Three-Dimensional Digital Documentation of Cultural Heritage Site Based on the Convergence of Terrestrial Laser Scanning and Unmanned Aerial Vehicle Photogrammetry


Abstract
:1. Introduction
2. Study Area and Method
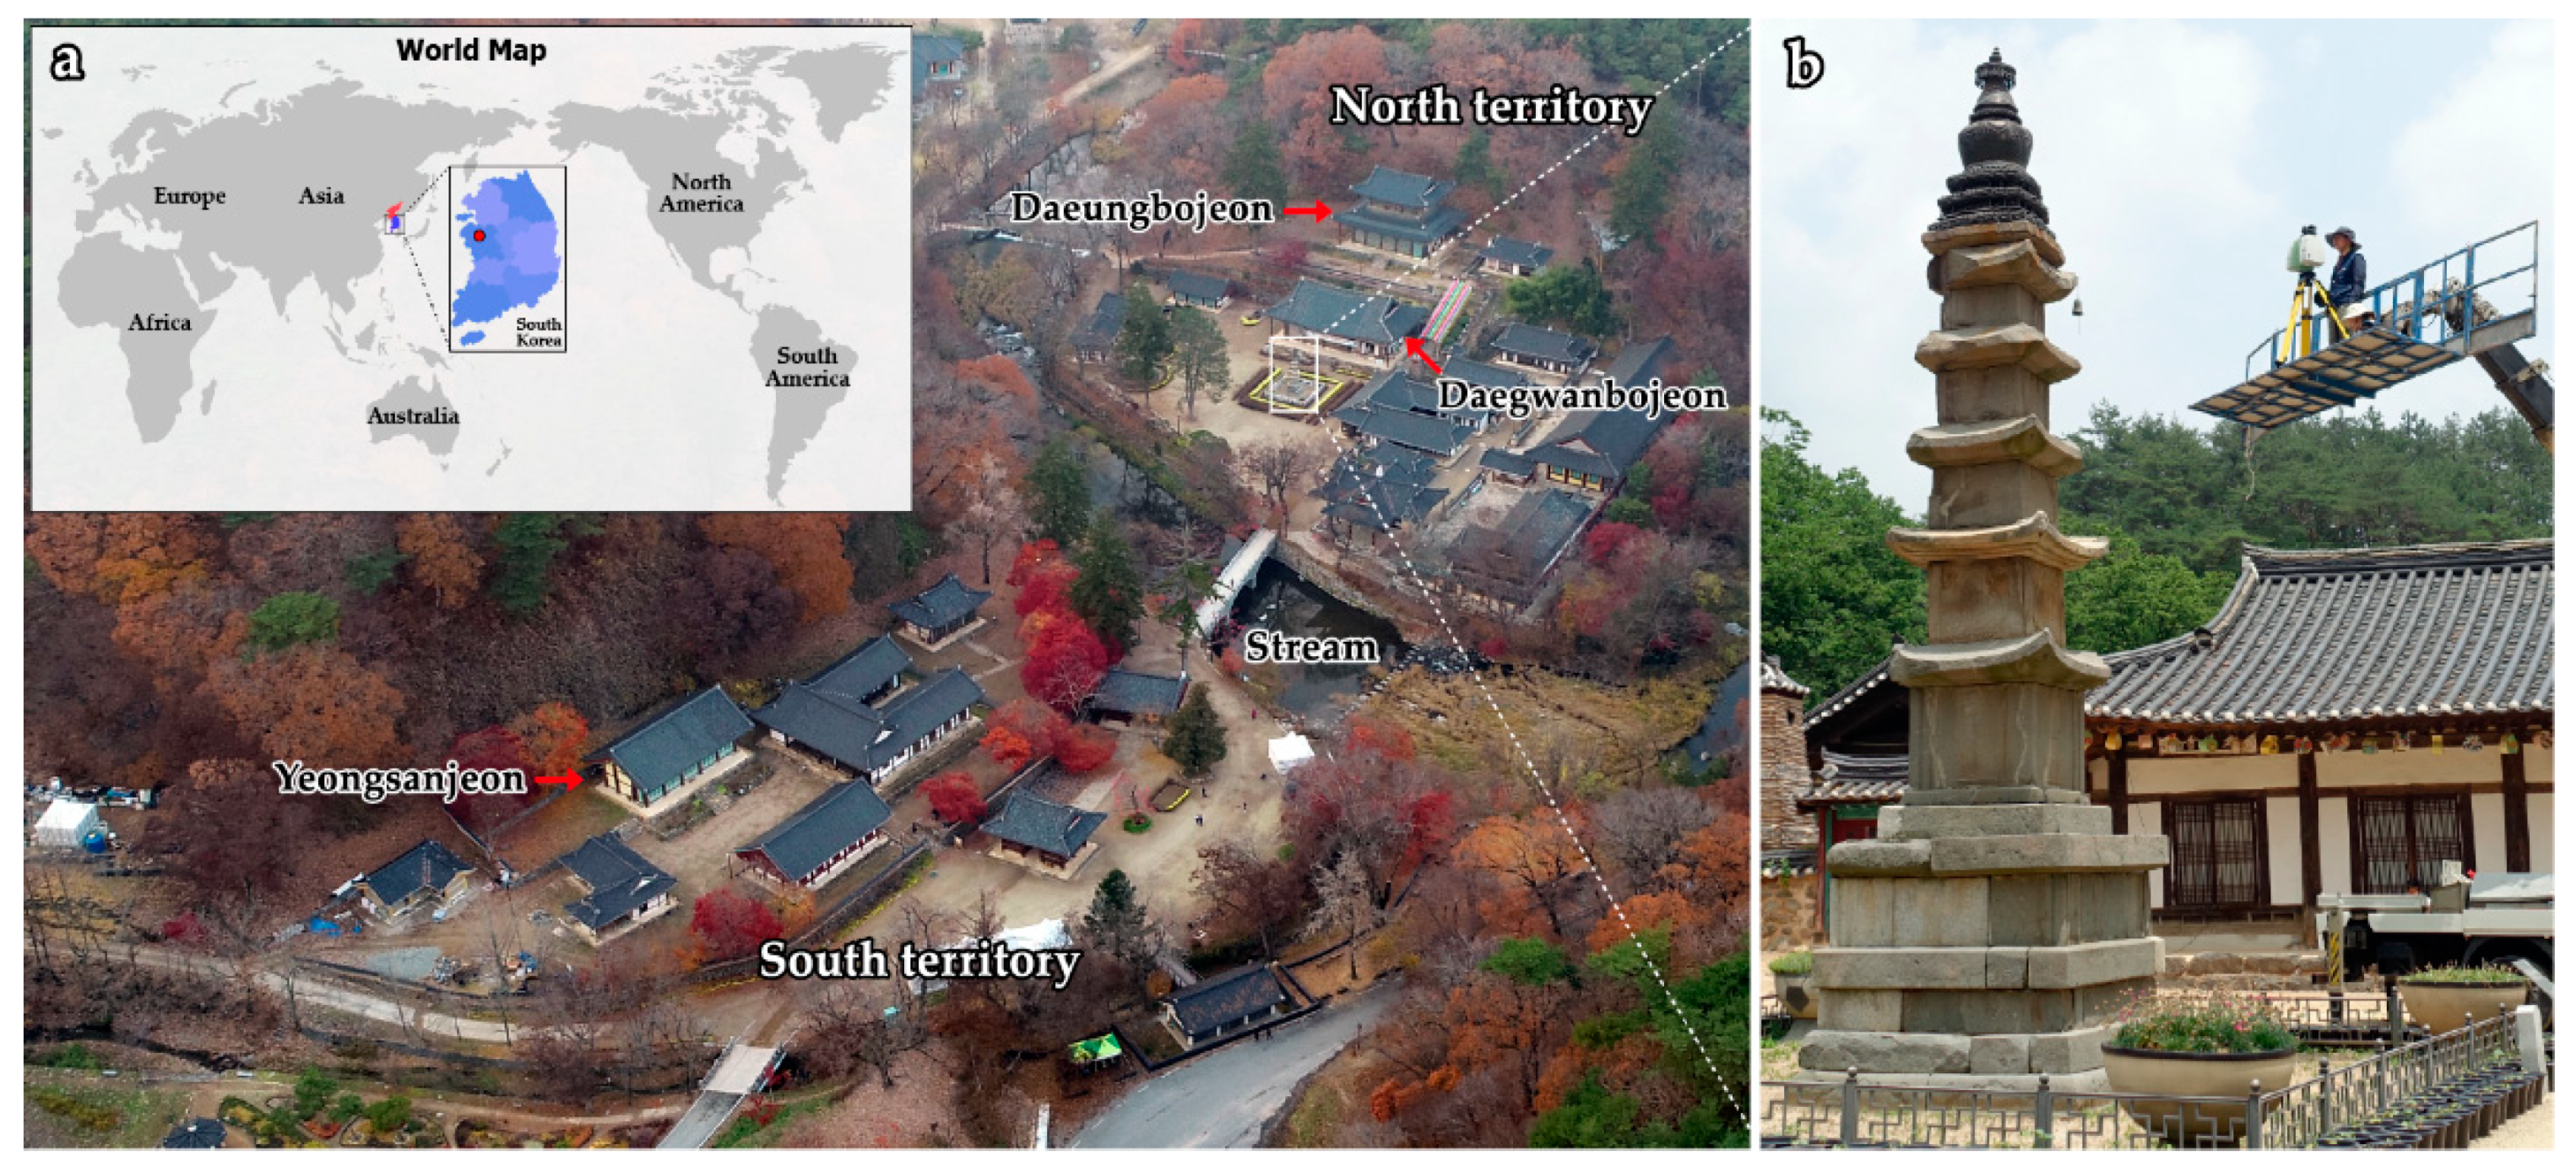
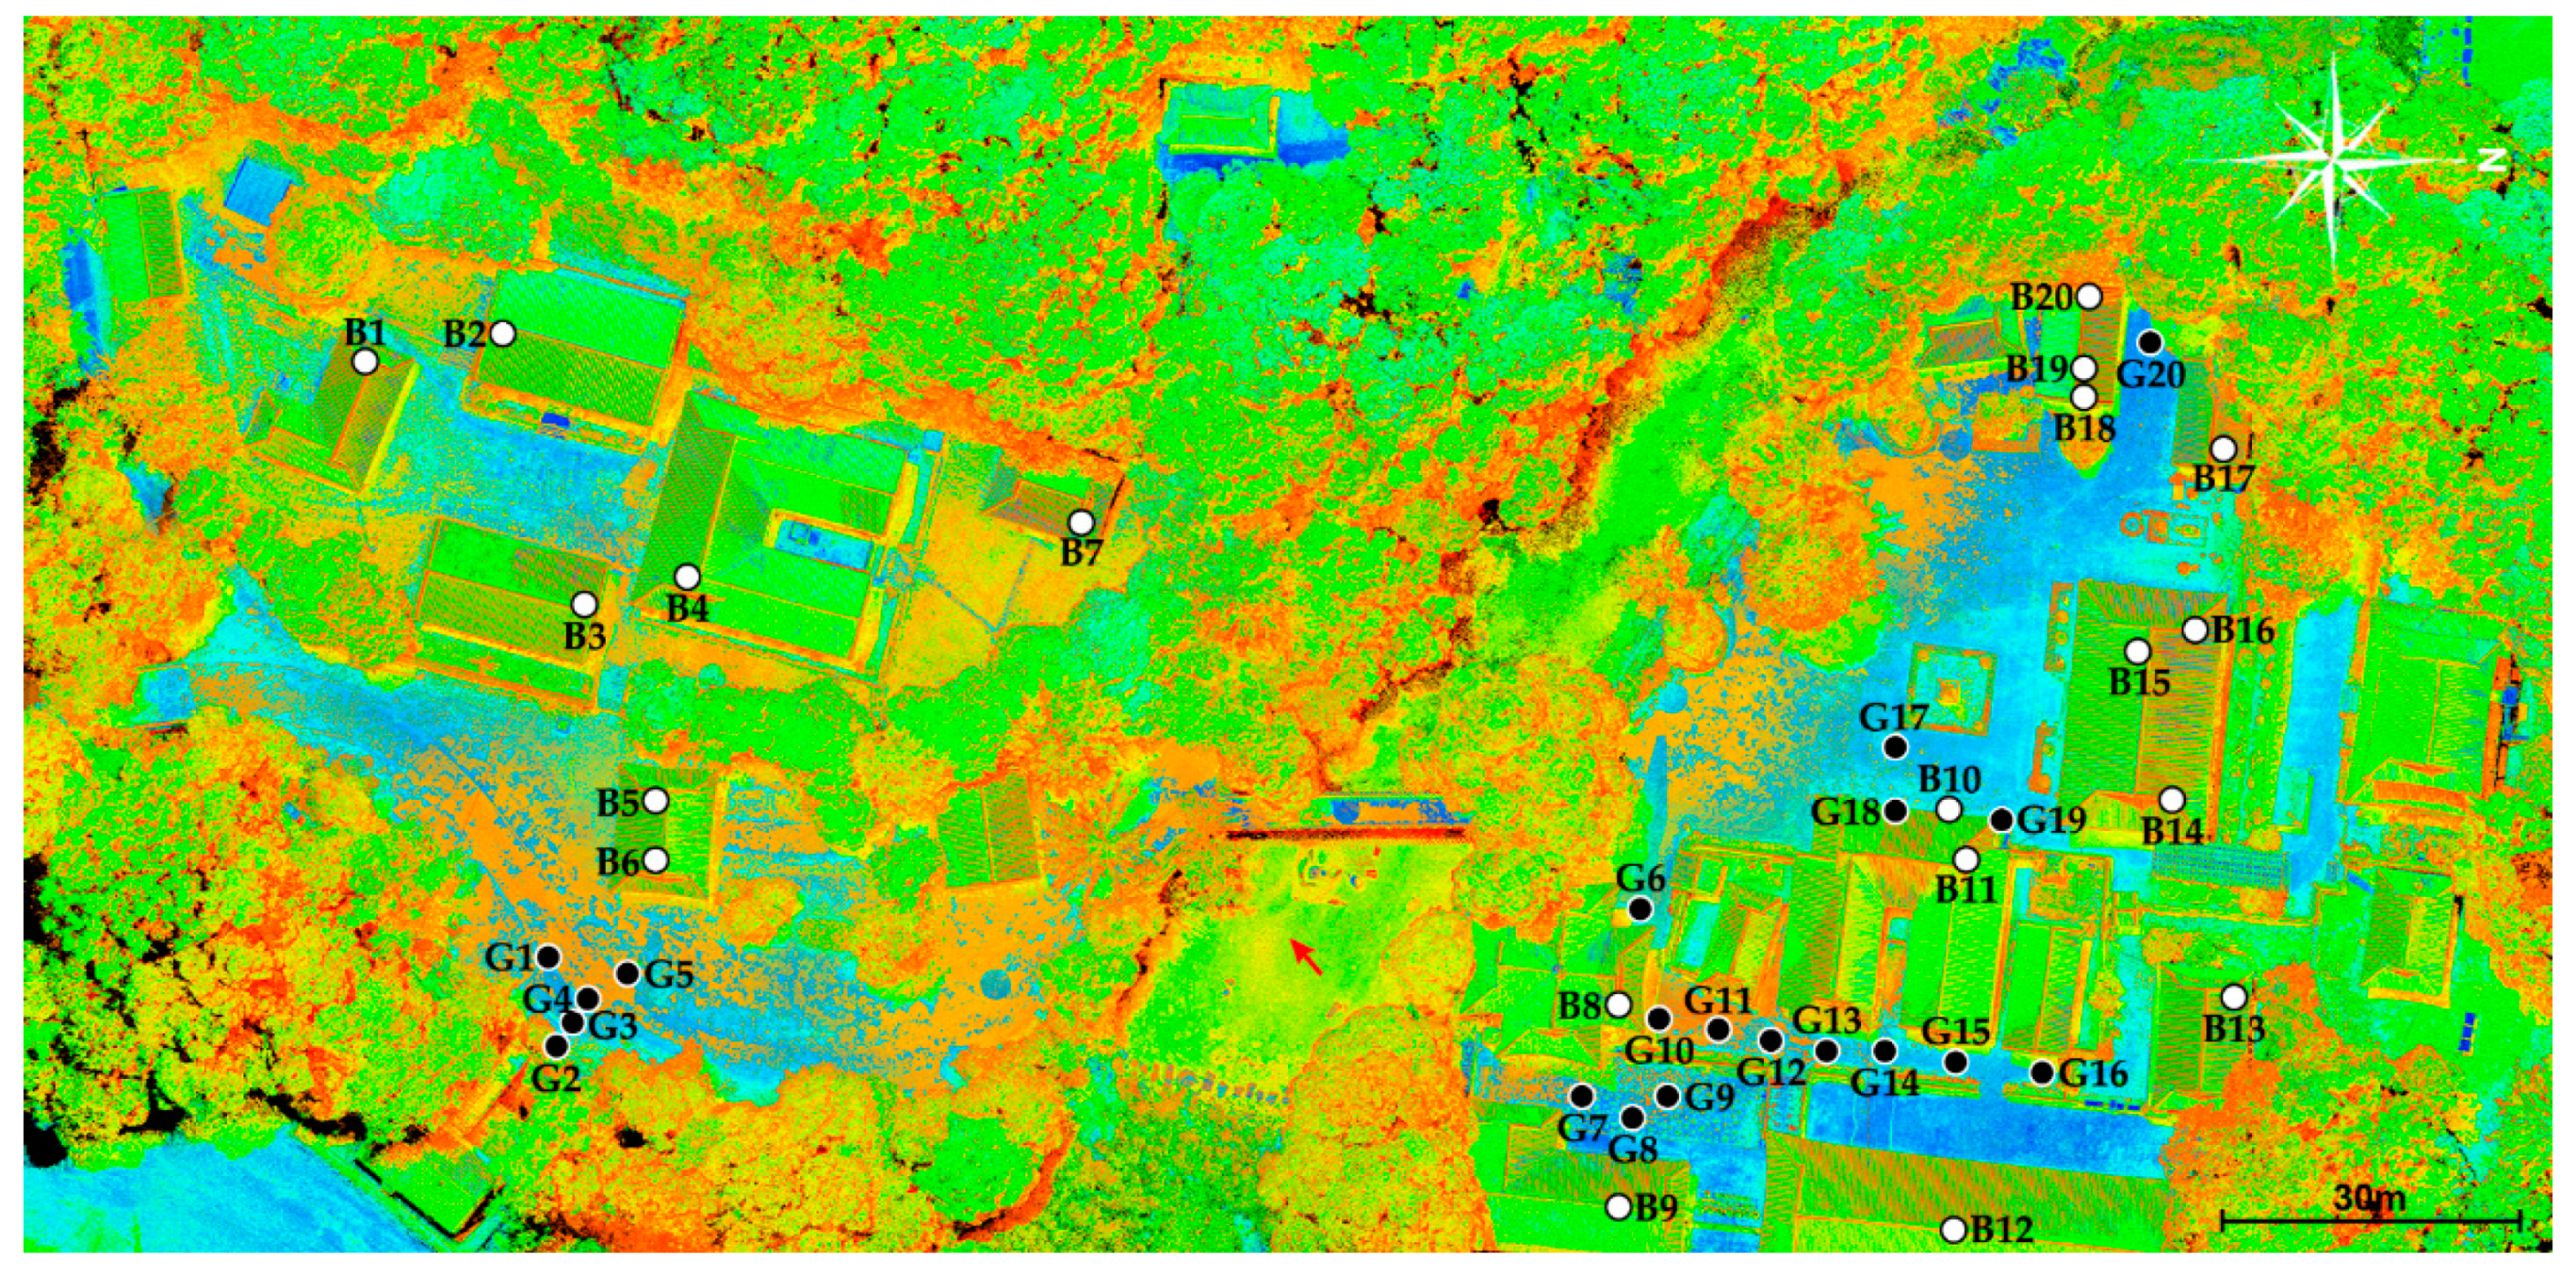
2.1. Study Area
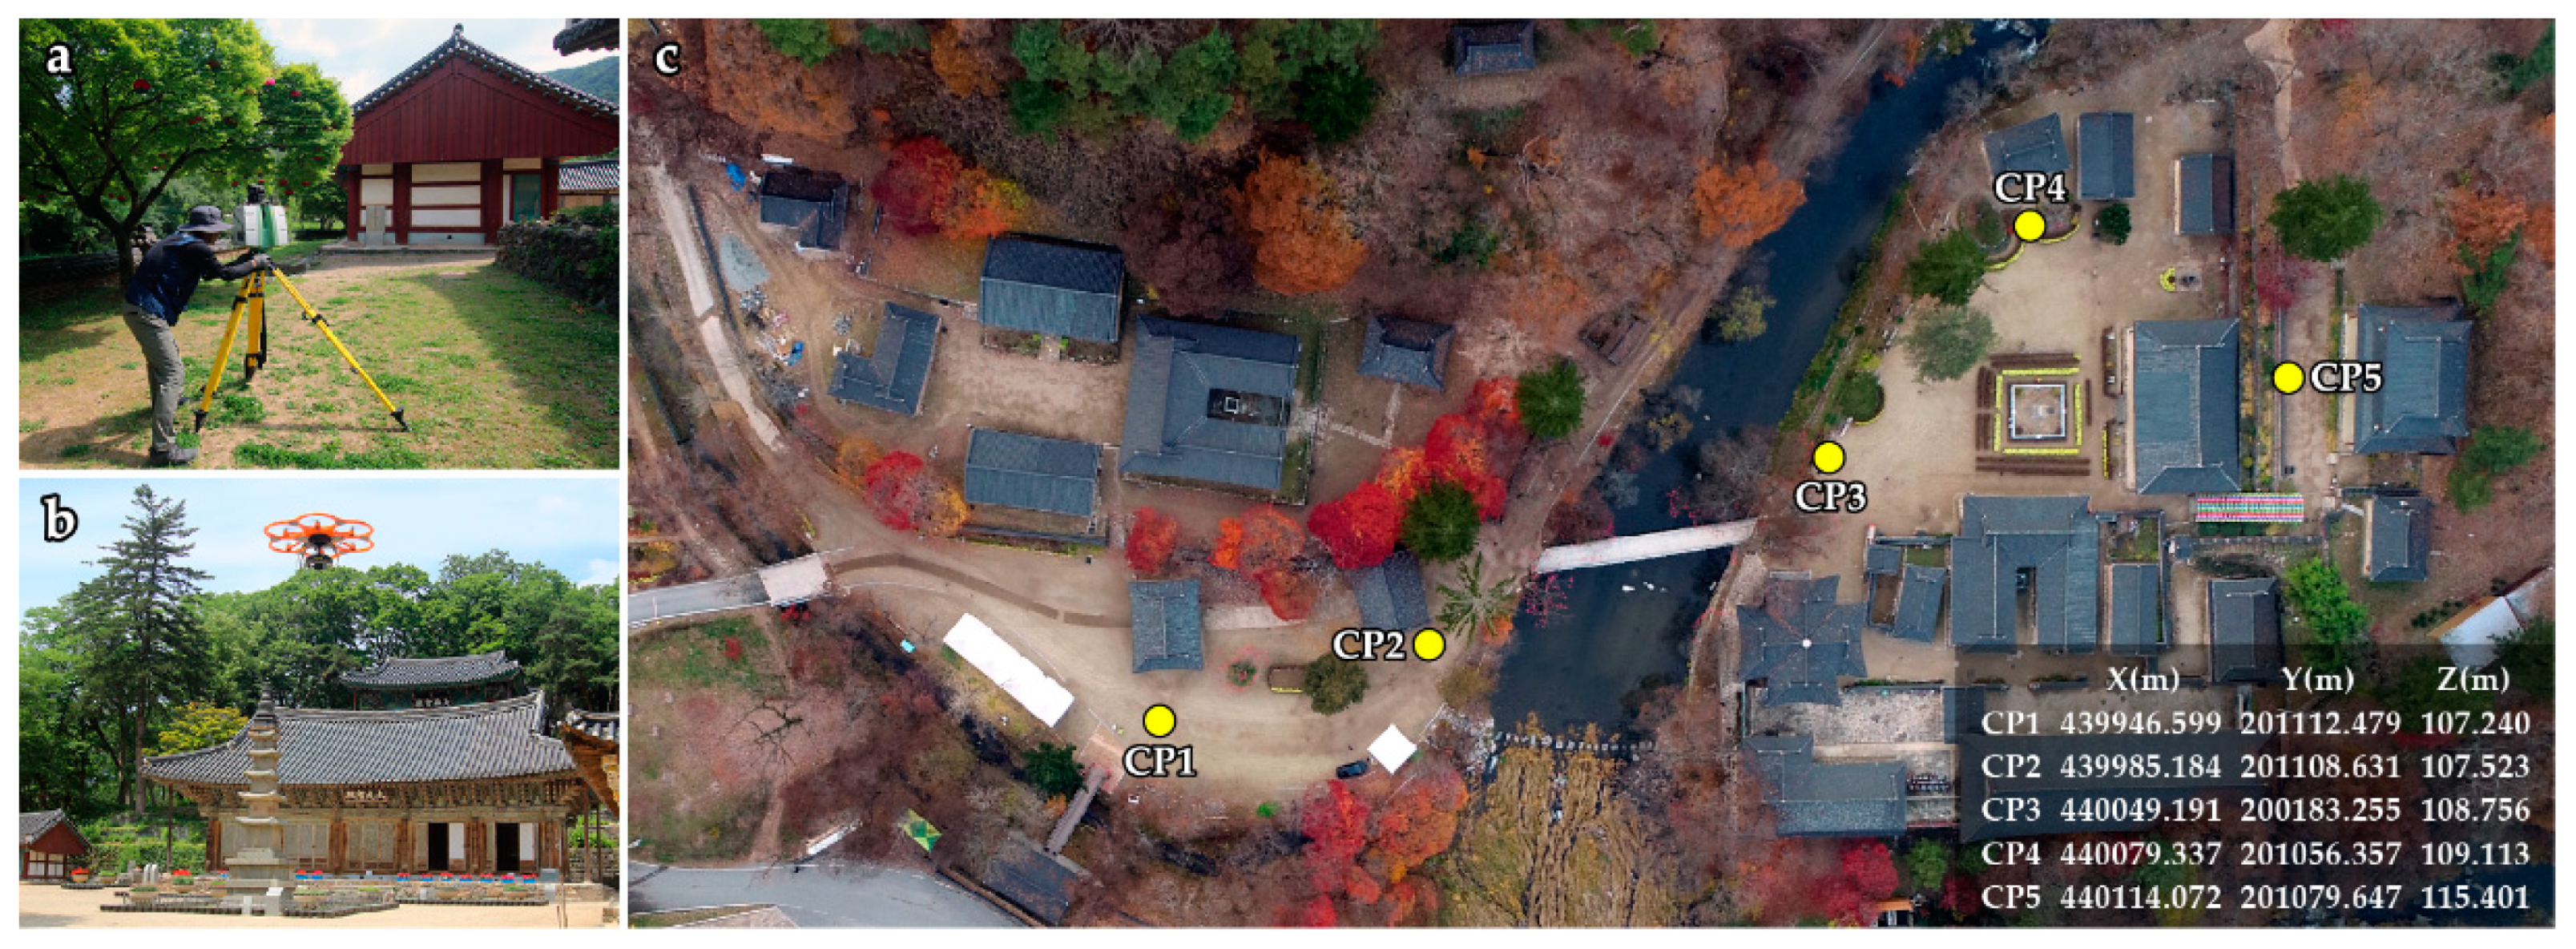
2.2. Method
3. Result and Discussion
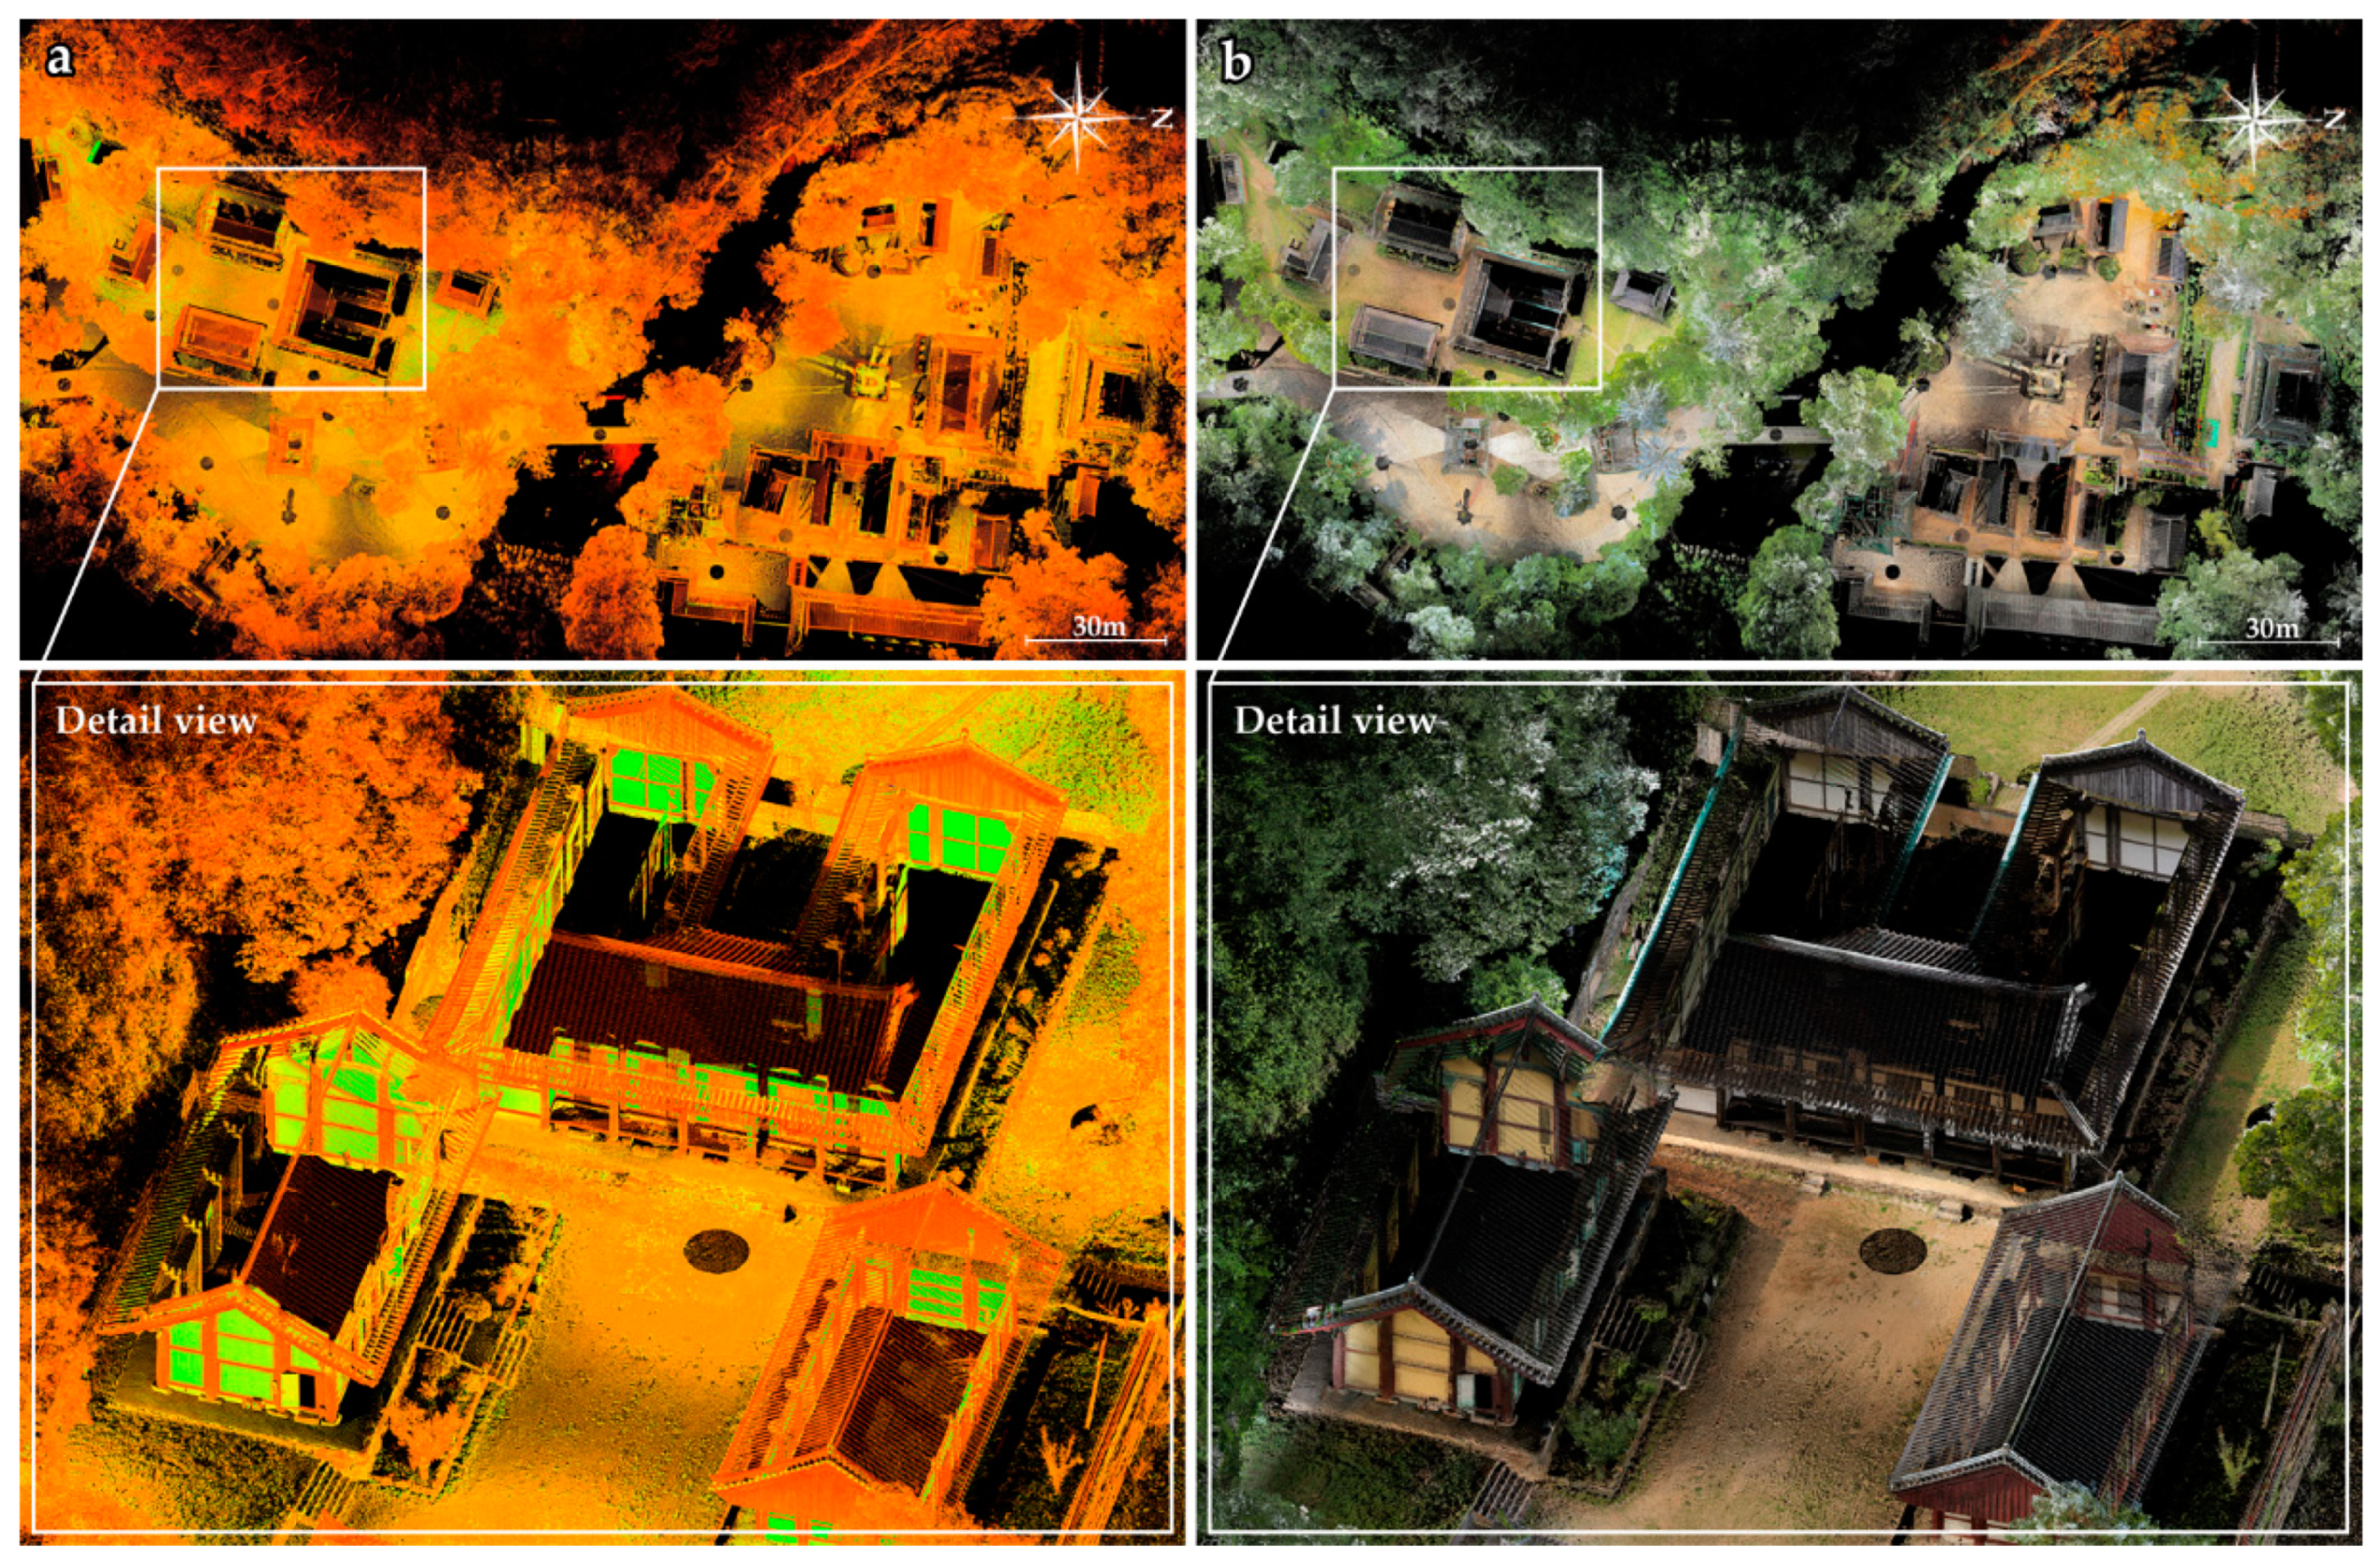
3.1. Terrestrial Laser Scanning
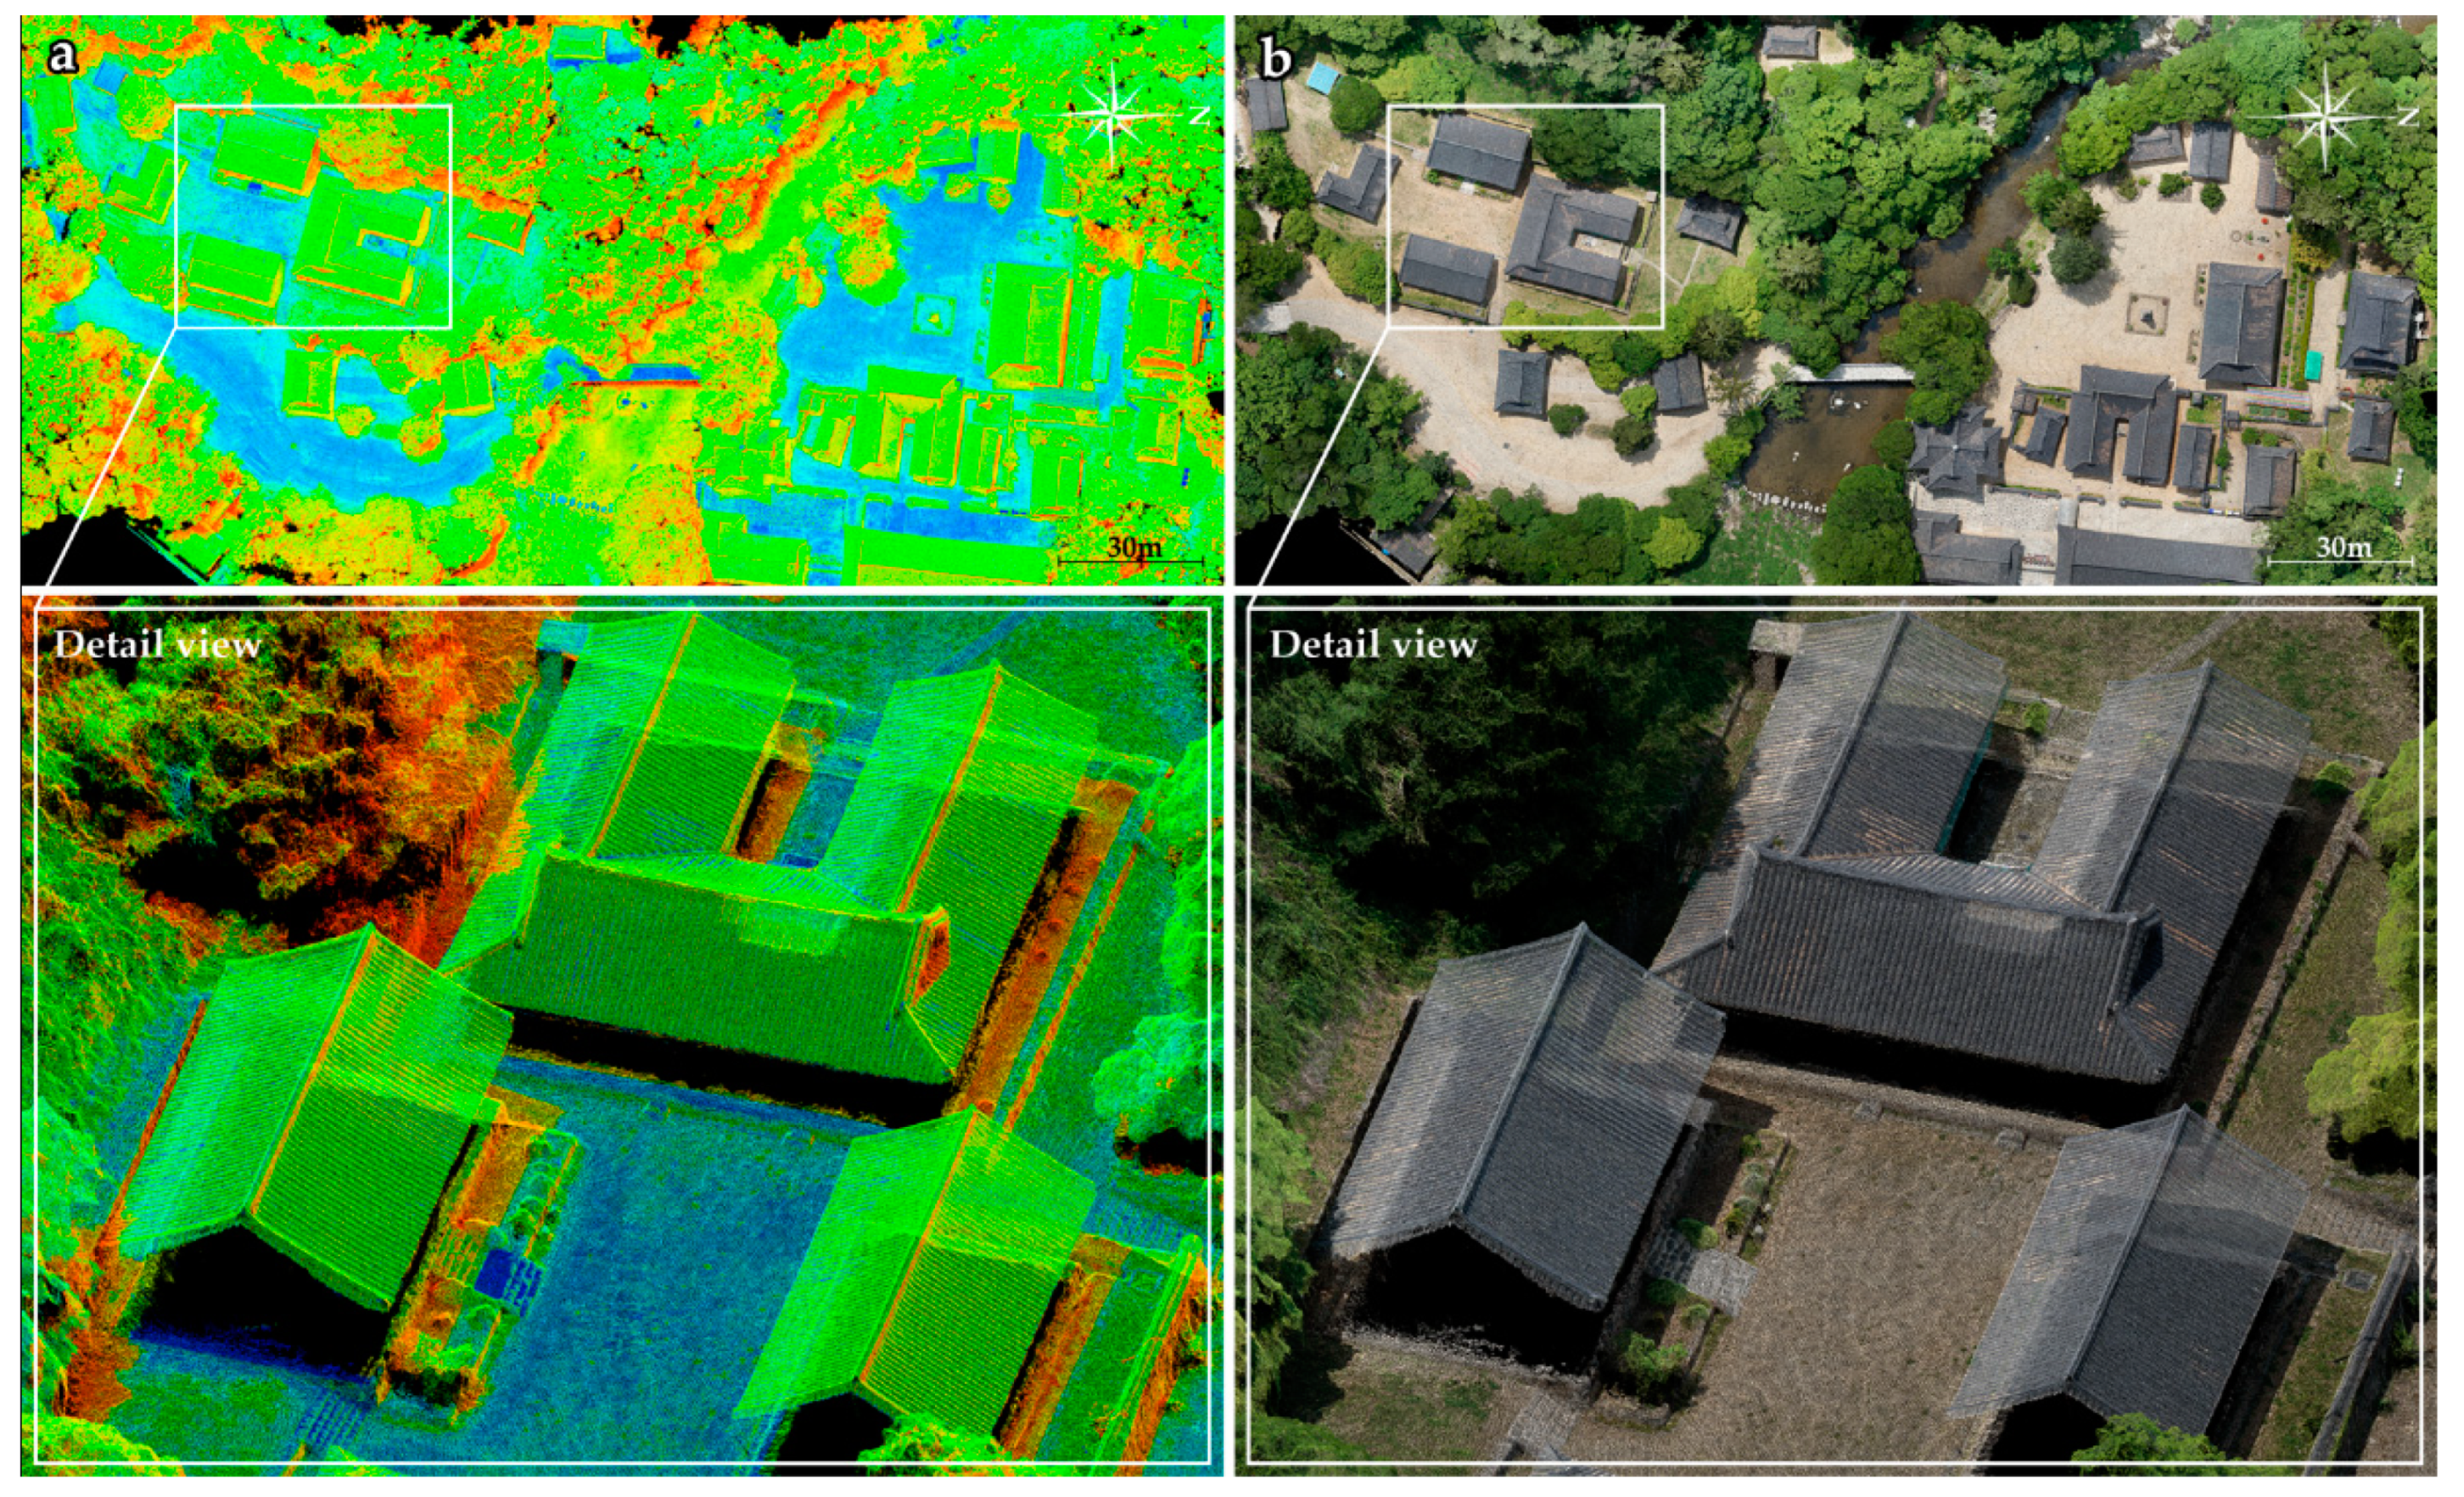
3.2. UAV Photogrammetry
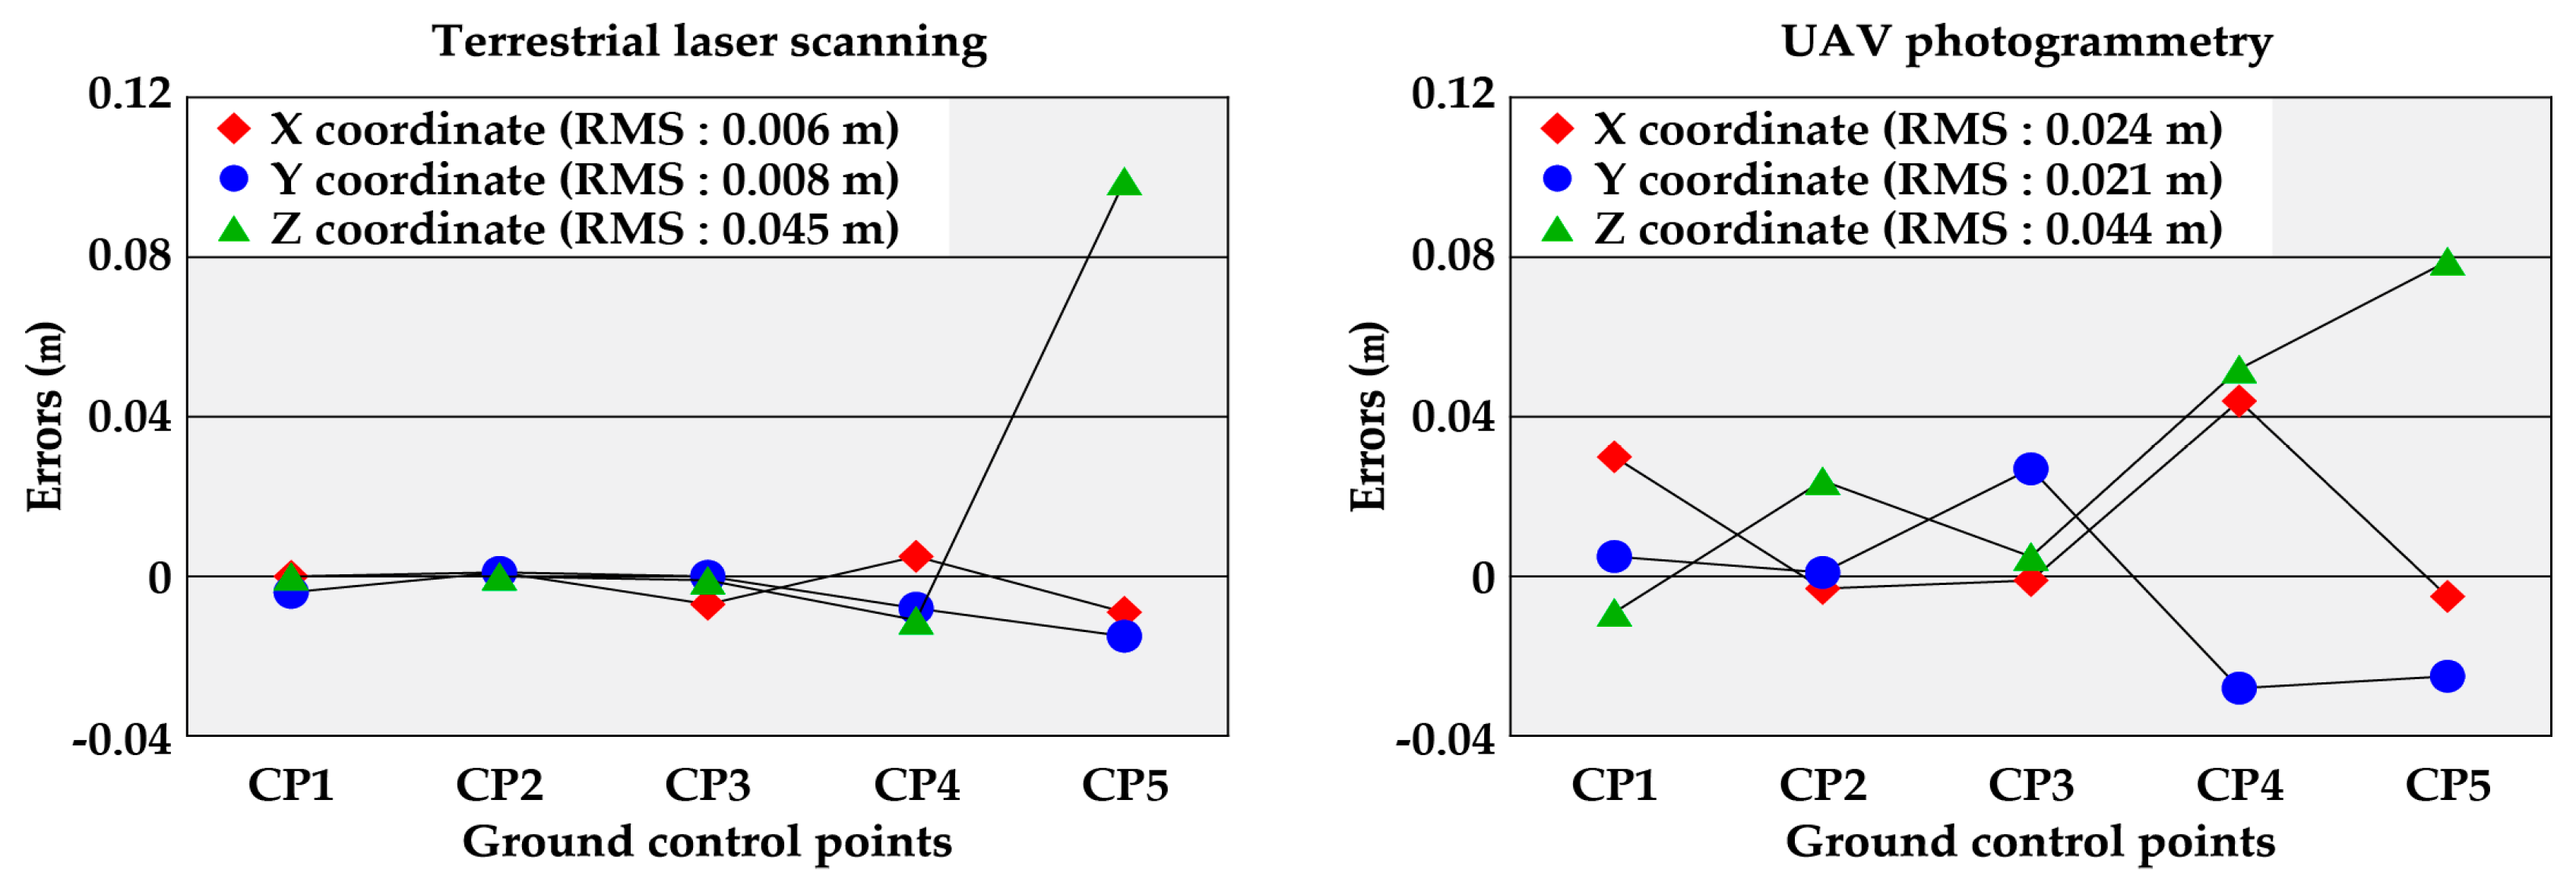
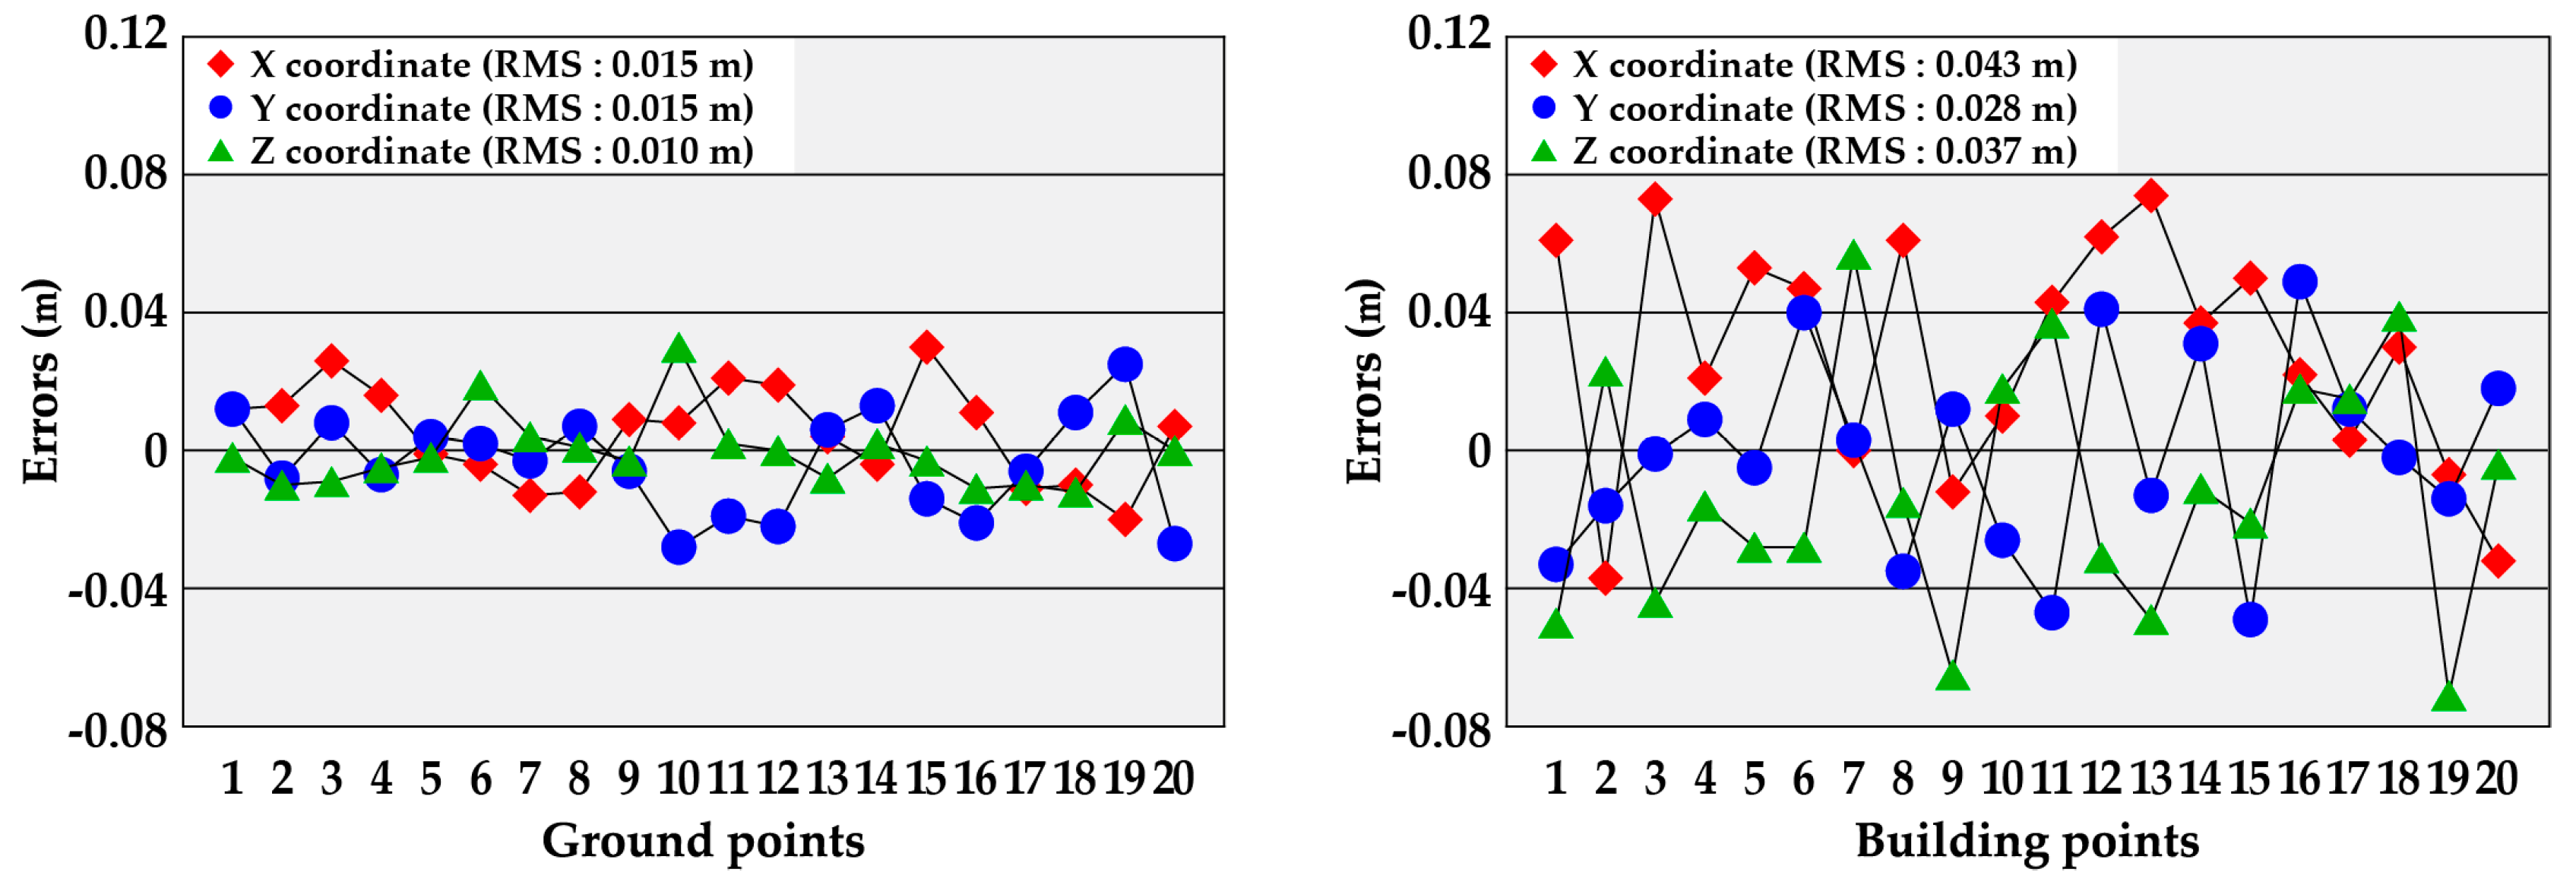
3.3. Accuracy Assessment
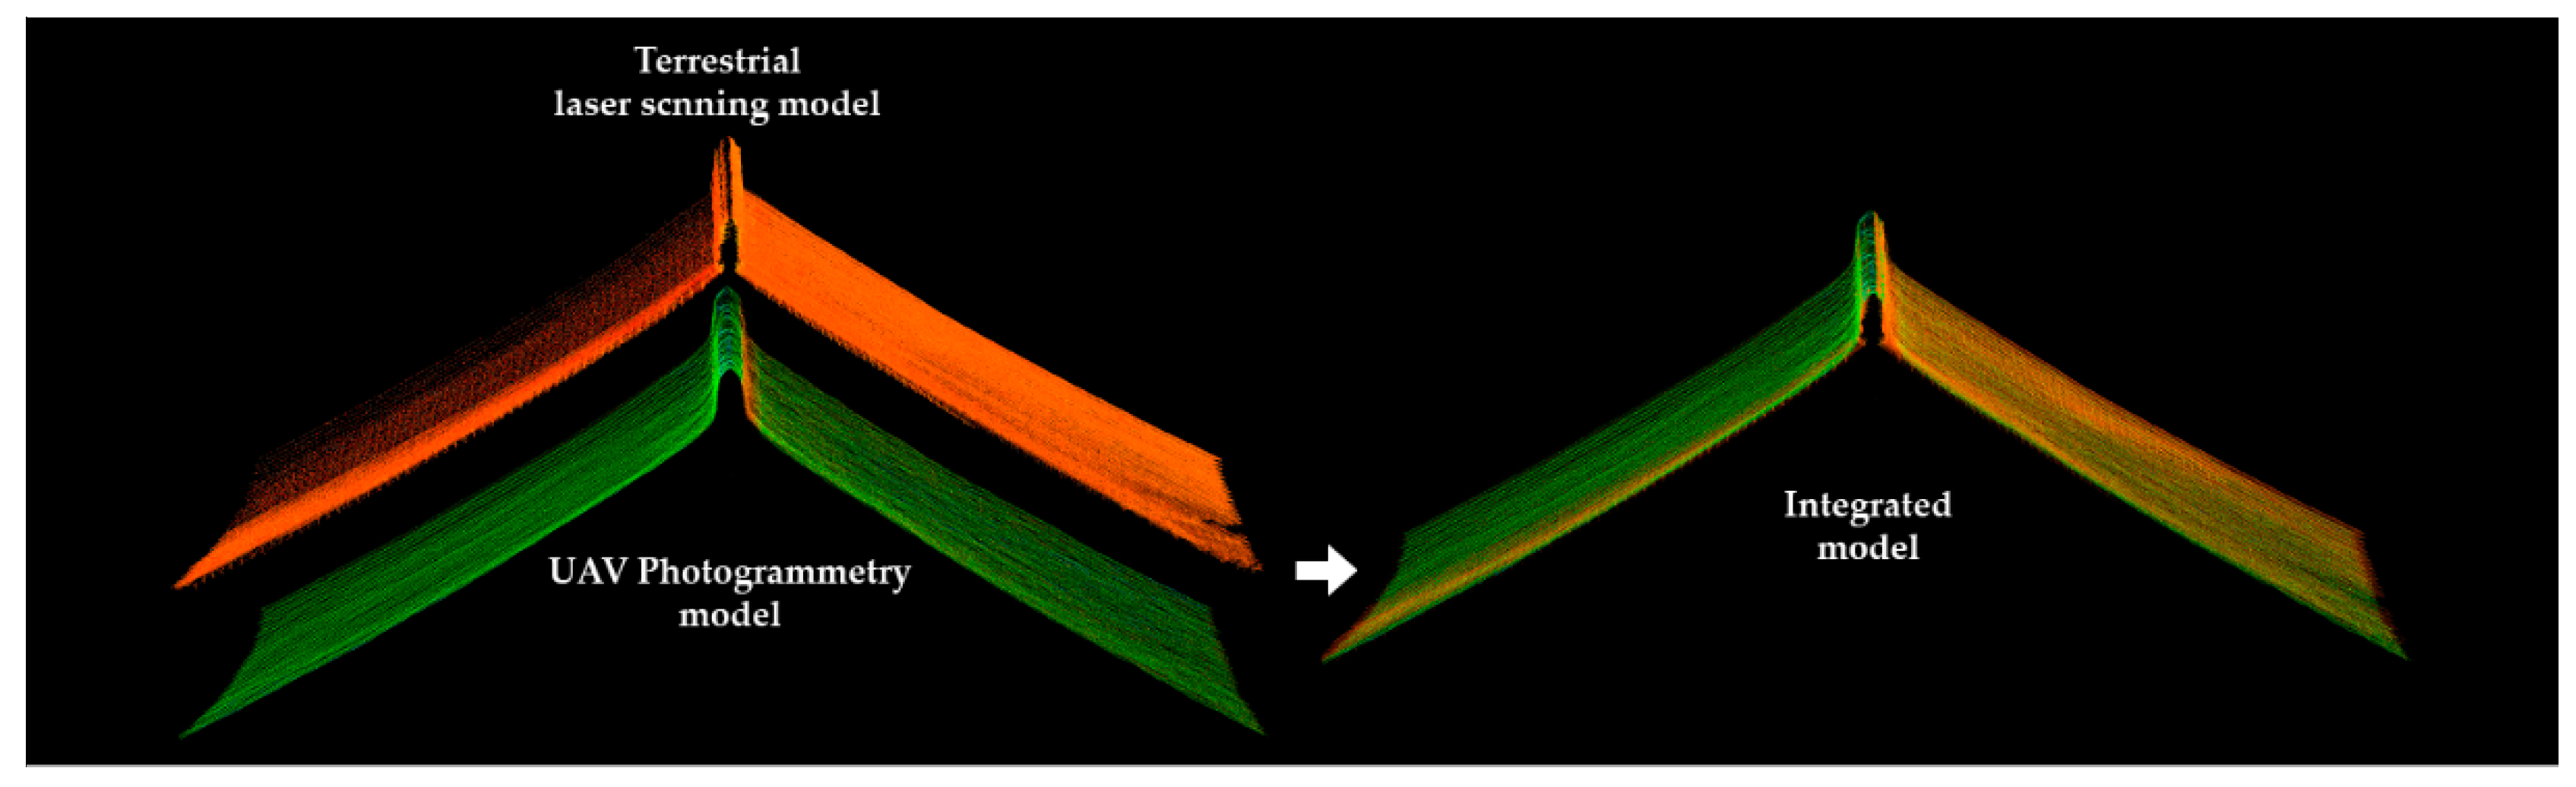
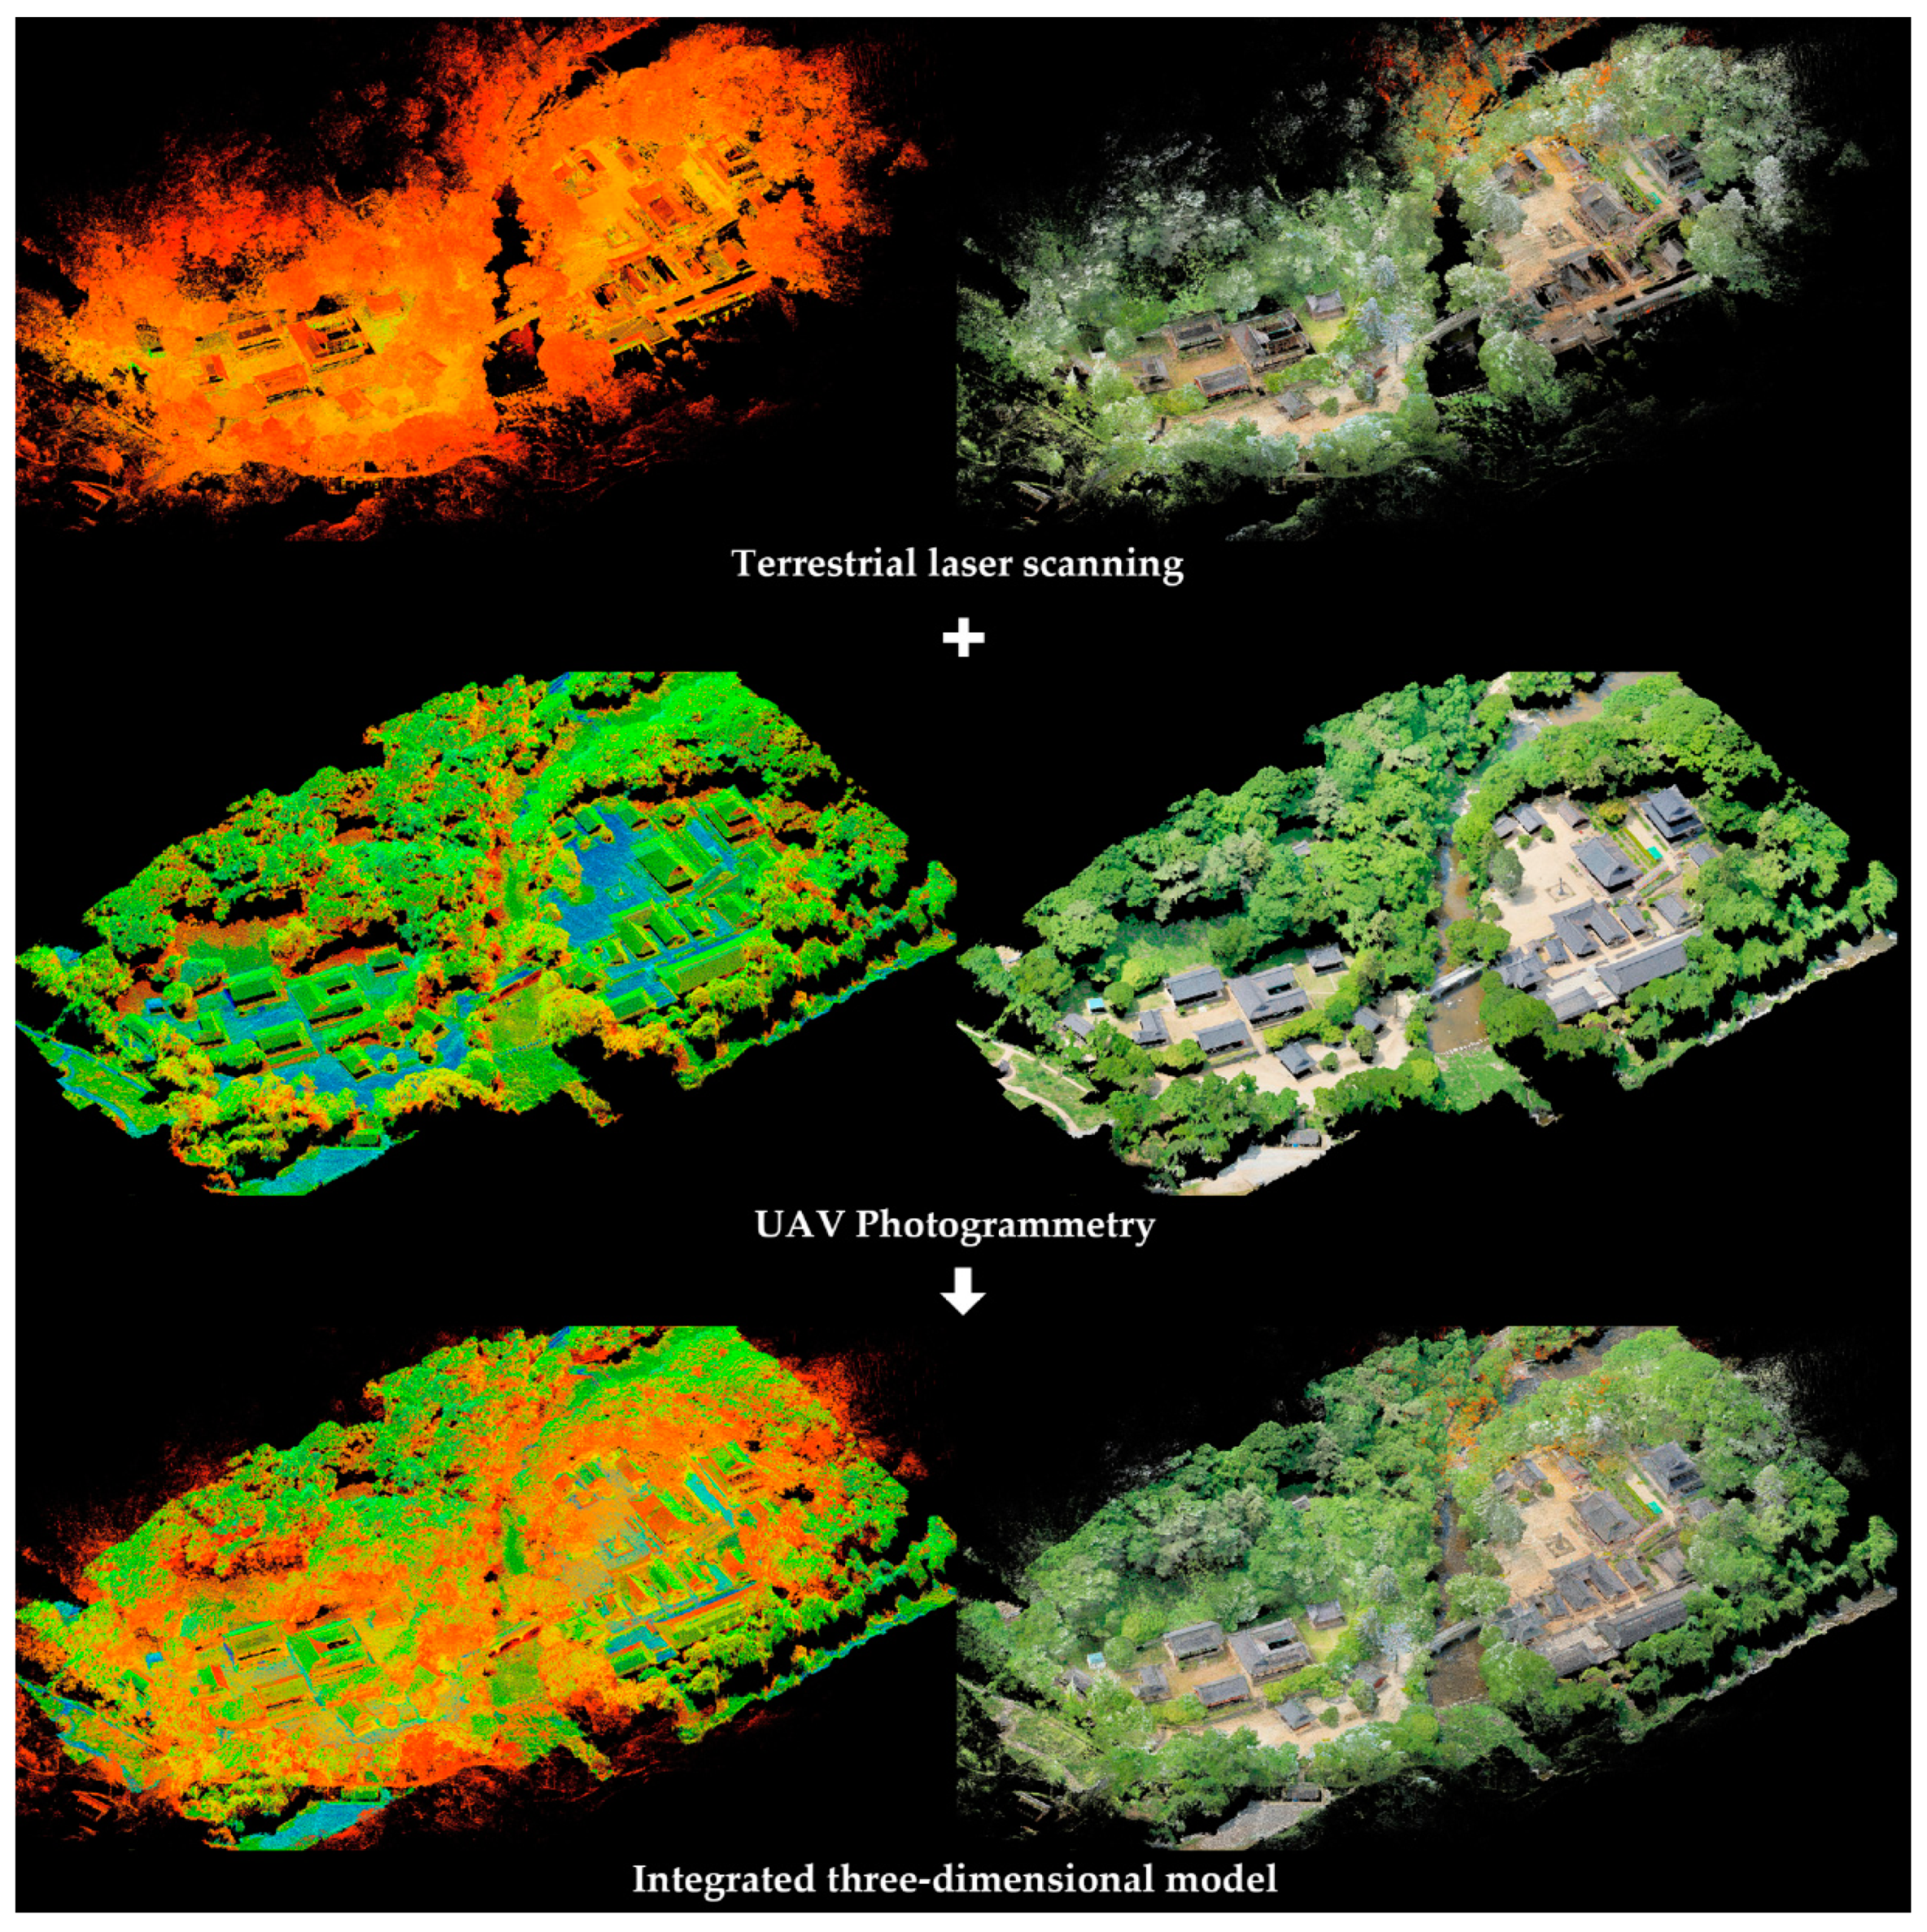
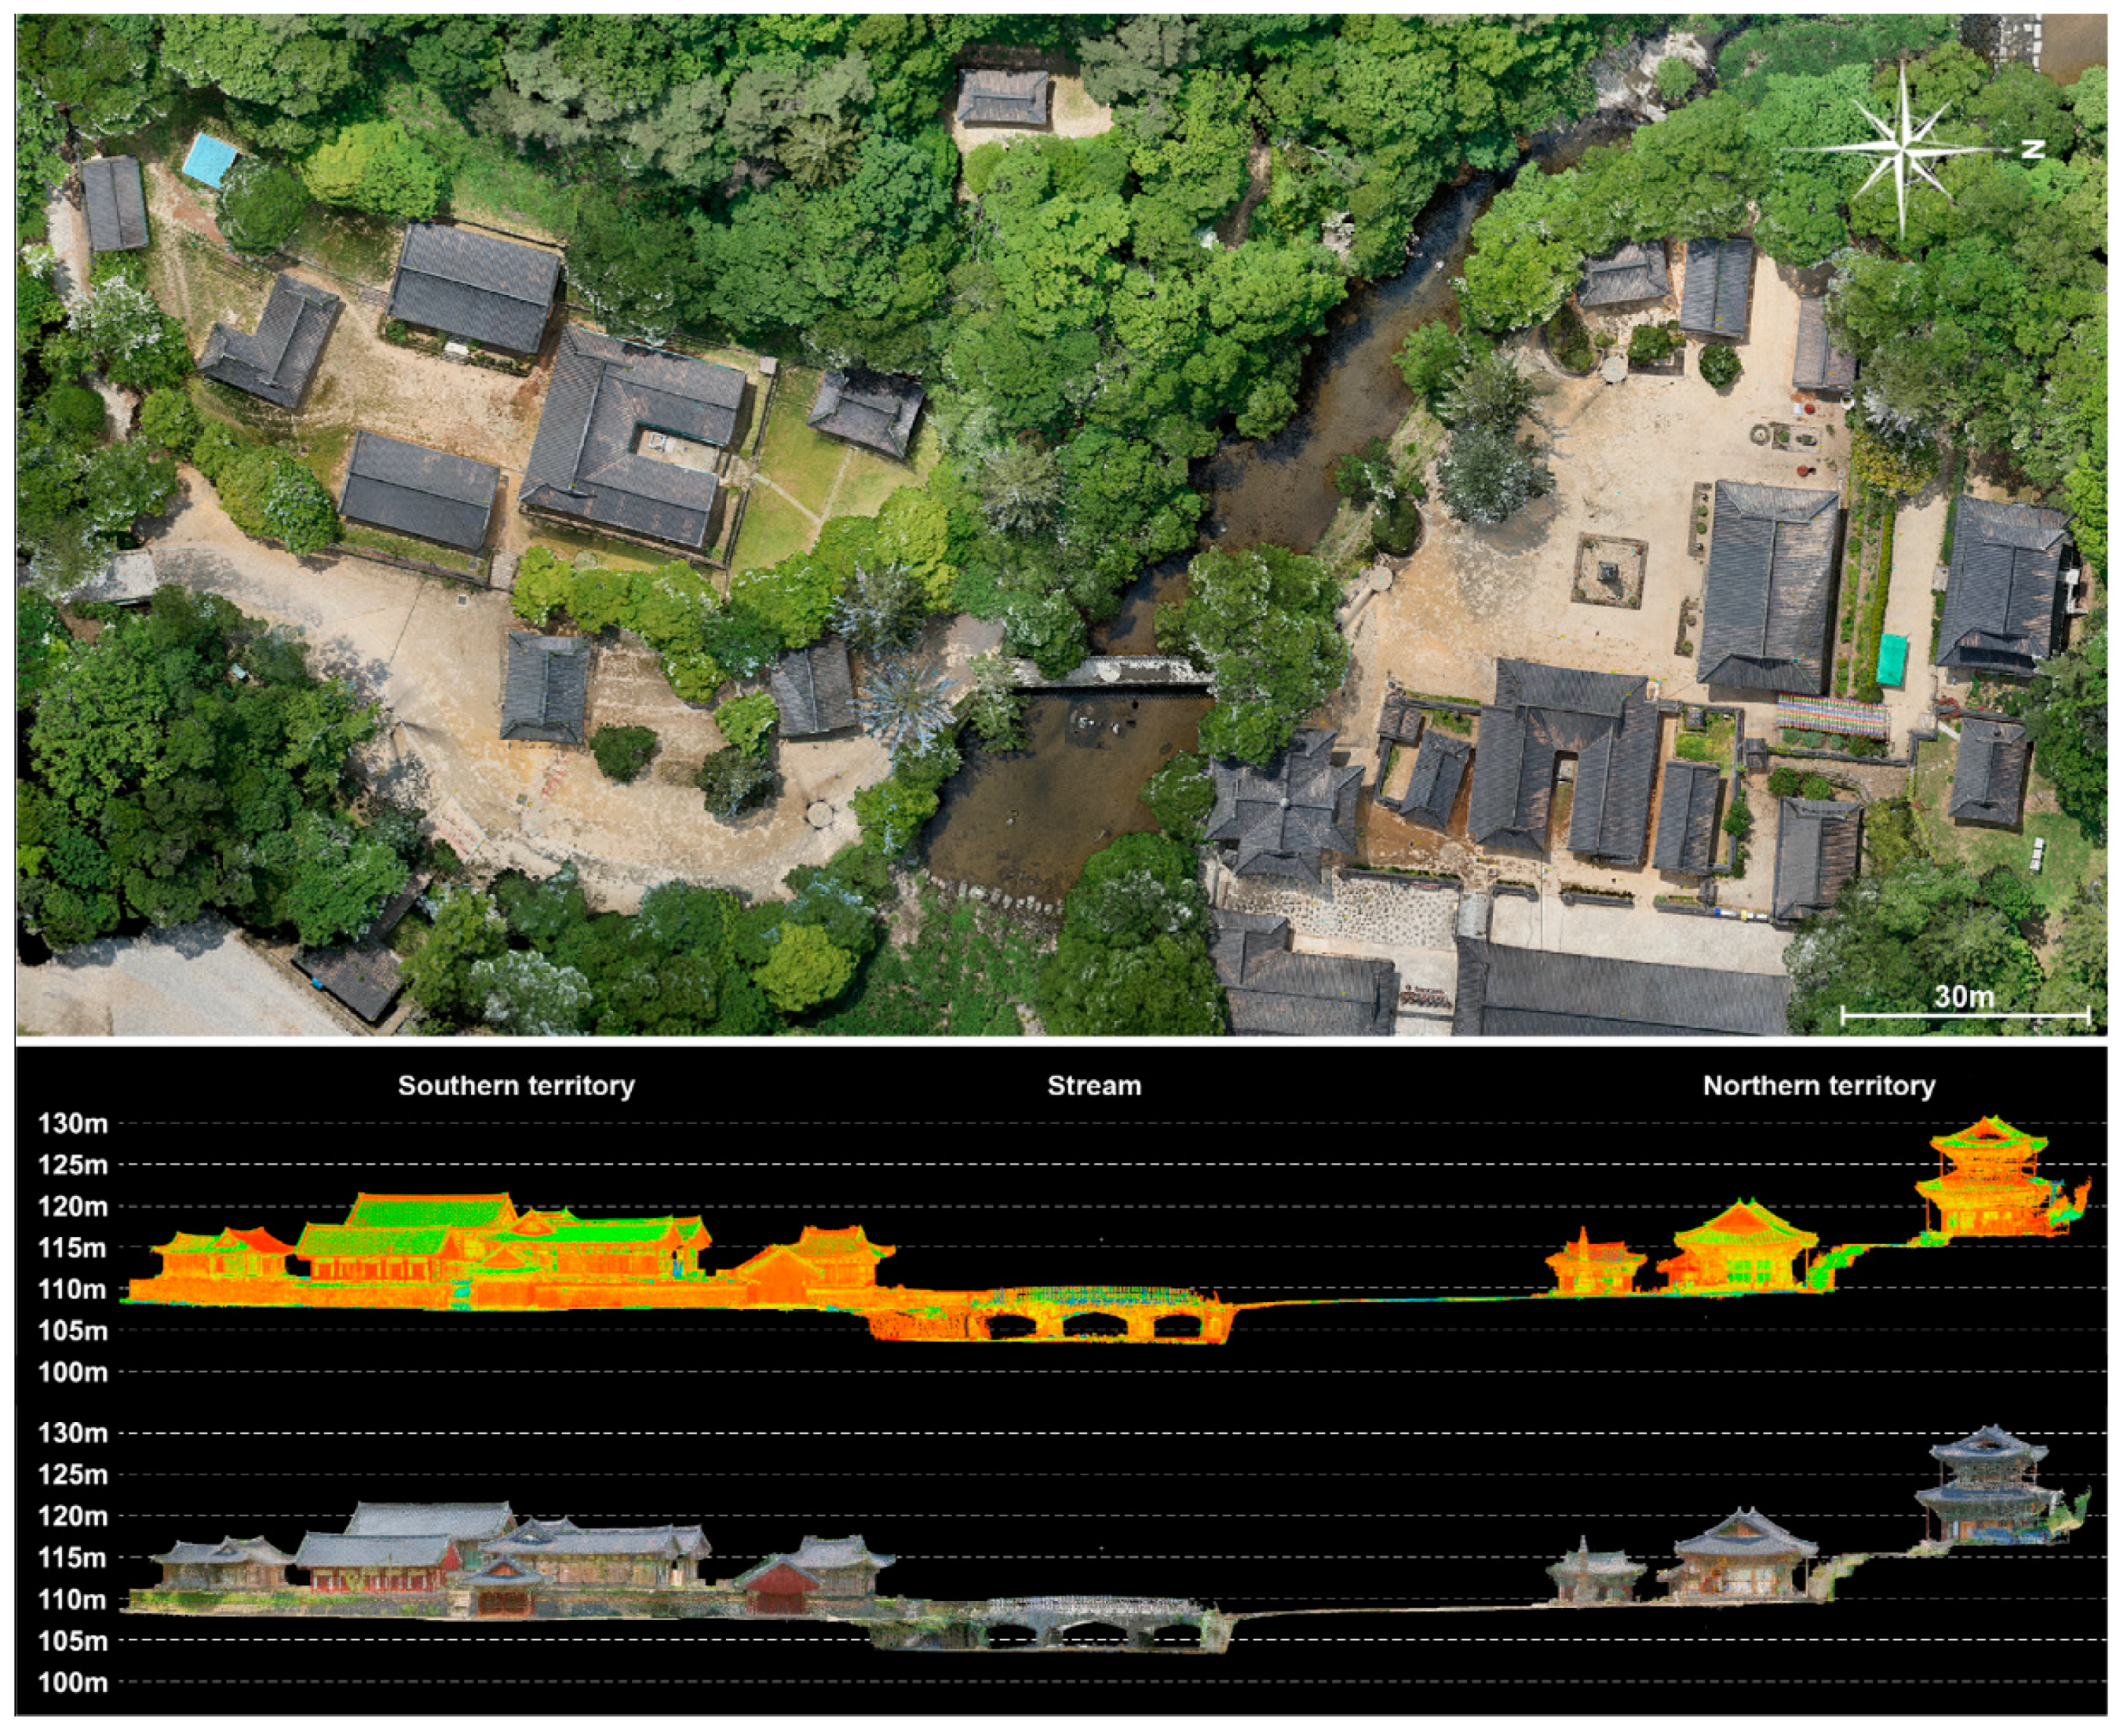
3.4. Integrated Three-Dimensional Modeling
4. Conclusions
Author Contributions
Funding
Acknowledgments
Conflicts of Interest
References
- Aragóna, E.; Munar, S.; Rodríguez, J.; Yamafunec, K. Underwater photogrammetric monitoring techniques for mid-depth shipwrecks. J. Cult. Herit. 2018, 34, 255–260. [Google Scholar] [CrossRef]
- Discamps, E.; Muth, X.; Gravina, B.; Lacrampe-Cuyaubère, F.; Chadelle, J.; Faivre, J.; Maureille, B. Photogrammetry as a tool for integrating archival data in archaeological fieldwork: Examples from the Middle Palaeolithic sites of Combe-Grenal, Le Moustier, and Regourdou. J. Archaeol. Sci. Rep. 2016, 8, 268–276. [Google Scholar] [CrossRef]
- Erenoglu, R.C.; Akcay, O.; Erenoglu, O. An UAS-assisted multi-sensor approach for 3D modeling and reconstruction of cultural heritage site. J. Cult. Herit. 2017, 26, 79–90. [Google Scholar] [CrossRef]
- O’Driscoll, J. Landscape applications of photogrammetry using unmanned aerial vehicles. J. Archaeol. Sci. Rep. 2018, 22, 32–44. [Google Scholar] [CrossRef]
- Themistocleous, K. Model reconstruction for 3-D vizualization of cultural heritage sites using open data from social media: The case study of Soli, Cyprus. J. Archaeol. Sci. Rep. 2017, 14, 774–781. [Google Scholar] [CrossRef]
- Wilson, L.; Rawlinson, A.; Frost, A.; Hepher, J. 3D digital documentation for disaster management in historic buildings: Applications following fire damage at the Mackintosh building, The Glasgow School of Art. J. Cult. Herit. 2018, 31, 24–32. [Google Scholar] [CrossRef]
- Messaoudi, T.; Véron, P.; Halin, G.; Luca, L.D. An ontological model for the reality-based 3D annotation of heritage building conservation state. J. Cult. Herit. 2018, 29, 100–112. [Google Scholar] [CrossRef]
- Xiao, W.; Mills, J.; Guidi, G.; Rodríguez-Gonzálvez, P.; Barsanti, S.G.; González-Aguilera, D. Geoinformatics for the conservation and promotion of cultural heritage in support of the UN Sustainable Development Goals. ISPRS J. Photogramm. Remote. Sens. 2018, 142, 389–406. [Google Scholar] [CrossRef]
- Zimmer, B.; Liutkus-Pierce, C.; Marshall, S.T.; Hatala, K.G.; Metallo, A.; Rossi, V. Using differential structure-from-motion photogrammetry to quantify erosion at the Engare Sero footprint site, Tanzania. Quat. Sci. Rev. 2018, 198, 226–241. [Google Scholar] [CrossRef]
- Angelo, L.D.; Stefano, P.D.; Fratocchi, L.; Marzola, A. An AHP-based method for choosing the best 3D scanner for cultural heritage applications. J. Cult. Herit. 2018, 34, 109–115. [Google Scholar] [CrossRef]
- Galantucci, L.M.; Pesce, M.; Lavecchia, F. A stereo photogrammetry scanning methodology, for precise and accurate 3D digitization of small parts with sub-millimeter sized features. CIRP Ann-Manuf. Techn. 2015, 64, 507–510. [Google Scholar] [CrossRef]
- Herráez, J.; Martínez, J.C.; Coll, E.; Martín, M.T.; Rodríguez, J. 3D modeling by means of videogrammetry and laser scanners for reverse engineering. Measurement 2016, 87, 216–227. [Google Scholar] [CrossRef]
- Vacaa, G.; Dessì, A.; Sacco, A. The use of nadir and oblique UAV images for building knowledge. ISPRS Int. J. Geo-Inf. 2017, 6, 393. [Google Scholar] [CrossRef]
- Galantucci, L.M.; Piperi, E.; Lavecchia, F.; Zhavo, A. Semi-automatic low cost 3D laser scanning system for reverse engineering. Procedia CIRP 2015, 28, 94–99. [Google Scholar] [CrossRef]
- Reznicek, J.; Pavella, K. New low cost 3D Scanning Techniques for Cultural Heritage Documentation. In Proceedings of the International Archives of Photogrammetry and Remote Sensing, XXXVI-B5, Beijing, China, 3–11 July 2008; pp. 237–240. [Google Scholar]
- Tannant, D.D. Review of photogrammetry-based techniques for characterization and hazard assessment of rock faces. Int. J. Georesour. Environ. 2015, 1, 76–87. [Google Scholar] [CrossRef]
- Zlot, R.; Bosse, M. Three-dimensional mobile mapping of caves. J. Cave Karst Stud. 2014, 76, 191–206. [Google Scholar] [CrossRef]
- Reichert, J.; Schellenberg, J.; Schubert, P.; Wilke, T. 3D scanning as a highly precise, reproducible, and minimally invasive method for surface area volume measurements of scleractinian corals. Limnol Oceanogr. Meth. 2016, 14, 518–526. [Google Scholar] [CrossRef]
- Palomar-Vazquez, J.; Baselga, S.; Viñals-Blasco, M.; García-Sales, C.; Sancho-Espinós, I. Application of a combination of digital image processing and 3D visualization of graffiti in heritage conservation. J. Archaeol. Sci. Rep. 2017, 12, 32–42. [Google Scholar] [CrossRef]
- Quagliarini, E.; Clini, P.; Ripanti, M. Fast, low cost and safe methodology for the assessment of the state of conservation of historical buildings from 3D laser scanning: The case study of Santa Maria in Portonovo (Italy). J. Cult. Herit. 2017, 24, 175–183. [Google Scholar] [CrossRef]
- Biagini, C.; Capone, P.; Donato, V.; Facchini, N. Towards the BIM implementation for historical building restoration sites. Automat. Constr. 2016, 71, 74–86. [Google Scholar] [CrossRef]
- Fryskowska, A.; Stachelek, J. A no-reference method of geometric content quality analysis of 3D models generated from laser scanning point clouds for hBIM. J. Cult. Herit. 2018, 34, 95–108. [Google Scholar] [CrossRef]
- Simeone, D.; Cursi, S.; Acierno, M. BIM semantic-enrichment for built heritage representation. Automat. Constr. 2019, 97, 122–137. [Google Scholar] [CrossRef]
- Galeazzi, F. Towards the definition of best 3D practices in archaeology: Assessing 3D documentation techniques for intra-site data recording. J. Cult. Herit. 2016, 17, 159–169. [Google Scholar] [CrossRef]
- Scafuri, M.P.; Rennison, B. Scanning the H.L. Hunley: Employing a structured-light scanning system in the archaeological documentation of a unique maritime artifact. J. Archaeol. Sci. Rep. 2016, 6, 302–309. [Google Scholar] [CrossRef]
- Monna, F.; Esin, Y.; Magail, J.; Granjon, L.; Navarro, N.; Wilczek, J.; Saligny, L.; Couette, S.; Dumontet, A.; Chateau, C. Documenting carved stones by 3D modelling—Example of Mongolian deer stones. J. Cult. Herit. 2018, 34, 116–128. [Google Scholar] [CrossRef]
- Rüther, H.; Chazan, M.; Schroeder, R.; Neeser, R.; Held, C.; Walker, S.J.; Matmon, A.; Horwitz, L.K. Laser scanning for conservation and research of African cultural heritage sites: The case study of Wonderwerk Cave, South Africa. J. Archaeol. Sci. 2009, 36, 1847–1856. [Google Scholar] [CrossRef]
- Fabbri, S.; Sauro, F.; Santagata, T.; Rossi, G.; Waele, J.D. High-resolution 3-D mapping using terrestrial laser scanning as a tool for geomorphological and speleogenetical studies in caves: An example from the Lessini mountains (North Italy). Geomorphology 2017, 280, 16–29. [Google Scholar] [CrossRef]
- Fernández-Lozano, J.; Gutiérrez-Alonso, G. Improving archaeological prospection using localized UAVs assisted photogrammetry: An example from the Roman Gold District of the Eria River Valley (NW Spain). J. Archaeol. Sci. Rep. 2016, 5, 509–520. [Google Scholar] [CrossRef]
- Watanabe, Y.; Kawahara, Y. UAV photogrammetry for monitoring changes in river topography and vegetation. Procedia Eng. 2016, 154, 317–325. [Google Scholar] [CrossRef]
- Assali, P.; Grussenmeyer, P.; Villemin, T.; Pollet, N.; Viguier, F. Surveying and modeling of rock discontinuities by terrestrial laser scanning and photogrammetry: Semi-automatic approaches for linear outcrop inspection. J. Struct. Geol. 2014, 66, 102–114. [Google Scholar] [CrossRef]
- Yang, B.; Zang, Y.; Dong, Z.; Huang, R. An automated method to register airborne and terrestrial laser scanning. ISPRS J. Photogramm. 2015, 109, 62–76. [Google Scholar] [CrossRef]
- Aicardi, I.; Dabove, P.; Lingua, A.M.; Piras, M. Integration between TLS and UAV photogrammetry techniques for forestry applications. Ifor. Bioengsic. For. 2016, 10, 41–47. [Google Scholar] [CrossRef]
- Liang, H.; Li, W.; Lai, S.; Zhu, L.; Jiang, W.; Zhang, Q. The integration of terrestrial laser scanning and terrestrial and unmanned aerial vehicle digital photogrammetry for the documentation of Chinese classical gardens—A case study of Huanxiu Shanzhuang, Suzhou, China. J. Cult. Herit. 2018, 33, 222–230. [Google Scholar] [CrossRef]
- Forkuo, E.; King, B. Automatic Fusion of Photogrammetric Imagery and Laser Scanner Point Clouds. In Proceedings of the International Archives of Photogrammetry and Remote Sensing, XXXV–B4, Istanbul, Turkey, 12–23 July 2004; pp. 921–926. [Google Scholar]
- Vosselman, R. Fusion of Laser Scanning Data, Maps, and Aerial Photographs for Building. In Proceedings of the IEEE International Geoscience and Remote Sensing Symposium, Toronto, ON, Canada, 24–28 June 2002; pp. 85–88. [Google Scholar]
- Gašparović, M.; Malarić, I. Increase of Readability and Accuracy of 3D Models Using Fusion of Close Range Photogrammetry and Laser Scanning. In Proceedings of the International Archives of Photogrammetry and Remote Sensing, XXXIX–B5, Melbourne, Australia, 25 August–01 September 2012; pp. 93–98. [Google Scholar]
- Beraldin, J.-A. Integration of Laser Scanning and Close-Range Photogrammetry—The last decade and beyond. In Proceedings of the International Archives of Photogrammetry and Remote Sensing, XXXV–B4, Istanbul, Turkey, 12–23 July 2004; pp. 12–23. [Google Scholar]
- Jo, Y.H.; Kim, J. Three-Dimensional Digital Documentation of Heritage Sites Using Terrestrial Laser Scanning and Unmanned Aerial Vehicle Photogrammetry. In Proceedings of the XXVI International CIPA Symposium, Ottawa, ON, Canada, 28 August–1 September 2017; pp. 395–398. [Google Scholar]
- Pérez, M.; Agüera, F.; Carvajal, F. Low Cost Surveying Using an Unmanned Aerial Vehicle. In Proceedings of the International Archives of Photogrammetry and Remote Sensing, XL-1/W2, Rostock, Germany, 4–6 September 2013; pp. 311–315. [Google Scholar]
- Gašparović, M.; Gajski, D. Two-Step Camera Calibration Method Developed for Micro UAV’s. In Proceedings of the International Archives of Photogrammetry and Remote Sensing, XLI-B1, Prague, Czech Republic, 12–19 July 2016; pp. 829–833. [Google Scholar]
- Gašparović, M.; Jurjević, L. Gimbal influence on the stability of exterior orientation parameters of UAV acquired images. Sensors 2017, 17, 401. [Google Scholar] [CrossRef] [PubMed]
- Nikolakopoulos, K.G.; Soura, K.; Koukouvelas, I.K.; Argyropoulos, N.G. UAV vs. classical aerial photogrammetry for archaeological studies. J. Archaeol. Sci. Rep. 2017, 14, 758–773. [Google Scholar] [CrossRef]
- Liu, K.; Ding, H.; Tang, G.; Na, J.; Huang, X.; Xue, Z.; Yang, X.; Li, F. Detection of catchment-scale gully-affected areas using unmanned aerial vehicle (UAV) on the Chinese Loess Plateau. ISPRS Int. J. Geo-Inf. 2018, 5, 238. [Google Scholar] [CrossRef]
- Liu, Y.; Zheng, X.; Ai, G.; Zhang, Y.; Zuo, Y. Generating a high-precision true digital orthophoto map based on UAV images. ISPRS Int. J. Geo-Inf. 2018, 7, 333. [Google Scholar] [CrossRef]
- Salach, A.; Bakuła, K.; Pilarska, M.; Ostrowski, W.; Górski, K.; Kurczyński, Z. Accuracy assessment of point clouds from LiDAR and dense image matching acquired using the UAV platform for DTM creation. ISPRS Int. J. Geo-Inf. 2018, 7, 342. [Google Scholar] [CrossRef]
- Moon, D.; Chung, S.; Kwon, S.; Seo, J.; Shin, J. Comparison and utilization of point cloud generated from photogrammetry and laser scanning: 3D world model for smart heavy equipment planning. Automat Constr. 2019, in press. [Google Scholar] [CrossRef]
- Habib, A.; Ghanma, M.; Mitishita, E. Co-registration of photogrammetric and LIDAR data: Methodology and case study. Rev. Brasileira Cartogr. 2004, 56, 1–13. [Google Scholar]
- Besl, P.; McKay, N. A method for registration of 3-D shapes. IEEE Trans. Pattern Anal. Mach. Intell. 1992, 14, 239–256. [Google Scholar] [CrossRef]
- Chen, Y.; Medioni, G. Object modelling by registration of multiple range images. Int. J. Comput. Vis. Image Underst. 1992, 10, 145–155. [Google Scholar] [CrossRef]


| GCPs | Terrestrial Laser Scanning | UAV Photogrammetry | ||||
|---|---|---|---|---|---|---|
| X | Y | Z | X | Y | Z | |
| CP1 | 0.000 m | −0.004 m | 0.000 m | 0.030 m | 0.005 m | −0.009 m |
| CP2 | 0.001 m | 0.001 m | 0.000 m | −0.003 m | 0.001 m | 0.024 m |
| CP3 | −0.007 m | 0.000 m | −0.001 m | −0.001 m | 0.027 m | 0.005 m |
| CP4 | 0.005 m | −0.008 m | −0.011 m | 0.044 m | −0.028 m | 0.052 m |
| CP5 | −0.009 m | −0.015 m | 0.099 m | −0.005 m | −0.025 m | 0.079 m |
| Mean | −0.002 m | −0.005 m | 0.017 m | 0.013 m | −0.004 m | 0.030 m |
| RMS | 0.006 m | 0.008 m | 0.045 m | 0.024 m | 0.021 m | 0.044 m |
| Point No. | Ground (G) | Buildings (B) | ||||
|---|---|---|---|---|---|---|
| X | Y | Z | X | Y | Z | |
| 1 | 0.012 m | 0.012 m | −0.002 m | 0.061 m | −0.033 m | −0.050 m |
| 2 | 0.013 m | −0.008 m | −0.010 m | −0.037 m | −0.016 m | 0.023 m |
| 3 | 0.026 m | 0.008 m | −0.009 m | 0.073 m | −0.001 m | −0.044 m |
| 4 | 0.016 m | −0.007 m | −0.005 m | 0.021 m | 0.009 m | −0.016 m |
| 5 | −0.001 m | 0.004 m | −0.002 m | 0.053 m | −0.005 m | −0.028 m |
| 6 | −0.004 m | 0.002 m | 0.019 m | 0.047 m | 0.040 m | −0.028 m |
| 7 | −0.013 m | −0.003 m | 0.004 m | 0.000 m | 0.003 m | 0.057 m |
| 8 | −0.012 m | 0.007 m | 0.001 m | 0.061 m | −0.035 m | −0.015 m |
| 9 | 0.009 m | −0.006 m | −0.003 m | −0.012 m | 0.012 m | −0.065 m |
| 10 | 0.008 m | −0.028 m | 0.030 m | 0.010 m | −0.026 m | 0.018 m |
| 11 | 0.021 m | −0.019 m | 0.002 m | 0.043 m | −0.047 m | 0.037 m |
| 12 | 0.019 m | −0.022 m | 0.000 m | 0.062 m | 0.041 m | −0.031 m |
| 13 | 0.004 m | 0.006 m | −0.008 m | 0.074 m | −0.013 m | −0.049 m |
| 14 | −0.004 m | 0.013 m | 0.002 m | 0.037 m | 0.031 m | −0.011 m |
| 15 | 0.030 m | −0.014 m | −0.003 m | 0.050 m | −0.049 m | −0.021 m |
| 16 | 0.011 m | −0.021 m | −0.011 m | 0.022 m | 0.049 m | 0.018 m |
| 17 | −0.011 m | −0.006 m | −0.010 m | 0.003 m | 0.012 m | 0.015 m |
| 18 | −0.010 m | 0.011 m | −0.012 m | 0.030 m | −0.002 m | 0.039 m |
| 19 | −0.020 m | 0.025 m | 0.009 m | −0.007 m | −0.014 m | −0.071 m |
| 20 | 0.007 m | −0.027 m | 0.000 m | −0.032 m | 0.018 m | −0.004 m |
| Mean | 0.005 m | −0.004 m | 0.000 m | 0.028 m | −0.001 m | −0.011 m |
| RMS | 0.015 m | 0.015 m | 0.010 m | 0.043 m | 0.028 m | 0.037 m |
| Alignment Processing | Max Search Distance Parameters | Iterations | RMS | Mean |
|---|---|---|---|---|
| First stage | 0.100 m | 12 | 0.038 m | 0.030 m |
| Second stage | 0.050 m | 10 | 0.020 m | 0.016 m |
| Third stage | 0.025 m | 18 | 0.012 m | 0.010 m |
| Fourth stage | 0.012 m | 6 | 0.006 m | 0.005 m |
© 2019 by the authors. Licensee MDPI, Basel, Switzerland. This article is an open access article distributed under the terms and conditions of the Creative Commons Attribution (CC BY) license (http://creativecommons.org/licenses/by/4.0/).
Share and Cite
Jo, Y.H.; Hong, S. Three-Dimensional Digital Documentation of Cultural Heritage Site Based on the Convergence of Terrestrial Laser Scanning and Unmanned Aerial Vehicle Photogrammetry. ISPRS Int. J. Geo-Inf. 2019, 8, 53. https://0-doi-org.brum.beds.ac.uk/10.3390/ijgi8020053
Jo YH, Hong S. Three-Dimensional Digital Documentation of Cultural Heritage Site Based on the Convergence of Terrestrial Laser Scanning and Unmanned Aerial Vehicle Photogrammetry. ISPRS International Journal of Geo-Information. 2019; 8(2):53. https://0-doi-org.brum.beds.ac.uk/10.3390/ijgi8020053
Chicago/Turabian StyleJo, Young Hoon, and Seonghyuk Hong. 2019. "Three-Dimensional Digital Documentation of Cultural Heritage Site Based on the Convergence of Terrestrial Laser Scanning and Unmanned Aerial Vehicle Photogrammetry" ISPRS International Journal of Geo-Information 8, no. 2: 53. https://0-doi-org.brum.beds.ac.uk/10.3390/ijgi8020053