Article

Multi-Sensor UAV Application for Thermal Analysis on a Dry-Stone Terraced Vineyard in Rural Tuscany Landscape

1
SCHEMA—Joint Laboratory between DICEA—Department of Civil and Environmental Engineering, Italian Military Geographic Institute, University of Florence and IMGI, Via di S. Marta, 3-50139 Florence, Italy
2
DAGRI—Department of Science and Technology of Agriculture, Food, Environment and Forestry—University of Florence, Via di S. Bonaventura, Quaracchi, 13-50145 Florence, Italy
3
WaVe (Water and Vegetation) Research Unit, University of Florence, Via di S. Bonaventura, Quaracchi, 13-50145 Florence, Italy
4
DICA—Department of Civil and Environmental Engineering, Polytechnic University of Milan, P.zza Leonardo da Vinci, 32-20133 Milan, Italy
5
IMGI—Italian Military Geographic Institute, Via C. Battisti, 10/12-50122 Florence, Italy
*
Authors to whom correspondence should be addressed.
ISPRS Int. J. Geo-Inf. 2019, 8(2), 87; https://0-doi-org.brum.beds.ac.uk/10.3390/ijgi8020087
Submission received: 31 January 2019 / Revised: 9 February 2019 / Accepted: 13 February 2019 / Published: 15 February 2019
(This article belongs to the Special Issue Data Acquisition and Processing in Cultural Heritage)

Abstract

:
Italian dry-stone wall terracing represents one of the most iconic features of agricultural landscapes across Europe, with sites listed among UNESCO World Heritage Sites and FAO Globally Important Agricultural Heritage Systems (GIAHS). The analysis of microclimate modifications induced by alterations of hillslope and by dry-stone walls is of particular interest for the valuation of benefits and drawbacks of terraces cultivation, a global land management technique. The aim of this paper is to perform a thermal characterization of a dry-stone wall terraced vineyard in the Chianti area (Tuscany, Italy), to detect possible microclimate dynamics induced by dry-stone terracing. The aerial surveys were carried out by using two sensors, in the Visible (VIS) and Thermal InfraRed (TIR) spectral range, mounted on Unmanned Aerial Vehicles (UAVs), with two different flights. Our results reveal that, in the morning, vineyard rows close to dry-stone walls have statistically lower temperatures with respect to the external ones. In the afternoon, due to solar insulation, temperatures raised to the same value for each row. The results of this early study, jointly with the latest developments in UAV and sensor technologies, justify and encourage further analyses on local climatic modifications in terraced landscapes.

1. Introduction

Dry-stone wall terracing represents one of the most iconic features of agricultural landscapes across Europe, as well as in other rural regions of the world. Italian and other dry-stone walls were added in November 2018 to UNESCO’s Representative List of the Intangible Cultural Heritage of Humanity (Decision 13.COM 10.b.10). Dry stone walling was recognized to be still in use in several countries, playing a fundamental role in maintaining the environment and landscape.
In addition, many terraced landscapes of the world are already inserted among UNESCO World Heritage Sites list, as well as in the newly established FAO Globally Important Agricultural Heritage Systems (GIAHS), including cases of Italian dry-stone wall terracing, such as “Portovenere, Cinque Terre, and the Islands terraced vineyards”, (UNESCO Heritage Site), or the “Olive Groves of the Slopes between Assisi and Spoleto” (FAO GIAHS).
In Italy, and in particular in the Tuscany region, rural landscape is characterized by the presence of stone wall bench terraces [1]. It is evident how terracing can alter the physical landscape, influencing factors such as soil moisture, erosion control and soil conservation [2]. The different ecosystem services provided by agricultural terraces have been object of a large number of studies in recent years [2,3,4]. These structures can induce significant modifications to local microclimate, such as a shading, as well as effects on local winds, inducing a potential thermal effect.
Due to the growing availability of short- (cameras) to long-range (satellite) sensors, remote sensing-based methodologies have been applied to the analysis of agricultural terraced fields, focusing on geo-morphological aspects, including analysis of preferential drainage patterns [5], and large scale [6] to medium scale terraces sites mapping [7]. Furthermore, remote sensing methodologies can be used to detect relevant bio-geo physical phenomena in these unique agricultural landscapes, such as microclimatic effects induced by the geo-morphological shape of bench terraces, as well as the presence of anthropic artifacts, such as dry-stone walls.
Nowadays, Unmanned Aerial Vehicle (UAV) systems can compete with traditional remote-sensing platforms (i.e., aircrafts and satellites) for agricultural mapping, thanks to their high flexibility of use, low operational cost and very high spatial resolution (cm-level). In Matese et al. [8] a comparison between vegetation indices obtained by satellite, aircraft and UAV platforms for intra-vineyard variability monitoring, highlights pros and cons of the different technologies: (i) satellite survey allows to simultaneously cover a wider area but is affected by some limitations, such as low spatial resolution for precision agriculture purposes, meteorological- and orbit-dependent acquisition, high economic costs; (ii) aircraft surveys are characterized by higher planning flexibility although noticeable organizational efforts and costs needs to be considered; (iii) UAVs are suitable systems for small field applications, but are still limited on wider areas because of their short flight endurance and limited payload for sensor carriage.
UAV photogrammetry has been extensively used for mapping and 3D modeling in the geomatics field, as evidenced by the huge increase in this research field in the last few years [9,10,11,12]. These platforms, equipped with digital RGB cameras, represent now a common alternative to traditional aerial manned photogrammetry. The application fields of image-based photogrammetric products from UAVs, such as 3D models or orthoimages, relate to forestry and agriculture [13], archaeology [14], architecture [15], cultural heritage [16,17,18], environmental surveying [19], traffic monitoring [20], and many others. Considering the above-mentioned features, and the possibility of carrying different type of payloads, ranging from RGB to Thermal InfraRed (TIR) sensors, UAVs appears to represent a key technology allowing a deeper understanding of small- to medium-scale bio-geophysical processes in agricultural landscapes.
The acquisition of the emitted radiation from natural surfaces in the range of TIR, thanks to airborne mounted sensors, allows us to obtain useful indication about soil and crops status by the analysis of temperature distribution across the field. For the specific case of vineyards, temperature patterns play a crucial role in regulating plant physiology, influencing phenology [21] and photosynthesis [22]. Furthermore, temperature trends were found to significantly impact on the berry developmental processes, such as the accumulation of dry matter and sugar [23], or the accumulation of anthocyanins [24], thus potentially determining the quality of the final product, wine. Costa et al. [25] reported a research on the evaluation of canopy temperature to generate maps for irrigation scheduling; other thermal-related indices were proposed by Idso et al. [26] and Jones [27,28] for the evaluation of crop water stress and stomatal conductance, respectively. Applications of thermal imaging on vineyard has been tested by García-Tejero et al. [29], Grant et al. [30], Jones et al. [28,31] and Moller et al. [32], who researched the correlation between thermal indices and different water regimes of vineyards. Further tests with thermal camera mounted on UAV systems are reported in Baluja et al. [33], for the evaluation of water status variability; Berni et al. [34] estimated biophysical parameters and water stress from thermal imagery; Turner et al. [35] presented a UAV system equipped with a thermal camera for soil moisture assessment to improve irrigation efficiency; Bellvert et al. [36] reported the evaluation of crop water stress index (CWSI) for precision irrigation in a Spanish vineyard.
To our knowledge, few, early experiences of thermal monitoring of dry-stone agricultural terraces have been carried out. Warren et al. [37] tested the use of TIR imagery for the detection of dry-stone walls features. They showed how thermal imagery can be used to detect wall features such as the depth of backfill, areas of high moisture and the presence of particular structural elements not visible from conventional surveys. Barbera et al. [38] analyzed the microclimatic modifications induced by dry stone walls in particular structures called “jardinu” (circular dry-stone walls protecting single or groups of trees), located in the Pantelleria Island terraced fields. They found out that the thermal inertia of the stones may greatly enhance dewfall occurrence, both on stones and on leaves, suggesting a thermal gradient between the stones and the nearby environment. Moreover, they observed that the dissipation of the heat cumulated during the day by the stones reduced temperature excursion at night, positively affecting citrus adaptation. The importance of microclimatic monitoring through remotely sensed methods for a more reliable and advanced management of eco-, as well as agricultural systems, is advancing in parallel to technological innovations of sensors and UAV platforms, as pointed out by Zellweger et al. [39]. For instance, the recent study of Romboli et al. [40] showed how microclimate spatial variability interacts with vine vigor in determining grape and wine characteristics. This latter one, however, was carried out in one non-terraced vineyard, with no anthropic modification to the surrounding landscape apart from cultivations. From the perspective of better understanding all the implications connected to dry-stone walls traditional structures over microclimate variations, further investigations are necessary.
Taking advantage by recent progresses in UAVs technologies, this paper presents a preliminary test carried out using a TIR sensor mounted on a UAV, coupled with a common RGB survey, to detect the thermal dynamics of a vineyard grown on a dry-stone wall terraced land, with the specific purposes of:
  • Investigate strengths and weaknesses of the use of TIR sensor mounted on UAV for thermal analysis of terraced crops;
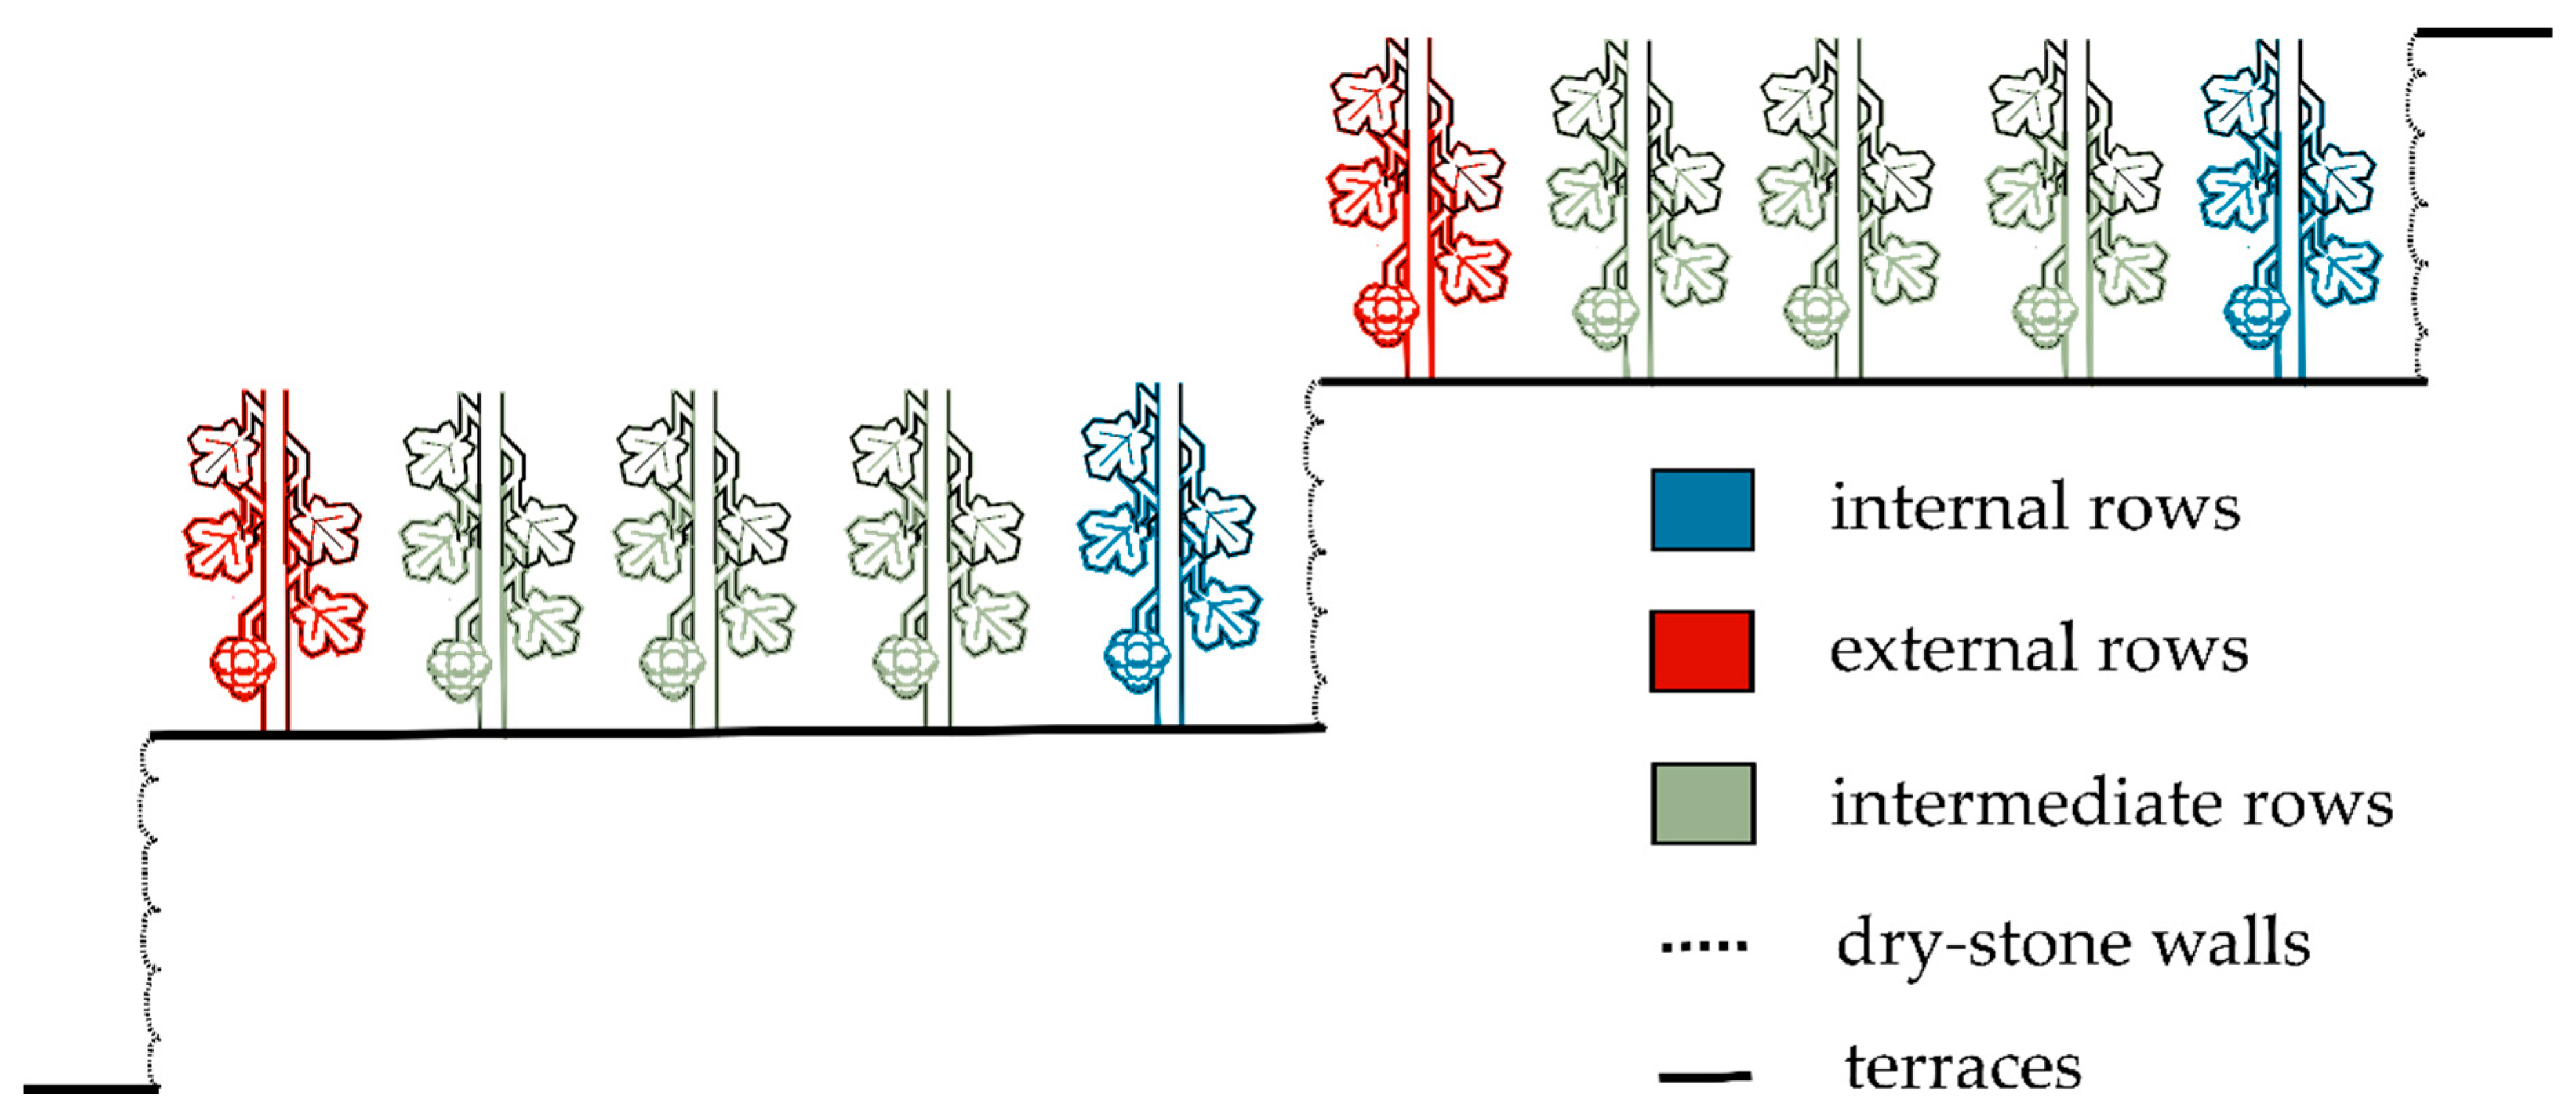
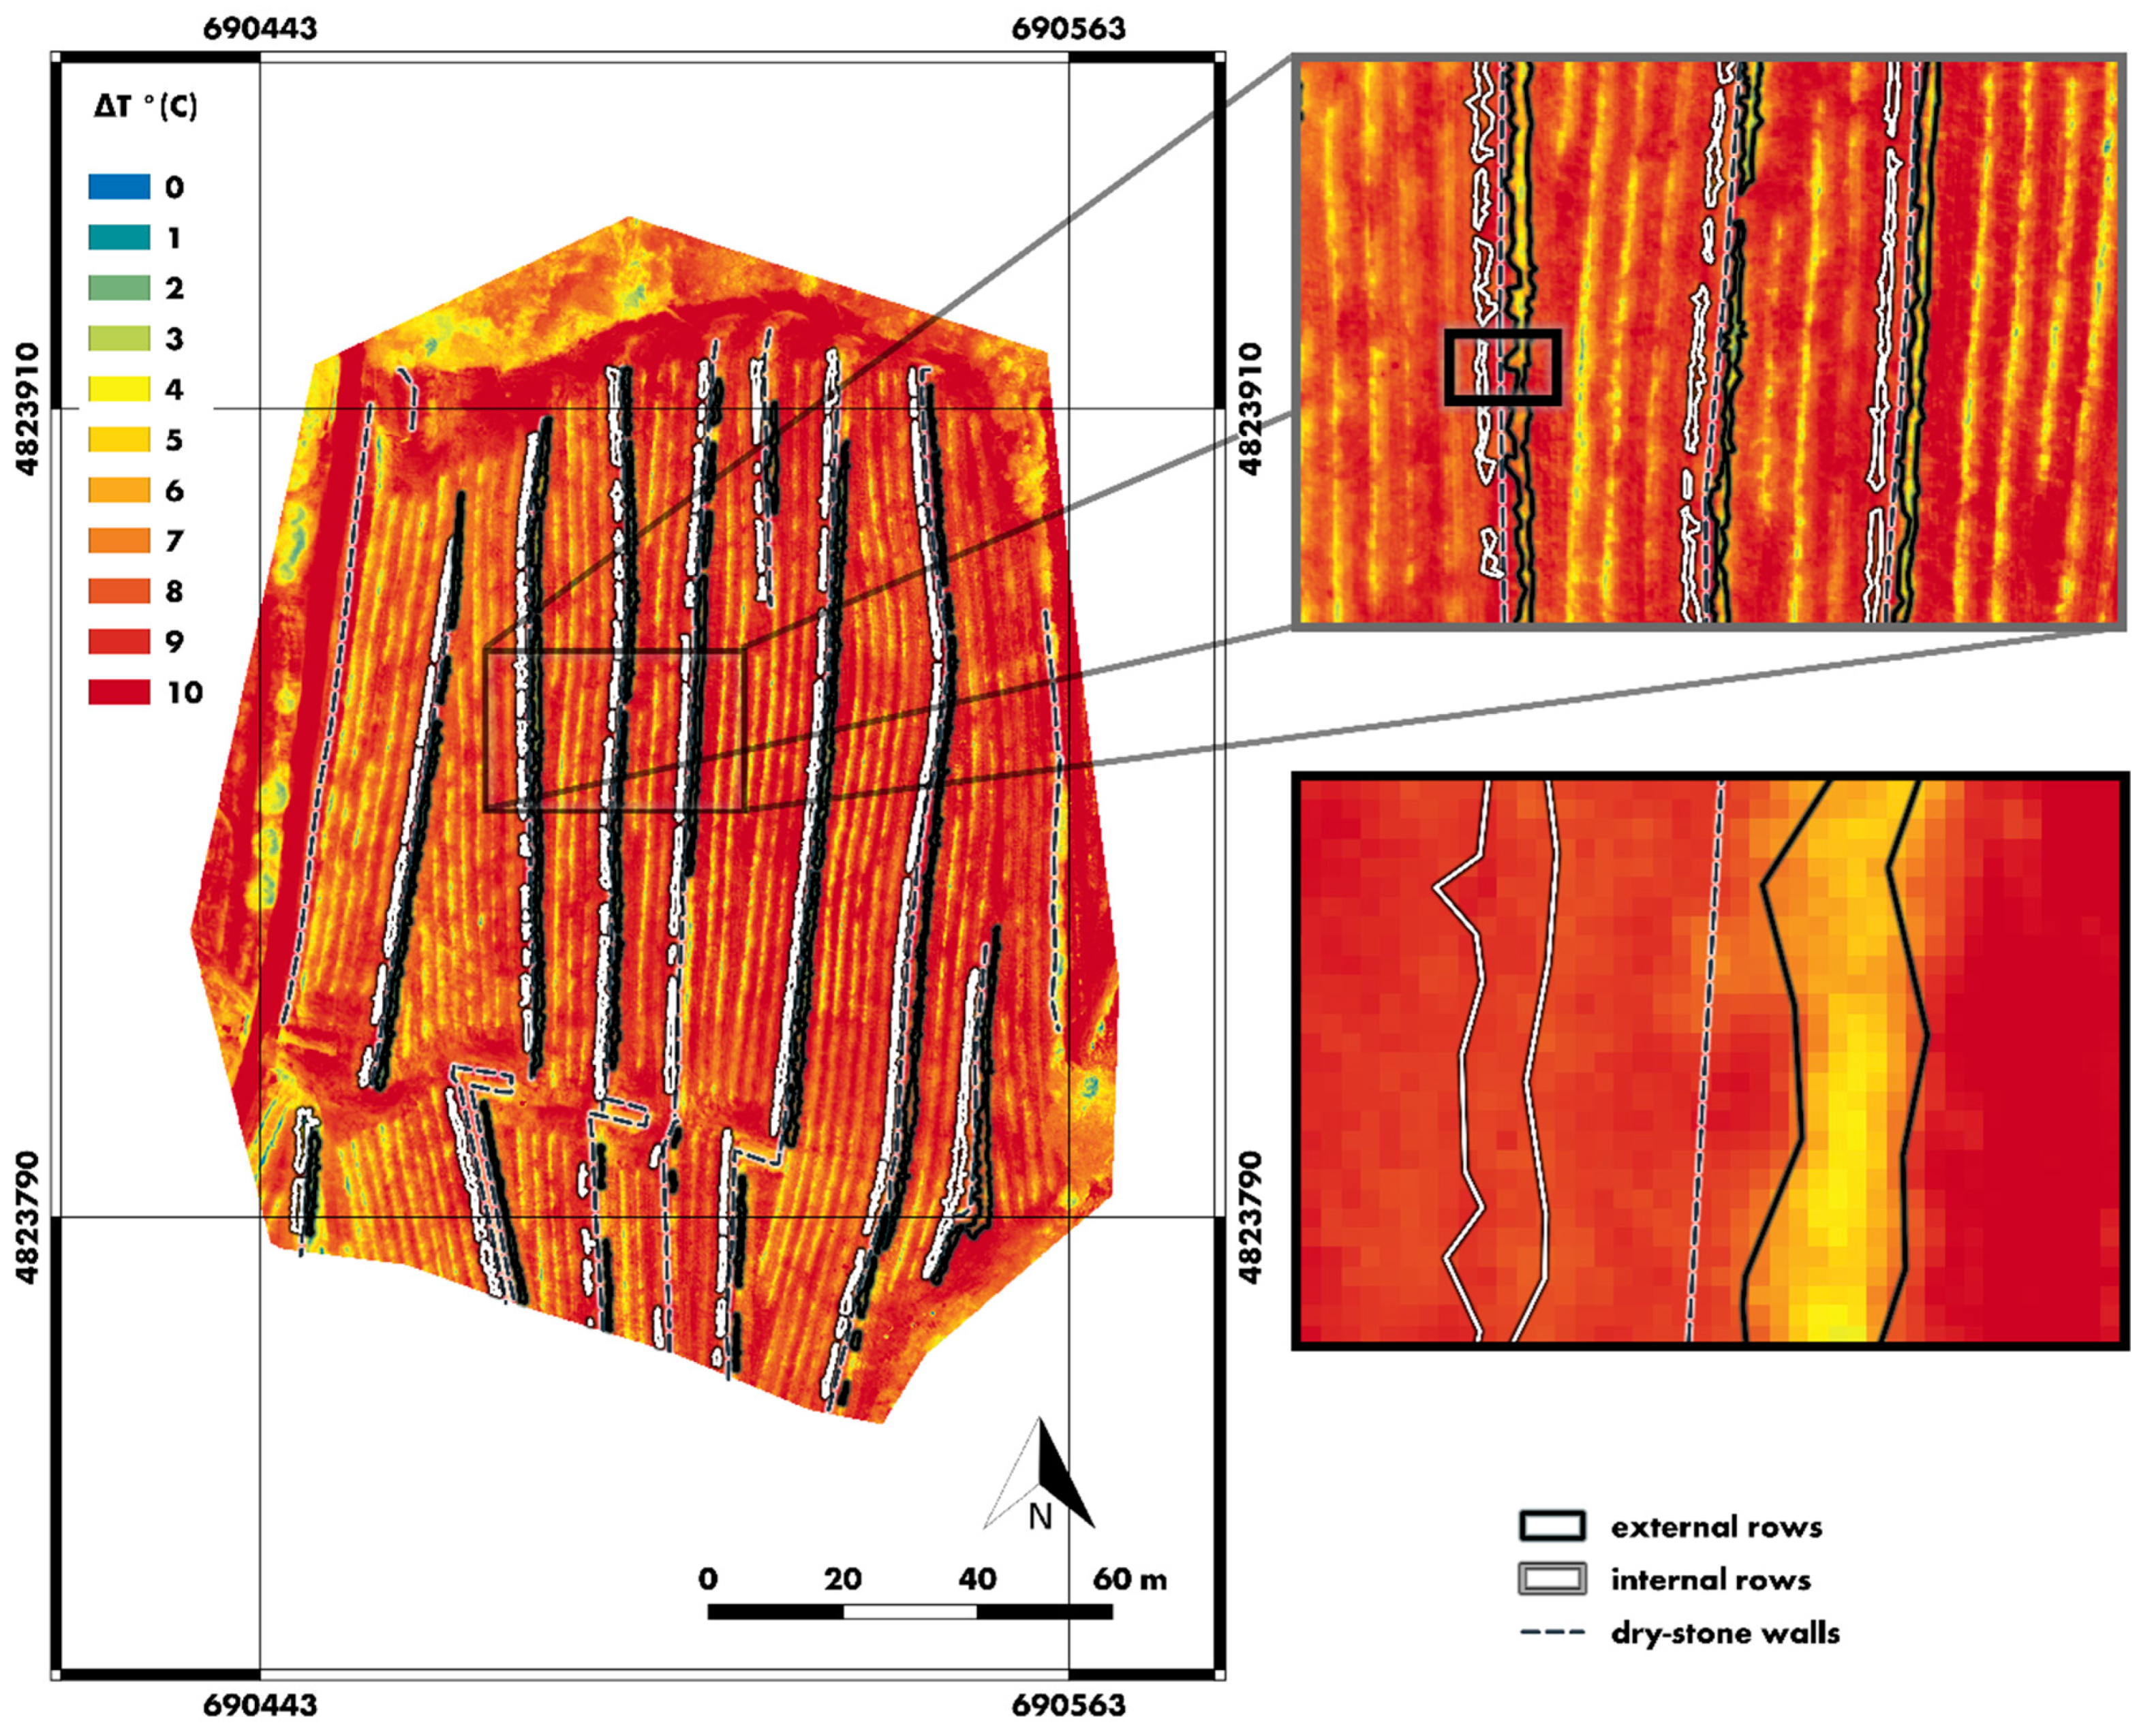
  • conduct a preliminary test on the possible thermal effect that dry-stone walls can have on the vineyard microclimate, testing the hypothesis that stones have an influence on the temperature patterns of the field which can influence grape ripening and quality.
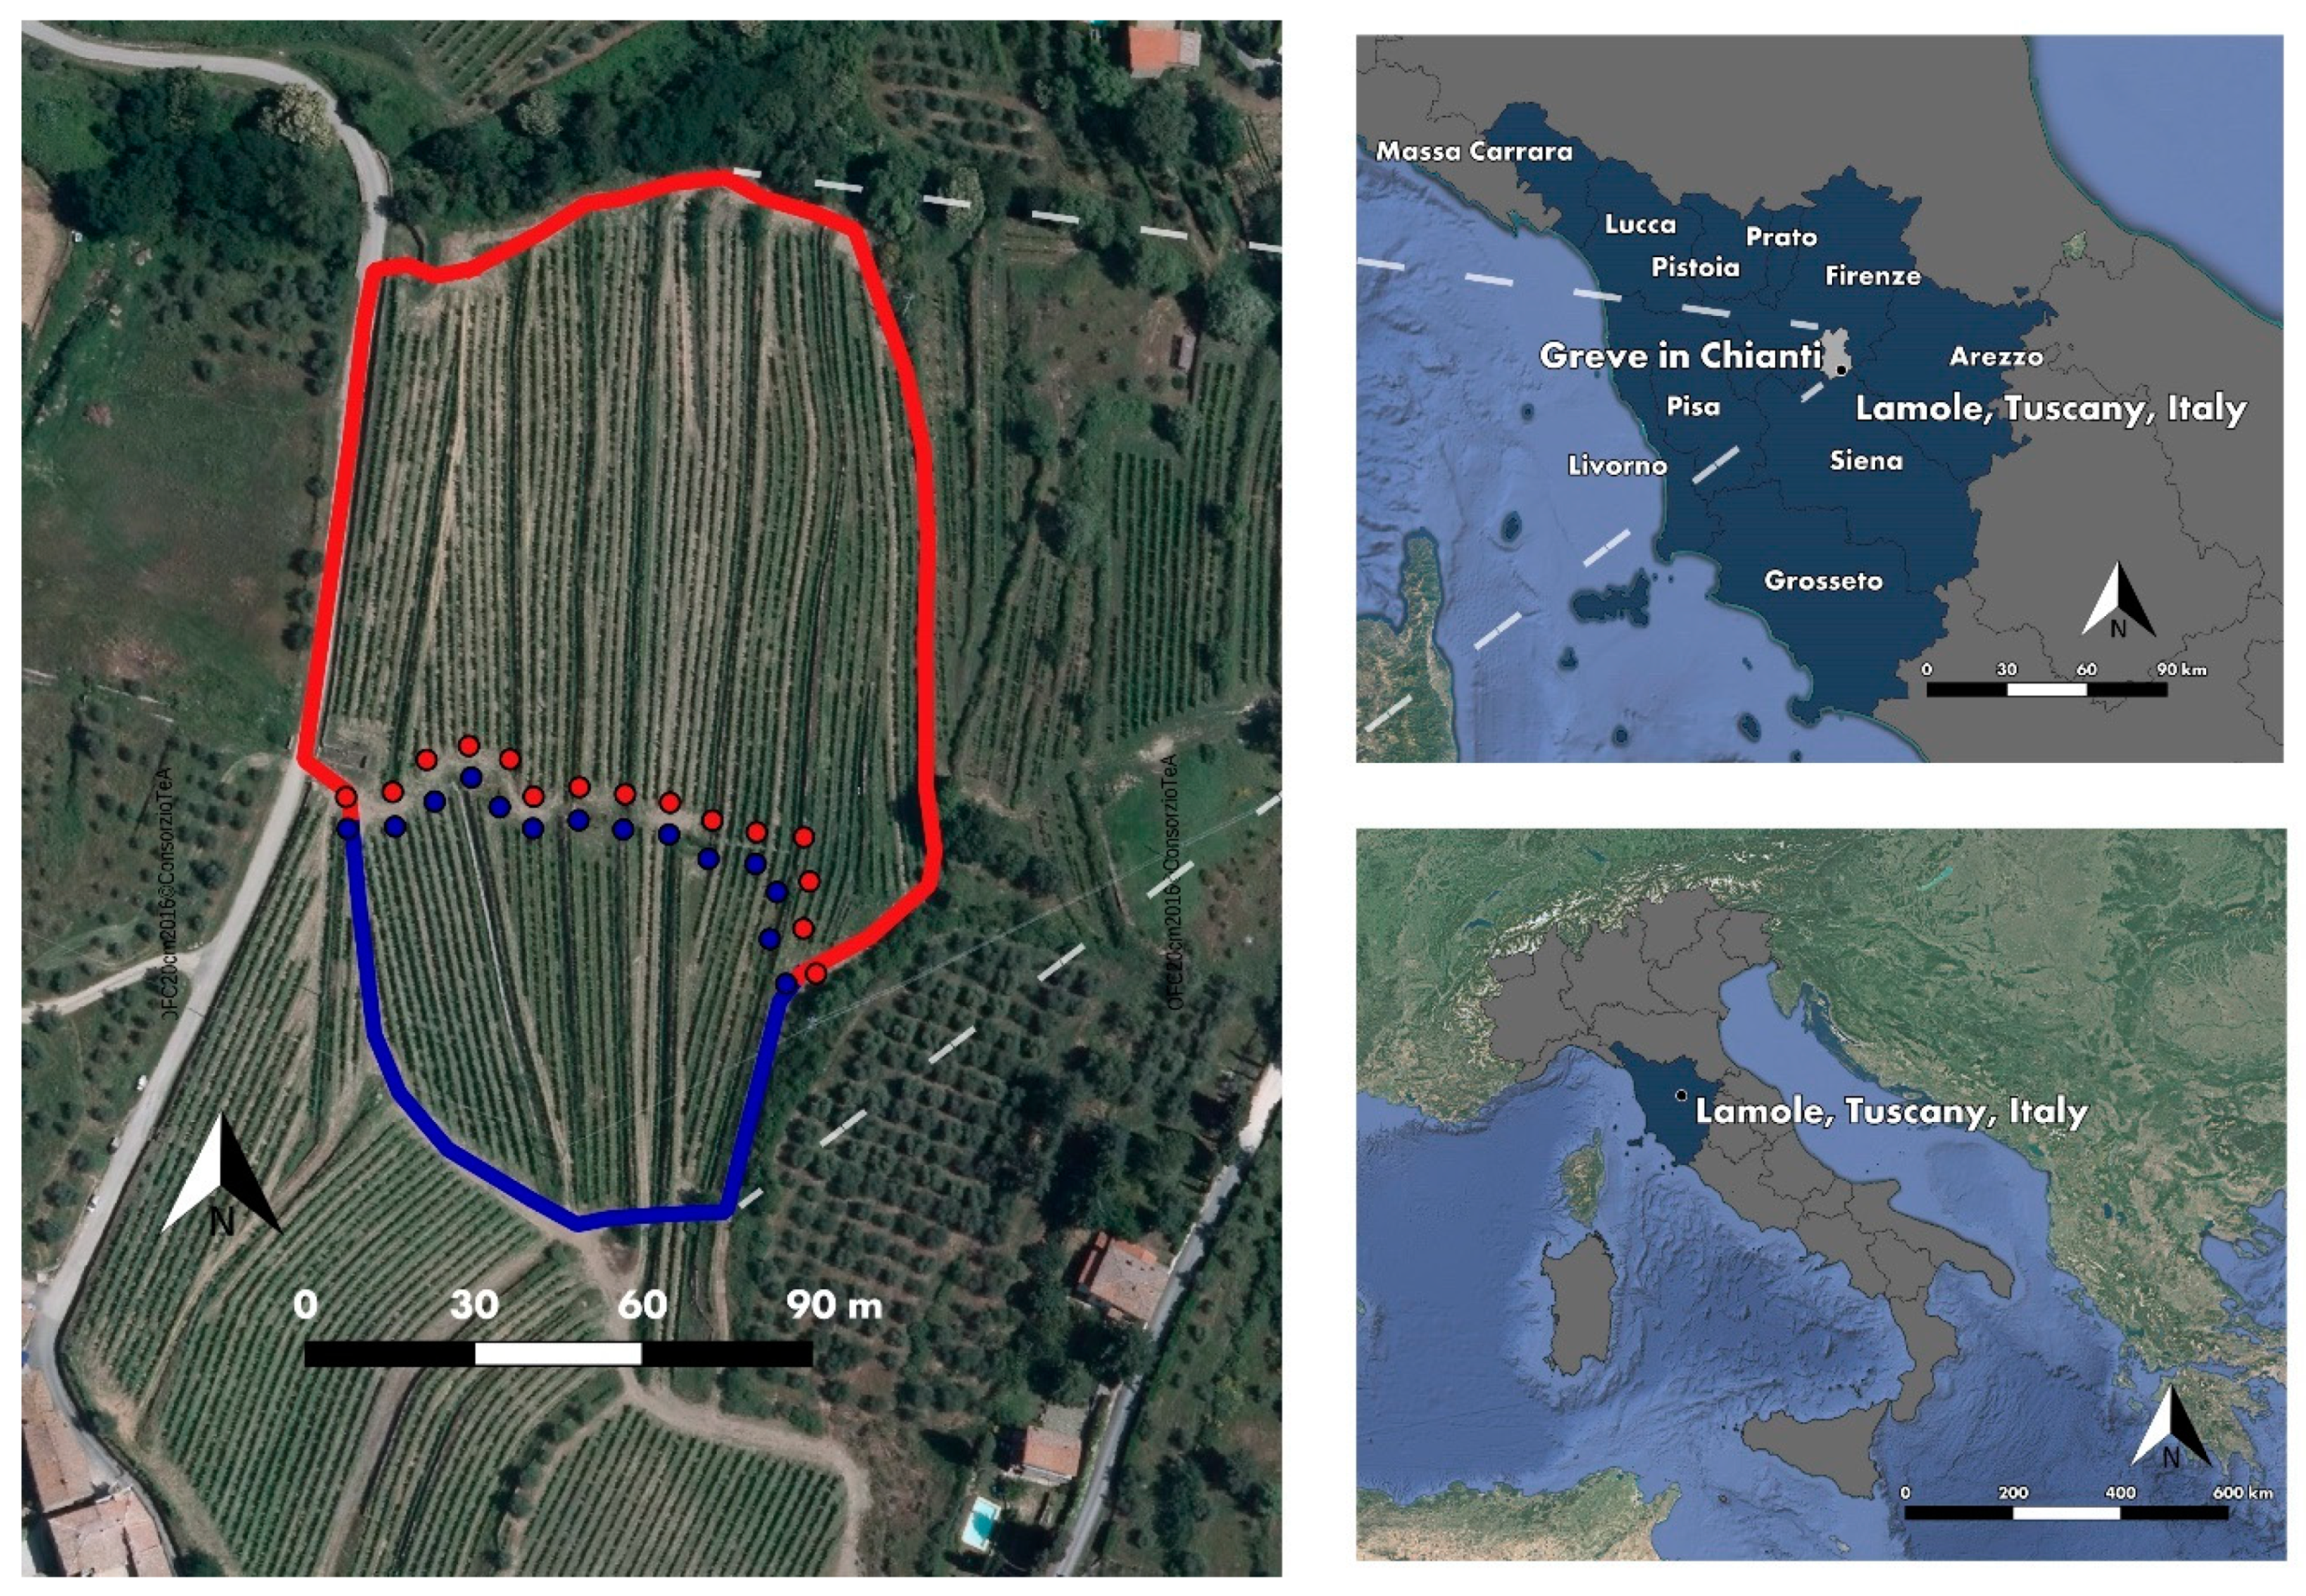
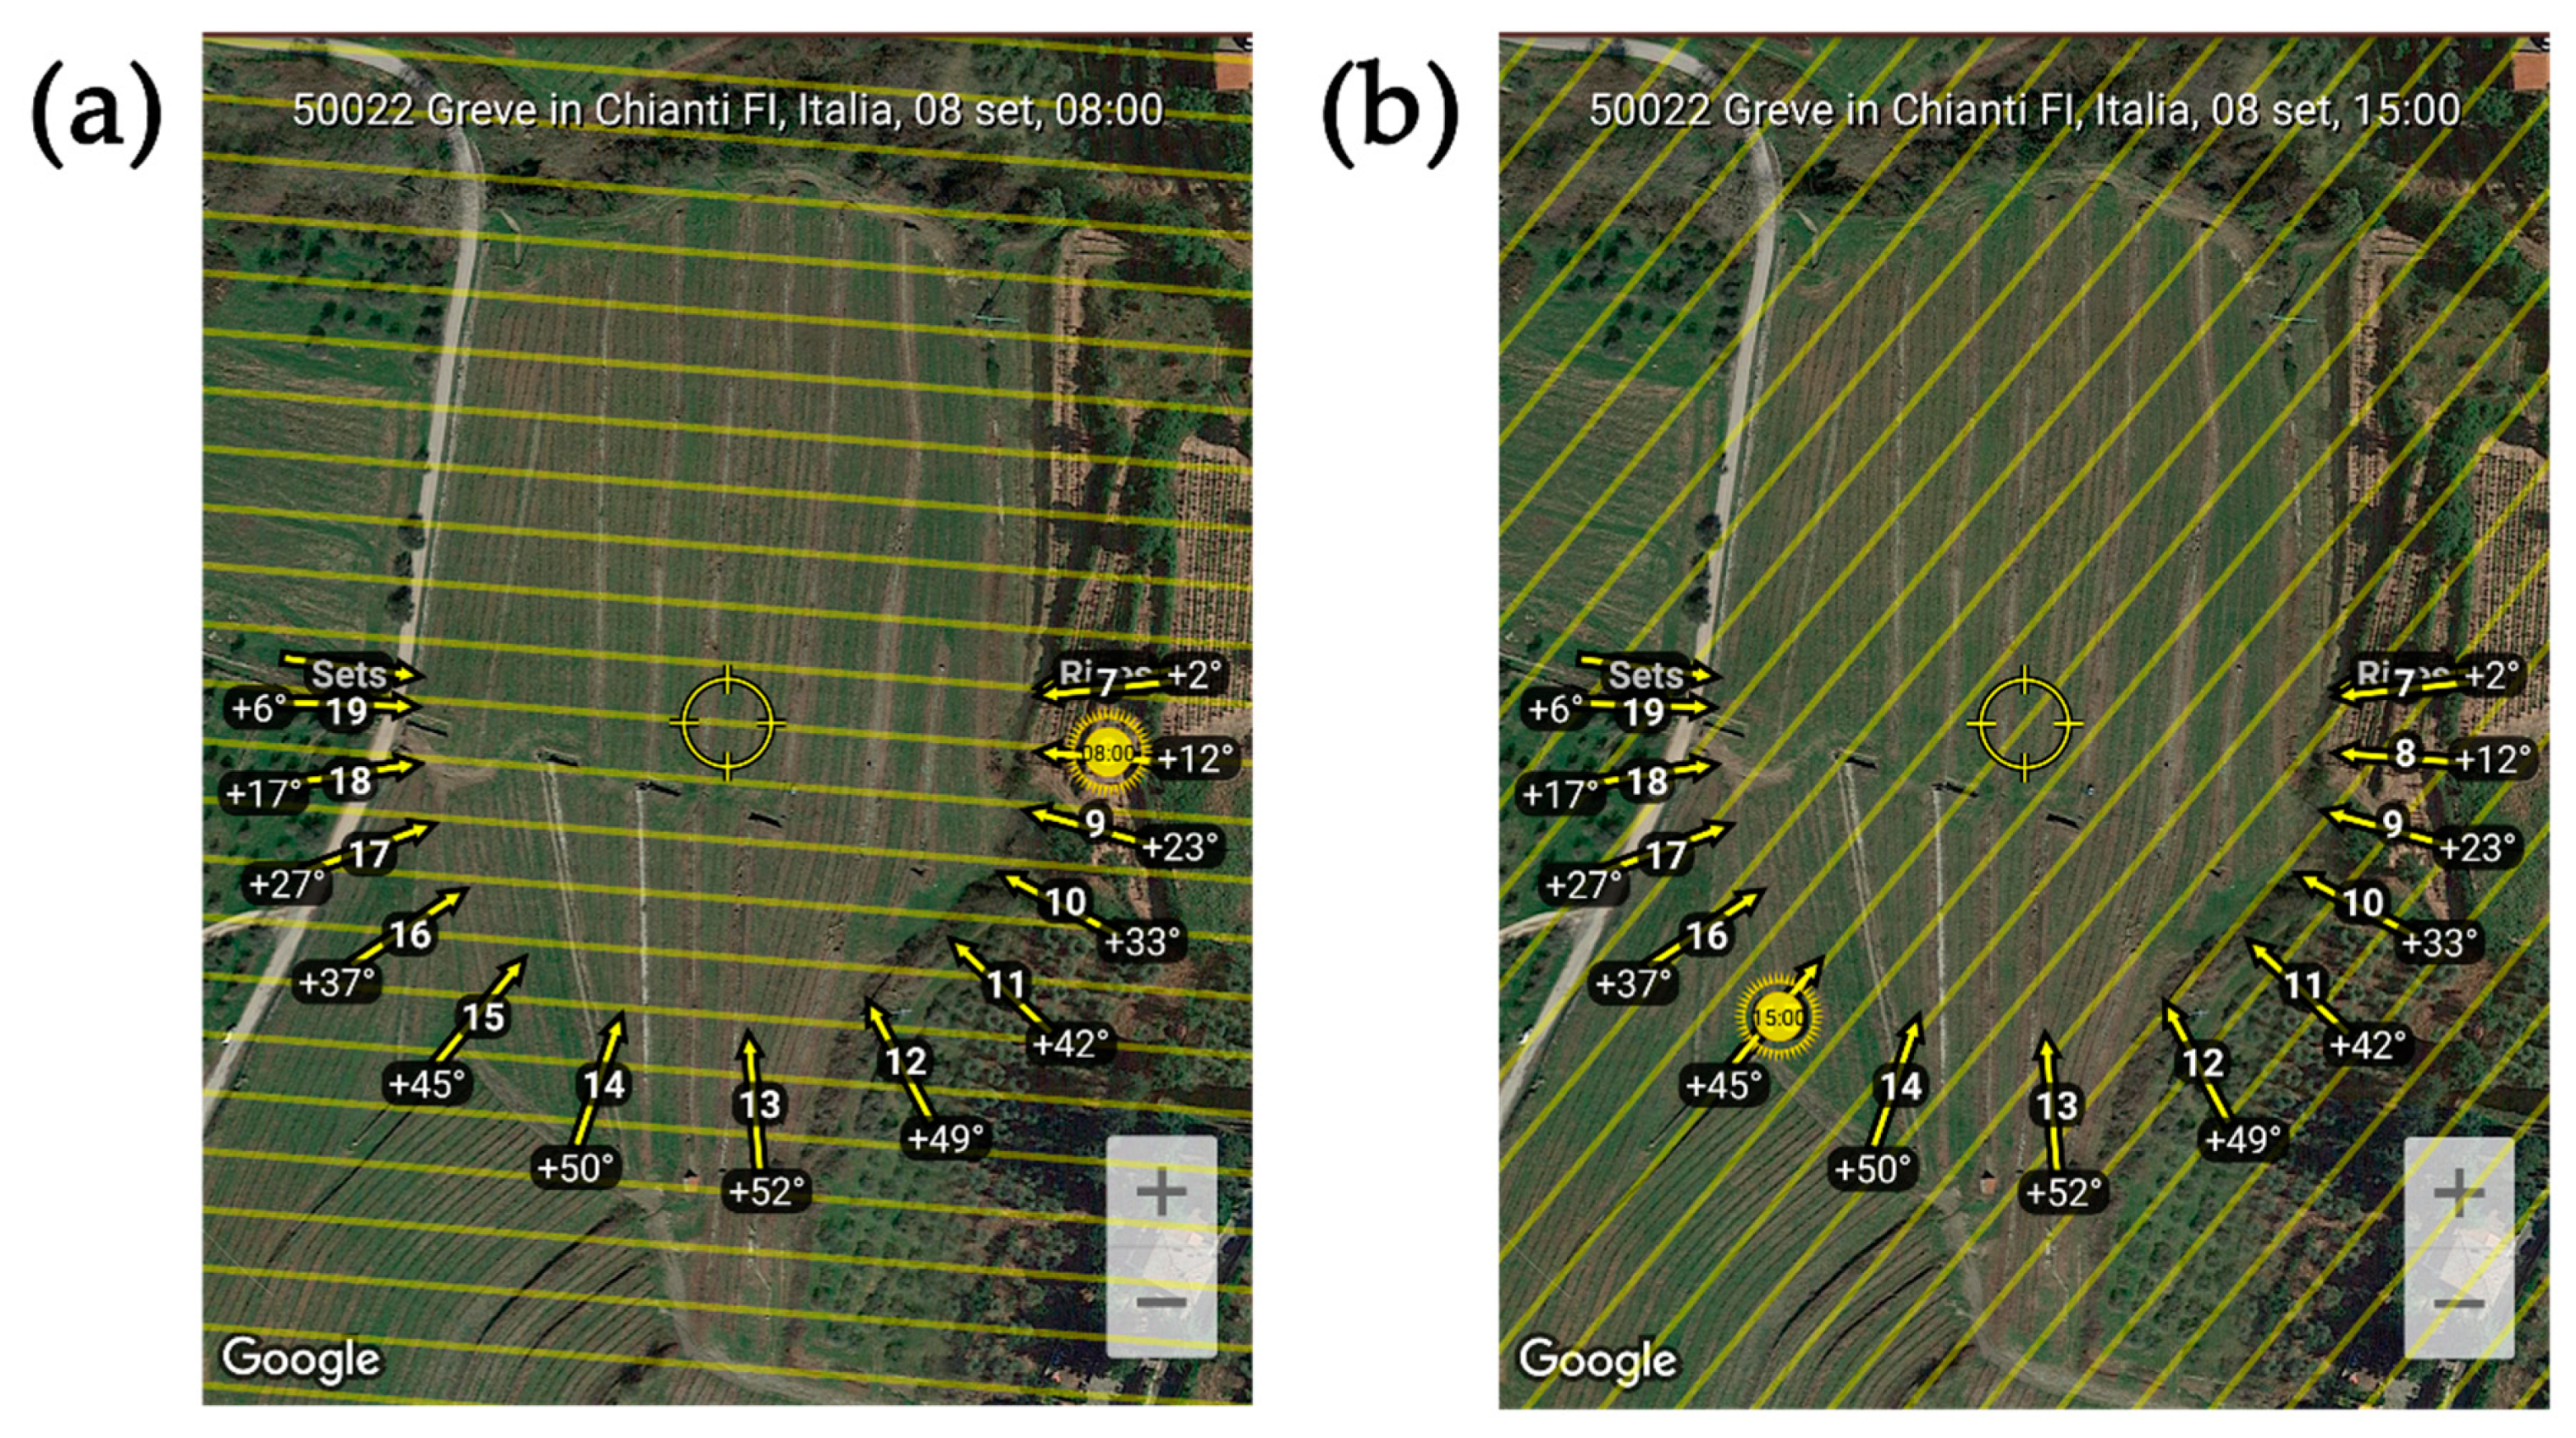
2. Study Area

The terraced area of Lamole, within the municipality of Greve in Chianti (Florence, Italy; 43°32′34.73″ N, 11°21′29.14″ E), represents one of the most relevant examples of agricultural terracing sites of the country. Despite not yet being present in FAO GIAHS and UNESCO Heritage lists, the site was included in the Rural Historic Landscape Catalogue [41] of the Italian Ministry of Agricultural, Food, Forestry Policies in February 2018. As reported in the related Ministerial Decree (n. 6415 of 20 February 2018), the Lamole area was included in the Catalogue because it represents “an historical landscape where soil protection measures, represented by dry-stone wall terraces, together with policoltures represented by olive groves and vineyards, the woodland and the historical settlements preserve the Chianti cultural identity. Moreover, Lamole represents a remarkable example of dynamic recover and conservation of historical agricultural practices, which play nowadays a peerless added value for the development of the entire territory.”
The study has been carried out in the Grospoli terraced vineyard, a site that has been object of a significant number of studies related to hydrological processes and failures on terraces (among others, Preti et al. [42,43]). The area lies in the Chianti Classico production region. Sangiovese, Petit Verdot, Cabernet Sauvignon cultivars are grown in the vineyard (Figure 1).
The vineyard has an area of 1.76 ha, with slopes ranging from from 12 to 22% [43] and an average altitude of 545 m a.s.l. The average terrace width is around 11 m, with wall ranging from 1 to 2.7 m height. For the remote sensing analysis, rows of vines were divided in two groups, the North and the South part, that are shown in Figure 2.

3. Materials and Methods

An aerial survey campaign was performed on 8 September 2017 over the Grospoli terraced vineyard in Lamole, a few weeks before grape harvesting, by employing two different UAVs, equipped with different sensors. The operations were carried out by the research group of the Survey, Cultural Heritage, Engineering, Monitoring, Analysis (SCHEMA) Laboratory, a joint collaboration between the University of Florence and the Italian Military Geographic Institute (IGMI). The first photogrammetric test was performed with a classic aerial approach in the visible (VIS) range, to produce a Digital Elevation Model (DEM) of the area and the respective projected orthophoto. The second test was performed in the TIR range in order to study the influence of stone walls upon the thermal properties of the neighboring rows. The TIR campaign was originally designed by planning three flights, in the morning, half day and evening, to monitor the thermal range over the entire day. Two flights were finally performed, due to the adverse climate conditions, in the morning (08:50 CET) and at 15:00 CET in the afternoon. Each flight was performed in terrain-following mode, which ensures the correct value of overlap and Ground Sample Distance (GSD) on uneven ground is maintained. The surveys with UAVs respected the regulation of the Italian Civil Aviation Authority (Ente Nazionale Aviazione Civile) in terms of non-critical operations, thus in Visual Line of Sight (VLoS).

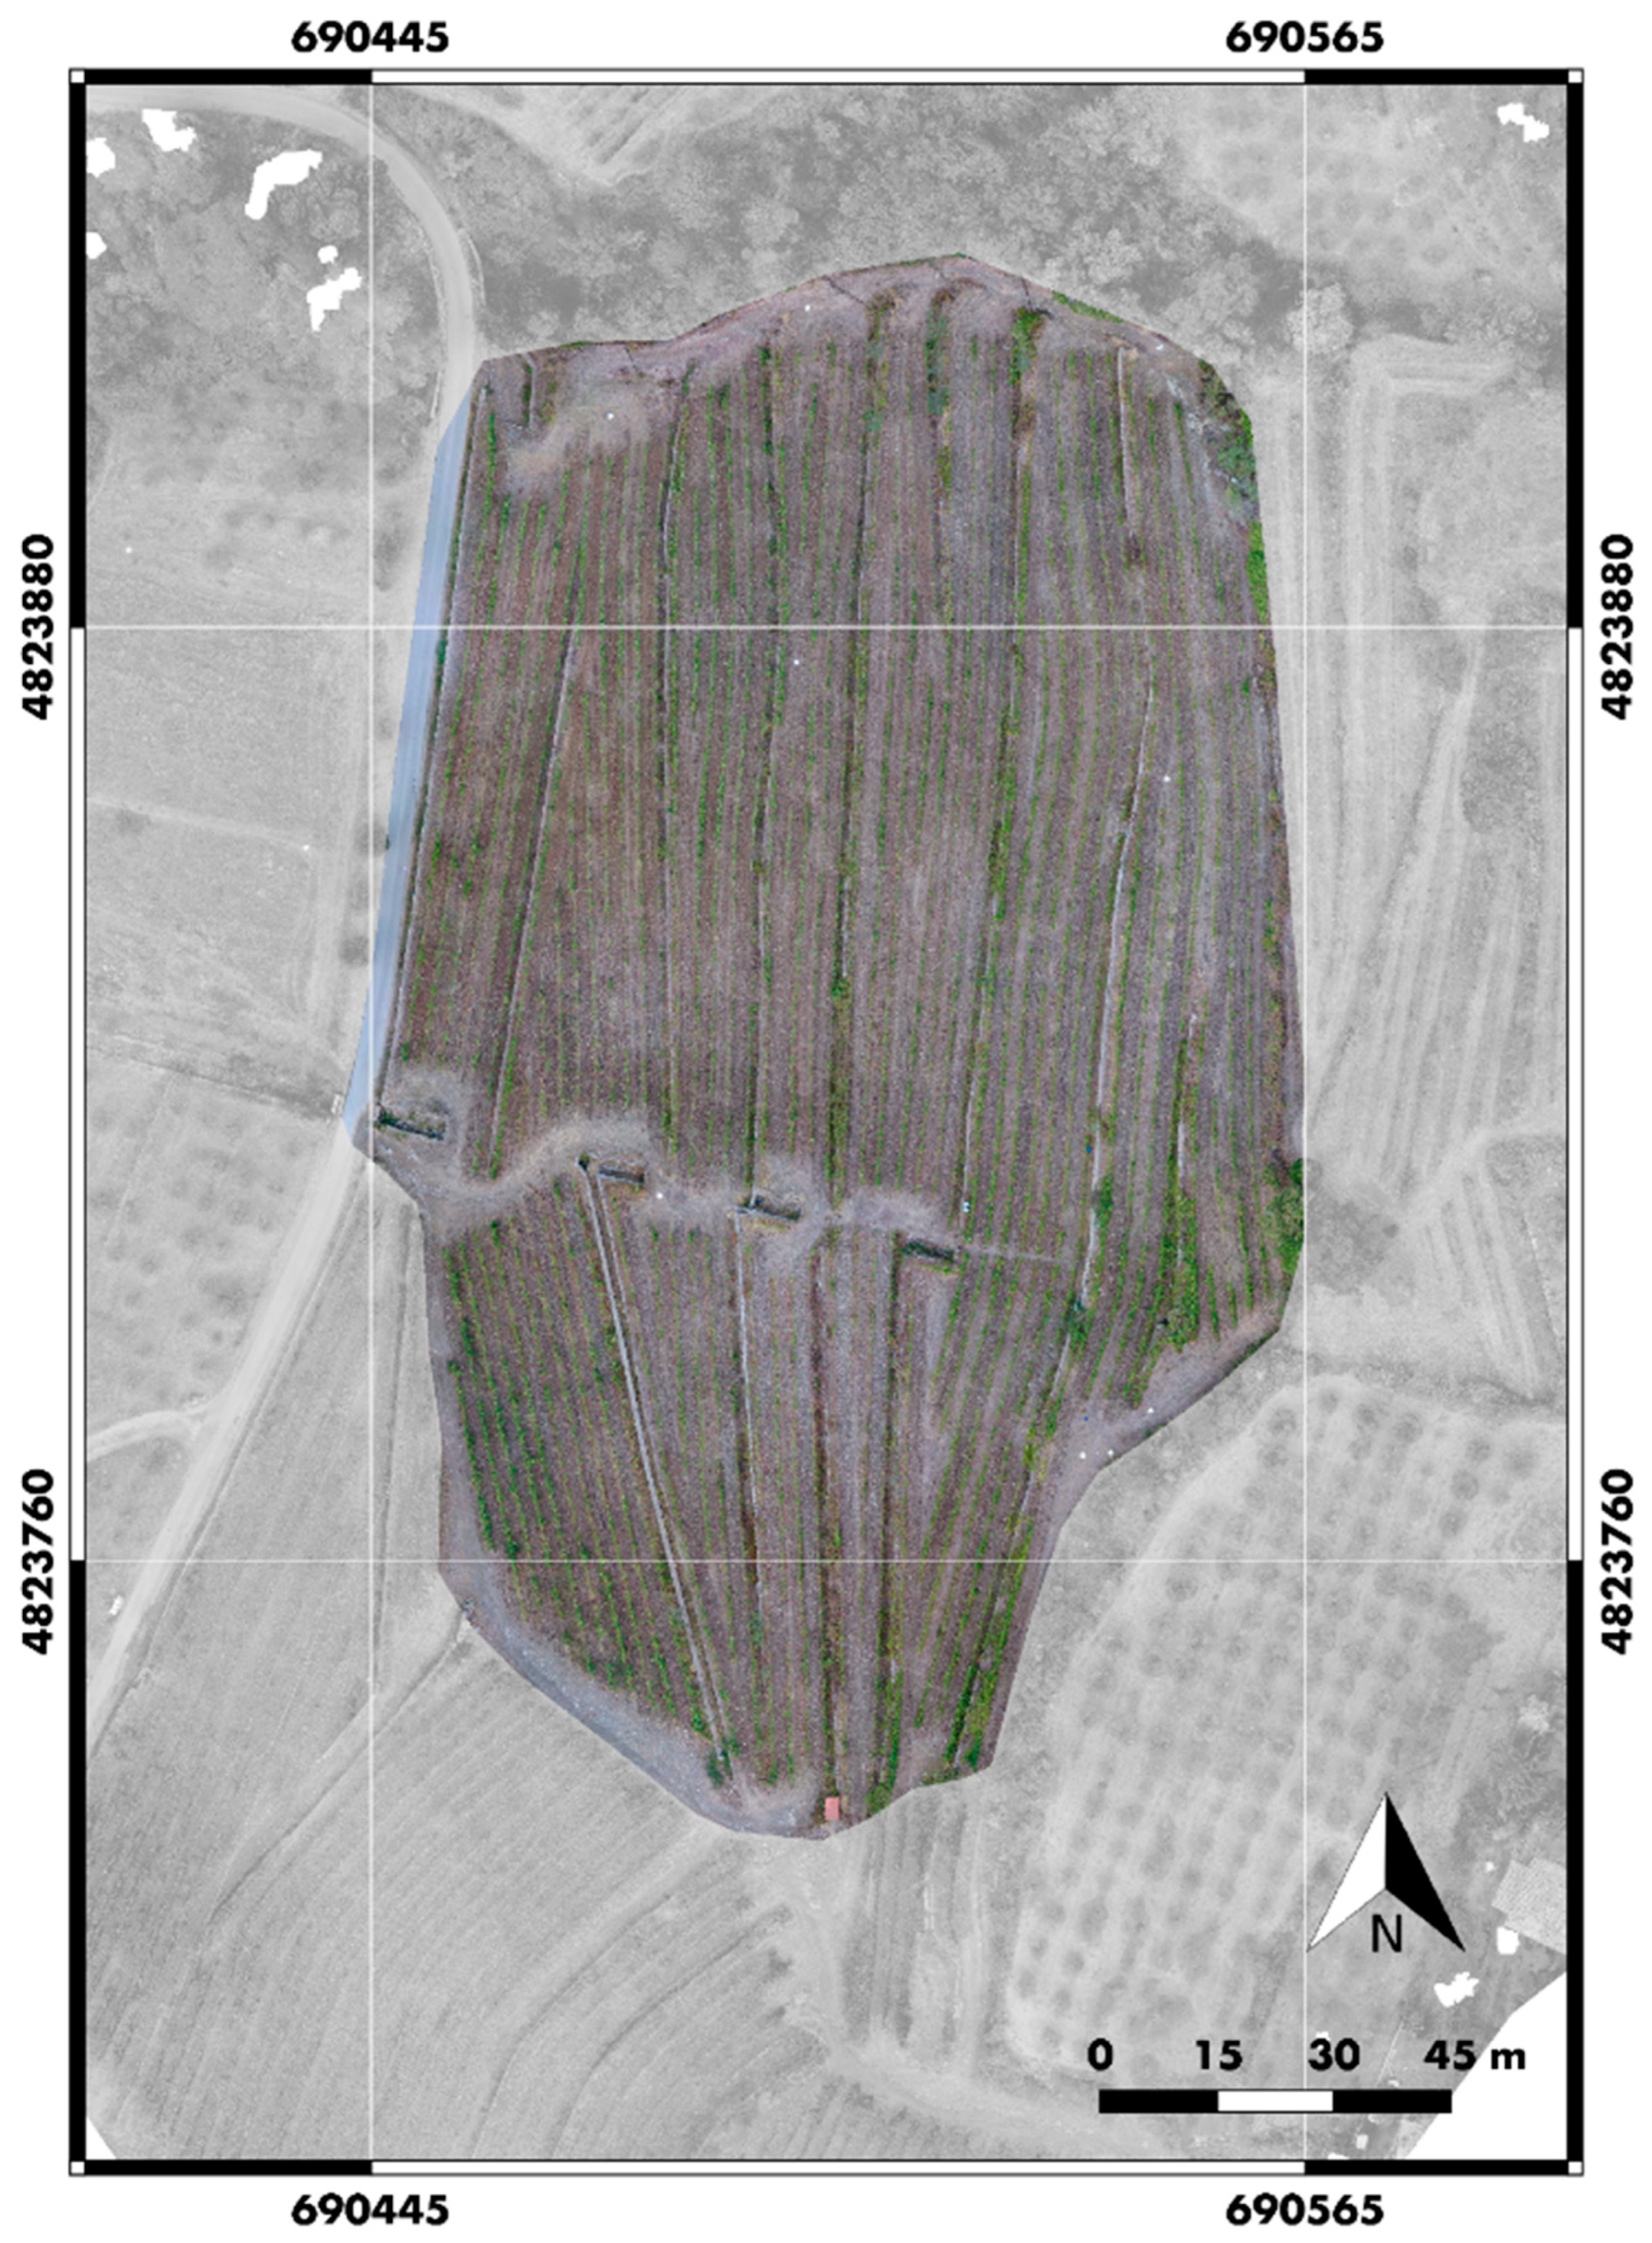
3.1. VIS Data Capture and Processing

A single flight was performed with a DJI Phantom 4 Pro over the entire area of the Grospoli vineyard, for the photogrammetric data capture in the VIS range. The used UAV platform is a multirotor quadcopter, which can be remotely controlled and programmed for automatic navigation, provided by Global Positioning System (GPS) waypoints. The aircraft is characterized by limited weight of about 1400 g (battery, propellers and sensor included) and size (350 mm diagonal size), with max flight time of approximately 30 minutes and max speed of 72 km/h. The system supports two operating frequencies, at 2.4 GHz and 5.8 GHz and the maximum transmission range is of 3.5 km (according to CE standard). The platform is also equipped with a sensor system, with dual rear front optical sensors and side infrared sensors, which allow a total of 5 directions obstacle sensing and 4 direction obstacle avoidance. Dual Inertial Measurement Units (IMU) and compasses design provides redundancy in case of errors. Other technical characteristics are reported in Table 1.
The DJI Phantom 4 Pro is equipped with DJI FC6310 integrated digital RGB camera, stabilized with a 3-axis (pitch, roll, yaw) gimbal. The onboard camera uses a 1-inch CMOS 20 MP sensor, which can take images of 5272 × 3648 pixels as maximum resolution. The fixed focal length is 8.8 mm (35 mm format equivalent of 24 mm) with 84° FOV and f/2.8-f/11. The mechanical shutter, with 1/2000 s max speed, as well as the lens arrangement allows to obtain good image quality in terms of both sharpness and vividness. Table 2 lists the relevant technical properties of the RGB sensor (left column).
The flight plan was realized with UgCS software (SPH Engineering UgCS), by setting the suitable parameters in order to have a GSD of approximately 2 cm. The flight was designed according to a classic photogrammetric criterion, with a flight pattern consisting of 9 swipes, with forward overlapping of 80% and sidelap of 70%. The images were acquired with nadiral camera at a constant speed of 5 m/s and altitude of 70 m Above Ground Level (AGL). More details of the flight plan are reported in Table 3 (left column).
The georeferencing of the photogrammetric survey was made by using 10 Ground Control Points (GCP), which guarantee also the metric accuracy of the survey. The GCPs were materialized as targets functional for both visible and thermal survey: 60 × 60 cm2 panels covered with aluminium foil and marked with black sprayed triangles. These targets were homogeneously distributed around the surveyed vineyard, to cover all the interested surface. The positioning and measuring activities for each target, were carried out by the Geodetic Direction of the IGMI, with the Global Navigation Satellite System (GNSS) TOPCON GR3. Two multi-frequency receivers were used for the coordinates acquisition, one as Master (base receiver) and the other as Rover receiver, working in Real Time Kinematic (RTK) radio mode. The coordinate system used in all data processing is ETRS89/UTM32N (EPSG:25832). The GCPs accuracy is about 1 cm.
The 206 images acquired for the VIS flight were processed with the photogrammetric software Agisoft Photoscan (version 1.2.6 build 2834). After image alignment, thanks to common Structure from Motion (SfM) procedures, GCPs were collimated and associated to their GNSS coordinates, for georeferencing and scale the photogrammetric model. A set of 7 of the 10 total collimated targets were used as GCPs, while 3 of them were used as Check Points (CP). Multi-View Stereo (MVS) algorithms were then used to obtain the dense cloud, from where the DEM of the surveyed area was generated. Finally, an orthophoto was projected as texture on the 3D model.

3.2. TIR Data Capture and Processing

The flight campaign for the thermal data capture was carried out on the same day with two distinct flights, at 08.50 CET and at 15:00 CET, by using an hexacopter customized by MicroGeo s.r.l. as UAV.
The flight plan was realized with the open source Mission Planner software, by setting the suitable parameters in order to have a GSD of 11 cm. The flights were designed according to a classic photogrammetric criterion, with a flight pattern consisting of 12 swipes, with forward overlapping of 80% and sidelap of 63%. The radiometric video sequences were acquired with nadiral orientation at a constant speed of 3 m/s and altitude of 40 m AGL. More details of the flight plan are reported in Table 3 (right column).
The UAV platform mounted the thermal camera OPTRIS PI450, with maximum optical resolution of 382 × 288 pixels at 80 Hz frame rate. The fixed focal length is 8 mm, with an angular FOV of 62° × 49°. The focal plane array (FPA) image sensor is made of uncooled microbolometers (25 × 25 μm each), with a spectral TIR response in the range 7.5–13 μm and accuracy of ±2 °C. Table 2 (right column) shows a summary of thermal camera specifications. The camera can be connected to a computer via a USB 2.0 protocol to download the acquired data in radiometric video sequences format (.RAVI). Single frames had consequently to be extracted from the video to be suitable for a classical photogrammetric project.
The same targets used for RGB photogrammetry were used for georeferencing the two thermal orthomosaics: since aluminium foil has a very low emissivity (0.09 ε) it can be easily seen in the TIR range. Some other panels were painted in black and white, onto the aluminium foil, and distributed all around the test field, as delimited test areas for pre-flight calibration. In fact, before the TIR flights, a calibration with the thermal sensor was made by detecting the thermal response over the GCP targets and the b/w panels and by comparing them with temperature measurements taken with contact thermometers.
The final values of ambient temperature and emissivity were kept as default, Tamb 23 °C and ε = 1 (vegetation usually has high values of emissivity, around 0.98 [34]) during the data processing step. For this reason, all the resulting thermal values must be considered only as qualitative information, because for absolute values a previous radiometric calibration would have been made.
The output of the thermal survey were, as mentioned, .RAVI radiometric videos, managed with the camera related software Optris PI Connect. The procedure for the frame extraction, in order to obtain pictures combined with the thermal information to use in the photogrammetric project, consisted of the following steps:
  • automatic extraction of single frames from the thermal video, by setting the proper time of acquisition to maintain a suitable overlapping (Auto Key Presser was used as software). The result is a series of .csv datasheet files for each screenshot;
  • conversion of the .csv files into 16-bit TIF images, through a point-to-point conversion (software ThermoVision_JoeC v. 1.0.6.0), to obtain three kinds of files: i) temperature 16-bit raster images (thermograms) with black and white values scaled according to the min/max temperature values of the overall set of images, ii) pictures with color palette set according to their own min/max temperature values, iii) an overview .txt file which reports the overall temperature range;
  • evaluation of thermal outliers for each frame: a temperature range too large results in an insufficient contrast for the identification of homologous points by the photogrammetric software. In this case, the frames containing people were removed, because body temperature (~36 °C) increased the temperature maximum overall value. On the contrary, the aluminium targets, which reflect sky temperature, gave outliers of about −30 °C. In fact, the solar rays enter the thermal camera as reflected instead of emitted radiation, thus compromising the measures. For this reason, a default threshold of 0 °C was assigned, with an automatic script made with MathWorks MATLAB, to all values < 0 °C;
  • after this normalization, the extracted thermograms were finally processed with the photogrammetric software Agisoft Photoscan (version 1.2.6 build 2834). The photogrammetric workflow, to obtain the DEM and the final thermal orthomosaics, is the same as reported in Section 3.1 for VIS processing, with the difference of having grey-scaled thermograms instead of RGB pictures;
  • finally, a linear transformation was applied to the thermal orthomosaics, with a GIS software (ESRI ArcGIS) to re-calibrate the 16-bit raster values as a function of the min/max values of temperatures, by considering the overall data set.
This procedure of data processing has been developed and tested at the Polytechnic University of Milan, by Sona, as reported in Reference [44].

3.3. GIS Processing

The obtained thermal orthomosaics, were then processed in GIS software (open source QGIS). Every single vineyard row included in the test area has been acquired as vector feature, by manual photointerpretation of the RGB orthophoto, in order to classify only the vegetation component. Each row has been identified considering the position on the right and on the left in respect to the dry-stone wall of that terraced bench. Then a statistical zonal analysis was performed on each row, resulting from the overlay with the two thermal orthomosaic raster, to classify each row by their own thermal characteristics.

3.4. Statistical Analysis

Vineyard row thermal behaviour was finally analysed starting from the differences in average temperatures between the ones in external and the ones in internal position. For each bench terrace, we considered as external row the one at the edge of the terrace, and as internal the ones closest to the dry-stone wall supporting the overlying bench, as shown in Figure 3. All the rows placed in between the external and internal rows of each bench are identified as intermediate. For both the morning and the afternoon flights, the mean and the standard deviation of the temperatures of the internal rows and the one of external rows were computed, and the difference of the means was then calculated and analysed. In both cases, the level of significance of the differences in mean temperatures of the two samples (internal rows and external rows) was tested with Student’s t-test for the comparison of two means.

4. Results

4.1. Results of VIS Image Analysis

The processing of the 206 pictures from the VIS flight resulted in a 2 mm GSD orthophoto with a pixel size of 2.41 × 2.41 μm2 (see Figure 4). The first features-matching procedure implemented in the SfM algorithm, produced a point cloud consisting of 1,308,933 features in a local coordinate system over an area of 114,000 m2. By inserting the GCPs’ coordinates, a bundle adjustment was performed to register the model in the UTM reference system, as reported in Section 3.1. The statistical values of the external orientation are listed in Table 4, reported as total RMSE values of GCPs and CPs. After the matching process which generated a sparse cloud, a denser cloud of 110,536,245 points was generated. Successively, a DEM surface model was created with a resolution of 4 cm/pix and point density of 772 points/m².

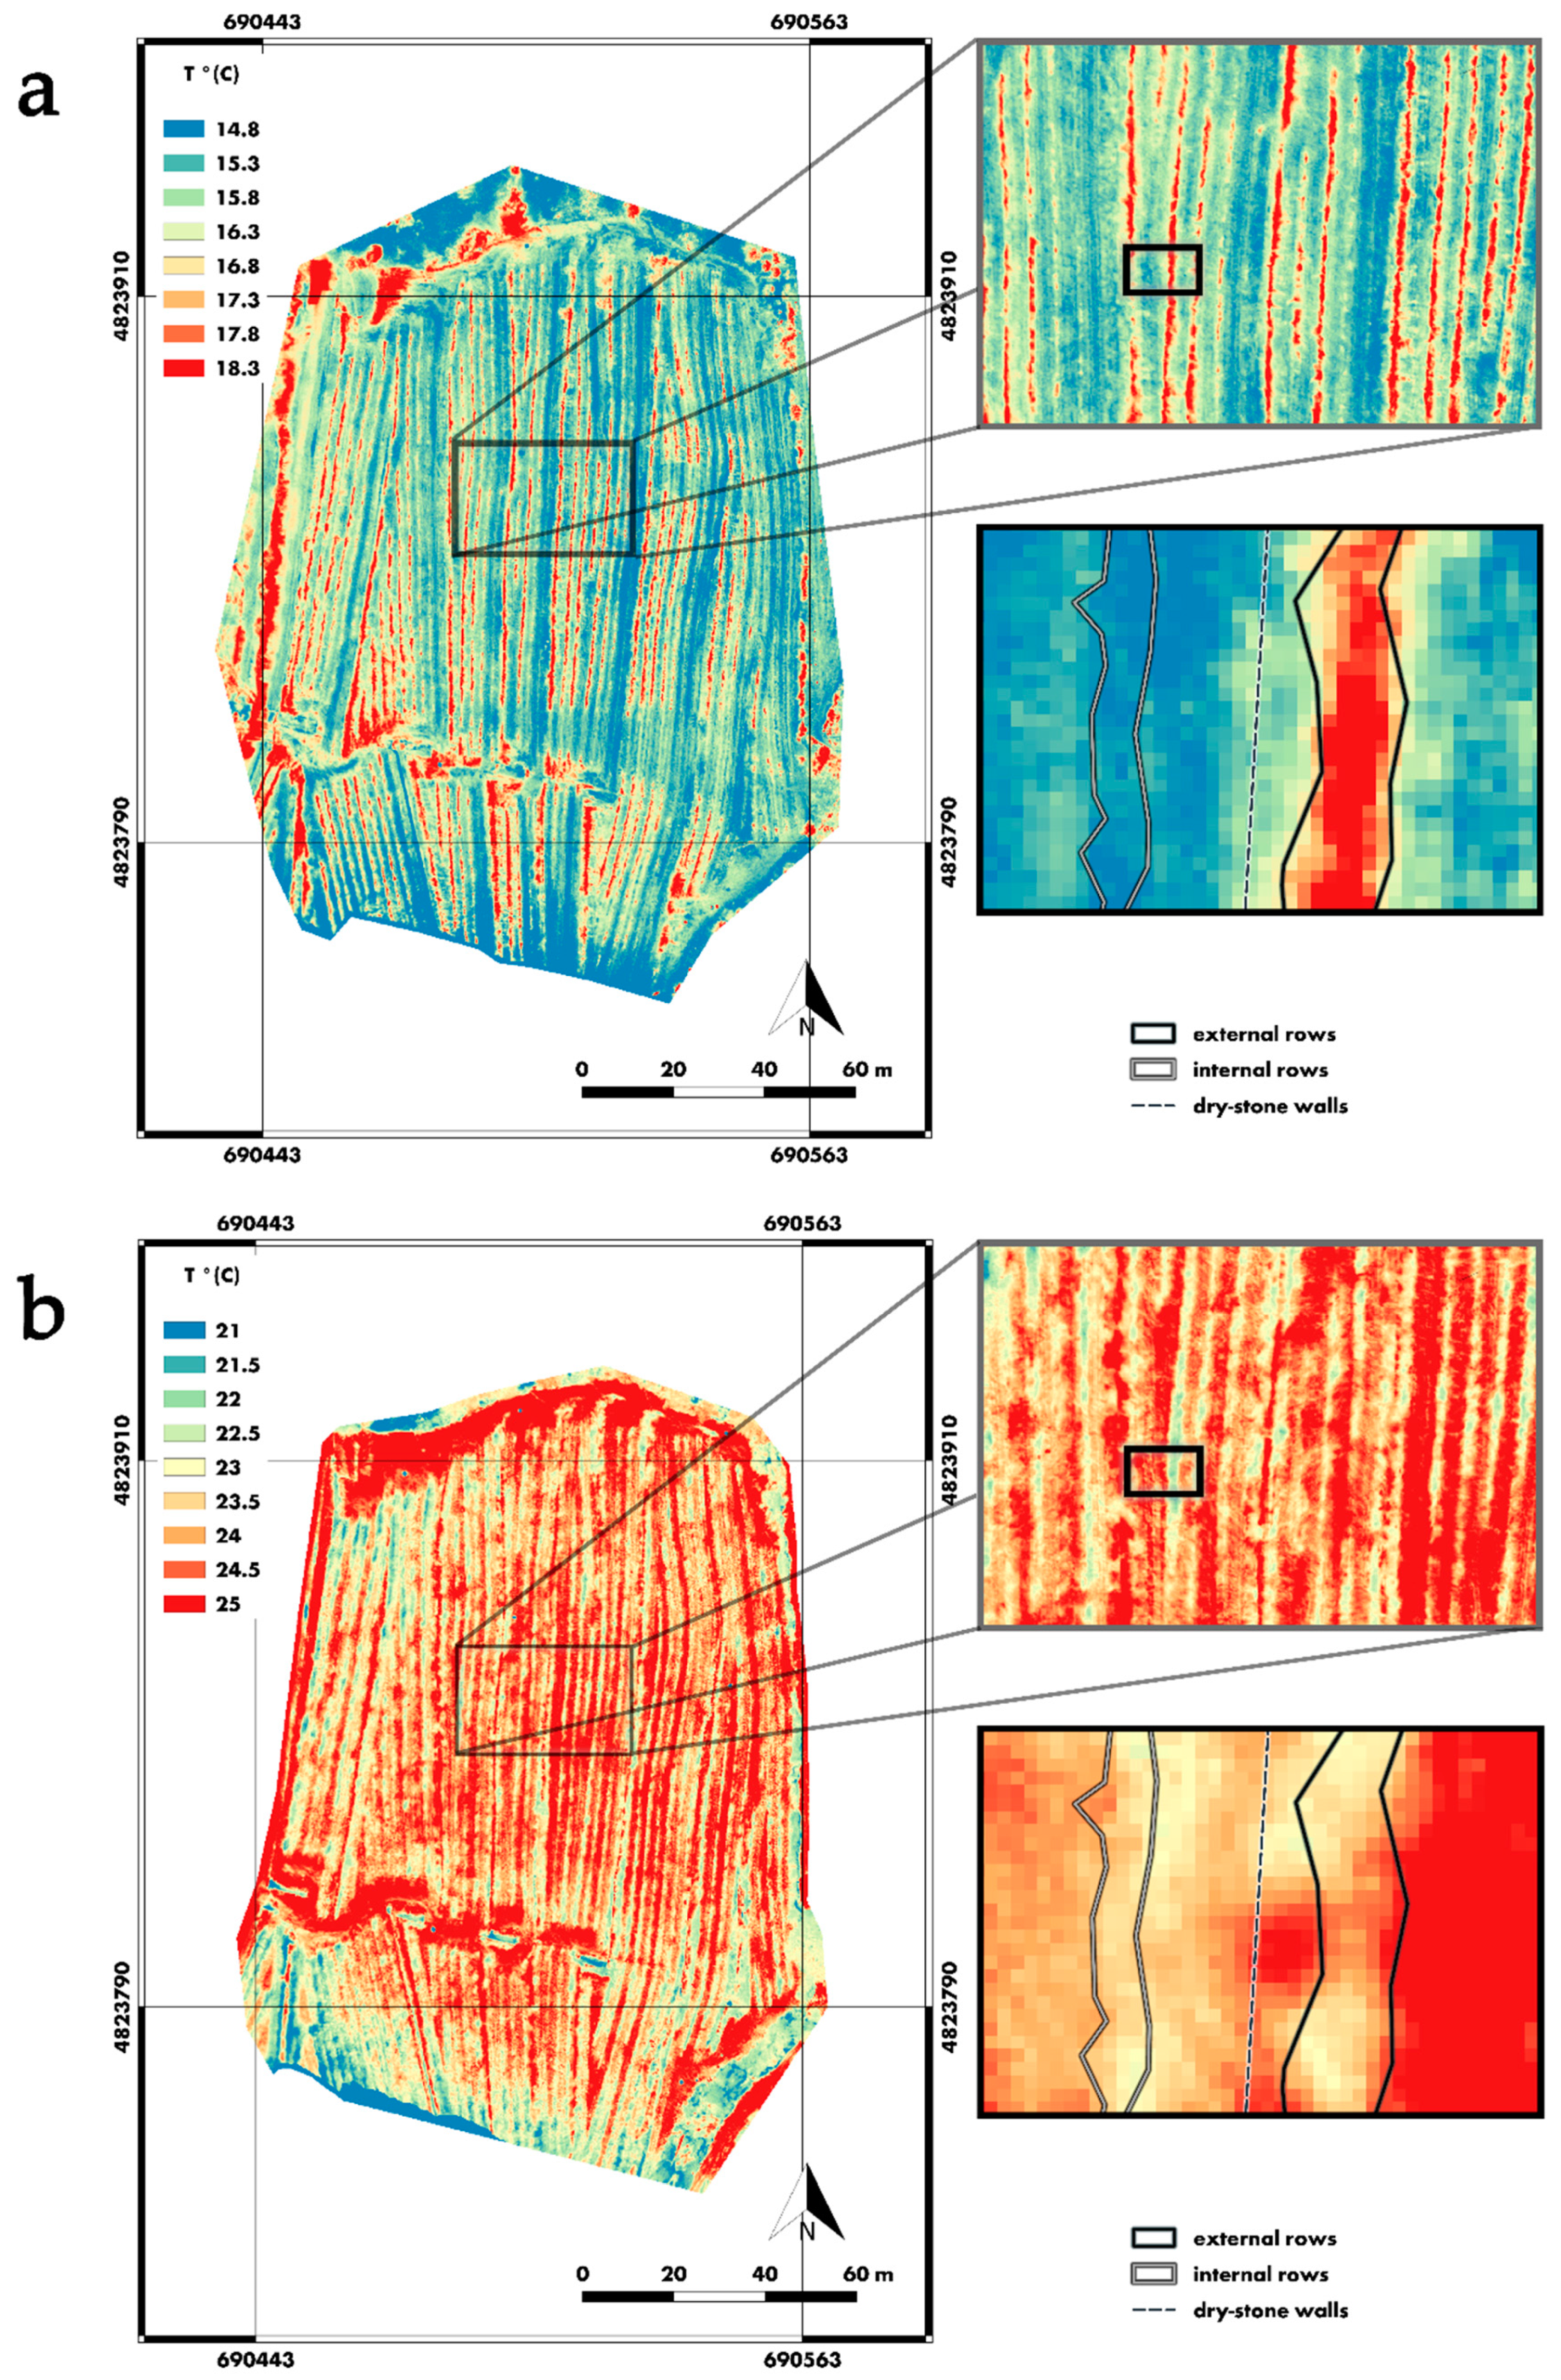
4.2. Results of TIR Image Analysis

The different spectral range and the lower spatial resolution of the TIR sensor compared to the VIS one resulted in orthomosaics with ground resolution of 12 cm/pix both. In fact, the lack of information in the grey-scaled thermograms for the feature-matching procedure of the software gave a lower number of tie points as a result, compared to the VIS orthophoto, respectively of 76,287 for the morning orthomosaic and of 105,949 for the afternoon one.
The same GCPs used to scale and georeferencing the VIS 3D model, gave different values of RMSE for the TIR projects, as reported in Table 4. The higher error values associated to the TIR CPs could be attributed to the difficulties in exactly picking the centre of the targets, mainly because of the low image quality, thus resulting in wrong identifications. In fact, the calculated Instantaneous Field Of View (IFOV) is of 91 mm, by considering the lens characteristics (FOV) of the thermal camera and the distance from the ground, thus giving a spatial resolution of about 1 cm, i.e., the minimum detail that can be seen on the thermal map.
The two generated dense clouds had similar sizes, of 964,066 points for the morning and 880,995 points for the afternoon. The DEM surface model was finally created with a resolution of 23 cm/pix and 18 points/m2 for both.
Figure 5 reports the two orthomosaics scaled differently, in function of their maximum and minimum temperature, to enhance visualization. In particular the morning orthomosaic shows a temperature range of 14.8–18.3 °C while in the afternoon the T range is between 21 °C and 25 °C.
From a visible comparison, it appears that the external rows are warmer compared to the internal ones in the morning, while the same have similar temperature in the afternoon. The subtraction of the morning orthomosaic from the afternoon thermal map is shown in Figure 6, where the different temperature range of internal rows in the morning compared to the afternoon is clearly visible.

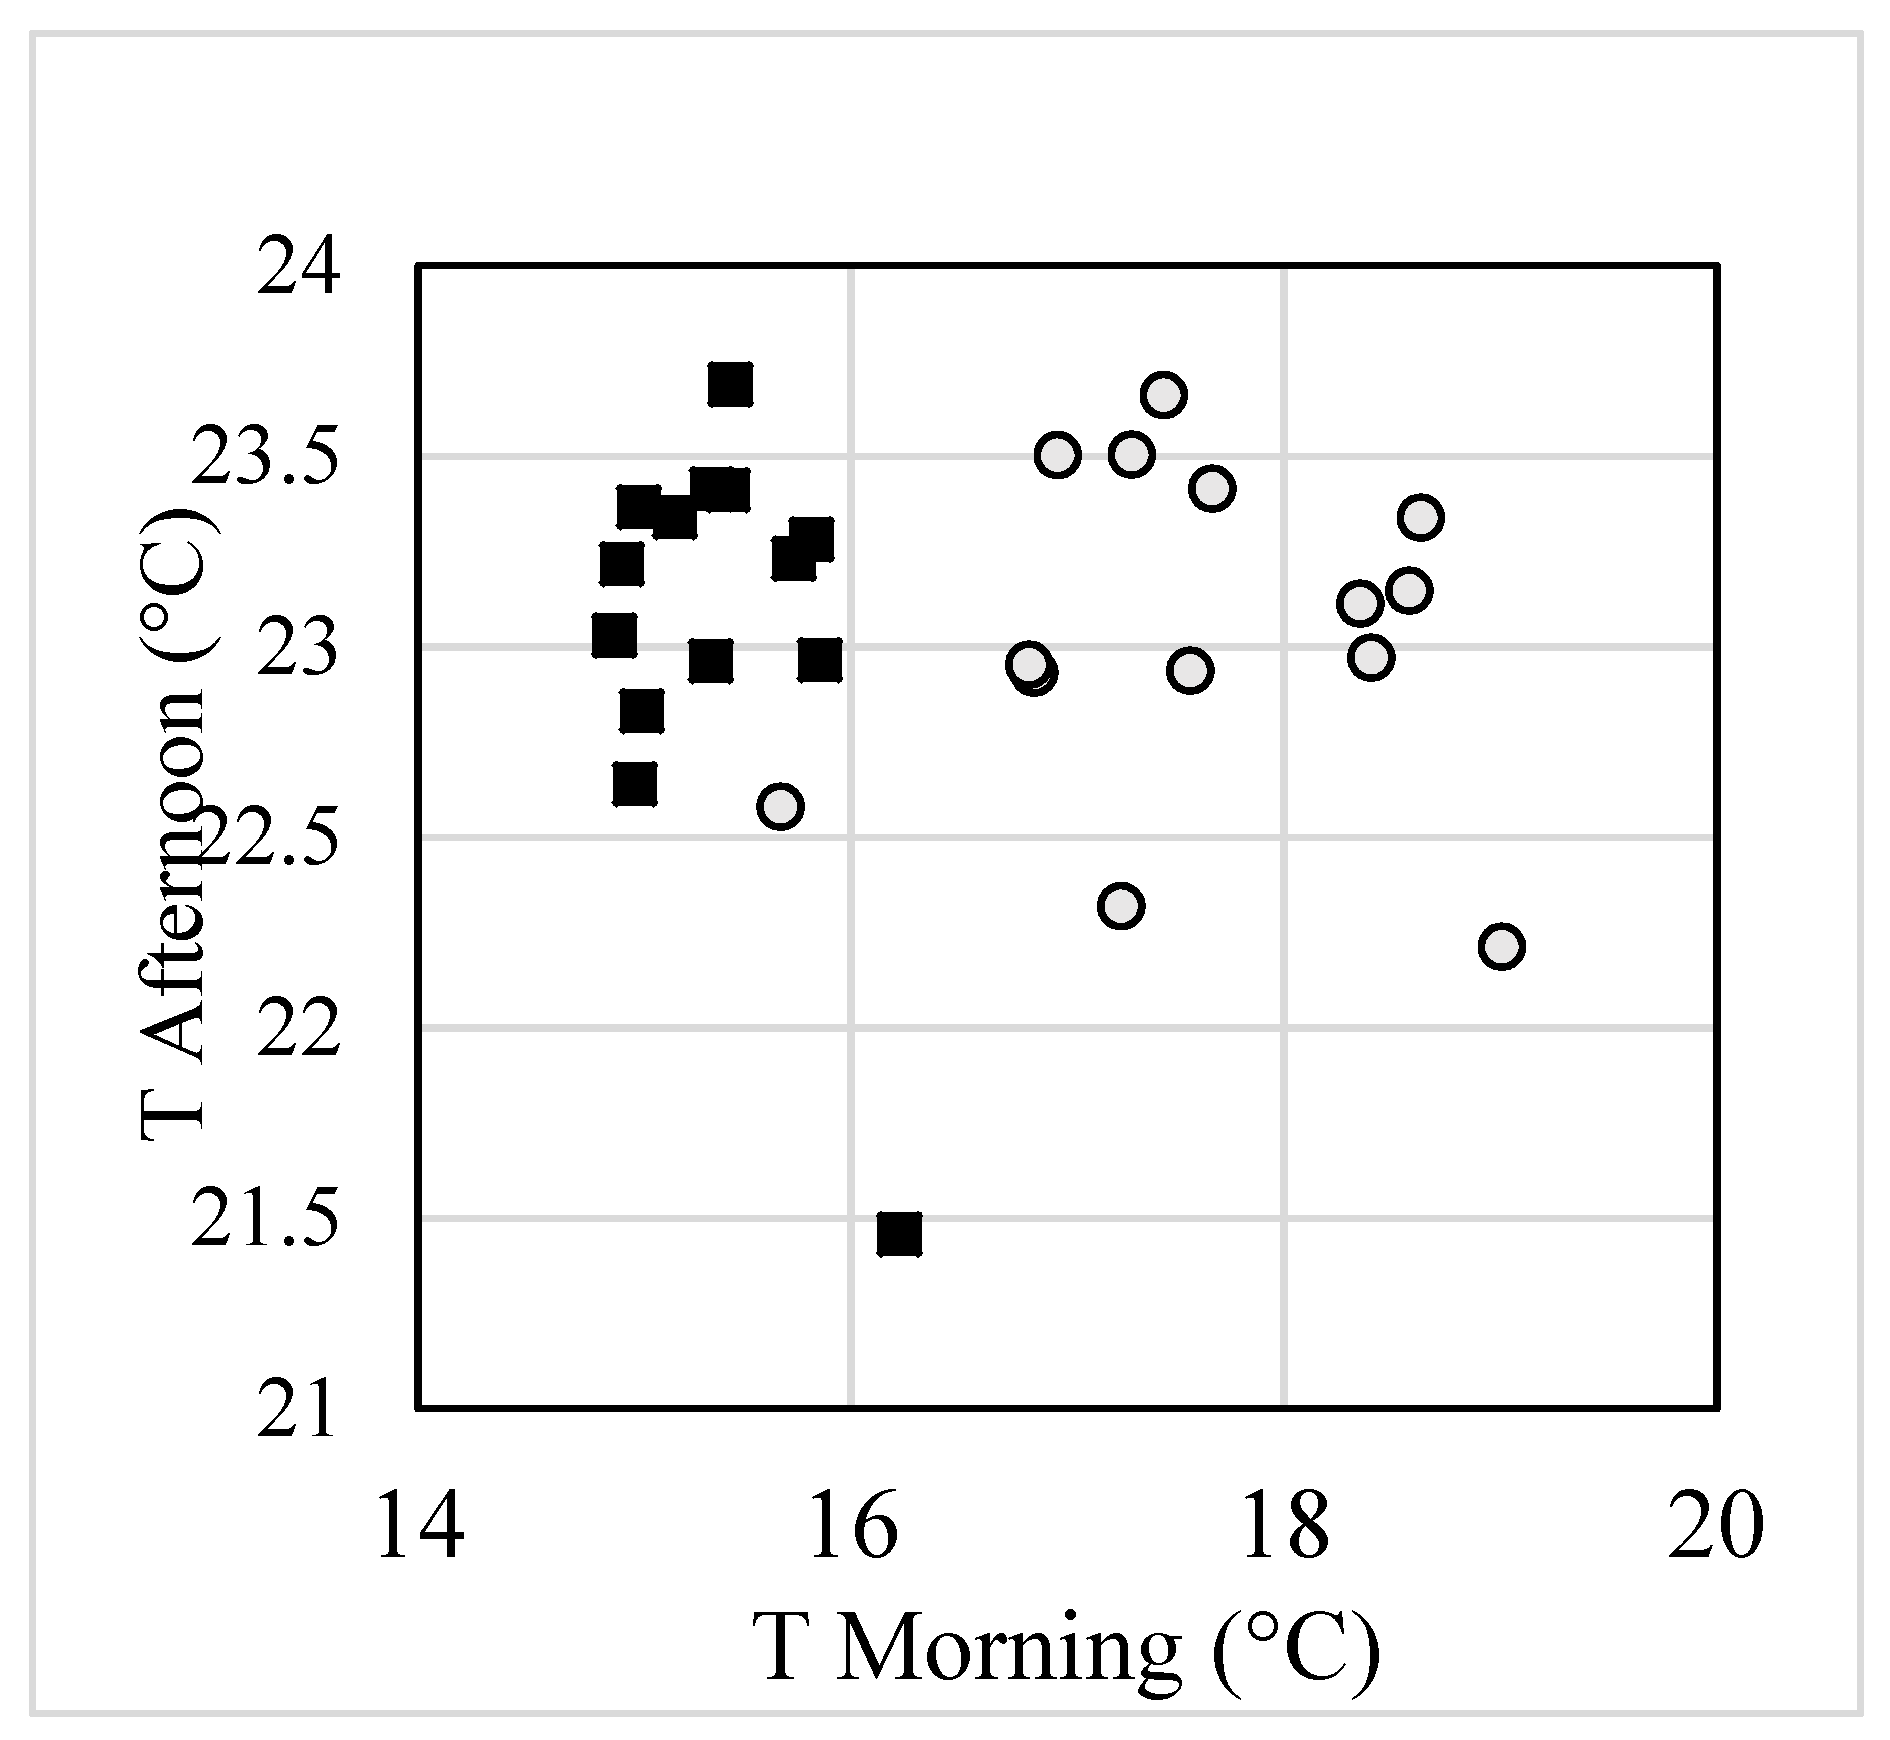
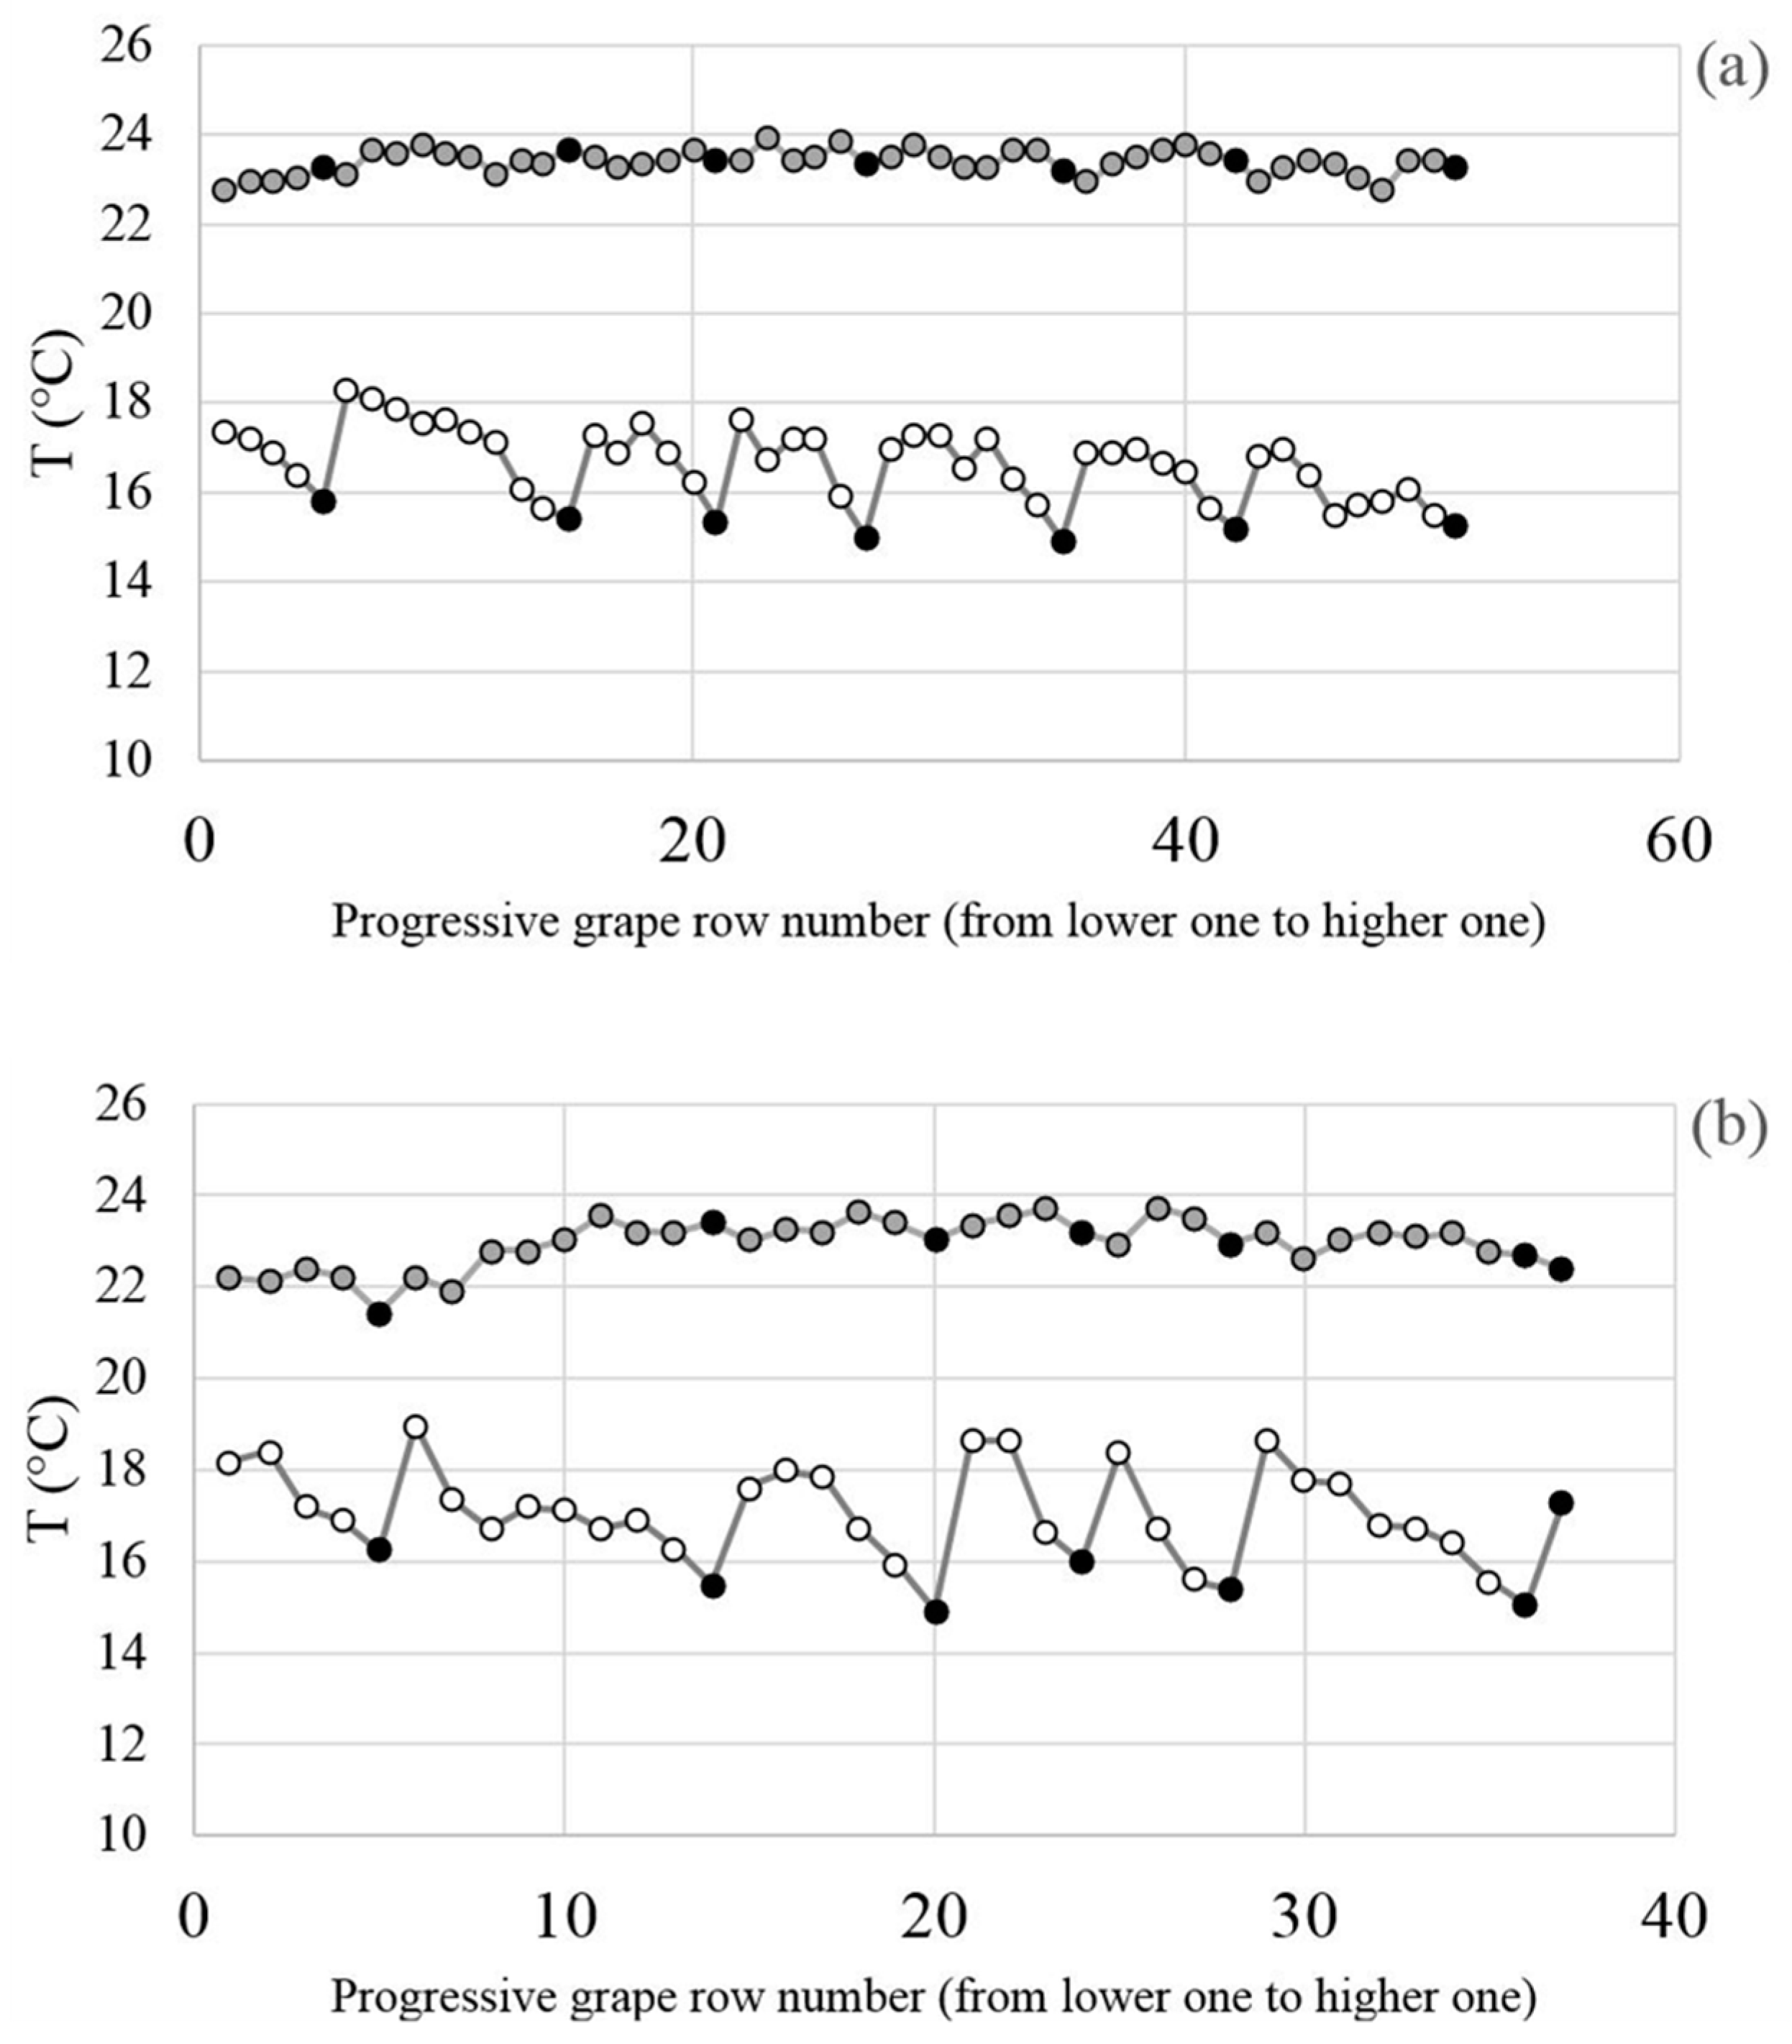
4.3. Results of Thermal Behaviour Analysis

The analysis of morning and afternoon temperatures showed how, on average, internal rows were colder then external ones of more than 2 °C, with a statistical significance of >99%, while temperatures recorded at 15:00 CET were almost equal for the two groups, around 23 °C (Table 5). Furthermore, the scatter plot of the morning and afternoon temperatures (Figure 7) showed how, in the morning, the whole population of internal rows exhibited temperatures lower than the external ones. On the other hand, afternoon temperatures were at the same level. The two populations appeared then as clearly separated.
To further investigate spatial and temporal temperatures patterns in the terraced hillslope, a full analysis of all rows of Grospoli vineyard was developed, considering also the values of temperatures of intermediate rows (Figure 8). The analysis showed how, for both the North and the South areas (see Figure 2), temperatures progressively decreased from the external edge to the internal position in the morning, while they grew up to the same value after 5 hours of insulation.

5. Discussion

Agricultural terraces are a fundamental feature of Mediterranean landscapes, which are threatened (among other causes) by the risk of abandonment and consequent degradation due to the progressive depopulation of marginal areas and the industrialization of agriculture [2]. In some cases, these ancient structures allowed the settlement and the survival of entire peoples, which through the practice of terracing have allowed cultivation of the steepest slopes and, thanks to the enhanced slope stability, the building of villages at the valley bottoms, containing the risk of landslides. In these situations, the abandonment of such anthropic structures can even imply the increase of hazards related to geo-hydrological processes that could be triggered by extreme rainfall events. In this context, a dramatic example is represented by the tremendous event occurred in the Cinque Terre area in 2011 [45,46]. However, the aspect of civil protection is limited to the few specific cases where settlements lie under terraced slopes. Beyond this, agricultural terraces represent a cultural heritage which should be maintained as part of a culture strongly connected to every territory where it is, or it was, present [47]. In this perspective, an economical sustainability of agriculture on terraced land should be encouraged and helped to keep on going despite the higher costs that it involves. For this reason, understanding and quantifying all the benefits produced by a terraced landscape becomes of paramount importance to address effective policies for its conservation.
In this context, the availability of a cost-affordable and efficient methodology for monitoring of terraces evolutions, in terms of both spatial morphology (RGB) or thermal behaviour induced by the presence of dry-stone walls (TIR), can be a useful tool for risk prevention and managing purposes.
Our preliminary tests carried out by TIR surveys showed some influence on the temperature distribution across the vineyard due to the presence of terraces.
The thermal behaviour of the rows can be well explained by considering the sun position in respect to the vineyard. Since the slope of the terraced vineyard is aligned to the E-W position, at the sunset the internal rows are shaded by the presence of overlying dry-stone walls. From 08:50 CET to 15:00 CET, the sun moves along its trajectory, irradiating progressively the intermediate rows, in the middle of each bench, and then the internal ones. At 15:00 CET, the sun’s position allowed the irradiation of all the rows, as reported in Figure 9.
Therefore, thermal differences appeared to be mainly influenced by the shading effect of the terrace risers, but we do not exclude the possibility that the walls themselves could have other effects related to the thermal behavior of stones.
A small fluctuation between the average temperature of internal and external rows can still be observed in the afternoon thermal data (see Figure 8). This variation might be explained by considering the high thermal inertia associated to stone wall. In fact, the medium value of specific heat for stone, is around 840 J/kg·°C (at 25 °C and atmospheric pressure) [48], thus making it a very common material in historical buildings of the Mediterranean area, typically characterized by thick and massive walls [49]. In that context the main function was related to prevent summer overheating by keeping low and comfortable indoor temperature. The poor heat conductivity of rocks, which exact value depends on stone porosity, mineral composition and specific heat conductivity, usually entails low heat transfer from the irradiated surface to the inner part of the rock [48]. These properties can be applied also on the dry-stone walls of the vineyard, which will warm up slowly during the day and they will passively release heat during the night, thus influencing also the facing internal rows temperature and microclimate.
Barbera et al. [38] analysed a wide range of environmental parameters to investigate the role of particular dry-stone wall structures in modifying the microclimate for crops. Among other interesting findings, they showed how the different thermal inertia of stones result in temperature differences (stones are colder in the morning and warmer in the evening, also showing very high temperatures when heated by the sun) which might influence the local microclimate. Working in a totally different context, Argyle and Stevens [50] investigated the distribution and growth patterns of a spontaneous shrub, the netleaf hackberry, growing around boulders in the cold desert biome of Wasatch Mountains (Utah). Unexpectedly, they found that hackberries associated with boulders were more likely to grow near the south side, suggesting that big stones may influence patterns of growth providing thermal radiation that melts snow thus providing a higher water availability for seedlings. Despite the fact that their research is far from the case of terraced vineyards, we hypothesize that the thermal inertia of dry-stone walls can have an influence, at least at the microclimatic scale, on temperature patterns of the crop and thus on its growth, phenology, ripening, and consequently on quality. However, neither works available in literature nor our findings have not yet shown it clearly. We believe that repeated measurements taken in different days at equal or comparable solar insulation conditions would provide a reliable time series to confirm these patterns of temperatures.
Nevertheless, the UAV-mounted TIR sensor, coupled with a RGB camera, proved to be a suitable monitoring method to reveal thermal variations induced by both natural sources (sun) as by anthropic artifacts (dry-stone walls). The main advantages of this approach consist in: (i) contained operative costs (ii) higher spatial resolution compared to traditional remote sensing platforms for TIR sensors (aircrafts and satellites); (iii) higher spatial covering in respect to ground-based TIR surveys; (iv) possibility of georeferencing spatial (RGB) and radiometric (TIR) information in a GIS software to maximize the data available for managing and prevention purposes; (v) reduced time required for data acquisition, thus allowing to repeat the survey multiple times during the day/month/year for monitoring of daily/seasonal variations; (vi) sufficient radiometric accuracy to discriminate qualitative daily thermal variations.
Some limitations, however, need to be pointed out. As Conte et al. reported in their work [51], having both high spatial and radiometric resolution in aerial thermal imagery is currently not possible. Despite the above-mentioned advantages in using UAVs as platforms and the progressively miniaturizing process of multi-spectral sensors, the two resolutions are not comparable yet, even if an exponential technological growth is happening.
Another aspect to consider, is related to calibration. A radiometric calibration should be carried out in order to obtain absolute values of temperature. In this work, a relative thermal information was enough to obtain some preliminary information and to test the adopted methodology. For this reason, statistical analysis on exact temperature values (reported in Section 4.3) has to be considered as a relative information about the different thermal behaviour between morning and afternoon. Furthermore, the temperature resolution of the TIR camera does not allow us to make quantitative considerations. A proper radiometric calibration with a black body in laboratory, as well as setting adequately other factors as ambient temperature, emissivity, and spot size, might reduce the possible margin of error for more accurate temperature evaluations.
A geometric calibration, instead, concerns the metric accuracy of the orthomosaics, which is fundamental when RGB and TIR data are overlapping in GIS. In fact, TIR orthomosaics geometric resolution is significantly lower than the RGB, where accuracies of 0.1–0.2 pix can be achieved. The main source of error is due to the radial distortion of the TIR sensor, deriving from refraction variations and other factors, as reported by Luhmann [52]. For this reason, a pre-flight calibration for the thermal camera is suggested, with special targets to enhance contrast in thermal images. In fact, the reduced contrast and the blurring effects on objects edges make very difficult a precise collimation of a point in thermal frames. The authors suggest using algorithms for radiometric image enhancement and increasing the number of overlapping images (i.e., redundancy) to ease the photogrammetric workflow (SfM algorithm). Furthermore, proper accuracy evaluations should be made by considering fixed calibration certificates, obtained in laboratory, and the analysis of computed ones, in addition the sole evaluation of check point residuals.
Further analysis should be considered for evaluating the potential thermal inertia effect of dry-stone walls on the surrounding vegetation, as shown by Barbera et al. [38]. Depending on its strength, this additional effect may have the potential of influencing local microclimate, as well as the characteristics of cultivations grown on bench terraces, such as grapevine. Considering the results of the present experiment, the use of TIR remote sensing based on UAV appears to be a reliable technological solution to assess this additional effect, for instance by mapping temperatures during or after the sunset. Further tests should be also performed to improve the photogrammetric process, as reported by Arandjelović et al. [53] for the registration of time-separated aerial images, to improve the overall geometric accuracy of the produced outputs (orthomosaics). Moreover, applications of TIR remote sensing that can be useful for analysis and monitoring of terraced landscape are not limited to thermal analysis. In fact, as shown by Glaser et al. [54], TIR analysis can highlight surface and subsurface water saturation dynamics. This application can provide additional insights to the studies carried out on the generation of preferential drainage patterns in terraced hillslopes, fundamental to understanding terraces degradation dynamics, that so far were based only on geo-morphological analyses and modelling [42,43,55].
Another future extension of this contribution might be the integration of different sensors on the same UAV platform, operating in different ranges of the electromagnetic spectrum, such as multi- or iper-spectral sensors [33,56,57]. In this way, additional information coming from selected or wider band of the spectral range would complete and extend the data collected, with biophysical vegetation indexes useful also for precision agriculture purposes.

6. Conclusions

The present work describes an early application of the use of combined multi-sensor surveys, in the VIS and TIR range mounted of UAV platforms, to detect thermal dynamics of dry-stone terraced areas, which represent one of the most iconic features of agricultural landscapes in Italy and Europe. The use of UAVs platforms for remote sensing presents advantages in terms of operative cost, high planning flexibility and higher spatial resolution if compared to common remote-sensing platforms (such as aircrafts and satellites) [8]. The methodology tested in this work, with an application in the historic Chianti area of Tuscany, proved to be an efficient tool for monitoring and managing these traditional rural landscapes. In particular, the UAV-mounted TIR sensor, coupled with an RGB camera approach allowed us to:
  • obtain sufficient radiometric accuracy to reveal daily thermal variations induced by both natural sources (sun) as by anthropic artifacts (dry-stone walls)
  • contain the operative costs and have higher spatial resolution compared to traditional remote sensing platforms for TIR sensors (aircrafts and satellites)
  • cover a wider area in respect to ground-based TIR surveys
  • georeferencing spatial (RGB) and radiometric (TIR) information in a GIS software
  • repeat the survey multiple times during the day, thanks to reduced time needed for data acquisition
The preliminary results proposed in this contribution highlight a different thermal behavior of rows in the morning, when the internal rows show lower temperature than the external rows, due to solar position and shading effect. After some hours of direct irradiation, in the afternoon, temperature of both internal and external rows increased, reaching almost the same values.
These outcomes, as well as the rapid evolution in sensors and UAV technologies, encourage further tests with the above-mentioned methodology to detect microclimatic effects of dry-stone walls on the bench-growing vegetation. For instance, repeating thermal flights more frequently within the entire 24 hours could help to better understand temperature patterns across the entire terraced field. Other future activities might concern the integration with other sensors, operating in different bands of the electromagnetic spectrum to obtain biophysical indexes of vegetation, as well as monitoring at different time of the day/month/year.

Author Contributions

Conceptualization, F.P., G.C., G.T., and E.B.; methodology, G.S. and G.T.; software, M.C., G.S. and E.V.; validation, E.I.P., G.C. and A.E.; formal analysis, G.C., E.V., M.C.; investigation, E.I.P., G.C. and A.E.; resources, G.T. and F.P.; data curation, E.I.P., G.C. and E.V.; writing—original draft preparation, E.I.P.; writing—review and editing, E.I.P., G.C. and A.E.; visualization, E.I.P. and G.C.; supervision, G.T., G.S. and. F.P.; project administration, G.T., E.B. and. F.P.; funding acquisition, G.T. and F.P.

Funding

The work has been partially supported as part of the Italian Research Project of National Interest “GAMHer—Geomatics Data Acquisition and Management for Landscape and Built Heritage in a European Perspective” (PRIN2015 n.2015HJLS7E), of which DICEA is partner. A.E. and F.P. acknowledge the financial support provided by Programma Interreg Italia-Francia marittimo 2014-2020 (“Adapt-assistere l’adattamento ai cambiamenti climatici dei sistemi urbani dello spazio trasfrontaliero”, CUP B19J16002890007). Publication costs were covered by the University of Florence DICEA and DAGRI Departments.

Acknowledgments

For providing the access to the study area of Grospoli vineyard and for his friendliness and hospitality, we would like to thank Paolo Socci, owner of the Fattoria di Lamole farm. The authors wish to thank the MicroGeo s.r.l. company for having kindly provided the tested UAV platform coupled with the TIR sensor and their flight operator Arch. Mattia Ventimiglia. Special thanks go also to Filippo Fiaschi, DICEA flight operator for the RGB flight. We also want to thank Dr. Valentina Bonora, for planning data collection in both VIS and TIR range and to Arch. Lidia Fiorini for field operations. Our gratitude also goes to Geodetic Direction of the IGMI for the GNSS operations support and to Brig. Gen. Enzo Santoro, Chief of the Geospatial Information Department, for coordinating the activities. Finally, we express our gratitude to Prof. Michael Hensel (Vienna University of Technology) for having encouraged this study through interdisciplinary collaborations.

Conflicts of Interest

The authors declare no conflicts of interest.

References

  1. Preti, F.; Tarolli, P.; Dani, A.; Calligaro, S.; Prosdocimi, M. LiDAR derived high resolution topography: The next challenge for the analysis of terraces stability and vineyard soil erosion. J. Agric. Eng. 2013, 44. [Google Scholar] [CrossRef]
  2. Wei, W.; Chen, D.; Wang, L.; Daryanto, S.; Chen, L.; Yu, Y.; Lu, Y.; Sun, G.; Feng, T. Global synthesis of the classifications, distributions, benefits and issues of terracing. Earth-Sci. Rev. 2016, 159, 388–403. [Google Scholar] [CrossRef] [Green Version]
  3. Arnáez, J.; Lana-Renault, N.; Lasanta, T.; Ruiz-Flaño, P.; Castroviejo, J. Effects of farming terraces on hydrological and geomorphological processes. A review. CATENA 2015, 128, 122–134. [Google Scholar] [CrossRef] [Green Version]
  4. Socci, P.; Errico, A.; Castelli, G.; Penna, D.; Preti, F. Terracing: From Agriculture to Multiple Ecosystem Services. In Oxford Research Encyclopedia on Agriculture; in press.
  5. Tarolli, P.; Sofia, G.; Calligaro, S.; Prosdocimi, M.; Preti, F.; Dalla Fontana, G. Vineyards in Terraced Landscapes: New Opportunities from Lidar Data: Vineyards in terraced landscapes. Land Degrad. Dev. 2015, 26, 92–102. [Google Scholar] [CrossRef]
  6. Eckert, S.; Tesfay Ghebremicael, S.; Hurni, H.; Kohler, T. Identification and classification of structural soil conservation measures based on very high resolution stereo satellite data. J. Environ. Manag. 2017, 193, 592–606. [Google Scholar] [CrossRef] [PubMed]
  7. Diaz-Varela, R.A.; Zarco-Tejada, P.J.; Angileri, V.; Loudjani, P. Automatic identification of agricultural terraces through object-oriented analysis of very high resolution DSMs and multispectral imagery obtained from an unmanned aerial vehicle. J. Environ. Manag. 2014, 134, 117–126. [Google Scholar] [CrossRef] [Green Version]
  8. Matese, A.; Toscano, P.; Di Gennaro, S.; Genesio, L.; Vaccari, F.; Primicerio, J.; Belli, C.; Zaldei, A.; Bianconi, R.; Gioli, B. Intercomparison of UAV, Aircraft and Satellite Remote Sensing Platforms for Precision Viticulture. Remote Sens. 2015, 7, 2971–2990. [Google Scholar] [CrossRef] [Green Version]
  9. Eisenbeiss, H.; Sauerbier, M. Investigation of uav systems and flight modes for photogrammetric applications: Investigation of UAV systems and flight modes. Photogramm. Rec. 2011, 26, 400–421. [Google Scholar] [CrossRef]
  10. Neitzel, F.; Klonowski, J. Mobile 3D mapping with a low-cost UAV system. ISPRS Int. Arch. Photogramm. Remote Sens. Spat. Inf. Sci. 2012, XXXVIII-1/C22, 39–44. [Google Scholar] [CrossRef]
  11. Chiabrando, F.; Lingua, A.; Piras, M. Direct photogrammetry using UAV: Tests and first results. ISPRS Int. Arch. Photogramm. Remote Sens. Spat. Inf. Sci. 2013, XL-1/W2, 81–86. [Google Scholar] [CrossRef]
  12. Dominici, D.; Alicandro, M.; Massimi, V. UAV photogrammetry in the post-earthquake scenario: Case studies in L’Aquila. Geomat. Nat. Hazards Risk 2017, 8, 87–103. [Google Scholar] [CrossRef]
  13. Torresan, C.; Berton, A.; Carotenuto, F.; Di Gennaro, S.F.; Gioli, B.; Matese, A.; Miglietta, F.; Vagnoli, C.; Zaldei, A.; Wallace, L. Forestry applications of UAVs in Europe: A review. Int. J. Remote Sens. 2017, 38, 2427–2447. [Google Scholar] [CrossRef]
  14. Rinaudo, F.; Chiabrando, F.; Lingua, A.; Spanò, A. Archaeological site monitoring: UAV photogrammetry can be an answer. ISPRS Int. Arch. Photogramm. Remote Sens. Spat. Inf. Sci. 2012, XXXIX-B5, 583–588. [Google Scholar] [CrossRef]
  15. Murtiyoso, A.; Grussenmeyer, P. Documentation of heritage buildings using close-range UAV images: Dense matching issues, comparison and case studies. Photogramm. Rec. 2017, 32, 206–229. [Google Scholar] [CrossRef]
  16. Lo Brutto, M.; Garraffa, A.; Meli, P. UAV platforms for cultural heritage survey: First results. ISPRS Ann. Photogramm. Remote Sens. Spat. Inf. Sci. 2014, II–5, 227–234. [Google Scholar] [CrossRef]
  17. Achille, C.; Adami, A.; Chiarini, S.; Cremonesi, S.; Fassi, F.; Fregonese, L.; Taffurelli, L. UAV-Based Photogrammetry and Integrated Technologies for Architectural Applications—Methodological Strategies for the After-Quake Survey of Vertical Structures in Mantua (Italy). Sensors 2015, 15, 15520–15539. [Google Scholar] [CrossRef] [PubMed] [Green Version]
  18. Tucci, G.; Bonora, V. Geomatics and management of at-risk cultural heritage. Rendiconti Lincei 2015, 26, 105–114. [Google Scholar] [CrossRef] [Green Version]
  19. Gonçalves, J.A.; Henriques, R. UAV photogrammetry for topographic monitoring of coastal areas. ISPRS J. Photogramm. Remote Sens. 2015, 104, 101–111. [Google Scholar] [CrossRef]
  20. Kanistras, K.; Martins, G.; Rutherford, M.J.; Valavanis, K.P. A survey of unmanned aerial vehicles (UAVs) for traffic monitoring. In Proceedings of the 2013 International Conference on Unmanned Aircraft Systems (ICUAS), Atlanta, GA, USA, 28–31 May 2013; IEEE: Atlanta, GA, USA, 2013; pp. 221–234. [Google Scholar]
  21. Martínez-Lüscher, J.; Kizildeniz, T.; Vučetić, V.; Dai, Z.; Luedeling, E.; van Leeuwen, C.; Gomès, E.; Pascual, I.; Irigoyen, J.J.; Morales, F.; et al. Sensitivity of Grapevine Phenology to Water Availability, Temperature and CO2 Concentration. Front. Environ. Sci. 2016, 4. [Google Scholar] [CrossRef]
  22. Ferrini, F.; Mattii, G.B.; Nicese, F.P. Effect of Temperature on Key Physiological Responses of Grapevine Leaf. Am. J. Enol. Viticult. 1995, 46, 5. [Google Scholar]
  23. Greer, D.; Weedon, M. Temperature-dependent responses of the berry developmental processes of three grapevine (Vitis vinifera) cultivars. N. Z. J. Crop Hortic. Sci. 2014, 42, 233–246. [Google Scholar] [CrossRef]
  24. Gaiotti, F.; Pastore, C.; Filippetti, I.; Lovat, L.; Belfiore, N.; Tomasi, D. Low night temperature at veraison enhances the accumulation of anthocyanins in Corvina grapes (Vitis vinifera L.). Sci. Rep. 2018, 8. [Google Scholar] [CrossRef] [PubMed]
  25. Costa, J.M.; Grant, O.M.; Chaves, M.M. Use of Thermal Imaging in Viticulture: Current Application and Future Prospects. In Methodologies and Results in Grapevine Research; Delrot, S., Medrano, H., Or, E., Bavaresco, L., Grando, S., Eds.; Springer: Dordrecht, The Netherlands, 2010; pp. 135–150. [Google Scholar]
  26. Idso, S.B.; Jackson, R.D.; Pinter, P.J.; Reginato, R.J.; Hatfield, J.L. Normalizing the stress-degree-day parameter for environmental variability. Agric. Meteorol. 1981, 24, 45–55. [Google Scholar] [CrossRef]
  27. Jones, H.G. Use of infrared thermometry for estimation of stomatal conductance as a possible aid to irrigation scheduling. Agric. For. Meteorol. 1999, 95, 139–149. [Google Scholar] [CrossRef]
  28. Jones, H.G. Use of infrared thermography for monitoring stomatal closure in the field: Application to grapevine. J. Exp. Bot. 2002, 53, 2249–2260. [Google Scholar] [CrossRef]
  29. García-Tejero, I.F.; Costa, J.M.; Egipto, R.; Durán-Zuazo, V.H.; Lima, R.S.N.; Lopes, C.M.; Chaves, M.M. Thermal data to monitor crop-water status in irrigated Mediterranean viticulture. Agric. Water Manag. 2016, 176, 80–90. [Google Scholar] [CrossRef]
  30. Grant, O.M.; Tronina, L.; Jones, H.G.; Chaves, M.M. Exploring thermal imaging variables for the detection of stress responses in grapevine under different irrigation regimes. J. Exp. Bot. 2006, 58, 815–825. [Google Scholar] [CrossRef] [Green Version]
  31. Jones, H.G.; Serraj, R.; Loveys, B.R.; Xiong, L.; Wheaton, A.; Price, A.H. Thermal infrared imaging of crop canopies for the remote diagnosis and quantification of plant responses to water stress in the field. Funct. Plant Biol. 2009, 36, 978. [Google Scholar] [CrossRef]
  32. Moller, M.; Alchanatis, V.; Cohen, Y.; Meron, M.; Tsipris, J.; Naor, A.; Ostrovsky, V.; Sprintsin, M.; Cohen, S. Use of thermal and visible imagery for estimating crop water status of irrigated grapevine. J. Exp. Bot. 2006, 58, 827–838. [Google Scholar] [CrossRef] [Green Version]
  33. Baluja, J.; Diago, M.P.; Balda, P.; Zorer, R.; Meggio, F.; Morales, F.; Tardaguila, J. Assessment of vineyard water status variability by thermal and multispectral imagery using an unmanned aerial vehicle (UAV). Irrig. Sci. 2012, 30, 511–522. [Google Scholar] [CrossRef] [Green Version]
  34. Berni, J.; Zarco-Tejada, P.J.; Suarez, L.; Fereres, E. Thermal and Narrowband Multispectral Remote Sensing for Vegetation Monitoring from an Unmanned Aerial Vehicle. IEEE Trans. Geosci. Remote Sens. 2009, 47, 722–738. [Google Scholar] [CrossRef]
  35. Turner, D.; Lucieer, A.; Watson, C. Development of an Unmanned Aerial Vehicle (UAV) for hyper resolution vineyard mapping based on visible, multispectral, and thermal imagery. In Proceedings of the 34th International Symposium on Remote Sensing of Environment, Sydney, Australia, 10–15 April 2011; p. 4. [Google Scholar]
  36. Bellvert, J.; Zarco-Tejada, P.J.; Girona, J.; Fereres, E. Mapping crop water stress index in a ‘Pinot-noir’ vineyard: Comparing ground measurements with thermal remote sensing imagery from an unmanned aerial vehicle. Precis. Agric. 2014, 15, 361–376. [Google Scholar] [CrossRef]
  37. Warren, L.A.; Briggs, K.M.; McCombie, P.F. Advances in the assessment of drystone retaining walls—Some case studies. In Proceedings of the XVI European Conference on Soil Mechanics and Geotechnical Engineering, Edinburgh, UK, 13–17 September 2015; p. 7. [Google Scholar]
  38. Barbera, G.; Chieco, C.; Georgiadis, T.; Motisi, A.; Rossi, F. The “jardinu” of Pantelleria as a paradigm of resource-efficient horticulture in the built-up environment. Acta Hortic. 2018, 351–356. [Google Scholar] [CrossRef]
  39. Zellweger, F.; De Frenne, P.; Lenoir, J.; Rocchini, D.; Coomes, D. Advances in Microclimate Ecology Arising from Remote Sensing. Trends Ecol. Evol. 2019. [Google Scholar] [CrossRef] [PubMed]
  40. Romboli, Y.; Di Gennaro, S.F.; Mangani, S.; Buscioni, G.; Matese, A.; Genesio, L.; Vincenzini, M. Vine vigour modulates bunch microclimate and affects the composition of grape and wine flavonoids: An unmanned aerial vehicle approach in a Sangiovese vineyard in Tuscany: Vine vigour affects grape and wine flavonoids. Aust. J. Grape Wine Res. 2017, 23, 368–377. [Google Scholar] [CrossRef]
  41. Agnoletti, M. Paesaggi Rurali Storici. Per un catalogo nazionale; Laterza: Bari, Italy, 2010. [Google Scholar]
  42. Preti, F.; Errico, A.; Caruso, M.; Dani, A.; Guastini, E. Dry-stone wall terrace monitoring and modelling. Land Degrad. Dev. 2018, 29, 1806–1818. [Google Scholar] [CrossRef]
  43. Preti, F.; Guastini, E.; Penna, D.; Dani, A.; Cassiani, G.; Boaga, J.; Deiana, R.; Romano, N.; Nasta, P.; Palladino, M.; et al. Conceptualization of Water Flow Pathways in Agricultural Terraced Landscapes: Water Flow Pathways in Agricultural Terraced Landscapes. Land Degrad. Dev. 2018, 29, 651–662. [Google Scholar] [CrossRef]
  44. Mezzanzanica, M. Use of Multispectral and Thermal Images for the Characterization of Agricultural Lands. Master’s Thesis, Polytechnic University of Milan, Milan, Italy, 2016. [Google Scholar]
  45. Brandolini, P.; Cevasco, A.; Capolongo, D.; Pepe, G.; Lovergine, F.; Del Monte, M. Response of Terraced Slopes to a Very Intense Rainfall Event and Relationships with Land Abandonment: A Case Study from Cinque Terre (Italy): Agricultural Terraces and Slope Instability at Cinque Terre (NW Italy). Land Degrad. Dev. 2018, 29, 630–642. [Google Scholar] [CrossRef]
  46. Agnoletti, M.; Errico, A.; Santoro, A.; Dani, A.; Preti, F. Terraced Landscapes and Hydrogeological Risk. Effects of Land Abandonment in Cinque Terre (Italy) during Severe Rainfall Events. Sustainability 2019, 11, 235. [Google Scholar] [CrossRef]
  47. Yehong, S.; Qingwen, M.; Junchao, S.; Yabing, J. Terraced Landscapes as a Cultural and Natural Heritage Resource. Tour. Geogr. 2011, 13, 328–331. [Google Scholar] [CrossRef] [Green Version]
  48. Siegesmund, S.; Snethlage, R. (Eds.) Stone in Architecture Properties, Durability, 5th ed.; Springer: Berlin/Heidelberg, Germany, 2014. [Google Scholar]
  49. Evola, G.; Marletta, L.; Natarajan, S.; Maria Patanè, E. Thermal inertia of heavyweight traditional buildings: Experimental measurements and simulated scenarios. Energy Procedia 2017, 133, 42–52. [Google Scholar] [CrossRef]
  50. Argyle, A.; Stevens, M.T. Influence of Boulders on Netleaf Hackberry (Celtis reticulata) Growth and Distribution in the Wasatch Foothills. West. North Am. Nat. 2013, 73, 525–529. [Google Scholar] [CrossRef]
  51. Conte, P.; Girelli, V.A.; Mandanici, E. Structure from Motion for aerial thermal imagery at city scale: Pre-processing, camera calibration, accuracy assessment. ISPRS J. Photogramm. Remote Sens. 2018, 146, 320–333. [Google Scholar] [CrossRef]
  52. Luhmann, T.; Piechel, J.; Roelfs, T. Geometric Calibration of Thermographic Cameras. In Thermal Infrared Remote Sensing: Sensors, Methods, Applications; Kuenzer, C., Dech, S., Eds.; Springer: Dordrecht, The Netherlands, 2013; pp. 27–42. [Google Scholar]
  53. Arandjelović, O.; Pham, D.-S.; Venkatesh, S. Efficient and accurate set-based registration of time-separated aerial images. Pattern Recognit. 2015, 48, 3466–3476. [Google Scholar] [CrossRef]
  54. Glaser, B.; Antonelli, M.; Chini, M.; Pfister, L.; Klaus, J. Technical note: Mapping surface saturation dynamics with thermal infrared imagery. Hydrol. Earth Syst. Sci. Discuss. 2018, 22, 5987–6003. [Google Scholar] [CrossRef]
  55. Tarolli, P.; Preti, F.; Romano, N. Terraced landscapes: From an old best practice to a potential hazard for soil degradation due to land abandonment. Anthropocene 2014, 6, 10–25. [Google Scholar] [CrossRef]
  56. Sona, G.; Passoni, D.; Pinto, L.; Pagliari, D.; Masseroni, D.; Ortuani, B.; Facchi, A. UAV multispectral survey to map soil and crop for precision farming applications. ISPRS Int. Arch. Photogramm. Remote Sens. Spat. Inf. Sci. 2016, XLI-B1, 1023–1029. [Google Scholar] [CrossRef]
  57. Stroppiana, D.; Villa, P.; Sona, G.; Ronchetti, G.; Candiani, G.; Pepe, M.; Busetto, L.; Migliazzi, M.; Boschetti, M. Early season weed mapping in rice crops using multi-spectral UAV data. Int. J. Remote Sens. 2018, 39, 5432–5452. [Google Scholar] [CrossRef]
Figure 1. Vigna Grospoli vineyard in Lamole. Photo by G. Castelli.
Ijgi 08 00087 g001
Figure 2. Location of the study area. Red border—North area; blue border—South area of the Grospoli vineyard in Tuscany region (Italy).
Ijgi 08 00087 g002
Figure 3. Each vineyard row has been labelled as: internal (blue) for the closest rows to the dry-stone wall (dotted line), external rows (red) for the ones at the edge of the terrace (black lines). All the rows comprised between internal and external have been identified as intermediate (green).
Ijgi 08 00087 g003
Figure 4. The orthophoto of the study area produced by the photogrammetric processing of the images acquired from the RGB flight over the Grospoli vineyard.
Ijgi 08 00087 g004
Figure 5. Thermal maps of the Grospoli vineyard in (a) morning (08.50 CET) and (b) afternoon (15:00 CET). The enlarged windows highlight internal and external rows, showing their respective thermal behaviours.
Ijgi 08 00087 g005
Figure 6. Difference between the afternoon thermal map and the morning orthomosaics highlighting, in the enlarged windows, the behaviour of the internal and external rows.
Ijgi 08 00087 g006
Figure 7. Scatter plot of morning and afternoon temperatures for external (circles) and internal (black squares) rows.
Ijgi 08 00087 g007
Figure 8. Temperature average values along the hillside terraced Grospoli vineyard. (a) North area; (b) South area. White and grey timeseries represent morning and afternoon temperatures respectively. Black dots represent internal rows temperature mean values.
Ijgi 08 00087 g008
Figure 9. Sun position over the Grospoli vineyard on 8 September 2017, at (a) 08:00 CET (solar rays perpendicular to the rows) and (b) 15:00 CET (solar rays irradiating all the rows).
Ijgi 08 00087 g009
Table 1. Technical specifications of DJI Phantom 4 Pro.
DJI Phantom 4 Pro
Specifications
Ijgi 08 00087 i001
TypologyQuadricopter
Weight 1388 g
Diagonal size350 mm
Max flight timeApprox. 30 min
Max speed72 kph (S-mode)
Power sourceLiPo 4S
Satellite positioning systemGPS-GLONASS
Gimbal stabilization3-axis (pitch, roll, yaw)
Range pitch120° (−90° to +30°)
Operating frequencies2.4 GHz and 5.7 GHz
Max Transmission distance3.5 km (CE)
Operating temperature0–40 °C
Obstacle Sensory Range0.2–7 m
Table 2. Technical specifications of the two sensors: DJI FC6310 (RGB) and OPTRIS PI450 (TIR).
Camera Ijgi 08 00087 i002
DJI FC6310
Ijgi 08 00087 i003
OPTRIS PI450
Spectral rangeRGB 2TIR 4 (7.5–13 μm)
Sensor1″ CMOSFPA 5, uncooled
Sensor size13.1 × 8.7 mm25 × 25 μm
Resolution20 MP (5472 × 3648 px)382 × 288 px
Focal length8.8 mm (f/2.8–f/11)8 mm
FOV 184°62° × 49°
OutputJPEG 3 image.RAVI 6 video
Weight300 g320 g
Temperature resolution-± 2 °C
Operating temp. range0–40 °C−20–250 °C
Acronyms explication: 1 Field Of View (FOV), 2 Red, Green, Blue, 3 Joint Photographic Experts Group (JPEG), 4 Thermal InfraRed (TIR), 5 Focal Plane Array (FPA), 6 RAdiometric VIdeo sequence (RAVI).
Table 3. The three flight plans in the visible (VIS) and Thermal InfraRed (TIR) ranges. The pictures represent camera locations (black dots) of each swipe and image overlap (colors).
Flight Plans Ijgi 08 00087 i004
VIS Range
Ijgi 08 00087 i005
TIR Range
Time of acquisition13:3008:50 1/15:00 2
Flight altitude AGL70 m40 m
Forward overlap80%80%
Side overlap70%60%
GSD2 cm/pix12 1,2 cm/pix
Number of pictures206578 1/603 2
Speed5 m/s3 m/s
TIR values in the 1 morning and 2 afternoon.
Table 4. Statistics of Ground Control Points (GCPs) and Check Points (CPs) for RGB and TIR photogrammetric projects provided by Agisoft PhotoScan.
Control PointsCheck Points
RMSE
[cm]
RMSE
[pix]
RMSE
[cm]
RMSE
[pix]
RGB1.590.132.520.15
TIR morning0.340.055.430.05
TIR afternoon0.450.0611.40.06
Table 5. Statistical analysis of averages of morning and afternoon temperatures, for external and internal rows (°C).
MorningAfternoon
External17.6 (0.9)23 (0.4)
Internal15.4 (0.4)23.1 (0.5)
P-value7E-090.919
Statistical significance>99%NO

