1. Introduction
In Switzerland, the construction of roundabouts, in addition to, or to replace regular intersections, started in the 1980s [
1]. Apart from facilitating efficient and smooth traffic flow, roundabouts are considered particularly safe. However, there is growing evidence from various countries that this does not hold for cyclists [
2,
3,
4]. Data for Switzerland also indicate that roundabouts pose safety risks to cyclists: While an overall safety benefit of roundabouts over conventional intersections was demonstrated in an early before/after study [
5], the same study revealed significantly increased numbers of bicycle accidents after roundabout installation. Recent numbers from federal surveys on road traffic accidents show that almost one-third of the accidents at roundabouts involve cyclists [
6,
7,
8] and often bicycle accident accumulations are located at roundabouts [
9]. While considerable attention has been given to the formulation of safety guidelines for roundabout design [
1,
5,
10,
11] and management [
12,
13], as well as analysis of bicycle accident occurrence at roundabouts [
8,
9,
11], extensive structural analyses of operating facilities with respect to the identified risks for cyclists are still missing for Switzerland c.f. [
1,
8,
13]: Early on, the influence of a large number of geometric properties on general roundabout safety was studied on a relatively small sample of roundabouts in Switzerland (
N = 32) [
1]. The main findings from this study were the importance of a sufficient deviation of entering vehicles by the central island, a restriction of the visibility range to the left from the entering roadway, a sight blocking design of the central island—especially in cases where the visibility range to the left on roundabout entry is restricted—and a negative influence of traversable aprons [
1]. In detail, the study results indicated a complex interdependence of different parameters with varying impacts depending on the type of accident (i.e., accident location or involved parties) [
1]. In a recent extensive analysis of general road infrastructure safety in Switzerland, Schüller et al., 2016 [
8] reported amongst others, a significant negative influence of road traffic volume and of the density of public transport stops on roundabout safety and a significantly better safety performance of roundabouts with only three entering legs. Altogether, the available evidence highlights the need for further studies on the form of operating facilities in connection to bicycle accidents. Hence, the purpose of this study was to explore the relation of roundabout geometric properties to bicycle safety for a larger sample of roundabouts in Switzerland.
Studies on the relation of bicycle accident occurrence to roundabout design and road traffic volumes have been carried out for other countries, e.g., [
2,
4,
14,
15,
16,
17]. A consistent finding of these studies is that motorized vehicle traffic volume is a major factor in bicycle accident frequency. Further, an inverse relation of the central island radius to bicycle accident occurrence when radii are 10–20 m and a positive relation for larger radii was reported repeatedly [
4,
18]. This goes together with observed adverse effects of the presence of central island aprons that are traversable for motorized vehicles and the apron’s width, respectively [
15,
16]. Further, central islands which are elevated >2 m seem to improve the bicycle safety performance of roundabouts [
4]. A relation of the number of legs to bicycle accident occurrence could not be established firmly [
14,
15,
16,
18]. The same is true for the number of lanes on the circulatory roadway or its width [
16,
17,
18]. However, the results from different studies are not easily compared to each other, due to differences in methodologies. Further, transferring results from one country to another is difficult [
16]. For instance, bicycle lanes on the circulatory roadways or separate tracks around them are common features of roundabouts in several countries [
4,
15,
16,
18] and may lead to specific dangerous spots. Such bicycle facilities are rare in Switzerland [
11]. In general, roundabouts in Switzerland are single-lane, mixed traffic, relatively small in diameter (c.f.
Section 2, [
11]), and often fitted into densely built-up areas. Hence, the eccentricity of the legs’ axes or small angels between axes of adjacent legs are more of a concern regarding safety risks than they may be elsewhere [
16]. It is therefore expected that local roundabout characteristics lead to specific attribute value distributions and a spatial distribution of collision spots at roundabouts that is not necessarily matched by samples from other countries.
2. Materials and Methods
The study was carried out on a sample of
single-lane roundabouts of the Canton of Berne, Switzerland (Public Works Department of the Canton of Berne 2016). The sample is characterized by a large number of small- and mini-sized roundabouts (c.f. [
5,
10]). With it, data on bicycle accidents at roundabouts recorded from 2004–2016 were available [
19]. Antecedently, roundabouts that intersect motorways only (
), as well as two-lane roundabouts (
N = 7) and roundabouts with less than three or more than five legs (
) were excluded. This was because there is no bicycle traffic on motorway roundabouts and the other types are rare and represent special cases with respect to geometry. Attributes of roundabout geometry were created using GIS software, data from the Topographic Landscape Model (TLM) [
20] and high-resolution aerial orthoimagery [
21]. Attribute values on vehicle traffic volume originate from the Gesamtverkehrsmodell (GVM) [
22]. The GVM provides model-based estimates of average weekday motorized traffic.
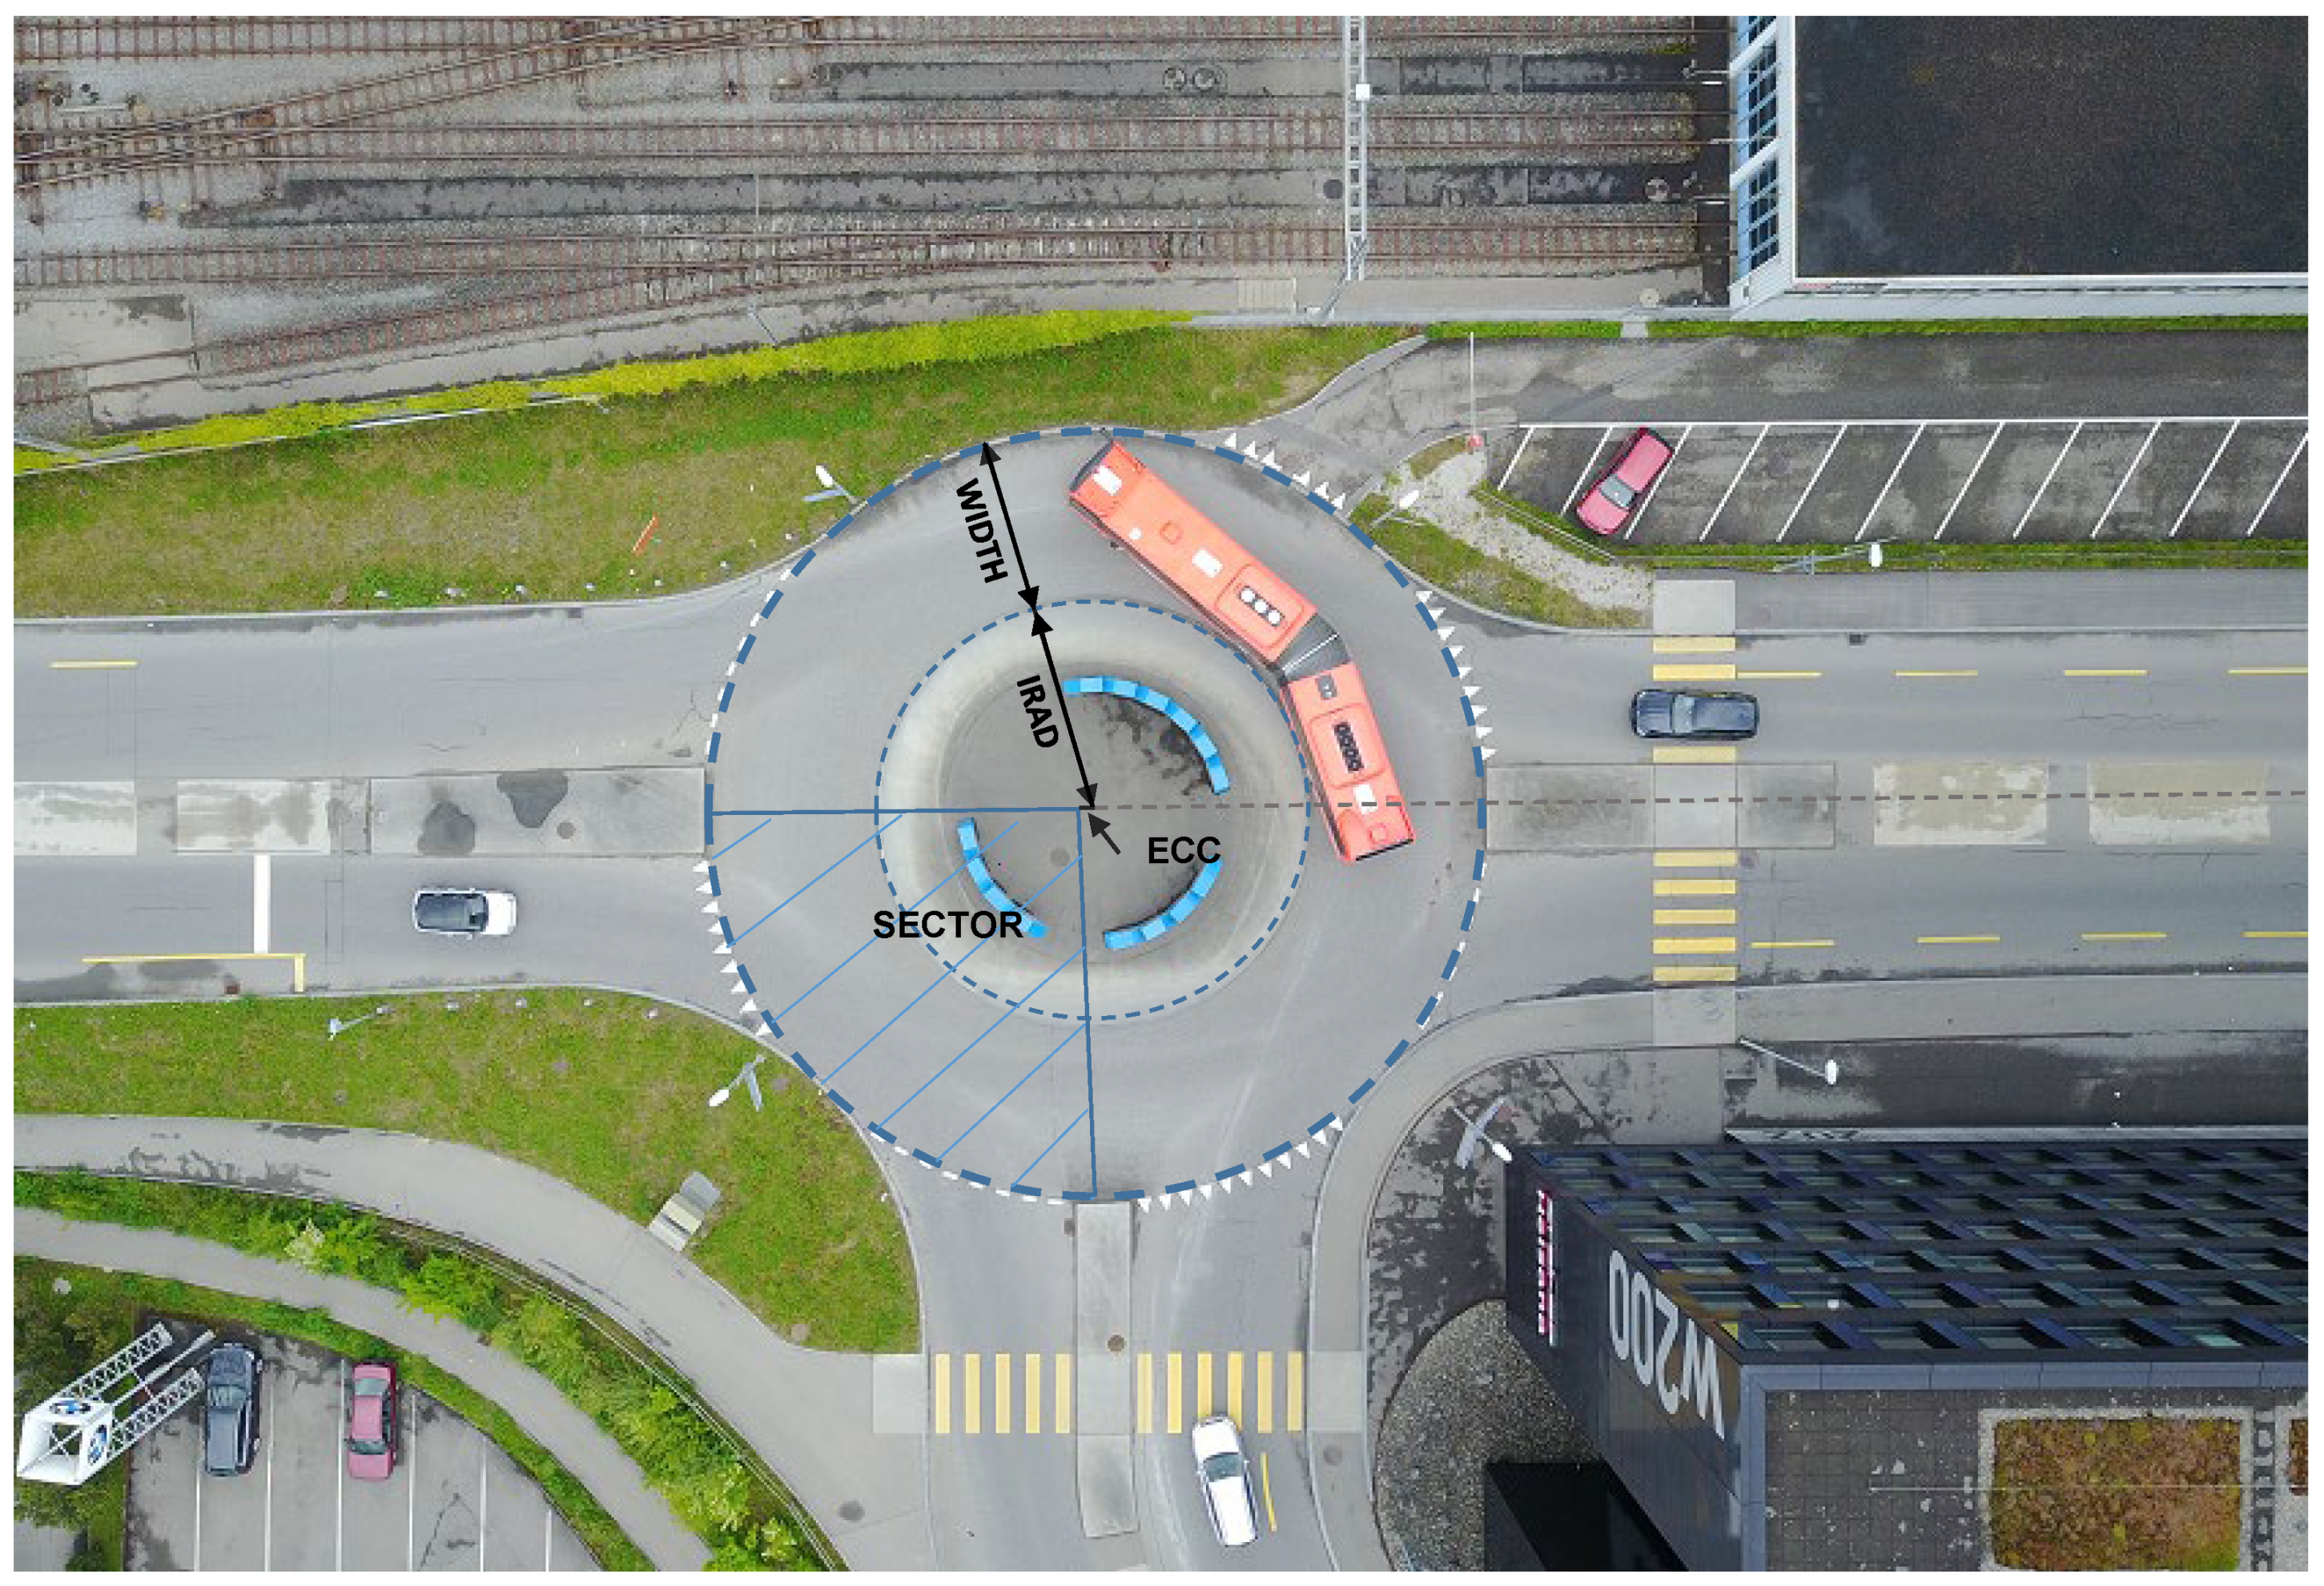
Table 1 and
Figure 1 detail the roundabout attributes that were used in the analysis, their data source, as well as their minimum, maximum and average values. The set of attributes and their expected relation to bicycle accident occurrence was established based on expert knowledge from the Public Works Department of the Canton of Berne, existing subject matter literature and was to some degree restricted by data availability: For example, there were no comprehensive data on speed limits or roadway slope, and no data on effective speed or bicycle traffic volumes available. Attributes of main interest were those concerning roundabout geometry and central island design. Attributes that are expected to positively influence bicycle safety are the inscribed circle radius (ICR) (measure of the size of the roundabout [
8,
11]), the radius of the central island (IRAD), the minimum sector angle (MIN_SA), a restricted view across the central island (VIEW), and the presence of pedestrian crossings on entering roadways (ZEBRA). An adverse effect on bicycle safety is expected for the width of the circulatory roadway (WIDTH), the maximum eccentricity of the legs’ axes (MAX_ECC) and unbalanced loads of motorized vehicle traffic on the legs (LOAD). WIDTH was calculated including the central island apron when the apron is only delineated by a marking. As a consequence, the actual central island measures no more than 0.5 m in some mini roundabouts. Estimated average weekday motorized traffic (AWT) was included as an expected factor in accident occurrence and to control confounding effects with respect to variables of interest. Further, roundabout location (LOC), i.e., out of town vs. in town, has proved relevant in several contexts of road traffic accident analysis [
23]. The role of the location, i.e., the underlying factors, is not clear [
23]: It can act as a proxy for different speed limits, e.g., [
4], but also as a proxy for different location characteristics (open vs. built-up) [
8,
16]. Beyond this, it could act as a proxy for different volumes of bicycle traffic (lower volumes out of town, higher volumes in town). Of course, bicycle traffic volume itself is expected to relate to bicycle accident occurrence [
2,
4,
14,
16]. However, as noted above, data on bicycle traffic volumes were not available. Hence, the presence of bicycle lanes was included as an attribute, not only because of a possible structural relation to accident occurrence, but also as a potential proxy to higher bicycle traffic volumes. Of course, the list of attributes is not comprehensive, c.f. [
1,
17]. Some of the geometric attributes that are missing from the analysis, such as roadway slope on the legs, may be associated significantly with bicycle safety risk. However, such geometric properties could be included more meaningfully in a finer grained analysis in which accidents are related to specific roundabout legs.
For the presented dataset, the year of construction of the roundabout is unknown. Hence, it was not possible to normalize the accident counts by the period of operation, i.e., to calculate accident frequencies. Therefore, a dichotomous dependent variable was created from the number of accidents at the roundabout: The sample was split between zero and one accident (
). This results in two outcome groups with
(0) and
(1). Dichotomizing variables is a matter of contention, as generally, a lot of information is lost and results may be flawed [
25]. This is especially problematic when the dependent variable is dichotomized. In the present case, the problem is that the optimal information was not available in the first place: Not knowing the period, during which no accidents occurred at a roundabout, makes it difficult to judge whether the observed outcome is the likely result of chance or more likely due to the structural properties of the roundabout. It is therefore noted that an additional attempt of splitting the sample between one and two accidents resulted in the same attributes being significant in a multivariate logistic model.
Given the purpose of investigating the relation of roundabout design to a binary dependent variable for bicycle accident occurrence, a logistic regression analysis was performed. Binary design variables were created for the levels of categorical variables (VIEW, NO_LEG, c.f.
Table 1), in which one level was set as the reference with value 0 for all binary variables of the attribute. First, univariate logistic regression was conducted on each variable listed in
Table 1. Then, purposeful model building was performed as advocated in [
26]:
Step I A first multivariate logistic regression model was fitted including all variables that yielded
p-values
for the Wald statistic or the log-likelihood ratio test in the case of polytomous variables in the univariate analyses (
Table 1).
Step II Variables with
p-values > 0.05 were excluded from this first model and a new model was fitted. The new model’s significance was checked against the first model via the log-likelihood ratio test. Further, it was checked that all remaining coefficients are still significant at the 95%-level and that none of the coefficients underwent changes >20% via the
-statistic. The latter would indicate that some variable was excluded that strongly adjusts the effect of a remaining covariate and therefore may be retained [
26].
Step III Subsequently, each variable that was not included in the first model was added back, one at a time, to check for changes in their p-value and changes in the estimates of the remaining coefficients >20%.
Step IV In the ‘preliminary main effects model’ [
26], the scale of each continuous variable was checked for its linearity in the logit by fitting a series of eight single-term and 36 two-term polynomials using exponents
instead of the linear term [
26,
27]. The multivariate models containing the polynomial terms were compared to the model with the linear term via a log-likelihood ratio test. The linear term was replaced by the best fitting polynomial term only if the log-likelihood ratio test was significant, if the deviance decreased considerably, and if the relation described by the polynomial term seemed interpretable [
26].
Step V Finally, all possible interactions between the variables of the model at the end of step IV were added to the main effects model, one at a time, or as group of terms in the case of polytomous variables, to check for significant effect moderation. Terms with p-values >0.05 for the log-likelihood ratio test were discarded.
The overall fit of the final model was assessed using the Hosmer–Lemeshow [
28], the Osius and Rojek’s [
29], and the Stukel’s [
30] test, as recommended in [
26]. Regression diagnostics were performed by plotting changes in Pearson Chi-square
, changes in deviance
and
against the estimated probabilities for all data records in order to identify outliers and single records with considerable influence on the estimates of coefficients [
26]. The corresponding records were temporarily removed from the dataset to study their effect on the model parameters. All analyses were conducted using R Version 3.4.3 [
31]: To fit the standard logistic regression model the R function glm [
31] was used. The goodness-of-fit tests as well as the diagnostic plots were carried out using the R library “LogisticDx” [
32].
3. Results
The results from the univariate logistic regression are presented in the last two columns of
Table 1. Average weekday motorized traffic (AWT), roundabout location (LOC), presence of pedestrian crossings (ZEBRA), and motorized traffic load distribution (LOAD) were significant at traditional levels. Further, radius of the central island (IRAD), width of the circulatory roadway (WIDTH) and number of legs (NO_LEG4, NO_LEG5) were significant at the 90%-level. The minimum sector angle (MIN_SA) yielded a
p-value <0.20. Hence, these were the variables used to fit the model at Step I (c.f.
Section 2), while presence of bicycle lanes (BIKE) and view across the central island (V_INTER, V_POOR) were not included due to their poor association with the outcome in univariate analyses.
Upon Step II variables WIDTH (), MIN_SA (), ZEBRA (), and LOAD () were excluded and the reduced model retained (L.R. Chisq 3.432, d.f. 4 p 0.488, max. ). No more variables were added through Steps III and V. However, as a result of the procedure in Step IV, AWT was replaced by . The second continuous variable, IRAD, was not substituted by an outperforming two-term polynomial (−2, 3), due to the lack of a straightforward interpretation.
The final multivariate model was
and the estimated coefficients are presented in
Table 2.
Goodness-of-fit statistics for the final model (
Table 2) (
) indicate that the model fits the data reasonably well. Further, all values of
, all values of
, and all values of
. Excluding three distinct outliers leaves all remaining
and
. Excluding a total of six roundabouts with relatively large
(this also includes the three outliers) only increases the levels of significance and the magnitudes of estimated coefficients, since for all of those subjects, the outcome goes against the model. However, all subjects were deemed valid and were therefore retained.
The radius of the central island (IRAD) relates inversely to the probability of at least one bicycle accident at a roundabout. The transformed sum of average weekday motorized traffic (), in town location (LOC), and the number of legs (NO_LEG4, NO_LEG5) relate positively to the probability of at least one bicycle accident at a roundabout.
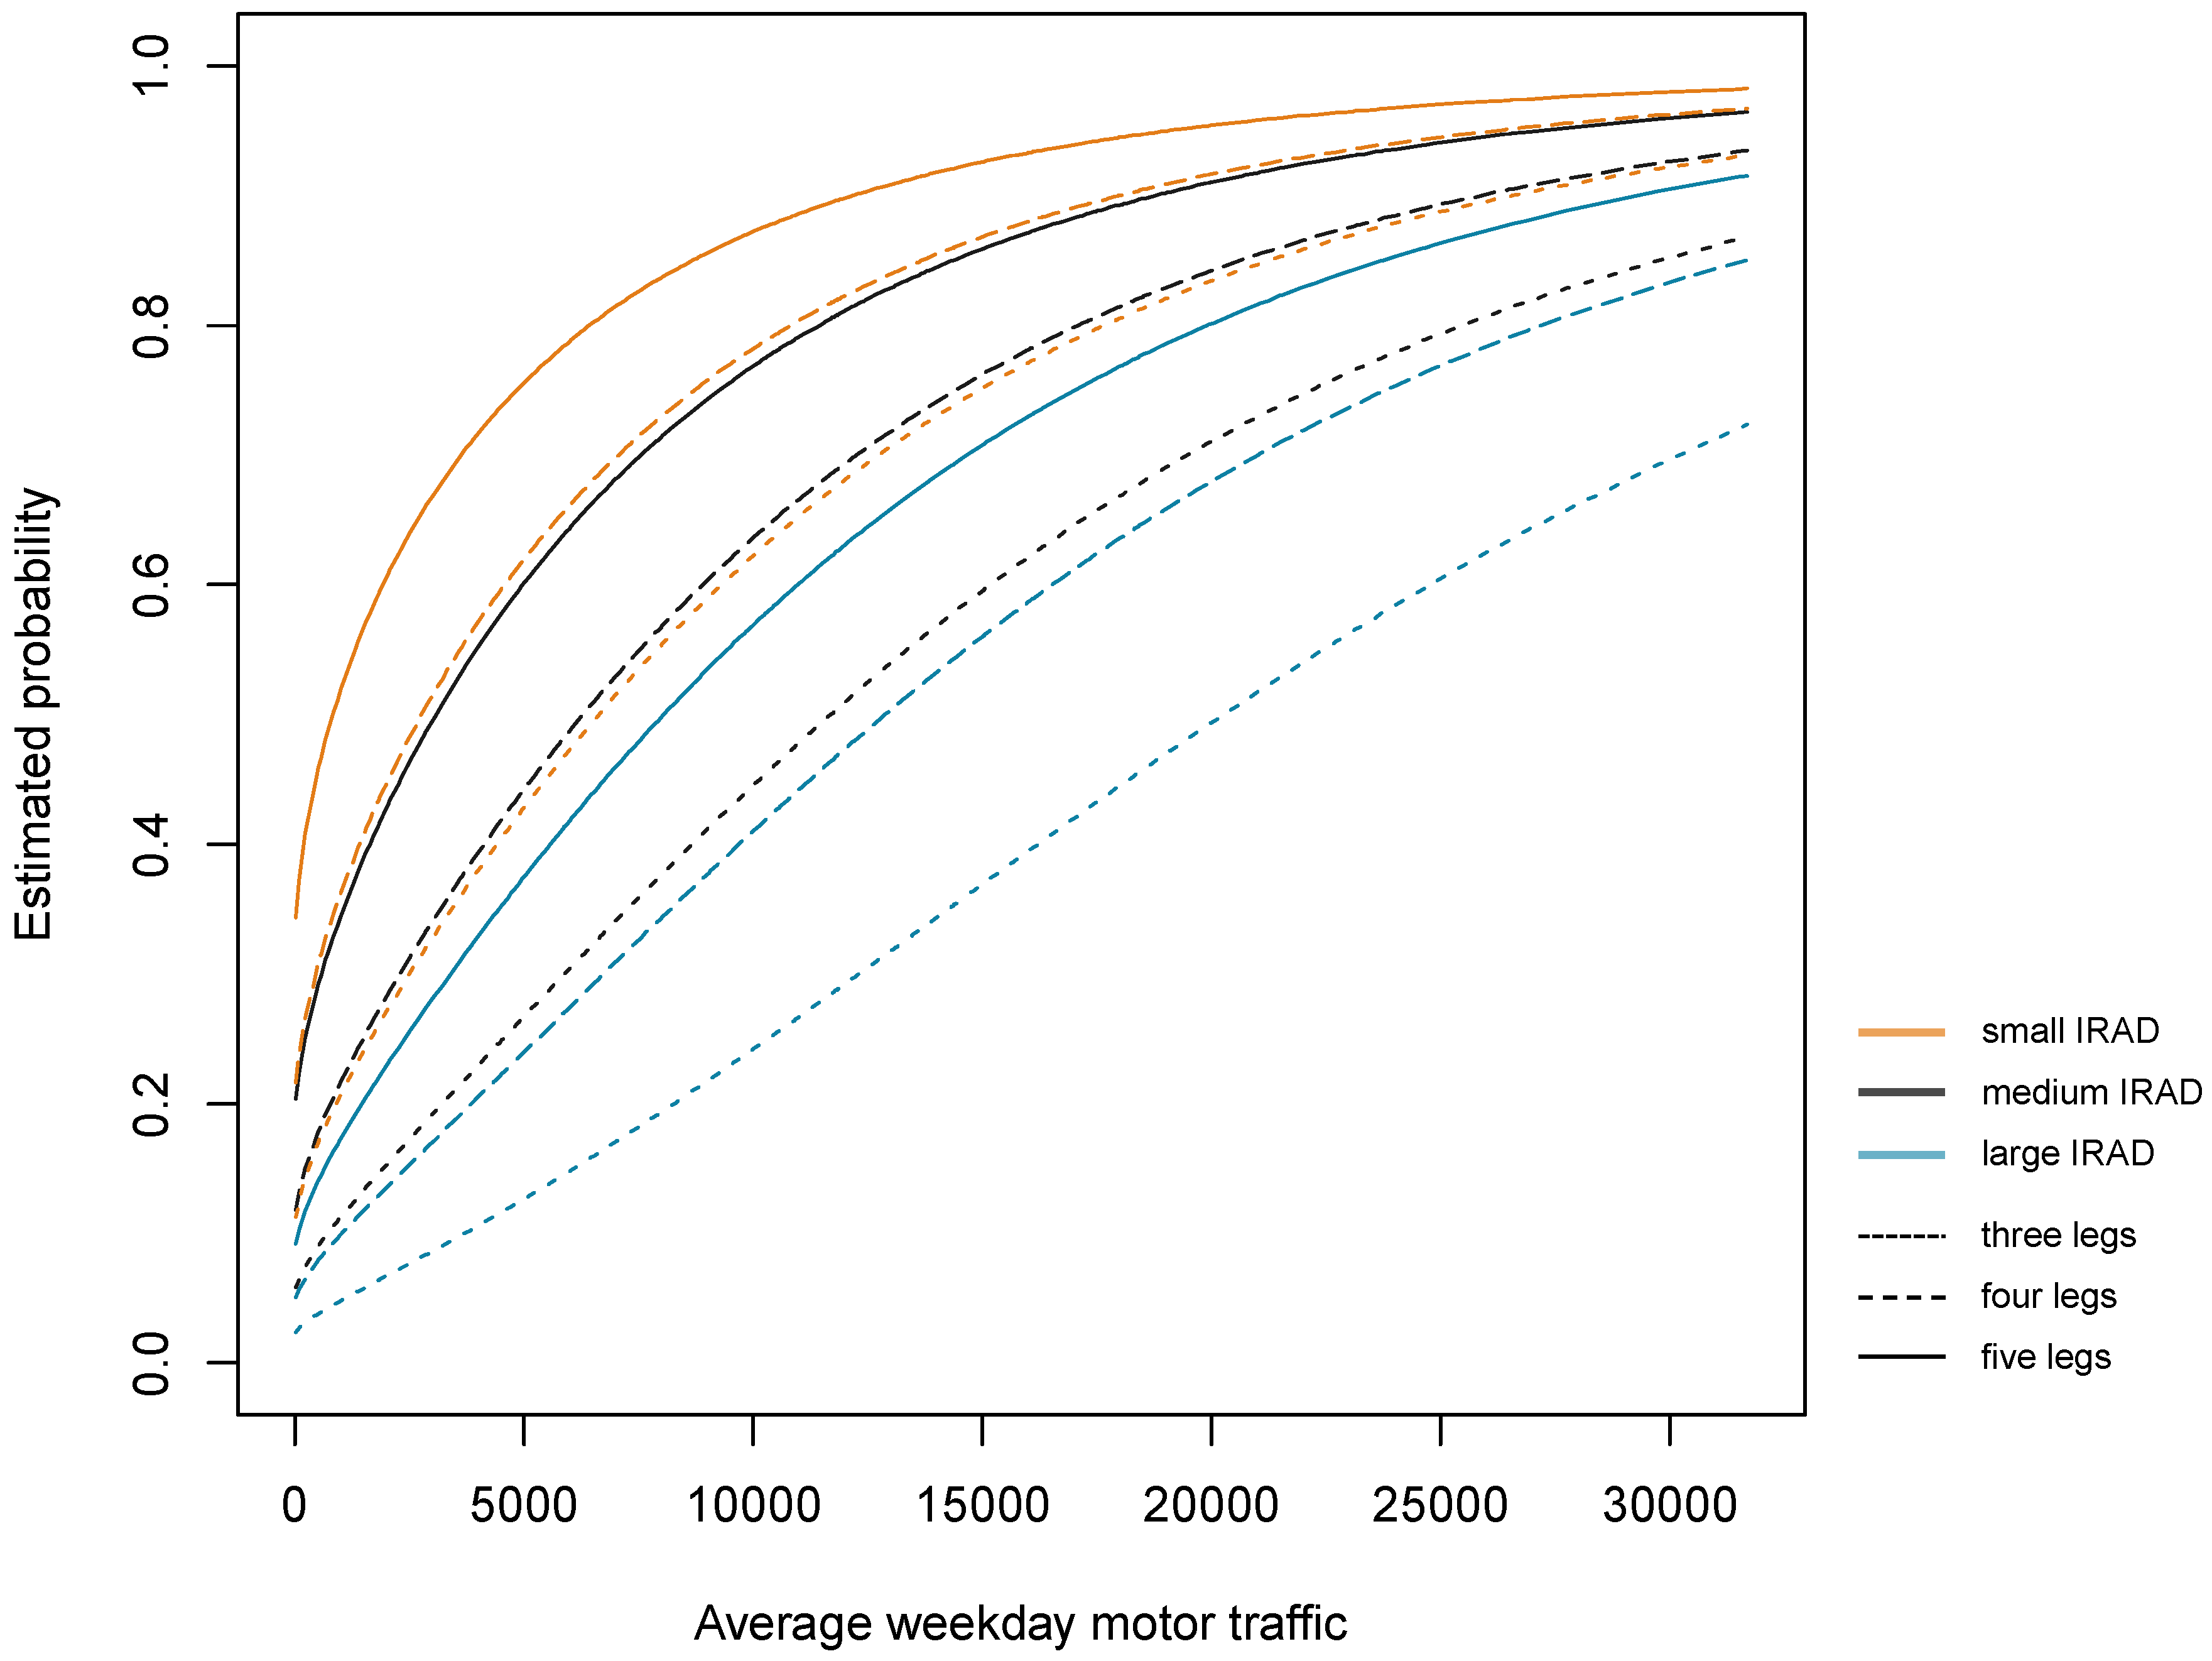
The non-linearity of the AWT in the logit results in impacts that change over the scale of this variable: Effectively, the change in the odds ratio for additional motorized traffic is the steepest for low AWT, while it flattens for higher AWT (
Figure 2). For large central island radii (IRAD), the relation of AWT to the estimated probabilities becomes more linear (
Figure 2).
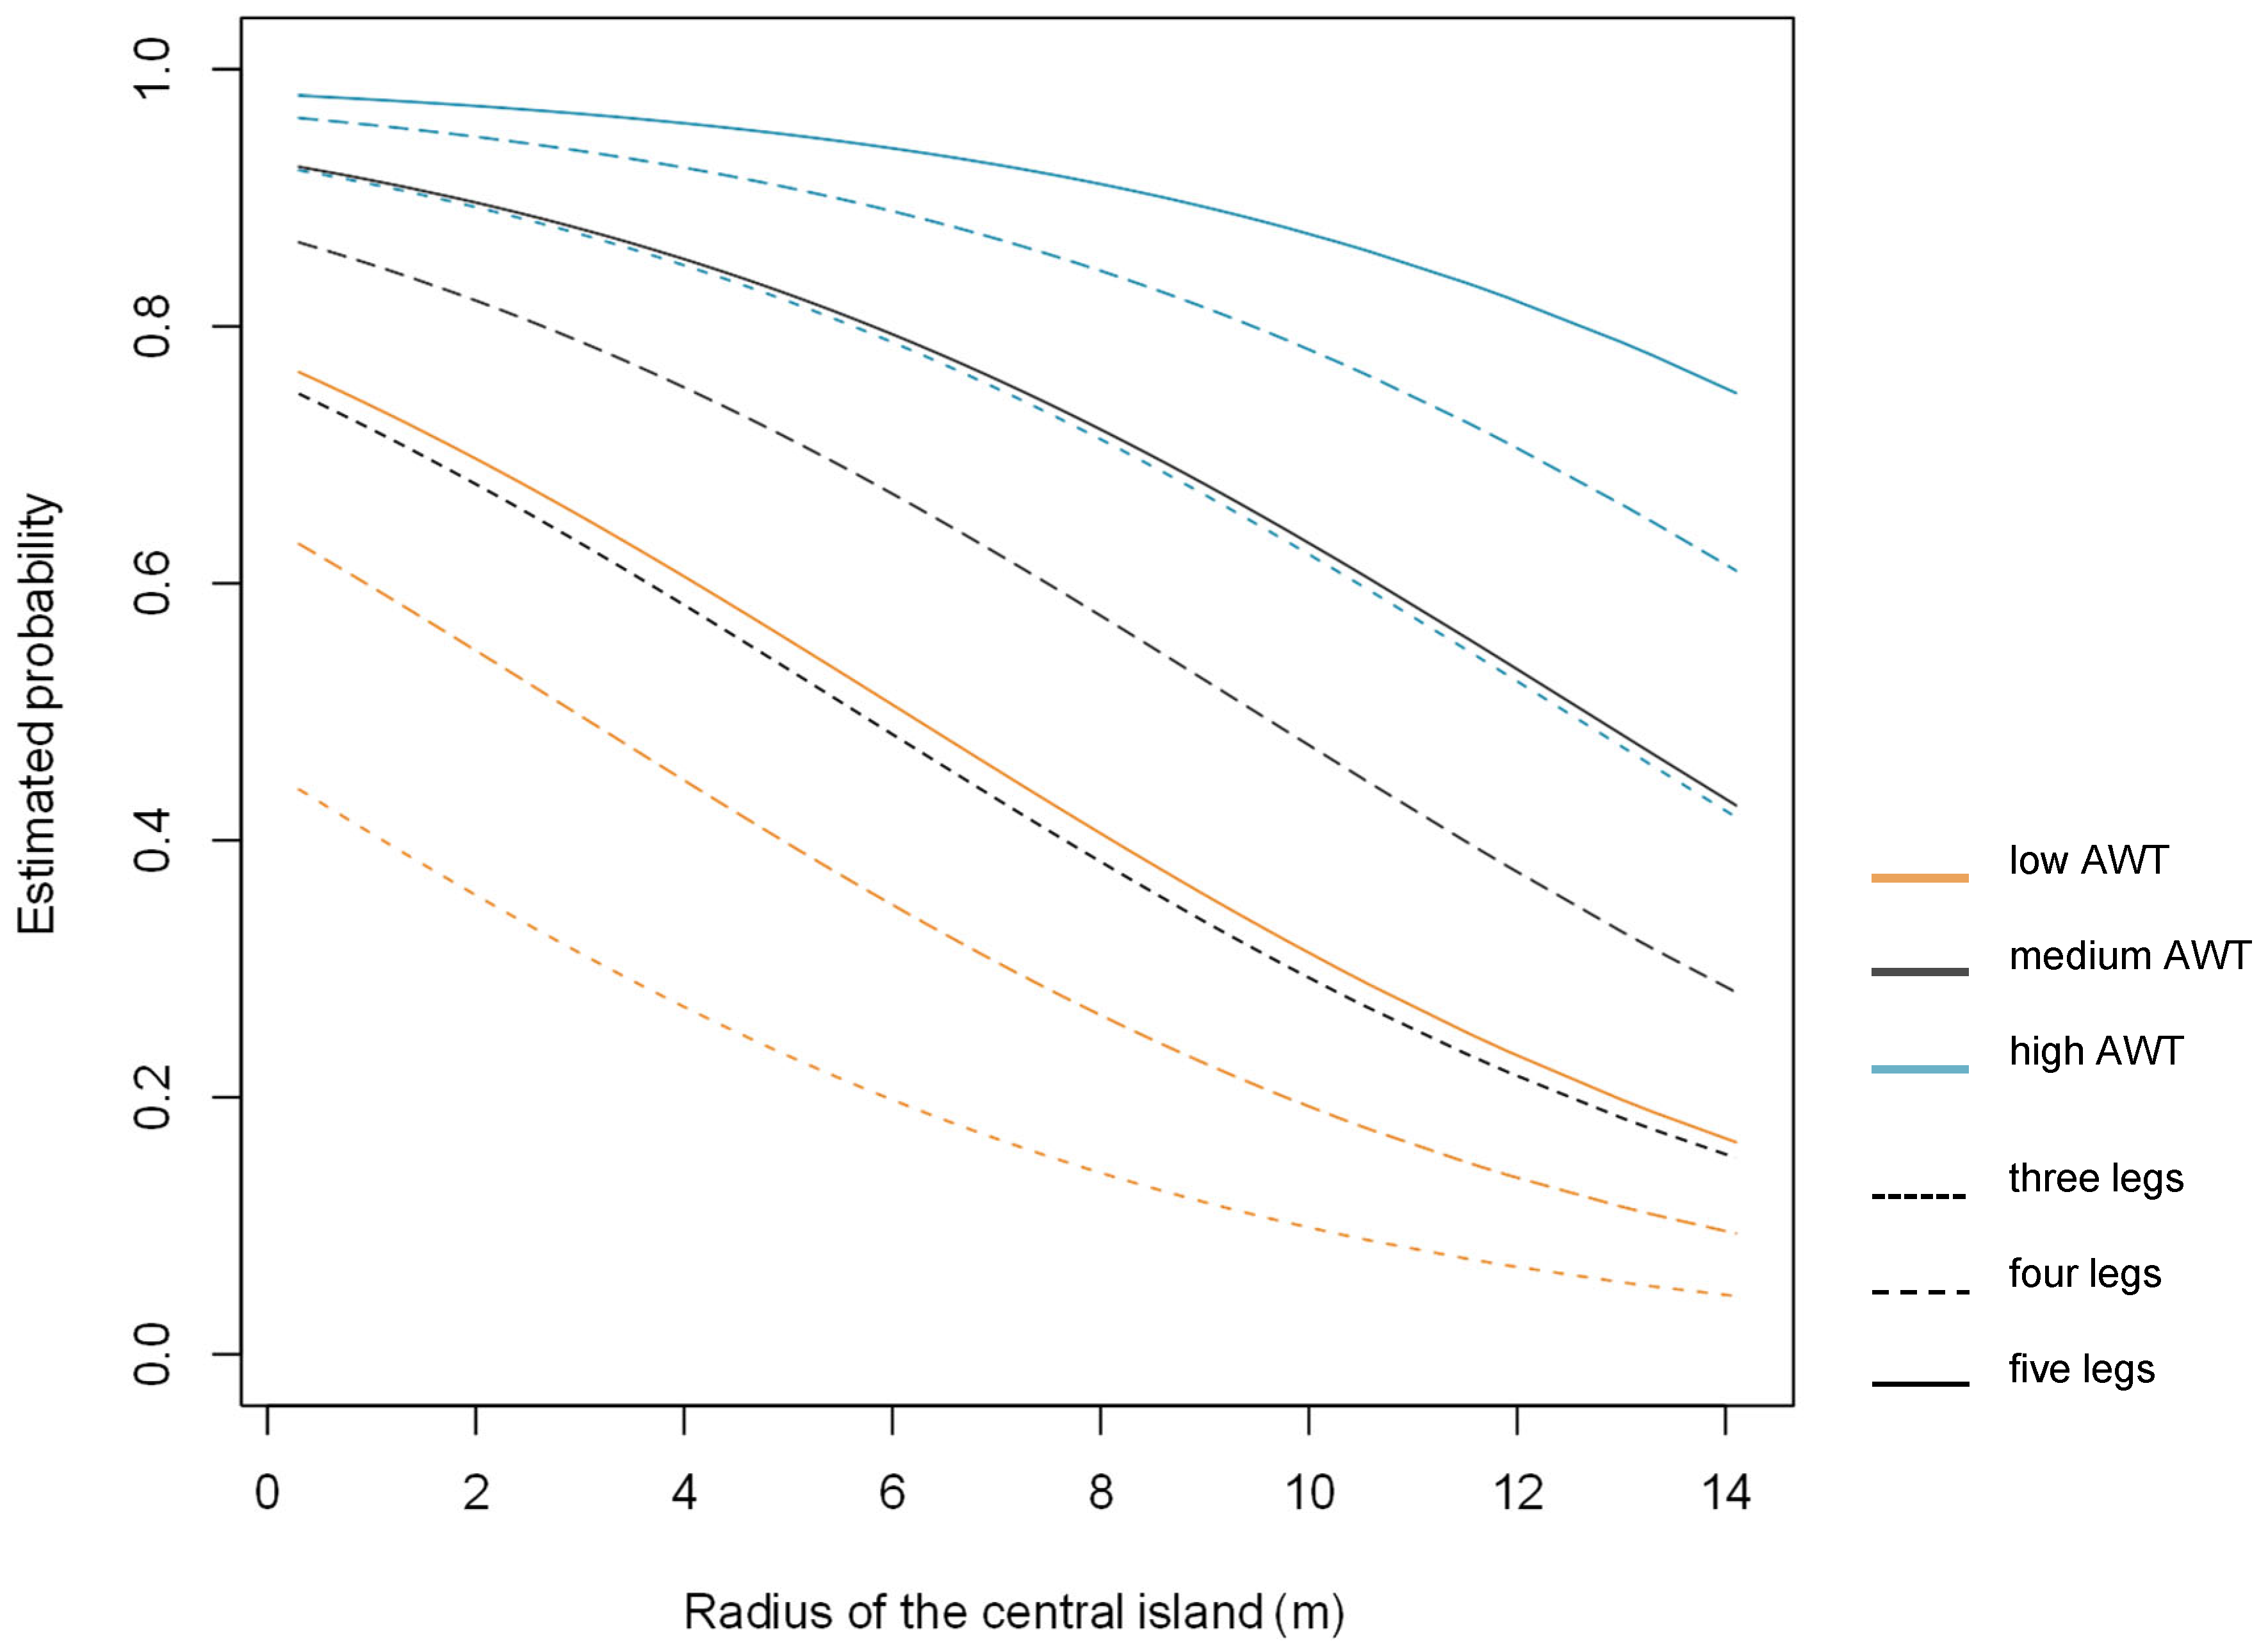
Figure 2 and
Figure 3 show that AWT is the major influencing factor in estimated accident probabilities, while the IRAD merely moderates this effect: When average weekday motorized traffic is high, even at the highest values of IRAD, the estimated probabilities do not drop below 0.5 for roundabouts with four or five legs in town (
Figure 3). Only when AWT is low, IRAD becomes more critical (
Figure 3): At low AWT, estimated probabilities drop below 0.3 for the top quartile of IRAD values of in town roundabouts. From
Figure 3, it is inferred that at low AWT, the most pronounced effect of an increase in IRAD on the estimated probabilities is for roundabouts with IRAD < 8 m, while under heavy traffic, the main decrease in estimated probabilities is for IRAD > 8 m. In addition, the difference in estimated accident probabilities for three-, four- and five-leg roundabouts is least pronounced for roundabouts with very low AWT and large IRAD, or very high AWT and small IRAD.
4. Discussion
The logistic regression analysis suggests that in the present dataset, the central island radius (IRAD), average weekday motorized traffic (AWT), roundabout location in town vs. out of town (LOC) and the number of legs (NO_LEG), are all explaining variables with respect to bicycle accident occurrence. By contrast, inscribed circle radius (ICR), circulatory roadway width (WIDTH), minimum sector angle, maximum eccentricity of the legs’ axes (MAX_ECC), presence of pedestrian crossings (ZEBRA) or bicycle lanes (BIKE) on the legs, view across the central island (VIEW) and motorized traffic load distribution (LOAD) are not significantly associated with bicycle accident occurrence.
While roundabouts with very small diameter (<24 m) [
5] are suspected to be a safety risk for cyclists [
8,
11], in this study—as in other studies on the subject [
15,
16]—an association of the size of the roundabout (i.e., the inscribed circle radius ICR in this study) with bicycle accident occurrence could not be confirmed. It could be that this parameter is simply too coarse to adequately reflect geometric properties that are critical to bicycle safety. The same might be true for the maximum eccentricity of the legs’ axes: The result with respect to eccentricity might be overturned when accidents are related to specific roundabout legs in a finer grained analysis. Further, the univariate analysis revealed that, statistically speaking, there are no more roundabouts with a minimum of one bicycle accident in the group of roundabouts with bicycle lanes on their entering roadways than among roundabouts without bicycle lanes on their legs. This may indicate that the presence of bicycle lanes is not a relevant feature for bicycle safety at the roundabout. Additionally, this might also show that bicycle lanes are a poor proxy for bicycle traffic.
AWT is a major factor in explaining bicycle accident occurrence in the present dataset. The relation between increasing AWT and the estimated odds ratio is best explained as degressive. These findings are in accordance with existing studies [
8,
16,
23]. There are, however, studies pointing, not to other signs, but to other forms of the relation (i.e., linear or over-proportional [
16]).
The IRAD is, strictly speaking, the only attribute with a significant influence on bicycle accident occurrence that is best interpreted in terms of its geometric property. It becomes critical when AWT is low (c.f.
Figure 1). Its relation to the probability of having at least one accident recorded at a roundabout is inverse: it is highest for small IRAD and lowest for high IRAD, while it does not drop linearly in between the extremes. Considering the relatively small central island radii in the present sample (max. IRAD < 14.1 m), this is in agreement with findings from previous studies [
4,
17,
18], in which the central island radius was also found to be an important factor that leads to a decrease in bicycle safety risk for increasing radii up to about 20 m.
The number of legs (NO_LEG) is the second significant variable with a geometric component: Basically, NOLEG is a categorical variable for the average sector angle. However, the interpretation of this attribute is not straightforward. Even though the number of legs correlates significantly with the minimum sector angle (MIN_SA), the latter was not significantly associated with bicycle accident occurrence in the logistic regression model. Since AWT was included in the model, the coefficients of the NO_LEG variables are not merely a function of higher AWT on roundabouts with more legs. The number of legs could result in different numbers of conflict points at roundabouts with three, four or five legs. The most frequent type of bicycle accident at roundabouts in Switzerland is the collision between a cyclist with the right of way on the circulatory roadway and a motorized vehicle on roundabout entry [
8,
9,
11]. Hence, a three-leg roundabout provides three options for the described collision, while at a five-leg roundabout, there are two more possible collision spots of this type. Other studies also found a positive relation between the number of legs and accident occurrence [
8,
18]. Daniels et al., 2010 [
16] on the other hand, reported an inverse relation for this attribute and combined bicycle and moped accident occurrence. Regarding the geometric component of this variable, it could be argued that having smaller sector angles only becomes an issue on roundabouts that are comparatively small (c.f. [
16]), which is the case in the present sample (c.f. attribute ICR
Table 1).
An interpretation of the effect of roundabout location (LOC, in town vs. out of town) on bicycle accident occurrence, as suggested by the model, is not possible based on the results from this study. In the absence of any further corroborating data, the effect could be due to any sort of underlying cause, such as a differences in driving speeds [
8,
23], a difference in street lighting [
8,
23], different land uses in the surrounding [
8,
23], differences in bicycle traffic volumes [
8], or some other unknown covariate. Variables that are more specific in this regard will have to be included in future analyses.
The data and method on which the presented results are based have some limitations: The main limitation is the lack of information on the year of construction to normalize the number of observed bicycle accidents. This results in questionable assignments of roundabouts to either the group with a lower or the group with a higher bicycle accident occurrence, whereupon, results remain indicative. The same is true, to some extent, with respect to the lack of data on bicycle traffic volumes. Without this variable, a relevant factor in explaining bicycle safety risk [
16] and an important confounding variable with respect to design properties is missing from the study. Its inclusion might change some of the obtained results. While data on the year of construction could potentially be generated from existing data sources, bicycle traffic volume was not recorded in the past and cannot be reconstructed (c.f. [
8]). However, the obtained results are strongly supported by findings from existing studies (particularly [
8]), which suggests that the chosen approach is to the purpose of the presented analysis.
5. Conclusions
This paper details results from a logistic regression analysis of roundabout design and bicycle accident occurrence on a sample of
N = 294 single-lane roundabouts in Switzerland. The sample is characterized by a large number of small- and mini-sized roundabouts. Motorized traffic volume is a major factor in estimated probabilities >0.5 of having at least one accident recorded at a roundabout. Increasing the central island radius decreases the estimated probability at a given traffic volume, while in town location (vs. out of town) and more than three entering roadways increase the estimated probability at a given central island radius and a given traffic volume. The lack of bicycle traffic data entails a degree of uncertainty to these results. However, while motorized traffic volume and in town location, which might functions as a proxy for higher bicycle traffic volumes, do not represent structural properties of roundabouts directly, the central island radius and the number of entering legs clearly shape the layout of a roundabout on a high level and influence geometric properties at finer-grained levels. The size of the central island, for example, likely influences the deviation and speed of the vehicles that enter the roundabout [
33], a factor that was related to roundabout safety previously, e.g., [
1,
8]. With respect to motorized traffic volume [
4,
14,
16,
18] and the central island radius [
4,
18], the presented results match findings from other studies on roundabout bicycle safety. The accordance of findings supports the validity of the results and the acceptability of the methodical approach that was guided by limitations in the dataset. The results also reveal aspects that may point to roundabout type-specific design issues: While small- or mini-sized roundabouts may not generally pose a higher safety risk to cyclists [
16], some geometric properties may only prove problematic in small or mini roundabouts. Whereas the number of legs is related positively to bicycle accident occurrence in the present study, as well as in [
8], a study looking at larger roundabouts found no relation of this property with bicycle accident occurrence [
16]. Similarly, the size of the central island may be more critical in smaller roundabouts, c.f. [
4,
16]. However, there is a need to further substantiate these findings through future studies in which models are used that integrate more geometric and accident location detail, such as in [
1,
13], and in which different types of roundabouts are handled separately. This could help identify the potential of design adjustments to improve roundabout bicycle safety and disentangle the risks that arise from human error [
8].


