Article

Airbnb Offer in Spain—Spatial Analysis of the Pattern and Determinants of Its Distribution

1
Department of Spatial Planning and Tourism, Faculty of Earth Sciences, Nicolaus Copernicus University, 87-100 Toruń, Poland
2
Department of Geography, Faculty of Social Sciences, Umeå University, 901 87 Umeå, Sweden
3
Departamento de Análisis Geográfico Regional y Geografía Física, Facultad de Filosofía y Letras, University of Granada, 18072 Granada, Spain
*
Author to whom correspondence should be addressed.
ISPRS Int. J. Geo-Inf. 2019, 8(3), 155; https://0-doi-org.brum.beds.ac.uk/10.3390/ijgi8030155
Submission received: 28 February 2019 / Revised: 12 March 2019 / Accepted: 15 March 2019 / Published: 22 March 2019

Abstract

:
The rising number of homes and apartments rented out through Airbnb and similar peer-to-peer accommodation platforms cause concerns about the impact of such activity on the tourism sector and property market. To date, spatial analysis on peer-to-peer rental activity has been usually limited in scope to individual large cities. In this study, we take into account the whole territory of Spain, with special attention given to cities and regions with high tourist activity. We use a dataset of about 250 thousand Airbnb listings in Spain obtained from the Airbnb webpage, aggregate the numbers of these offers in 8124 municipalities and 79 tourist areas/sites, measure their concentration, spatial autocorrelation, and develop regression models to find the determinants of Airbnb rentals’ distribution. We conclude that apart from largest cities, Airbnb is active in holiday destinations of Spain, where it often serves as an intermediary for the rental of second or investment homes and apartments. The location of Airbnb listings is mostly determined by the supply of empty or secondary dwellings, distribution of traditional tourism accommodation, coastal location, and the level of internationalization of tourism demand.

Graphical Abstract

1. Introduction

Internet platforms enabling short-term rental of private houses or rooms, called peer-to-peer (P2P) accommodation or homesharing platforms, are an increasingly popular provider of tourist accommodation. The largest of such platforms is Airbnb, with over 5 million rental offers worldwide [1]. After 10 years of its existence, Airbnb has become an important subject of research within tourism and urban studies, as well as within other fields of social sciences. Review papers [2,3,4] and edited books [5,6] outline some of the research topics undertaken in these studies. These include competition between peer-to-peer rentals and traditional hospitality industry [7,8,9,10,11], general contribution to destinations’ economies [12,13,14], social impacts [15,16,17,18], with special attention given to the impact on housing markets [19,20,21,22,23], policy and regulations on P2P rental platforms [24,25,26,27], costumer satisfaction of the service provided [28,29,30] and the impact of these new practices on travel patterns [31].
An interesting body of research focuses on the spatial analysis of the available offer [32,33,34,35]. It allows for a geographical understanding of the phenomenon by providing insight about where it is located and which are the factors that affect its distribution. This knowledge can help to answer the big research questions that have been posed regarding urban vacation rentals and Airbnb: are P2P platforms a competition to the traditional hotel sector or do they complement its offer? Are urban vacation rentals commercialised through P2P platforms contributing to the touristification of city centres? Is it a phenomenon only affecting tourist cities?
To date, the majority of the studies analysing the distribution of Airbnb listings have focused on large cities [23,32,33,34,35,36,37,38]. Although the platform itself claims to contribute to the spreading of tourist activity towards peripheral districts, previously not so much visited by tourists [39], most of the studies to date agree when stating the concentration of Airbnb listings around major tourist attractions [32,33,34,40]. This contributes to further agglomeration of tourism mobility and the potential displacement of residents from central districts [22,23,41].
Quattrone et al. [34] prove the correlation between the number of Airbnb listings and the distance to the city centre in London. They also noticed a relation between the distribution of Airbnb listings and the socioeconomic profile of the neighbourhoods. According to their conclusions, the distribution follows a different pattern according to the type of listings considered: room or house. Airbnb rooms are located in areas populated by highly-educated non-UK born residents, whereas Airbnb houses are located in areas of high housing prices. High spatial concentration of Airbnb listings around city centres and major tourist attractions is confirmed by Gutiérrez et al. for Barcelona [33], Heo et al. for Paris [9] and by Wegmann’s and Jiao’s [27] for five US cities. Other papers support the idea of the complementary role played by peer-to-peer accommodation with respect to hotel supply. Gyódi [37] shows that Airbnb listings are concentrated in different areas to hotels in central districts of Warsaw. In the case of Vienna, Gunter and Önder’s [36] claim that Airbnb rentals complement hotel supply by providing larger, cheap and centrally located accommodation.
Only few studies to date extended the spatial analysis of Airbnb phenomenon outside of the limits of individual cities. There are few comparative studies between cities of Europe [42,43], USA [44], and global capitals [45]. Cesarani and Nechita [46] provide the description of the distribution of Airbnb listings in Italy, pointing at their concentration in the largest cities, coastal areas, around lakes in the north of the country and in rural Tuscany. Strommen-Bakhtiar and Vinogradov [47], and Larpin et al. [48] show how Airbnb has spread from major cities towards tourist regions in Norway and Switzerland. Studies that have looked at the role of P2P accommodation in middle-sized and small towns are also scarce. Di Natale et al. [24] examined Airbnb offer of 237 small cities in Oregon, showing how the intensity of Airbnb activity and perceptions of its impacts differ between cities. Adamiak [42] analysed the numbers and structures of Airbnb listings in European cities over 100,000 inhabitants. This study shows the ubiquity of Airbnb activity, its varied role in the structure of tourism accommodation, and country-specific characteristics of the structures of offers. In addition, it points at the important role that Airbnb plays in smaller cities, particularly in Southern Europe, emphasizing the need for further studies of the impacts of Airbnb activity in these locations.
Together with France and Italy, Spain is one of the most important Airbnb markets in Europe [49]. In addition, Spain is the second largest international tourist destination [50], with a steady increase in the number of foreign visitors in the last years [32,51]. P2P accommodation is an important topic of both academic debate and media discourse in this country [32,33,51,52,53]. Most attention has been given to the impacts of peer-to-peer rental platforms on major cities, mostly Barcelona [32,33,54]. Airbnb activity is blamed to cause gentrification of the city centre through the “collective displacement”, that is the substitution of residential life by tourism [41,55,56]. Segú [57] estimated that Airbnb has contributed to a 4% increase in housing rents in the city between 2009 and 2016. However, Blanco-Romero et al. [15] show that tourism rentals are just one of many factors causing the increase in housing prices.
Similar conclusions about the impacts of Airbnb on urban space have been presented in cases of other Spanish cities: Madrid [16,58], Palma de Mallorca [22,59] and Valencia [60]. Spatial analyses of the Airbnb offer have been conducted for Barcelona [33], Málaga [61], Madrid [58], Valencia [60,62] and in the form of comparative studies including various cities [32,63]. They all agree on the concentration of the Airbnb offers in the city centres and close to the tourist hotspots.
Studies analysing the Airbnb offer in areas other than big cities are rare in Spain, just as in other countries. Coll Ramis et al. [64] studied the Airbnb offer of a small inland municipality of Mallorca (Lloret de Vistalegre), showing the increase in available tourist accommodation since the appearance of peer-to-peer online platforms. The study of Yrigoy [65] describes the growth of tourist accommodation offer on the island of Menorca. It notices a high concentration of Airbnb listings in urban centres, which contrasts with the concentration of traditional tourist rental houses in tourist residential areas. Both studies prove that P2P platforms play an important role in the commercialization of rental apartments in tourist areas. Eugeno-Martin et al. explore the spatial distribution of Airbnb listings in Canary Islands [66]. They found differences between various kinds of tourist areas: sun and beach, nature-based and urban.
In Spanish coastal areas, second homes form an important part of tourism accommodation. Spain is the country with the highest number of second homes in Europe [67]. They are used for private purposes by the owners, but they are also rented out to other tourists using P2P platforms. In this regard, Miranda et al. [68] consider peer-to-peer platforms to be able to offset the negative impacts of residential tourism in these areas: increase the occupancy of dwellings, reduce seasonality and dependence of local economies on construction sector. Outside of Spanish major cities and coastal areas, rural tourism has been growing steadily in the last decades and it is now an important source of income for rural communities [69]. Rural tourism is mainly based on the rental of rural houses for vacation use, which can also be mediated through new P2P platforms as Airbnb [70].
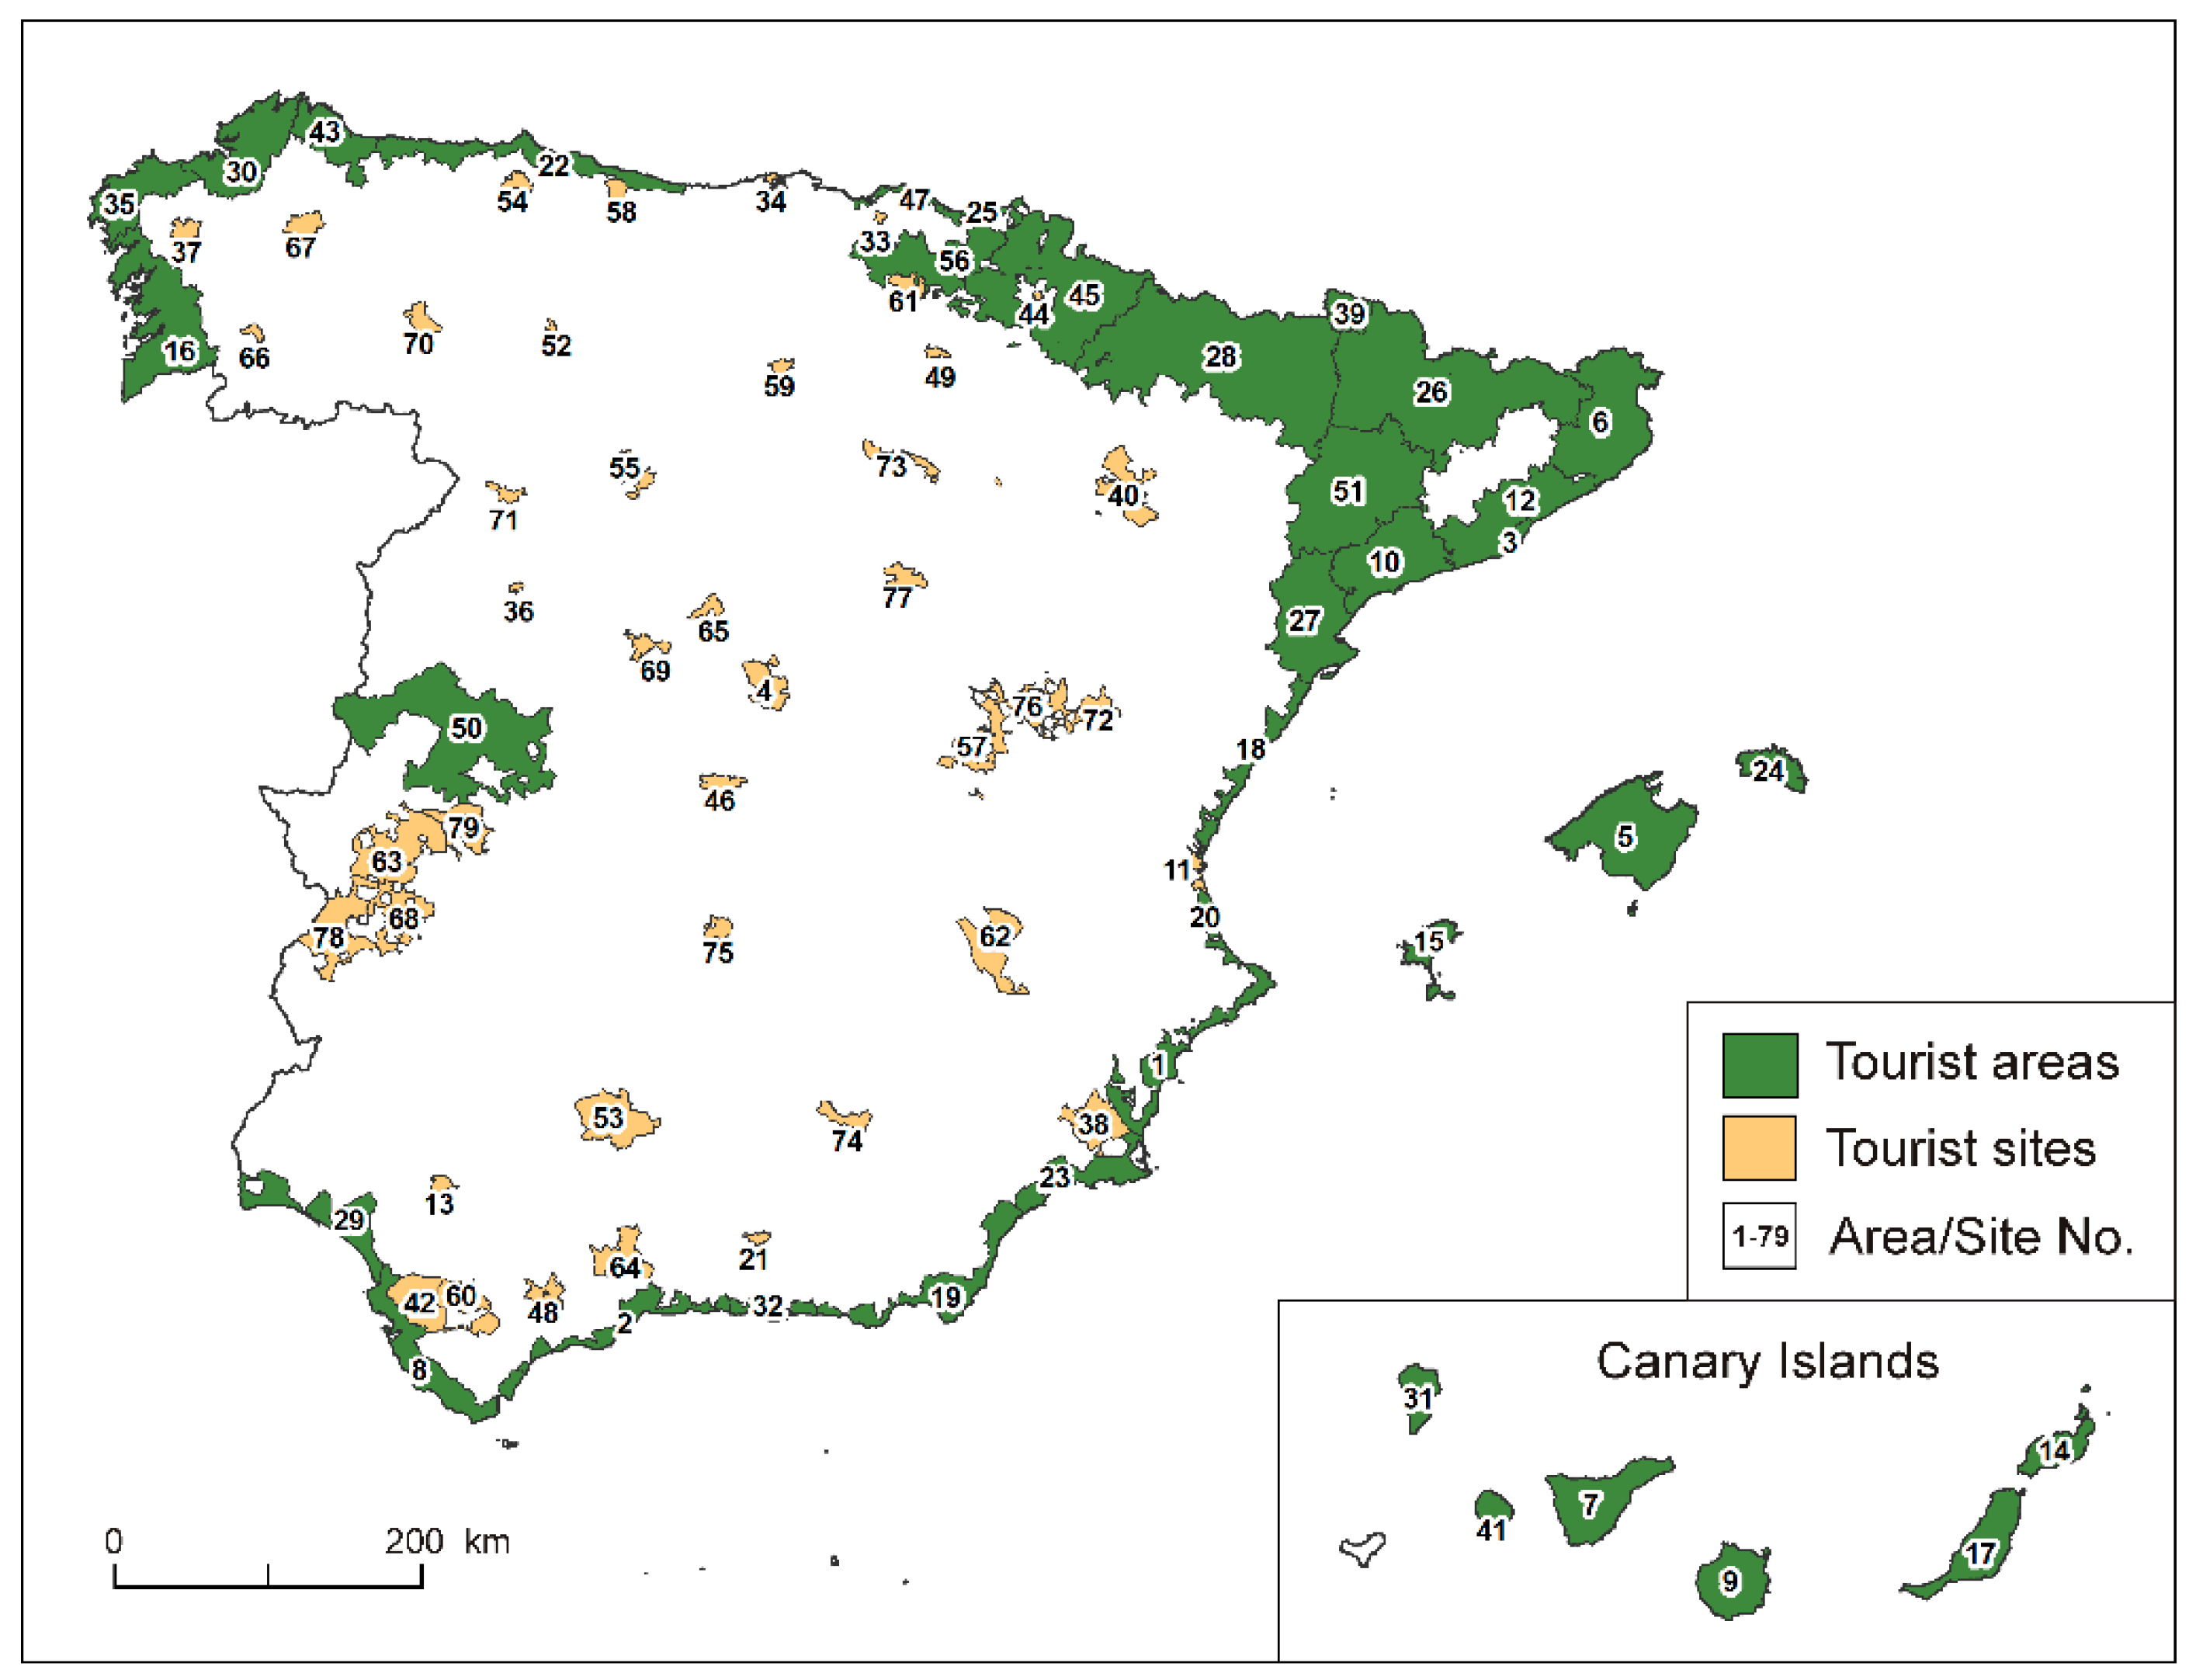
In this paper, we aim to fill the research gaps identified above by providing a spatial analysis of Airbnb listings for entire Spain. We chose this country because of high importance of tourism for its economy, and a vivid academic and popular discussion on the impacts of P2P platforms. The analysis of the entire territory of the country is particularly interesting due to the heterogeneity of models of tourism developed in different parts of Spain, and possible variety of impacts of P2P accommodation on different types of tourist areas.
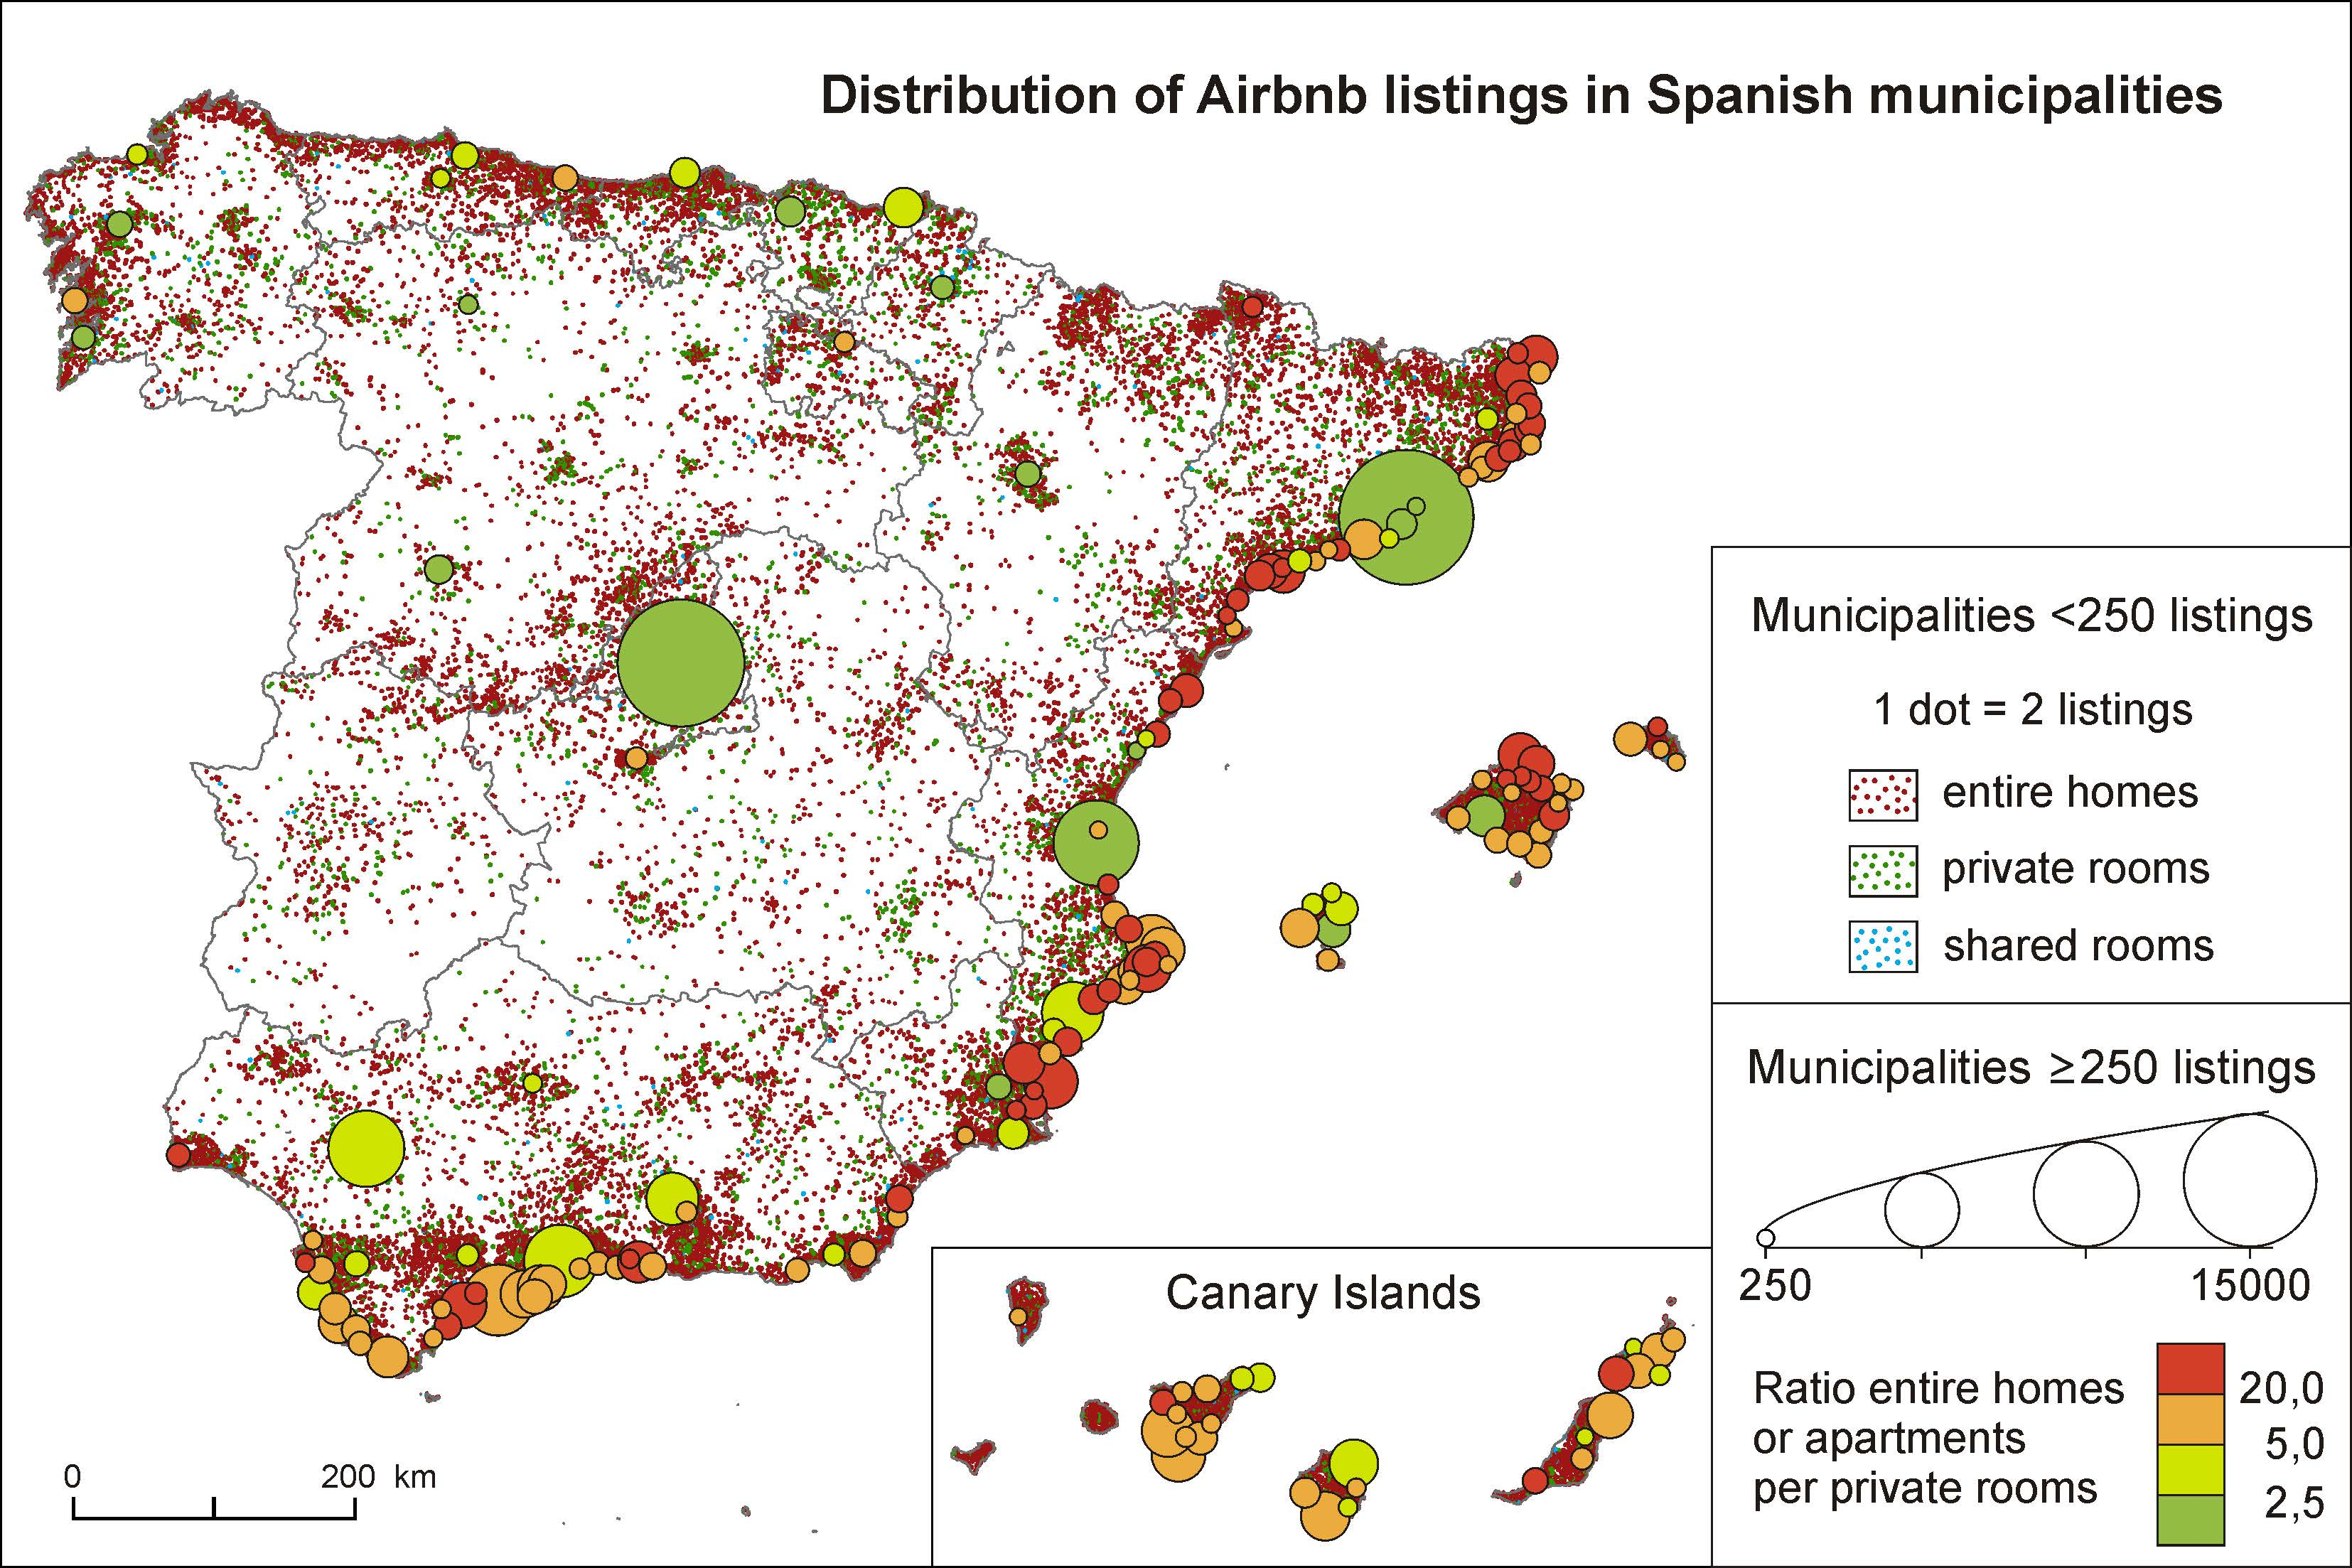
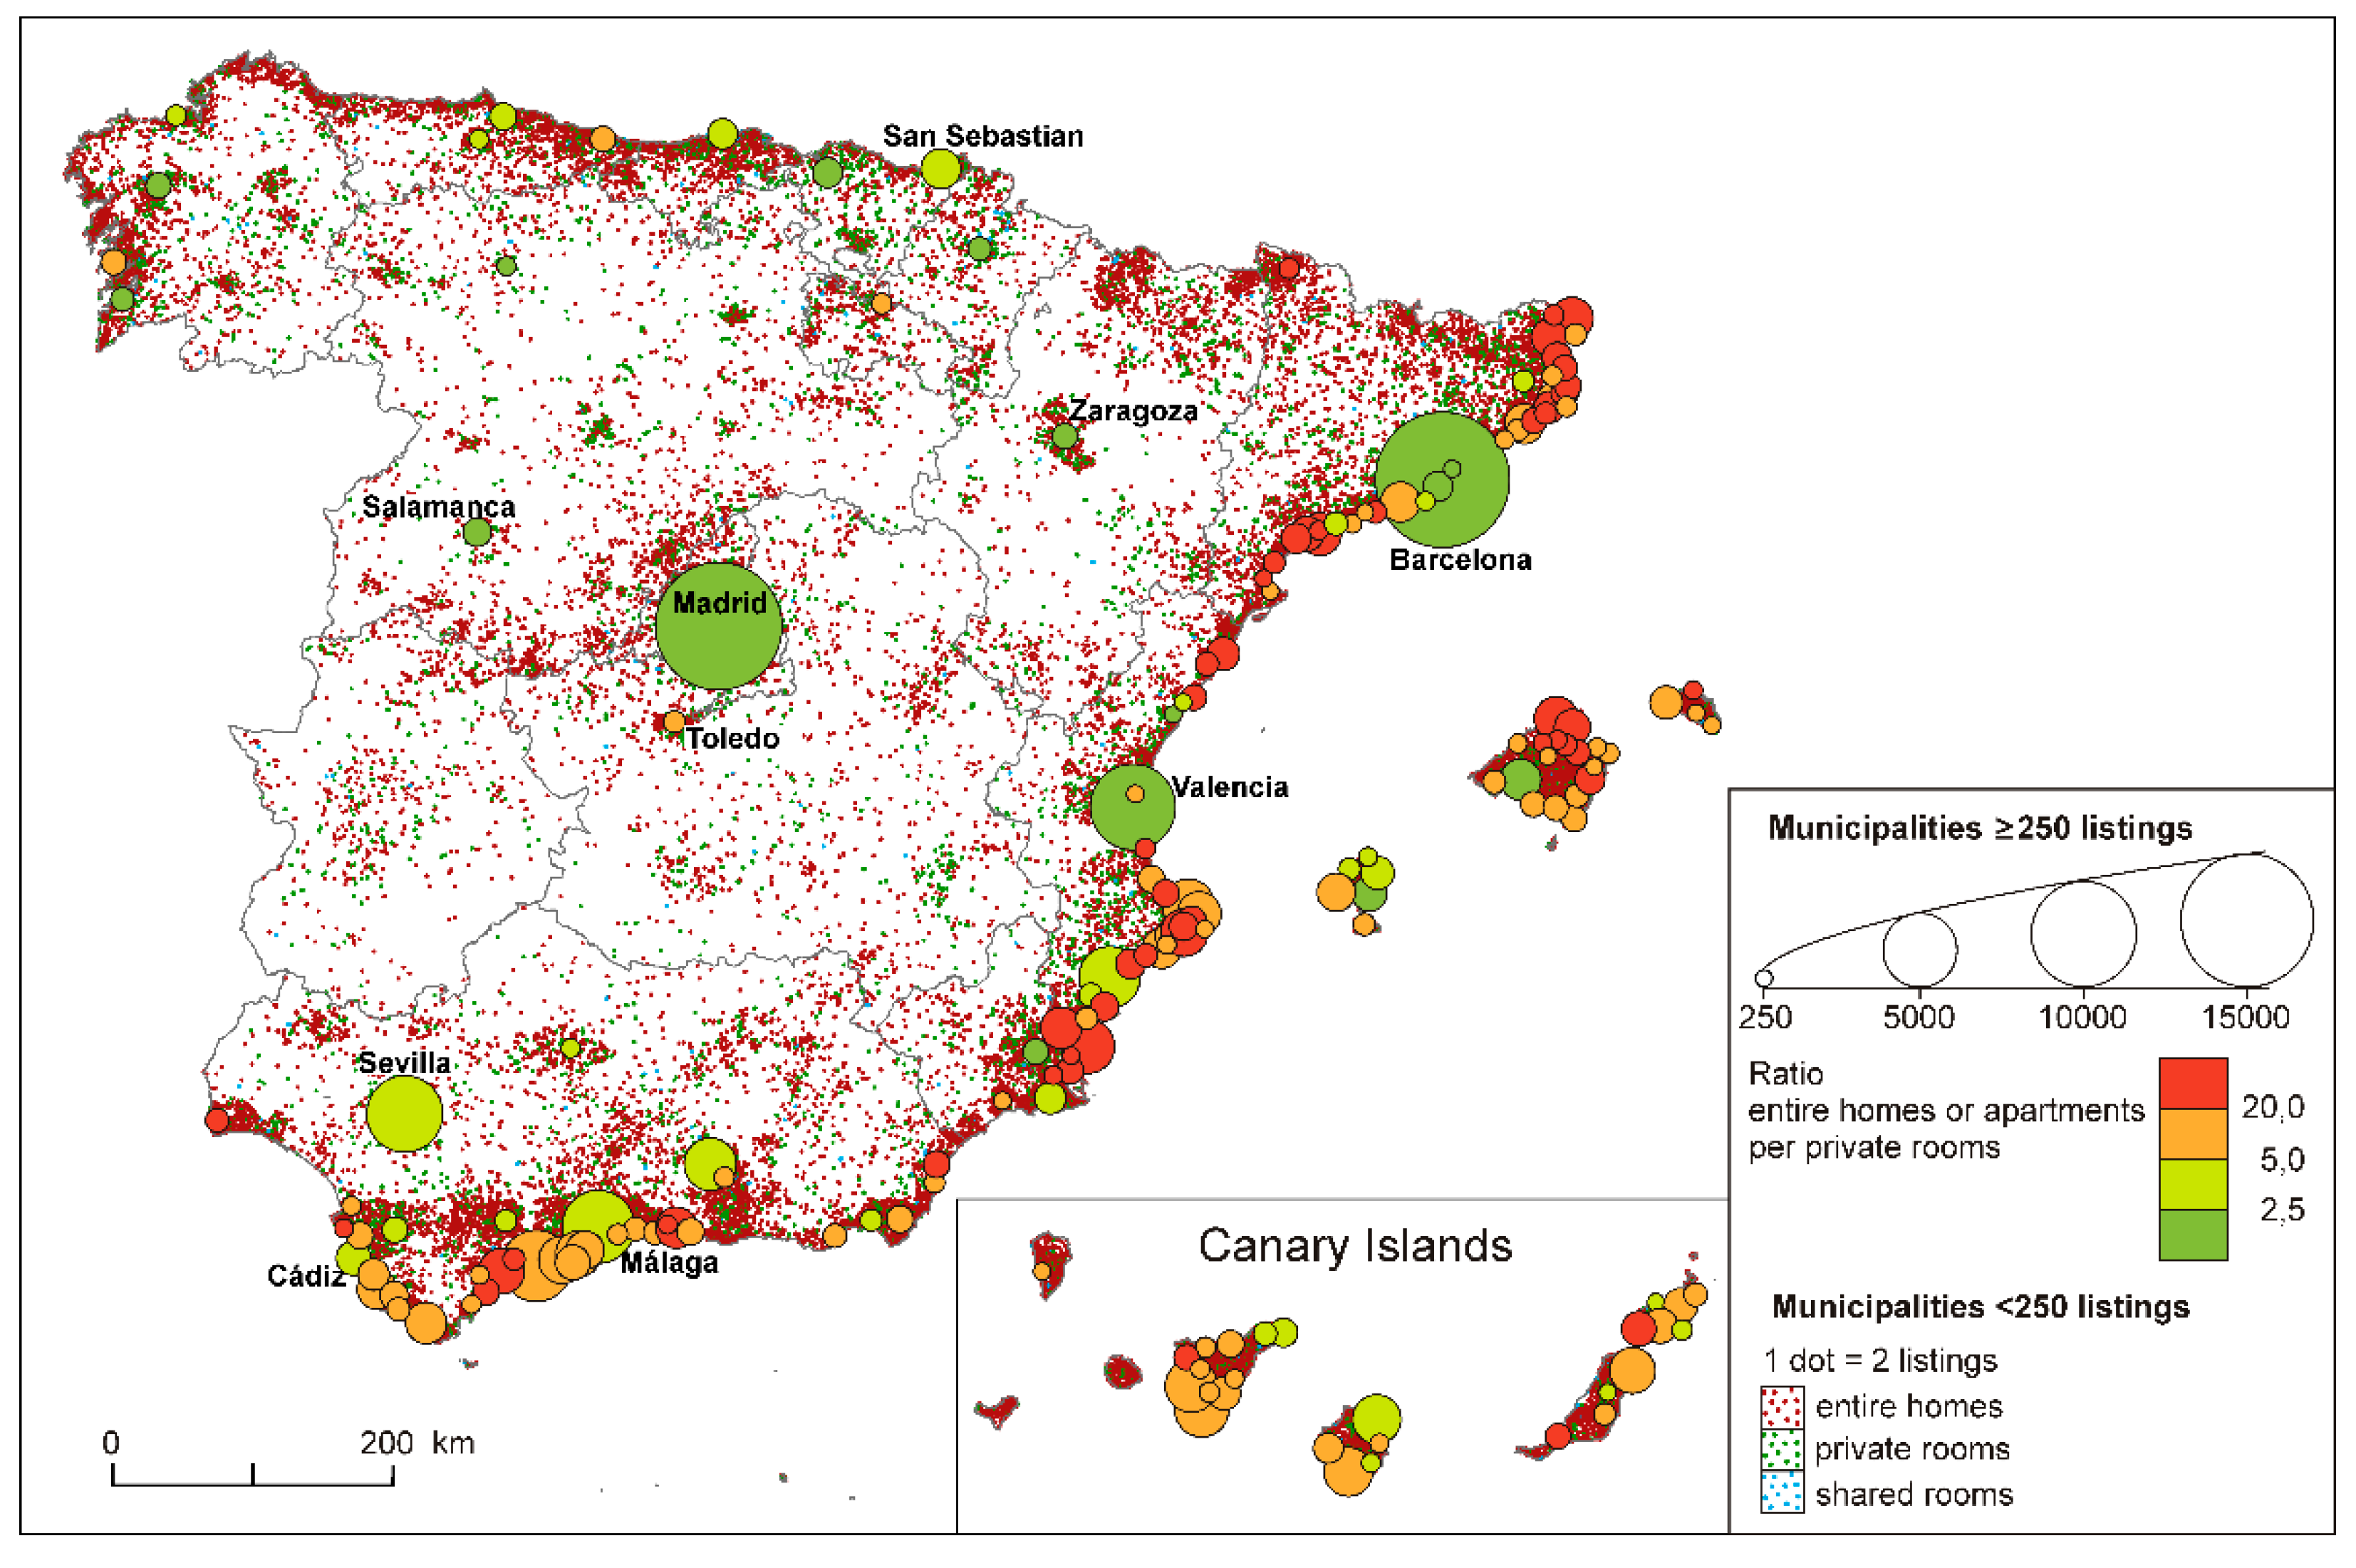
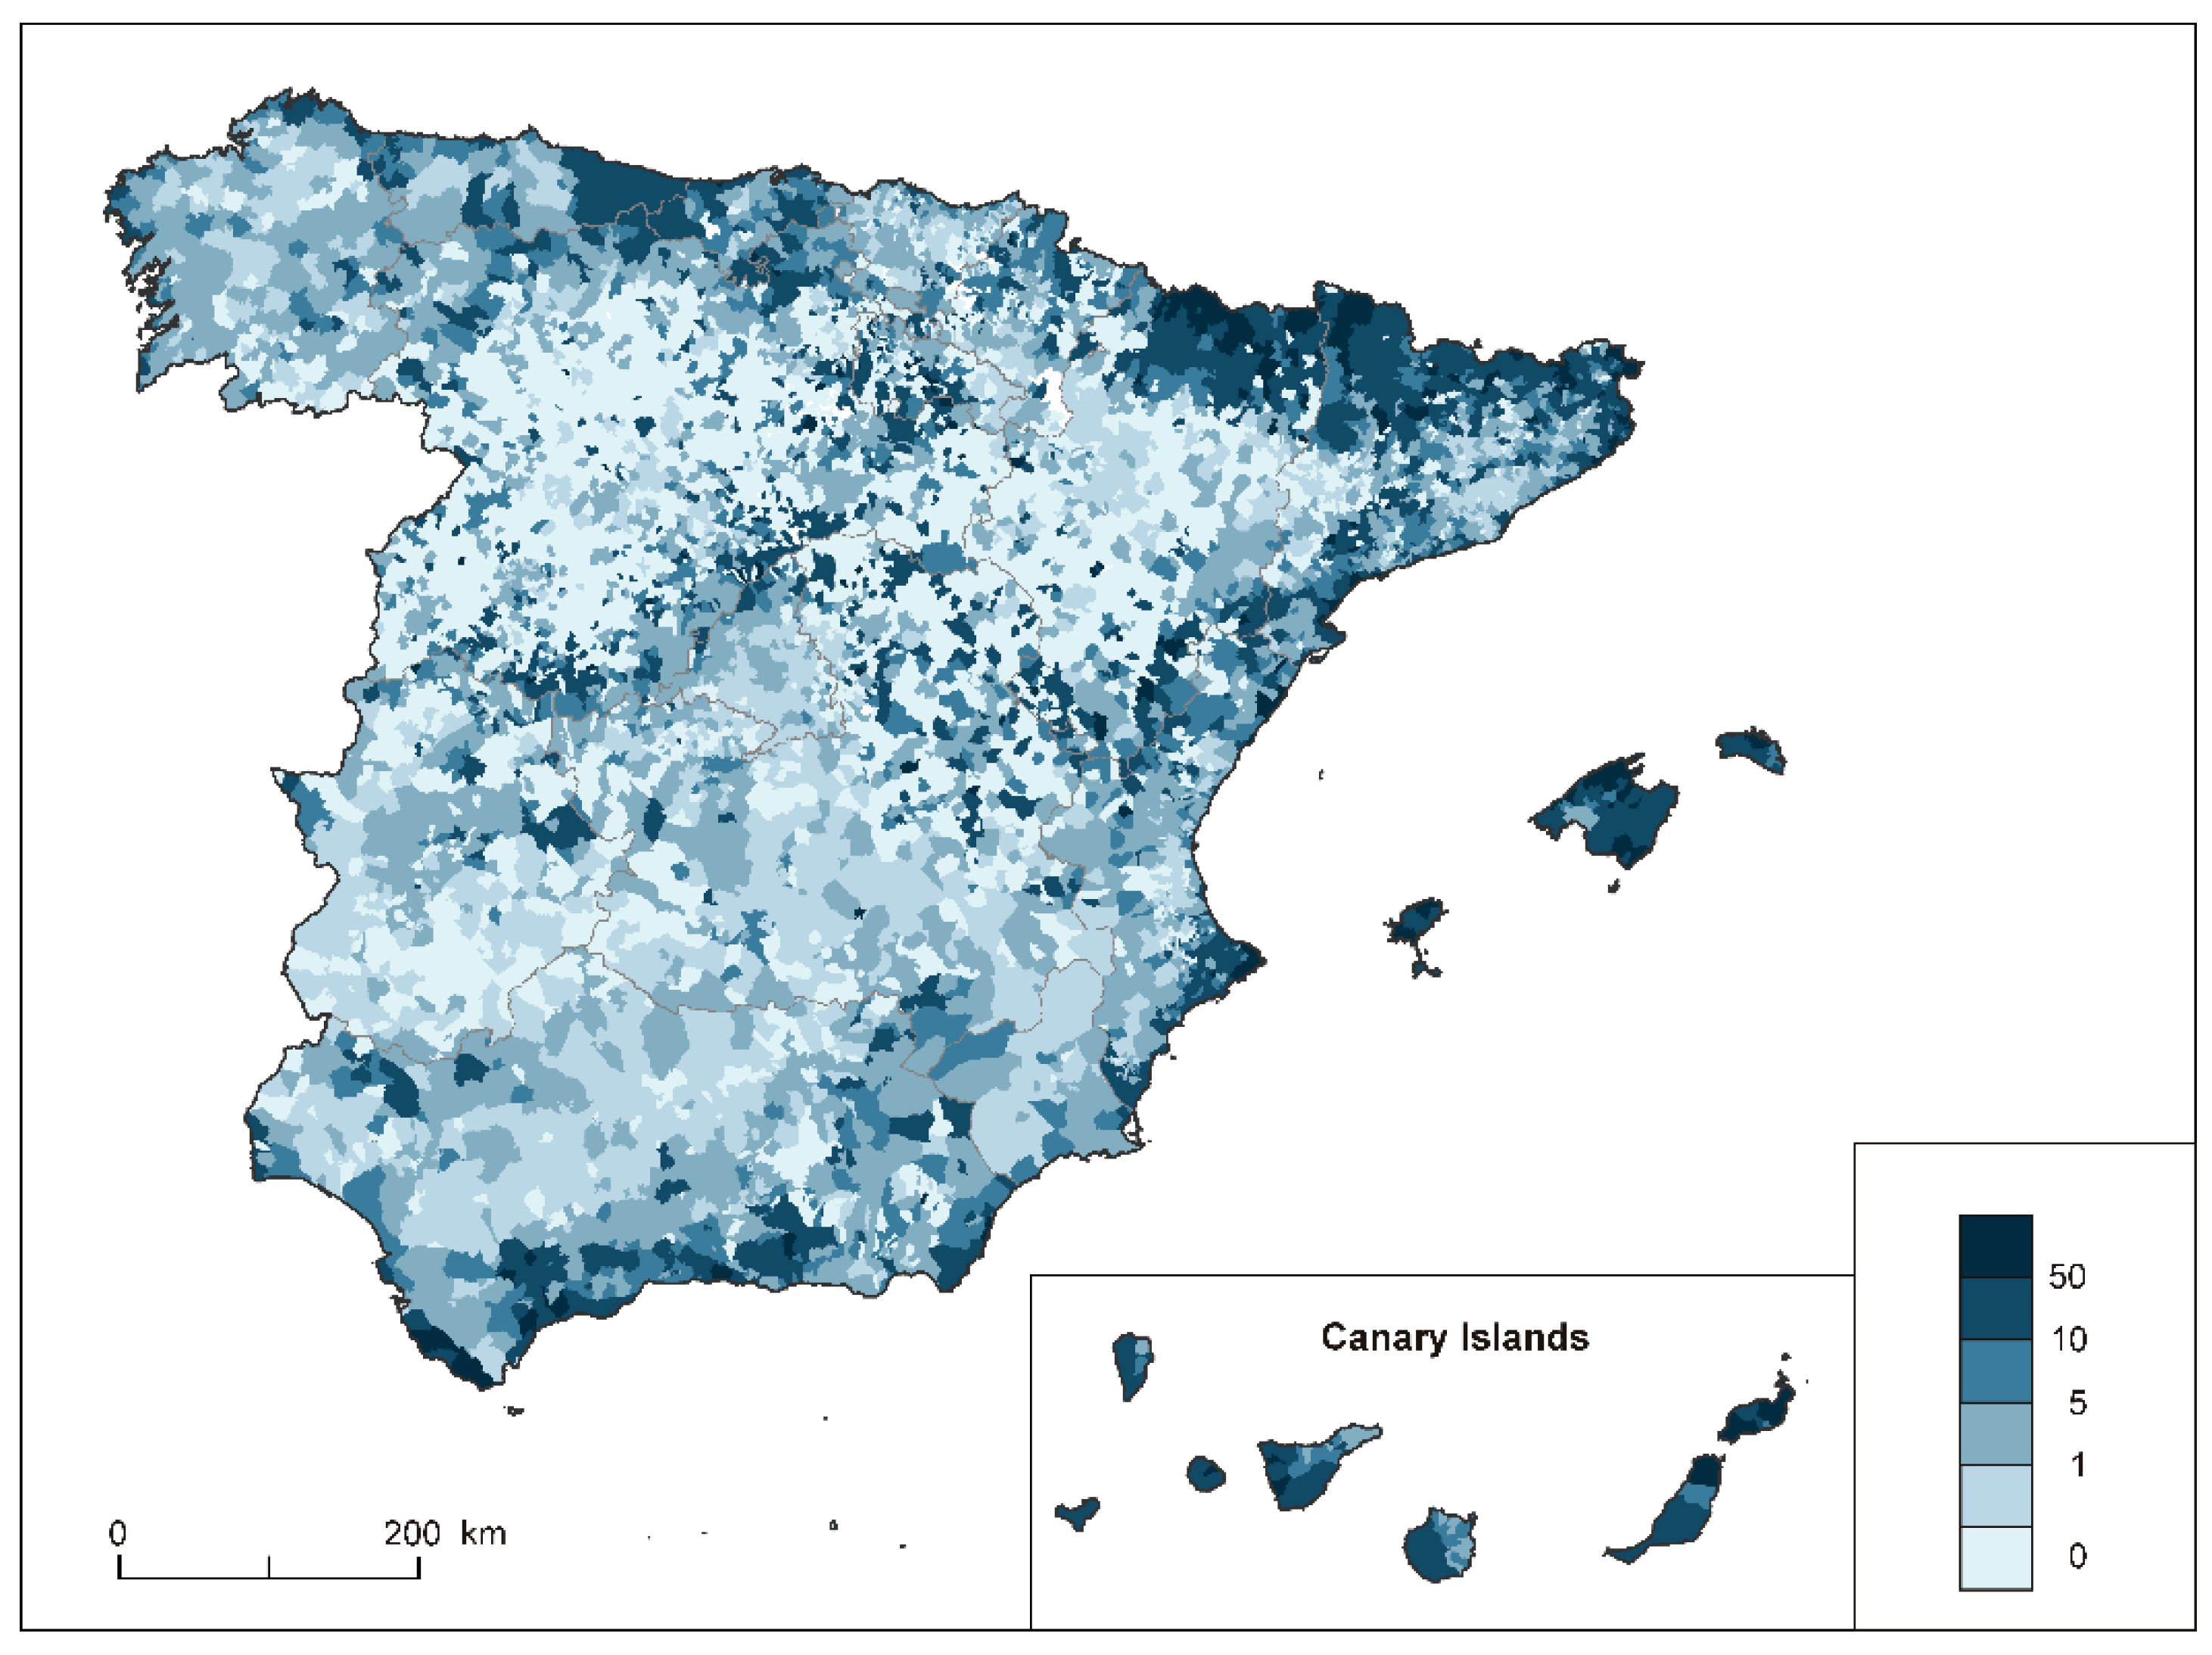
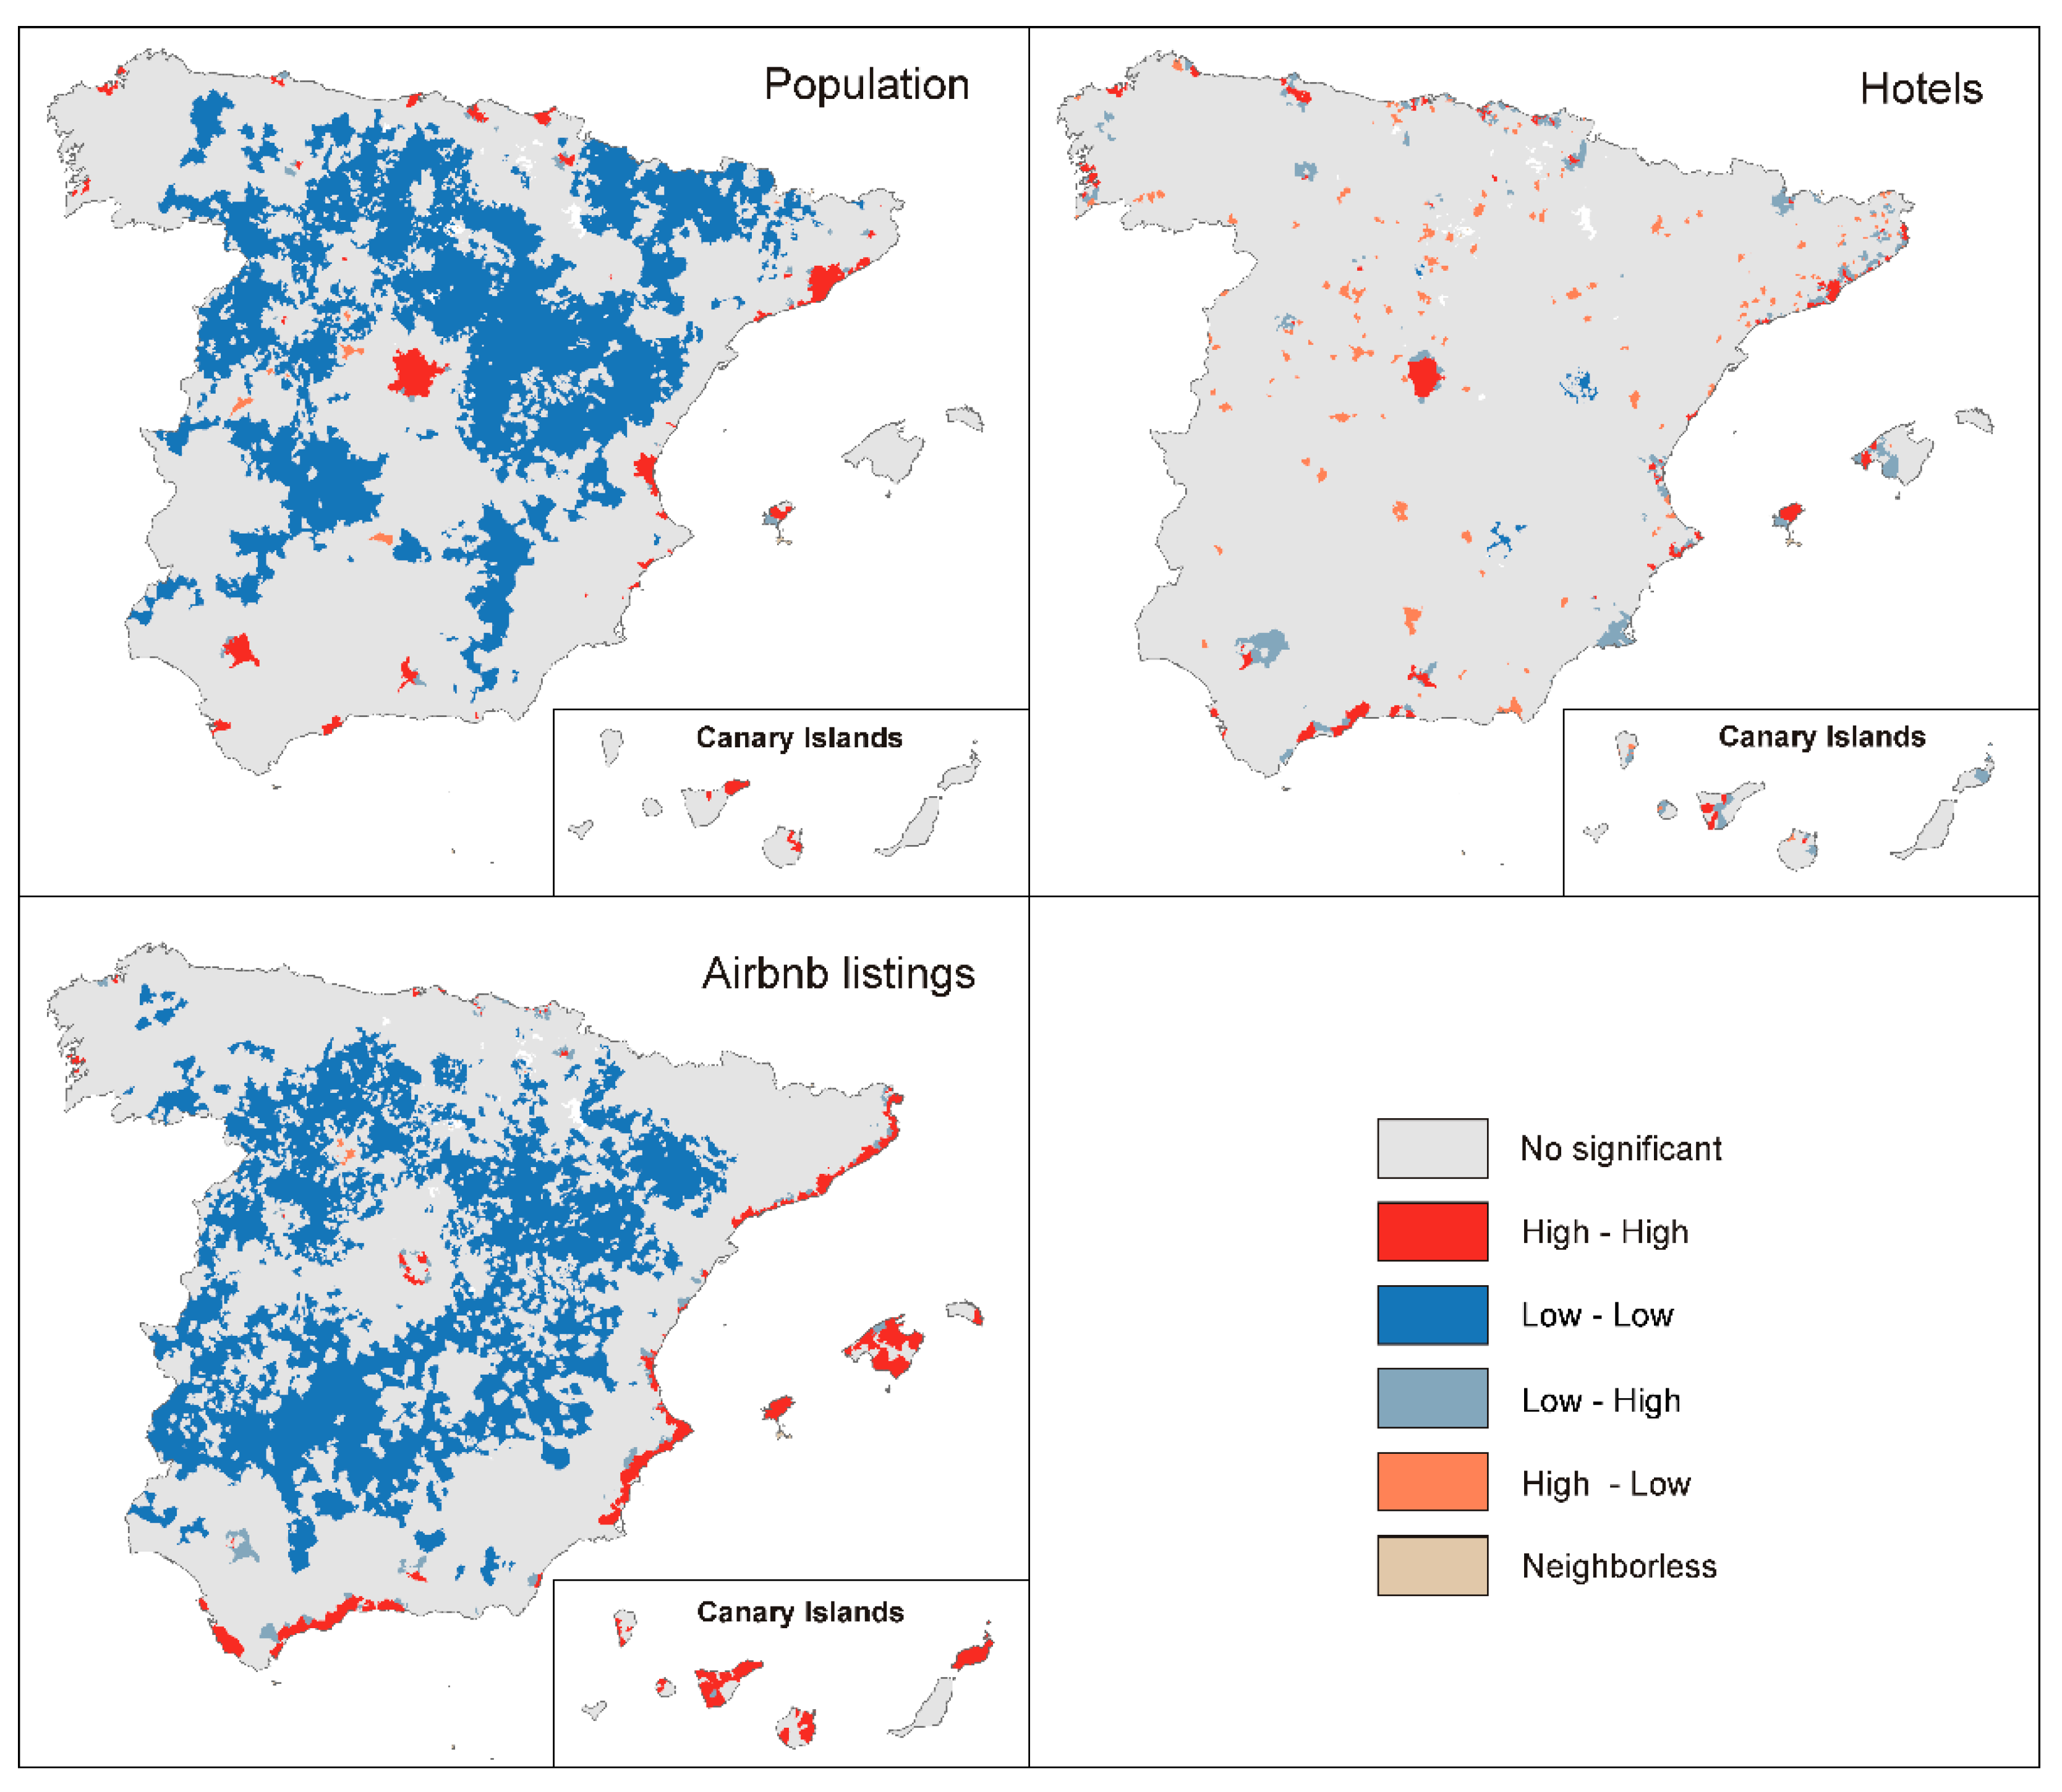
Our empirical analysis consists of two stages. First, we make a comprehensive description of the spatiality of Airbnb supply in Spain. We present the distribution of Airbnb listings in autumn 2018 in the whole country, considering three different types of listings: entire homes/apartments, private rooms and shared rooms. We then compare the distribution of P2P accommodation offer and the hotel supply, as well as measure the spatial concentration and spatial autocorrelation of the density of Airbnb listings in comparison to hotel and housing supply.
In the second stage, we attempt to find the determinants shaping the territorial distribution of Airbnb supply of various kinds employing regression analysis. To this end, we formulate five hypotheses about the possible factors influencing the distribution of Airbnb offers:
  • The location of Airbnb rentals is determined by the number of homes and flats, both used as primary dwellings and nonprimary dwellings, including second homes and vacant homes and flats. In primary dwellings, residents can rent out parts of their home through Airbnb. Nonprimary dwellings can be rented out as entire properties. The higher the number of primary and nonprimary dwellings, the higher the potential number of houses and rooms to rent. Accordingly, we assume a higher concentration of Airbnb accommodation in larger cities, as they have more primary dwellings, and are usually important tourism destinations at the same time [71].
  • Airbnb offer is located in places close to the coastline, which are (apart from major cities) principal leisure tourism destinations in Spain [72]. They also have large stocks of second homes and vacation rentals [73,74].
  • Airbnb offer concentrates in areas attractive to tourists and with already established tourism sector. Therefore, there is a correlation between Airbnb supply and hotel accommodation supply, as proved by other international studies [42].
  • Airbnb serves as an additional supply of accommodation in places where the existing accommodation capacity does not satisfy the demand due to high growth in tourism arrivals or high seasonal variations [42,75].
  • Airbnb is particularly attractive for international tourists, as it provides a familiar system of search and transaction that mitigates the risk of the deal and rates the quality of the product [76]. Accordingly, Airbnb offer is bigger in areas with a high number of international tourists, or areas easily accessible for them because of proximity to airports.
The remaining part of the paper is structured as follows: in Section 2, we present data and methods that we used in the analysis. Detailed description of the procedure of collecting data about Airbnb listings is moved to an appendix. In the next section, we present the results of the analysis: the distribution of Airbnb listings, measures of concentration and spatial autocorrelation, and models explaining their location. Detailed statistics for tourist areas/sites, and supplementary tables describing regression models are placed in appendices. The last part of the paper presents conclusions and discussion of the results.

2. Materials and Methods

2.1. Data

Homesharing platforms, including Airbnb, do not provide public data on numbers and performance of their rentals. However, such information can be obtained from their webpages through web scrapping. For our analysis, we collected Airbnb data using the script published by Tom Slee [77]. In Appendix A, we provided a detailed description of the procedure of data collection, along with the discussion of possible errors, and comparison of various sources of data on Airbnb listings in Spanish cities (Table A1). We performed the data collection in October 2018, and only listings available for rent any time in the following months were saved in our dataset. We created a database containing data on 247,456 Airbnb listings. The scrapped listings are divided into three groups defined by the platform itself: entire homes/apartments (81.7% of all listings in the database), private rooms (17.7%) and shared rooms (0.6%).
To compare Airbnb supply with housing supply and tourism activity, we used data of the Spanish Statistical Office (INE) [78]. We obtained the numbers of population of each municipality for the year 2017 from the Spanish municipal register, and the numbers of dwellings in municipalities from the last population and housing census (2011). We also obtained statistics of the tourist sector (numbers of hotel rooms and hotel guests) from the hotel occupancy survey. It is a continuous survey made on monthly basis by INE. We took into account the latest published data for the year period between October 2017 and September 2018. This data is not available at the municipal level. Hence, we used the lowest available territorial aggregation for this data: tourist areas and sites.
As a proxy of the size of hotel accommodation supply at the municipal level, we used the data obtained from TripAdvisor. This Internet platform aggregates information on hotel offers from several online travel agencies, and its search engine identifies hotels in administrative borders of cities (municipalities). We manually extracted numbers of hotels for each municipality in October 2018.

2.2. Describing the Distribution of Airbnb Listings

Due to the different availability of data, we performed analysis of the distribution of Airbnb listings at two territorial levels: municipalities and tourist areas/sites. In the first approach, we used 8124 Spanish municipalities as units of analysis. They are varied in both area (between 1 km2 and 1751 km2) and population (between 5 persons and 3.2 million inhabitants). We counted Airbnb listings in each municipality using base map of administrative division [79]. At the municipal level, we used TripAdvisor data about the number of hotels as an indicator of tourism accommodation supply.
The second spatial unit of analysis are the tourist areas and sites defined by the Spanish Statistical Office (INE). They are areas with high concentration of tourist activity. Tourist sites are single municipalities, whereas tourist areas consist of multiple municipalities [80]. They do not cover the entire territory of Spain (see Figure A1 in Appendix C). We considered all 37 tourist areas defined by INE. Out of 106 tourist sites covered by INE statistics, we included 42 in our sample. We excluded those which are located within tourist areas, as well as those with small numbers of hotels for which data was protected by INE because of statistic secrecy. In the end, we took into account 79 tourism areas/sites in total.

2.3. Measuring Concentration and Spatial Autocorrelation of Airbnb Listings, Population and Hotel Supply

In order to numerically describe the level of spatial concentration of the supply of housing, hotel and peer-to-peer accommodation in Spanish municipalities, we employed the Hoover index. It is a widely used metric of spatial concentration, popular in population studies [81,82]. It is calculated as half of the sum of differences between shares of accommodation of each territorial unit (pi, where i is the index of territorial unit) in total supply of accommodation in the country (P), and shares of area of each territorial unit in total area of the country (ai and A respectively):
H = ½∑i|piP−1 − aiA−1|
The value of the index equals 0 if the distribution of tourist accommodation is even across the country, and approaches 1 when it is concentrated in one small area. The value of the index can be interpreted as the share of the tourist accommodation that needs to be relocated to other units in order to obtain full uniformity of its distribution.
In an attempt to find out if municipalities with high concentrations of population, hotel and Airbnb offer cluster in specific areas, we used Moran I statistics of global univariate (formula (2)) and local univariate (formula (3)) spatial autocorrelation:
I = NS0−1iΣjwijzizj)(Σizi2)−1
Ii = ziΣjwijzj
where N represents the number of spatial units, i and j are their indexes, z is the deviation from mean (zi = xi x ¯ ), and wij are spatial weights which sum up to S0 (S0 = ΣiΣjwij) [83,84]. The calculation of Moran I depends of the way the spatial weights matrix is defined. In our study, we used the row-standardised queen-style contiguity weights matrix. Seven municipalities were excluded from the spatial autocorrelation analysis, as they do not have any neighbours.
For large samples, univariate global Moran I values higher than 0 indicate positive spatial autocorrelation, i.e., a tendency to cluster together high values in certain areas, and low values in other areas. Calculating univariate local Moran I for each territorial unit enables to produce maps of clusters based on the deviations of the variable values in given territorial unit and neighbouring units from the mean. High-high clusters are those where values for both given unit and neighbouring units are significantly higher than the mean, low-low clusters are the opposite. High-low outliers are areas with relatively high values surrounded by areas with low values, and low-high are the opposite.
Bivariate global and local Moran I enable to find out if the values of one variable in given spatial unit are correlated to the values of the second variable (lagged variable) in neighbouring spatial units. The general formula for global multivariate spatial correlation enables one to compute a variable by variable correlation coefficient matrix M based on data matrix Z including standardised values for n locations by m variables, its transpose ZT, and spatial weights matrix W [85]:
M = ZTWZ
Bivariate local Moran I is calculated similarly to univariate local Moran I, but instead of the values zi and zj of the same variable for different locations, zk,i is calculated based on the value of one variable (xk) in location i, while zl,j is based on the value of the second, lagged, variable (xl) in neighbouring location j [86]:
Ikl,i = zk,iΣjwijzl,j
To calculate spatial autocorrelation measures, we used densities of population, hotels and Airbnb listings per km2. We performed this part of the analysis using GeoDa software [83].

2.4. Finding Factors That Explain the Distribution of Airbnb Listings

In order to identify the factors affecting the distribution of Airbnb listings in Spain, we developed a series of regression models. We built eight models: for each territorial unit of analysis (municipality and tourist areas/sites) and for each type of Airbnb listings (total listings, entire homes/apartments, private rooms, and shared rooms). In municipality models, we used densities of Airbnb listings of given type per square kilometre as explained variables, which helped to deal with data on municipalities of very diverse sizes. In the models for tourist areas/sites absolute numbers of Airbnb listings of given type served as explained variables. To each of the five hypotheses listed in Section 1, we assigned one or more explaining variables in regression models (Table 1). The descriptive statistics for all explained and explaining variables used in the models are presented in Appendix B.
Because of the strongly asymmetric distribution of all explained variables, as well as some explaining variables, we used natural logarithms of their values in the models (Table A2 and Table A3). In each model, we first introduced all explaining variables, and then performed their backward selection: we excluded insignificant factors until obtaining the best quality model measured by the maximum value of adjusted R2 or minimum value of the Akaike Information Criterion (AIC). As several explaining variables in our model tend to be correlated, we also checked for multicollinearity by calculating variance inflation factors (VIF).
The values of Airbnb supply in municipalities are spatially autocorrelated (see Section 3.2). To remove the effect of spatial autocorrelation from model results, we included spatially lagged values of dependent variable as an explaining variable, thus creating spatial lag models [88,89] (also termed spatial autoregressive models [90]):
y = ρWy + Xβ + ε
Apart from simple linear model elements: dependent variable y, matrix of independent variables X, parameters vector β, and error term ε, the formula includes spatial weights matrix W (from row-standardised queen-style contiguity weights matrix), and spatial autoregressive parameter ρ (positive values denote a positive autocorrelation independent of explaining variables). In spatial lag models, we also excluded 7 municipalities which do not have any neighbours. We developed the models using R software with spdep [91] and regclass [92] packages.
For tourist areas/sites, we developed simple linear models not including the spatial effects. We did so because it was impossible to create a meaningful spatial weights matrix both based on neighbourhood (40 out of 79 units have no neighbours) and distance (sizes of units are very diverse, and geodesic distance may differ considerably from actual accessibility, e.g., in the case of islands).

3. Results

3.1. Distribution of Airbnb Listings

Out of 8124 Spanish municipalities, 4882 (60.1%) have at least one Airbnb listing, but most of municipalities have only a few of them. Airbnb offers are most numerous in large cities, as well as in municipalities located on the Mediterranean coast and in the Canary and Balearic Islands. In raw numbers, there are 1500 municipalities with 10 listings or more, 178 municipalities with at least 250 listings, and 45 municipalities with 1000 listings or more (Table 2).
Map of the distribution of Airbnb listings (Figure 1) shows their concentration in large cities and in the areas with high tourist activity. A strip of municipalities with high numbers of listings stretches along the entire Mediterranean coast of Spain, as well as the coast of Cádiz. Apart from the largest coastal cities (Barcelona and Valencia), the quantity of listings is particularly high in the regions of Costa Brava (Catalonia), Costa Blanca (Valencia) and Costa del Sol (Málaga), as well as in the archipelagos: Canary Islands and Balearic Islands. All of them are popular sun-and-beach tourism destinations. In the northern part of Spain, the concentration of Airbnb listings is remarkable in traditional tourist areas of Sansenxo (Galicia) and San Sebastián (Basque Country).
Beyond coastal areas, Airbnb listings concentrate in mountain tourist destinations: Pyrenees, Sierra de Guadarrama, Sierra Nevada and Picos de Europa. All these areas are protected as national parks. The total numbers of offers are not as big there as in the cities and coastal municipalities, but they sprawl over large areas. The common form of accommodation in these places are spatially dispersed rural houses. Besides coastal and mountain areas, Airbnb offers are located in cities, particularly the largest ones: Barcelona, Madrid, Valencia, Sevilla and Málaga (Appendix C). Significant numbers of listings are also located in interior cities with important administrative and economic functions (e.g., Zaragoza), and in smaller cities with high numbers of tourist visits (e.g., Salamanca, Toledo).
There are some differences in the distribution of Airbnb listings of different types. Private rooms are particularly numerous in cities. In Barcelona, there is almost the same number of private rooms as entire properties. Traditional university cities, such as Salamanca or Santiago de Compostela, also have high proportion of private rooms. On the other hand, entire homes or apartments dominate in leisure tourist areas, especially in those areas where the tourist model has been historically oriented to second homes. In these cases, entire properties usually represent more than 90% of all listings (Appendix C). Similar structure characterises rural and mountain areas.
The distribution of absolute numbers of Airbnb listings may be misleading, since it is highly correlated with the distribution of population and housing. In Figure 2, we present the number of Airbnb listings per 1000 inhabitants in Spanish municipalities. These values are not the highest in the largest cities anymore. High numbers of listings per capita characterise coastal, mountain and rural leisure tourism areas. In Madrid and other major urban areas, the numbers of Airbnb listings per capita are similar or lower than the values for Pyrenees, Sierra Nevada, Sierra de Guadarrama mountains located north-west from Madrid metropolitan area, and eastern Asturias with popular tourist areas: Picos de Europa and Llanes. These regions, as well as many coastal areas, have low density of permanent population and their economies are highly reliant on tourism. High per capita numbers of Airbnb listings in such areas show that P2P rental accommodation is not only important for urban tourism.
The analysis of the distribution of Airbnb offers in tourist areas/sites shows the same distribution patterns as the municipal study (Figure 3, Table A4 in Appendix C). This territorial aggregation also allows us to compare the numbers of Airbnb listings with the capacity of hotel accommodation. In all tourist areas/sites combined, there are 218,222 Airbnb listings, which supplement the capacity of 765,532 hotel rooms. There are on average 285 listings per 1000 hotel rooms. In fact, the capacity of Airbnb properties is higher than this ratio suggests, as one listing can accommodate 4.83 persons on average (based on our web-scrapped database on listings), while hotel rooms house 2.09 persons on average (based on INE hotel occupancy survey). On the other hand, Airbnb places are probably less frequently occupied than hotel rooms.
The results show that the ratio of Airbnb listings per hotel rooms is high along the coasts, both in the Cantabrian and Mediterranean coasts. Costa del Sol (Málaga) and Costa Blanca (Comunitat Valenciana), both important residential tourism areas, are characterised by exceptionally high values of this proportion (over 500 Airbnb listings per 1000 hotel rooms). In the archipelagos, particularly in the Balearic Islands, Airbnb listings represent a lower share in the total accommodation capacity, due to very high numbers of hotels rooms. The exceptions are the islands of La Palma and La Gomera in Canary Islands, with high numbers of Airbnb listings compared to hotel rooms. In inland Spain, the proportion is usually lower than in coastal areas, even in the case of Madrid (323.6 Airbnb listings per 1000 hotel rooms).

3.2. Concentration and Spatial Autocorrelation of Airbnb Listings, Population and Hotel Supply

The Hoover index values prove the spatial concentration of population, hotel capacity and Airbnb listings in certain areas of the country (Table 3). The degree of concentration of traditional tourism accommodation is higher than of population. Nonprimary dwellings are more dispersed than primary dwellings across the country, because of a high number of nonpermanently inhabited rural houses, being a relic of historical, more dispersed distribution of population. Hotels and Airbnb listings have a similar degree of concentration. Nevertheless, there are some differences in the levels of concentration of different types of listings. Shared rooms are much more concentrated that entire homes/apartments, and private rooms are relatively dispersed.
Values of univariate global Moran I calculated for densities of population, two types of dwellings, hotels and Airbnb listings show that all of them have a significant tendency to cluster in certain areas (Table 4). Population and the distribution of primary dwellings are most strongly spatially autocorrelated. The lowest value of Moran I for the density of hotels is a result of a high number of municipalities with no hotels. The locations of clusters of high population, hotel and Airbnb listing density differ between each other (Figure 4). Population is clustered in major metropolitan areas, with low population clusters in large areas of inland Spain, including some mountainous areas like the Pyrenees. Hotel clusters are also located in major metropolitan areas as well as in important tourist coastal destinations, such as the Costa del Sol. Airbnb listings are clustered in the coastal strips of municipalities, and the archipelagos, i.e., the main sun and beach destinations of Spain. Nevertheless, important urban and metropolitan destinations, such as Madrid or Granada, are also marked as Airbnb listing clusters.
The values of bivariate Moran I inform if the values of one variable are correlated with spatially lagged values of another variable. Table 5 shows that the distribution of hotels is spatially correlated with the distribution of population, and the distribution of Airbnb listings is spatially correlated with the distribution of both population and hotels. Cluster maps based on bivariate local Moran I make it possible to find out clusters of co-occurrence and outliers of spatial disparity between the variables (Figure 5). They confirm our previous observations. Hotels tend to be located in the same metropolitan clusters as the population, but many positive outliers (high density of hotels surrounded by low population density) are located in middle-size cities. Clusters of co-occurrence of Airbnb listings with population are present in metropolitan areas and some coastal parts of the country. Positive outliers (high density of Airbnb listings surrounded by low population density) are located in the Pyrenees, and negative outliers (low density of Airbnb listings surrounded by high population density) are present in suburban municipalities near big cities. Comparison between Airbnb listing density and spatially lagged hotel density shows that these two variables form common clusters. Still, there are many municipalities in the coastal regions, which have relatively high density of Airbnb listings, and are surrounded by areas with low density of hotels.

3.3. Factors Affecting the Distribution of Airbnb Listings

After developing four simple regression models at the municipal level, the majority of the explaining variables proved to significantly affect the dependent variables (Table A5 in Appendix D). This is partially a result of a large sample size. Despite correlation between various explaining variables, VIF values below 5 (Table A6 in Appendix D) show that multicollinearity does not bias our models [93]. Spatial lag models reveal the high impact of spatial autocorrelation (positive and statistically significant ρ values). Initial spatial lag models are presented in Table A7, and final models in Table 6.
The results confirm the hypotheses of the impact of supply of apartments not used as primary dwellings, proximity to the principal tourism amenity of the sea coast, and presence of traditional tourism accommodation (hotels). Positive impact of the accessibility for international tourists measured by proximity to airports, which is visible in simple linear models (negative coefficient means that the further from the airport, the lower the number of Airbnb listings), was hidden under the autocorrelation effect in spatial lag models. An unexpected outcome is the negative and significant independent impact of the number of primary dwellings (though weaker than the positive impact of the number of nonprimary dwellings). This can be attributed to the influence of urban and suburban municipalities with high population, prevalence of primary dwellings and low tourism interest.
The municipal model for entire properties reflects the results of the one for total number of listings. In the model for private rooms, the number of primary dwellings becomes an independent factor positively affecting the results, which corroborates the hypothesis about the influence of supply of permanent residences on the number of rooms rented on Airbnb. According to the third model, numbers of hotels and nonprimary dwellings significantly positively affect the density of shared rooms.
Models for tourist areas/sites allow taking into account several new variables based on the data extracted from the hotel occupancy survey made by INE: number and occupancy of hotel rooms, seasonality of tourism and share of international tourists. Initial models with all variables included proved the need for limiting their sets in order to rid explaining variables with no significant effects (Table A8 in Appendix D). We should note, however, that besides low effect sizes, the much smaller sample in this set of models increased the significance thresholds for variables. Log-transformed numbers of primary and nonprimary dwellings are highly correlated (r = 0.911) causing VIF values reach 11.6. To avoid the problem of multicollinearity, we chose only one of these two variables (the one with higher absolute t value) for each model. After that, VIF analysis shows that coefficient estimates should not be biased by multicollinearity (Table A9 in Appendix D).
Final models for tourist areas/sites confirm the results obtained using data for municipalities (Table 7). The total number of listings is significantly positively affected by the amount of available nonprimary houses, coastal location, number of hotel rooms and the proximity to airports. Out of two variables added to the models to verify the hypothesis about the shortage of hotel capacity as a driver of Airbnb presence, neither tourism seasonality, nor occupancy ratio have an independent significant effect. New models confirmed that the number of Airbnb listings is positively affected not only by the accessibility for international tourist measured as negative distance to the nearest airport, but also by the actual share of international tourists in overall number of tourists.
There are differences in the sets of factors affecting the distribution of each of the three kinds of Airbnb accommodation in tourist areas/sites. As we expected, private rooms are more numerous in the areas of high supply of permanent dwellings. Unlike in the municipalities model, the effect of the number of primary dwellings is stronger than the effect of the number of nonprimary dwellings. Coastal location strongly affects the distribution of entire properties, but not private rooms. The model for private rooms includes occupancy of hotel rooms and seasonality (the latter variable is also present in the model for shared rooms), but the effect is the opposite of what we assumed: low occupancy and seasonality lead to the increase in private room supply. Proximity to airport significantly affects the distribution of private rooms, while its impact on the number of entire homes/apartments does not reach the statistical significance threshold. A similar pattern can be observed in case of the share of international tourists. These differences stem from the fact that entire properties are more concentrated in vacation coastal locations, while rooms tend to be more often located in cities.

4. Discussion and Conclusions

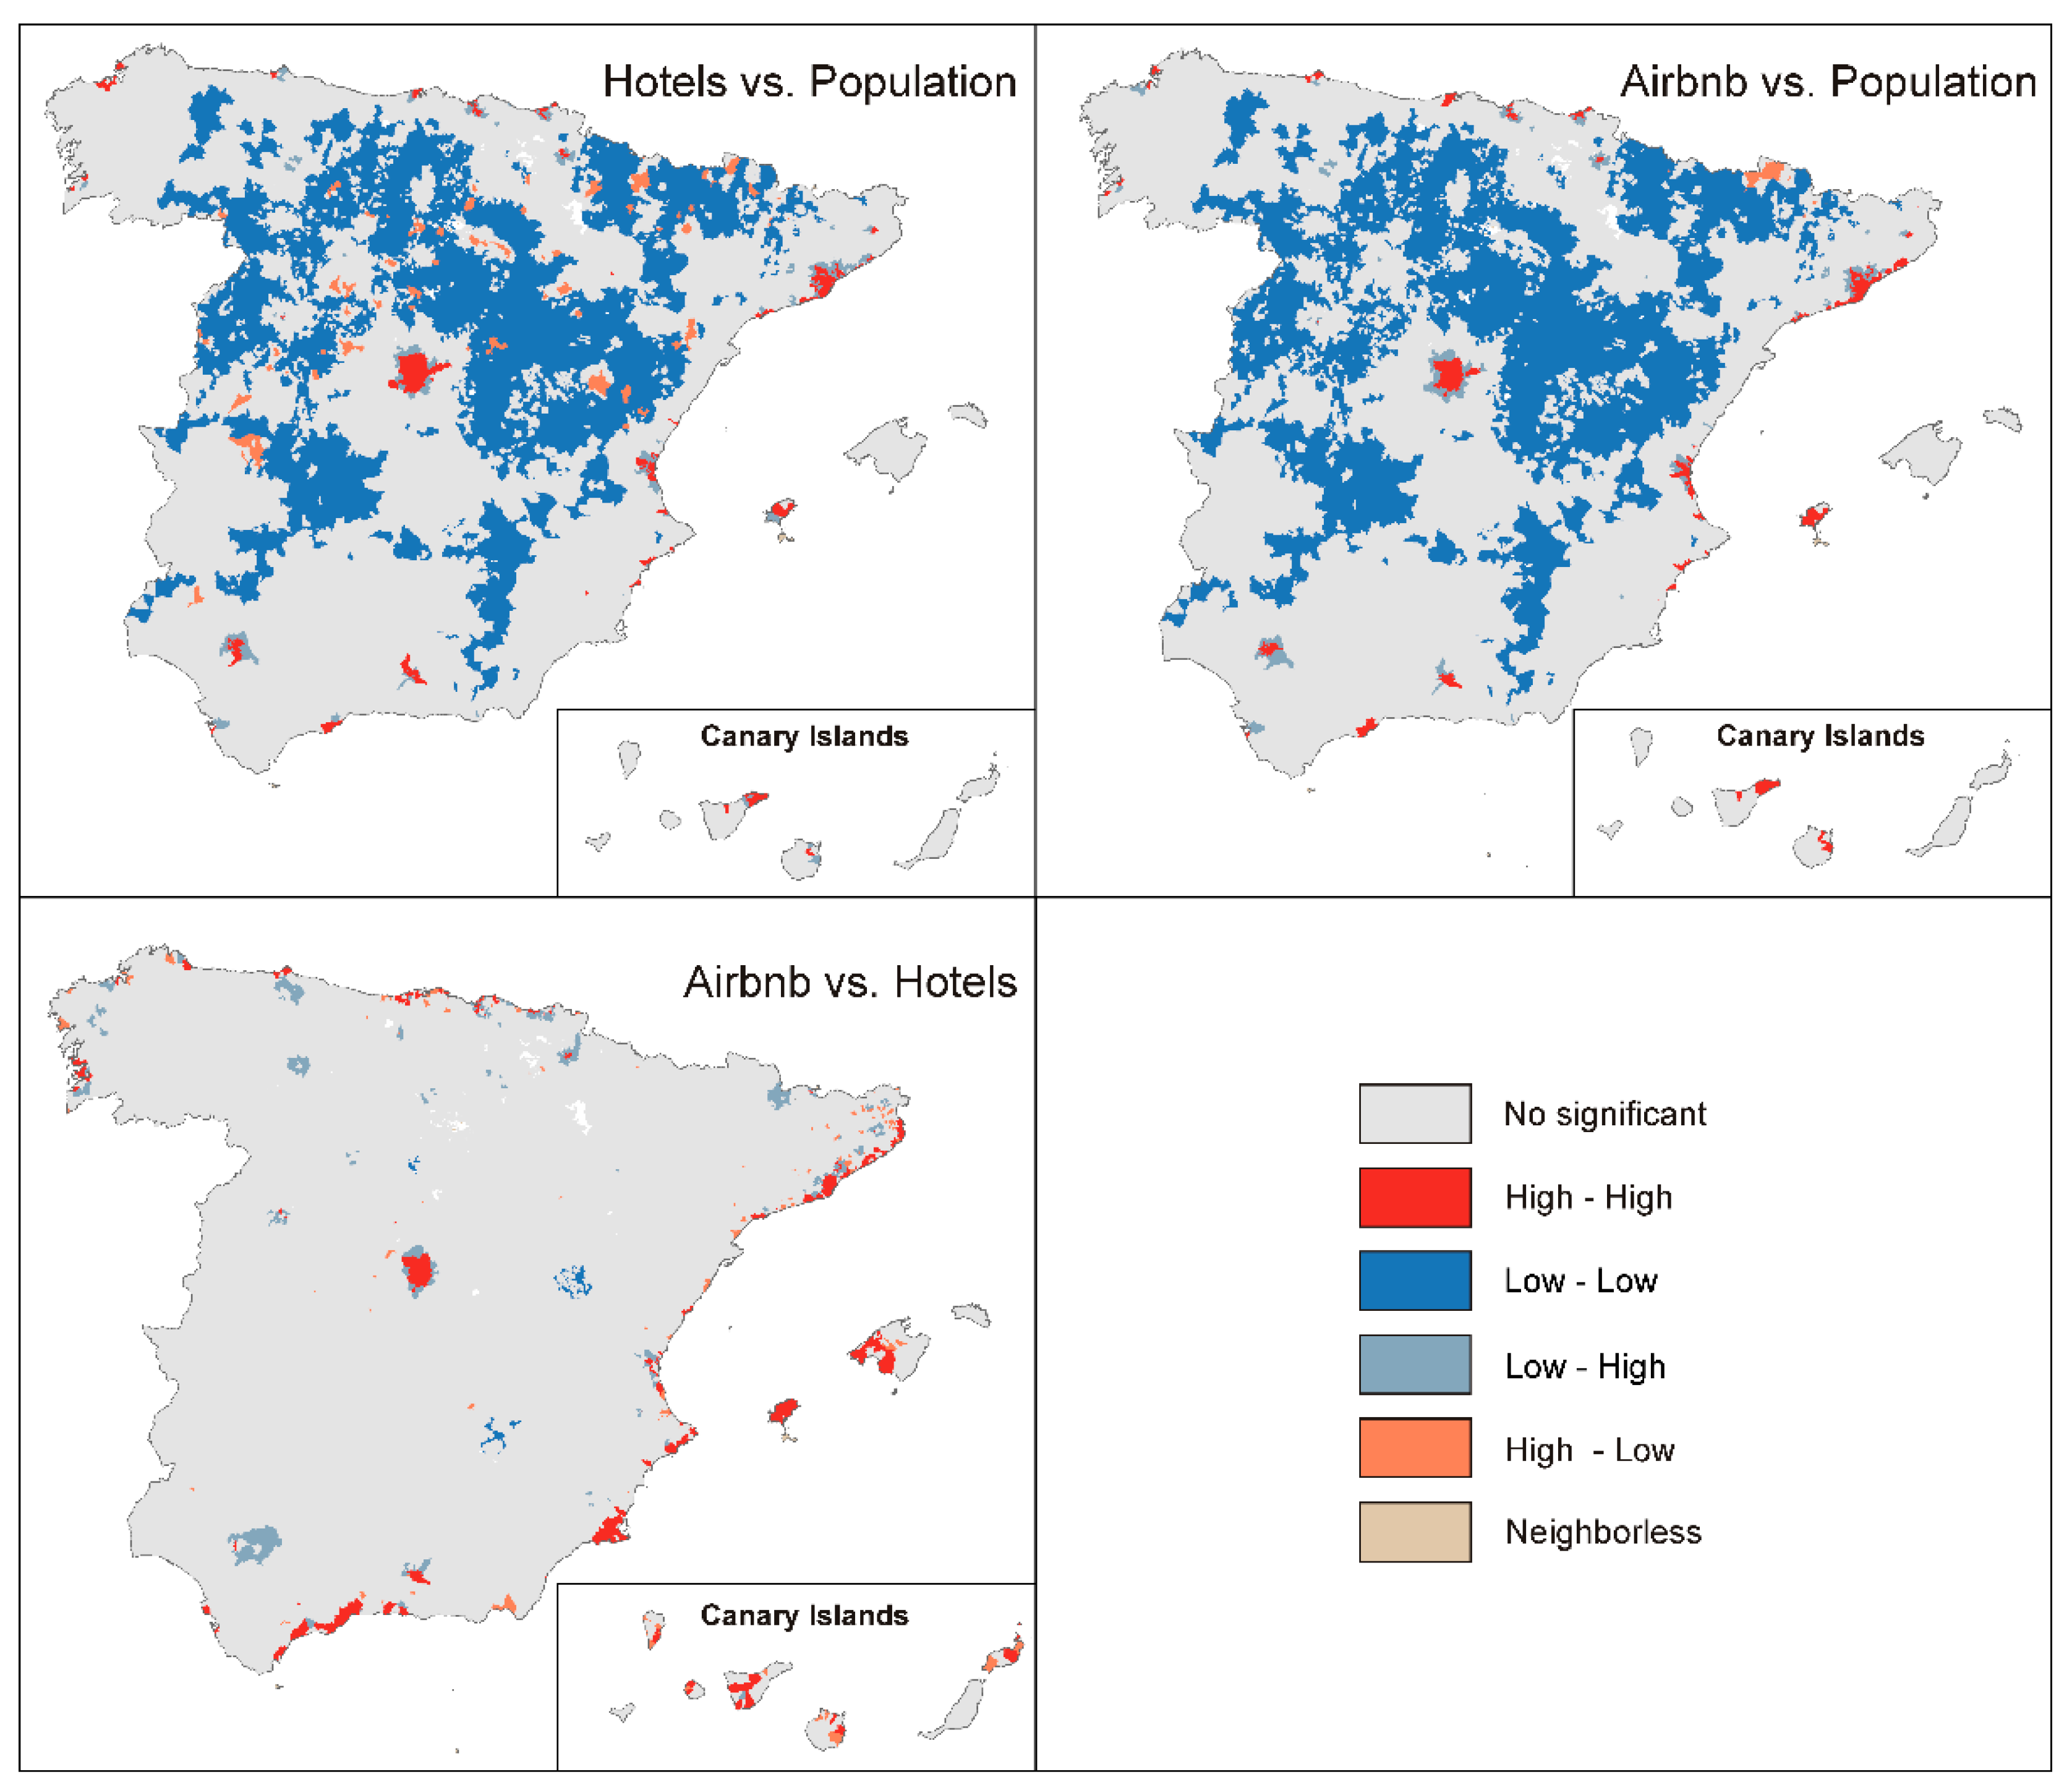
The research shows that the distribution of about 250,000 properties offered for rent through the Airbnb platform in Spain follows the general patterns of the distribution of population and hotel accommodation. Airbnb listings are mostly concentrated in major cities, coastal areas and in the Balearic and Canary Islands. Therefore, tourist accommodation offered through P2P platforms does not contribute to the territorial deglomeration of tourist activity at the country scale, as it does not contribute to the territorial deglomeration of tourist activity at the local scale in urban areas and nature-based tourism areas [32,33,66]. On the contrary, the possible revenue from Airbnb rental encourages the growth of the tourist accommodation offer in places of high demand, which contributes to the concentration of tourism activity in already existing hotspots.
Airbnb listings, mostly entire homes and apartments, concentrate in tourism areas which follow the model of sun-and-beach residential tourism development [94,95]. This is supported by the results of the regression analysis: the number of Airbnb rentals is positively affected by coastal location, high number of nonprimary dwellings and hotel accommodation supply. In these areas, P2P accommodation platforms provide a new way of commercializing tourist accommodation in homes or apartments already used for touristic purposes either privately (second homes) or commercially. In coastal tourist areas, numbers of Airbnb listings are much higher than the numbers of legally registered holiday dwellings, according to the Holiday Dwellings Occupancy Survey [78]. It is difficult to say to what degree Airbnb is used to commercialise the already existing, either registered or not, stock of holiday dwellings. The lack of such data hampers the full understanding of the impact of P2P platforms on the development of tourism destinations. In any case, this new way of commercialisation of vacation dwellings can increase the intensity of use of the accommodation stock and open new business opportunities for the tourism sector [68,96].
The above conclusions apply to the entire homes/apartments rented trough Airbnb platform, which are the majority (81.7%) of listings. The supply of private and shared rooms has different characteristics. It does not concentrate in residential tourism areas, but mainly in big and medium-sized cities. Therefore, it is more related to the housing market dynamics of these cities and to urban and cultural tourism models. The two types of Airbnb offer (entire homes/apartments and private rooms) should be treated separately, as they have different distribution and exert different impacts on the territory and the society. Whereas P2P platforms are mainly a way to commercialise vacation rentals and second homes in residential tourism areas, in cities, the use of these platforms appears to be slightly closer to the original “sharing economy” model, where owners rent out a room in their houses, obtaining an extra income in exchange for the service provided. However, we do not know if all private and shared rooms offered on Airbnb are parts of houses inhabited by their owners, or they are rather parts of houses or apartments in which all rooms are rented out. Further research should explore these issues in detail. Also, urban Airbnb rentals can not only serve tourist demand (short rentals), but may be also used to supply housing for permanent or temporal residents.
Although Airbnb listings mostly concentrate around tourist hotspots, our research has shown that Airbnb supply is spread over the entire Spanish territory, including mountain and rural areas. Airbnb is far from being only an urban phenomenon, despite the urban focus of most studies on the topic to date [32,33,34,35,36,37,38]. More studies assessing the impact of P2P accommodation platforms on nonurban areas are needed. The distinction of different kinds of location of Airbnb rental activity (big cities, coastal tourist areas, rural areas) is useful in designing policy response to this phenomenon. Significant differences in the size, structure, and role of peer-to-peer rental supply in various types of settlements and tourist destinations must lead to different impacts on the housing and tourism markets. These impacts should be addressed by policies adjusted to the regional and local conditions. Such policies need to be informed by studies focused on specific local environments and should address multiple issues, such as the competition of P2P rentals with other tourism accommodation providers, the effects on housing supply and demand or the effects on employment and entrepreneurship.
Our study does not provide an unambiguous answer to the question whether P2P accommodation competes with or complements the tourism accommodation offered by hotels and other traditional establishments. As stated above, many Airbnb offers in residential tourism destinations might be homes and apartments that have already been used privately for tourism purposes, or offered for rent to tourists using other distribution channels. This applies particularly to the coast of Andalucía and Comunitat Valenciana, with the highest stocks of vacation rentals [97], and not so much to the archipelagos, where the numbers of hotel beds are much higher than those located in holiday apartments. Second homes also form a significant part of tourism accommodation in rural tourism areas [98], and our results suggest that such homes are also being commercialised through P2P platforms. Still, the numbers of Airbnb listings in these areas are low compared to the numbers of hotel rooms. Accordingly, no serious competition can be seen yet between P2P platforms and traditional commercial tourist accommodation offer in this kind of areas.
We have not proven positive correlation between the number of Airbnb listings and the shortage of hotel capacity, which would suggest that Airbnb capacity supplements the supply of tourism accommodation in places where it is most needed. The spatial correlation between the location of Airbnb listings and hotel accommodation is high, though not perfect. Their numbers differ in some residential tourism areas with low supply of hotel accommodation, and in some cities which are not important leisure tourism destinations, where the size of Airbnb offer is much smaller than hotel capacity. In such places, P2P platforms and the traditional hotel sector play a complementary role, which is consistent with the conclusions of previous studies in the field [7,9]. Previous studies at the local scale conclude that even if P2P accommodation locates in the same areas as hotels [33,60,99], their offer may be targeted to different customers. In fact, Airbnb seems to compete mostly against hotels and other accommodation services of lower categories, but not against high-end hotels [10,13,58].
The interpretation of the study results has several limitations. First, we used data on Airbnb, which is the largest, but only one of several platforms that enable peer-to-peer rental of flats for tourist purposes. Comparative data show high correlation in territorial distribution of offers on various platforms [100], yet some differences may exist. Airbnb is a platform used often by international and urban tourists [52,101,102], while domestic tourists may use other platforms as well. Rural tourism establishments traditionally use other web portals [103,104], which may also be used to commercialise rental houses in these areas. Second, we measured only the supply of Airbnb accommodation, which reflects the homeowners’ decisions to rent out a property, but not their actual use. We do not use the numbers of reviews obtained by individual listings, but other authors have tested using this data as a proxy for the intensity of the use of P2P accommodation establishments [57,58]. Finally, the web scrapping technique that we have employed omitted some of the Airbnb listings, which could lead to the underrating of the absolute numbers of listings (see Appendix A). However, it is unlikely that it has distorted the proportions of listings across types and locations.
Future directions of spatial studies on peer-to-peer accommodation should include other platforms and look for spatial regularities in other characteristics than the size of supply, like occupancy, ratings and prices. Such studies are already performed on lower, particularly urban spatial scales, but large-scale analysis on country or international levels will be more fruitful in finding determinants of spatial variability, including type of environment and cultural and political factors. Advanced techniques of spatial analysis, and the use of geometric spatial units of analysis, should also be moved from urban and regional scale to larger areas of interest.
Our research is an example of a study based on nonconventional sources of spatial statistical data. Such approaches are increasingly popular in studies on population and tourism. Data obtained from online sources, such as online travel agencies [72], social media [105] or search engines [106], are used to describe and predict tourist activity with higher spatial and temporal precision than it is possible based on conventional statistical data provided by public statistical institutions. Keeping in mind that Airbnb data does not reflect the entire tourism mobility (as shown in the paper, it exaggerates the role of international tourism), it can also be used as a tool enabling comparative studies on spatial patterns of tourism activity on the international scale. Thanks to the data on the numbers of reviews, it can also serve to investigate the temporal variability of tourism activity with a high level of geographic detail.
Finally, the analysis contributes to wider debates on the nature of tourist accommodation and tourism itself from a geographical perspective. Together with second homes, VFR (visiting friends and relatives) tourism, cruise tourism or recreational vehicles, peer-to-peer accommodation is located at the peripheries of the notion of tourist accommodation, the centre of which is occupied by hotels. Hotels are fixed in space, (relatively) constant in time, often located based on the negotiations between public and private institutions realised through the planning process, and designed following globalised trends and the pursuit of comfort and organisational efficiency. Peer-to-peer accommodation platforms oppose this model in many ways: such tourism accommodation establishments are “invisible”, volatile in time and space and flexibly adjust to market situations, offering variety and uniqueness, which are primary qualities sought after by customers. Dealing with dispersed, volatile, or mobile, forms of accommodation is challenging for spatial studies, but necessary to understand the complex nature of tourism mobility.

Author Contributions

Conceptualization, C.A.; methodology, C.A.; formal analysis, C.A., B.S. and A.D.; investigation, C.A., B.S., A.D. and D.G.-Á.; writing—original draft preparation, C.A. and D.G.-Á.; writing—review and editing, C.A., B.S., A.D. and D.G.-Á.; visualization, B.S.; supervision, C.A.; project administration, C.A.

Funding

The last author is grateful to the Spanish Ministry of Economy and Competitiveness and the European Social Fund for the funding of his research activity (Ayudas para contratos predoctorales para la formación de doctores 2014).

Conflicts of Interest

The authors declare no conflict of interest.

Appendix A. Web Scrapping Procedure

We collected data on Airbnb listings using a Python script published by Tom Slee [77]. The script accesses the Airbnb website, searching for the listings located within a given set of coordinates and saves the following information about the resulting offers in a database: listing type, approximate address, number of reviews and average review score, capacity, numbers of bedrooms and bathrooms, price, and coordinates.
Some of the listings have wrong coordinates in the platform and appear to be located offshore or outside of Spain, despite having a Spanish address. We have cleaned the database of such falsely located listings, ruling out those listings which were not located in the Spanish territory. After this step, we gathered 247,456 records.
We evaluated the completeness of our data collection by comparing it with the information from three other services gathering data on Airbnb offer: Inside Airbnb, DataHippo and AirDNA (Table A1). Inside Airbnb is a nonprofit website that publishes datasets with information on Airbnb listings for various cities of the world, including the Barcelona, Madrid, Málaga and Sevilla in Spain [107]. DataHippo is another nonprofit project that gathers data on offers of Airbnb and three other P2P rental platforms for Spain, Portugal and Andorra [100]. It has been collecting data continuously for a year, which results in a large list of offers, including listings that are not available for rent anymore. Finally, AirDNA is a commercial service offering information on Airbnb market that uses advanced technology for web monitoring, which enables one to filter out inactive Airbnb offers [108].
The author of the script states that the data collection method may underrate the number of listings by up to 20% [77]. Indeed, the number of Airbnb records we have gathered is on average 7% lower than the most recent data of Inside Airbnb and a 29% lower than the one scrapped by DataHippo. The difference between our data and data of AirDNA is very low on average, although the numbers for individual cities differ by up to 9%.
Table A1. Comparison of numbers of Airbnb listings in Spanish cities according to various sources.
CityAuthors (October 2018)Inside AirbnbDataHippo (September 2017–September 2018)AirDNA (November 2018)
Barcelona16,50918473 (10 October 2018)27,50318,093
Madrid14,52017303 (10 October 2018)24,97615,229
Valencia6616-93946420
Sevilla52524746 (18 October 2018)74235583
Málaga49275549 (29 September 2018)64195002
Marbella4677-62343945
Alacant3561-45223444
Arona2607-34572693
Granada2559-37482742
Torrevieja2531-33352397

Appendix B. Descriptive Statistics of the Variables Used in Regression Models

Table A2. Descriptive statistics of the variables used in models for municipalities (N = 8124).
VariableMinMedianMeanMaxSDTransformation
Total listings per km200.0250.665163.574.352ln(x + 1)
Entire homes/apartments per km200.0170.548101.563.581ln(x + 1)
Private rooms per km2000.11379.7681.147ln(x + 1)
Shared rooms per km2000.0032.3720.044ln(x + 1)
Primary dwellings per km20.1026.02266.70410189.7348.95ln(x + 1)
Nonprimary dwellings per km205.27223.8211840.188.664ln(x + 1)
Coastal location000.05810.233x
Number of hotels per km2000.0156.3500.133ln(x + 1)
Distance to nearest airport (100 km)00.6530.7282.7570.468x
Table A3. Descriptive statistics of the variables used in models for tourist areas/sites (N = 79).
VariableMinMedianMeanMaxSumSDTransformation
Total listings25582276221,921218,2224858ln(x)
Entire homes/apartments18422227520,130179,7574108ln(x)
Private rooms6105472867437,2921148ln(x)
Shared rooms0415184117331ln(x + 1)
Primary dwellings (thous.)0.464.6143132111280223ln(x)
Nonprimary dwellings (thous.)0.421.252.1404411569.2ln(x)
Coastal location000.421330.50x
Number of hotel rooms (thus.)0.312.289.6912576617.7ln(x)
Occupancy of hotel rooms26.950.950.277.9 11.9x
Seasonality ratio1.272.604.5143.8 5.9ln(x)
Distance to nearest airport (100 km)00.410.552.12 0.52x
Share of international tourists8.726.534.489.6 22.2ln(x)

Appendix C. Airbnb Accommodation Supply in Tourist Areas/Sites

Figure A1. Location of tourist areas/sites described in Table A4.
Ijgi 08 00155 g0a1
Table A4. Airbnb accommodation supply in tourist areas/sites.
Area/Site No.TypeNameArea (km2)Population (2017)Hotel Rooms (2018)Airbnb Listings:Ratio Entire Homes or Apartments per Private RoomsAirbnb Listings per:
TotalEntire Homes/
Apartments
Private RoomsShared Roomskm21000 Inhabitants1000 Hotel Rooms
1AreaComunitat Valenciana: Costa Blanca16801,076,96235,86721,92120,13017583311.513.020.4611.2
2AreaAndalucía: Costa Del Sol (Málaga)12261,247,98440,96921,47619,68017583811.217.517.2524.2
3AreaCataluña: Barcelona1472,248,22743,06117,871904886741491.0121.47.9415.0
4SiteMadrid6073,182,98144,87414,520967146651842.123.94.6323.6
5AreaBaleares (Illes): Isla De Mallorca3723868,693125,22114,41713,13512701210.33.916.6115.1
6AreaCataluña: Costa Brava3945658,82137,76814,03513,1298881814.83.621.3371.6
7AreaCanarias: Isla De Tenerife2068894,63639,87211,93510,7141127949.55.813.3299.3
8AreaAndalucía: Costa De La Luz De Cádiz2059832,51619,34483897354989467.44.110.1433.7
9AreaCanarias: Isla De Gran Canaria1583843,15829,59172236167978786.34.68.6244.1
10AreaCataluña: Costa Daurada3046612,18528,004667461505061812.22.210.9238.3
11SiteValencia141787,8089061661645662027232.347.08.4730.2
12AreaCataluña: Costa Barcelona 201630362,825,76630,334617245821558322.92.02.2203.5
13SiteSevilla141689,43411,284525240311204173.337.17.6465.4
14AreaCanarias: Isla De Lanzarote853147,02315,989474043084032910.75.632.2296.5
15AreaBaleares (Illes): Islas De Ibiza-Formentera666156,13631,40446773716934274.07.030.0148.9
16AreaGalicia: Rías Baixas (Pontevedra y A Coruña)3700990,02116,19536242993596355.01.03.7223.8
17AreaCanarias: Isla De Fuerteventura1675110,29921,739348631362757511.42.131.6160.4
18AreaComunitat Valenciana: Costa de Castellón931362,728979833033005292610.33.59.1337.1
19AreaAndalucía: Costa De Almería1875491,61215,04532422977261411.41.76.6215.5
20AreaComunitat Valenciana: Costa Valencia573353,799535029462710232411.75.18.3550.7
21SiteGranada88232,77075762559194860743.228.911.0337.8
22AreaAsturias (Principado De): Costa Verde2080480,971770624122017371245.41.25.0313.0
23AreaMurcia (Región De): Costa Cálida1286371,642572023952139246108.71.96.4418.7
24AreaBaleares (Illes): Isla De Menorca71491,17013,699219419971821511.03.124.1160.2
25AreaPais Vasco: Costa Guipuzkoa229272,16137171945147845893.28.57.1523.3
26AreaPirineus9164195,52968321762144730964.70.29.0257.9
27AreaCataluña: Terres de l’Ebre3350179,508255916591543113313.70.59.2648.3
28AreaPirineo Aragonés10,69458,09472371651141922396.40.228.4228.1
29AreaAndalucía: Costa De La Luz (Huelva)1695158,72210,7351290120682214.70.88.1120.2
30AreaGalicia: Rías Altas (A Coruña)2531623,6636105118593824163.90.51.9194.1
31AreaCanarias: Isla De La Palma72281,350205711601058911111.61.614.3563.9
32AreaAndalucía: Costa Tropical (Granada)441115,6693355102595866114.52.38.9305.5
33SiteBilbao42345,1104147847438399101.120.42.5204.2
34SiteSantander36171,951228281460520722.922.54.7356.7
35AreaGalicia: Costa Da Morte (A Coruña)1718114,561142373967852913.00.46.5519.3
36SiteSalamanca39144,436296471242727781.518.14.9240.2
37SiteSantiago de Compostela22096,456421861542218852.22.86.4145.8
38SiteMurcia894443,2432502614385219101.80.71.4245.4
39AreaCataluña: Vall d’Aran6409985304060555451010.90.960.6199.0
40SiteZaragoza983664,938557158237919851.90.60.9104.5
41AreaCanarias: Isla De La Gomera37520,97690358153645011.91.527.7643.4
42SiteJerez de la Frontera1189212,915183957441515722.60.52.7312.1
43AreaGalicia: Costa A Mariña Lucense (Lugo)139671,47118425674947216.90.47.9307.8
44SitePamplona/Iruña25197,1381823534256243351.121.12.7292.9
45AreaPirineo Navarro595092,0541575442318110142.90.14.8280.6
46SiteToledo23383,74122404293656315.81.85.1191.5
47AreaPais Vasco: Costa Bizkaia248200,823743428313105103.01.72.1576.0
48SiteRonda39834,26811714213437624.51.112.3359.5
49SiteLogroño79150,97913833833215755.64.82.5276.9
50AreaExtremadura: Norte de Extremadura6342161,99522843522747803.50.12.2154.1
51AreaCataluña: Terres de Lleida5664361,138203234323810232.30.10.9168.8
52SiteLeón39125,317208933322110392.18.52.7159.4
53SiteCórdoba1258325,91636993182477103.50.31.086.0
54SiteOviedo187220,30129343142278702.61.71.4107.0
55SiteValladolid198299,71521312279213320.71.10.8106.5
56AreaPirineo Vasco2590208,10012152031208031.50.11.0167.1
57SiteCuenca91754,87610922011663414.90.23.7184.1
58SiteCangas de Onís214633212581901642247.50.930.0151.0
59SiteBurgos107175,62320651771146301.81.61.085.7
60SiteArcos de la Frontera52830,9834491691313803.40.35.5376.4
61SiteVitoria-Gasteiz278246,9761563159639600.70.60.6101.7
62SiteAlbacete1135172,81612371565110410.50.10.9126.1
63SiteCáceres175195,91712571511153333.50.11.6120.1
64SiteAntequera75041,1047391471202614.60.23.6198.9
65SiteSegovia16451,7561273128973103.10.82.5100.5
66SiteOurense85105,636728114793142.51.31.1156.6
67SiteLugo33097,995962110644601.40.31.1114.3
68SiteMérida86659,187995110713901.80.11.9110.6
69SiteÁvila23158,1491403104762802.70.41.874.1
70SitePonferrada28365,788720101693202.20.41.5140.3
71SiteZamora14962,38964092741804.10.61.5143.8
72SiteTeruel44435,48493469636010.50.21.973.9
73SiteSoria27338,88165755441104.00.21.483.7
74SiteCazorla30776134215345805.60.27.0125.9
75SiteCiudad Real28674,64180351331801.80.20.763.5
76SiteAlbarracín456104430845261901.40.143.1146.1
77SiteSigüenza38944963084535913.90.110.0146.1
78SiteBadajoz1441150,543111137211601.30.00.233.3
79SiteTrujillo65092744912518702.60.02.750.9

Appendix D. Additional Tables for Regression Models

Table A5. Initial linear models for municipalities (N = 8124).
Total ListingsEntire Homes/ApartmentsPrivate RoomsShared Rooms
(Intercept)−0.169 ***−0.140 ***−0.077 ***−0.001
Primary dwellings (per km2, ln)−0.004−0.031 ***0.028 ***0.000
Nonprimary dwellings (per km2, ln)0.162 ***0.162 ***0.025 ***0.001
Coastal location0.851 ***0.869 ***0.117 ***0.008 ***
Number of hotels (per km2, ln)2.090 ***1.884 ***1.515 ***0.162 ***
Distance to nearest airport (100 km)−0.051 ***−0.041 ***−0.009 *−0.001
Adjusted R20.6780.6530.5660.172
Dependent variables: ln(listings/km2). Significance scores: *** p < 0.001, ** p < 0.01, * p < 0.05, ˙ p < 0.1.
Table A6. Variance inflation factors for linear models for municipalities (N = 8124).
VIF
Primary dwellings (per km2, ln)4.833
Nonprimary dwellings (per km2, ln)4.655
Coastal location1.277
Number of hotels (per km2, ln)1.205
Distance to nearest airport (100 km)1.277
Table A7. Initial spatial lag models for municipalities (N = 8117).
Total ListingsEntire Homes/ApartmentsPrivate RoomsShared Rooms
(Intercept)−0.146 ***−0.120 ***−0.054 ***–0.001
Primary dwellings (per km2, ln)−0.041 ***−0.055 ***0.004 *−0.000
Nonprimary dwellings (per km2, ln)0.132 ***0.129 ***0.023 ***0.001
Coastal location0.516 ***0.530 ***0.075 ***0.008 ***
Number of hotels (per km2, ln)1.965 ***1.802 ***1.391 ***0.159 ***
Distance to nearest airport (100 km)0.0030.0030.007 *−0.000
ρ0.553 ***0.555 ***0.506 ***0.150 ***
AIC−1078.2−1516.7−11497−35594
AIC for linear model2371.51763.6−9033.5−35490
Dependent variables: ln(listings/km2). Significance scores: *** p < 0.001, ** p < 0.01, * p < 0.05, ˙ p < 0.1.
Table A8. Initial linear models for tourist areas/sites (N = 79).
Total ListingsEntire Homes/ApartmentsPrivate RoomsShared Rooms
(Intercept)−2.088 **−2.375 **−3.773 ***−2.793 *
Primary dwellings (ln)−0.347 **−0.537 ***0.218−0.082
Nonprimary dwellings (ln)0.539 ***0.708 ***0.062−0.195
Coastal location0.462 **0.589 **0.0620.450
Number of hotel rooms (ln)0.753 ***0.765 ***0.696 ***0.809 ***
Occupancy of hotel rooms−0.004−001−0.018 ˙−0.020
Seasonality ratio (ln)−0.111−0.093−0.222 ˙−0.424 *
Distance to nearest airport (100 km)−0.483 ***−0.484 **−0.439 **−0.492 *
Share of international tourists (ln)0.393 *0.414 *0.417 *0.164
Adjusted R20.9260.9170.8730.668
Dependent variables: ln(listings). Significance scores: *** p < 0.001, ** p < 0.01, * p < 0.05, ˙ p < 0.1.
Table A9. Variance inflation factors for final models for tourist areas/sites (N = 79).
Total ListingsEntire Homes/ApartmentsPrivate RoomsShared Rooms
Primary dwellings (ln)- 3.515-
Nonprimary dwellings (ln)3.6333.633--
Coastal location1.6671.667-1.815
Number of hotel rooms (ln)5.3485.3485.5461.742
Occupancy of hotel rooms--3.014-
Seasonality ratio (ln)--1.8671.261
Distance to nearest airport (100 km)1.5471.5471.6681.424
Share of international tourists (ln)2.5232.5233.048-

References

  1. About Us. Available online: https://press.airbnb.com/about-us/ (accessed on 14 September 2019).
  2. Dann, D.; Teubner, T.; Weinhardt, C. Poster Child and Guinea Pig—Insights from a Structured Literature Review on Airbnb. Int. J. Contemp. Hosp. Manag. 2018. [Google Scholar] [CrossRef]
  3. Guttentag, D. Airbnb: Disruptive Innovation and the Rise of an Informal Tourism Accommodation Sector. Curr. Issues Tour. 2015, 18, 1192–1217. [Google Scholar] [CrossRef]
  4. Prayag, G.; Ozanne, L.K. A Systematic Review of Peer-to-Peer (P2P) Accommodation Sharing Research from 2010 to 2016: Progress and Prospects from the Multi-Level Perspective. J. Hosp. Mark. Manag. 2018, 27, 1–30. [Google Scholar] [CrossRef]
  5. Dredge, D.; Guimóthy, S. (Eds.) Collaborative Economy and Tourism: Perspectives, Poltics, Policies and Prospects; Springer: Cham, Switzerland, 2017. [Google Scholar]
  6. Dolnicar, S. (Ed.) Peer-to-Peer Accommodation Networks: Pushing the Boundaries; Goodfellow Publishers: Oxford, UK, 2018. [Google Scholar]
  7. Blal, I.; Singal, M.; Templin, J. Airbnb’s Effect on Hotel Sales Growth. Int. J. Hosp. Manag. 2018, 73, 85–92. [Google Scholar] [CrossRef]
  8. Dogru, T.; Mody, M.; Suess, C. Adding evidence to the debate: Quantifying Airbnb’s disruptive impact on ten key hotel markets. Tour. Manag. 2018, 72, 27–38. [Google Scholar] [CrossRef]
  9. Heo, C.Y.; Blal, I.; Choi, M. What Is Happening in Paris? Airbnb, Hotels, and the Parisian Market: A Case Study. Tour. Manag. 2019, 70, 78–88. [Google Scholar] [CrossRef]
  10. Koh, E.; King, B. Accommodating the Sharing Revolution: A Qualitative Evaluation of the Impact of Airbnb on Singapore’s Budget Hotels. Tour. Recreat. Res. 2017, 42, 409–421. [Google Scholar] [CrossRef]
  11. Zervas, G.; Proserpio, D.; Byers, J. The Rise of the Sharing Economy: Estimating the Impact of Airbnb on the Hotel Industry. SSRN Electron. J. 2013, 13, 1–36. [Google Scholar] [CrossRef]
  12. Alyakoob, M.; Lafayette, W.; Lafayette, W. Airbnb: Is it a Curse or a Blessing for Restaurant Employment. In Proceedings of the Thirty Ninth International Conference on Information Systems, San Francisco, CA, USA, 13–15 May 2018. [Google Scholar]
  13. Fang, B.; Ye, Q.; Law, R. Effect of Sharing Economy on Tourism Industry Employment. Ann. Tour. Res. 2016, 57, 264–267. [Google Scholar] [CrossRef]
  14. Farronato, C.; Fradkin, A. The Welfare Effects of Peer Entry in the Accommodation Market: The Case of Airbnb; Technical Report; National Bureau of Economic Research: Cambridge, MA, USA, 2017. [Google Scholar]
  15. Blanco-Romero, A.; Blázquez-Salom, M.; Cànoves, G. Barcelona, Housing Rent Bubble in a Tourist City. Social Responses and Local Policies. Sustainability 2018, 10, 2043. [Google Scholar] [CrossRef]
  16. Gil, J.; Sequera, J. Expansión de La Ciudad Turrística y Nuevas Resistencias. El Caso de Airbnb En Madrid. EMPRITIA Rev. Metodol. Cienc. Soc. 2018, 41, 15–32. [Google Scholar]
  17. Jordan, E.J.; Moore, J.; Jordan, E.J. An In-Depth Exploration of Residents’ Perceived Impacts of Transient Vacation Rentals Rentals. J. Travel Tour. Mark. 2017. [Google Scholar] [CrossRef]
  18. Mody, M.; Suess, C.; Dogru, T. Not in My Backyard? Is the Anti-Airbnb Discourse Truly Warranted? Ann. Tour. Res. 2018. [Google Scholar] [CrossRef]
  19. Ayouba, K.; Breuillé, M.L.; Grivault, C.; Le Gallo, J. Does Airbnb Disrupt the Private Rental Market? An Empirical Analysis for French Cities. Int. Reg. Sci. Rev. 2019. [Google Scholar] [CrossRef]
  20. Barron, K.; Kung, E.; Proserpio, D. The Sharing Economy and Housing Affordability: Evidence from Airbnb. SSRN Electron. J. 2018, 1–42. [Google Scholar] [CrossRef]
  21. Horn, K.; Merante, M. Is Home Sharing Driving up Rents? Evidence from Airbnb in Boston. J. Hous. Econ. 2017, 38, 14–24. [Google Scholar] [CrossRef]
  22. Yrigoy, I. Rent gap reloaded: Airbnb and the shift from residential to touristic rental housing in the Palma Old Quarter in Mallorca, Spain. Urban Stud. 2018. [Google Scholar] [CrossRef]
  23. Wachsmuth, D.; Weisler, A. Airbnb and the Rent Gap: Gentrification through the Sharing Economy. Environ. Plan. A Econ. Space 2018, 50, 1147–1170. [Google Scholar] [CrossRef]
  24. DiNatale, S.; Lewis, R.; Parker, R. Short-Term Rentals in Small Cities in Oregon: Impacts and Regulations. Land Use Policy 2018, 79, 407–423. [Google Scholar] [CrossRef]
  25. Dredge, D.; Gymóthy, S.; Birkbak, A.; Jensen, T.E.; Madsen, A.K. The Impact of Regulatory Approaches Targeting Collaborative Economy in the Tourism Accommodation Sector: Barcelona, Berlin, Amsterdam and Paris; Aalborg University: Aalborg, UK, 2016. [Google Scholar]
  26. Munkøe, M.M. Regulating the European Sharing Economy: State of Play and Challenges. Intereconomics 2017, 52, 38–44. [Google Scholar] [CrossRef]
  27. Wegmann, J.; Jiao, J. Taming Airbnb: Toward Guiding Principles for Local Regulation of Urban Vacation Rentals Based on Empirical Results from Five US Cities. Land Use Policy 2017, 69, 494–501. [Google Scholar] [CrossRef]
  28. Ju, Y.; Back, K.-J.; Choi, Y.; Lee, J.-S. Exploring Airbnb Service Quality Attributes and Their Asymmetric Effects on Customer Satisfaction. Int. J. Hosp. Manag. 2019, 77, 342–352. [Google Scholar] [CrossRef]
  29. Pappas, N. The Complexity of Consumer Experience Formulation in the Sharing Economy. Int. J. Hosp. Manag. 2018, 77, 415–424. [Google Scholar] [CrossRef]
  30. Sung, E.; Kim, H.; Lee, D. Why Do People Consume and Provide Sharing Economy Accommodation?—A Sustainability Perspective. Sustainability 2018, 10, 2072. [Google Scholar] [CrossRef]
  31. Tussyadiah, I.P.; Pesonen, J. Impacts of Peer-to-Peer Accommodation Use on Travel Patterns. J. Travel Res. 2016, 55, 1022–1040. [Google Scholar] [CrossRef]
  32. Garcia-Ayllon, S. Urban Transformations as an Indicator of Unsustainability in the P2P Mass Tourism Phenomenon: The Airbnb Case in Spain through Three Case Studies. Sustainability 2018. [Google Scholar] [CrossRef]
  33. Gutiérrez, J.; García-Palomares, J.C.; Romanillos, G.; Salas-Olmedo, M.H. The Eruption of Airbnb in Tourist Cities: Comparing Spatial Patterns of Hotels and Peer-to-Peer Accommodation in Barcelona. Tour. Manag. 2017, 62, 278–291. [Google Scholar] [CrossRef]
  34. Quattrone, G.; Proserpio, D.; Quercia, D.; Capra, L.; Musolesi, M. Who Benefits from the “Sharing” Economy of Airbnb? In Proceedings of the 25th International Conference on World Wide Web–WWW ’16, Montréal, QC, Canada, 11–15 April 2016; ACM Press: New York, NY, USA, 2016; pp. 1385–1394. [Google Scholar] [CrossRef]
  35. Schäfer, P.; Braun, N. Misuse through Short-Term Rentals on the Berlin Housing Market. Int. J. Hous. Mark. Anal. 2016, 9, 287–311. [Google Scholar] [CrossRef]
  36. Gunter, U.; Önder, I. Determinants of Airbnb Demand in Vienna and Their Implications for the Traditional Accommodation Industry. Tour. Econ. 2018, 24, 270–293. [Google Scholar] [CrossRef]
  37. Gyódi, K. Airbnb and the Hotel Industry in Warsaw: An Example of the Sharing Economy? Cent. Eur. Econ. J. 2017, 2, 22–34. [Google Scholar] [CrossRef]
  38. Zhang, Z.; Chen, R.; Han, L.; Yang, L. Key Factors Affecting the Price of Airbnb Listings: A Geographically Weighted Approach. Sustainability 2017, 9, 1635. [Google Scholar] [CrossRef]
  39. Airbnb and Economic Opportunity in the New York City’s Predominantly Black Neighborhoods; Technical Report; Airbnb: San Francisco, CA, USA, 2016.
  40. Roelofsen, M. Exploring the Socio-Spatial Inequalities of Airbnb in Sofia, Bulgaria. Erdekunde 2018, 72, 313–327. [Google Scholar] [CrossRef]
  41. Cócola Gant, A. Holiday Rentals: The New Gentrification Battlefront. Sociol. Res. Online 2016, 21, 10. [Google Scholar] [CrossRef]
  42. Adamiak, C. Mapping Airbnb Supply in European Cities. Ann. Tour. Res. 2018, 71, 67–71. [Google Scholar] [CrossRef]
  43. Coyle, D.; Yeung, T.Y. Understanding AirBnB in Fourteen European Cities. In Proceedings of the Tenth IDEI-TSE-IAST Conference on The Economics of Intellectual Property, Software and the Internet, Toulouse, France, 12–13 January 2017. [Google Scholar]
  44. Yang, Y.; Mao, Z. Welcome to My Home! An Empirical Analysis of Airbnb Supply in US Cities. J. Travel Res. 2018. [Google Scholar] [CrossRef]
  45. Heo, C.Y.; Blengini, I. A macroeconomic perspective on Airbnb’s global presence. Int. J. Hosp. Manag. 2019, 78, 47–49. [Google Scholar] [CrossRef]
  46. Cesarani, M.; Nechita, F. Tourism and the Sharing Economy. An Evidence from Airbnb Usage in Italy and Romania. Symphonya Emerg. Issues Manag. 2017, 3, 32–47. [Google Scholar]
  47. Strommen-Bakhtiar, A.; Vinogradov, E. The Adoption and Development of Airbnb Services in Norway. Int. J. Innov. Digit. Econ. 2019, 10, 28–39. [Google Scholar] [CrossRef]
  48. Larpin, B.; Mabillard, J.; Scaglione, M.; Favre, P.; Schegg, R. An Analysis of Regional Developments of Airbnb in Switzerland: Insights into Growth Patterns of a P2P Platform. In Proceedings of the Information and Communication Technologies in Tourism, Nicosia, Cyprus, 29 January–1 February 2019; Springer: Cham, Switzerland, 2019; pp. 92–103. [Google Scholar] [CrossRef]
  49. Abdar, M.; Yen, N.Y. Understanding Regional Characteristics through Crowd Preference and Confidence Mining in P2P Accommodation Rental Service. Libr. Hi Tech 2017, 35, 521–541. [Google Scholar] [CrossRef]
  50. UNWTO Tourism Highlights: 2018 Edition; World Tourism Organization (UNWTO): Madrid, Spain, 2018. [CrossRef]
  51. Cardona, J.R. Aproximación a La Situación Actual Del Alquiler Vacational. Int. J. Sci. Manag. Tour. 2018, 4, 569–587. [Google Scholar]
  52. Alojamiento Turístico En Viviendas de Alquiler: Impactos y Retos Asociados; Technical Report; Exceltur: Madrid, Spain, 2015.
  53. Nilsson, W.; Leoni, V.; Figini, P. Report on the Airbnb Rental Market for the Balearic Islands; Technical Report; Universitat de las Illes Balears: Palma de Mallorca, Spain, 2016. [Google Scholar]
  54. Aznar, J.; Sayeras, J.M.; Rocafort, A.; Galiana, J. The Irruption of AirBNB and Its Effects on Hotels’ Profitability: An Analysis of Barcelona’s Hotel Sector. Intang. Cap. 2017, 13, 147. [Google Scholar] [CrossRef]
  55. Cócola Gant, A. Apartamentos Turísticos, Hoteles y Desplazamiento de Población; Technical Report; Agustín Cócola Gant: Barcelona, Spain, 2016. [Google Scholar]
  56. Lambea Llop, N. A Policy Approach to the Impact of Tourist Dwellings in Condominiums and Neighbourhoods in Barcelona. Urban Res. Pract. 2017, 10, 120–129. [Google Scholar] [CrossRef]
  57. Segú, M. Do Short-Term Rent Platforms Affect Rents? Evidence from Airbnb in Barcelona; MPRA Paper No. 84369; Munich Personal RePEc Archive: Munich, Germany, 2018. [Google Scholar]
  58. Análisis Del Impacto de Las Viviendas de Uso Turístico En El Distrito Centro de Madrid; Technical Report; Ayuntamiento de Madrid: Madrid, Spain, 2017.
  59. Vives-Miró, S.; Rullan, O. Desposesión de Vivienda Por Turistización? Revalorización y Desplazamientos En El Centro Histórico de Palma (Mallorca). Rev. Geogr. Norte Gd. 2017, 67, 53–71. [Google Scholar] [CrossRef]
  60. La Economía Colaborativa y La Vivienda Turística No Reglada. El Caso de Valencia; Technical Report; Unión Hotelera Provincia de Valencia: Valencia, Spain, 2017.
  61. Fernández-Morales, A.; Mayorga-Toledano, M.C. New Accommodation Models in City Tourism: The Case of Airbnb in Málaga. In Proceedings of the III Spring Symposium on Challenges in Tourism Development, Las Palmas de Gran Canaria, Spain, 7–8 June 2018. [Google Scholar]
  62. Temes Cordovez, R.E.; Simancas Cruz, M.R.; Peñarrubia Zaragoza, M.P.; Moya Fuero, A.; García Amaya, A.M. Characterization and Spatial Identification of the Tourist-Residential Settement in Valencia (Spain). In Proceedings of the 6th European Postgraduate Sustainable Development Symposium, Granada, Spain, 1–3 June 2016; Rivas Navarro, J.L., Bravo Rodríguez, B., Eds.; Goldel Impresioens Digitales: Granada, Spain, 2016. [Google Scholar]
  63. Perez-Sanchez, V.R.; Serrano-Estrada, L.; Marti, P.; Mora-Garcia, R.T. The what, where, and why of Airbnb price determinants. Sustainability 2018, 10, 4596. [Google Scholar] [CrossRef]
  64. Coll Ramis, M.A.; Obrador Izara, M.; Seguí Llinás, M. Consideraciones Socio-Territoriales En Torno Al Negocio Del Alquiler de Viviendas de Uso Turístico. El Case Del Municipio de Lloret de Vistalegre (Mallorca). Revista de Análisis Turístico 2016, 22, 28–38. [Google Scholar]
  65. Yrigoy, I. Airbnb En Menorca: ¿una Nueva Forma de Gentrificación Turística? Localización de La Vivienda Turística, Agentes e Impactos Sobre El Alquiler Residencial. Scr. Nova. Rev. Electrónica Geogr. Cienc. Soc. 2017, 21. [Google Scholar] [CrossRef]
  66. Eugenio-Martin, J.L.; Cazorla-Artiles, J.M.; González-Martel, C. On the determinants of Airbnb location and its spatial distribution. Tour. Econ. 2019. [Google Scholar] [CrossRef]
  67. Guisan, M.-C.; Aguayo, E. Second Homes in the Spanish Regions: Evolution in 2001–2007 and Impact on Tourism, GDP and Employment. Reg. Struct. Econ. Stud. 2010, 10, 83–104. [Google Scholar]
  68. Miranda, I.J.; Aledo Tur, A.; Ortuño Padilla, A. Airbnb on the Costa Blanca. Diagnosis and Proposal of Social and Tourist Integration. Int. J. Sustain. Dev. Plan. 2018, 13, 1008–1019. [Google Scholar] [CrossRef]
  69. Cànoves, G.; Garay, L.; Duro, J.A. Turismo Rural En España: Avances y Retrocesos En Los Últimos Veinte Años. Pap. Tur. 2012, 51, 7–21. [Google Scholar]
  70. Sánchez- Aguilera, D.; Font Garolera, J. Nuevas Formas de Alojamiento En El Medio Rural: La Difusión de La Economía Colaborativa En Tres Destinos de La Montaña Española. In Proceedings of the Turismo y crisis, turismo colaborativo y ecoturismo, XV Coloquio de Geografía del Turismo, el Ocio y la Recreación de la AGE, Mallorca, Spain, 6–8 October 2016. [Google Scholar]
  71. Flamarich, M.; Duro, J.A.D. Turismo de Negocios (Eventos) En España: Análisis y Perspectivas. Pap. Tur. 2011, 49, 59–75. [Google Scholar]
  72. Batista e Silva, F.; Marín Herrera, M.A.; Rosina, K.; Ribeiro Barranco, R.; Freire, S.; Schiavina, M. Analysing Spatiotemporal Patterns of Tourism in Europe at High-Resolution with Conventional and Big Data Sources. Tour. Manag. 2018, 68, 101–115. [Google Scholar] [CrossRef]
  73. Varela Merino, B.; López Lago, A.; Martínez Serrano, A. Primeras Aproximaciones Al Estudio Estadístico Del Alojamiento Privado Con Fines Turísticos Desde Una Perspectiva de Oferta. Estud. Tur. 2003, 156, 87–109. [Google Scholar]
  74. García Manrique, E. Los Espacios Turísticos Del Litoral Andaluz. Cuad. Geogr. 2000, 30, 43–76. [Google Scholar]
  75. Fairley, S.; Dolnicar, S. Facilitating Events. In Peer-to-Peer Accommodation Networks; Dolnicar, S., Ed.; Goodfellow Publishers: Oxford, UK, 2017; pp. 109–119. [Google Scholar]
  76. Reinhold, S.; Dolnicar, S. How Airbnb Creates Value. In Peer-to-Peer Accommodation Networks; Dolnicar, S., Ed.; Goodfellow Publishers: Oxford, UK, 2017; pp. 39–53. [Google Scholar]
  77. Slee, T. Data Collection for Airbnb Listings. Available online: https://github.com/tomslee/airbnb-data-collection (accessed on 24 September 2018).
  78. Instituto Nacional de Estadística. Available online: http://www.ine.es/ (accessed on 30 November 2018).
  79. Centro de Descargas, Centro Nacional de Información Geográfica. Available online: Centrodedescargas.cnig.es (accessed on 5 November 2018).
  80. Encuesta de Ocupación En Apartamentos Turísticos: Metodología; Instituto Nacional de Estadística: Madrid, Spain, 2017.
  81. Hoover, E.M. Interstate Redistribution of Population, 1850–1940. J. Econ. Hist. 1941, 1, 199–205. [Google Scholar] [CrossRef]
  82. Rogerson, P.A.; Plane, D.A. The Hoover Index of Population Concentration and the Demographic Components of Change: An Article in Memory of Andy Isserman. Int. Reg. Sci. Rev. 2012, 36, 97–114. [Google Scholar] [CrossRef]
  83. Anselin, L. GeoDa: An Introduction to Spatial Data Analysis. Available online: https://geodacenter.github.io/index.html (accessed on 8 February 2019).
  84. Cliff, A.D.; Ord, J.K. Spatial Process: Models and Applications; Taylor & Francis: Abingdon, UK, 1981. [Google Scholar]
  85. Wartenberg, D. Multivariate Spatial Correlation: A Method for Exploratory Geographical Analysis. Geogr. Anal. 1985, 17, 263–283. [Google Scholar] [CrossRef]
  86. Anselin, L.; Syabri, I.; Smirnov, O. Visualizing Multivariate Spatial Correlation with Dynamically Linked Windows. In New Tools for Spatial Data Analysis: Proceedings of the Specialist Meeting; Anselin, L., Rey, S., Eds.; Center for Spatially Integrated Social Science (CSISS), University of California: Santa Barbara, CA, USA, 2002. [Google Scholar]
  87. Aena: Estadísticas de Tráfico Aéreo. Available online: http://www.aena.es/csee/Satellite?pagename=Estadisticas/Home (accessed on 14 November 2018).
  88. Anselin, L. Spatial Econometrics. In A Companion to Theoretical Econometrics; Baltagi, B.H., Ed.; Blackwell Publishing: Malden, MA, USA, 2001; pp. 310–330. [Google Scholar]
  89. Ward, M.D.; Gleditsch, K.S. Spatial Regression Models; Sage: Thousand Oaks, CA, USA, 2008. [Google Scholar]
  90. LeSage, J.; Pace, R.K. Introduction to Spatial Econometrics; CRC Press: Boca Raton, FL, USA, 2009. [Google Scholar]
  91. Bivand, R.S.; Pebesma, E.; Gomez-Rubio, V. Applied Spatial Data Analysis with R, 2nd ed.; Springer: New York, NY, USA, 2013. [Google Scholar]
  92. Petrie, A. regclass: Tools for an Introductory Class in Regression and Modeling. R Package Version 1.5. 2017. Available online: https://CRAN.R-project.org/package=regclass (accessed on 8 February 2019).
  93. O’Brien, R.M. A Caution Regarding Rules of Thumb for Variance Inflation Factors. Qual. Quant. 2007, 41, 673–690. [Google Scholar] [CrossRef]
  94. Huete Nieves, R. Tendencias Del Turismo Residencial: El Caso Del Mediterráneo Español. El Periplo SustenTable 2008, 14, 65–87. [Google Scholar] [CrossRef]
  95. Ribes, J.F.P.; Rodríguez, A.R.; Jiménez, M.S. Determinants of the Competitive Advantage of Residential Tourism Destinations in Spain. Tour. Econ. 2011, 17, 373–403. [Google Scholar] [CrossRef]
  96. Groizard, J.L.; Nilsson, W. Mito y Realidad Del Alquiler Vacacional En Las Islas Baleares. Análisis y Recomendaciones de Política Turística; Universitat de les Illes Balears: Palma de Mallorca, Spain, 2017. [Google Scholar]
  97. Rodríguez-Antón, J.M.; Alonso-Almeida, M.D.M.; Rubio-Andrada, L.; Celemín Pedroche, M.S. La Economía Colaborativa. Una Aproximación Al Turismo Colaborativo En España. CIRIEC-Esp. Rev. Econ. Pública Soc. Coop. 2016, 88, 259–283. [Google Scholar]
  98. Brunet, I.; Alarcón, A. El Turismo Rural En Cataluña. Estrategias Empresariales. Rev. Int. Sociol. 2008, 66, 141–165. [Google Scholar]
  99. Arias Sans, A.; Quaglieri Domínguez, A. Unravelling Airbnb: Urban Perspecives from Barcelona. In Reinventing the Local in Tourism: Producing, Consuming and Negotiating Place; Russo, A.P., Richards, G., Eds.; Channel View: Bristol, UK, 2016; pp. 209–228. [Google Scholar]
  100. DataHippo Project. Available online: https://datahippo.org/en/ (accessed on 26 November 2018).
  101. Airbnb’s Positive Impact in Madrid. Available online: https://blog.atairbnb.com/airbnbs-positive-impact-in-madrid/ (accessed on 20 February 2019).
  102. Smith, A. Shared, Collaborative and On Demand: The New Digital Economy; Pew Research Center: Washington, DC, USA, 2016. [Google Scholar]
  103. Jiménez Abad, R.M. Globarruralización: Cómo El Medio Rural Se ve Afectado Por La Globalización y Las TIC. Geogr. Rev. Digit. Para Estud. Geogr. Cienc. Soc. 2014, 5, 283–311. [Google Scholar] [CrossRef]
  104. Nieto, J.; Hernández-Maestro, R.M.; Muñoz-Gallego, P.A. Marketing Decisions, Customer Reviews, and Business Performance: The Use of the Toprural Website by Spanish Rural Lodging Establishments. Tour. Manag. 2014, 45, 115–123. [Google Scholar] [CrossRef]
  105. Hawelka, B.; Sitko, I.; Beinat, E.; Sobolevsky, S.; Kazakopoulos, P.; Ratti, C. Geo-Located Twitter as Proxy for Global Mobility Patterns. Cartogr. Geogr. Inf. Sci. 2014, 41, 260–271. [Google Scholar] [CrossRef]
  106. Li, X.; Pan, B.; Law, R.; Huang, X. Forecasting Tourism Demand with Composite Search Index. Tour. Manag. 2017, 59, 57–66. [Google Scholar] [CrossRef]
  107. About Inside Airbnb. Available online: http://insideairbnb.com/about.html (accessed on 26 November 2018).
  108. About AirDNA. Available online: https://www.airdna.co/about (accessed on 26 November 2018).
Figure 1. Distribution of Airbnb listings in Spanish municipalities.
Ijgi 08 00155 g001
Figure 2. Number of Airbnb listings per 1000 inhabitants in Spanish municipalities.
Ijgi 08 00155 g002
Figure 3. Number of Airbnb listings in Spanish tourist areas/sites.
Ijgi 08 00155 g003
Figure 4. Cluster maps of univariate local Moran I.
Ijgi 08 00155 g004
Figure 5. Cluster maps of bivariate local Moran I.
Ijgi 08 00155 g005
Table 1. Explaining variables used in regression models.
HypothesisVariables Used in Models for Municipalities
(Explained Variables:
Numbers of Listings per km2)
Variables Used in Models for Tourist Areas/Sites
(Explained Variables:
Numbers of Listings)
1. Supply of homes and flatsNumber of primary dwellings per km2 (Census, 2011)Number of primary dwellings (Census, 2011)
Number of nonprimary dwellings per km2 (Census, 2011)Number of nonprimary dwellings (Census, 2011)
2. Coastal locationCoastal location (1 for municipality which borders sea coast, 0 for other municipalities)Coastal location (1 for tourist area/site which borders sea coast, 0 for other tourist areas/sites)
3. Supply of hotel accommodationNumber of hotels in TripAdvisor search engine per km2 (2018)Number of hotel rooms (Hotel occupancy survey, 2018)
4. Shortage of hotel capacity Occupancy of hotel rooms (percent, average monthly value between XI 2017 and X 2018; Hotel occupancy survey)
Seasonality ratio (ratio between the highest and the lowest monthly number of hotel guests between X 2017 and IX 2018; Hotel occupancy survey)
5. Access and presence of international touristsDistance to the nearest airport (straight line in 100 km between airports with at least 50,000 passengers (2017) [87] and municipality border)Distance to the nearest airport
(for areas: average distance for all municipalities acknowledging the role of the extent of area; for sites: as for municipalities)
Share of international tourists (percent among hotel guests; Hotel occupancy survey)
Table 2. Numbers of Airbnb listings in Spanish municipalities.
Number of ListingsNumber of Municipalities
14,520–16,5092
2000–661614
1000–199929
500–99959
250–49974
100–249136
10–991186
1–93382
03242
Table 3. Level of spatial concentration of population, hotels, and Airbnb listings in Spanish municipalities.
VariableHoover Index
Population0.688
Primary dwellings0.682
Nonprimary dwellings0.573
Hotels (from TripAdvisor)0.815
Airbnb listings: total0.802
Airbnb listings: entire homes/apartments0.811
Airbnb listings: private rooms0.801
Airbnb listings: shared rooms0.920
Table 4. Values of univariate global Moran I.
VariableMoran IZ-Value
Population0.42969.011 ***
Primary dwellings0.41968.017 ***
Nonprimary dwellings0.35554.481 ***
Hotels (from TripAdvisor)0.08815.929 ***
Airbnb listings: total0.31449.352 ***
Airbnb listings: entire homes/apartments0.32749.631 ***
Airbnb listings: private rooms0.27660.996 ***
Airbnb listings: shared rooms0.10719.769 ***
*** Significant at p = 0.001. Randomisation with 999 permutations.
Table 5. Values of bivariate global Moran I.
VariableLagged VariableMoran IZ-Value
Hotels (from TripAdvisor)Population0.14326.954 ***
Airbnb listings: totalPopulation0.19938.228 ***
Airbnb listings: totalHotels (from TripAdvisor)0.14227.841 ***
*** Significant at p = 0.001. Randomisation with 999 permutations.
Table 6. Final spatial lag models for municipalities (N = 8117).
Total ListingsEntire Homes/ApartmentsPrivate RoomsShared Rooms
(Intercept)−0.144 ***−0.117 ***−0.054 ***−0.001
Primary dwellings (per km2, ln)−0.042 ***−0.055 ***0.004 *-
Nonprimary dwellings (per km2, ln)0.133 ***0.129 ***0.023 ***0.001 *
Coastal location0.515 ***0.530 ***0.075 ***0.008 ***
Number of hotels (per km2, ln)1.965 ***1.802 ***1.391 ***0.159 ***
Distance to nearest airport (100 km)--0.007 *-
ρ0.553 ***0.555 ***0.506 ***0.150 ***
AIC−1080−1518.5−11497−35,598
AIC for linear model2413.91793.5−9033.5−35,491
Dependent variables: ln(listings/km2). Significance scores: *** p < 0.001, ** p < 0.01, * p < 0.05, ˙ p < 0.1.
Table 7. Final linear models for tourist areas/sites (N = 79).
Total ListingsEntire Homes/ApartmentsPrivate RoomsShared Rooms
(Intercept)−2.549 ***−2.888 ***−3.640 ***−3.264 ***
Primary dwellings (ln)--0.257 **-
Nonprimary dwellings (ln)0.213 **0.171 ˙--
Coastal location0.558 ***0.781 ***-0.366
Number of hotel rooms (ln)0.737 ***0.788 ***0.715 ***0.671 ***
Occupancy of hotel rooms--−0.019 *-
Seasonality ratio (ln)--−0.231 ˙−0.316 *
Distance to nearest airport (100 km)−0.340 *−0.251−0.421 **−0.538 *
Share of international tourists (ln)0.278 ˙0.2540.394 *-
Residual standard error0.4960.5800.5490.816
Adjusted R20.9200.9000.8770.675
F-statistic179.0 ***141.0 ***93.2 ***41.5 ***
Significance scores: *** p < 0.001, ** p < 0.01, * p < 0.05, ˙ p < 0.1.

