Case Report

Analysis of Spatial Characteristics of Digital Signage in Beijing with Multi-Source Data

1
Beijing Key Laboratory of Big Data Technology for Food Safety, School of Computer and Information Engineering, Beijing Technology and Business University, Beijing 100048, China
2
Key Laboratory of Resources Utilization and Environmental Remediation, Institute of Geographical Sciences and Natural Resources Research, Chinese Academy of Sciences, Beijing 100101, China
3
National Engineering and Technology Center for Information Agriculture, Nanjing Agricultural University, Nanjing 210095, China
*
Author to whom correspondence should be addressed.
ISPRS Int. J. Geo-Inf. 2019, 8(5), 207; https://0-doi-org.brum.beds.ac.uk/10.3390/ijgi8050207
Submission received: 31 March 2019 / Revised: 20 April 2019 / Accepted: 2 May 2019 / Published: 6 May 2019
(This article belongs to the Special Issue Human-Centric Data Science for Urban Studies)

Abstract

:
Digital signage is an important medium for urban outdoor advertising. Understanding the spatial distribution characteristics and factors that influence the site of digital signage are conducive to the efficient, standardized, and sustainable development of digital signage. The outdoor commercial digital signage within the Sixth Ring Road in Beijing is taken as the research object, and social network check-ins, housing prices, traffic network centrality and the mount of commercial facilities are considered factors that influence digital signage. The spatial distribution characteristics of digital signage are studied by using point pattern analysis methods. Moreover, we use three spatial clustering algorithms to study the hierarchical spatial characteristics of digital signage and test the effectiveness of the results. In addition, the factors that influence the distribution of digital signage are analyzed by Spearman correlation analysis. The results indicate that (1) the digital signage in Beijing generally presents a relatively concentrated distribution with centrality and forms an obvious gathering area and the agglomeration centers are mainly concentrated in the core parts of the central business district (CBD). (2) Digital signage is categorized into three groups, the traffic-oriented, the population-oriented, and the market-oriented. In addition, the spatial distribution of digital signage is consistent with the historical urban development of Beijing. (3) The social network check-ins with dynamic population characteristics had the highest correlation with the operation cost of digital signage. The spatial characteristics of digital signage evaluated in this study can effectively enhance the sustainable management of digital signage and provide a reference for research of the sustainable allocation of digital signage resources.

1. Introduction

Due to the rapid development of Internet technology and the digital transformation of the media industry, digital signage has been widely used. Digital signage refers to a multimedia professional audio–visual system that uses text, audio, images and video to publish business, finance and entertainment information in public places [1,2]. Compared with traditional “static” signage such as posters and billboards, digital signage has the characteristics of flexibility, accuracy, interactivity, immediacy and integration and can deliver targeted information to different audience groups in specific locations at specific times using specific equipment [3,4,5,6,7].
With the increasing popularity of digital signage and the increasing complexity of the digital signage business, the understanding of the spatial characteristics of digital signage and its influencing factors is urgently needed to achieve scientific and sustainable management of digital signage. Currently, digital signage research mainly focuses on the systematic research of digital signage, consumer behavior, and content design [8,9,10,11,12], with the purpose of the management of digital signage terminals, automatic scheduling, and content distribution [13,14,15,16]. However, digital signage has the problems of unclear spatial patterns and influence mechanisms and lacks unified management of spatialization, overall planning and sustainability. It is urgent to consider the spatial characteristics of digital signage and the factors influencing its location.
To clarify the spatial characteristics of digital signage, this paper takes the Sixth Ring Road in Beijing as the research area and urban outdoor commercial digital signage as the research object. According to the characteristics of spatial digital signage data, the distribution of digital signage is abstracted into points. We analyze the spatial distribution of Beijing digital signage in three dimensions. Macroscopically, we use the standard deviational ellipse analysis method to characterize the overall direction of the changes in Beijing digital signage [17]. In addition, microscopically, we use the kernel density analysis method to analyze the clustering characteristics of digital signage within the area of the Sixth Ring Road in Beijing [18,19], and we compare the distributions of digital signage and commercial facilities from macro and micro perspectives. At the same time, this study used the multiple distance spatial clustering analysis (Ripley’s K(r) function) to study the changes in digital signage distance [20]. On this basis, three spatial clustering methods, K-means, SOM and DBSCAN, were compared in generating hierarchical spatial categories of digital signage [21,22,23,24,25,26,27], and the appropriate method was determined by Calinski-Harabasz index (CH) [28]. Then, we used one-way analysis of variance (one-way ANOVA) to verify the categories [29]. Moreover, Spearman rank correlation coefficients were used to study the correlations between the influencing factors and the price of digital signage [30], and analyzed the mechanisms in the spatial distribution of digital signage.

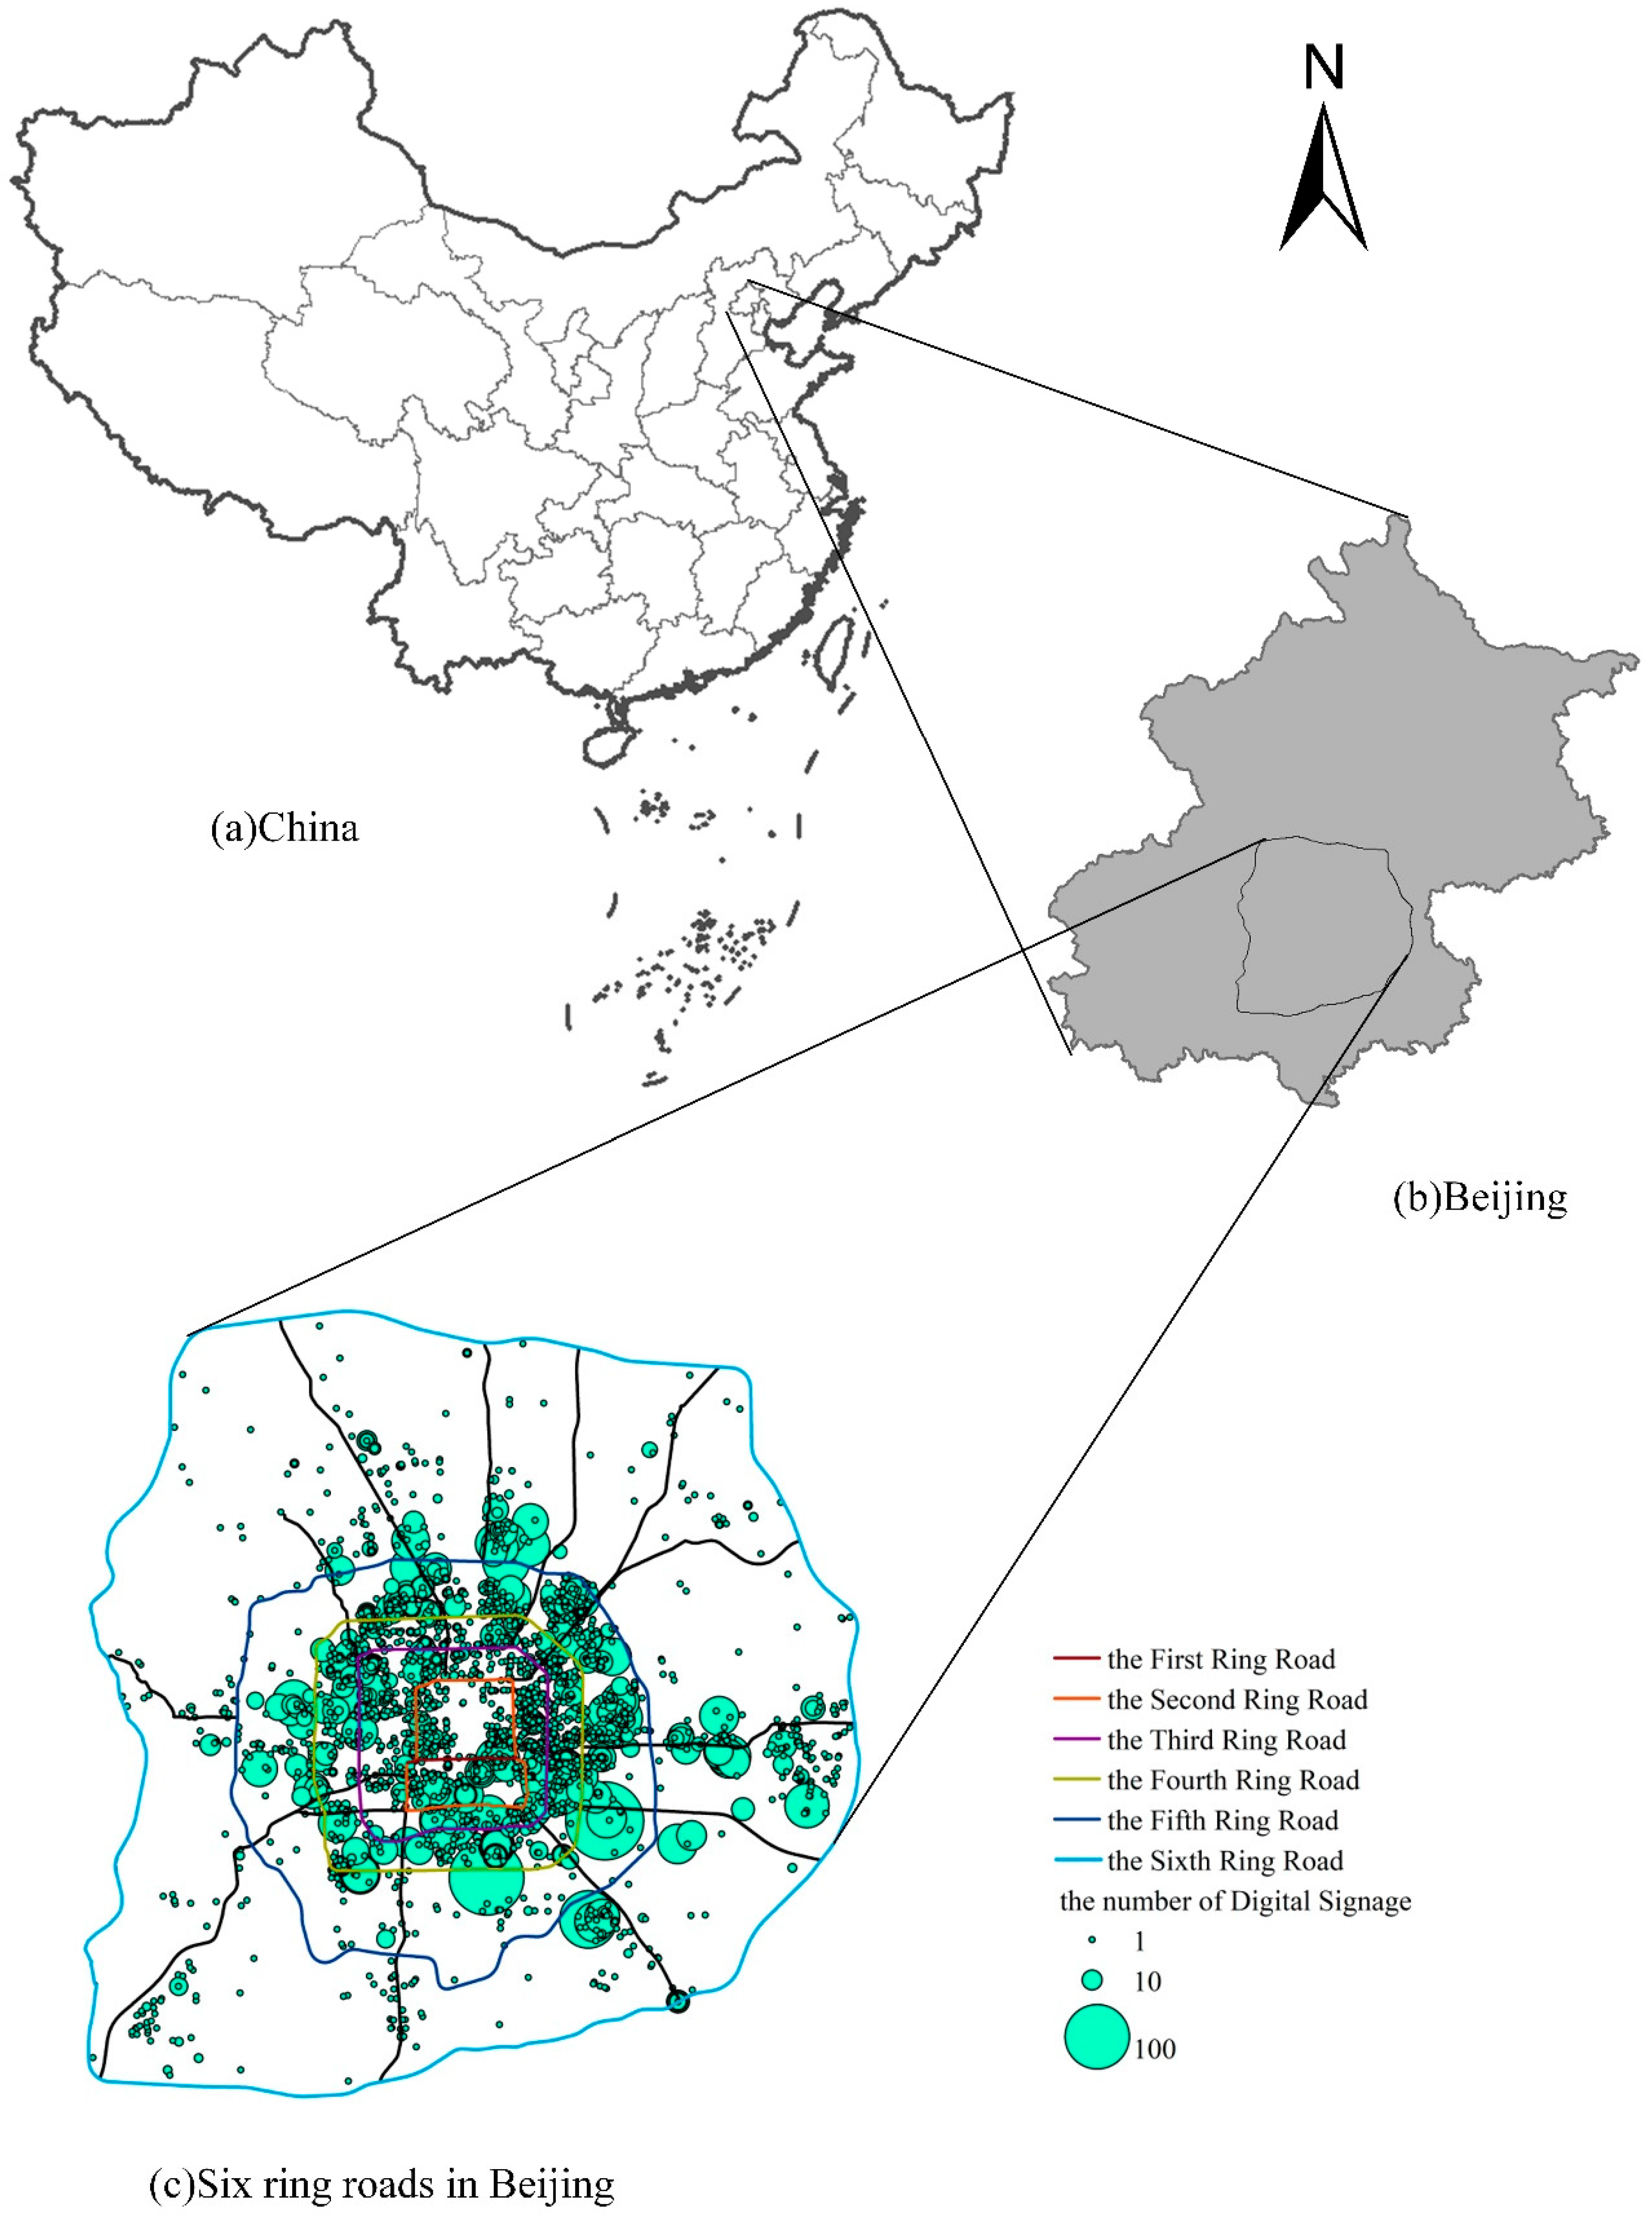
2. Study Area and Data Source
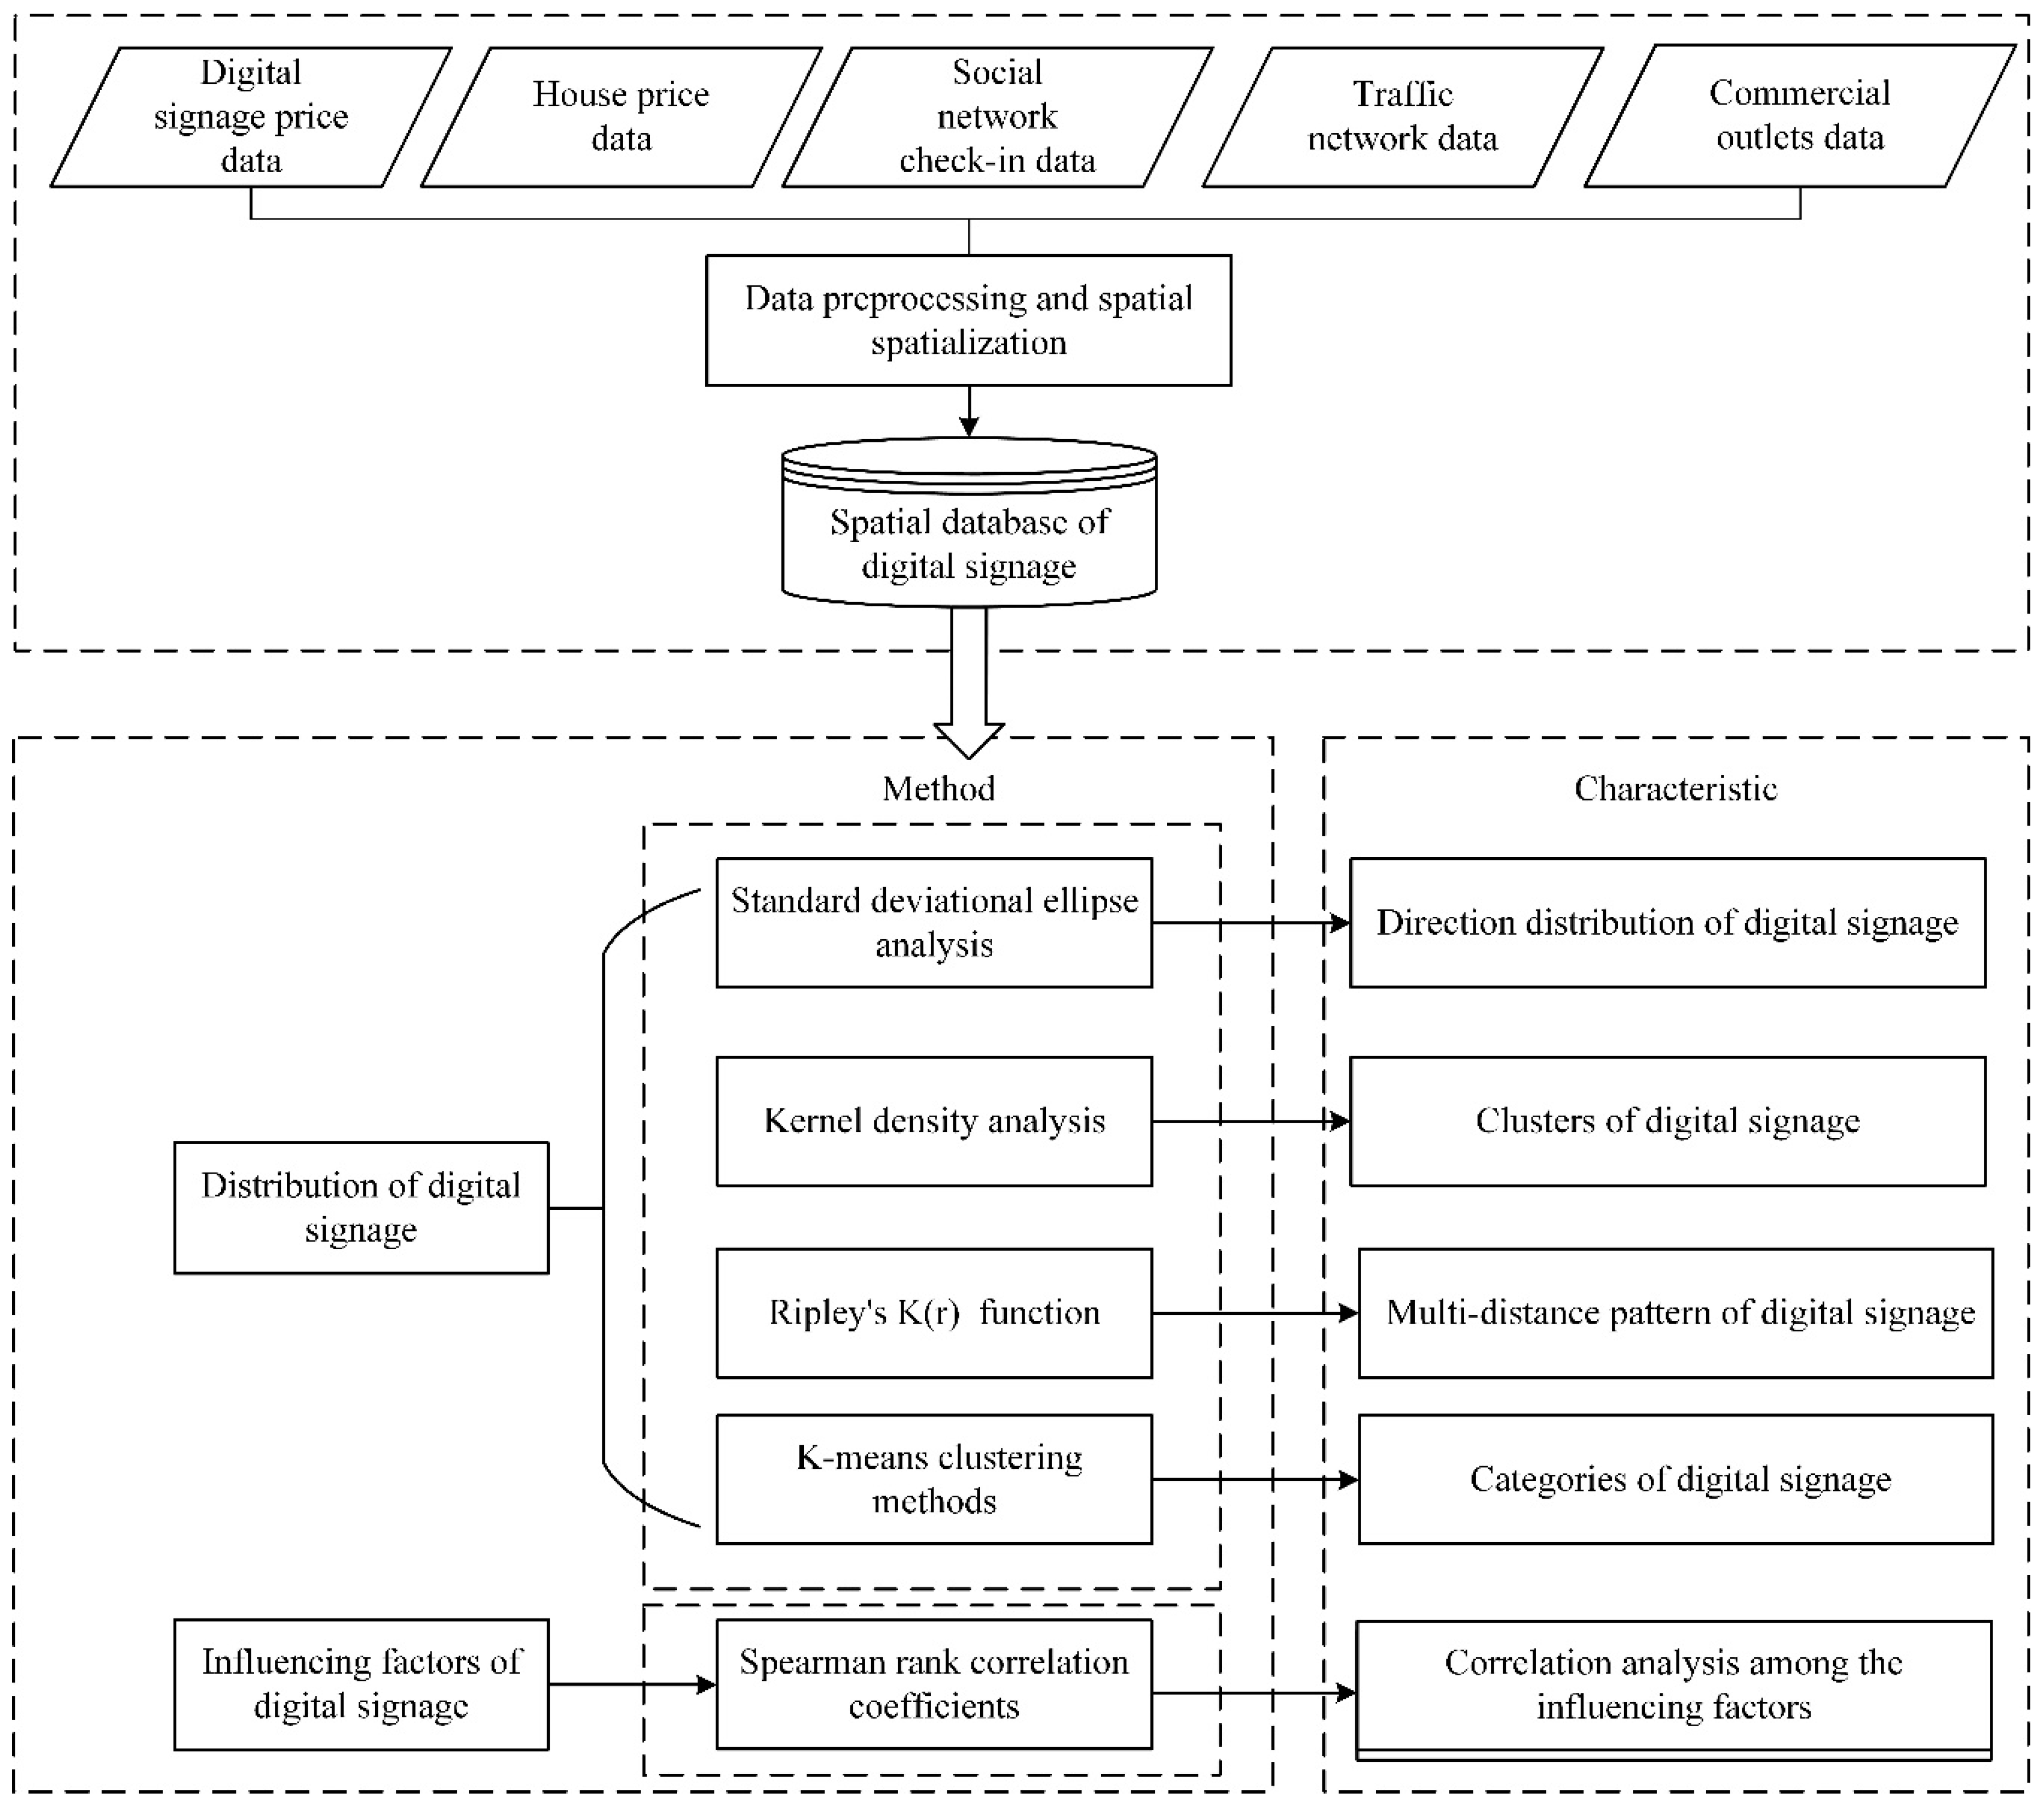
The urban area within the Sixth Ring Road in Beijing is selected as the study area in this research (Figure 1). Beijing is an important consumer market and the center of trade circulation in China [31], and it is also an area where urban outdoor advertising has accumulated, and digital signage has been developed. The core urban built-up area is mostly covered within the Sixth Ring Road in Beijing, and has a large number of commercial and entertainment centers, government agencies, hospitals, universities and other urban facilities. Extensive digital signage highly distributed in the region, accounting for 85% of the total amount of digital signage in Beijing [16].
The dataset involved in this research includes digital signage data and the data on factors influencing digital signage. The digital signage data are achieved from previous projects, describe the operation cost, screen type and address of the 5,823 digital signage in the study area (Figure 1c). The operation cost of digital signage is selected to represent the scope of the digital signage. The layout of digital signage and its advertising effects are constrained by the location, accessibility, visibility, and the geographical environment surrounding the signage, which are decisive for the scientific management of digital signage [32]. Moreover, in former researches, the commercial activity, traffic capacity, population and the housing price were used as the environmental factors in this field [16,32]. In addition, we used the data of the number of commercial workers, the traffic network centrality index, the check-ins data, and the average house price to represent these factors. a) The number of commercial workers is used to indicate the size of commercial facilities which can reflect the number of audiences and digital signage. We get the data from the third economic census [33]. b) The traffic network centrality index, measured based on the basic road network, indicates a location more central and thus more advantageous for digital signage [34]. c) The check-ins data, derived from Sina Weibo microblog in China (https://weibo.com/, such open data is freely captured from application program interfaces on the websites), indicates a location more popular for audiences [35]. d) The average house price represents the cost of digital signage and we capture from Housing World Website (https://bj.fang.com/) [36].
Moreover, we matched the address with spatial location via geocoding and converted the data into point-based data by ESRI® ArcGISTM 10.2. With the purpose of integrating the inferencing factor data, we assigned the value of each influencing factor to the digital signage point as attributes. For each digital signage, the attribute values were determined by the closest inferencing factor data.

3. Methodology

With the well-prepared datasets, we use the standard deviational ellipse analysis method to characterize the overall direction of the changes in Beijing digital signage. Additionally, we apply the kernel density analysis to analyze the clustering characteristics of digital signage, as well as the multiple distance spatial clustering analysis (Ripley’s K(r)) function to study the changes in digital signage distance. Moreover, the K-means clustering method is also introduced to study the hierarchical spatial characteristics of digital signage (Figure 2).

3.1. Standard Deviational Ellipse Analysis

The standard deviational ellipse is a classic algorithm for analyzing the spatial distribution characteristics of the point dataset. This algorithm is used to measure the direction and distribution characteristics of the dataset, and the output is an ellipse [37]. The long axis of the ellipse represents the maximum diffusion direction of the study data, and the short axis of the ellipse represents the minimum diffusion direction of the study data [38]. From the area of the ellipse, the degree of dispersion of the digital signage distribution can be determined. The smaller the area is, the closer the distribution of the digital signage is to the center of gravity. The deflection angle is the angle from which the long axis of the standard deviational ellipse rotates clockwise from the north [39].
We assume that all the point coordinates in the point data set are ( x 1 , y 1 ) , ( x 2 , y 2 ) , , ( x n , y n ) . Taking the X-axis as the standard, north (12 o’clock direction) is at 0 degrees, and the rotation is clockwise; thus, tan θ is the angle of deflection. The direction function of the ellipse can be written as Equation (1):
tan θ = ( i = 1 n ( x i x ¯ ) 2 i = 1 n ( y i y ¯ ) 2 ) + ( i = 1 n ( x i x ¯ ) 2 i = 1 n ( y i y ¯ ) 2 ) 2 + 4 ( i = 1 n ( x i x ¯ ) i = 1 n ( y i y ¯ ) ) 2 2 i = 1 n ( x i x ¯ ) i = 1 n ( y i y ¯ )
where x ¯ and y ¯ in the above equation represent the averages of the x-coordinate and y-coordinate values of all points in the point set, respectively.
x ¯ = i = 1 n x i n ;   y ¯ = i = 1 n y i n .
The length σ x of the x-axis is shown in Equation (2) and the length σ y of the y-axis is shown in Equations (3) and (4):
σ x = i 1 n [ ( x i x _ ) cos θ ( y i y _ ) sin θ ] 2 n ,
σ y = i 1 n [ ( x i x _ ) sin θ ( y i y _ ) cos θ ] 2 n ,
where θ is the angle of rotation. The spatial digital signage data was normalized before the standard deviational ellipse analysis, and some singular points were deleted to ensure the homogeneity of the samples. Then, the standard deviational ellipse analysis of the spatial digital signage data in Beijing was performed with ESRI® ArcGISTM 10.2.

3.2. Kernel Density Analysis

As a nonparametric estimation method, kernel density analysis is mainly used to calculate the density of digital signage in surrounding neighborhoods. This method sets the position of a specific feature point as the center and distributes the attribute value of the center point within a specified threshold range. The range is usually a circle with a radius of h, which is displayed when the feature points are gathered at the center position where the density is highest. Then, the density will gradually decrease as the distance decreases until the density at the distance limit is 0 [40].
The samples extracted from the overall data with the density distribution function f n ( ) are x 1 , x 2 , , x i , and x i is a series of vectors whose coordinates describe the location of each point i, and the estimated value of f at point x is f ( ) . This function is shown in Equation (5) [41]:
f n ( x ) = 1 n h i = 1 n k ( | x x i | h )
where k ( ) is the kernel function, h is the bandwidth, | x x i | is the distance from the estimated point x to the sample x i .
To reflect the general distribution characteristics of Beijing digital signage and avoid too much detail, we selected 3 km as the distance threshold after trial and error and performed kernel density analysis on the data in ESRI® ArcGISTM 10.2.

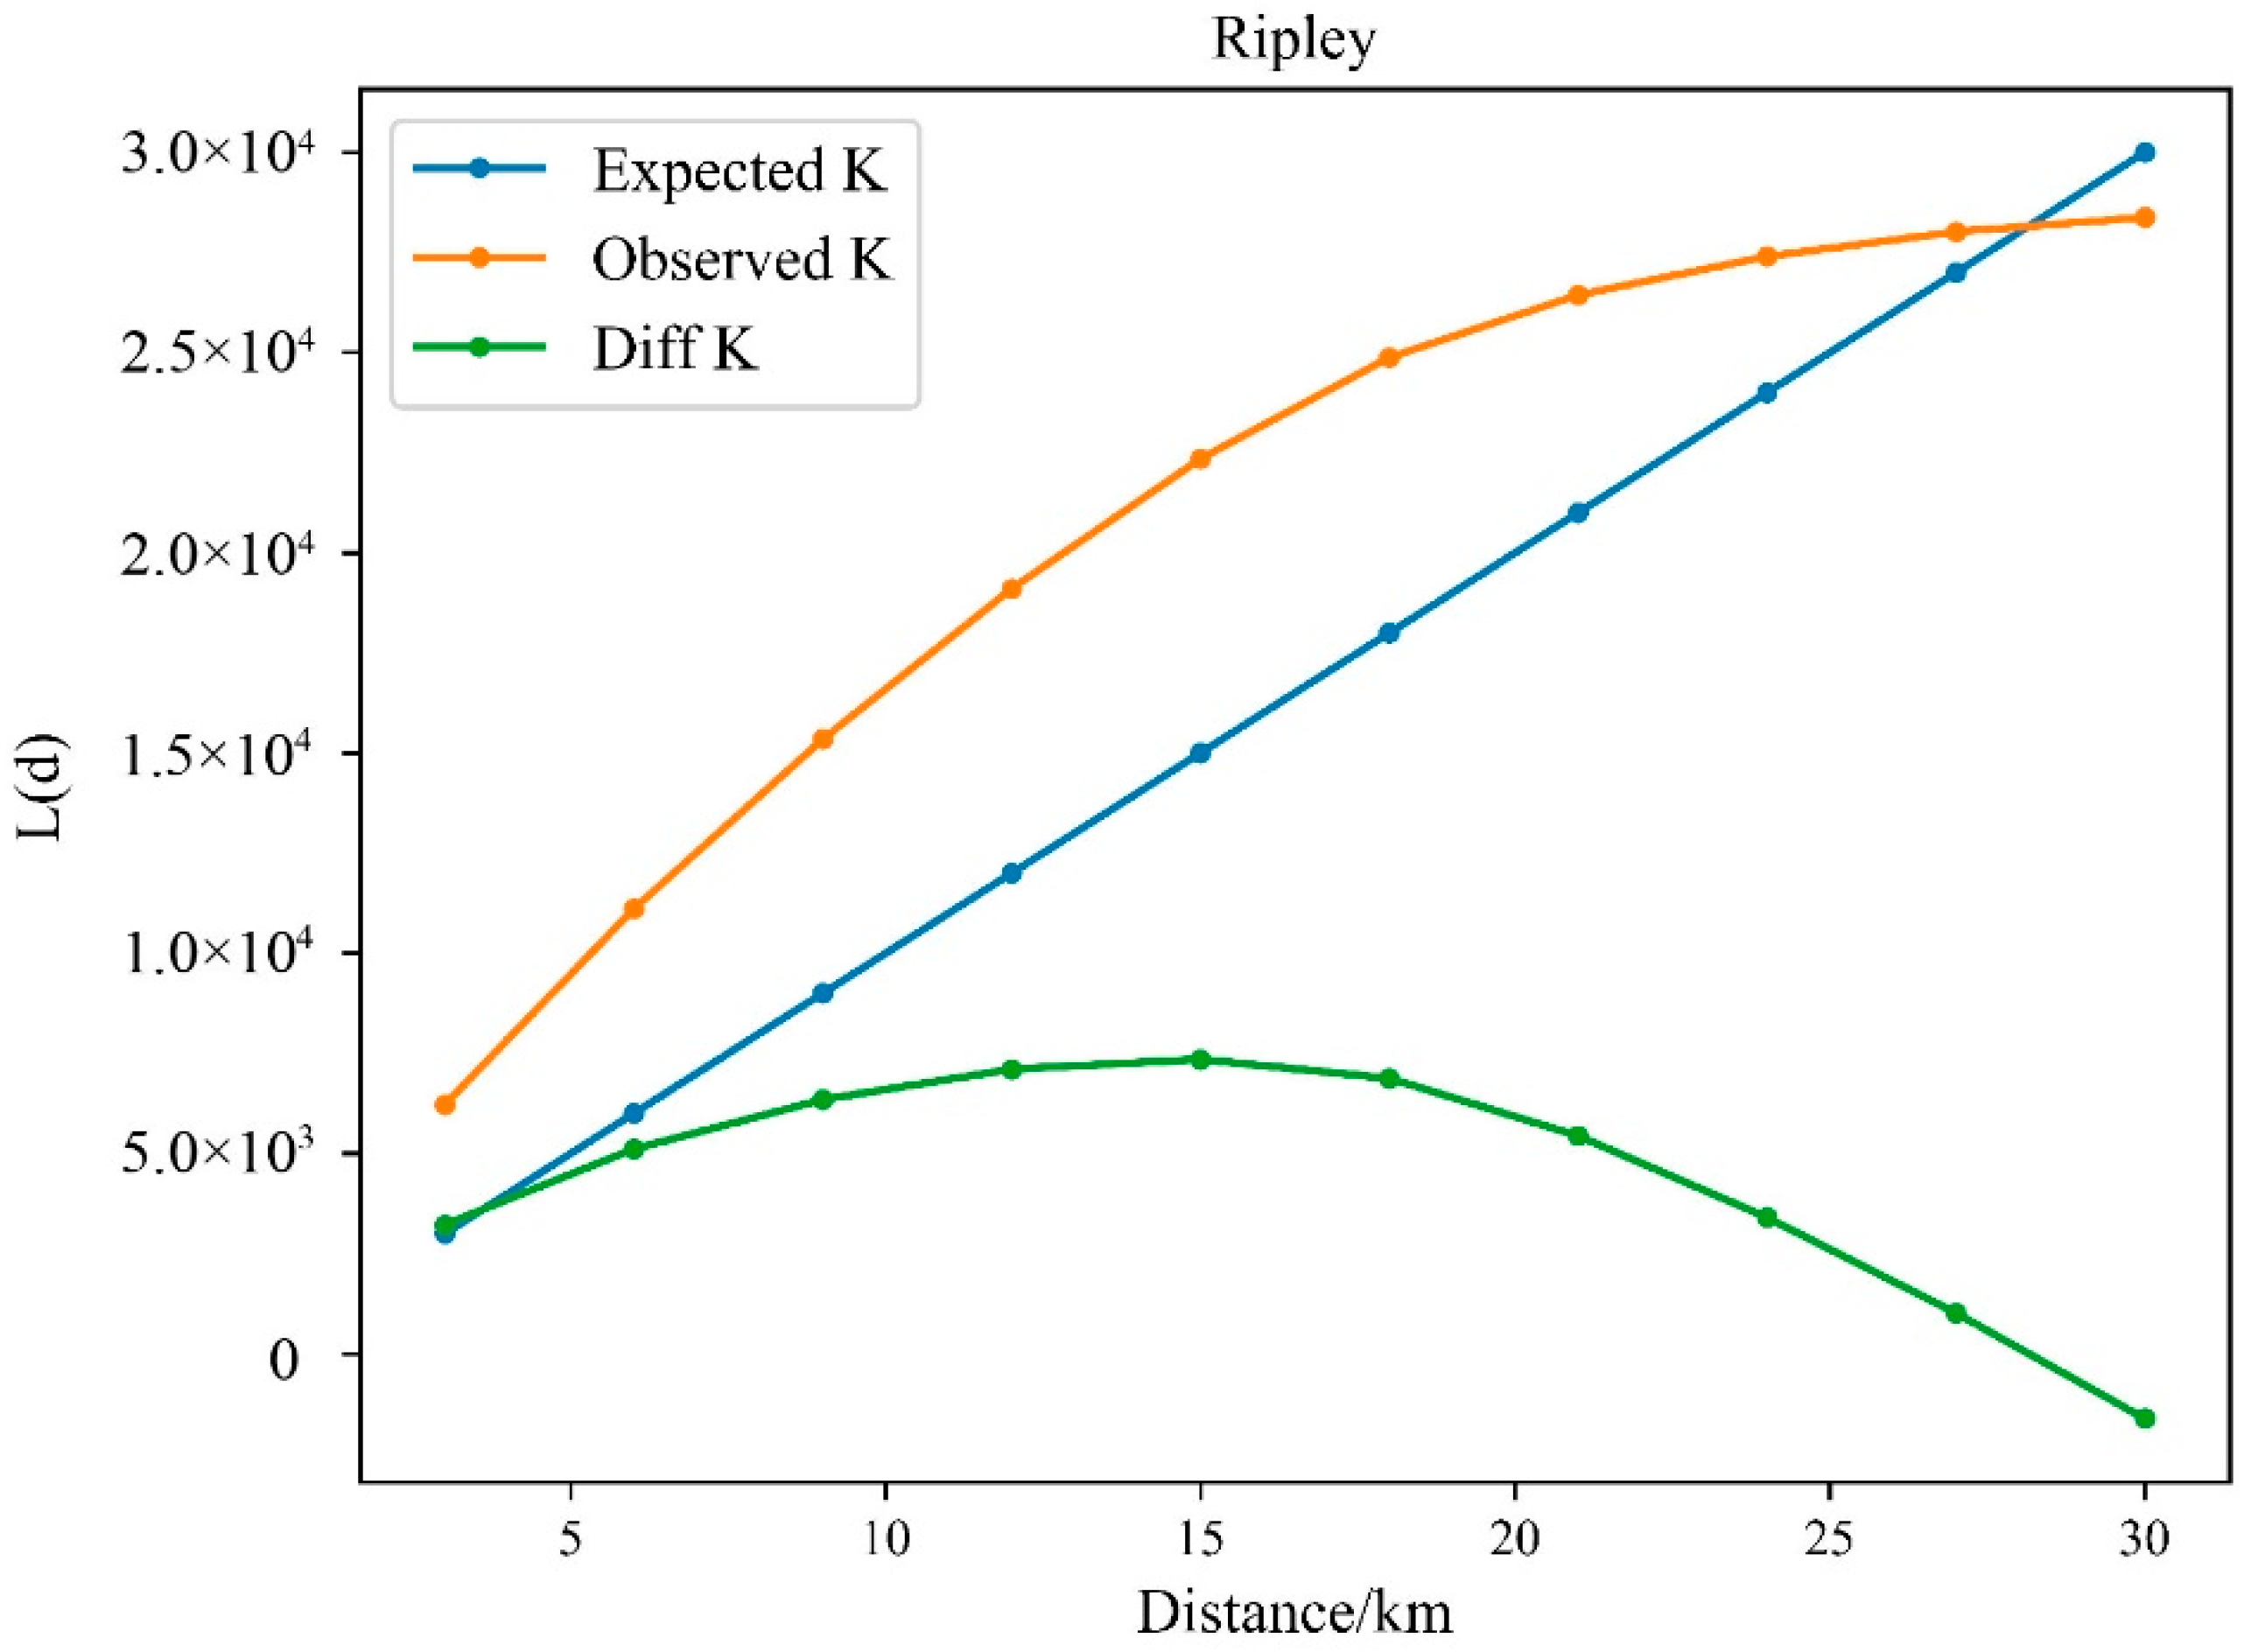
3.3. Ripley’s K(r) Function

Ripley’s K(r) function is a tool to analyze spatial point data over a range of scales, and its statistics can be used to analyze specific spatial distribution patterns of points on different spatial scales [42,43]. Marcon used this function to measure the geographic concentration of industrial areas [44]. Ripley’s K(r) function generally describes the spatial distribution of points as follows. The number of neighbors in the radius r of each point in the data set is compared to the expected number of neighbors to determine whether the point features are spatially aggregated. If the number of neighbors in radius r is higher than the number of neighbors expected, then it can be determined that the neighbors are concentrated around the point. Ripley’s K(r) function is shown in Equation (6) [45]:
K ( r ) = A i = 1 n j = 1 n δ i j ( r ) n 2 ,
i , j = 1 , 2 , , n   and   i j ,
δ i j ( r ) = { 1   ( d i j r ) 0   ( d i j > r ) ,
where A is the area of the studied region; n is the amount of digital signage in the study area; d is the distance scale; d i j is the distance between digital signage i and j. On the basis of K ( r ) , Besag proposed the L ( r ) function (Equation (9)) [20]:
L ( r ) = K ( r ) π r .
L ( r ) can be used to evaluate the characteristics of digital signage distribution. When the actual observation value of L ( r ) is larger than the value expected by a random distribution, this indicates that the digital signage has a tendency to exhibit aggregated distribution; otherwise, the digital signage is considered to be randomly distributed. In this paper, the L ( r ) function is used to analyze the spatial distribution of digital signage in different scales.

3.4. K-Means Clustering

K-means is a classic partition-based clustering algorithm. The algorithm calculates the distance between each point and the selected center and continuously clusters the points according to similarity until the specified requirements are met [22,23]. The basic idea of the algorithm is to initially randomly assign K cluster centers and divide the sample points into clusters according to the nearest neighbor principle. The distance Di between the point and the center of the cluster is calculated using the Euclidean Distance (Equation (10)).
D i = ( x i x 0 ) 2 + ( y i y 0 ) 2 ,
where ( x i , y i ) is coordinates of each point, and ( x 0 , y 0 ) is the coordinates of the cluster center point. Then, the centroid of each cluster is recalculated by the averaging method to determine the center of the new cluster, iterating until the distance in which the cluster heart moves is less than a given value. The new cluster center point ( x 0 , y 0 ) is calculated as Equation (11).
x 0 = i = 1 n x i n ,   y 0 = i = 1 n y i n .

4. Results and Discussion

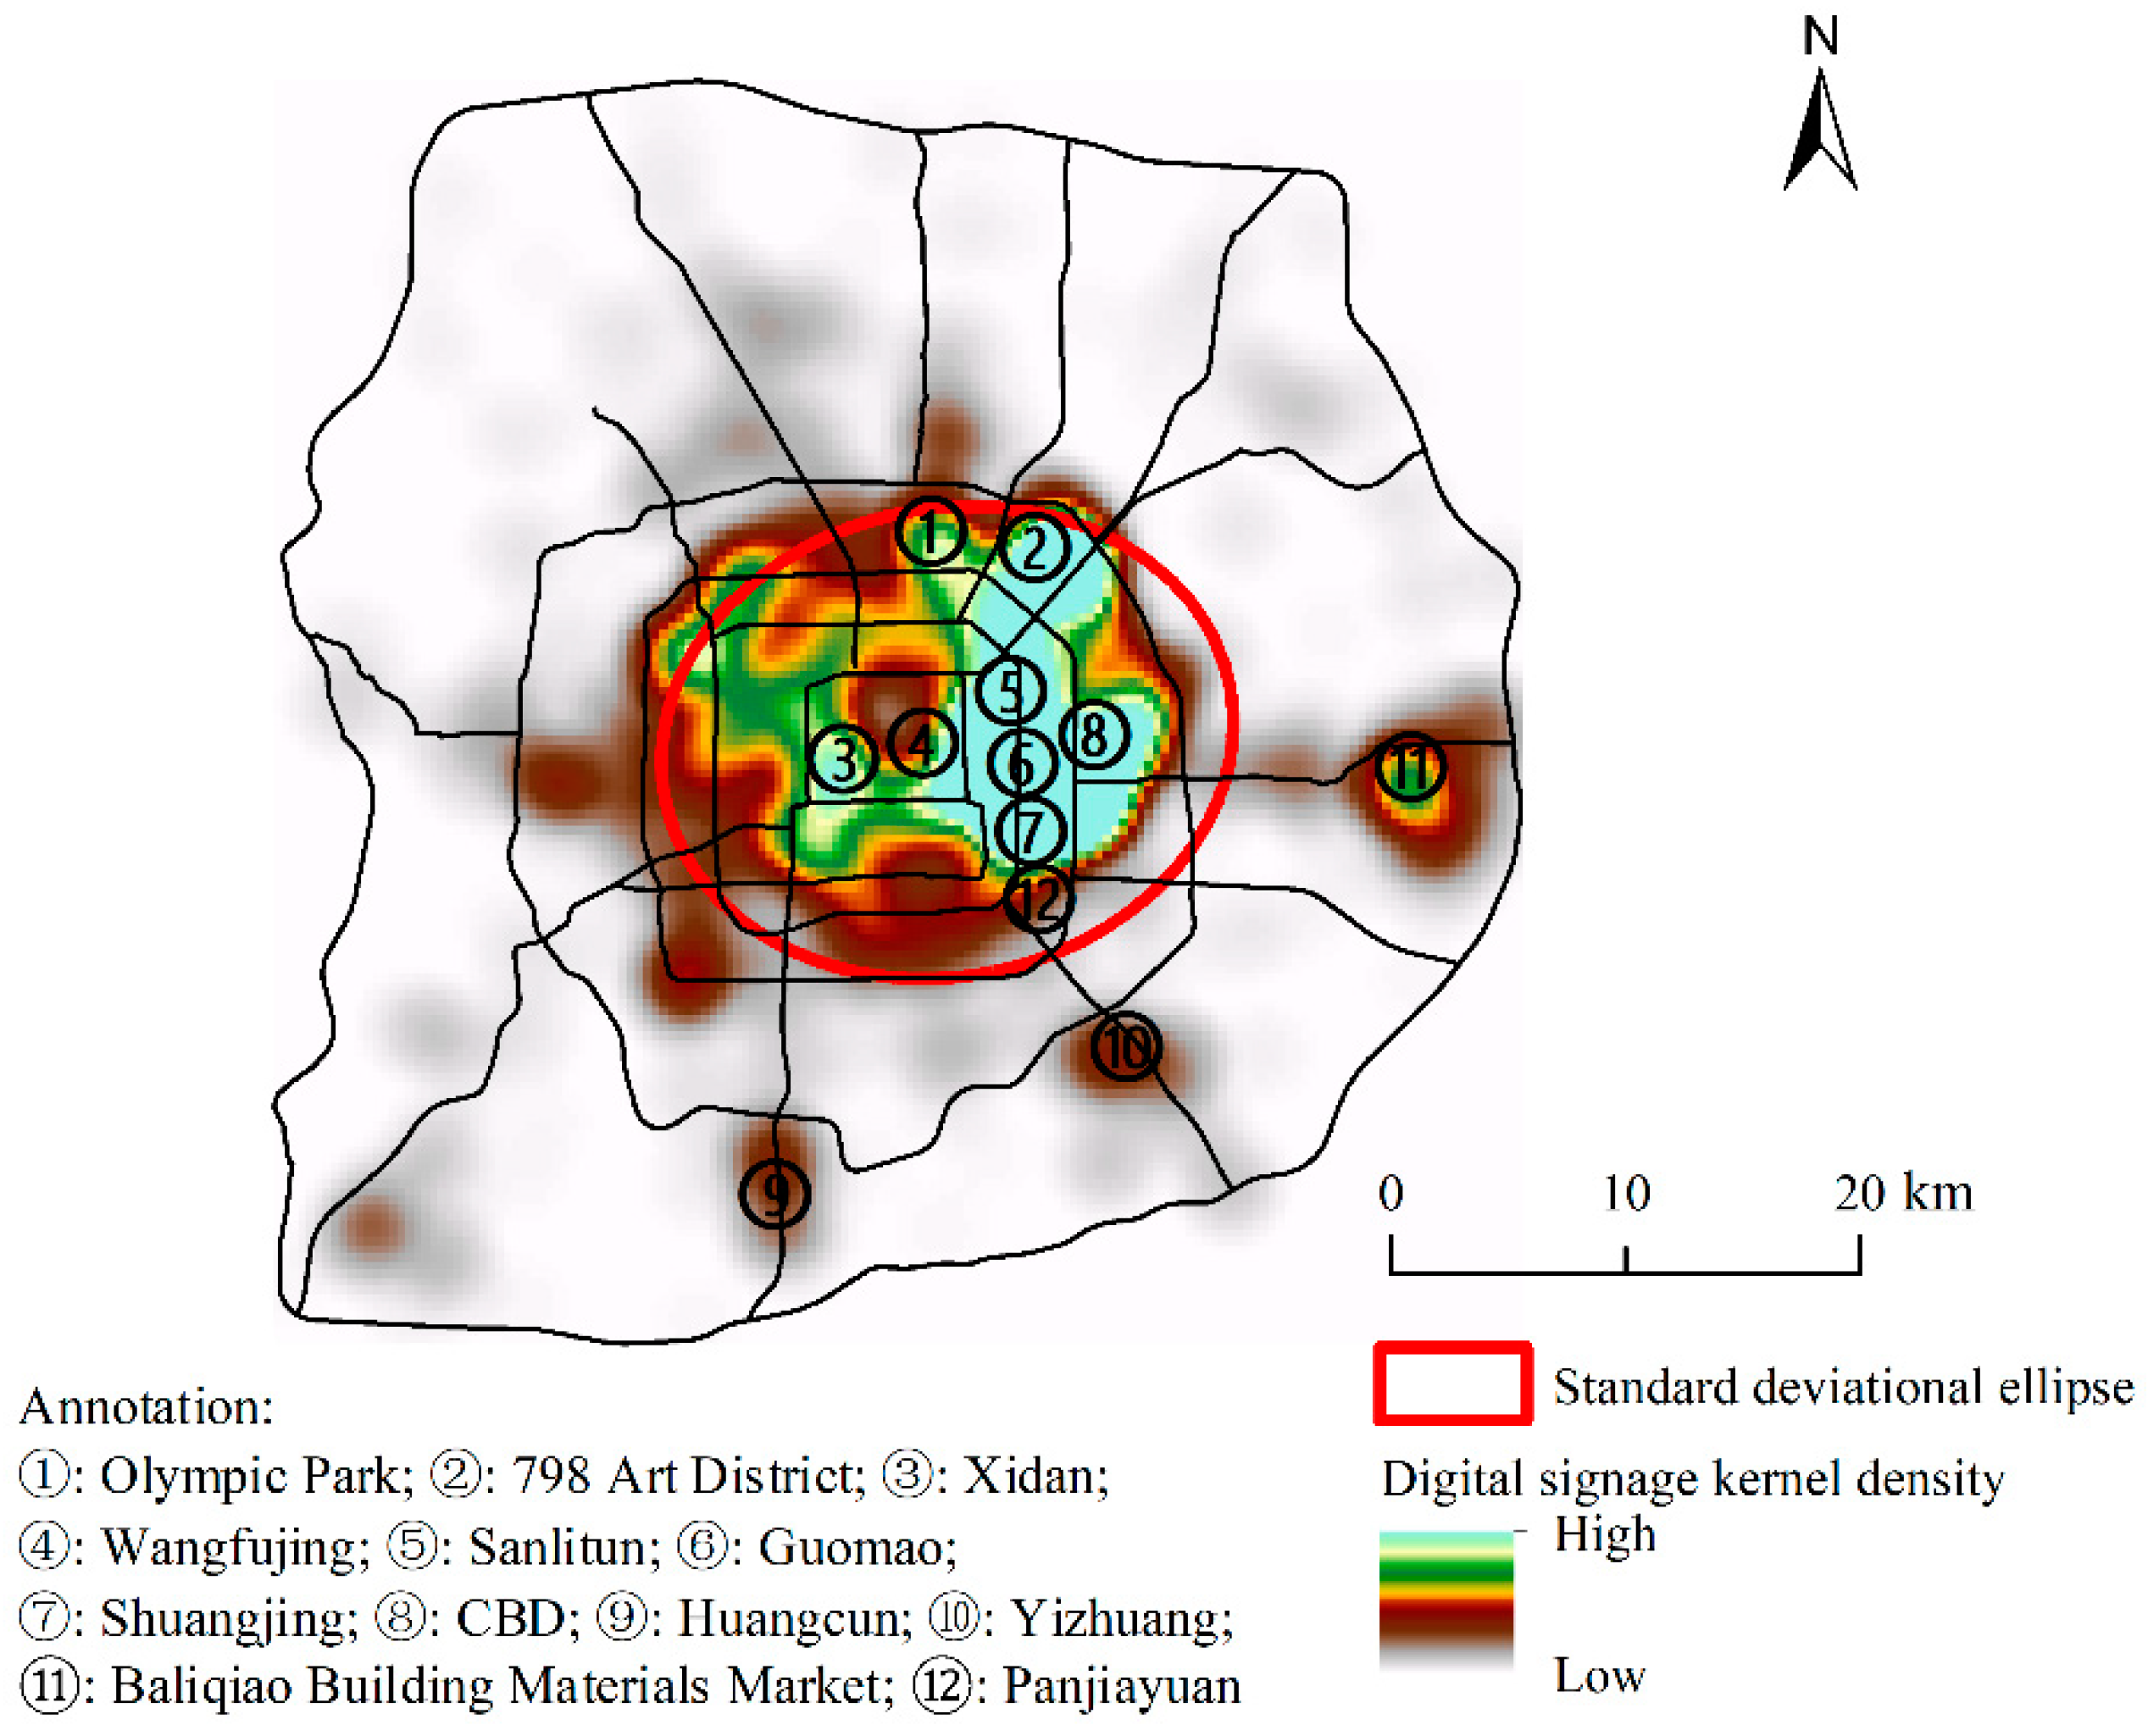
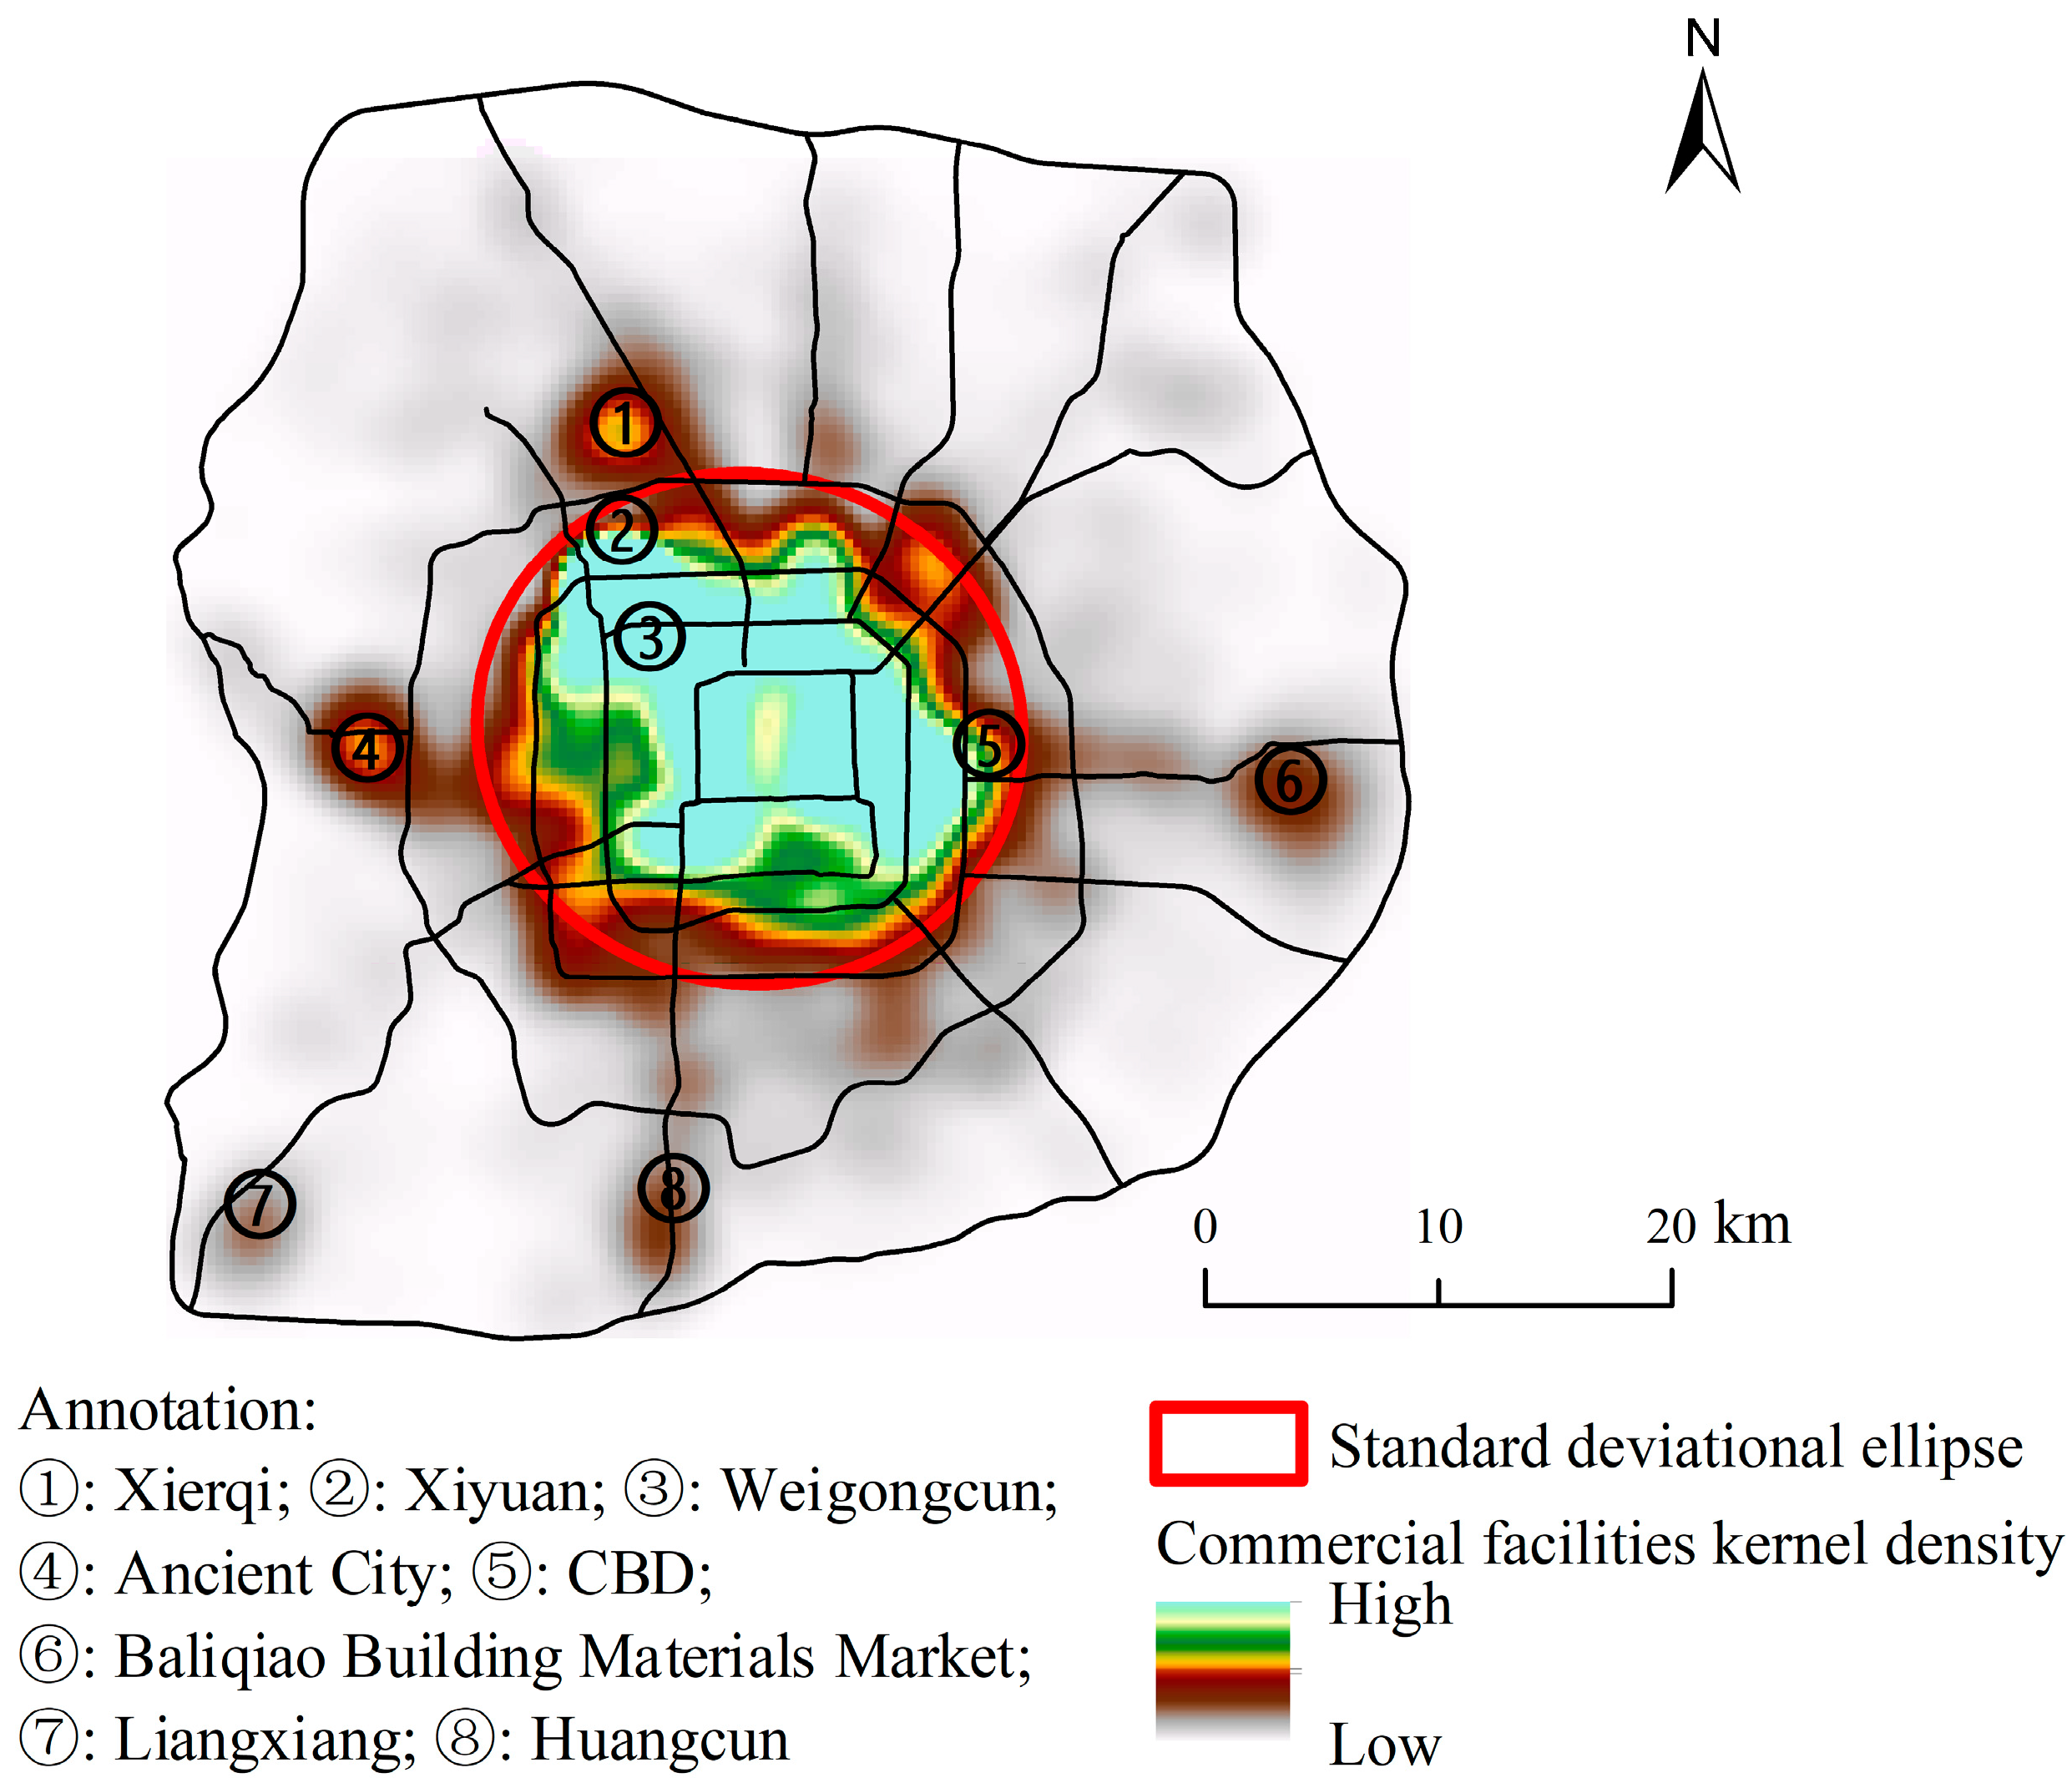
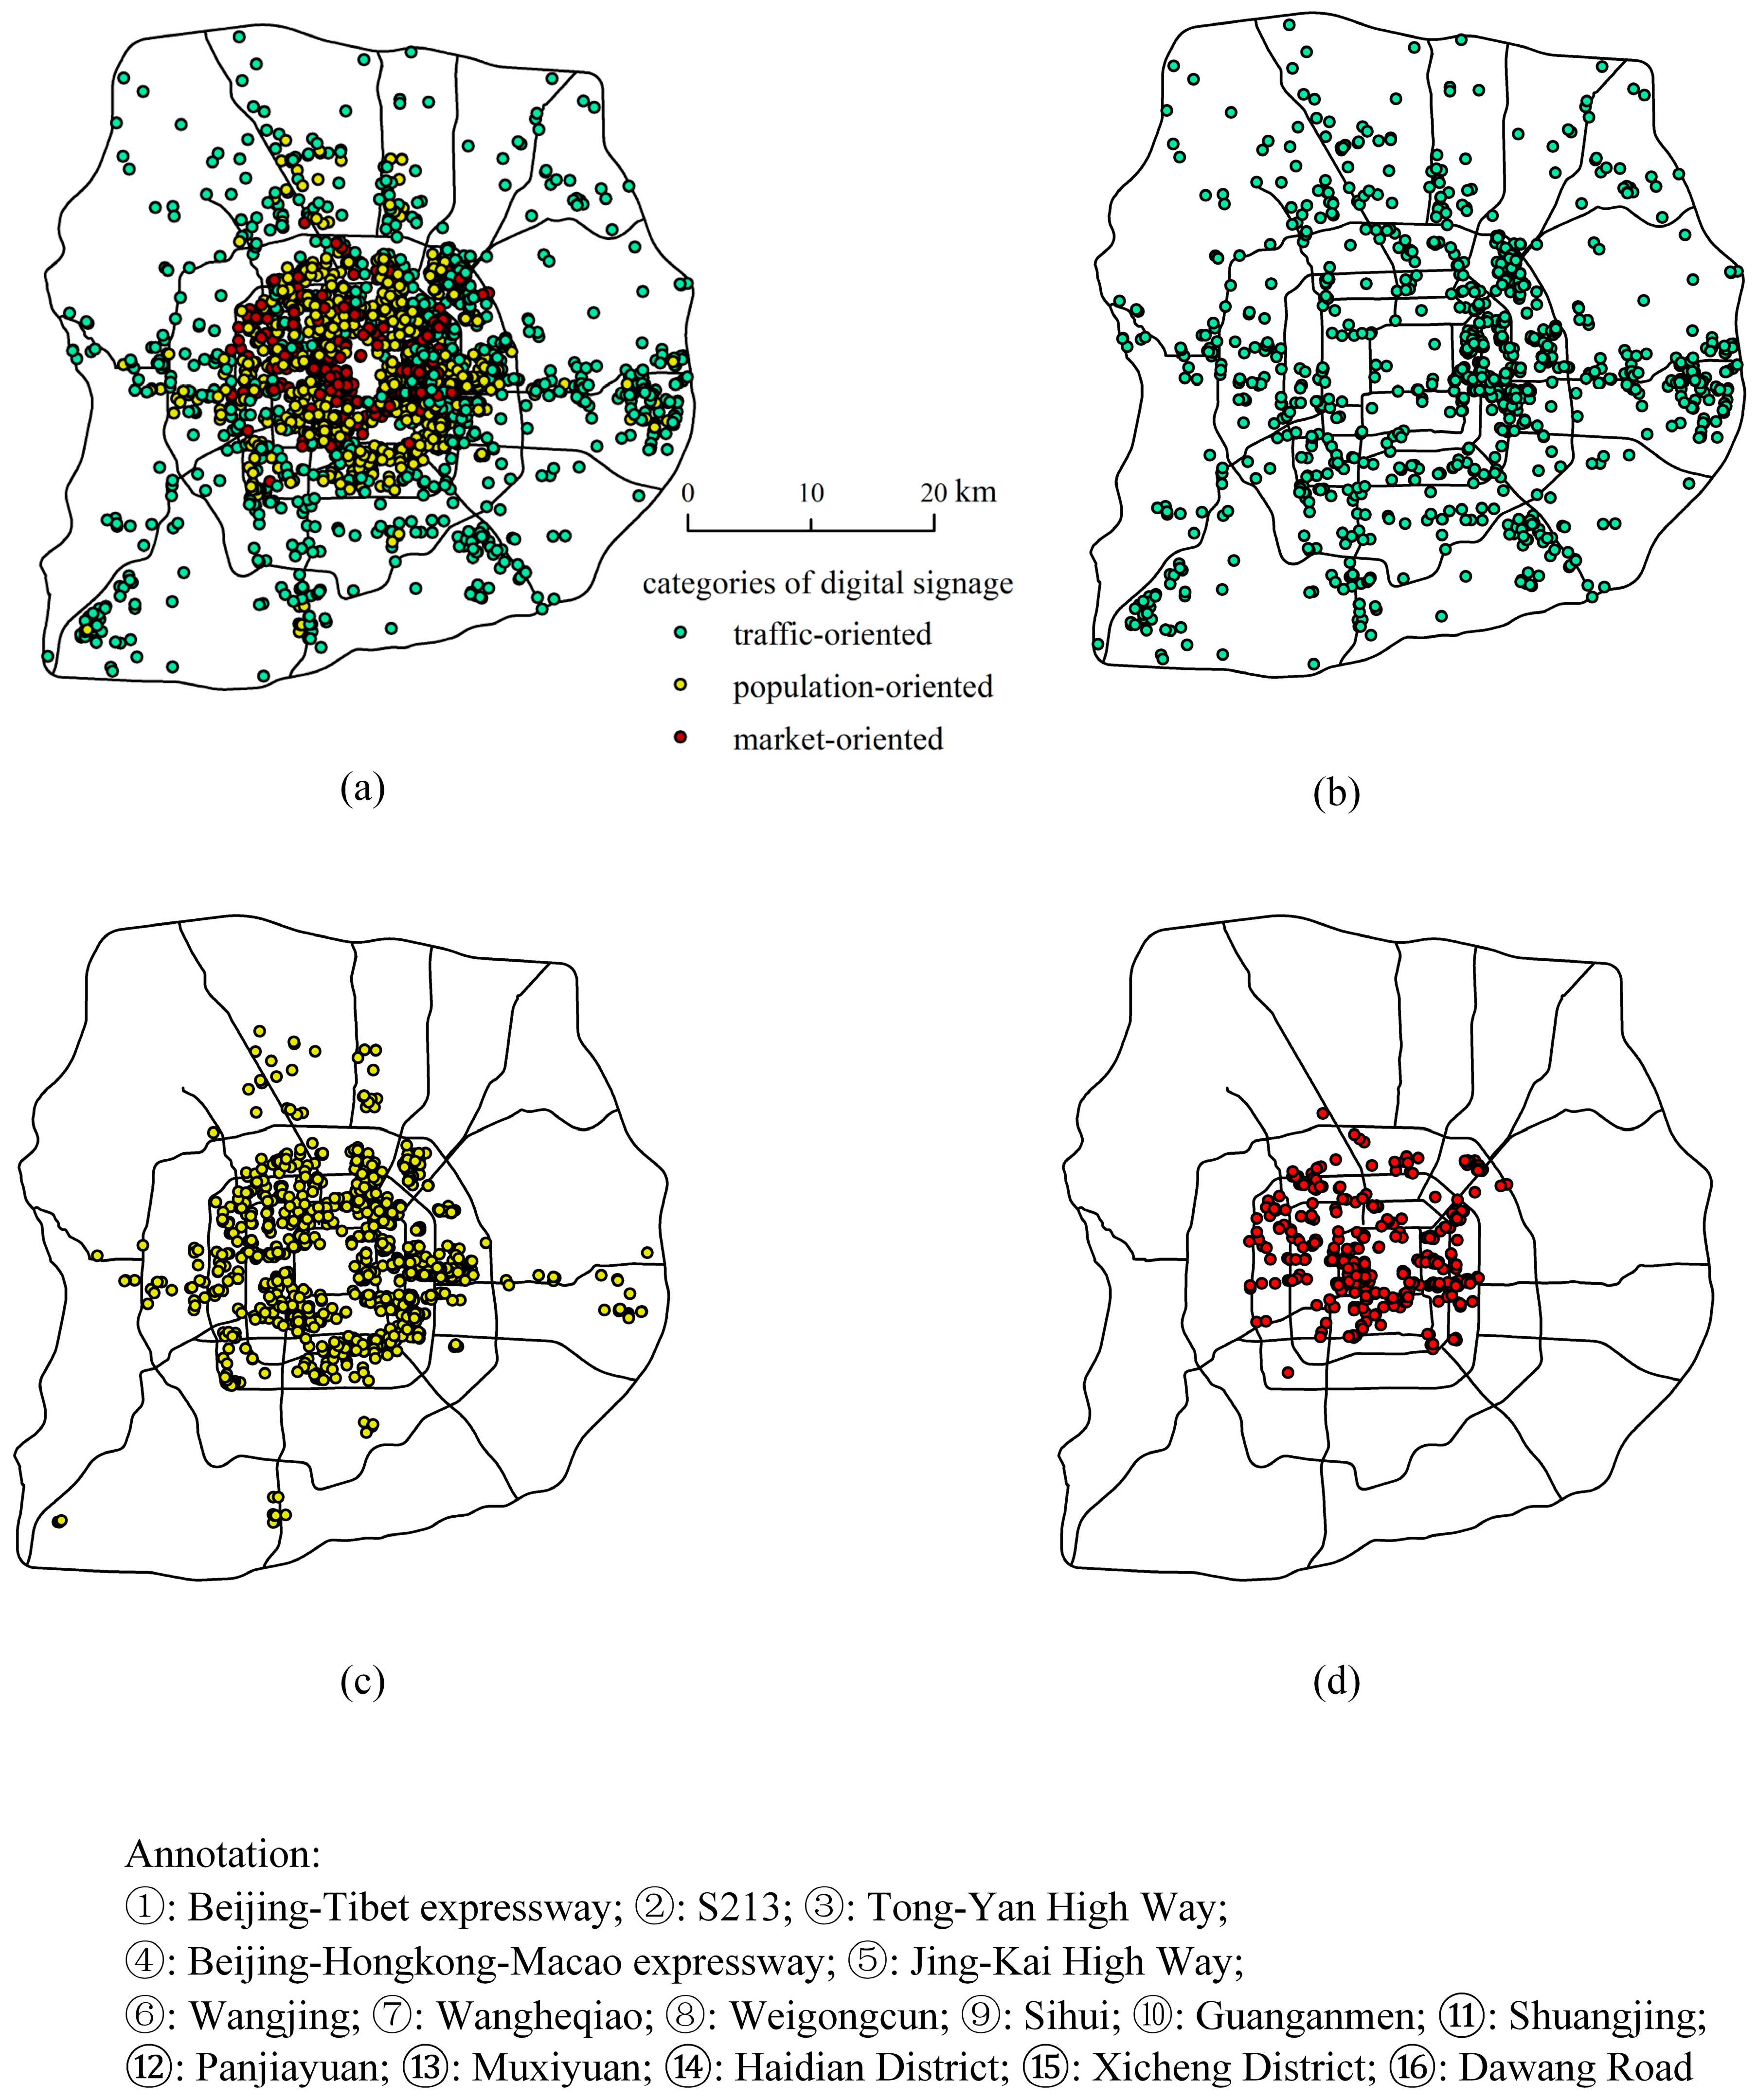
4.1. Spatial Distribution Characteristics of Digital Signage

The density of the digital signage within the Sixth Ring Road in Beijing was calculated. The digital signage generally showed a relatively concentrated distribution (Figure 3). Based on the long axis of the standard deviational ellipse, the distribution density and amount of digital signage in the south area (Shuangjing, central business district (CBD), etc.) are higher than those in the north (Sanlitun, Olympic Park, 798 Art District, etc.). The results indicate that the digital signage within the Sixth Ring Road in Beijing exhibits a biased spatial distribution. Moreover, kernel density analysis investigates the clusters in point data with a direct unsupervised way. However, sometimes it is hard to interpret results without prior knowledge. Additionally, digital signage presents a multi-center distribution trend, and distinctive aggregation centers are sited in Guomao, Shuangjing, Panjiayuan, Siyuanqiao, Xidan and Weigongcun. In addition, there are aggregation centers in areas such as Baliqiao, Yizhuang and Huangcun between the Fifth Ring Road and the Sixth Ring Road in Beijing. Among these centers, the areas with high concentrations are mainly distributed in the Guomao, Shuangjing and Panjiayuan areas of the CBD; Sanlitun, 798 Art District, Olympic Park and other places in the cultural and entertainment industry center; and business districts such as Xidan and Wangfujing (Figure 3).
Moreover, compared with distribution of commercial facilities, the digital signage cover most of the areas with dense commercial facilities distributions, and both digital signage and commercial facilities are concentrated within the Fifth Ring Road (Figure 4). Standard deviational ellipse analysis reveals the direction and distribution of the point data. However, the main direction of the ellipse will not be obvious when the ellipse tends to be a circle. We can find that although commercial facilities have no obvious directional characteristics, combined with kernel density analysis, commercial facilities and digital signage have differences in directional characteristics., it differs from the digital signage in the concentrated distribution mode. There are both spatial consistency and inconsistency between the commercial facilities aggregation center and the digital signage aggregation center. Spatial consistency mainly occurred where commercial facilities are highly concentrated from the Second Ring area to the Sixth Ring areas. The spatial inconsistency mainly occurred where commercial facilities focus on accommodations, catering, wholesale and retail shops, and residential services. For example, students are the main audience in the northwest of Beijing where there are many colleges and universities, and the commercial facilities in this area mainly serve residents. Therefore, the aggregation of the commercial facilities is relatively high while the amount of digital signage is low. In contrast, a large number of cultural, entertainment, and advertising industry bases are concentrated in the northeast and southeast of Beijing. The audiences in these areas are mainly corporate employees, thus the amount of digital signage is relatively higher.
Different from standard aggregation analysis methods, Ripley’s K(r) function measures the aggregation pattern at different spatial scales, but this method only analyzes the point data. When calculated by Ripley’s L(r) function, the boundary correction uses the simulated boundary-outlier method with a confidence of 99% (Figure 5). The Observed K value is much larger than the Expected K value in the range from 3 km to 27 km, which indicates that the concentration of digital signage within the Sixth Ring Road in Beijing is higher than the maximum value of the random distribution in this range. The K observation differences (Diff K) indicate the degree of digital signage aggregation. The change in the curve indicates that the digital signage generally increases first and then gradually stabilizes. Moreover, the observed amount of digital signage is equal to the predicted value at a distance of 27.5 km, and the observed K values gradually become smaller than the expected K values as the distance continues to increase. The variation in the curve indicates that the digital signage is mainly distributed within the Fifth Ring Road and has the highest degree of aggregation in this area. The digital signage within the Sixth Ring Road in Beijing has significant agglomeration characteristics, and the degree of digital signage aggregation is consistent with the overall urban spatial structure of Beijing. The density of digital signage is higher in the central urban area than in the peripheral area, and the commercial area with large investment capital occupies a favorable position in the urban center.

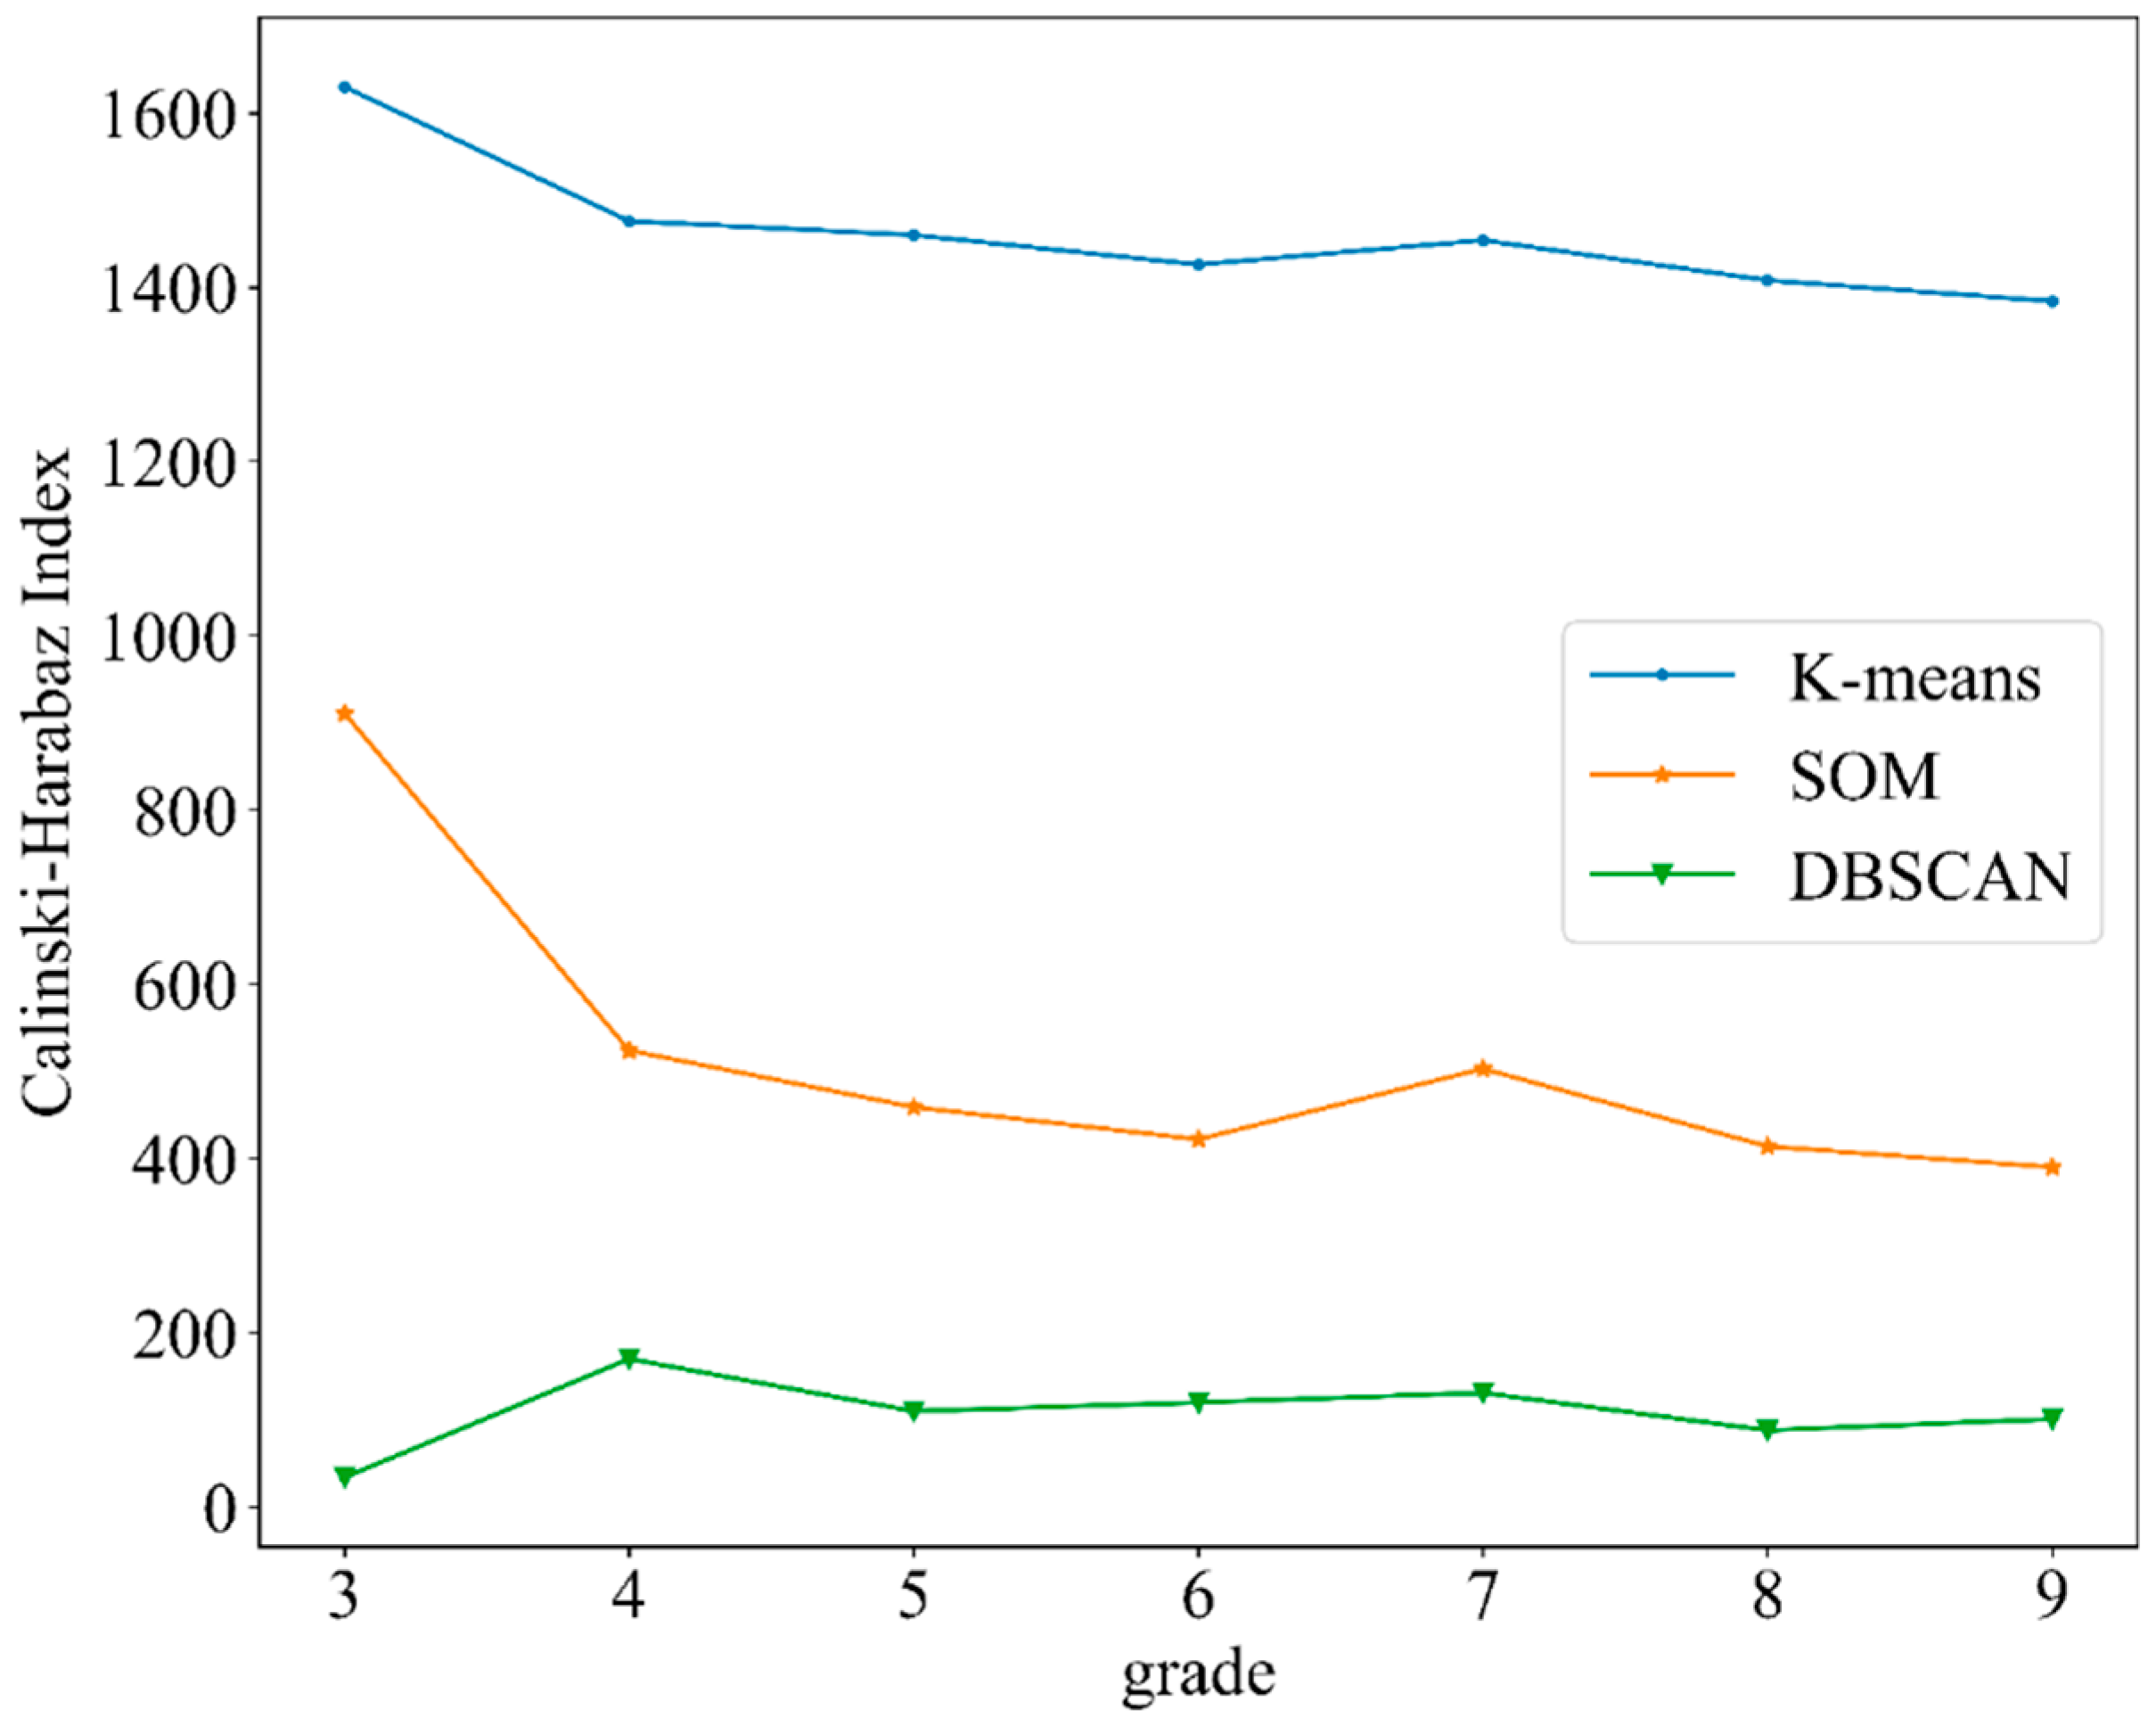
4.2. Hierarchical Characteristics of Digital Signage

Consistent with traditional business geography theory [46], we divide the digital signage level into at least three levels. The K-means, DBSCAN and SOM clustering algorithms are used to divide the digital signage data into grades 3–9 by adjusting their corresponding parameters. Thus, a total of 21 kinds of division results are obtained; then, the quality of the division results is evaluated by the CH index. The CH index is a statistical index that can be used to detect clustering effects, the clustering result is optimal when the CH index reaches the maximum value [47]. The final classification is obtained (Figure 6). In the case of clustering by the three algorithms, the CH index is largest when the K-means algorithm is used with K = 3; that is, the clustering effect is optimal.
To test the rationality of the classified digital signage levels, this paper analyzes whether the influencing factors exhibit significant differences among groups via one-way ANOVA. The analysis is conducted in SPSS (19.0) software. Before using the one-way ANOVA method, it is necessary to check whether the data satisfy the homogeneity of variance assumption. The level of significance (p-value) in the homogeneity of variance test of the four influencing factors are all less than 0.05, and the data do not satisfy the homogeneity of variance assumption (Table 1). Hence, we used the Games-Howell method to compare the single factors between the groups. The results of the Games-Howell test indicate the magnitude of the p-value. If p > 0.05, there is no significant difference in the factors between the two levels. If p < 0.05, there is a significant difference in the factors between the two levels. The results are shown in Table 2. The road signage corresponding to the level 0 and level 1 digital signage are located along the high-speed routes of Jingha Expressway, Beijing–Shanghai Expressway and Airport Expressway, and the other roads that have the rest of the level 0 digital signage also have level 1 digital signage. That is, the traffic network accessibility factors between the two levels of 0 and 1 are similar.
The distribution of different digital signage clusters is shown in Figure 7. The distribution of digital signage is significantly higher in the eastern part of Beijing than in the western region. The spatial distribution of digital signage exhibits strong consistency with the spatial pattern of the radiating road loops of the Beijing-based highway traffic system.
With the analysis of K-means, all digital signage in Beijing is classified into three categories. The first category, labeled traffic-oriented, mainly spreads along the main roads, especially Sixth Ring Roads. The traffic-oriented digital signage has the largest number and is the most widely distributed with weak spatial heterogeneity. The traffic-oriented digital signage is particularly dense in the northeast region between the Second Ring Road and the Fourth Ring road and may be closely related to the rapid construction of the CBD in recent years and the rapid development of the entertainment industry. The traffic-oriented digital signage also has an aggregation center in Tongzhou District, which is related to the construction of the Beijing city subcenter on the eastern edge of the city. It can be foreseen that with the advancement of the construction of the Beijing city subcenter, an area of digital signage will appear in the Tongzhou area. Meanwhile, the traffic-oriented digital signage is relatively dense in the periphery of the city, and there is less digital signage inside the “convex”-shaped old city in Beijing, indicating that the service level of the traffic-oriented digital signage is low. The traffic-oriented digital signage is common between the Fourth Ring Road and the Fifth Ring Road, and most of it appears in urban settlement centers that were previously developed in the outer suburbs, such as Huangcun, Liangxiang and Lishuiqiao.
The second category, labeled population-oriented, is set up in the area with a large population. Most of the population-oriented digital signage is distributed within the Fifth Ring Road, and the distribution density is largest between the Second Ring Road and the Fourth Ring Road. The spatial distribution of population-oriented digital signage is relatively uniform, and there are significantly more in the north than in the south. This pattern is consistent with the development of the north city, which is more advanced than the development of the southern part of the city in Beijing [48]. The population-oriented digital signage has multiple spatial distribution centers. These centers are more representative of the core area of the suburban city settlement center and slightly overlap with the Level 0 digital signage, such as Huangcun, Liangxiang, and Tongzhou Xinhua Street (Figure 7b,c).
The third category, labeled market-oriented, concerns about the commercial development of the city and spreads around the market areas. Most of the market-oriented digital signage, except for the limited amount distributed in the northern area of the North Fourth Ring Road and the Wangjing Street area on the east side of Wangjing, is distributed within the Fourth Ring Road. Haidian District, Xicheng District and Dawang Road are the main distribution areas of market-oriented digital signage. The spatial distribution of the market-oriented digital signage is relatively uneven, reflecting that the regional economic development exhibits an imbalance. The distribution of market-oriented digital signage is obviously biased towards the northern part of the city, which is consistent with the faster trends of urban construction and development in the north of Beijing than the south [49]. The market-oriented digital signage are distributed in the areas with the highest levels of economic development, such as the core area of the Beijing CBD, among the Xicheng traditional commercial areas of Xisi-Xidan-Xuanwumen and the surrounding buffer areas, Wangfujing, Qianmen and other commercial areas. In some areas, such as the Haidian District between the Second Ring Road and the Fourth Ring Road, the market-oriented digital signage and population-oriented digital signage are distributed alternately. The reason lies that the economy in the area enjoys a similarly higher level overall. Against this background, the well-developed area features the market-oriented digital signage while the less-developed area features the population-oriented. However, the north and south sides of the Changchun Street-Hepingmen-Qianmen exhibit alternating distribution characteristics. The reason for this pattern is that the market-oriented digital signage has a wider range of services than the population-oriented digital signage, and the corresponding level of regional economic development is correspondingly higher. The inner city of Beijing city is to the north of Changchun Street-Peace Gate-Qianmen in the Ming and Qing Dynasties, and the outer city is to the south. Due to the historical and political reasons, the inhabitants of the inner city are dignitaries, and the outer city is a prosperous civilian culture. This spatial pattern also represents the pattern of urban commercial, economic space in Beijing. The spatial distribution of digital signage and the historical urban construction and development processes are highly consistent throughout Beijing.

4.3. Correlation Analysis of the Factors Influencing Digital Signage

The data on the operation cost of digital signage and four influencing factors including housing price, the mount of commercial facilities, traffic network centrality index and social network check-ins were analyzed. Because all these data do not obey the normal distribution, and the common parameter test methods such as t-test, chi-square test and analysis of variance require the sample data to follow a normal distribution, so these methods are not suitable for data analysis in this paper.
The Spearman rank correlation coefficient method can describe the correlations among data that do not obey the normal distribution. This method is a nonparametric statistical method. Therefore, this method was used to analyze the correlation between the operation cost of digital signage and the four attributes of housing prices, the number of commercial workers, the traffic network centrality and the social network check-in data. If the significance level between the two variables (Sig.) (Table 3) is less than 0.01, the two variables are correlated; otherwise, they are uncorrelated. As shown in Table 3. the operation cost of digital signage is correlated with the three attributes of commercial facilities, traffic network centrality, and social network check-ins and is not correlated with housing prices. The correlation coefficients between the digital signage price and the three digital signage factors of social network check-ins, traffic network centrality and commercial facilities are 0.17, 0.064 and 0.115, respectively.
According to the correlation analysis, digital signage is more affected by the commercial facilities and social network check-ins factors than traffic network factors. The social network check-ins factors indicate the interest of the urban population in the check-ins location and characterize the floating population. The highest social network check-ins values mainly occur in the university and business district, such as near Peking University and Renmin University of China, and Wangfujing, Shuangjing, Panjiayuan, Sihui, Siyuanqiao and the CBD. This result is also consistent with the dense distribution of digital signage, indicating that the spatial distribution of the urban regional economy is attractive to the flow of the population, and this attraction affects the spatial distribution of digital signage via the audience factor. Therefore, there is a significant correlation between social network check-ins factors and digital signage. The distributions of commercial facilities and digital signage are similar. In particular, Sanlitun, Sihui, Shuangjing and the CBD are not only prosperous areas for the entertainment industry but also prosperous areas for the advertising industry. Advertising companies that place outdoor advertising for entertainment companies need to place digital signage in this area, which is one of the reasons why digital signage is densely distributed in these areas. This result shows that there is also a significant correlation between the commercial facilities size and digital signage. The traffic network centrality patterns show that there are large proportions of the digital signage at ring road and near the main roads. The amount of digital signage within 200 meters of the main ring roads and the main roads were counted, which revealed that 54% of all digital signage in these areas. These results indicate that digital signage is highly correlated with traffic factors. The influence of traffic network centrality on the remaining digital signage is small. Therefore, there is a general correlation between the traffic centrality factor and the digital signage, but the correlation is small.
In particular, Sanlitun, Sihui, Shuangjing, the CBD and other areas are located in the region that is one of the cultural industrial clusters in Beijing. The three influencing factors exhibit dense distributions in this region, indicating that the area is extremely suitable for the deployment of outdoor digital signage. Moreover, the results of the kernel density distribution of digital signage are consistent with this conclusion, and this area is also a dense area of digital signage.

5. Conclusions

We analyzed the spatial characteristics of outdoor commercial digital signage within the Sixth Ring Road in Beijing by using GIS spatial point pattern analysis, spatial cluster analysis and correlation analysis methods. The analyses of the spatial distribution characteristics were used to evaluate the digital signage directionality, agglomeration and scales. The digital signage spatial grading study includes the hierarchical division and verification of digital signage distribution; finally, the correlations between digital signage and influencing factors were analyzed. The following conclusions were obtained:
(1) Beijing digital signage generally presents multiple centers with obvious spatial centrality. The distribution axis shows the spatial distribution pattern of “southwest–northeast”, and the spatial heterogeneity is obvious. The digital signage is mainly distributed within the Fifth Ring Road, and the closer the area is to the city center, the higher the concentration of digital signage. The gathering centers are mainly concentrated in the core areas of the CBD, such as Guomao, Shuangjing and Panjiayuan; Sanlitun, the 798 Art District, Olympic Park and other places in the cultural and entertainment industry center; and Xidan, Wangfujing and other commercial districts.
(2) Through the comparison and analysis of three kinds of clustering algorithms, K-means produced the best classification results. All digital signage in Beijing is classified into three categories, the traffic-oriented, the population-oriented, and the market-oriented. The traffic-oriented mainly spreads along the main roads, especially six ring roads, with relatively high traffic network centrality index. The population-oriented is set up in the area with a large audience, which can be well indicated by social network check-ins. The market-oriented concerns about the commercial development of the city and spreads around the market areas. Moreover, the spatial distribution of digital signage is consistent with the historical urban development of Beijing.
(3) This study selected the four factors related to digital signage of social network check-ins, traffic network centrality, commercial facilities and housing prices to perform a Spearman bivariate correlation analysis with operation cost of digital signage. It was finally determined that among the four influencing factors, social network check-ins, commercial facilities and traffic network centrality were significantly related to digital signage, and social network check-ins, which represent the floating population and the audience, was the most relevant factor.
Through the analysis of the spatial characteristics and factors influencing digital signage, it aims to analyze the spatial distribution of digital signage, effectively carry out hierarchical management, and further clarify the factors influencing digital signage. This study provides a theoretical and practical basis for maximizing the effectiveness of advertising and optimizing the sustainable development of digital signage resources. These results also provide a significant reference for the establishment and improvement of urban functional planning systems.
Moreover, we must point out that although the methods utilized in this research are standard methods, it is a new application of these methods in the research of digital signage. In our work, we focused on the spatial characteristics of the factors, and ignored the difference in the attributes of the data. Every point data of each factor is processed in the same way. Thus, it ignored the important features of the factors that could affect and explain the patterns of digital signage. In the future, the data should be classified into different groups by considering the attributes of data, such as the time-specific elements.

Author Contributions

Conceptualization, Xun Zhang; Data curation, Guangchi Ma; Funding acquisition, Xun Zhang and Xiaohu Zhang; Investigation, Xun Zhang; Methodology, Ying Liu; Project administration, Xun Zhang; Software, Li Jiang; Supervision, Xun Zhang; Validation, Guangchi Ma; Visualization, Yuxue Wang and Conghui Zhao; Writing—original draft, Guangchi Ma; Writing—review & editing, Xiaohu Zhang.

Funding

This research was funded by Support Project of High-level Teachers in Beijing Municipal Universities in the Period of 13th Five–year Plan(CIT&TCD201904037); Humanities and Social Science on Youth Fond of the ministry of Education (grant number 15YJCZH224); China Postdoctoral Science Foundation (grant number 2017M620885); Opening Fund of Capital Circulation Industry Research Base (grant number JD-YB-2017-010).

Acknowledgments

We would like to acknowledge Beijing Key Laboratory of Big Data Technology for Food Safety and Key Laboratory of Resources utilization and Environmental Remediation for providing a research grant to conduct this work. We express gratitude to the editors for the editing assistance. Lastly, we would like to thank the reviewers for their valuable comments and suggestions on our paper.

Conflicts of Interest

The authors declare no conflict of interest.

References

  1. Hyun, W.; Huh, M.Y.; Kim, S.H.; Park, J.Y. Standardizations and considerations on P2P-based contents distribution for digital signage service. In Proceedings of the 17th IEEE International Conference on Advanced Communications Technology (ICACT), PyeonhChang, South Korea, 1–3 July 2015; pp. 509–512. [Google Scholar]
  2. Schaeffler, J. Digital Signage: Software, Networks, Advertising, and Displays a Primer for Understanding the Business; Focal Press: Waltham, MA, USA, 2008; pp. 40–55. [Google Scholar]
  3. Krumm, J. Ubiquitous advertising: The killer application for the 21st century. IEEE Pervasive Comput. 2010, 10, 66–73. [Google Scholar] [CrossRef]
  4. Bauer, C.; Dohmen, P.; Strauss, C. Interactive digital signage—An innovative service and its future strategies. In Proceedings of the IEEE International Conference on Emerging Intelligent Data and Web Technologies, Tirana, Albania, 7–9 September 2011; pp. 137–142. [Google Scholar]
  5. Davies, N.; Langheinrich, M.; Rui, J. Open display networks: A communications medium for the 21st century. Computer 2012, 45, 58–64. [Google Scholar] [CrossRef]
  6. Want, R.; Schilit, B.N. Interactive digital signage. Computer 2012, 45, 21–24. [Google Scholar] [CrossRef]
  7. Lee, J.; Lee, J.; Jung, H.; Moon, S.; Yoon, K. Smart digital signage using smartphone. In Proceedings of the 15th IEEE International Conference on Advanced Communication Technology (ICACT), PyeongChang, South Korea, 27–30 January 2013; pp. 978–981. [Google Scholar]
  8. Grobelny, J.; Michalski, R. Various approaches to a human preference analysis in a digital signage display design. Hum. Factors Ergon. Manuf. 2011, 21, 529–542. [Google Scholar] [CrossRef] [Green Version]
  9. Dennis, C.; Michon, R.; Newman, A.; Brakus, J.J.; Alamanos, E. New insights into the impact of digital signage as a retail atmospheric tool. J. Consum. Behav. 2012, 11, 454–466. [Google Scholar] [CrossRef]
  10. Bonfanti, A. Towards an approach to signage management quality (SMQ). J. Serv. Mark. 2013, 27, 312–321. [Google Scholar] [CrossRef]
  11. Dennis, C.; Brakus, J.J.; Gupta, S.; Alamanos, E. The effect of digital signage on shoppers’ behavior: The role of the evoked experience. J. Bus. Res. 2014, 67, 2250–2257. [Google Scholar] [CrossRef]
  12. Ijaz, M.F.; Tao, W.; Rhee, J.; Kang, Y.S.; Alfian, G. Efficient digital signage-based online store layout: An experimental study. Sustainability 2016, 8, 511. [Google Scholar] [CrossRef]
  13. Inoue, H.; Suzuki, K.; Sakata, K.; Maeda, K. Development of a digital signage system for automatic collection and distribution of its content from the existing digital contents and its field trials. In Proceedings of the IEEE/IPSJ International Symposium on Applications and the Internet, Munich, Bavaria, Germany, 18–21 July 2011; pp. 463–468. [Google Scholar]
  14. Chen, Y. Optimization Design and Implementation of Multimedia Information Publishing System; Fudan University: Shanghai, China, 2013. (In Chinese) [Google Scholar]
  15. Kim, J.S. A study of contact frequency and consumer preference for digital signage advertisement. In Green and Smart Technology with Sensor Applications; Springer: Berlin & Heidelberg, Germany, 2012. [Google Scholar]
  16. Xie, X.; Zhang, X.; Fu, J.; Jiang, D.; Yu, C.; Jin, M. Location recommendation of digital signage based on multi-source information fusion. Sustainability 2018, 10, 2357. [Google Scholar] [CrossRef]
  17. Yu, W.; Ai, T.; Yang, M. Detecting “hot spots” of facility POIs based on kernel density estimation and spatial autocorrelation technique. Available online: https://www.researchgate.net/publication/301557481_Detecting_hot_spots_of_facility_POIs_based_on_kernel_density_estimation_and_spatial_autocorrelation_technique (accessed on 1 May 2019).
  18. Wang, S.; Li, J. Analysis and visualization of POI distribution density based on urban network space. Urban Geotech. Investig. Surv. 2015, 1, 21–25. [Google Scholar]
  19. Tang, L.; Kan, Z.; Liu, H. A kernel density estimation method for linear features in network space. Acta Geodaetica et Cartographica Sinica 2017, 46, 107–113. [Google Scholar]
  20. Besag, J. Contribution to the discussion of Dr. Ripley’s paper. J. R. Stat. Soc. 1977, 39, 193–195. [Google Scholar]
  21. Cottrell, M.; Fort, J.C.; Pagès, G. Theoretical aspects of the SOM algorithm. Neurocomputing 2007, 21, 119–138. [Google Scholar] [CrossRef]
  22. Har-Peled, S.; Kushal, A. Smaller coresets for k-median and k-means clustering. Discrete Comput. Geom. 2005, 37, 3–19. [Google Scholar] [CrossRef]
  23. Likas, A.; Vlassis, N.; Verbeek, J.J. The global k-means clustering algorithm. Pattern Recognition. 2003, 36, 451–461. [Google Scholar] [CrossRef] [Green Version]
  24. Viswanath, P.; Babu, V.S. Rough-DBSCAN: A fast hybrid density based clustering method for large data sets. Pattern Recognit. Lett. 2009, 30, 1477–1488. [Google Scholar] [CrossRef]
  25. Kumar, K.M.; Reddy, A.R.M. A fast DBSCAN clustering algorithm by accelerating neighbor searching using Groups method. Pattern Recognit. 2016, 58, 39–48. [Google Scholar] [CrossRef]
  26. Tramacere, A.; Vecchio, C. γ-ray DBSCAN: A clustering algorithm applied to Fermi-LAT γ-ray data. Astron. Astrophys. 2012, 549, 705–708. [Google Scholar]
  27. Hartigan, J.A.; Wong, M.A. Algorithm as 136: A K-Means clustering algorithm. R. Stat. Soc. 1979, 28, 100–108. [Google Scholar] [CrossRef]
  28. Łukasik, S.; Kowalski, P.A.; Charytanowicz, M. Clustering using flower pollination algorithm and Calinski-Harabasz index. In Proceedings of the IEEE Congress on Evolutionary Computation, Vancouver, BC, Canada, 24–29 July 2016; pp. 2724–2728. [Google Scholar]
  29. Lisa, M.L.; Joanne, C.K.; Keselman, H.J. Consequences of assumption violations revisited: A quantitative review of alternatives to the One-Way analysis of variance F test. Am. Educ. Res. Assoc. 1996, 66, 579–619. [Google Scholar]
  30. Xie, Z.; Yan, J. Kernel density estimation of traffic accidents in a network space. Comput. Environ. Urban Syst. 2008, 32, 396–406. [Google Scholar] [CrossRef]
  31. Yan, X. Beijing business development outlook: Building an international business center. J. Beijing Technol. Bus. Univ. 2012, 27, 5–8. [Google Scholar]
  32. Four key factors in billboard site selection. Available online: http://butlertill.com/blog/media/offline/four-key-factors-in-billboard-site-selection/ (accessed on 26 January 2015).
  33. Aboulola, O.I. GIS spatial analysis: A new approach to site selection and decision making for small retail facilities. Ph.D. Thesis, Claremont Graduate University, Claremont, CA, USA.
  34. Jayasinghe, A.; Sano, K.; Nishiuchi, H. Explaining traffic flow patterns using centrality measures. Int. J. Traffic Transp. Eng. 2015, 5, 134–149. [Google Scholar] [CrossRef]
  35. Zhong, Y.; Yuan, N.J.; Zhong, W.; Zhang, F.Z.; Xie, X. You are where you go: Inferring demographic attributes from location check-ins. In Proceedings of the 8th ACM international conference on web search and data mining, Shanghai, China, 2–6 February 2015; pp. 295–304. [Google Scholar]
  36. Yao, R.; Li, W. The life-cycle effects of house price change. J. Money Credit Bank 2007, 39, 1375–1409. [Google Scholar]
  37. Eryando, T.; Susanna, D.; Pratiwi, D. Standard deviational ellipse (SDE) models for malaria surveillance, case study: Sukabumi District-Indonesia, In 2012. Malar. J. 2012, 11, 1–2. [Google Scholar] [CrossRef]
  38. Yuill, R.S. The standard deviational ellipse; an updated tool for spatial description. Geografiska Annaler 1971, 53, 28–39. [Google Scholar] [CrossRef]
  39. Portnov, B.A.; Zusman, M. Big Data Analysis. In Encyclopedia of Business Analytics and Optimization; IGI Global Publishers: Hershey, PA, USA, 2014; p. 13. [Google Scholar]
  40. Cai, X.; Wu, Z.; Cheng, J. Analysis of road network pattern and landscape fragmentation based on kernel density estimation. Chin. J. Eco. 2012, 31, 158–164. [Google Scholar]
  41. Seaman, D.E.; Powell, R.A. An Evaluation of the accuracy of kernel density estimators for home range analysis. Ecology 1996, 77, 2075–2085. [Google Scholar] [CrossRef]
  42. Haase, P. Spatial pattern analysis in ecology based on Ripley’s K-function: Introduction and methods of edge correction. J. Veg. Sci. 2010, 6, 575–582. [Google Scholar] [CrossRef]
  43. Mrkvicka, T.; Goreaud, F.; Chadoeuf, J. Spatial prediction of the mark of a location-dependent marked point process: How the use of a parametric model may improve prediction. Kybernetika 2011, 47, 696–714. [Google Scholar]
  44. Mislove, A.; Marcon, M.; Gummadi, K.P.; Druschel, P.; Bhattacharjee, B. Measurement and analysis of online social networks. In Proceedings of the 7th ACM SIGCOMM conference on Internet measurement, San Diego, CA, USA, 24–26 October 2007; pp. 29–42. [Google Scholar]
  45. Meng, B.; Zhang, J.; Wang, J. Application of spatial analysis to the research of real estate: Taking Beijing as a case. Geogr. Res. 2005, 24, 956–964. [Google Scholar]
  46. Proudfoot, M.J. City Retail Structure. Econ. Geogr. 2016, 13, 425–428. [Google Scholar] [CrossRef]
  47. Zhang, X.; Jin, M.; Fu, J.; Hao, M.; Yu, C.; Xie, X. On the risk assessment of terrorist attacks coupled with multi-source factors. ISPRS Int. J. Geo-Inf. 2018, 7, 354. [Google Scholar] [CrossRef]
  48. Wang, J.; Deng, Y.; Song, C.; Tian, D. Measuring time accessibility and its spatial characteristics in the urban areas of Beijing. J. Geogr. Sci. 2016, 26, 1754–1768. [Google Scholar] [CrossRef] [Green Version]
  49. Zhu, H.; Liu, J.; Chen, C.; Lin, J.; Tao, H. A spatial-temporal analysis of urban recreational business districts: A case study in Beijing, China. J. Geogr. Sci. 2015, 25, 1521–1536. [Google Scholar] [CrossRef] [Green Version]
Figure 1. The area within the Sixth Ring Road in Beijing.
Ijgi 08 00207 g001
Figure 2. The workflow of the research.
Ijgi 08 00207 g002
Figure 3. Kernel density and standard deviational ellipse analysis of digital signage.
Ijgi 08 00207 g003
Figure 4. Kernel density and standard deviational ellipse analysis of commercial facilities.
Ijgi 08 00207 g004
Figure 5. Ripley’s L(r) function results for digital signage.
Ijgi 08 00207 g005
Figure 6. CH index of different algorithm rankings.
Ijgi 08 00207 g006
Figure 7. Results of K-means clustering classification ((a) K-means clustering level division; (b) The distribution of traffic-oriented digital signage; (c) The distribution of population-oriented digital signage; (d) The distribution of market-oriented digital signage).
Ijgi 08 00207 g007
Table 1. Homogeneity of variance test.
Levene Statisticsdf1df2p
Social Check-ins
(Sina Weibo)
117.734238200.000
Housing Price31.741238200.000
Traffic Network Centrality291.468238200.000
Commercial Workers470.684238200.000
Table 2. Games-Howell test results.
Dependent Variable(I) Category(J) Categoryp
Social Check-ins
(Sina Weibo)
010.000
20.000
100.000
20.000
200.000
10.000
Housing Price010.000
20.000
100.000
20.000
200.000
10.000
Traffic Network Centrality010.927
20.000
100.927
20.000
200.000
10.000
Commercial Workers010.000
20.000
100.000
20.000
200.000
10.000
Table 3. The Spearman correlation analysis—Sig. (two-tailed) and correlation coefficient between the operation cost of digital signage and four attributes.
Social Network Check-ins (Sina Weibo)Housing PriceTraffic Network CentralityCommercial Workers
Sig. (two-sided test)0.000 **0.0550.000 **0.000 **
Correlation0.1700.0310.0640.115
**: Correlation exists when the significance level (Sig.; two-tailed) is less than 0.01.

