Article

Adaptive Construction of the Virtual Debris Flow Disaster Environments Driven by Multilevel Visualization Task

1
Faculty of Geosciences and Environmental Engineering, Southwest Jiaotong University, Chengdu 610031, China
2
School of Civil Engineering and Architecture, Southwest Petroleum University, Chengdu 610500, China
*
Author to whom correspondence should be addressed.
ISPRS Int. J. Geo-Inf. 2019, 8(5), 209; https://0-doi-org.brum.beds.ac.uk/10.3390/ijgi8050209
Submission received: 21 March 2019 / Revised: 16 April 2019 / Accepted: 3 May 2019 / Published: 7 May 2019

Abstract

:
The construction of a virtual debris flow disaster environment is of great significance in debris flow disaster prevention, risk assessment, accurate simulation, and disaster emergency response. However, existing research on virtual disaster environments mainly focus on the specific visualization task requirements of single-type users, and the multilevel visualization task requirements of multitype users are generally not met. In this paper, an adaptive construction method for virtual debris flow disaster environments driven by multilevel visualization task is proposed based on the characteristics of users with different professional knowledge backgrounds and requirements in disaster emergency response scenarios. The on-demand construction of virtual debris flow disaster environments and the corresponding diverse organization and dynamic scheduling technologies are discussed in detail. Finally, the Qipan Gully debris flow disaster is selected for experimental analysis, and a prototype system is developed. The experimental results show that the proposed method can adaptively construct virtual debris flow disaster environments according to the multilevel visualization task requirements of multitype users in debris flow disaster emergency response scenarios. This approach can provide efficient rendering of disaster scenes and appropriate disaster information to multitype users who are involved in debris flow disaster emergency response scenarios.

1. Introduction

China is a natural disaster-prone country. Natural disasters have caused extensive property losses and led to loss of life, and debris flow disasters are a type of natural disaster that frequently occurs in mountainous areas. These disasters are characterized by high speeds, broad impacts and destructiveness [1,2,3,4]. Therefore, visualizing and accurately expressing disaster information are of great significance for guiding disaster prevention, risk assessment, and emergency response measures. Debris flow disaster areas usually contain a large number of geographical entities that are intertwined and complicated. Thus, simulating the geographical environment and evolution process of debris flow disasters is a key scientific problem that must urgently be solved [5,6,7]. Moreover, the construction of a virtual disaster environment would provide a new method for disaster simulation, prediction and analysis [8,9].
Lin officially proposed new geography language and analysis tools based on computer and network technology called VGE (virtual geographic environment) [10,11]. This approach has been widely used to solve scientific problems related to multidimensional visual expression, dynamic process simulation and public participation in the development of geographic information science [12,13]. The virtual disaster environments are oriented to the requirements of disaster emergency response and can be used to visualize disaster scenes and disaster information, as well as simulate the dynamic evolution process of disasters. The virtual disaster environments encompass disaster scene interactions, disaster information analysis and disaster predictions to assist users in perceiving, understanding, recognizing and exploring disaster scenes [13,14,15,16]. In order for the construction of a virtual debris flow disaster environments to improve the expression and sharing of disaster knowledge and assist users in conducting simulation, analysis, prediction and decision-making tasks associated with debris flow disasters [15,16,17]. Compared with a general VGE, the construction of a virtual disaster environment must consider a large variety of multisource and related disaster data; therefore, the presentation of a virtual disaster environment is highly complicated. Additionally, a large number of relevant individuals are involved in the disaster emergency process; these participants with different professional knowledge backgrounds are usually located in different areas and use diverse visualization terminals [18,19,20]. Therefore, it is necessary to comprehensively consider the locations, professional knowledge backgrounds, and diverse visualization terminals of users in disaster emergency response scenarios to adaptively construct virtual debris flow disaster environments for diverse visualization task requirements [21,22]. Such methods must be applicable to various debris flow disaster data in different fields and with different structures and complexities.
Many scholars have studied disaster scene visualization and disaster simulation analysis by constructing VGEs. Zhu constructed a VGE to simulate and analyze flood disasters. The VGE provided users with an intuitive, efficient and interactive visualization environment to explore and analyze disaster scenes. A collaborative VGE was further proposed to create a collaborative workflow and perform flood emergency response simulations and risk assessments in an efficient and collaborative approach [23,24,25,26]. Ding proposed an integrated VGE simulation framework that automated the accumulation and manipulation of sensor data to perform dynamic geodata analysis and simulate the spatial-temporal process of flood disasters [27]. Liu proposed an optimized simulation and visual analysis method for dam failure flood disasters based on diverse computing systems. Flood simulation data were organized according to the performance of different terminals, and a multiresolution flood virtual scene was constructed for visualization analysis [28]. Beni added the ability to manage and model the 3D and dynamic properties of spatial data related to the disaster, proposed 3D dynamic simulation method to support disaster management, and applied the method to flood simulation [29]. Bates developed a flood simulation system to simulate and predict flood inundation [30]. Yin developed a VGE system for debris flow emergency response and risk assessment in residential areas; the system integrated debris flow numerical simulations, risk assessment and 3D dynamic visualization to effectively support debris flow disaster emergency response analysis and rapid assessment [31,32]. Wang developed a collaborative VGE system for fire simulation and virtual fire training [33]. A platform named ANYWHERE (Multi-Hazard Forecasting Products)was developed for multi-hazard forecasting impact and localization due to weather and climate events. The platform constructs a series algorithm model for simulation, risk assessment and forecasting of flood, debris flow and landslide disasters [34,35,36]. Avagyan developed a VGE system that enabled visualizations and risk assessments of typical natural disasters and accidents such as floods, large-scale fires, leaks and explosions [37]. Kim proposed a slope-based intelligent 3D disaster simulation method based physic engine to simulate various 3D disaster scenes include landslide and flood [38]. In summary, many scholars have researched the construction of VGEs for disaster emergency response scenarios, and there are many relevant studies based on collaborative efforts to explore the mechanisms of disaster simulation and risk assessment using diverse terminals. However, these studies have mainly focused on the construction of VGEs based on the specific requirements of single-type users and have failed to consider the features and preferences of multitype users in disaster emergency response scenarios to establish diverse visualization task requirements. Therefore, there is a lack of research on the construction of virtual disaster environments considering the visualization task requirements of multitype users.
To address the above problems, this paper proposes an adaptive construction driven by multilevel visualization task method for virtual debris flow disaster environments. The aim is to adaptively construct virtual debris flow disaster environments according to the multilevel visualization task requirements of multitype users in debris flow disaster emergency response scenarios. We mainly focus on the multilevel visualization task in debris flow disaster emergency response scenarios and on-demand construction methods for virtual debris flow disaster environments. Additionally, the diverse organization and dynamic scheduling of debris flow disaster data are considered. The remainder of this paper is organized as follows. In Section 2, a framework of virtual debris flow disaster environments and a multilevel visualization task model for disaster emergency response are constructed. Then, on this basis, we analyze the relationships among users, demands, tasks, data and scene objects in debris flow disaster emergency response and propose an on-demand construction method for virtual debris flow disaster environments. Finally, a diverse organization and dynamic scheduling method for debris flow disaster data according to terminal performance is proposed. Section 3 describes the development of a prototype system and the experimental analysis. Section 4 presents the conclusions of this study and provides a brief discussion of future work.

2. Methodology

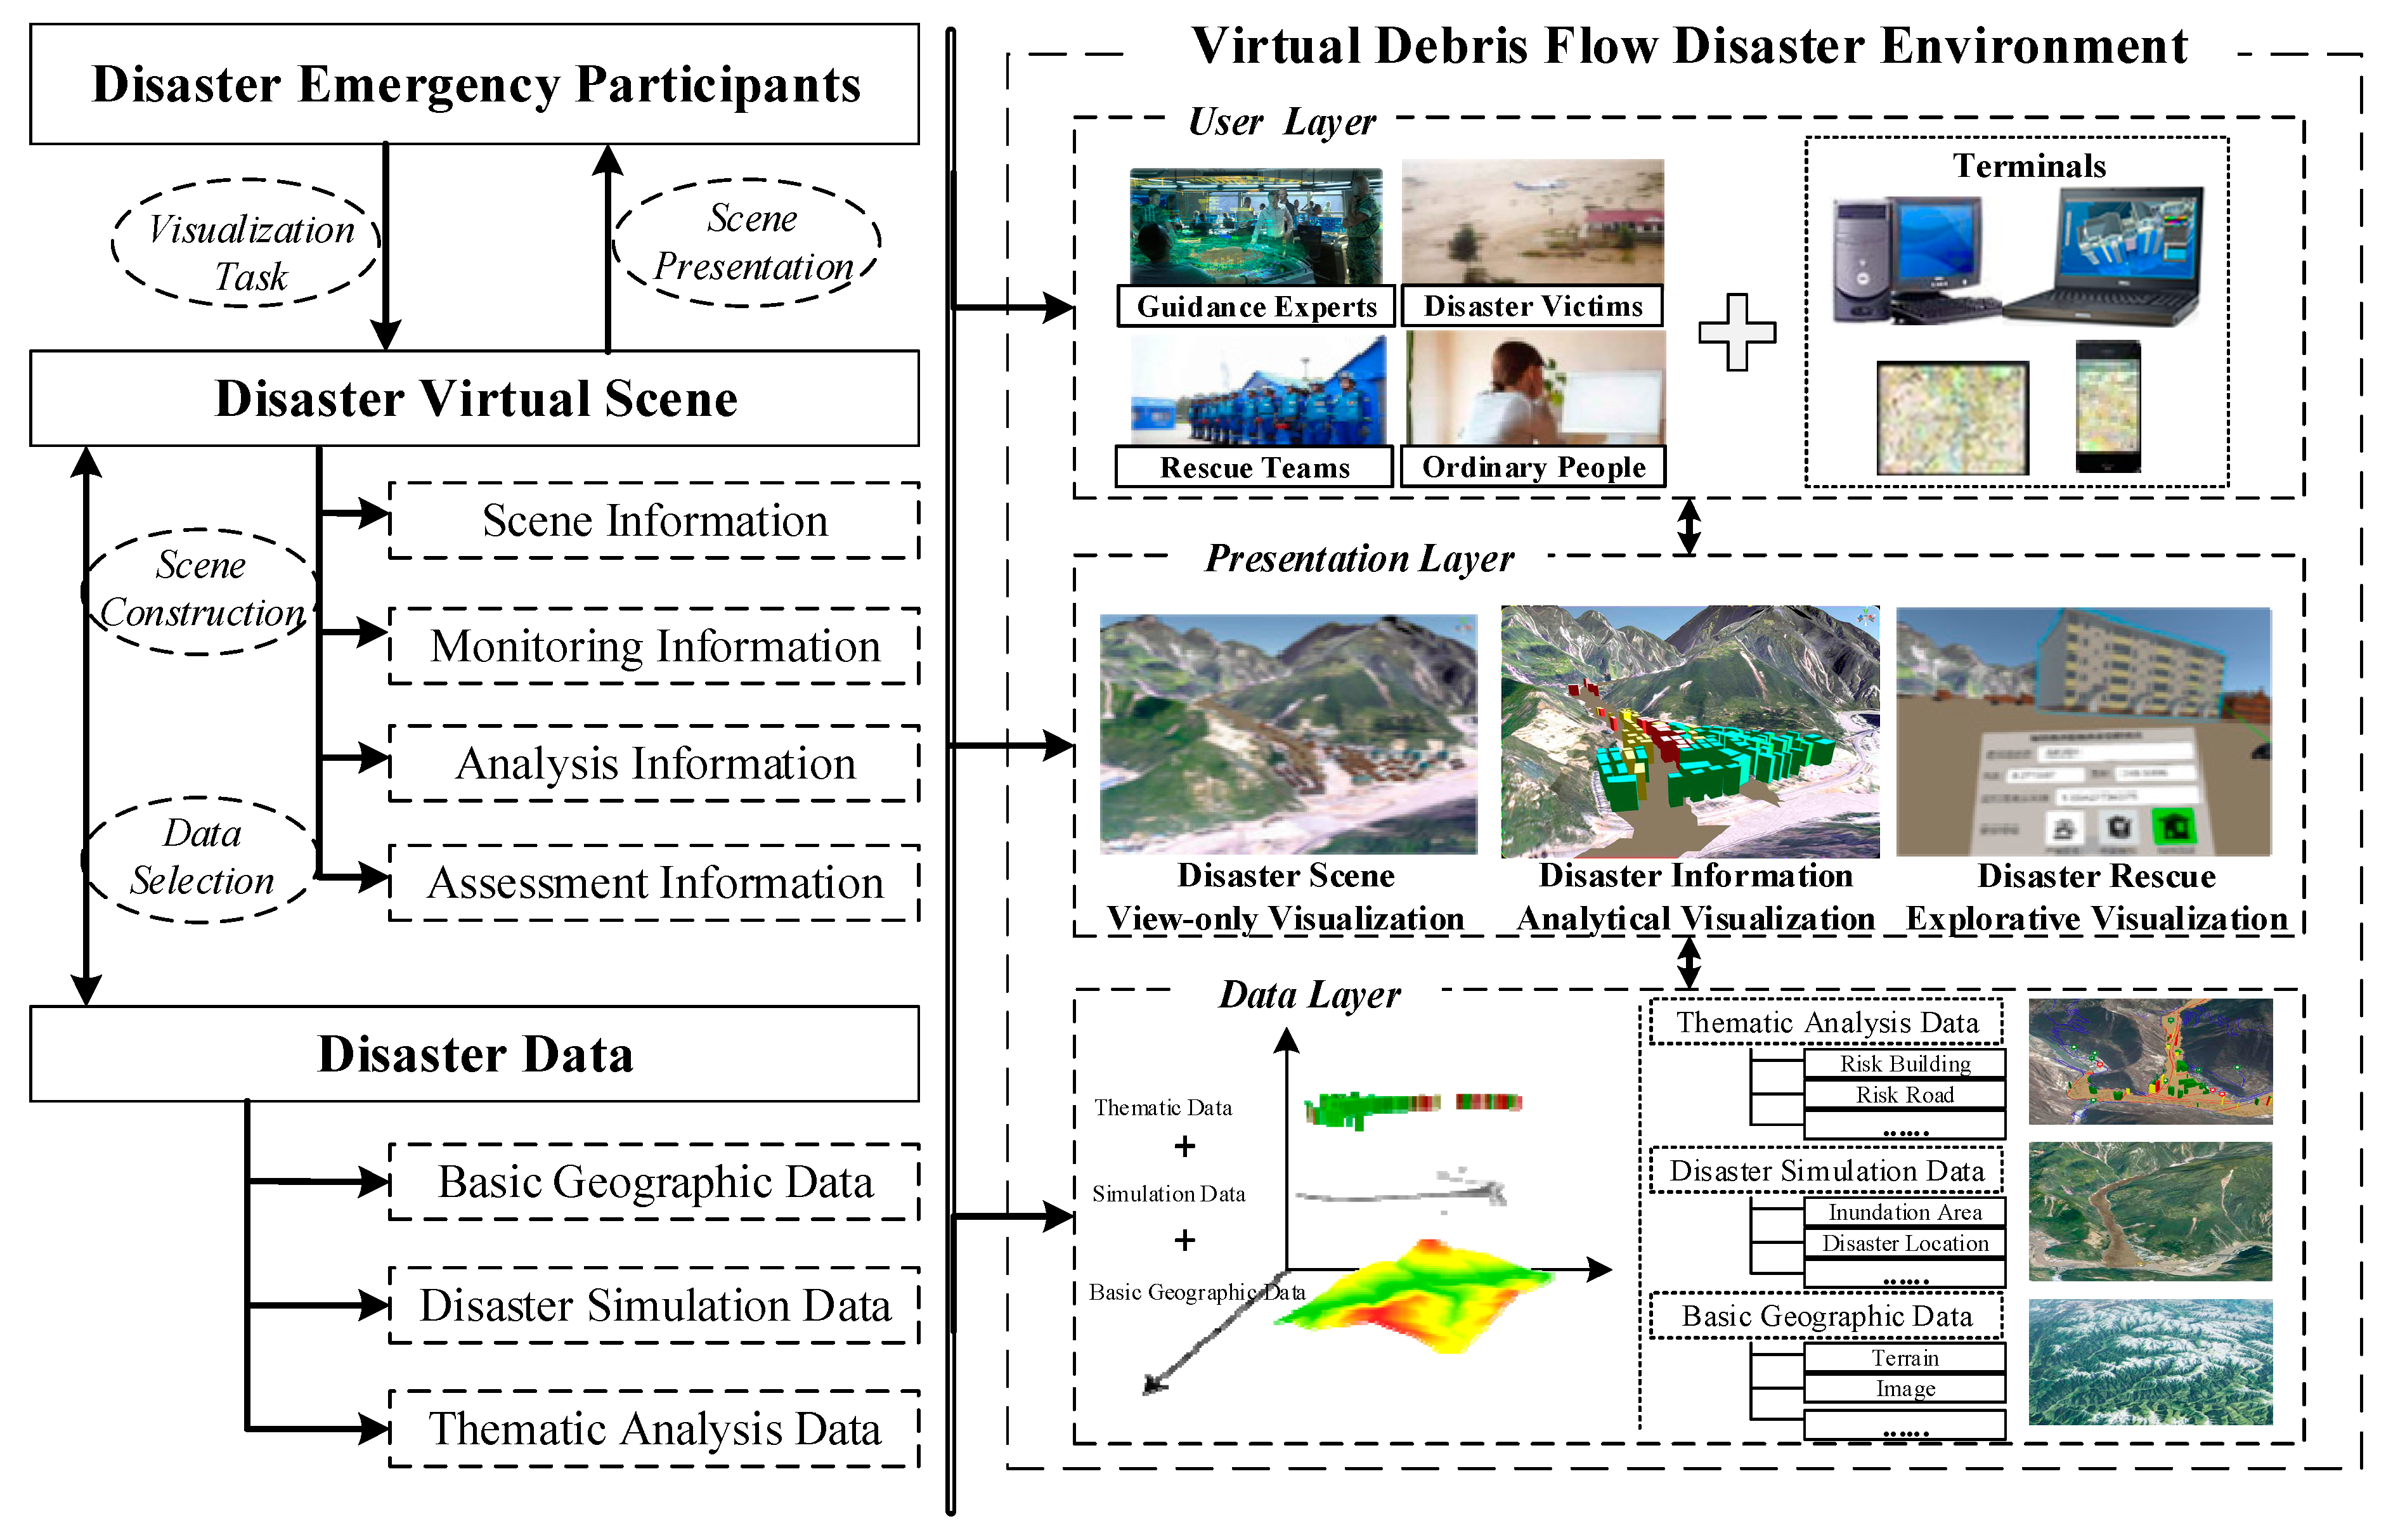
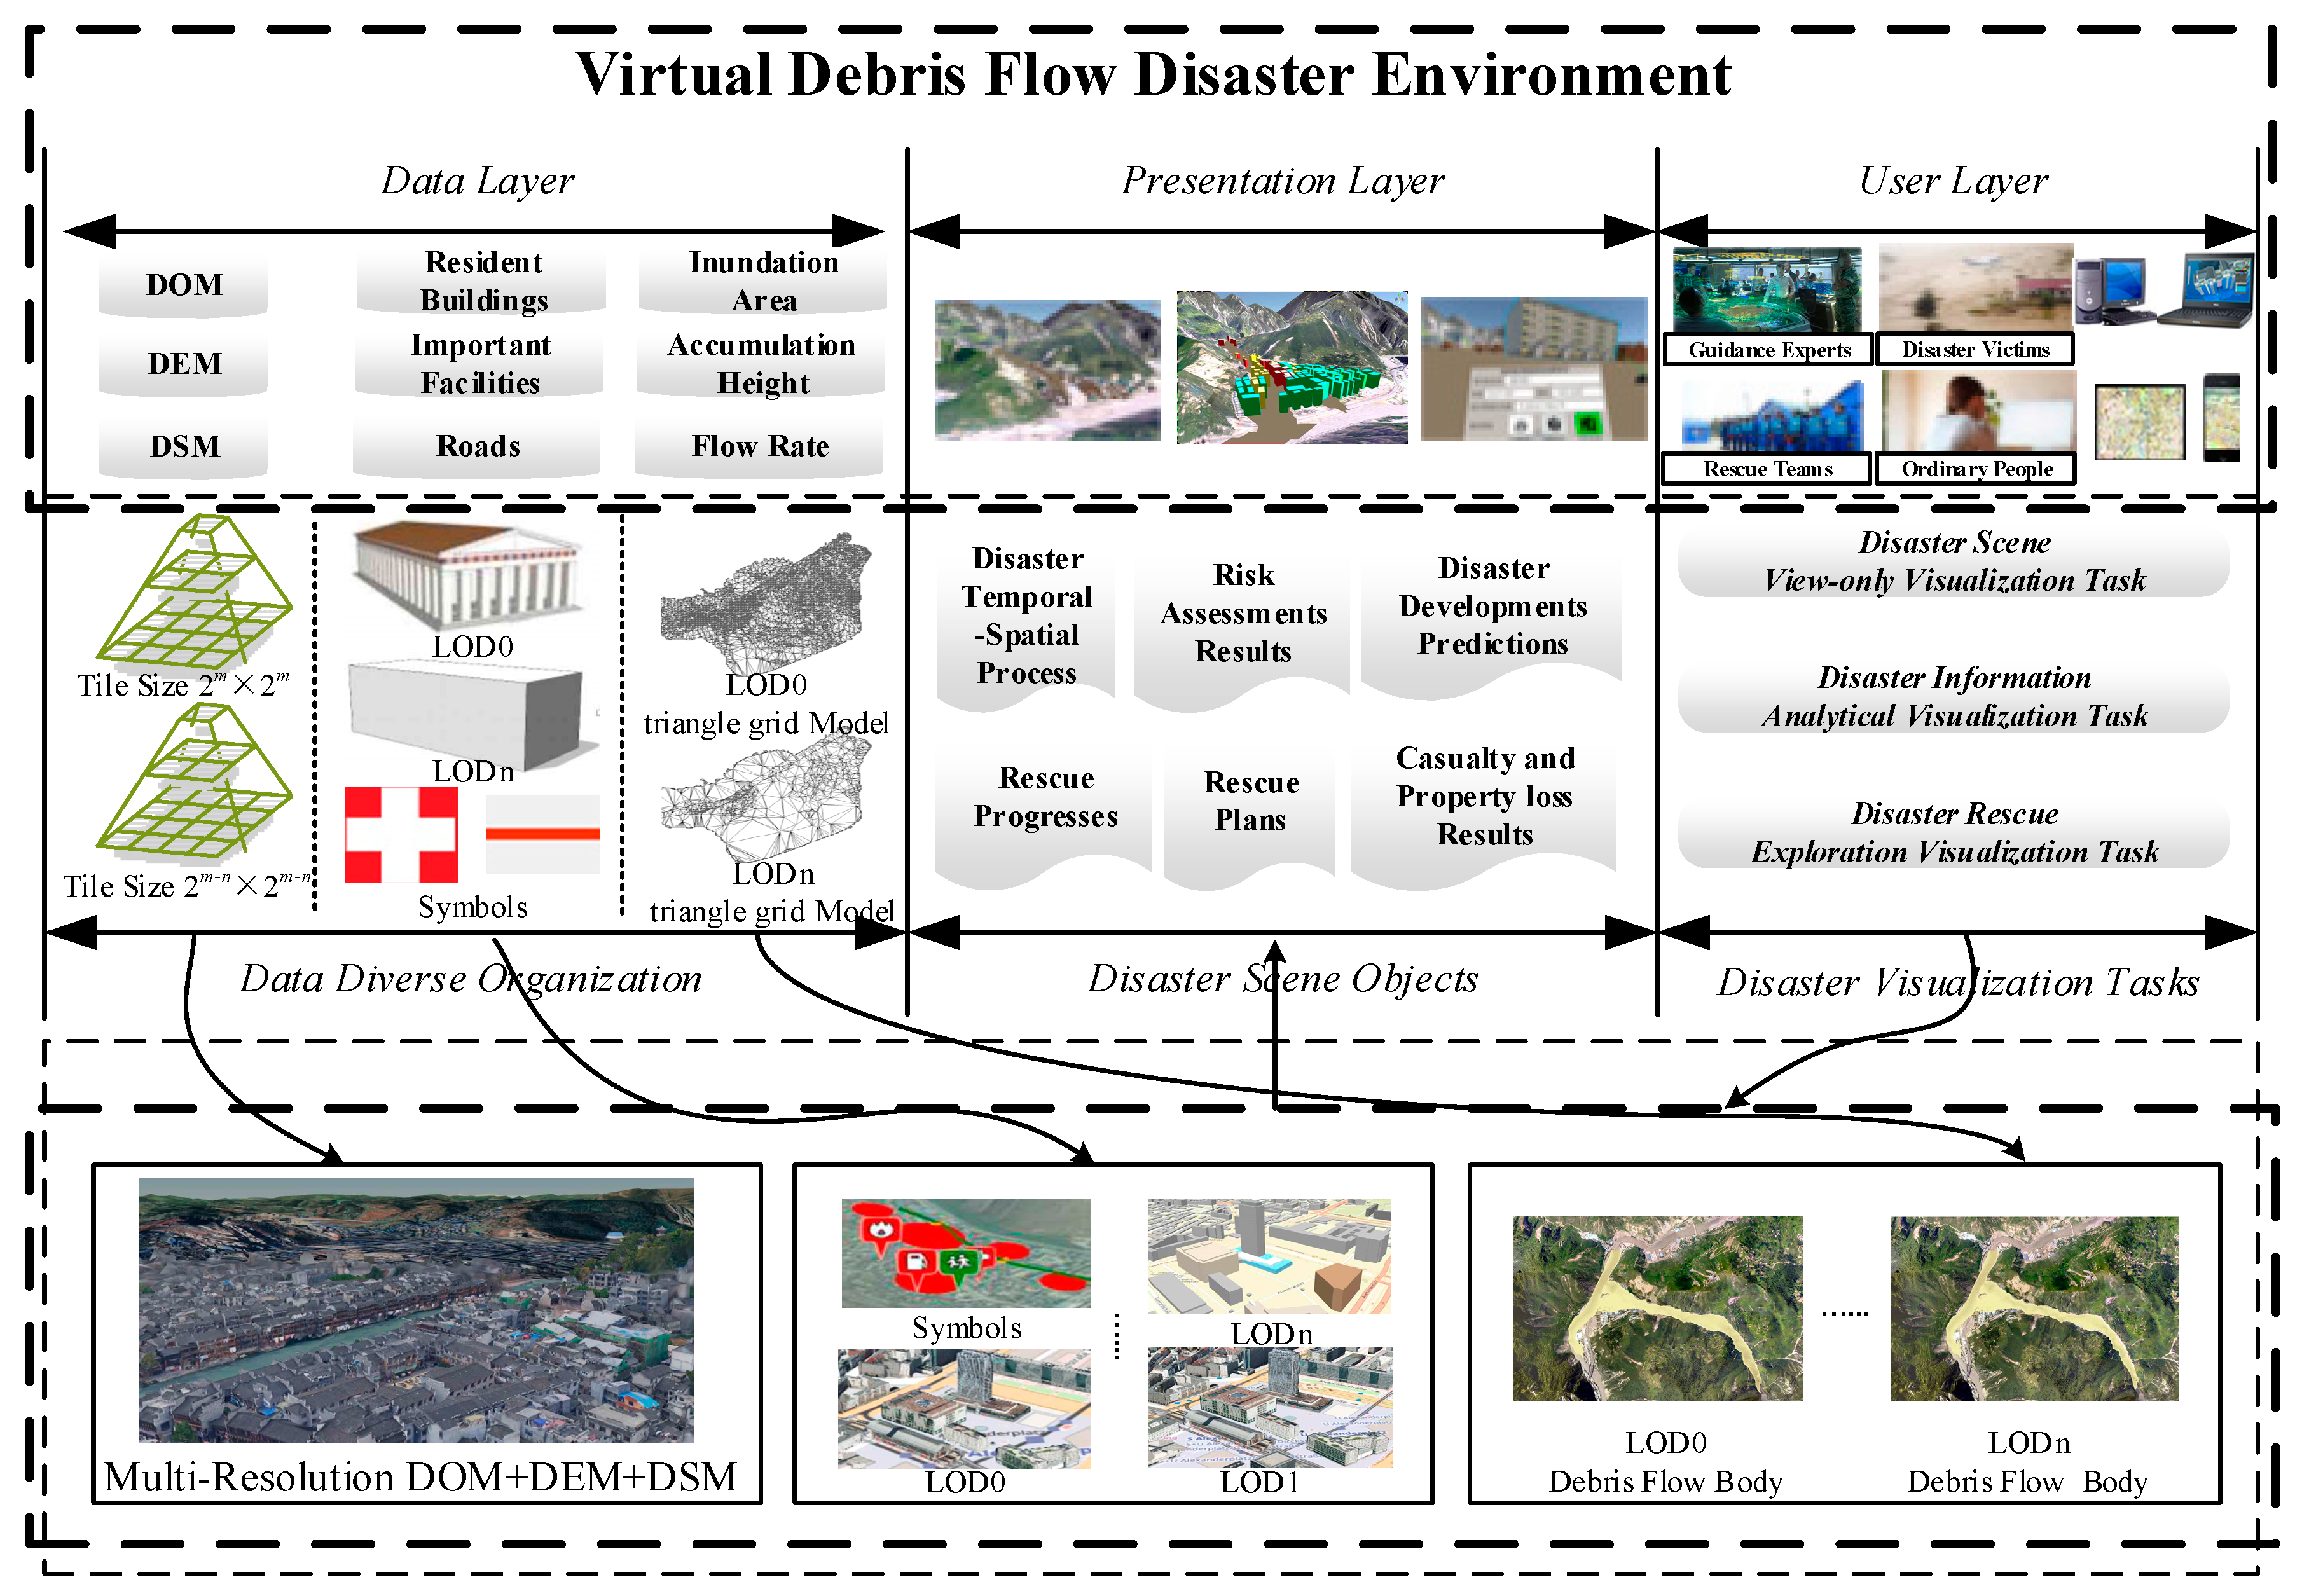
2.1. Framework of Virtual Debris Flow Disaster Environment

In Section 1, it is noted that compared with a general VGE, the construction of a virtual debris flow disaster environment must fully consider the characteristics of disaster emergency response, such as the relevant disaster data, disaster scenes and participants. A virtual debris flow disaster environment must be adaptively constructed considering the visualization task requirements of multitype users in disaster emergency response scenarios. This paper analyzes the characteristics of virtual debris flow disaster environments, which mainly include the disaster data, disaster virtual scenes and disaster emergency response participants. The corresponding virtual debris flow disaster environment is divided into three levels: data layer, presentation layer and user layer. The disaster data include basic geographic data, disaster simulation data and disaster thematic analysis data, which constitute the data layer of the virtual debris flow disaster environment. The disaster virtual scenes incorporate the disaster scene information, monitoring information, analysis information, assessment information and other similar information. Then, through certain rules regarding data selection, the disaster view-only visualization scene, disaster information analytical visualization scene and disaster rescue explorative visualization scene are established to form the presentation layer of the virtual debris flow disaster environment. According to the professional knowledge backgrounds and the tasks of users in debris flow disaster emergency response scenarios, the participants involved in relevant tasks can be divided into four categories: guidance experts, rescue teams, disaster victims and ordinary people [18]. Additionally, visualization terminals can be divided into desktop and mobile terminals, which constitute the user layer of the virtual debris flow disaster environment. Figure 1 shows the framework of the proposed virtual debris flow disaster environment.

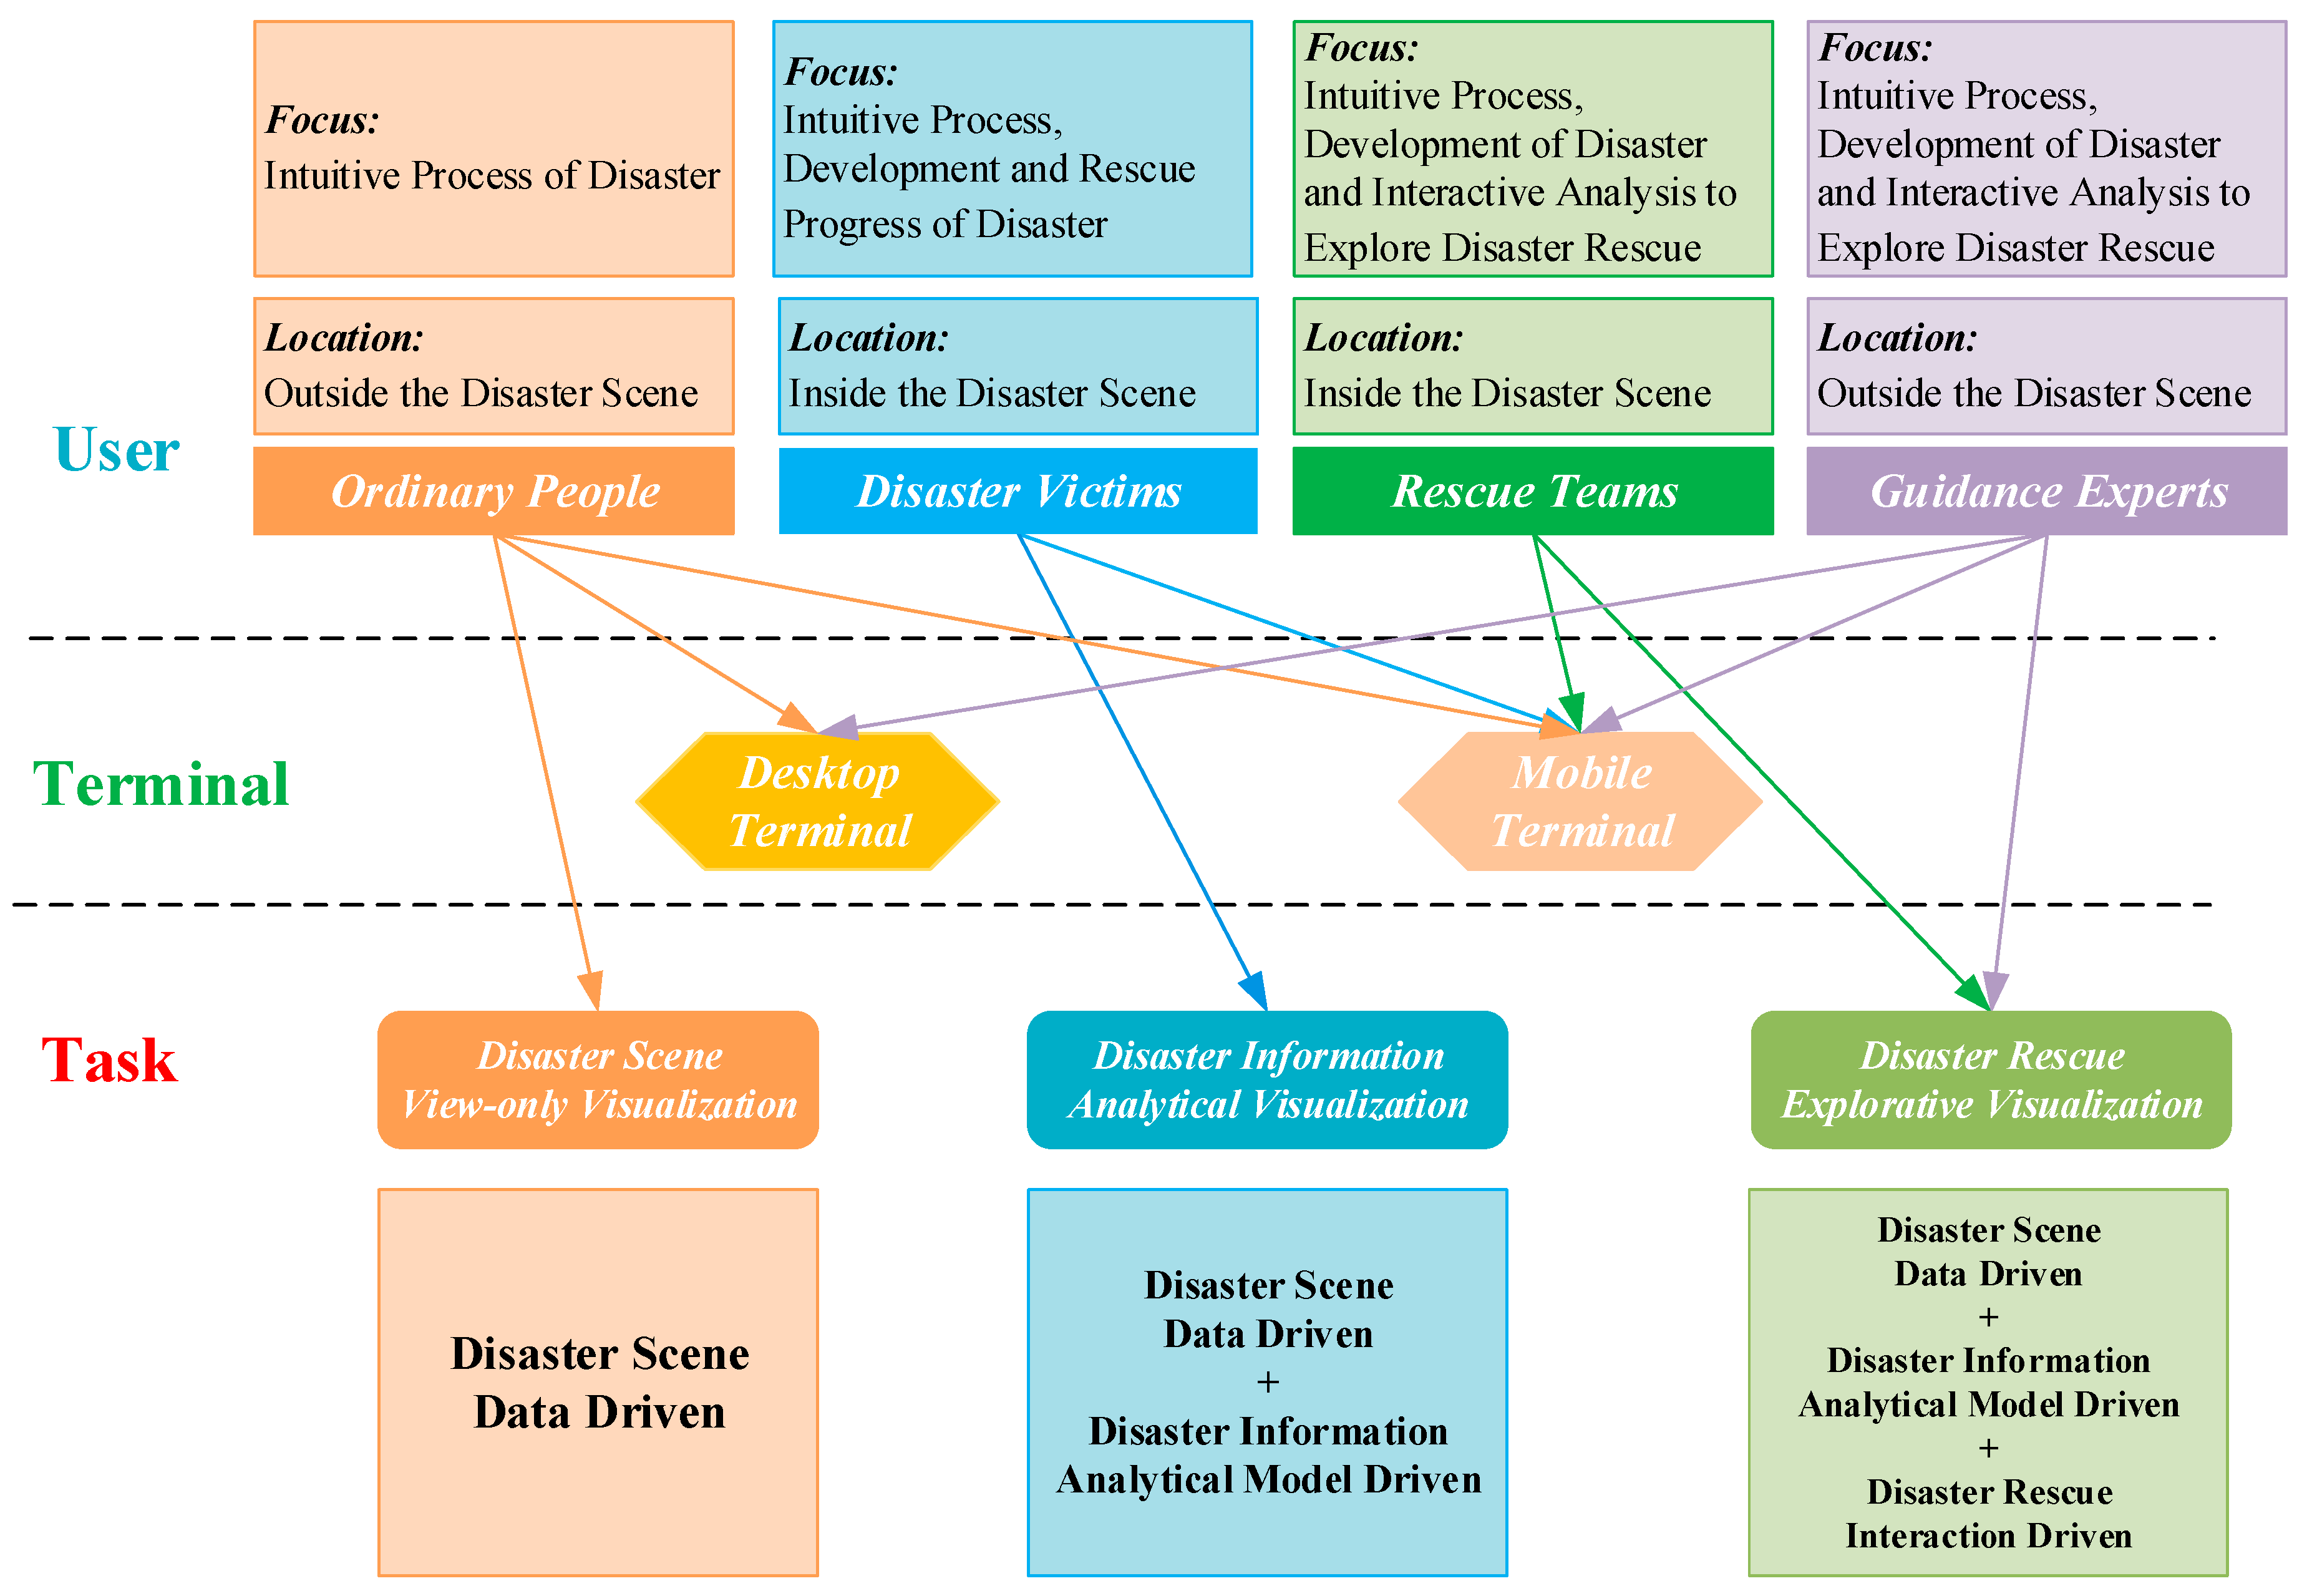
2.2. Multilevel Visualization Task Model for Disaster Emergency Response

Many scholars in related fields have studied visualization tasks and constructed multilevel visualization task models at the macro-level [39,40,41]. This paper combines the characteristics of debris flow disaster emergency response and visualization and further summarizes multilevel visualization tasks at the macro-level into three levels based on spatial cognition laws: disaster scene view-only visualization tasks, disaster information analytical visualization tasks and disaster rescue explorative visualization tasks. The disaster scene view-only visualization tasks are driven by disaster data, and the purpose of these tasks is to comprehensively and accurately visualize the original disaster scene through the efficient organization and high-performance visualization of disaster data. The disaster information analytical visualization tasks are driven by disaster information analytical models with various types of disaster data. The purpose of these tasks is to fully explore analysis results and disaster information by calculating and analyzing the hidden information in a disaster scene. The disaster rescue explorative visualization tasks are driven by collaborative disaster rescue data and disaster information analytical models. The purpose of these tasks is to support real-time interactive exploration according to the actual disaster rescue scene and to explore the optimal disaster rescue plan based on the relevant user interactions, experiences, assumptions and disaster scene characteristics.
This paper analyzes the relationships among users, terminals and tasks in disaster emergency response scenarios and constructs a user-terminal-task-associated multilevel visualization model. Figure 2 shows the multilevel visualization task model for disaster emergency response.
Section 2.1 noted that users are divided into four types: ordinary people, disaster victims, rescue teams and guidance experts. The visualization terminals are divided into two types: mobile and desktop terminals. Ordinary people are not stakeholders in disaster emergency response scenarios, and most of them do not have a professional knowledge background. These individuals are mainly concerned with disaster processes and have no special needs for disaster information analysis and interactive exploration. Therefore, ordinary people correspond to disaster scene view-only visualization. As their locations are outside the disaster scene, mobile or desktop terminals can be selected as the visualization terminals. Disaster victims are inside the disaster scene, so only a mobile terminal can be selected as the visualization terminal. Most of these individuals do not have any professional knowledge background and are mainly concerned with the development of the disaster and the progress of the disaster rescue near their location. Therefore, disaster victims correspond to disaster information analytical visualization. Rescue teams are the same as disaster victims in that they are inside the disaster scene and focused on the development of the disaster and the progress of the disaster rescue. In addition, rescue teams have a certain professional knowledge background and perform disaster rescue work. They require interactive analysis tools to explore disaster rescue plans and can only select mobile terminals as their visualization terminals. Thus, rescue teams correspond to disaster rescue explorative visualization. Guidance experts have a professional knowledge background and focus on the global development of disasters and the progress of disaster rescue missions. These individuals must explore the optimal disaster rescue plan and provide detailed guidance to the rescue teams. Therefore, guidance experts correspond to disaster rescue explorative visualization and are outside the disaster scene. Moreover, experts can select mobile or desktop terminals as their visualization terminals.

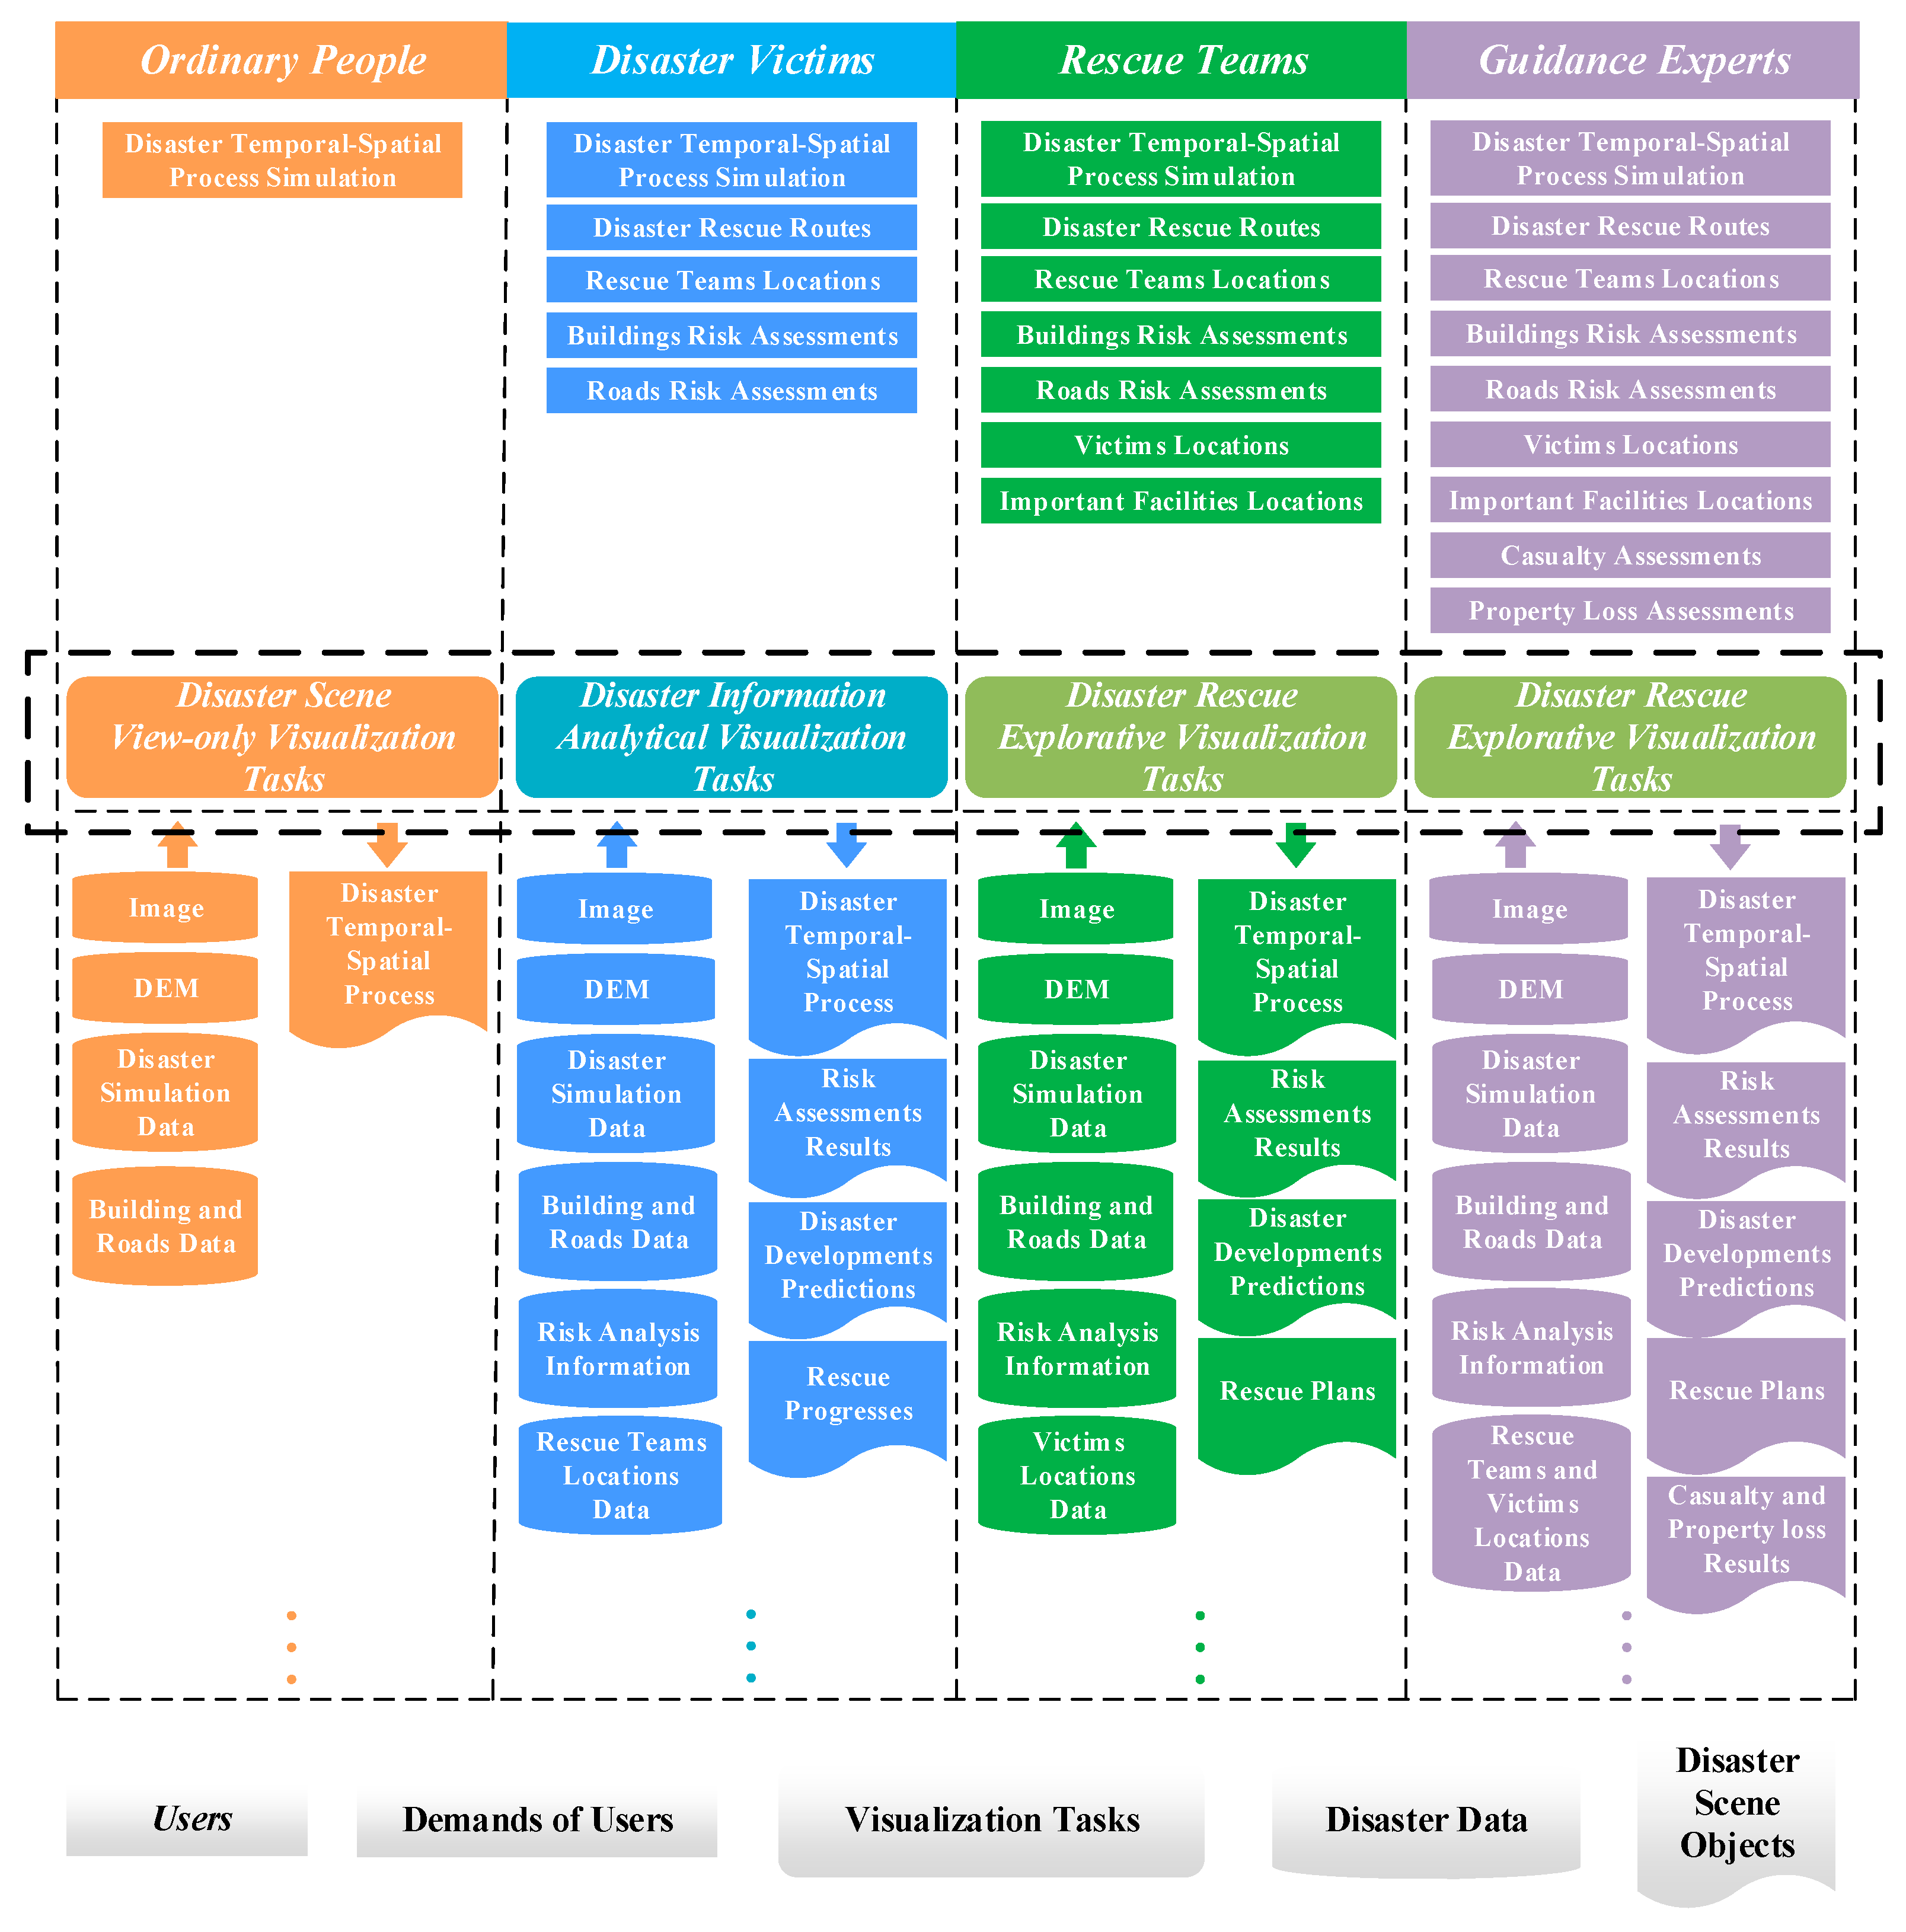
2.3. On-demand Construction of the Virtual Debris Flow Disaster Environments

According to the description in Section 2.1, virtual debris flow disaster environments can be divided into three layers: user layer, presentation layer and data layer. During construction of a virtual debris flow disaster environment, the user layer parses the user requirements into corresponding visualization tasks according to the type of disaster participants and terminals and passes these tasks to the presentation layer. The presentation layer proposes data scheduling requirements for the data layer based on the obtained visualization tasks and selects the appropriate data on demand to construct a disaster scene that meets the user requirements. The data layer is the basis of the virtual debris flow disaster environment. According to the data scheduling requirements transmitted by the presentation layer, appropriate scene data are transmitted to the presentation layer to construct the disaster scene. In the above construction process, this paper proposes an on-demand construction driven by multilevel visualization task method for virtual debris flow disaster environments.
First, it is necessary to clarify the relationships among the debris flow disaster data sets for a given virtual debris flow disaster environment. This paper abstracts debris flow disaster scenes into a series of disaster data sets and divides these data into three categories: basic geographic data, debris flow simulation data and thematic analysis data. Figure 3 shows the relations among the debris flow disaster data sets.
To clarify the relationships among debris flow disaster scene objects, it is also necessary to clarify the construction requirements of the virtual debris flow disaster environments, which are associated with various disaster emergency response participants. This paper analyzes the relationships among users, user demands, visualization tasks, disaster data and disaster scene objects [42]. The relationship model involving these factors in debris flow disaster emergency response is shown in Figure 4.

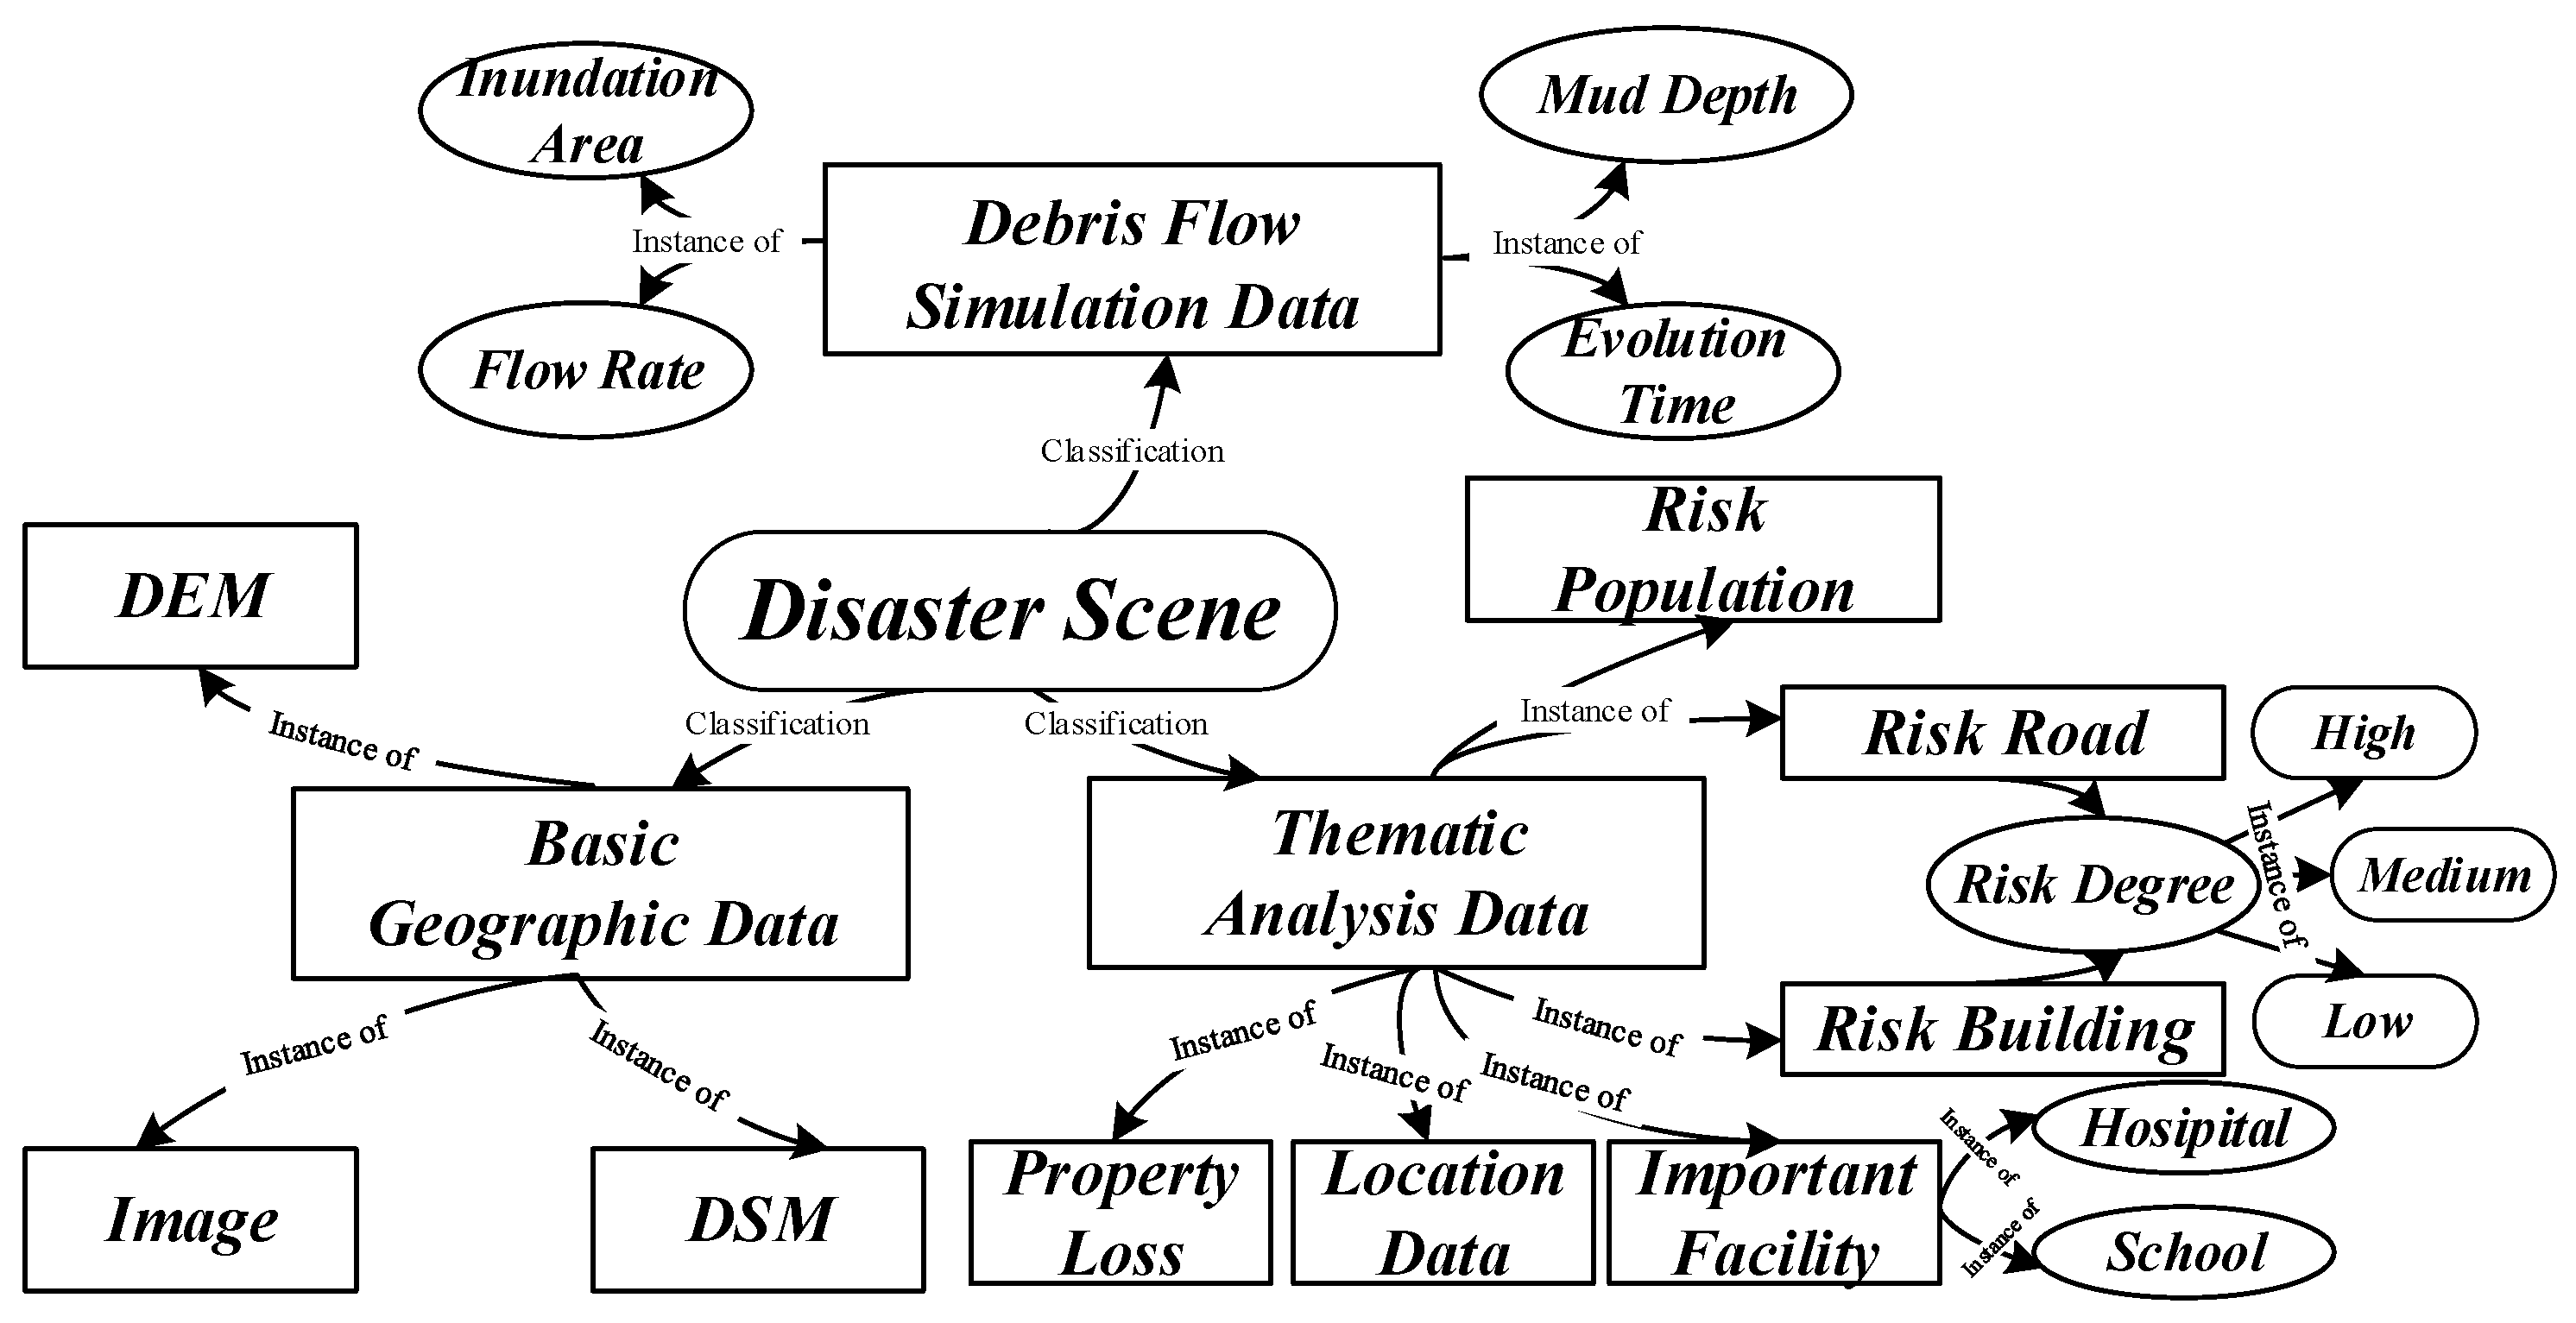
2.4. Optimized Organization of Debris Flow Disaster Scenes

Section 2.1 indicates that the visualization terminals in disaster emergency response are divided into mobile and desktop terminals. To select the appropriate data for constructing a debris flow disaster scene, it is necessary to optimize the organization and adaptive visualization of the debris flow disaster scene according to terminal performance. To solve the above problems, this paper proposes a diverse organization and dynamic scheduling method for debris flow disaster data and performs the efficient and adaptive visualization of debris flow disaster scenes for diverse terminals. Figure 5 shows the diverse organization method of multitype debris flow disaster data.
Basic geographic data are divided into three categories: digital orthophoto map (DOM), digital elevation model (DEM) and digital surface model (DSM) data. These data are continuous surface models consisting of a series of grids. According to the characteristics of these data sets, this paper uses the standard quad-tree spatial partitioning method to organize the data, preprocesses these data into multiple regions and resolutions, and constructs a hierarchy scene pyramid [43,44].
Disaster thematic analysis data can be divided into disaster analysis data and 3D building models, including 3D building models that include residential buildings, important facilities, dangerous facilities, etc. These features have complicated structures and must be targeted for optimized organization. 3D building models can be preprocessed into multilevel LOD models. The models are down-sampled to obtain textures with lower resolutions, and the bottom contours of buildings are converted to a block model structure. Some buildings and roads with specific significance are represented by symbols [45,46].
Disaster simulation data include time series-related location and attribute information from the spatiotemporal disaster evolution process, such as the inundation area, mud depth, and flow rate. According to time series-related location information, a series of triangle grid models of debris flow bodies is constructed, and the attribute information is given. Multilevel LOD debris flow bodies are constructed by setting the grid resolution and reducing the data size of debris flow bodies during disaster evolution [28,31,32,46,47].
Considering the performance of visualization terminals, it is necessary to complete the dynamic scheduling of disaster data to support the adaptive visualization of complicated disaster scenes. This paper proposes a dynamic scheduling method suitable for diverse debris flow disaster data. The core objective is to reduce the rendered data size as much as possible while ensuring that the debris flow disaster scene and visualization requirements of users are met. Table 1 shows the dynamic scheduling method of diverse debris flow scene data.

3. System Implementation and Experimental Analysis

3.1. Case Area and Data Processing

In this paper, the Qipan Gully debris flow disaster that occurred on 11 July 2013, in Sichuan Province, China, was selected as the case area to perform the experimental analysis. The experimental data are listed in Table 2.
In the experiment, DOM and DEM data were used to construct 256 × 256 and 64 × 64 multiresolution scene pyramids. The texture resolution of the 3D building models was 256 × 256 for the LOD0 models. Source data were processed into 128 × 128 texture resolution models for the LOD1 model. The bottom contours of buildings were converted to block model format as LOD2 models. Debris flow disaster simulation data were provided by Yin [30], including regular grid debris flow body models with 10-m and 20-m resolutions.

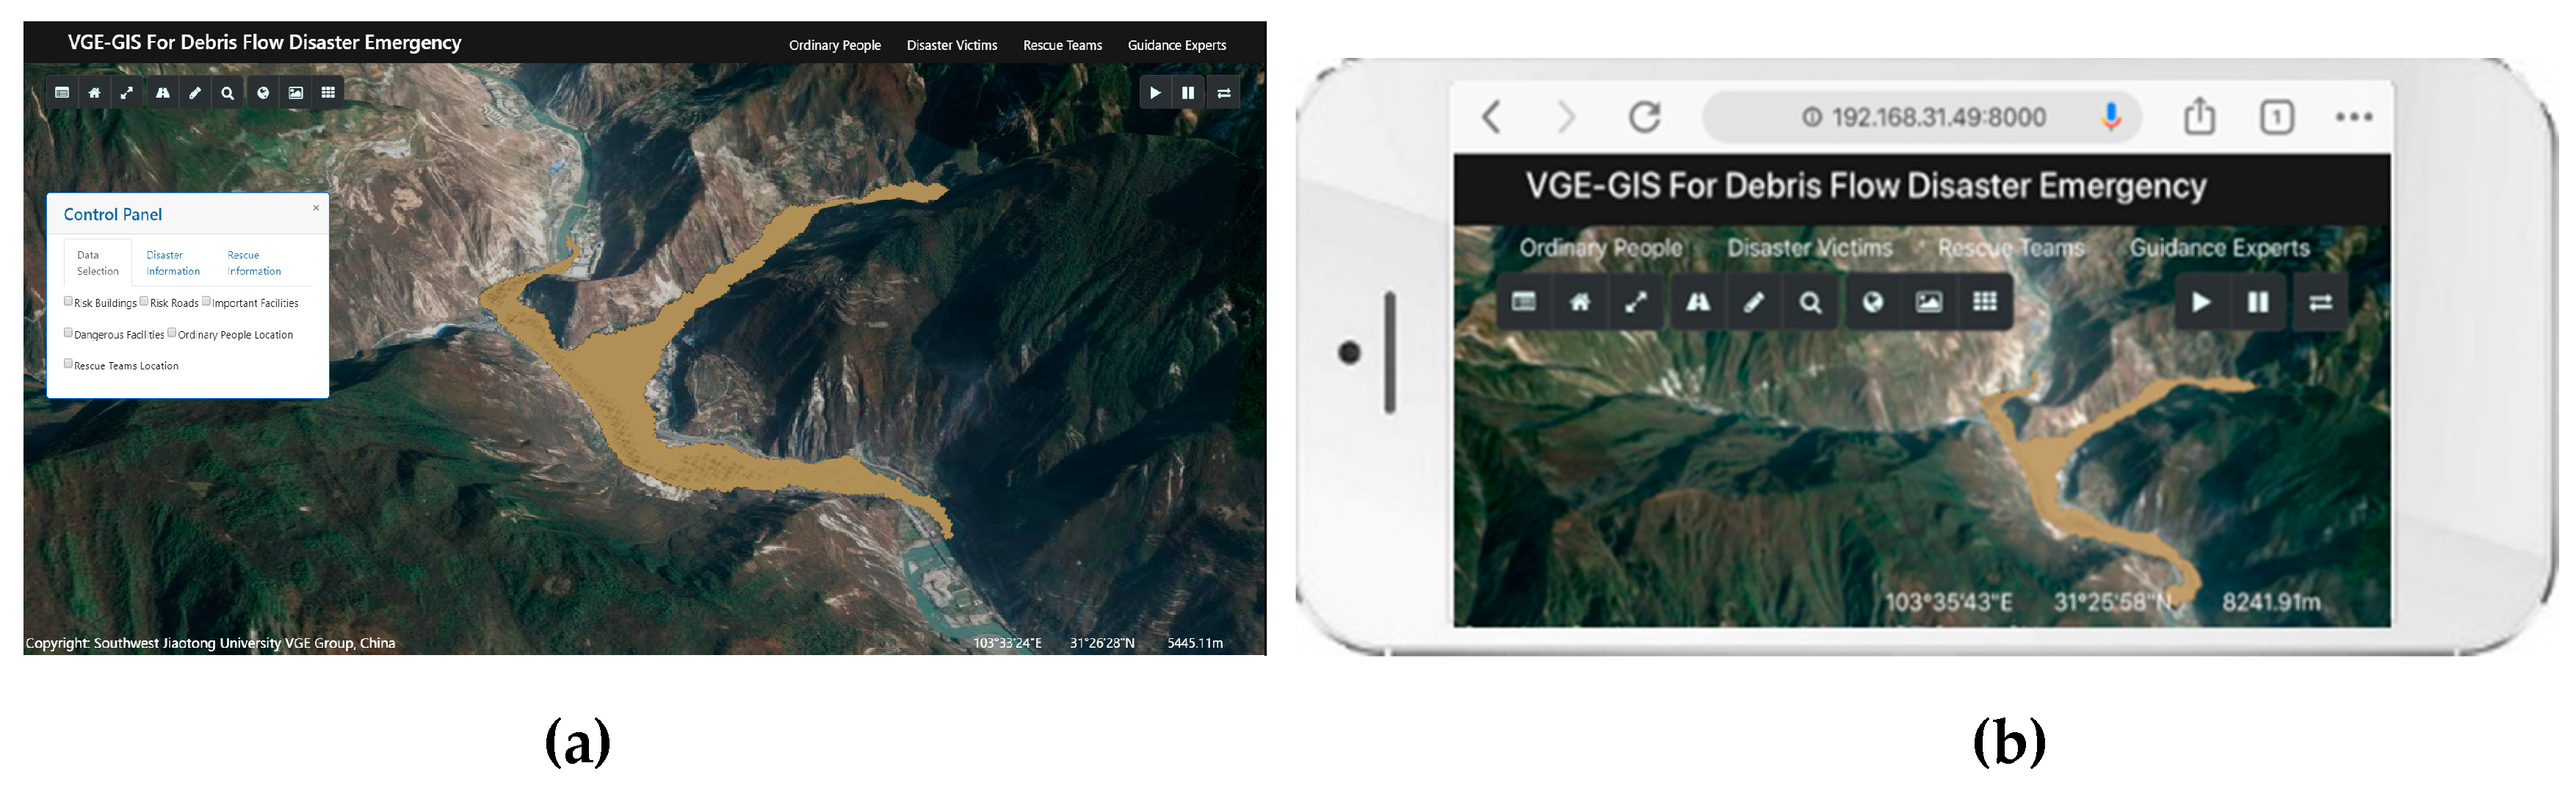
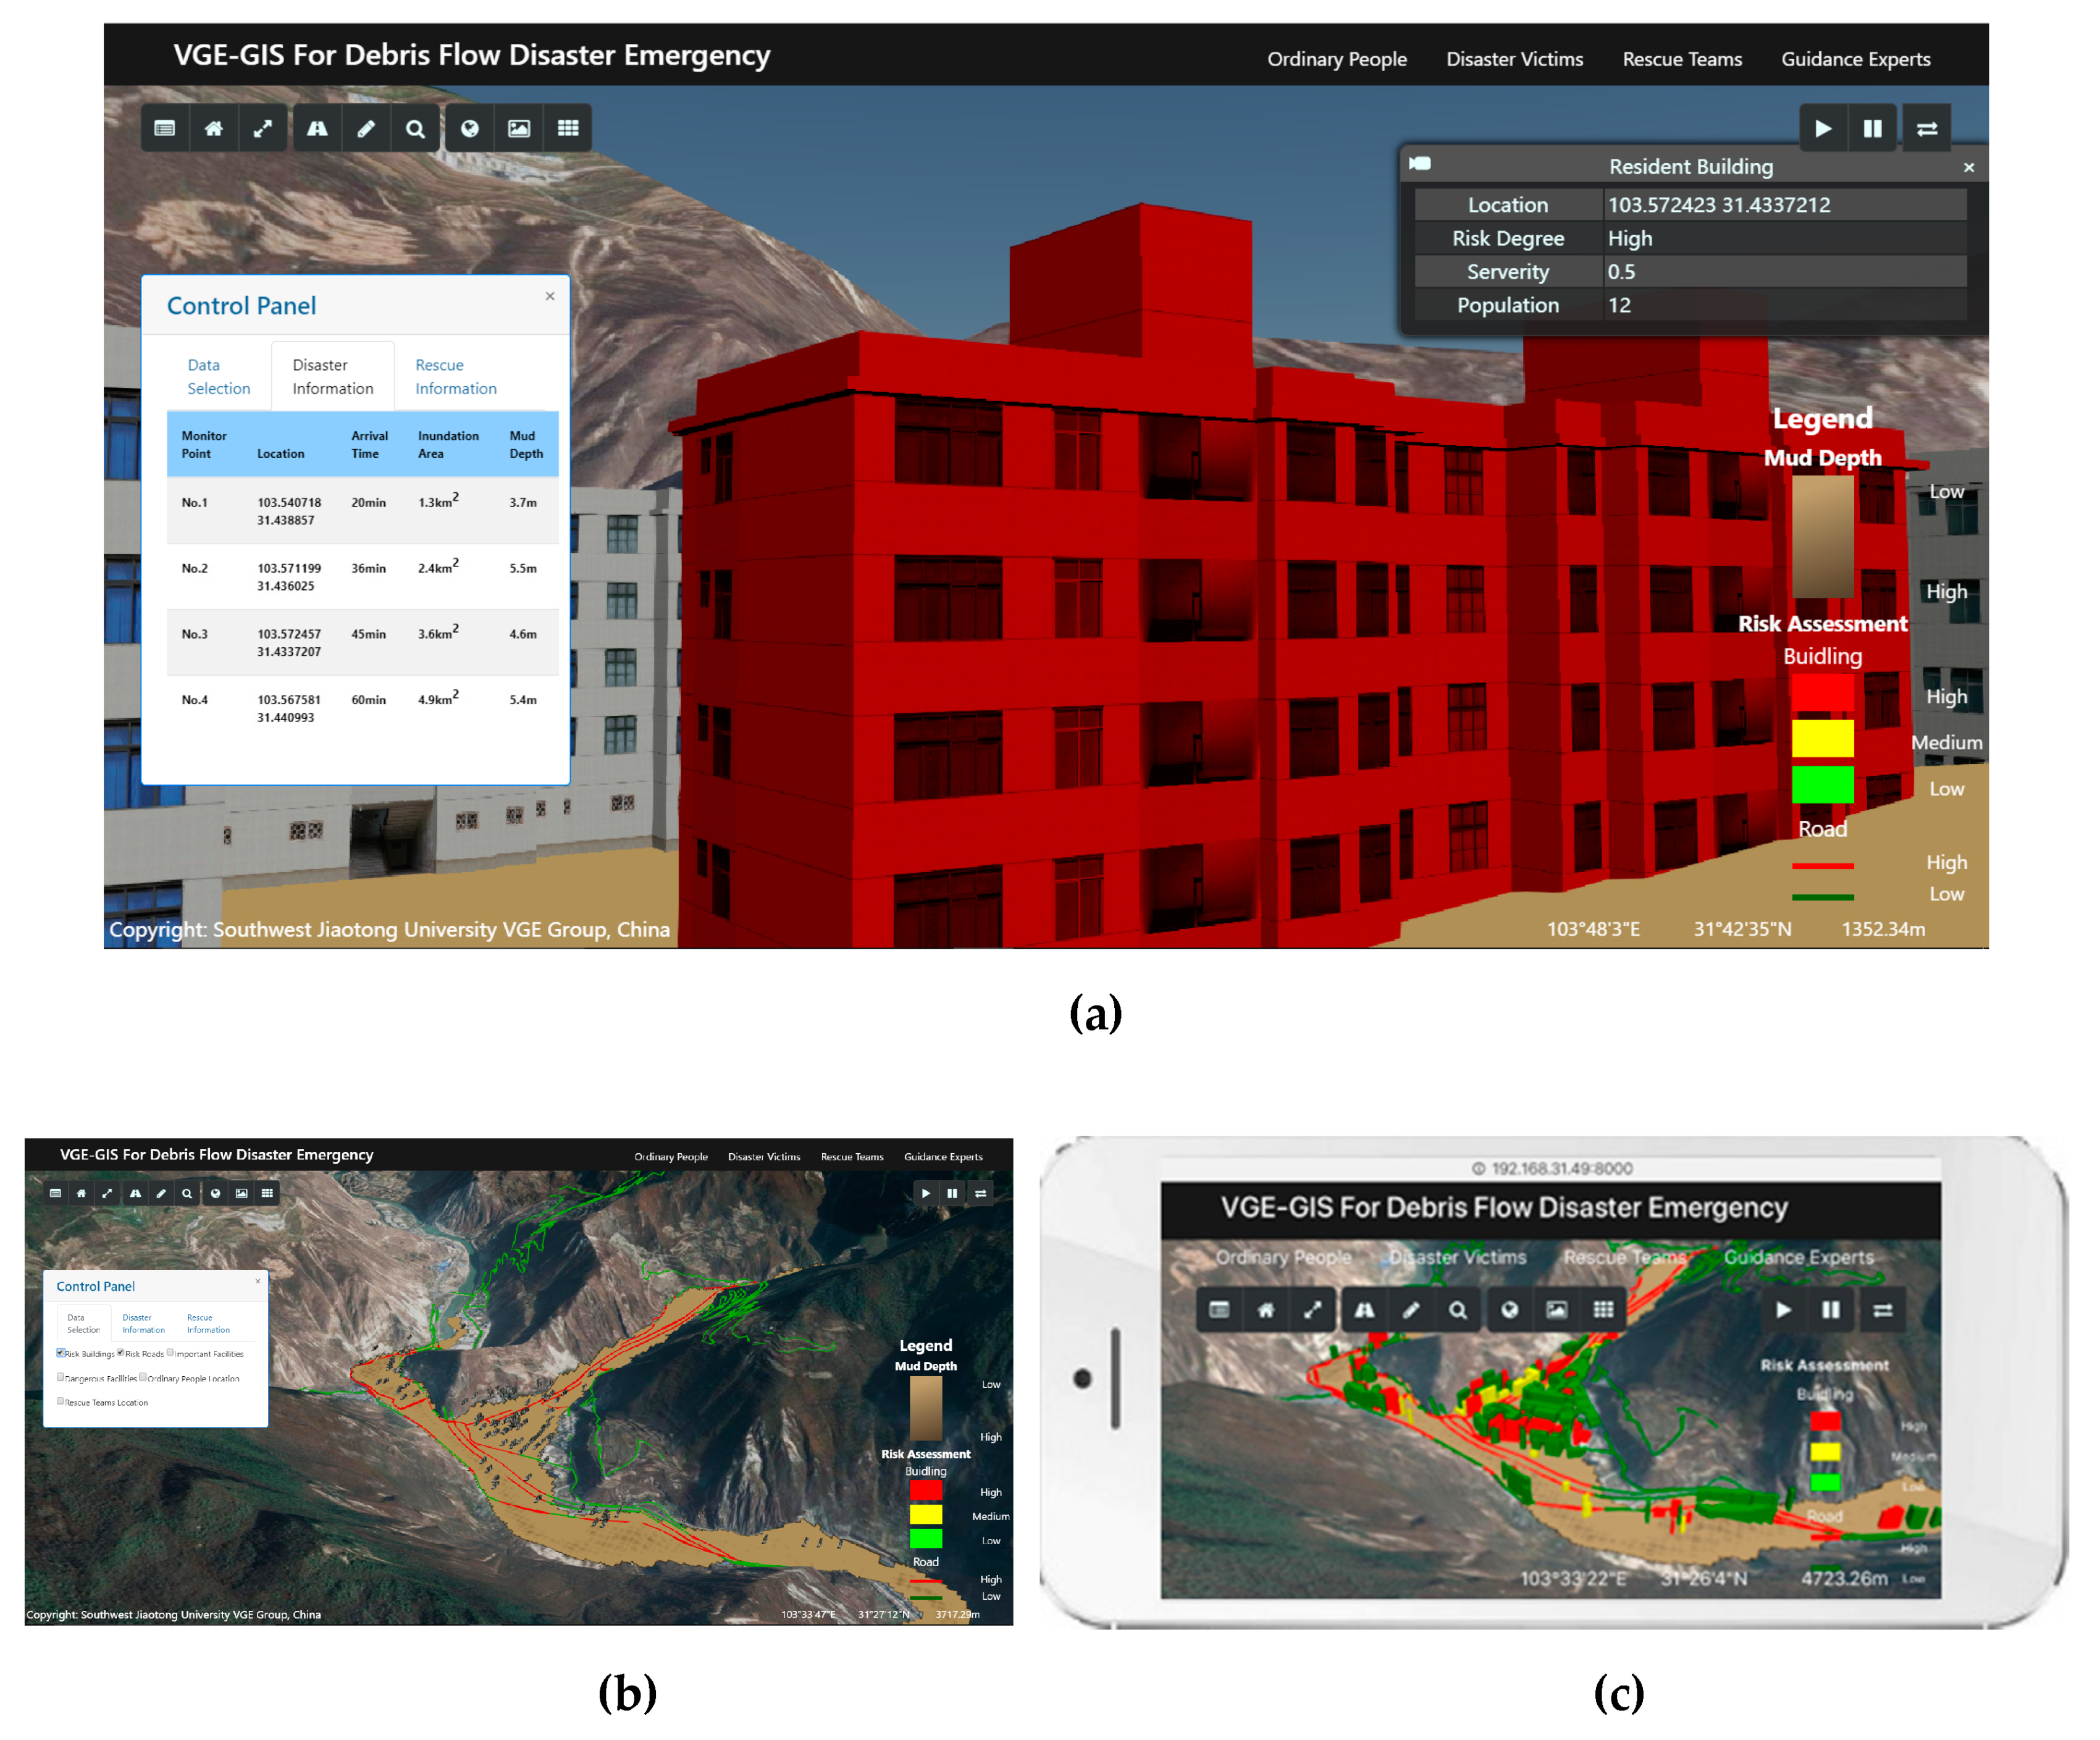
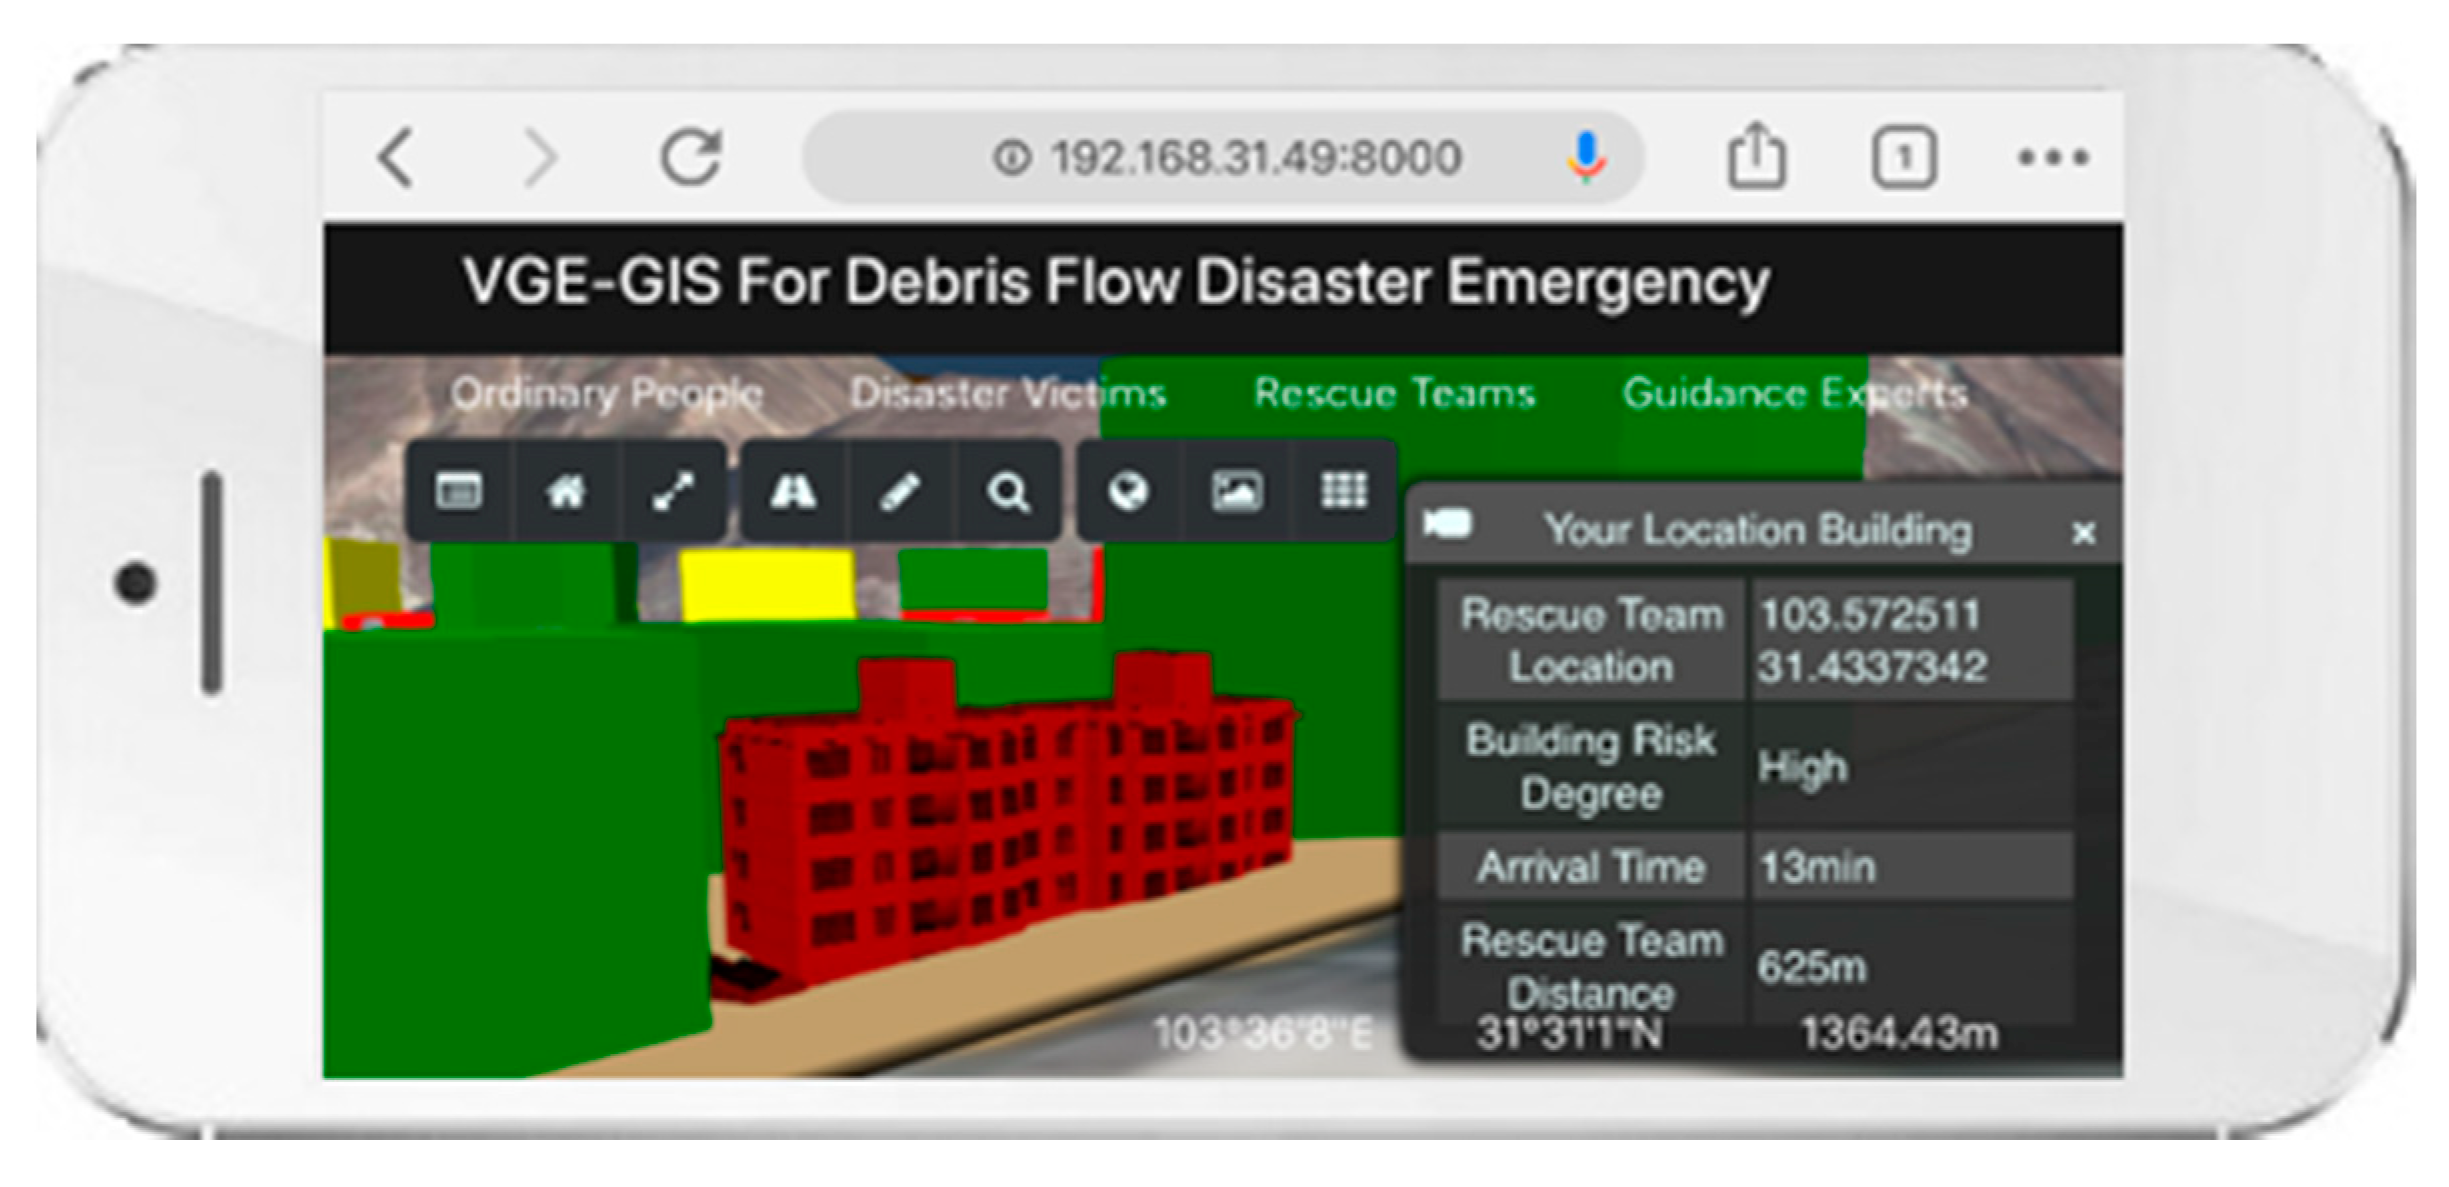
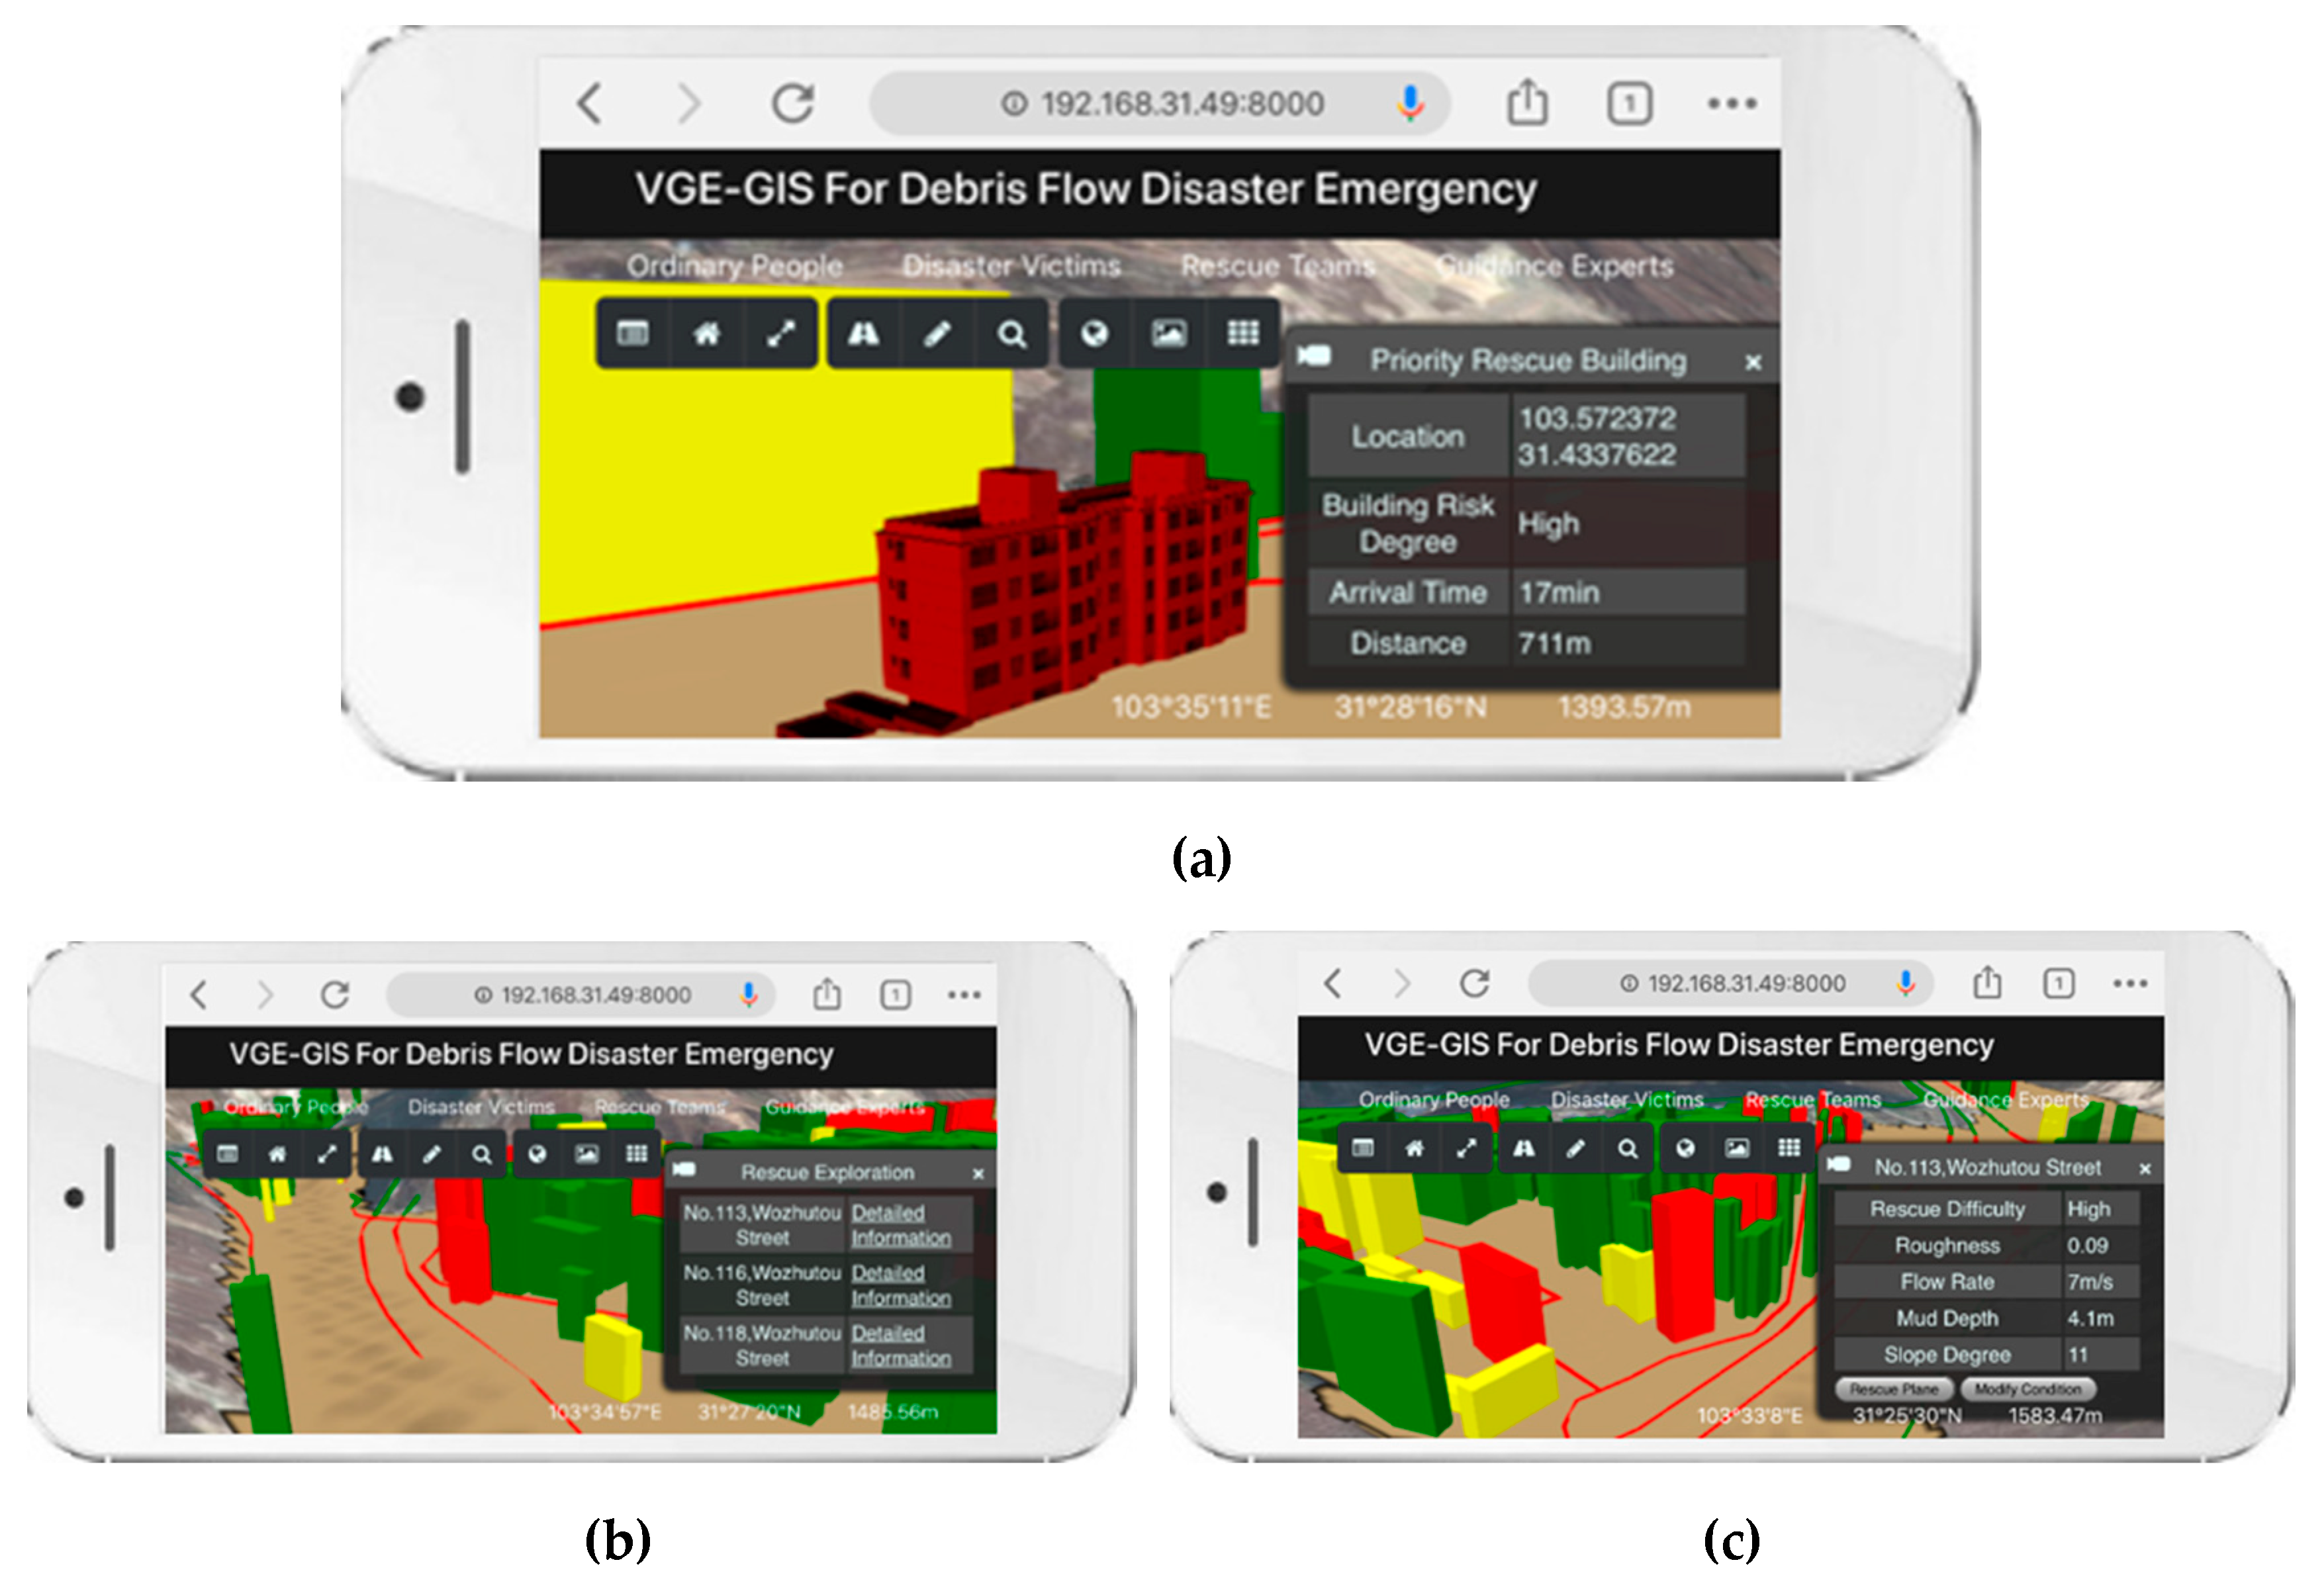
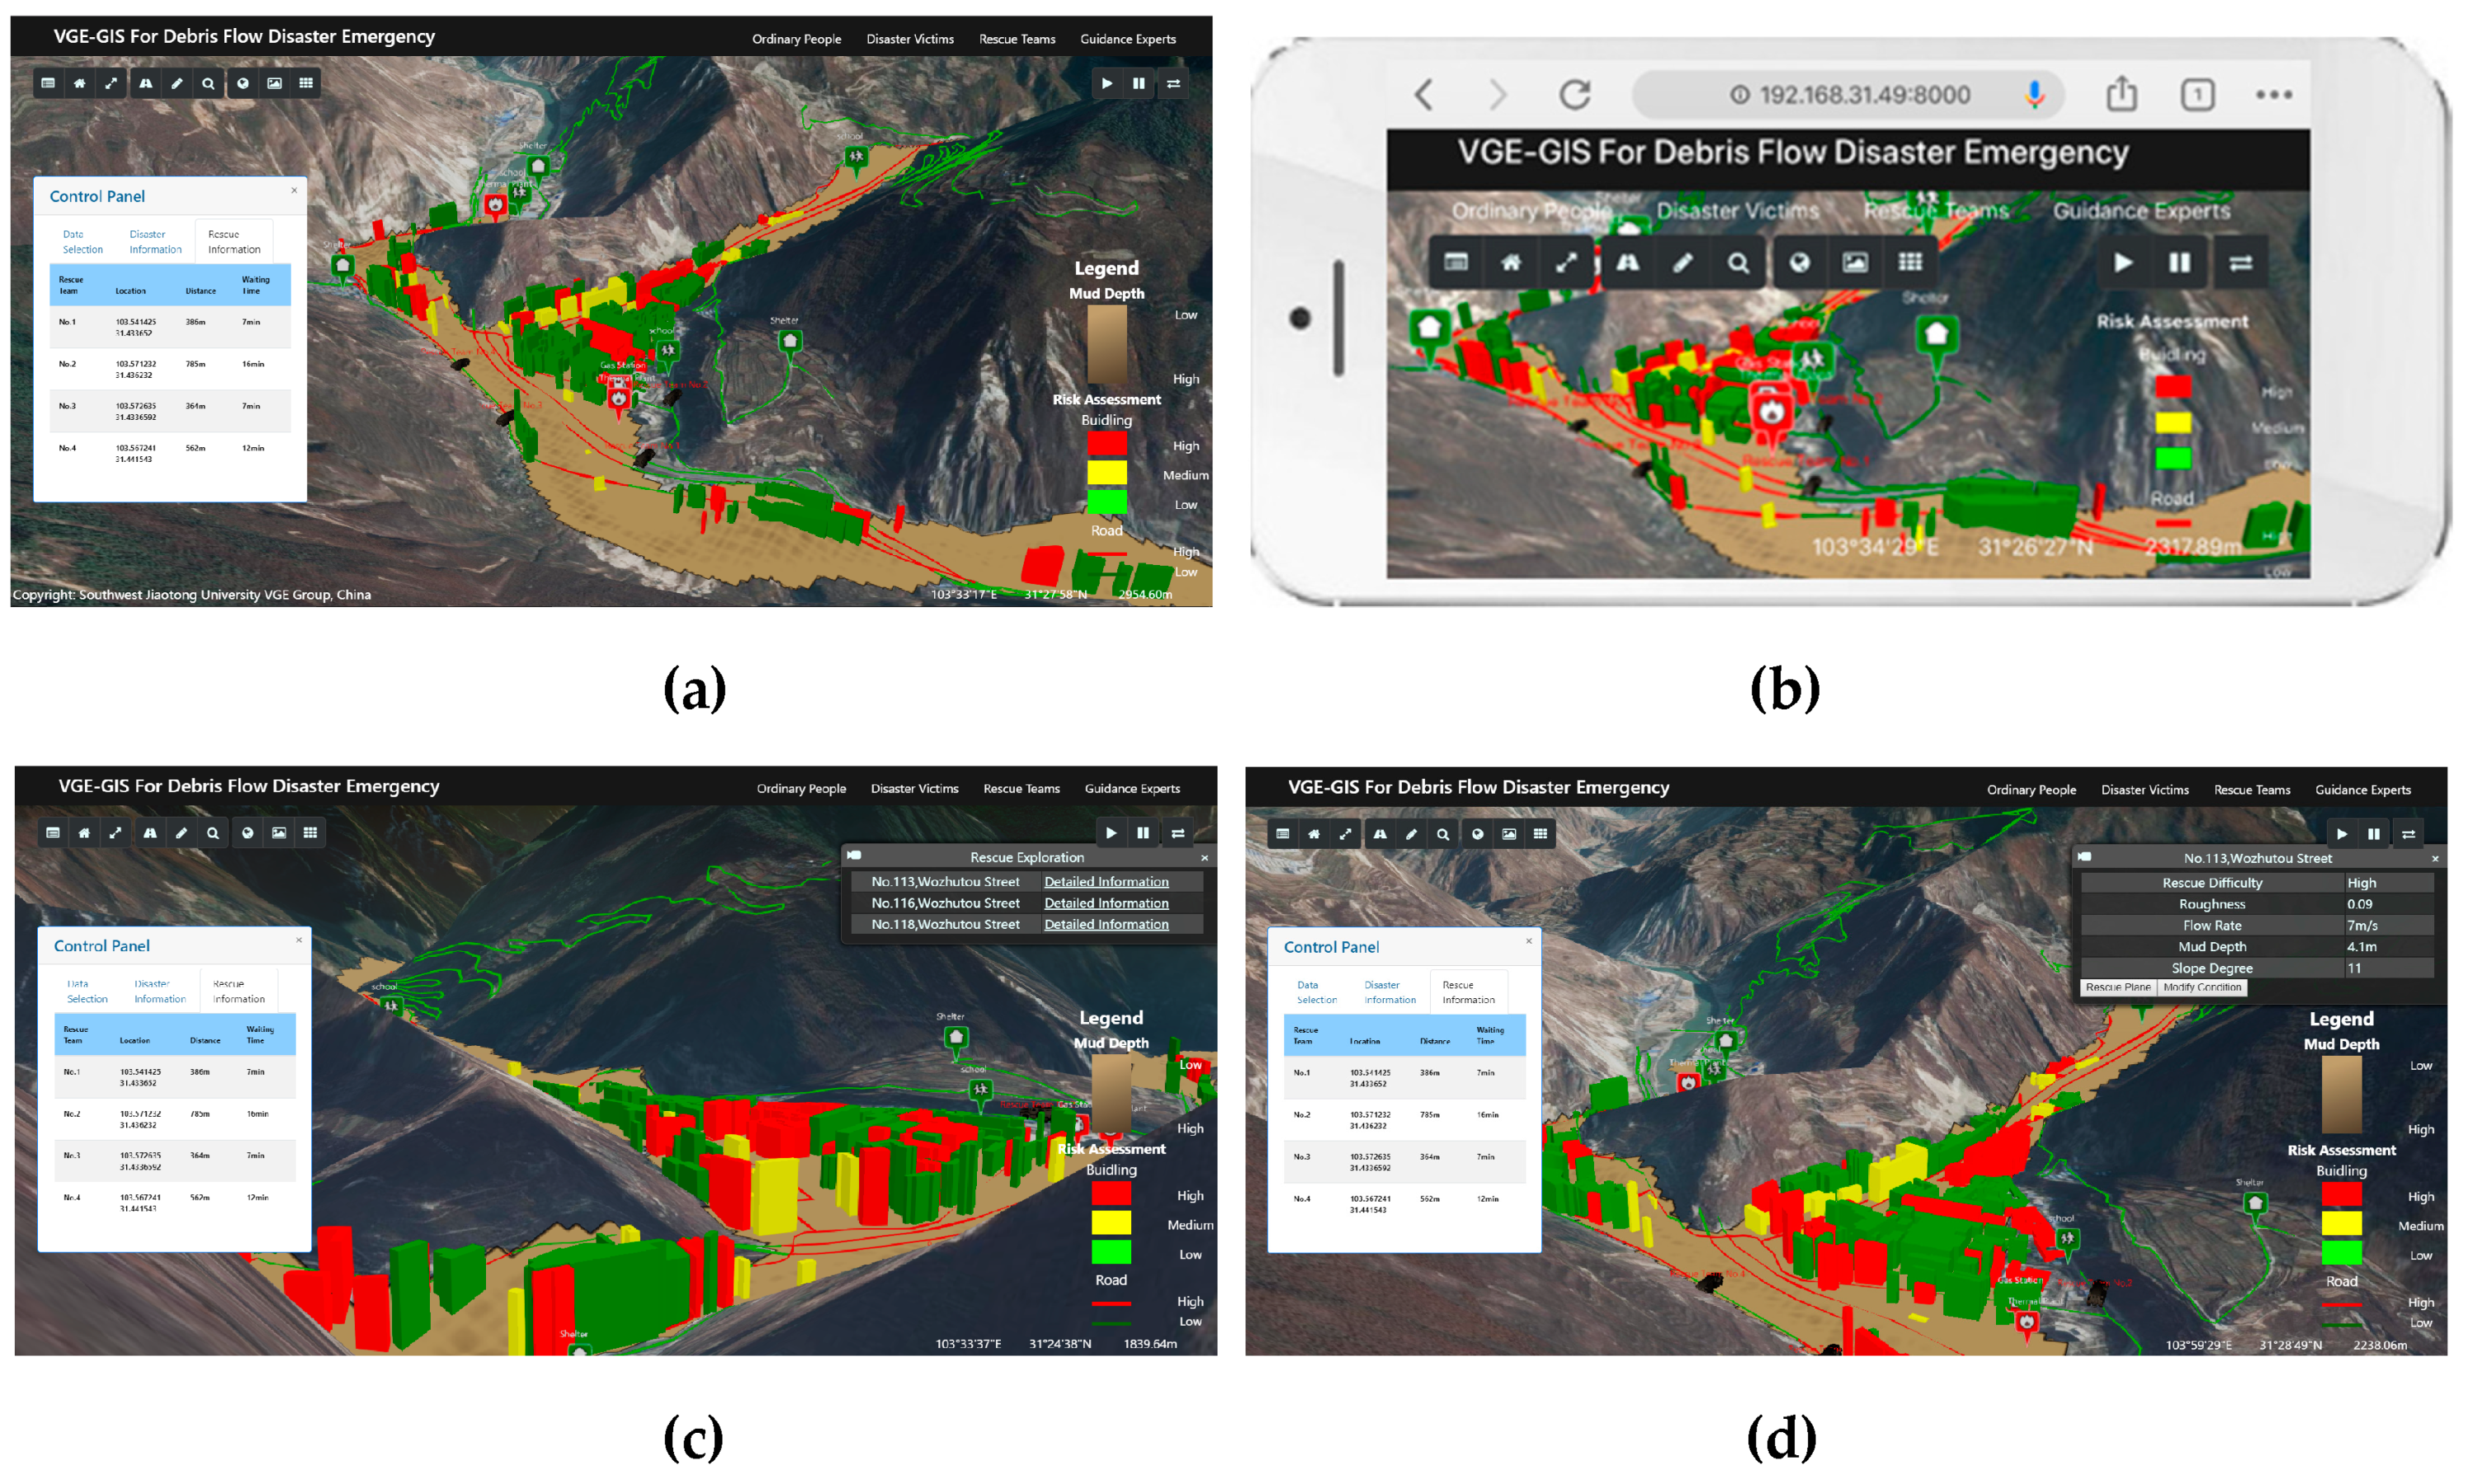
3.2. Prototype System Implementation

Based on the above strategy, a plugin-free browser/server (B/S) prototype system was developed based on WebGL. The prototype system was run and tested on a desktop terminal and mobile terminal. The processor of the desktop terminal was an Intel Core i7 CPU @ 2.6 GHz with 16 GB memory and an NVIDIA GeForce GTX960M GPU. The processor of the mobile terminal was an Apple A9 CPU @ 1.8 GHz with 2 GB of memory and a Power VR GT7600 GPU. The interface of the prototype system for debris flow disaster visualization on different terminals is shown in Figure 6. The system provides basic geographical scene visualization and efficient disaster scene roaming, as well as some additional functions, such as debris flow simulation, evolution control, and disaster interaction analysis. These functions can provide comprehensive disaster information visualization and disaster rescue guidance for multitype users in disaster emergency response scenarios.
In the prototype system, a virtual debris flow disaster environment was constructed to meet the requirements of multitype users in disaster emergency response scenarios. The disaster data include experimental data listed in Table 2, which constitute the data layer of the virtual debris flow disaster environment. The visualization terminals of participants involved in disaster emergency response, which constitute the user layer of the virtual debris flow disaster environment. The disaster virtual scenes incorporate the disaster scene information, monitoring information, analysis information, assessment information and other similar information, which constitute the presentation layer of the virtual debris flow disaster environment.
During the experiment, the user could select their identity to identify the terminal type and perform visualization tasks according to the multilevel visualization task model. The appropriate disaster data can be selected on demand, and appropriate LOD disaster data can be used to construct virtual debris flow disaster environments. Additionally, disaster scene objects can be added or deleted through a control panel by users to meet the requirements of various users in disaster emergency response scenarios.

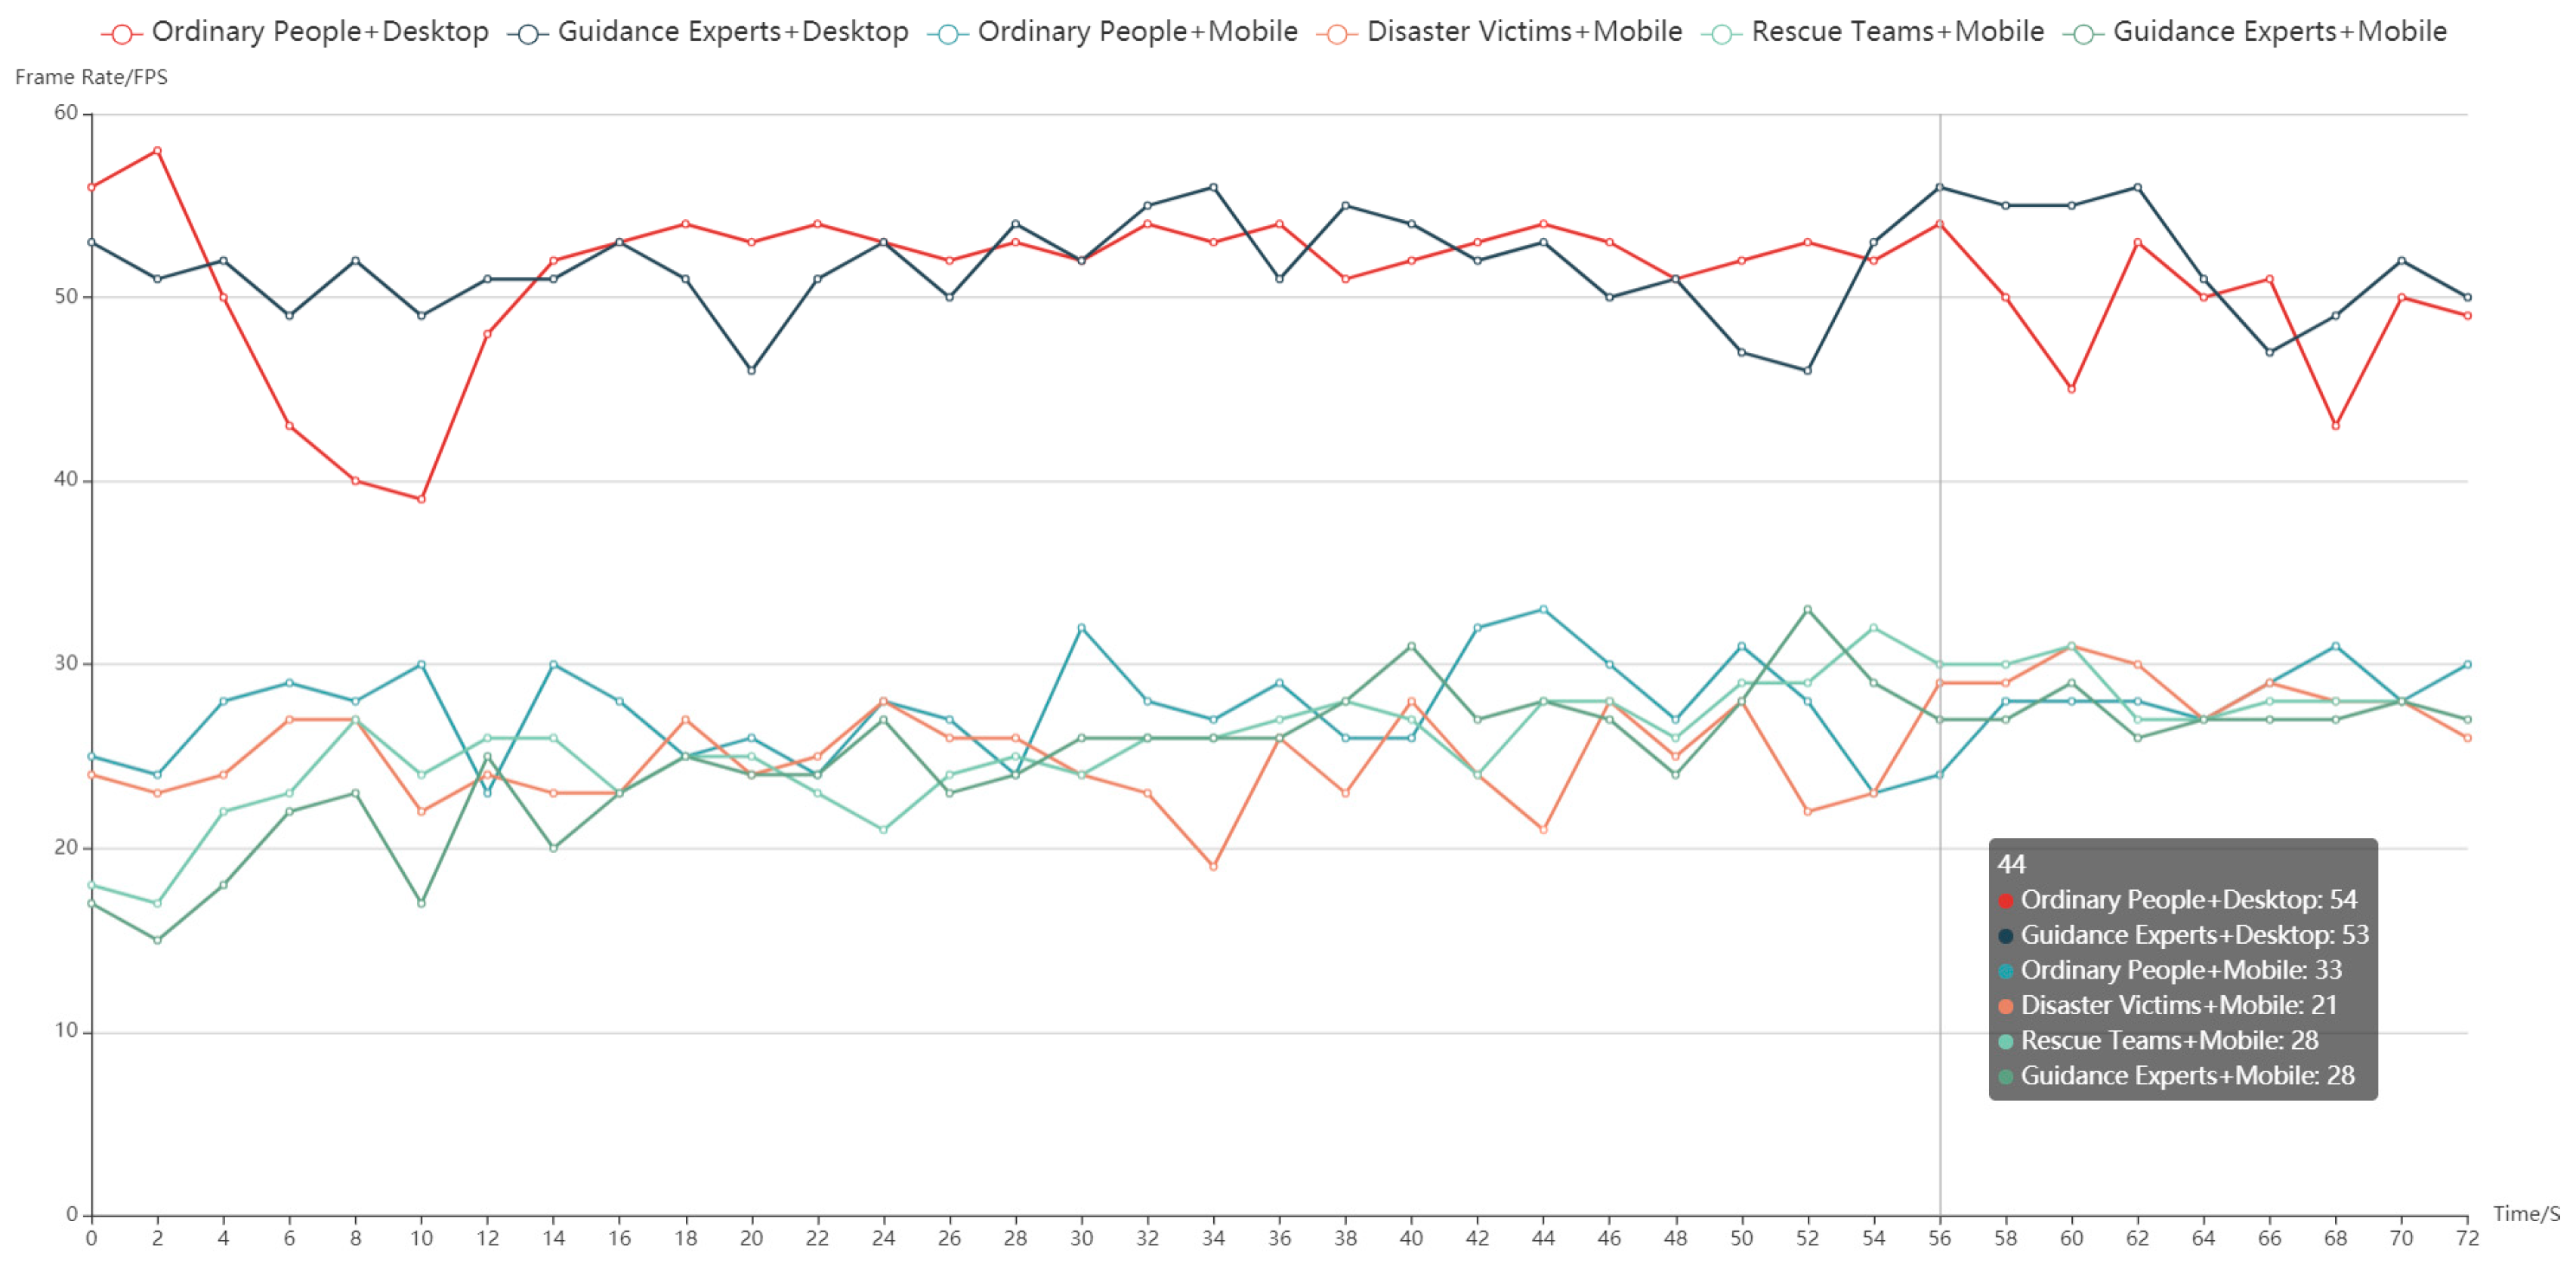
3.3. Experimental Analysis

In the experiment, the various disaster scene objects were visualized, and multilevel LOD building models and debris flow body models were loaded in the virtual debris flow disaster environment for different user identities and visualization task requirements.
If the user identity was ordinary person, the system provides a global view that enables the user to observe the entire debris flow disaster scene and all disaster information, such as the real-time inundation area, evolution time, mud depth and other data. Users can also select one building to observe detailed disaster information. According to the requirements of disaster scene view-only visualization tasks, debris flow disaster scenes and global disaster information were visualized. The system loaded multilevel LOD buildings, roads and debris flow body models according to the terminal used. Figure 7 shows that virtual debris flow disaster environment for an ordinary person on desktop and mobile terminals.
If the user identity was ‘disaster victim’, the system view shifts to the user’s location, loads buildings and roads near this location, and displays relevant rescue information, such as the locations and distances of rescue teams and estimated waiting time. According to the requirements of disaster information analytical tasks, the debris flow disaster scene, relevant disaster information and analysis results near the victim, as well as rescue team information, were visualized. The system loaded the LOD1 model for the user location and the debris flow body model with a low grid resolution. Nearby buildings were loaded as LOD2 models or symbols with risk assessment results considering the performance of the mobile terminal. Figure 8 shows the virtual debris flow disaster environment for disaster victims on mobile terminals.
If the user identity was ‘rescue team’, the system view focuses on the locations of the disaster victims closest to the user’s location and displays relevant rescue information, such as rescue routes, estimated rescue times and other information. In addition, the system loads buildings, roads and risk assessment results near the locations of priority rescue targets. The system provides an interactive and explorative rescue method in which a user can input relevant disaster information and parameters. The system intelligently evaluates the rescue difficulty and gives rescue routes and plans. According to the requirements of disaster rescue explorative visualization tasks, the debris flow disaster scene, relevant disaster information and analysis results near priority rescue targets were visualized. The system loaded LOD1 models near priority rescue targets, global LOD2 models or symbols with risk assessment results and debris flow body models with low grid resolution considering the performance of mobile terminals. Figure 9 shows the virtual debris flow disaster environment for rescue teams on mobile terminals.
If the user identity was ‘guidance expert’, the system provides a global view that enables the user to observe the entire debris flow disaster scene, relevant information for rescue teams and disaster victims. The system loads all buildings, roads, important and dangerous facilities and displays global disaster information analysis results, including human and property loss reports. The system provides an interactive and explorative rescue approach, and the user can input relevant disaster information and parameters. The system can also intelligently evaluate the rescue difficulty and give rescue routes and plans to guide rescue personnel and decision makers. According to the requirements of disaster rescue explorative visualization tasks, the debris flow disaster scene, global disaster information, human and property loss reports, and relevant rescue team and disaster victim information were visualized. The system loaded LOD2 models and symbols, risk assessment results and debris flow body models with high grid resolutions to clearly depict disaster scenes on desktop and mobile terminals. Figure 10 shows the virtual debris flow disaster environment for guidance experts on desktop and mobile terminals.
Simultaneously, the real-time rendering frame rate of the above experimental process was recorded for all types of users, as shown in Figure 11. The figure shows that the rendering frame rate on desktop terminals was approximately 50 FPS and the rendering frame rate on mobile terminals was approximately 25 FPS.
In conclusion, the experimental results indicate that the proposed method can be used to adaptively construct virtual debris flow disaster environments according to the multilevel visualization task requirements of multitype users in debris flow disaster emergency response scenarios. This approach provides efficient visualizations of disaster scenes and appropriate disaster information to various users in debris flow disaster emergency response scenarios.

4. Conclusions and Future Work

The existing research on virtual disaster environments has mainly focused on the specific visualization task requirements of single-type users, and most methods do not meet the multilevel visualization task requirements of multitype users. To address the above problems, this paper considered the professional knowledge backgrounds and requirements of multitype users in debris flow disaster emergency response scenarios to form diverse visualization task requirements and propose the adaptive construction driven by multilevel visualization task method of virtual debris flow disaster environments. First, this paper analyzed the characteristics of virtual debris flow disaster environments and proposed a three-level structure with user layer, presentation layer and data layer. Second, this paper constructed a multilevel visualization model for debris flow disaster emergency response. Third, this paper investigated the relationships among debris flow disaster scene objects in virtual debris flow disaster environments. Notably, the relationships among users, user demands, visualization tasks, disaster data and disaster scene objects were considered to construct a relationship model for debris flow disaster emergency response scenarios. An on-demand construction driven by multilevel visualization task method was proposed for virtual debris flow disaster environments. Fourth, the diverse organization and dynamic scheduling of debris flow disaster scenes were studied for diverse terminals, and an optimized organization and adaptive visualization method was proposed for debris flow disaster scenes. Finally, a debris flow disaster that occurred in Qipan Gully was selected for experimental analysis, and a prototype system was developed. The experimental results showed that the proposed method can adaptively construct virtual debris flow disaster environments according to the multilevel visualization task requirements of multitype users in debris flow disaster emergency response scenarios. This approach provides efficient rendering for disaster 3D scenes and appropriate disaster information for multitype users in debris flow disaster situations.
Despite the achievements described above, this paper has some shortcomings. For example, the division of disaster emergency response participants in general, and the interactive and explorative method developed is relatively simple. Therefore, a more detailed division of participants and a more complex interactive and explorative method in the VR/AR mode should be considered in future work to better meet the user requirements for disaster rescue exploration and visualization.

Author Contributions

Yunhao Zhang, Jun Zhu, Qing Zhu and Ya Hu provided the initial idea for this study. Yunhao Zhang, Weilian Li, Ya Hu, and Junxiao Zhang designed and performed the experiments. Yunhao Zhang, Weilian Li, Lin Fu and Pengcheng Huang recorded and analyzed the experimental results. Junxiao Zhang, Yakun Xie and Lingzhi Yin contributed the experimental data and provided important suggestions. Yunhao Zhang wrote the paper.

Funding

This paper was supported by the National Key Research and Development Program of China (Grant No. 2016YFC0803105), the National Natural Science Foundation of China (Grant Nos. 41801297, and 41871289), and the Fundamental Research Funds for the Central Universities (Grant No. 2682018CX35).

Conflicts of Interest

The authors declare no conflicts of interest.

References

  1. Fan, Y.D.; Wu, W.; Wang, W.; Liu, M.; Wen, Q. Research progress of disaster remote sensing in China. J. Remote Sens. 2016, 20, 523–535. [Google Scholar]
  2. Kryvasheyeu, Y.; Chen, H.; Obradovich, N.; Moro, E.; Van Hentenryck, P.; Fowler, J.; Cebrian, M. Rapid assessment of disaster damage using social media activity. Sci. Adv. 2016, 2, e1500779. [Google Scholar] [CrossRef] [PubMed] [Green Version]
  3. Zhao, Z.C. Seriously study and implement the spirit of General Secretary Xi Jinping’s important speech, comprehensively improve the ability of disaster prevention, mitigation and relief. Disaster Reduct. China 2016, 17, 11. [Google Scholar]
  4. Zhuang, J.Q.; Cui, P.; Ge, Y.G.; He, Y.P.; Liu, Y.H.; Guo, X.J. Probability assessment of river blocking by debris flow associated with the Wenchuan earthquake. Int. J. Remote Sens. 2010, 31, 3465–3478. [Google Scholar] [CrossRef]
  5. Cui, P. Progress and prospects in research on mountain hazards in China. Prog. Geogr. 2014, 33, 145–152. [Google Scholar]
  6. Fan, W.C.; Weng, W.G.; Wu, G.; Meng, Q.F.; Yang, L.X. Basic scientific problems of national security management. Bull. Natl. Nat. Sci. Found. China 2015, 29, 436–443. [Google Scholar]
  7. Fan, Y.D. Disaster prevention and reduction from “+Internet” to “Internet +”. Disaster Reduct. China 2016, 5, 12–15. [Google Scholar]
  8. Bainbridge, W.S. The scientific research potential of virtual worlds. Science 2007, 31, 472–476. [Google Scholar] [CrossRef]
  9. Denolle, M.A.; Dunham, E.M.; Prieto, G.A.; Beroza, G.C. Strong ground motion prediction using virtual earthquakes. Science 2014, 343, 399–403. [Google Scholar] [CrossRef]
  10. Lin, H.; Gong, J.H. Exploring virtual geographic environments. Geogr. Inf. Sci. 2001, 7, 1–7. [Google Scholar] [CrossRef]
  11. Lin, H.; Gong, J.H. On virtual geographic environments. Acta Geod. Cartogr. Sin. 2002, 1, 1–6. [Google Scholar]
  12. Lin, H.; Chen, M.; Hu, M.Y. Research progress and prospect of virtual geographic environments (VGEs). J. Geomat. Sci. Technol. 2013, 30, 361–368. [Google Scholar]
  13. Lin, H.; Zhu, Q.; Chen, M. The being and non-being generate each other, and the virtual and the real are mutually interactive—The progress of virtual geographic environments (VGE) studies in last 20 years. Acta Geod. Cartogr. Sin. 2018, 47, 1027–1030. [Google Scholar]
  14. Lü, G.N. Geographic analysis-oriented virtual geographic environment: Framework, structure and functions. Sci. China Ser. D Earth Sci. 2011, 54, 733–743. [Google Scholar] [CrossRef]
  15. Chen, M.; Lin, H.; Kolditz, O.; Chen, C. Developing dynamic virtual geographic environments (VGEs) for geographic research. Environ. Earth Sci. 2015, 74, 6975–6980. [Google Scholar] [CrossRef] [Green Version]
  16. Lin, H.; Chen, M.; Lü, G.N.; Zhu, Q.; Gong, J.H.; You, X.; Wen, Y.N.; Xu, B.L.; Hu, M.Y. Virtual geographic environments (VGEs): A new generation of geographic analysis tool. Earth-Sci. Rev. 2013, 126, 74–84. [Google Scholar] [CrossRef]
  17. Lin, H.; Zhang, C.X.; Chen, M.; Zheng, X.Q. On virtual geographic environments for geographic knowledge representation and sharing. J. Remote Sens. 2016, 20, 1290–1298. [Google Scholar]
  18. Peng, G.Q.; Wen, Y.N.; Li, Y.T.; Yue, S.S.; Song, Z.Y. Construction of collaborative mapping engine for dynamic disaster and emergency response response. Nat. Hazards 2018, 90, 217–236. [Google Scholar] [CrossRef]
  19. Jiang, J.; Wang, P.; Lung, W.S.; Guo, L.; Li, M. A GIS-based generic real-time risk assessment framework and decision tools for chemical spills in the river basin. J. Hazard. Mater. 2012, 227, 280–291. [Google Scholar] [CrossRef]
  20. Steichen, B.; Carenini, G.; Conati, C. User-adaptive information visualization—Using eye gaze data to infer visualization tasks and user cognitive abilities. In Proceedings of the International Conference on Intelligent User Interfaces, Santa Monica, CA, USA, 19–22 March 2013; pp. 317–328. [Google Scholar]
  21. Gotz, D.; Wen, Z. Behavior-driven visualization recommendation. In Proceedings of the International Conference on Intelligent User Interfaces, Sanibel Island, FL, USA, 8–11 February 2009. [Google Scholar]
  22. Steichen, B.; Conati, C.; Carenini, G. Inferring visualization task properties, user performance, and user cognitive abilities from eye gaze data. ACM Trans. Interact. Intell. Syst. 2014, 4, 1–29. [Google Scholar] [CrossRef]
  23. Zhu, J.; Qi, H.; Hu, Y.; Cao, Y.G. A distributed virtual geographic environment service system for risk assessment of dam-break. In Proceedings of the International Conference on Fuzzy Systems and Knowledge Discovery, Chongqing, China, 29–31 May 2012. [Google Scholar]
  24. Zhu, J.; Zhang, H.; Yang, X.F.; Yin, L.Z.; Li, Y.; Hu, Y.; Zhang, X. A collaborative virtual geographic environment for emergency response dam-break simulation and risk analysis. J. Spat. Sci. 2016, 61, 133–155. [Google Scholar] [CrossRef]
  25. Zhu, J.; Yin, L.Z.; Wang, J.H.; Zhang, H.; Hu, Y.; Liu, Z.J. Dam-break flood routing simulation and scale effect analysis based on virtual geographic environment. IEEE J. Sel. Top. Appl. Earth Obs. Remote Sens. 2015, 8, 105–113. [Google Scholar] [CrossRef]
  26. Yin, L.Z.; Zhu, J.; Zhang, X.; Li, Y.; Wang, J.H.; Zhang, H.; Yang, X.F. Visual analysis and simulation of dam-break flood spatiotemporal process in a network environment. Environ. Earth Sci. 2015, 74, 7133–7146. [Google Scholar] [CrossRef]
  27. Ding, Y.L.; Zhu, Q.; Lin, H. An integrated virtual geographic environmental simulation framework: A case study of flood disaster simulation. Geo-Spat. Inf. Sci. 2014, 17, 190–200. [Google Scholar] [CrossRef]
  28. Liu, M.W.; Zhu, J.; Zhu, Q.; Qi, H.; Yin, L.Z.; Zhang, X.; Feng, B.; He, H.G.; Yang, W.J.; Chen, L.Y. Optimization of simulation and visualization analysis of dam-failure flood disaster for diverse computing systems. Int. J. Geogr. Inf. Sci. 2017, 31, 1891–1906. [Google Scholar] [CrossRef]
  29. Beni, L.H.; Mostafavi, M.A.; Pouliot, J. Geomatics Solutions for Disaster Management; Springer: Berlin/Heidelberg, Germany, 2007. [Google Scholar]
  30. Bates, P.D.; Roo, A.P.J. A simple raster-based model for flood inundation simulation. J. Hydrol. 2000, 236, 54–57. [Google Scholar] [CrossRef]
  31. Yin, L.Z.; Zhu, J.; Li, Y.; Zeng, C.; Zhu, Q.; Qi, H.; Liu, M.; Li, W.; Cao, Z.; Yang, W.; et al. A virtual geographic environment for debris flow risk analysis in residential areas. ISPRS Int. J. Geo-Inf. 2017, 6, 377. [Google Scholar] [CrossRef]
  32. Yin, L.Z. Real-Time Visual Simulation and Analysis Method for Rapid Risk Assessment of Debris Flow Disasters. Ph.D. Thesis, Southwest Jiaotong University, Chengdu, China, 2018. [Google Scholar]
  33. Wang, R.; Chen, B.; Huang, F.R.; Fang, Y. Using collaborative virtual geographic environment for fire disaster simulation and virtual fire training. In Proceedings of the International Conference on Geoinformatics, Hong Kong, China, 15–17 June 2012. [Google Scholar]
  34. Jongman, B.; Hochrainer-Stigler, S.; Feyen, L.; Aerts, J.C.J.H.; Mechler, R.; Botzen, W.J.W.; Bouwer, L.M.; Pflug, G.; Rojas, R.; Ward, P.J. Increasing stress on disaster-risk finance due to large floods. Nat. Clim. Chang. 2014, 4, 264–268. [Google Scholar] [CrossRef]
  35. Berenguer, M.; Sempere-Torres, D.; Hürlimann, M. Debris-flow forecasting at regional scale by combining susceptibility mapping and radar rainfall. Nat. Hazards Earth Syst. Sci. 2015, 15, 587–602. [Google Scholar] [CrossRef] [Green Version]
  36. Thielen, J.; Bartholmes, J.; Ramos, M.H.; Roo, A. The European flood alert system—Part 1: Concept and development. Hydrol. Earth Syst. Sci. 2009, 13, 125–140. [Google Scholar] [CrossRef]
  37. Avagyan, A.; Manandyan, H.; Arakelyan, A.; Piloyan, A. Toward a disaster risk assessment and mapping in the virtual geographic environment of Armenia. Nat. Hazards 2018, 92, 283–309. [Google Scholar] [CrossRef]
  38. Kim, J.C.; Jung, H.; Kim, S.; Chung, K. Slope based intelligent 3D disaster simulation using physics engine. Wirel. Pers. Commun. 2016, 86, 183–199. [Google Scholar] [CrossRef]
  39. Meng, L.Q.; Reischenbacher, T.; Zirf, A. Map Based Mobile Services; Springer: Berlin/Heidelberg, Germany, 2005. [Google Scholar]
  40. Zhu, Q.; Fu, X. The review of visual analysis methods of multi-modal spatio-temporal big data. Acta Geod. Cartogr. Sin. 2017, 46, 1672–1677. [Google Scholar]
  41. Liu, M.W.; Zhu, Q.; Zhu, J.; Feng, B.; Li, Y.; Zhang, J.X.; Fu, X.; Zhang, P.C.; Yang, W.J.; Ning, X.W.; et al. The multi-level visualization task model for multi-modal spatio-temporal data. Acta Geod. Cartogr. Sin. 2018, 47, 1098–1104. [Google Scholar]
  42. Qiu, L.Y. A Smart Aggregation Method of Spatial-Temporal Data for Natural Disaster Emergency Response Tasks. Ph.D. Thesis, Wuhan University, Wuhan, China, 2017. [Google Scholar]
  43. Zhang, Y.H.; Zhu, Q.; Zhu, J.; Liu, M.W.; He, H.G.; Yang, W.J.; Zhang, P.C.; Cao, Z.Y. Lightweight web visualization of massive dsm data. J. Geomat. Sci. Technol. 2017, 34, 649–653. [Google Scholar]
  44. Hu, Y.; Zhu, J.; Li, W.L.; Zhang, Y.H.; Zhu, Q.; Qi, H.; Zhang, H.; Cao, Z.Y.; Yang, W.J.; Zhang, P.C. Construction and optimization of three-dimensional disaster scenes within mobile virtual reality. ISPRS Int. J. Geo-Inf. 2018, 7, 215. [Google Scholar] [CrossRef]
  45. Zhu, Q.; Chen, X.W.; Ding, Y.L.; Liu, M.W.; He, H.G.; Yang, W.J.; Chen, L.Y.; Cao, Z.Y. Organization and scheduling method of 3d urban scene data driven by visual perception. J. Southwest Jiaotong Univ. 2017, 52, 869–876. [Google Scholar]
  46. Zhang, Y.H.; Zhu, J.; Zhu, Q.; Li, W.L.; Zhang, J.X.; Liu, M.W.; Li, Y.; Feng, B. Optimized organization and adaptive visualization of complicated mountain disaster 3D scenes for diverse terminals. ISPRS Arch. Photogramm. Remote Sens. Spat. Inf. Sci. 2018, 42, 237–241. [Google Scholar] [CrossRef]
  47. Li, W.L.; Zhu, J.; Zhang, Y.H.; Cao, Y.G.; Hu, Y.; Fu, L.; Huang, P.C.; Xie, Y.K.; Yin, L.Z.; Xu, B. A fusion visualization method for disaster information based on self-explanatory symbols and photorealistic scene cooperation. ISPRS Int. J. Geo-Inf. 2019, 8, 104. [Google Scholar] [CrossRef]
Figure 1. Framework of virtual debris flow disaster environment.
Ijgi 08 00209 g001
Figure 2. Multilevel visualization task model for disaster emergency response.
Ijgi 08 00209 g002
Figure 3. Relations among debris flow disaster data sets.
Ijgi 08 00209 g003
Figure 4. Relationship model of users, demands, tasks, data and scene objects in debris flow disaster emergency response.
Ijgi 08 00209 g004
Figure 5. Diverse organization method of multitype debris flow disaster data.
Ijgi 08 00209 g005
Figure 6. Prototype system for debris flow disaster visualization: (a) Prototype system run on a desktop terminal and (b) prototype system run on a mobile terminal.
Ijgi 08 00209 g006
Figure 7. Virtual debris flow disaster environment for an ordinary person on desktop and mobile terminals: (a) User selects one building to observe detailed disaster information; (b) prototype system is run on a desktop terminal; (c) prototype system is run on a mobile terminal.
Ijgi 08 00209 g007
Figure 8. Virtual debris flow disaster environment for disaster victims on mobile terminals
Ijgi 08 00209 g008
Figure 9. Virtual debris flow disaster environment for rescue teams on mobile terminals: (a) Users can observe relevant information for disaster victims; (b) step 1 of the interactive and explorative rescue process; (b) step 2 of the interactive and explorative rescue process.
Ijgi 08 00209 g009
Figure 10. Virtual debris flow disaster environment for guidance experts on desktop and mobile terminals: (a) Prototype system run on a desktop terminal; (b) prototype system run on a mobile terminal; (c) step 1 of the interactive and explorative rescue process; (d) step 2 of the interactive and explorative rescue process.
Ijgi 08 00209 g010
Figure 11. Real-time rendering frame rate of the experimental process for various users
Ijgi 08 00209 g011
Table 1. Dynamic scheduling method of diverse debris flow scene data.
Data CategoryData OrganizationScheduling Method
Basic geographic dataHierarchy scene pyramidRaising/lowering the maximum tile level
3D buildings dataMultilevel LOD modelsScheduling more detailed/simplified LOD models or symbols
Roads dataRoad centerlinesScheduling all/main road centerlines
Debris flow body dataMultilevel LOD debris flow bodyScheduling more detailed/simplified LOD debris flow bodies
Table 2. Experimental data.
CategoryContent
Basic geographic dataDOM/DEM
disaster simulation dataInundation area/mud depth/flow rate/evolution time/debris flow body model
Thematic analysis dataResidents building models/roads/important facilities/dangerous facilities/population/risk assessment/property loss/personnel location

