Article

Monitoring and Mapping of Rice Cropping Pattern in Flooding Area in the Vietnamese Mekong Delta Using Sentinel-1A Data: A Case of An Giang Province

1
Faculty of Environmental Earth Science, Hokkaido University, Sapporo 060-0810, Japan
2
United Nations University Institute for the Advanced Study of Sustainability (UNU-IAS), Tokyo 150-8925, Japan
3
Institute of Industrial Science, The University of Tokyo, Tokyo 153-8505, Japan
4
Faculty of Environmental Earth Science, Hokkaido University, Sapporo 060-0810, Japan
*
Author to whom correspondence should be addressed.
ISPRS Int. J. Geo-Inf. 2019, 8(5), 211; https://0-doi-org.brum.beds.ac.uk/10.3390/ijgi8050211
Submission received: 17 March 2019 / Revised: 24 April 2019 / Accepted: 4 May 2019 / Published: 7 May 2019

Abstract

:
Cropping intensity is one of the most important decisions made independently by farmers in Vietnam. It is a crucial variable of various economic and process-based models. Rice is grown under irrigated triple- and double-rice cropping systems and a rainfed single-rice cropping system in the Vietnamese Mekong Delta (VMD). These rice cropping systems are adopted according to the geographical location and water infrastructure. However, little work has been done to map triple-cropping of rice using Sentinel-1 along with the effects of water infrastructure on the rice cropping intensity decision. This study is focused on monitoring rice cropping patterns in the An Giang province of the VMD from March 2017 to March 2018. The fieldwork was carried out on the dates close to the Sentinel-1A acquisition. The results of dual-polarized (VV and VH) Sentinel-1A data show a strong correlation with the spatial patterns of various rice growth stages and their association with the water infrastructure. The VH backscatter (σ°) is strongly correlated with the three rice growth stages, especially the reproductive stage when the backscatter is less affected by soil moisture and water in the rice fields. In all three cropping patterns, σ°VV and σ°VH show the highest value in the maturity stage, often appearing 10 to 12 days before the harvesting of the rice. A rice cropping pattern map was generated using the Support Vector Machine (SVM) classification of Sentinel-1A data. The overall accuracy of the classification was 80.7% with a 0.78 Kappa coefficient. Therefore, Sentinel-1A can be used to understand rice phenological changes as well as rice cropping systems using radar backscattering.

1. Introduction

Rice (Oryza. sativa L.) is one of the major crops and the primary daily grain consumed in Asian countries [1,2,3]. The increasing population in this region is leading to an increased demand for rice production [3,4]. Previous studies revealed that rice demand is rising by ~1.8% per year [3,5]. It is challenging to increase rice production with limited land and water resources [5,6], especially under the conditions of extreme floods and weather driven by climate change [7,8,9,10]. The Mekong Delta is vulnerable to water regime changes and seawater intrusion [11,12]. Most of the rice produced in Vietnam comes from the Vietnamese Mekong Delta (VMD). It feeds a population of nearly 95 million and provides food security in Southeast Asia [13,14,15]. Rice is grown under irrigated triple- and double-rice crops and rainfed single-rice crop, a traditional rice cropping system. In the VMD, these rice cropping systems were adopted according to the geographical location and water infrastructure [16]. Typically, rice irrigation takes place within a rectangular dike-protection system [17,18,19]. The rapid intensification of agriculture, mainly in irrigated areas, has been explained by the renovation policy, by which the delta was turned into the rice bowl of Vietnam by the mid-1990s [20,21,22,23]. Since then, Vietnam has continuously increased rice production to become the second largest rice exporting country in the world in 2012 [24]. Vietnam expanded dike and irrigation systems to cope with floods and manage water irrigation [25,26,27]. The An Giang province has been well known as the largest dike system area in the VMD since 1996 [28]. The traditional rice crop has been replaced by a double-rice crop. Since 2009, the double-rice crop has gradually been replaced by a triple-rice crop to increase rice production for food security and economic development [29,30].
Understanding rice crop dynamics is critical for stabilizing and sustaining rice production. Location and phenological stages of rice crops are useful for policymakers to protect crops and minimize productivity loss. The strategy for sustainable cropping systems is key for long-term development in the region. For example, An Giang has faced dike breaks on several occasions. In October 2011, approximately 4000 hectares of rice fields were lost in Chau Phu district and Chau Doc city. On August 29, 2018, a dike break resulted in the submerging of 700 hectares of ready-for-harvest rice in Tri Ton district. Rice prices have recently also declined due to a sustained oversupply of rice. Typically, the local farmers have been gradually shifting their rice to non-rice crops based on market prices. Therefore, systematic rice crop mapping and monitoring in the VMD could play an essential role in economic planning. Remote sensing data might provide quick high-quality, consistent, and timely information about spatial and temporal changes in the rice cropping area in different seasons on regional and global scales [31,32,33].
Previous studies have used optical imagery such as Moderate Resolution Imaging Spectroradiometer (MODIS) and Landsat to monitor rice paddy growth [29,34,35,36,37]. However, it is difficult to achieve high accuracy due to the moderate spatial resolution of images produced by MODIS and Landsat satellites. The low resolution leads to the inability to detect small rice fields [29,34]. The optical sensors have a high temporal resolution but, as passive sensors, they are frequently contaminated by clouds in monsoon regions [29,35,38]. Besides, crop distribution has only been mapped using time series of vegetation and water indices, e.g., normalized difference vegetation index (NDVI), enhanced vegetation index (EVI), and normalized difference water index (NDWI) [34,39,40]. Thus, these studies showed relatively high errors in detection of rice patterns because the flood patterns disturbed the rice detection causing confusion with other vegetation types. The advancement of synthetic aperture radar (SAR) system penetrating clouds makes SAR a better choice for timely mapping of crops, plantation, water bodies, and flooding by specific backscattering properties [5,32,33,41].
Recently, SAR data were utilized to map rice crops as its signals are sensitive to rice crop geometric structures [42,43]. Choudhury et al. [43] revealed the potential of RADARSAT-1 data for rice monitoring. The SAR signal is independent of solar illumination and cloud condition, producing high-quality satellite images. Nelson et al. [44] used TerraSAR-X data to create rice maps in Southern Asia and achieved relative accuracy of 85%. However, the shorter wavelength microwave radiation of the X-band detects only the canopy. The longer wavelength microwave radiation of the L-band can also penetrate targets like leaves and canopy and only returns energy from the stem of the plant. Thus, using only X-band or L-band, it is hard to separate plants and other objects [45,46]. Previous studies showed that the C-band was able to distinguish between rice and non-rice, particularly in Japan, China, India, and Vietnam [41,47,48,49,50,51]. The SAR data availability has increased with the launch of Sentinel-1A C-band SAR on April 3, 2014 under the European Commission’s Copernicus program [52,53]. Continuous near-real-time land monitoring, providing dual-polarized, i.e., Vertical–Vertical (VV) and Vertical–Horizontal (VH) SAR images are contributed by Sentinel-1A. Depending on the geographic location, revisit cycles are up to six days due to the Sentinel-1B. Even though Sentinel-1A has moderate time series (12 days revisit cycle), it is still suitable for monitoring rice stages and the seasonal calendar. Each rice stage takes at least 30 days, and sowing time also varies at least a month in the VMD. The Sentinel-1A C-band at a high spatial resolution (10-m pixel) is sensitive to water and crop geometry [41,52]. Thus, Sentinel-1A is particularly valuable for monitoring rice cropping patterns and can improve rice mapping accuracy.
In Vietnam, Sentinel-1 data has been successfully applied in various fields such as estimation rice production and area, aquaculture production, and rice cropping pattern based on Earth observation. Clauss et al. [54] conducted a study to estimate rice production and rice area in Vietnam. Ottinger et al. [55] observed aquaculture ponds using more than 500 Sentinel-1 scenes and an object-based analysis method and revealed that Sentinel-1 SAR with high spatial resolution can be used for monitoring aquaculture ponds in Vietnam and China. The author showed this approach has great potential for global production projections. Interestingly, Arai et al. [56] predicted methane emissions based on remote sensing data and found that PALSAR-2 could distinguish inundated-rice field and noninundated rice field in Vietnam. It should be pointed out, moreover, that Bouvet et al. [31], Nguyen et al. [41], and Phan et al. [45] used SAR sensors from COSMO-SkyMed X-band, Sentinel-1A, and ENVISAT/ASAR satellite images, respectively, for monitoring rice in the VMD. However, those studies were focused on specific seasons; Nguyen et al. [41] paid attention to the winter–spring season in 2017 and Phan et al. [45] concentrated on summer–autumn in 2018. Bouvet et al. [31] also focused on the main seasons (winter–spring and autumn–winter). Little work has been done on analyzing the temporal pattern of three rice cropping patterns using the response of the radar signal of Sentinel-1A. This study aimed to apply geoinformation technology that can provide a better understanding of the behaviors of crop phenology based on the radar backscattering of Sentinel-1A data. Moreover, a spatiotemporal database of rice growth stages in different rice cropping systems can support policymakers in the decision-making process. We also assessed rice cropping system distribution in the water infrastructure in the An Giang province. To address this, we analyzed temporal variation σ°VV and σ°VH polarizations throughout the rice growth stages. We also classified the rice cropping patterns distribution by using Sentinel-1A data.

2. Materials and Methods
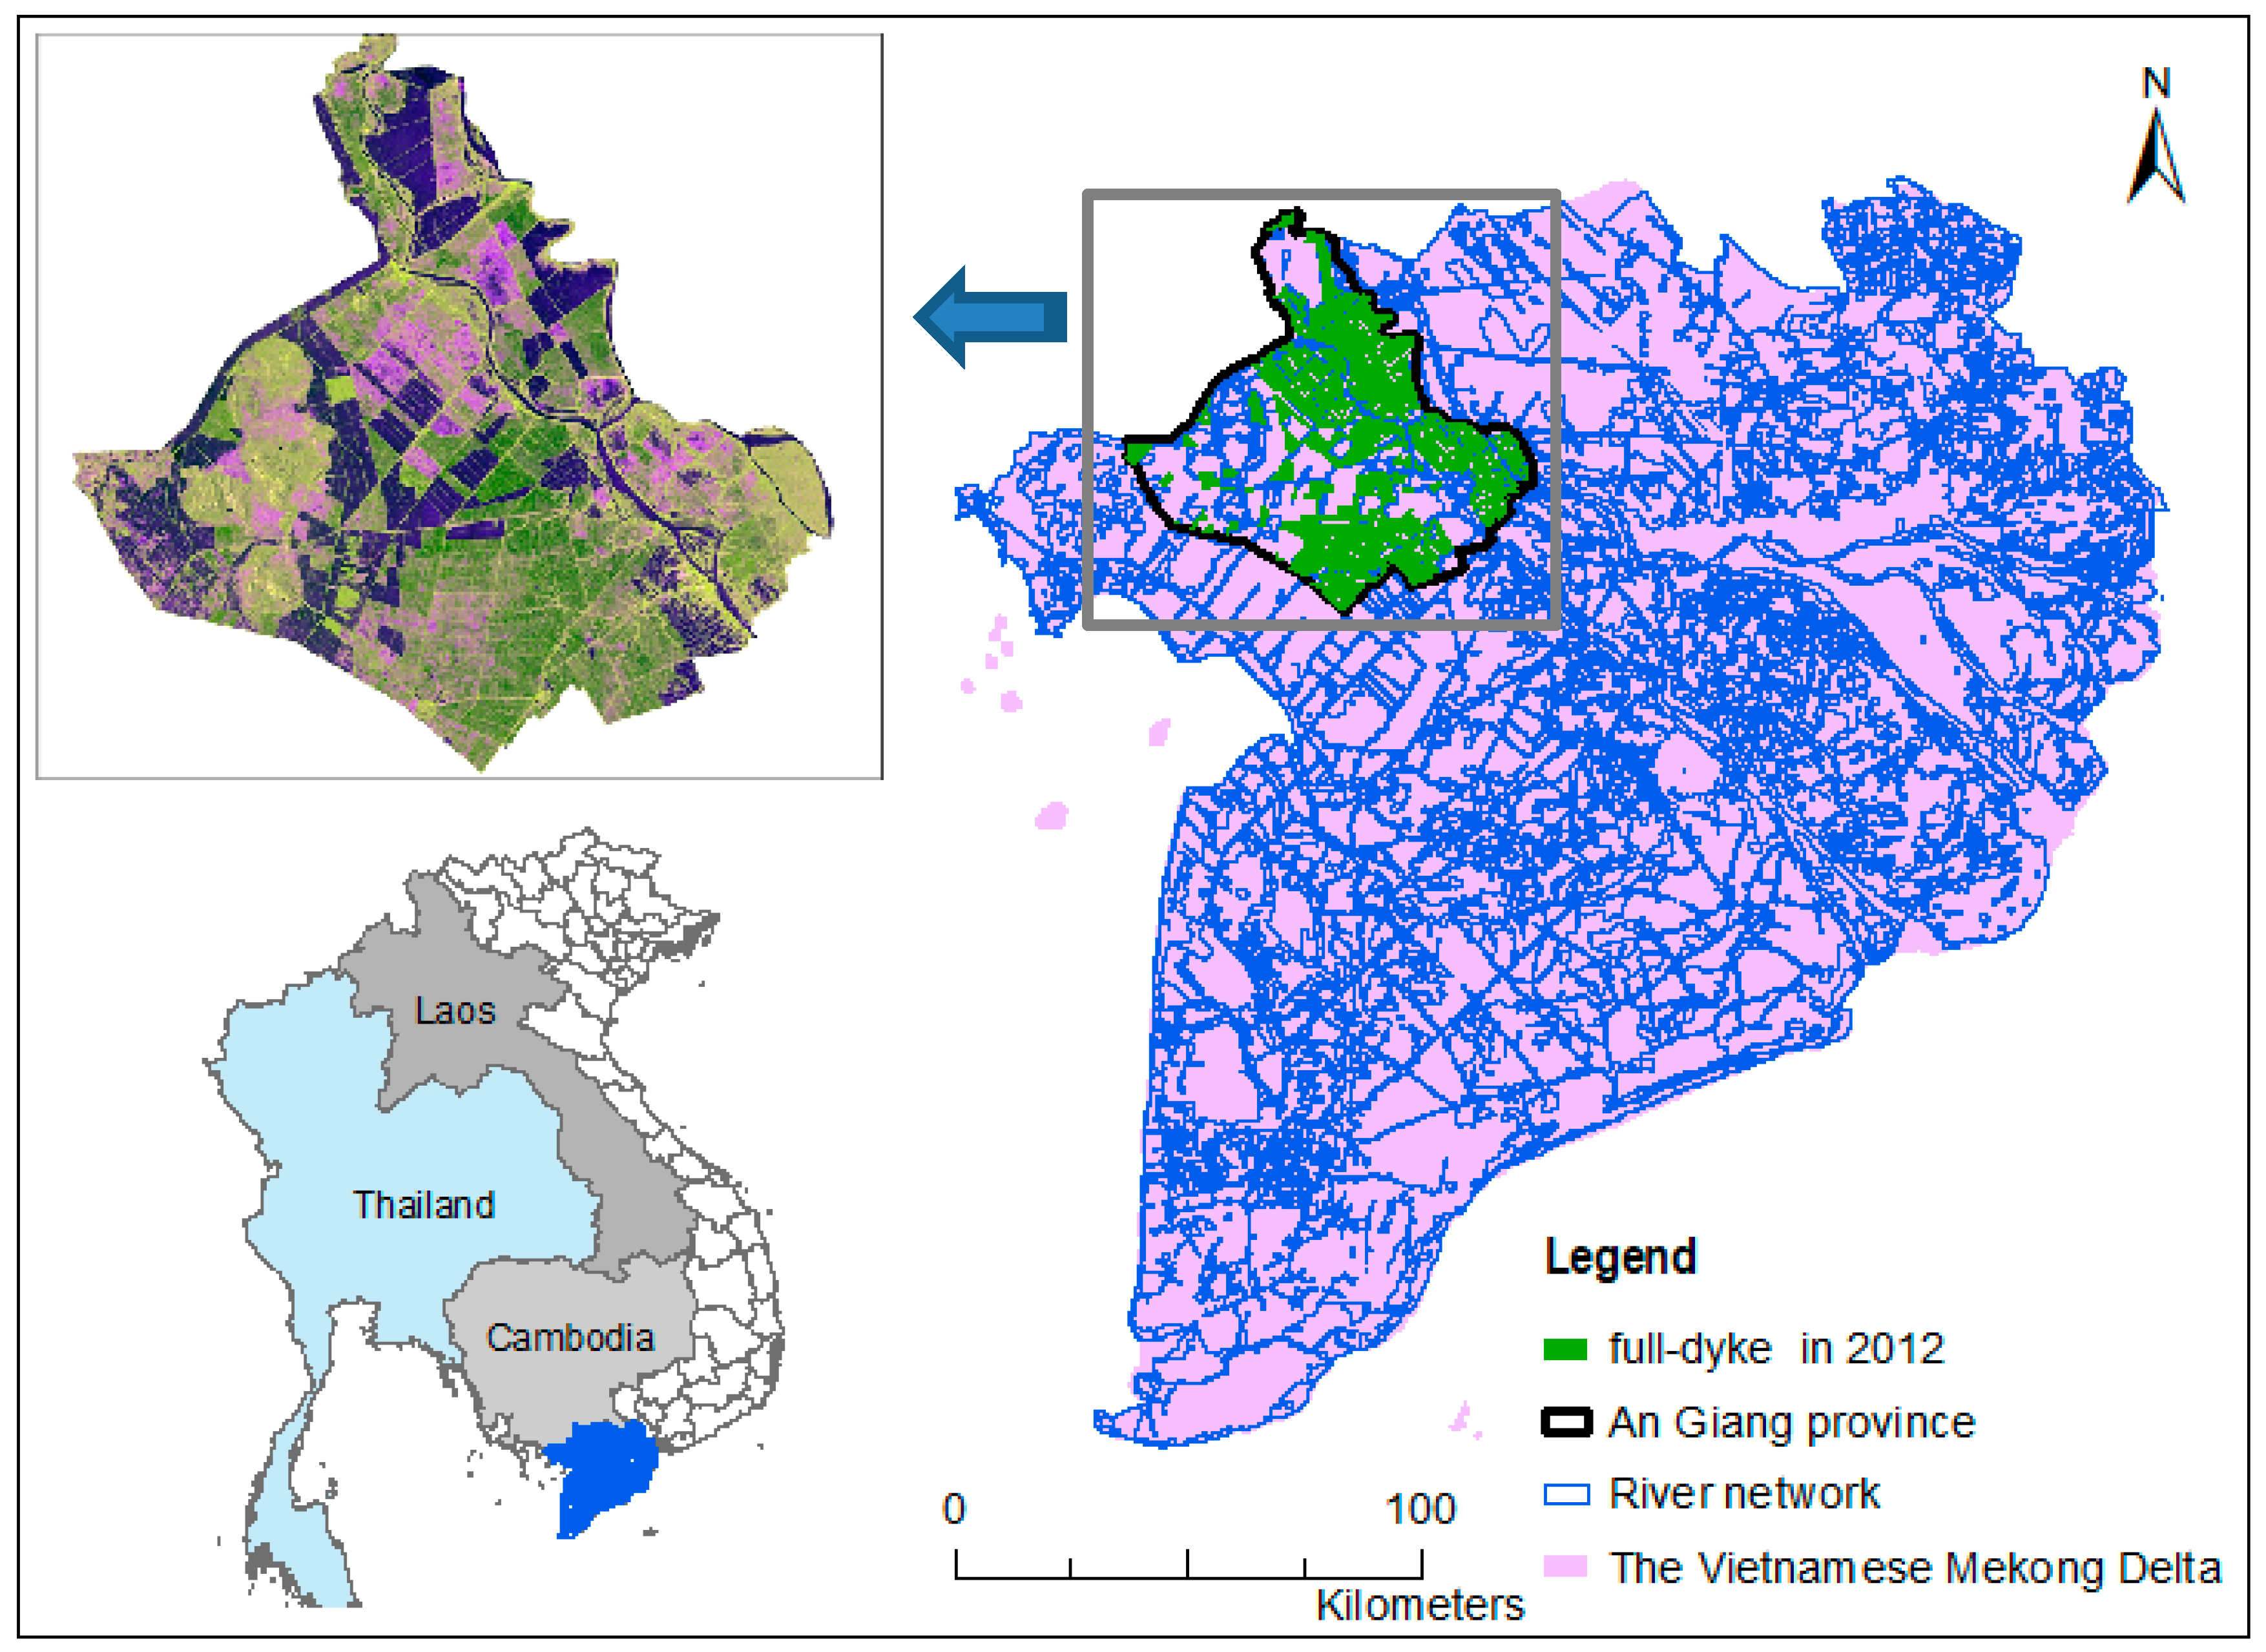
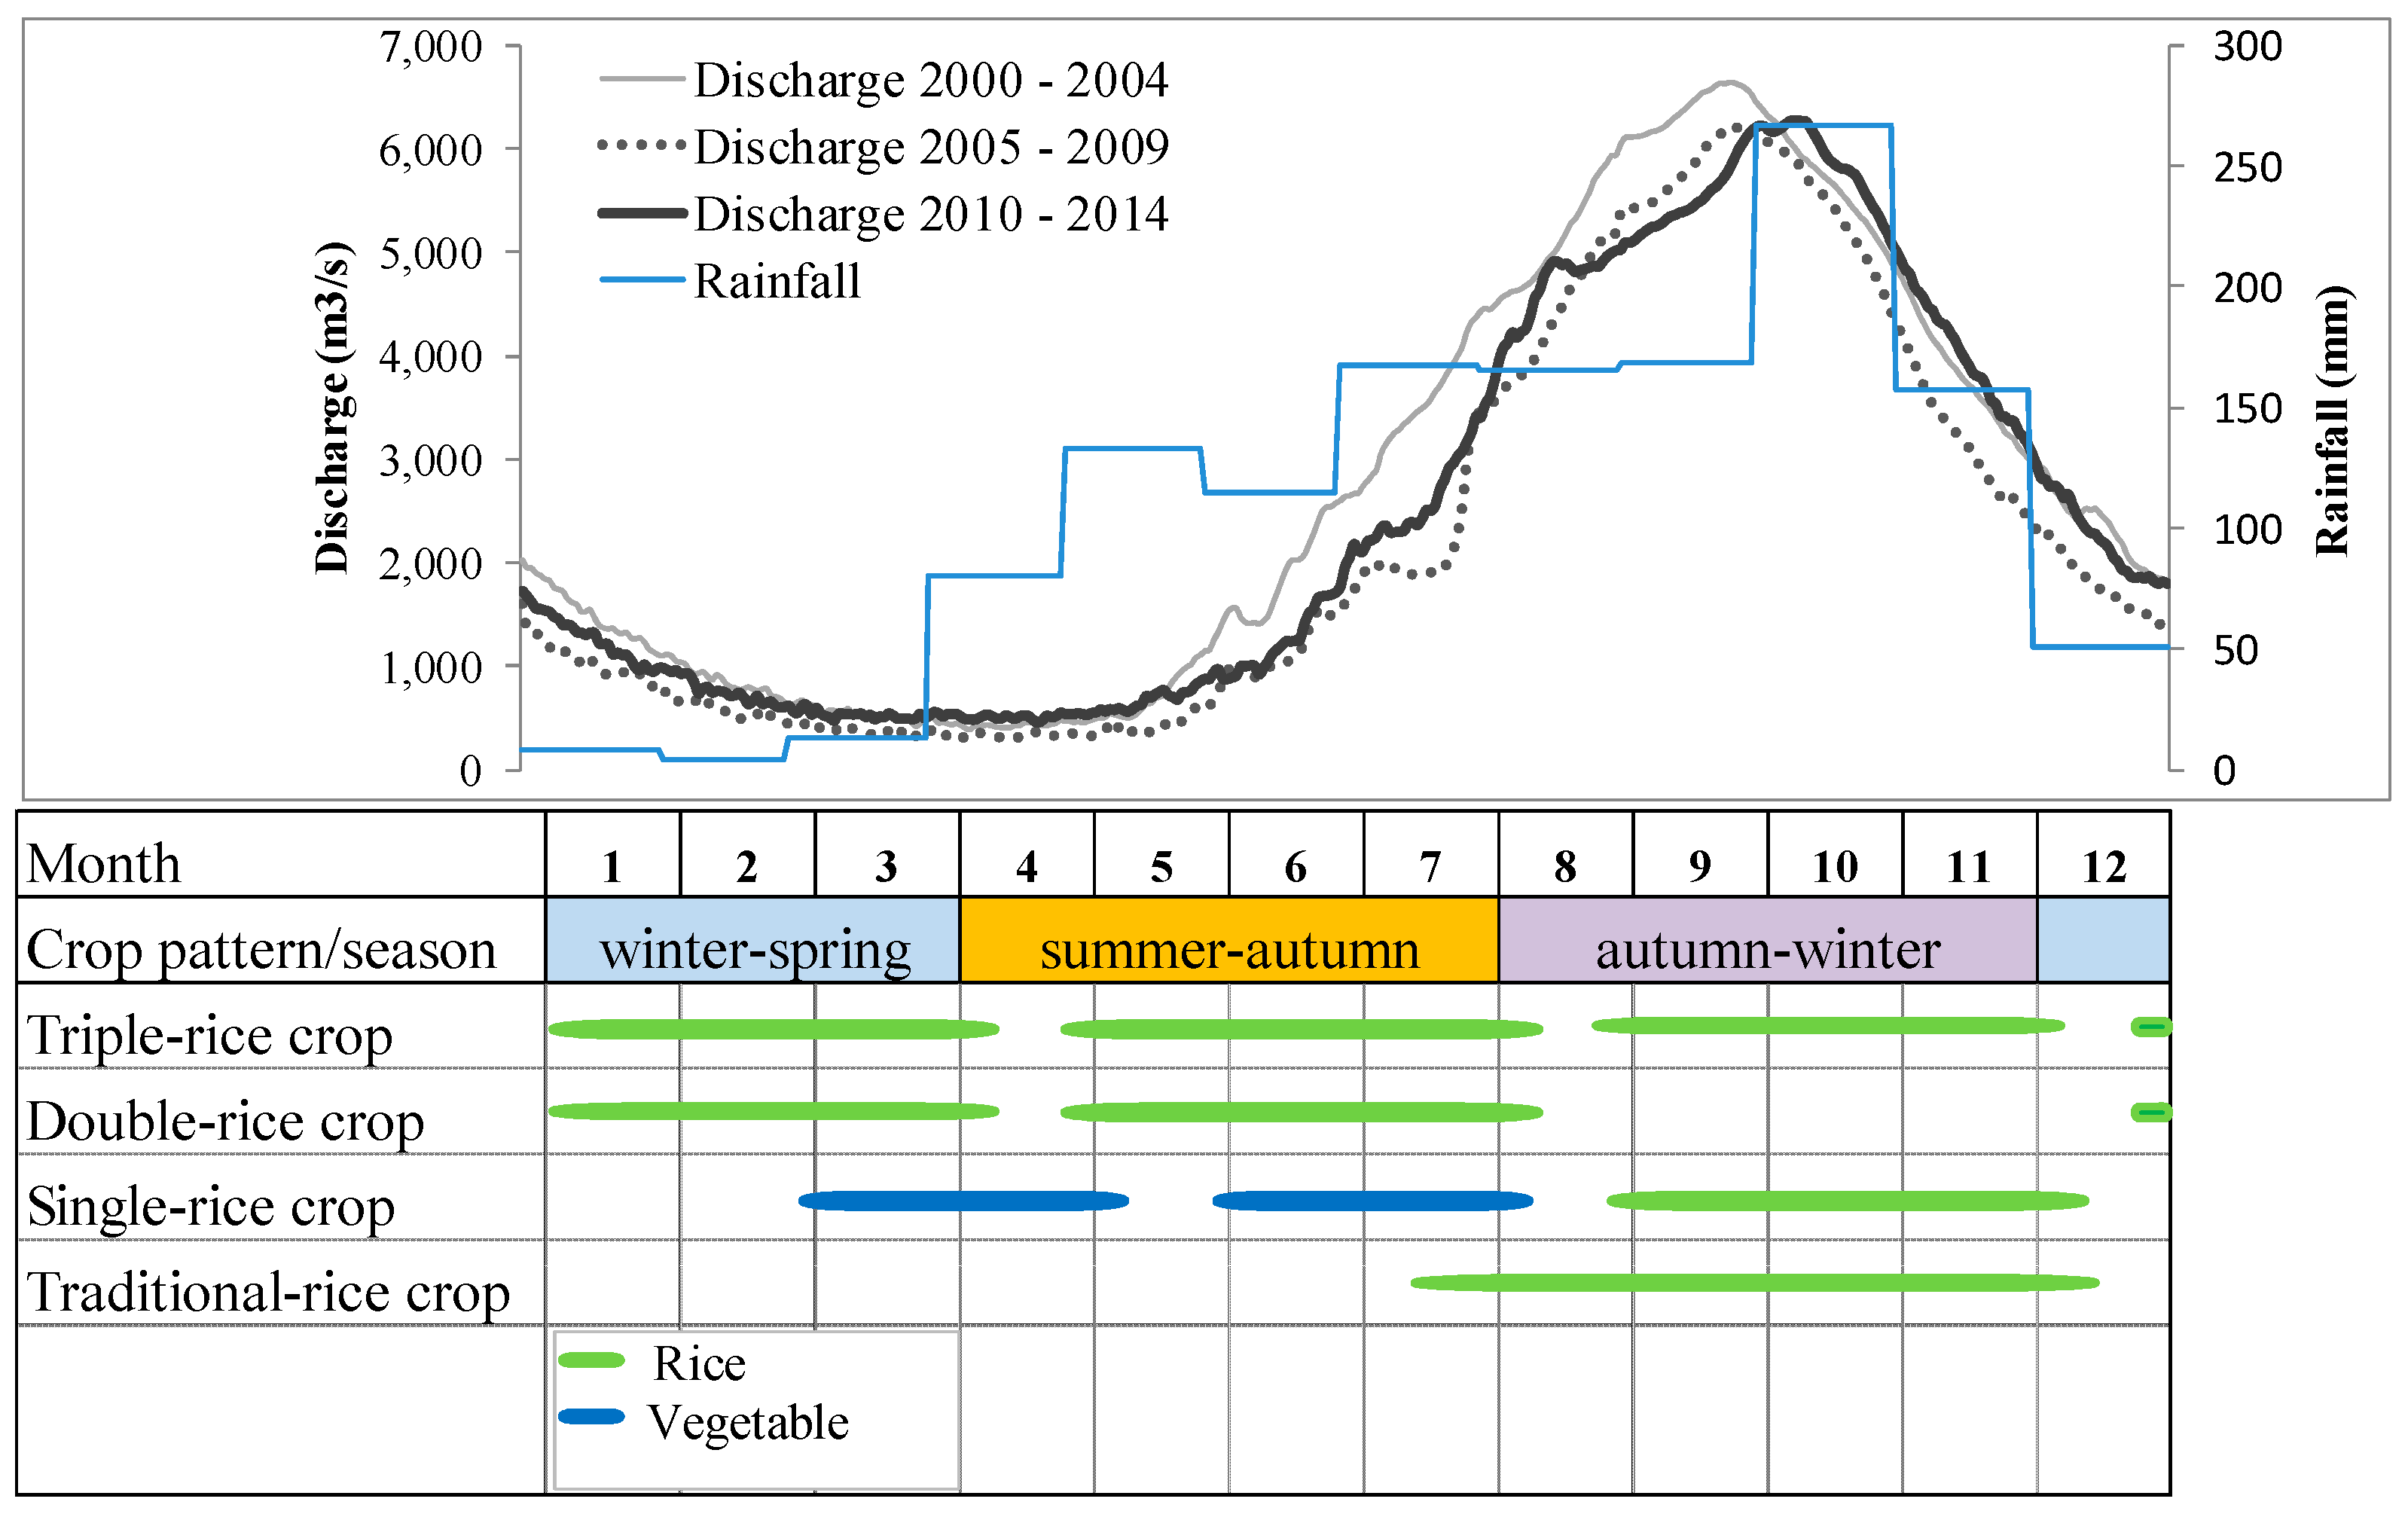
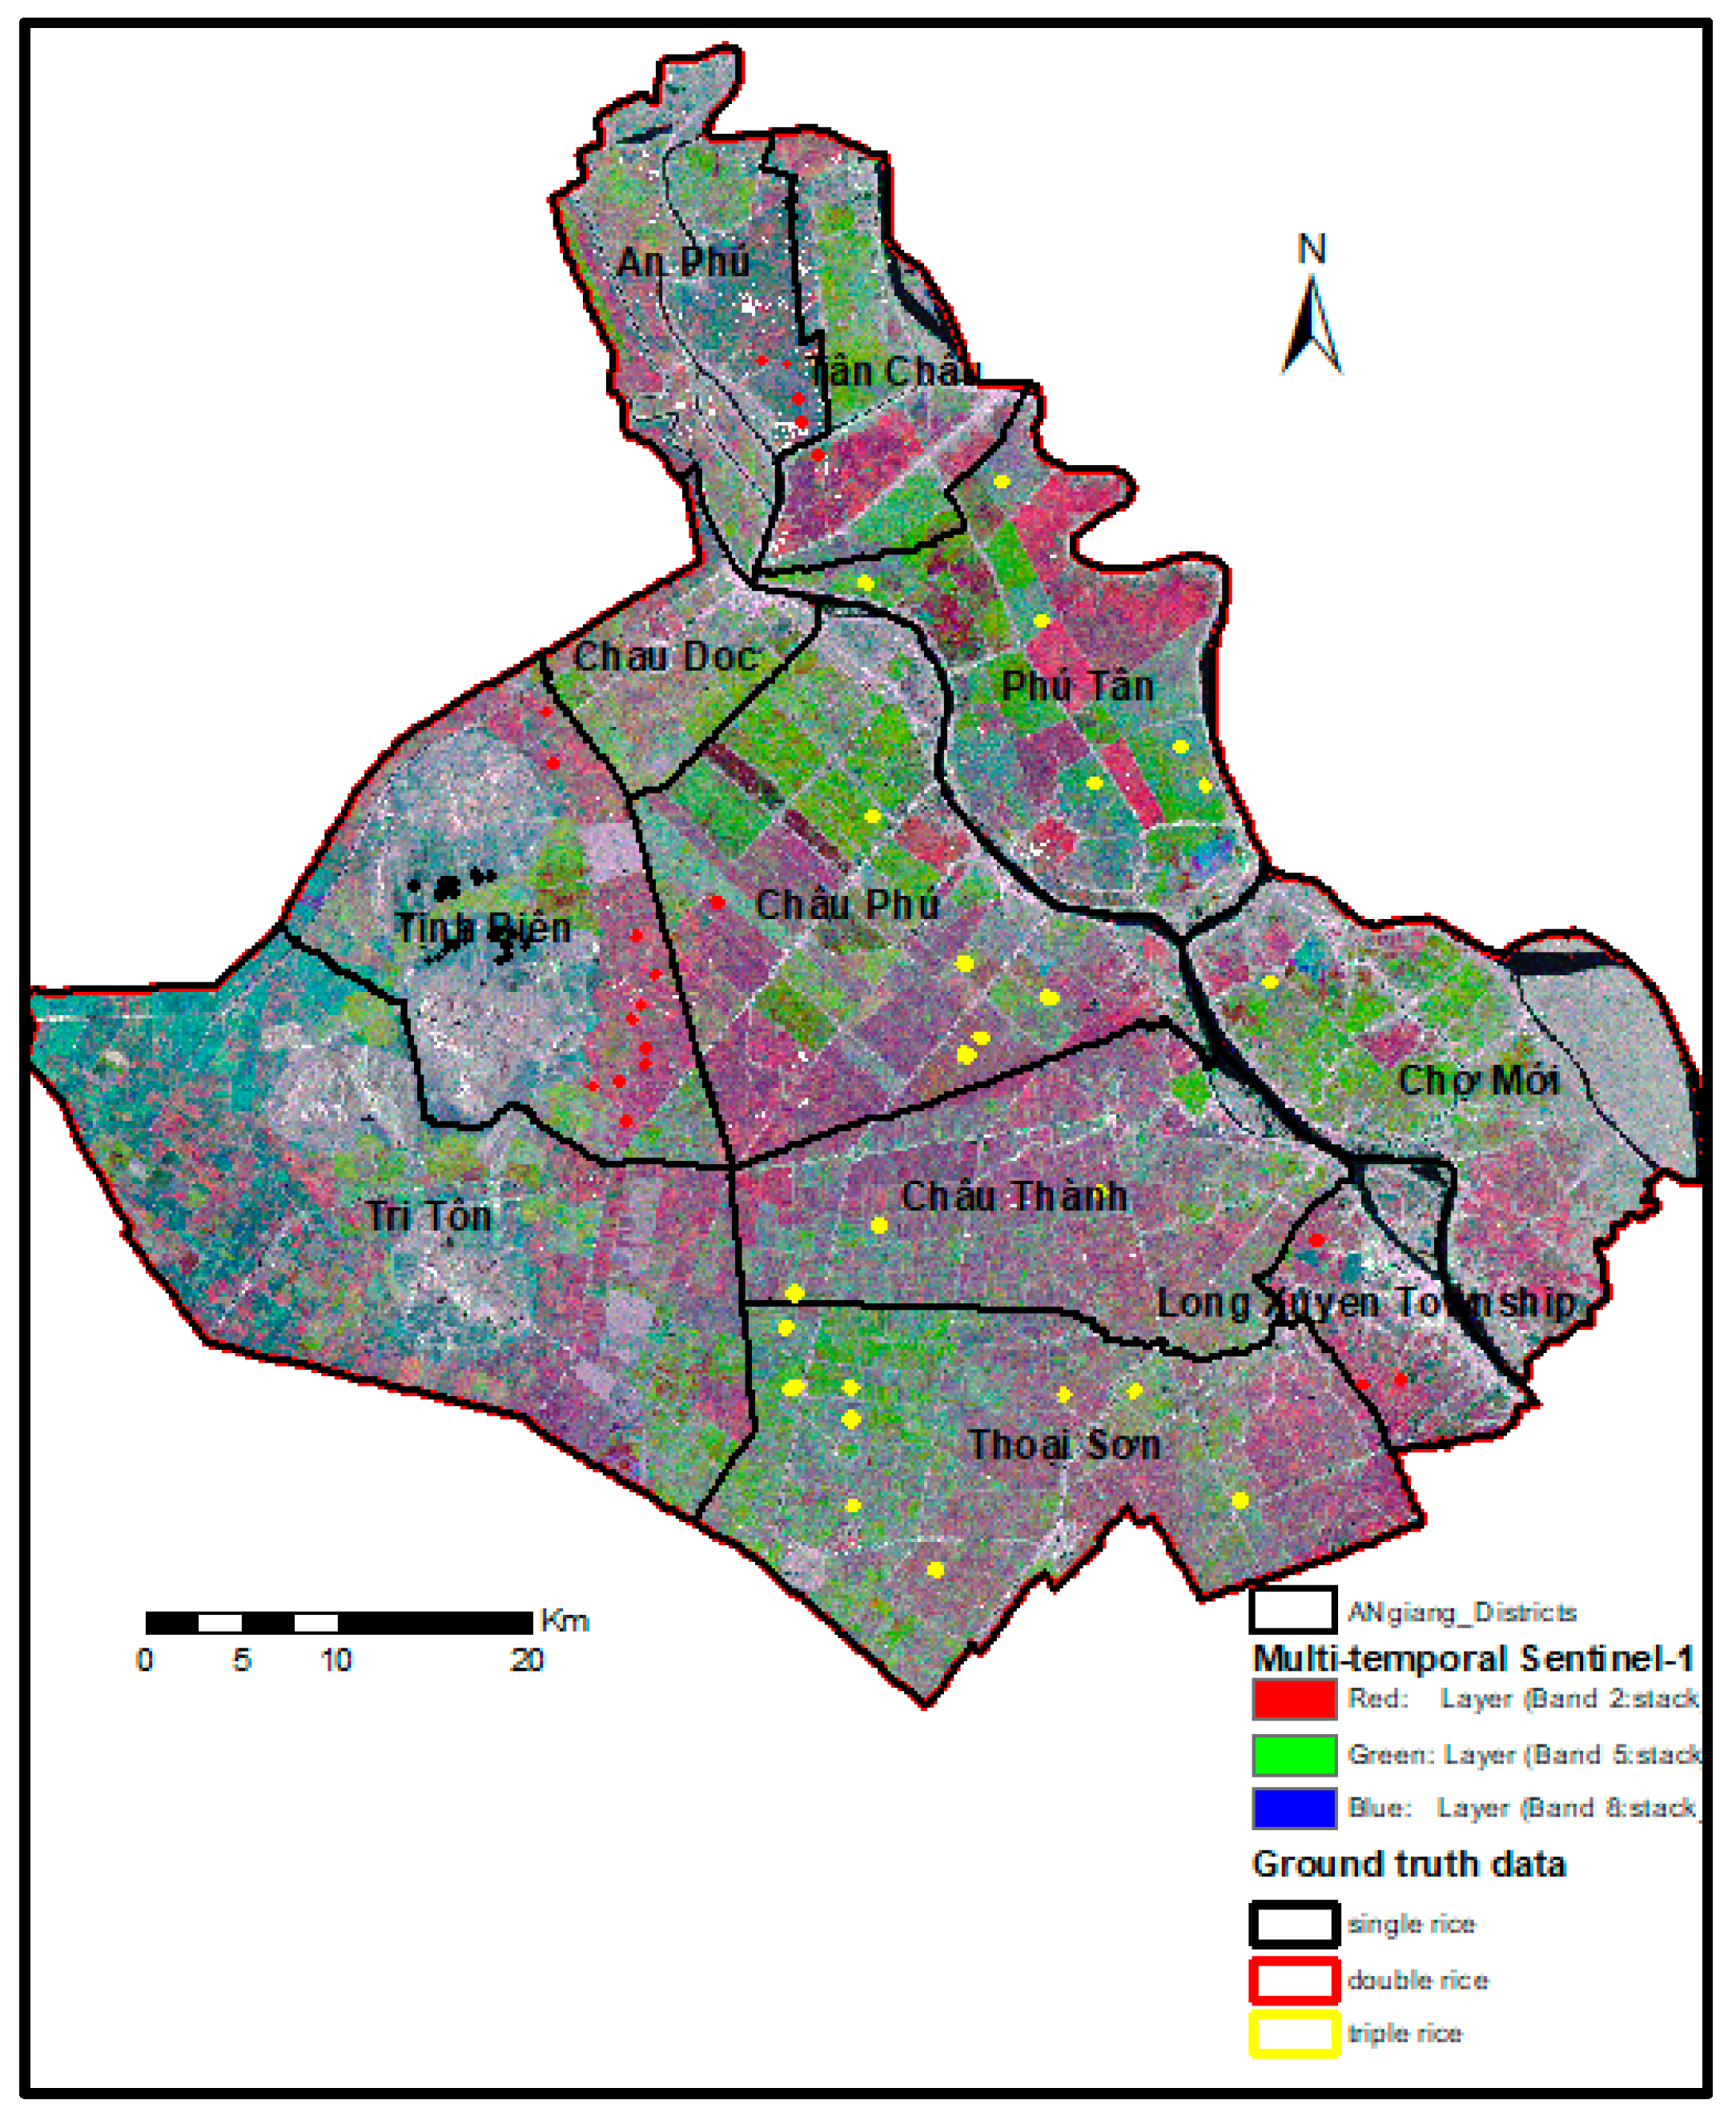
2.1. Study Area

The study site is located in the An Giang province, which belongs to upstream of the Lower Mekong river basin in Vietnam (Figure 1). Flooding is a common phenomenon in this area and has been controlled by hydraulic infrastructures. Farmers also construct minor canals and dikes to manage water for their small rice fields [57]. Rice production by An Giang accounts for ~80% of the total rice production in the VMD. The rice production depends heavily on the freshwater availability and sediment supplied from the Bassac and Mekong Rivers [15]. An Giang has an area of 3406 sq.km and borders with Cambodia in the Northwest. The province has a tropical climate, dry and monsoon seasons annually, has an average temperature of 27.6°C, maximum temperature of 32.4°C, and minimum temperature at 24.6°C. For the last 40 years, the annual mean rainfall is ~1400 mm of which the highest rainfall occurs in October (270 mm). Approximately 90% of the rainfall occurs during the monsoon season, between May and October. An Giang receives slightly lower average annual rainfall compared to the VMD, at 2000 mm per year, because the province is located in the inland delta with a minimal effect of the southwest monsoon.
The flooding season often starts a month after the start of the rainy season and ends at the same time as the rainy season (Figure 2). Daily average discharge shows a decrease in the discharge pattern from 2000 to 2014 partly due to the effect of the hydropower plants in the upstream of the Mekong river basin. The partial impact of the hydropower plants on changing the natural flow regimes of the Mekong River in the VMD has been noticed before [58,59]. The discharge peaks also move slightly from September to October and have been decreasing. Rice is grown in three distinct cropping seasons, such as winter–spring from December to March and summer–autumn from the mid-April to mid-August. In the autumn–winter, either irrigated or nonirrigated fields are usually sown from mid-July to the end of August, as can be seen in Figure 2 [41]. In An Giang, rice crop is cultivated in single, double, and triple-rice-cropping systems. The double-rice crop is often found within the semi-dike system with an elevation lower than 3 m above sea level. In such dike systems, flooding can take place in the monsoon season because the high water level overflows into the fields. It causes sediment deposition during the monsoon season [26]. Traditionally, farmers employed the double-rice crop and sought extra income through fishing or small-scale livestock husbandry practices, which are also common in the fallow rice field. The triple-rice crop is found within full-dike systems (over 3 m above sea level) with operational sluice gates, which can bring less sediment during flooding. Farmers adopted triple-rice cropping by upgrading their semi-dike systems to full-dike systems to fulfill the government targets.

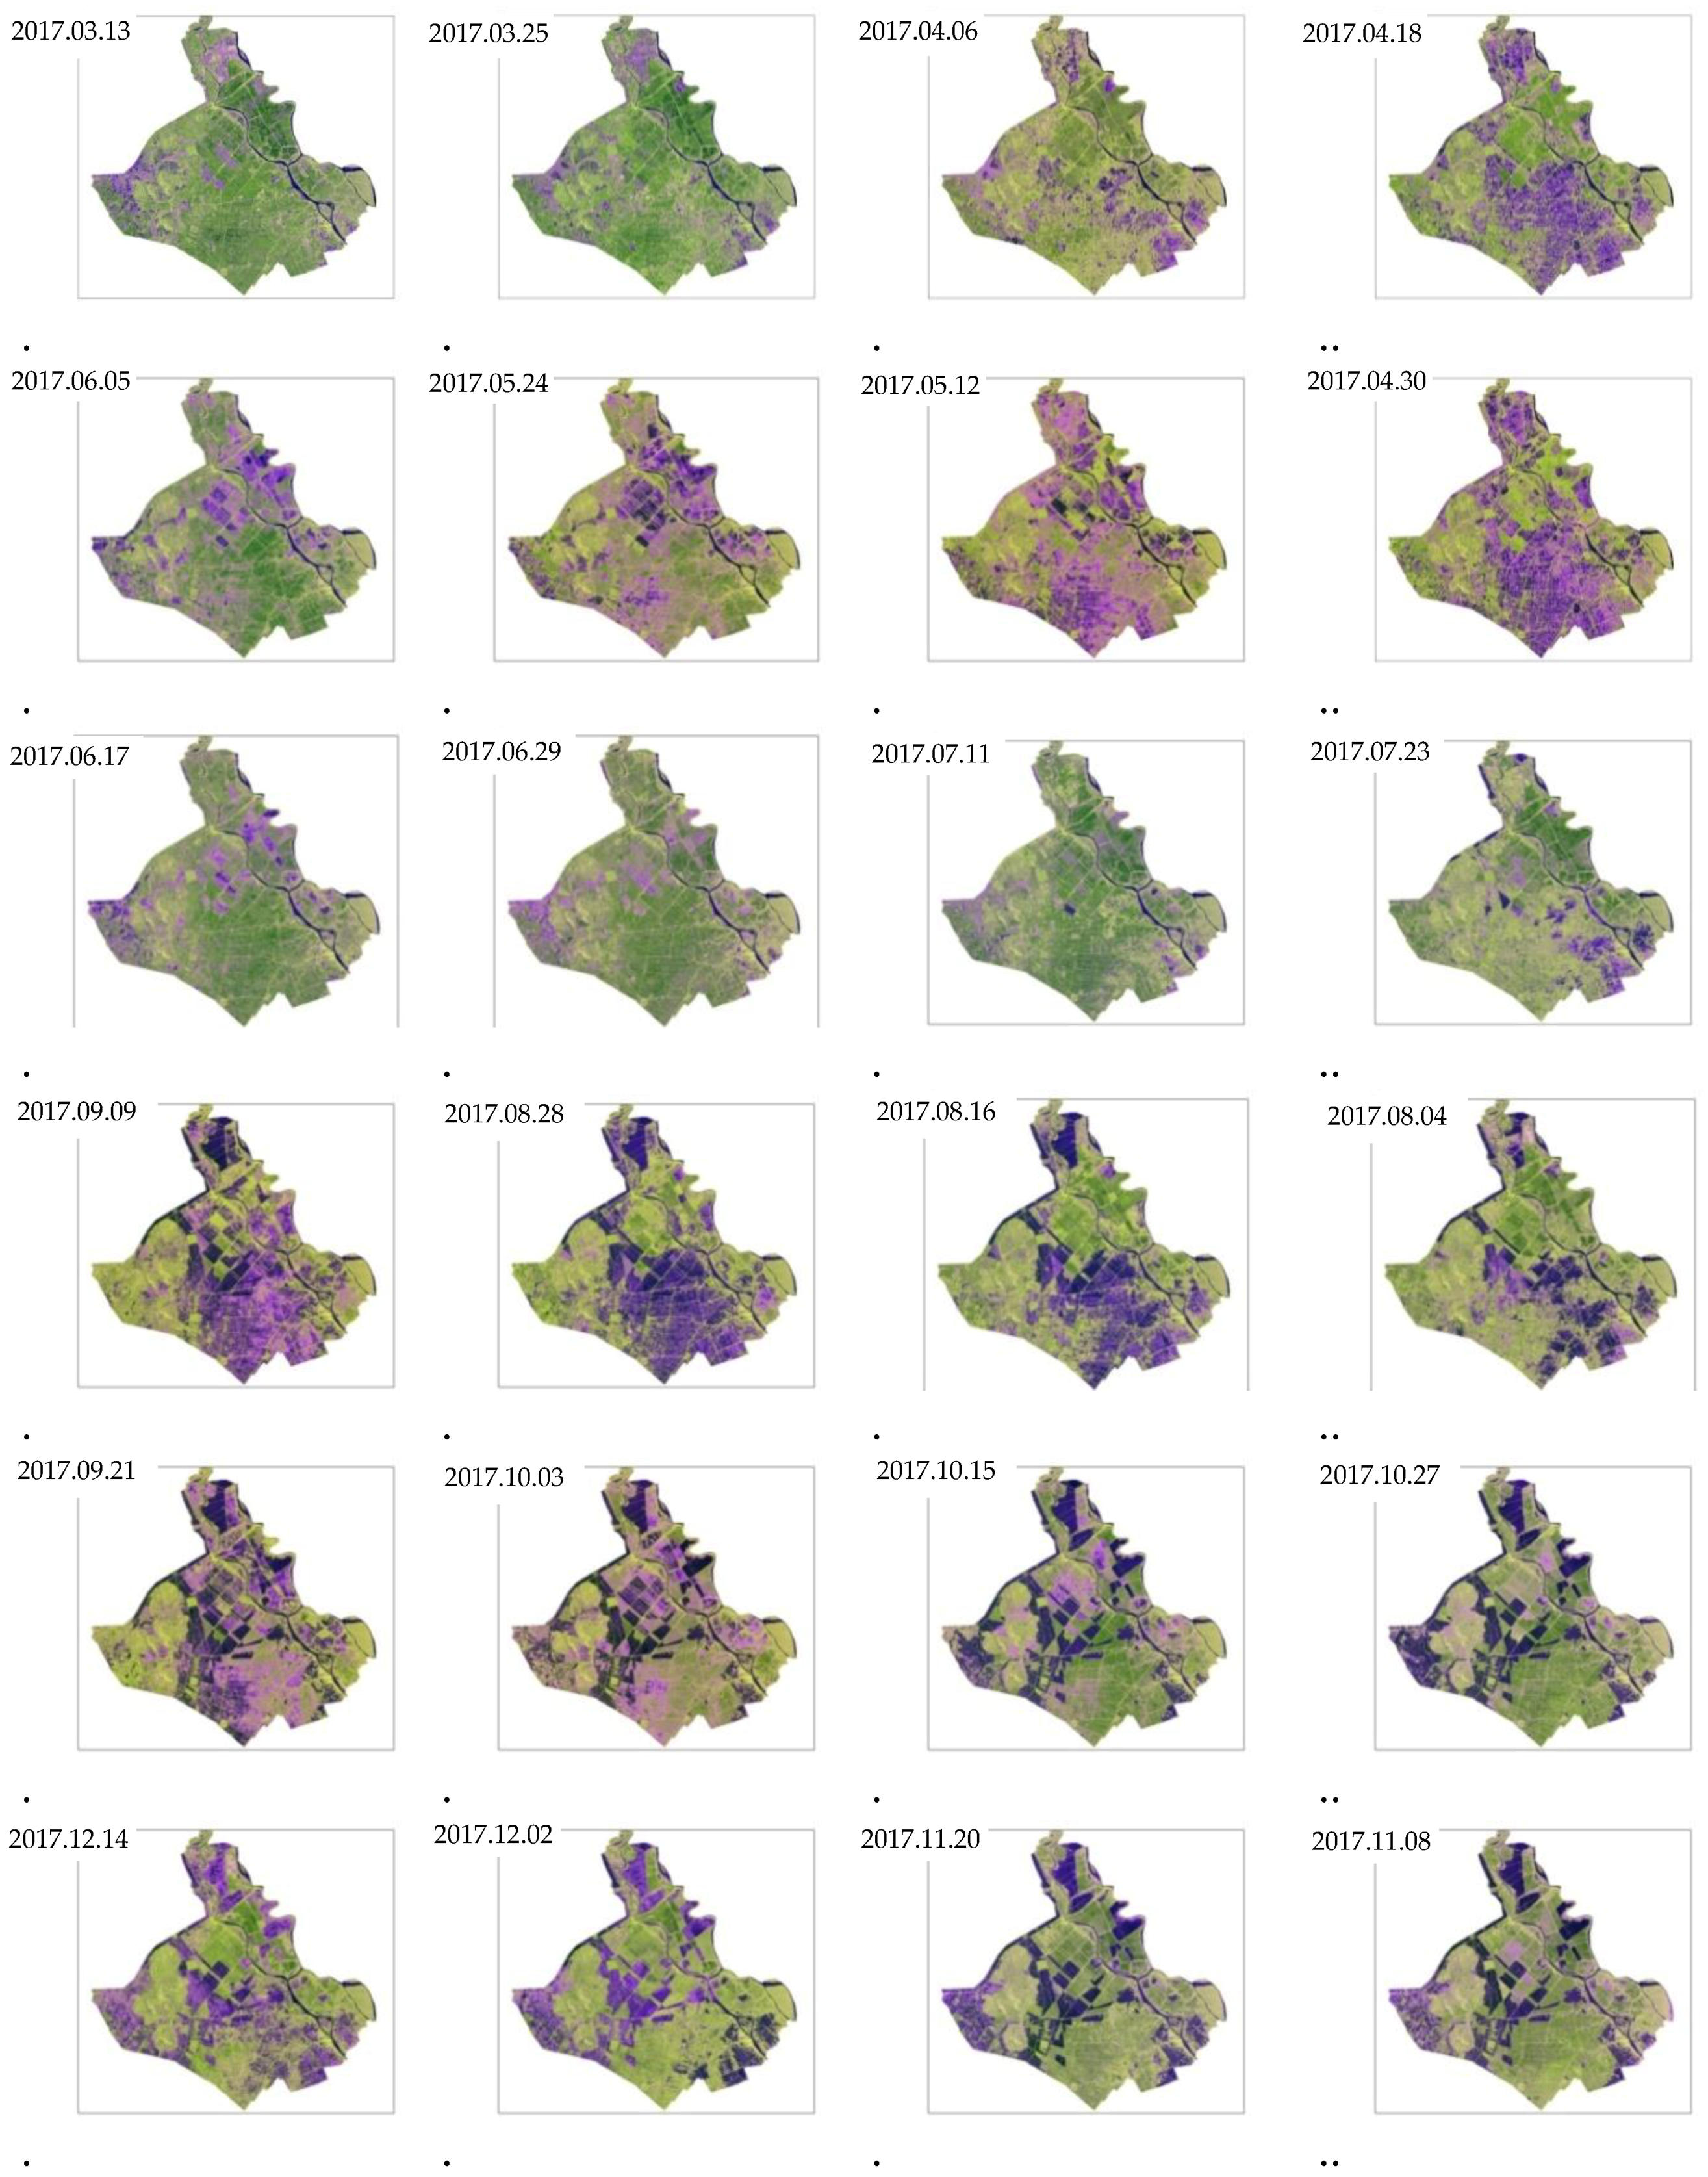
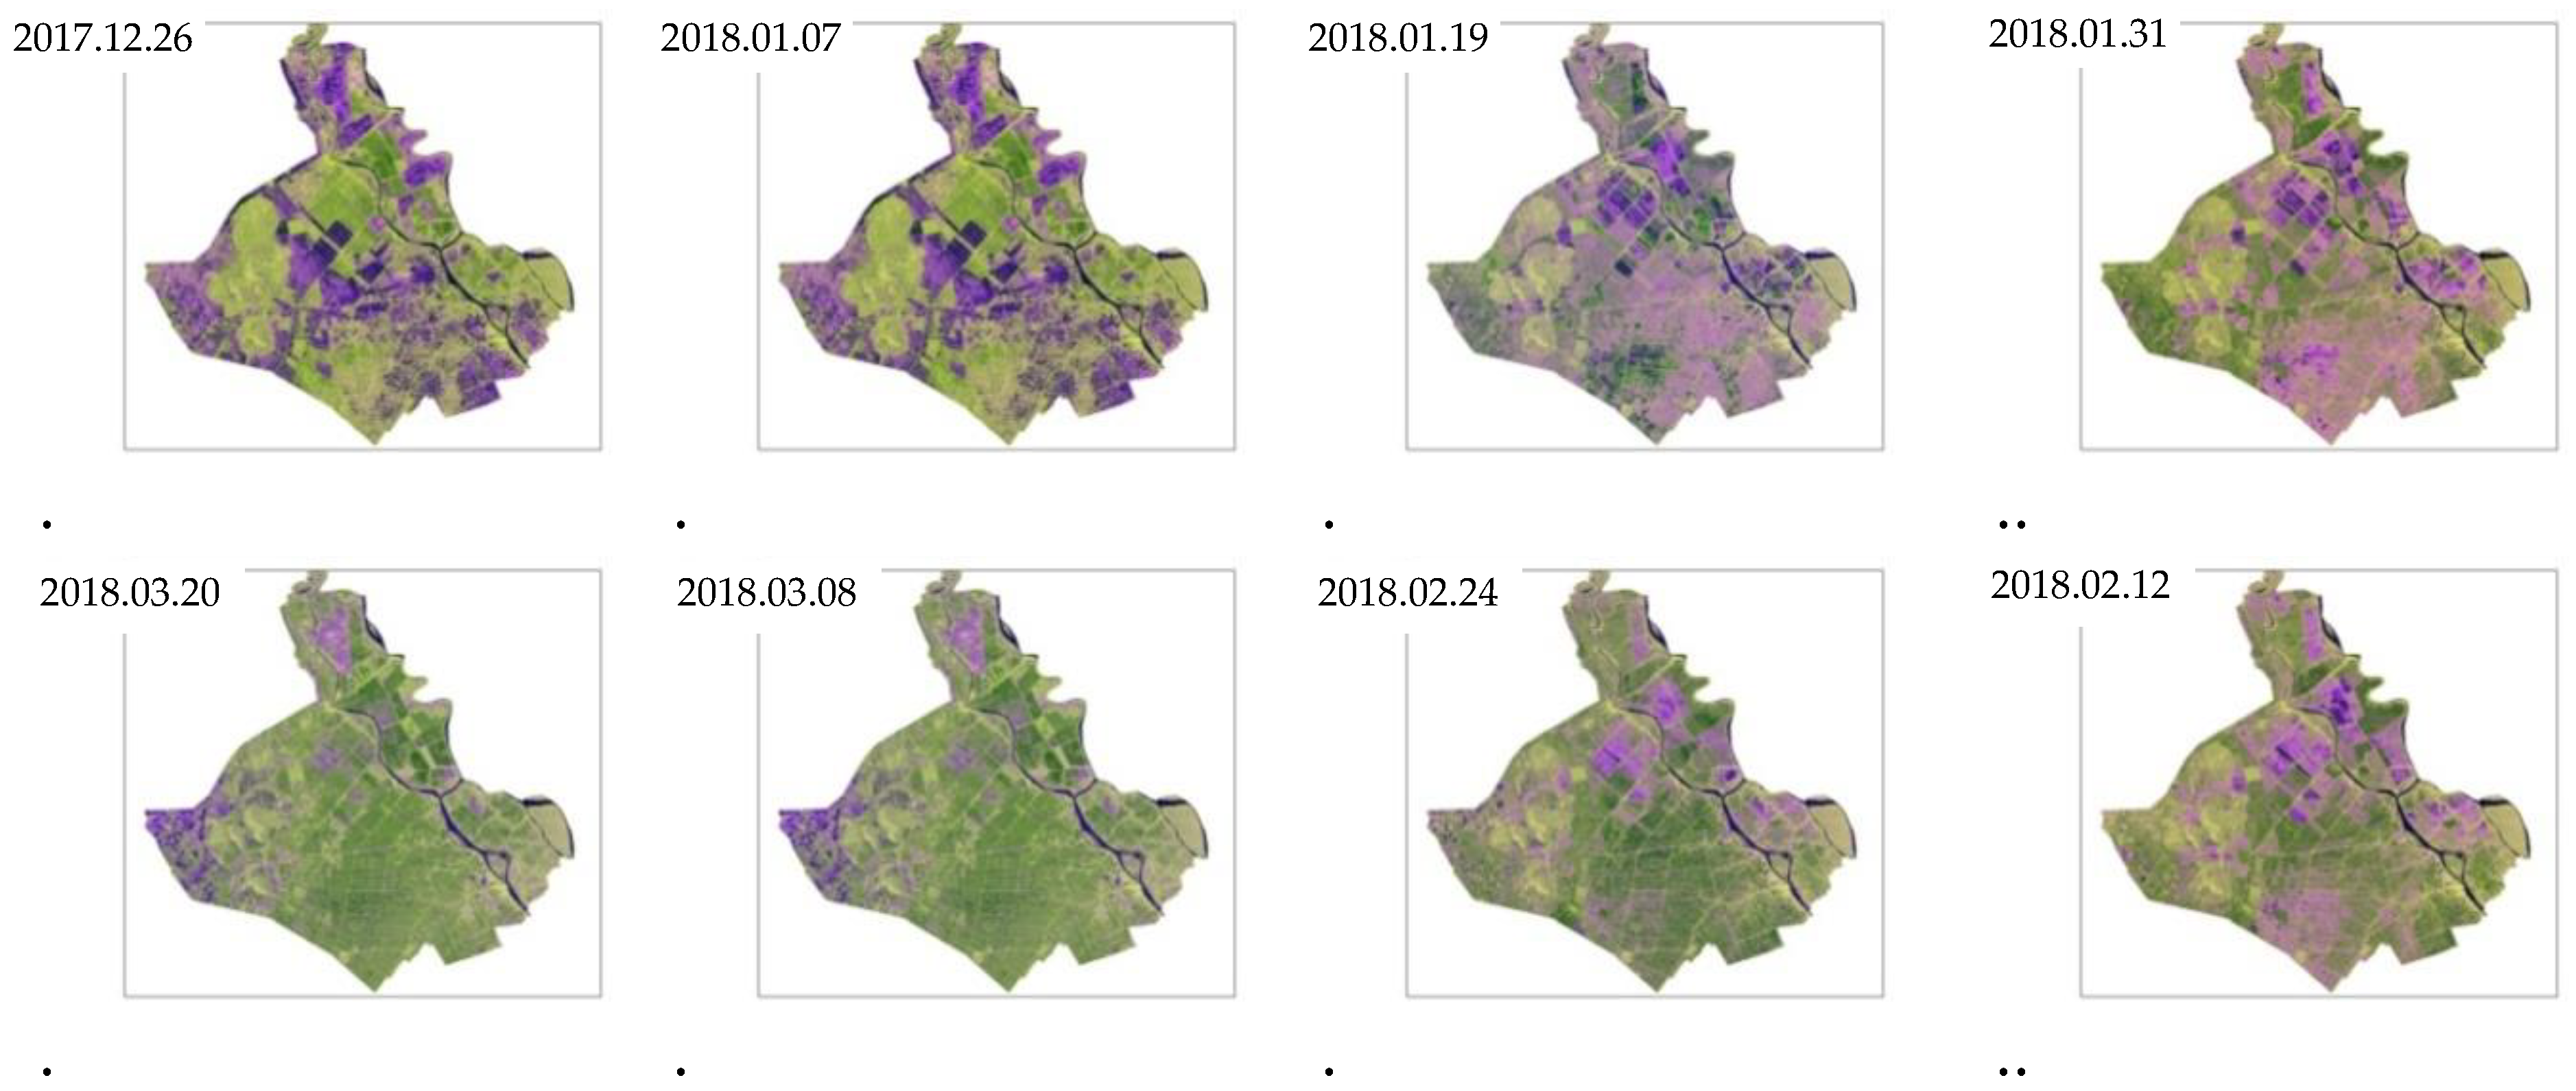
2.2. Sentinel-1A Data and Preprocessing
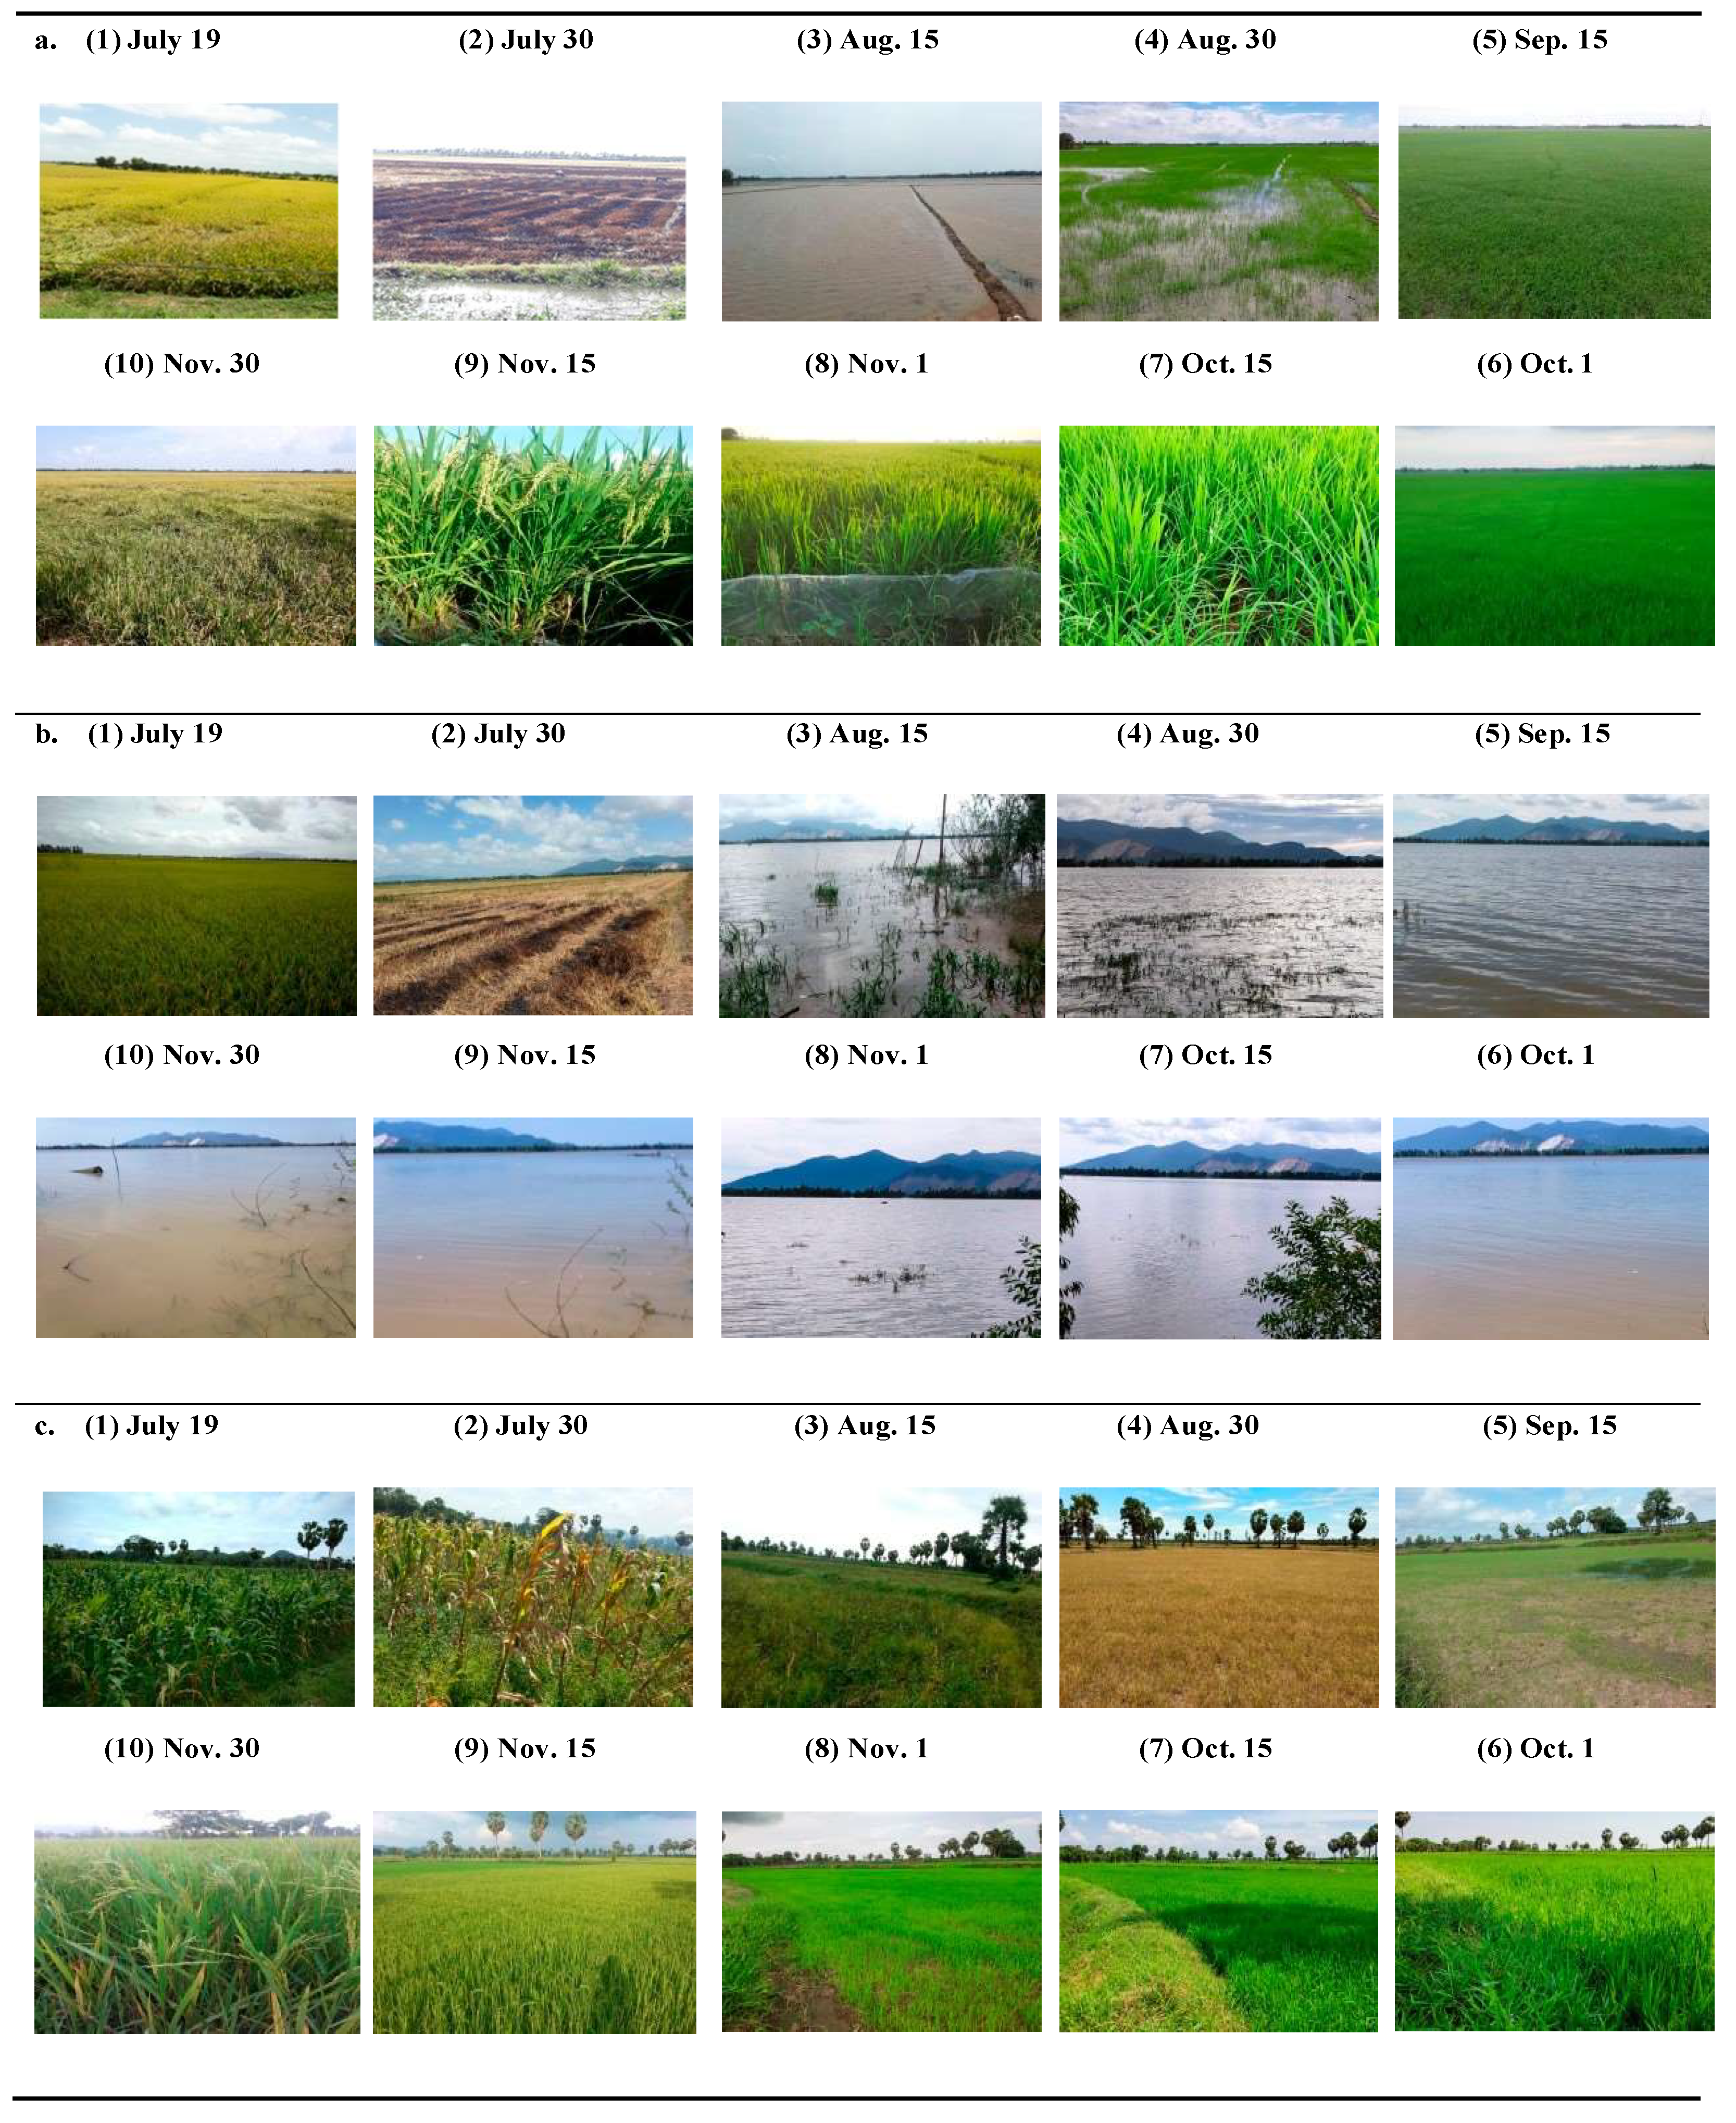
Sentinel-1A data with C-band (5.4 GHz) SAR were acquired from March 2017 to March 2018. Sentinel-1A data supports operation in dual-polarization (HH+HV, VV+VH) implemented through one transmit chain (switchable to H or V) and two parallel receive chains for H and V polarization [52]. The four acquisition modes are Interferometric Wide-swath (IW), Stripmap (SM), Extra Wide-swath (EW), and Wave Mode (WV). These products are available in single- (HH or VV) or dual-polarization (HH+HV or VV+VH) [53,60]. The main operational mode features are Interferometric Wide swath mode (IW) with 10 m x 10 m pixel size and a swath width of 250 km. We used the IW mode dual-polarization data acquired in Ground Range Detected (GRD) Level-1. The repeat cycle of Sentinel-1A data is 12 days with dual-polarization (VV+VH) [61]. To cover the whole An Giang, a satellite track in ascending pass was used. Thirty-two images are available from March 2017 to March 2018 (Figure A1). Table 1 shows the specification of Sentinel-1A data with the dates of acquisition.
Figure 3 shows the general flowchart of the methodology. Sentinel-1A data were processed using the free and open source Sentinel-1 toolbox in Sentinel Application Platform (SNAP) software. The GRD images were processed including restituted orbit files. Radiometric calibration was performed to output σ° bands. Orthorectification and terrain correction were done using SRTM 30-m DEM data. The biggest speckle noise was often found in SAR data [62,63]. We used the Enhanced Lee filter to reduce SAR speckle noise since Enhanced Lee has more advantages compared to other filters. The Enhanced Lee filter might keep edges and present the preserved details while filtering images in both homogeneous and heterogeneous regions [64,65]. The backscattering coefficient in decibel (dB) was acquired for the analysis and classification according to equation   10   x   l o g 10 ( σ ° ) . Plant phenological characteristics were identified following Jonsson and Eklundh [66]. The mapping algorithm introduced by Nguyen et al. was used [41,67]. Later, backscattering information was used to identify single-, double-, and triple-rice crops and other land covers were classed.

2.3. Field Survey

We conducted fieldwork throughout the study area between March 2017 and March 2018. The fieldwork was carried out on the dates close to Sentinel-1A acquisition in An Giang. The data included surveys on the crop practices calendar and field condition. We collected Geotagged photos about rice growing stages at different locations. The locations of single-, double-, and triple-rice crops were marked in the Global Positioning System (GPS) (using Garmin 60x device). These locations were used for training and validation of the Sentinel-1A data processing model. Besides, we also measured rice height at three distinct rice cropping patterns during rice growth stages (Figure 4). The rice height was only conducted in summer–autumn for double and triple-rice crops and in autumn–winter for the single-rice crop. The average rice height is 104 cm, 102 cm, and 87 cm in the triple-, double-, and single-rice crops, respectively. Figure 5 shows the multitemporal composite of SAR data overlaid with the field data. We divided the data into training and test datasets. For the time series observation, we selected 34 ground truth points randomly distributed in single, double, and triple-rice cropping areas for classification. There was no significant difference in the management practices of water and fertilizer usage in triple- and double-rice crops. The single-rice crop was grown naturally without fertilizer and pesticide usage. Land use/land cover (LULC) mapping was validated by 140 ground truth points. Photos of rice growth stages showed various growing stages of different crops and were found in Figure 6.
Rice development can be defined in three main growth stages: vegetative stage, reproductive stage, and maturity stage [68]. The vegetative stage usually takes from sowing to 35–55 days depending on rice varieties, while the reproductive and maturity stages take about 30 days each for all rice varieties [68]. Rice growth can be affected by various natural factors (e.g., rainfall, water allocation, and air temperature) and artificial factors (e.g., fertilizers and pesticides) [30,69,70]
The majority of rice varieties in the study area are short duration varieties (average 85–95 days), and a few rice varieties are grown with a duration of 95 to 105 days. Figure 6 shows the various growth stages of rice in different cropping pattern from the summer–autumn season to autumn–winter season, in the study sites and vacant time in the double-rice crop and vegetable crop in the single-rice crop.

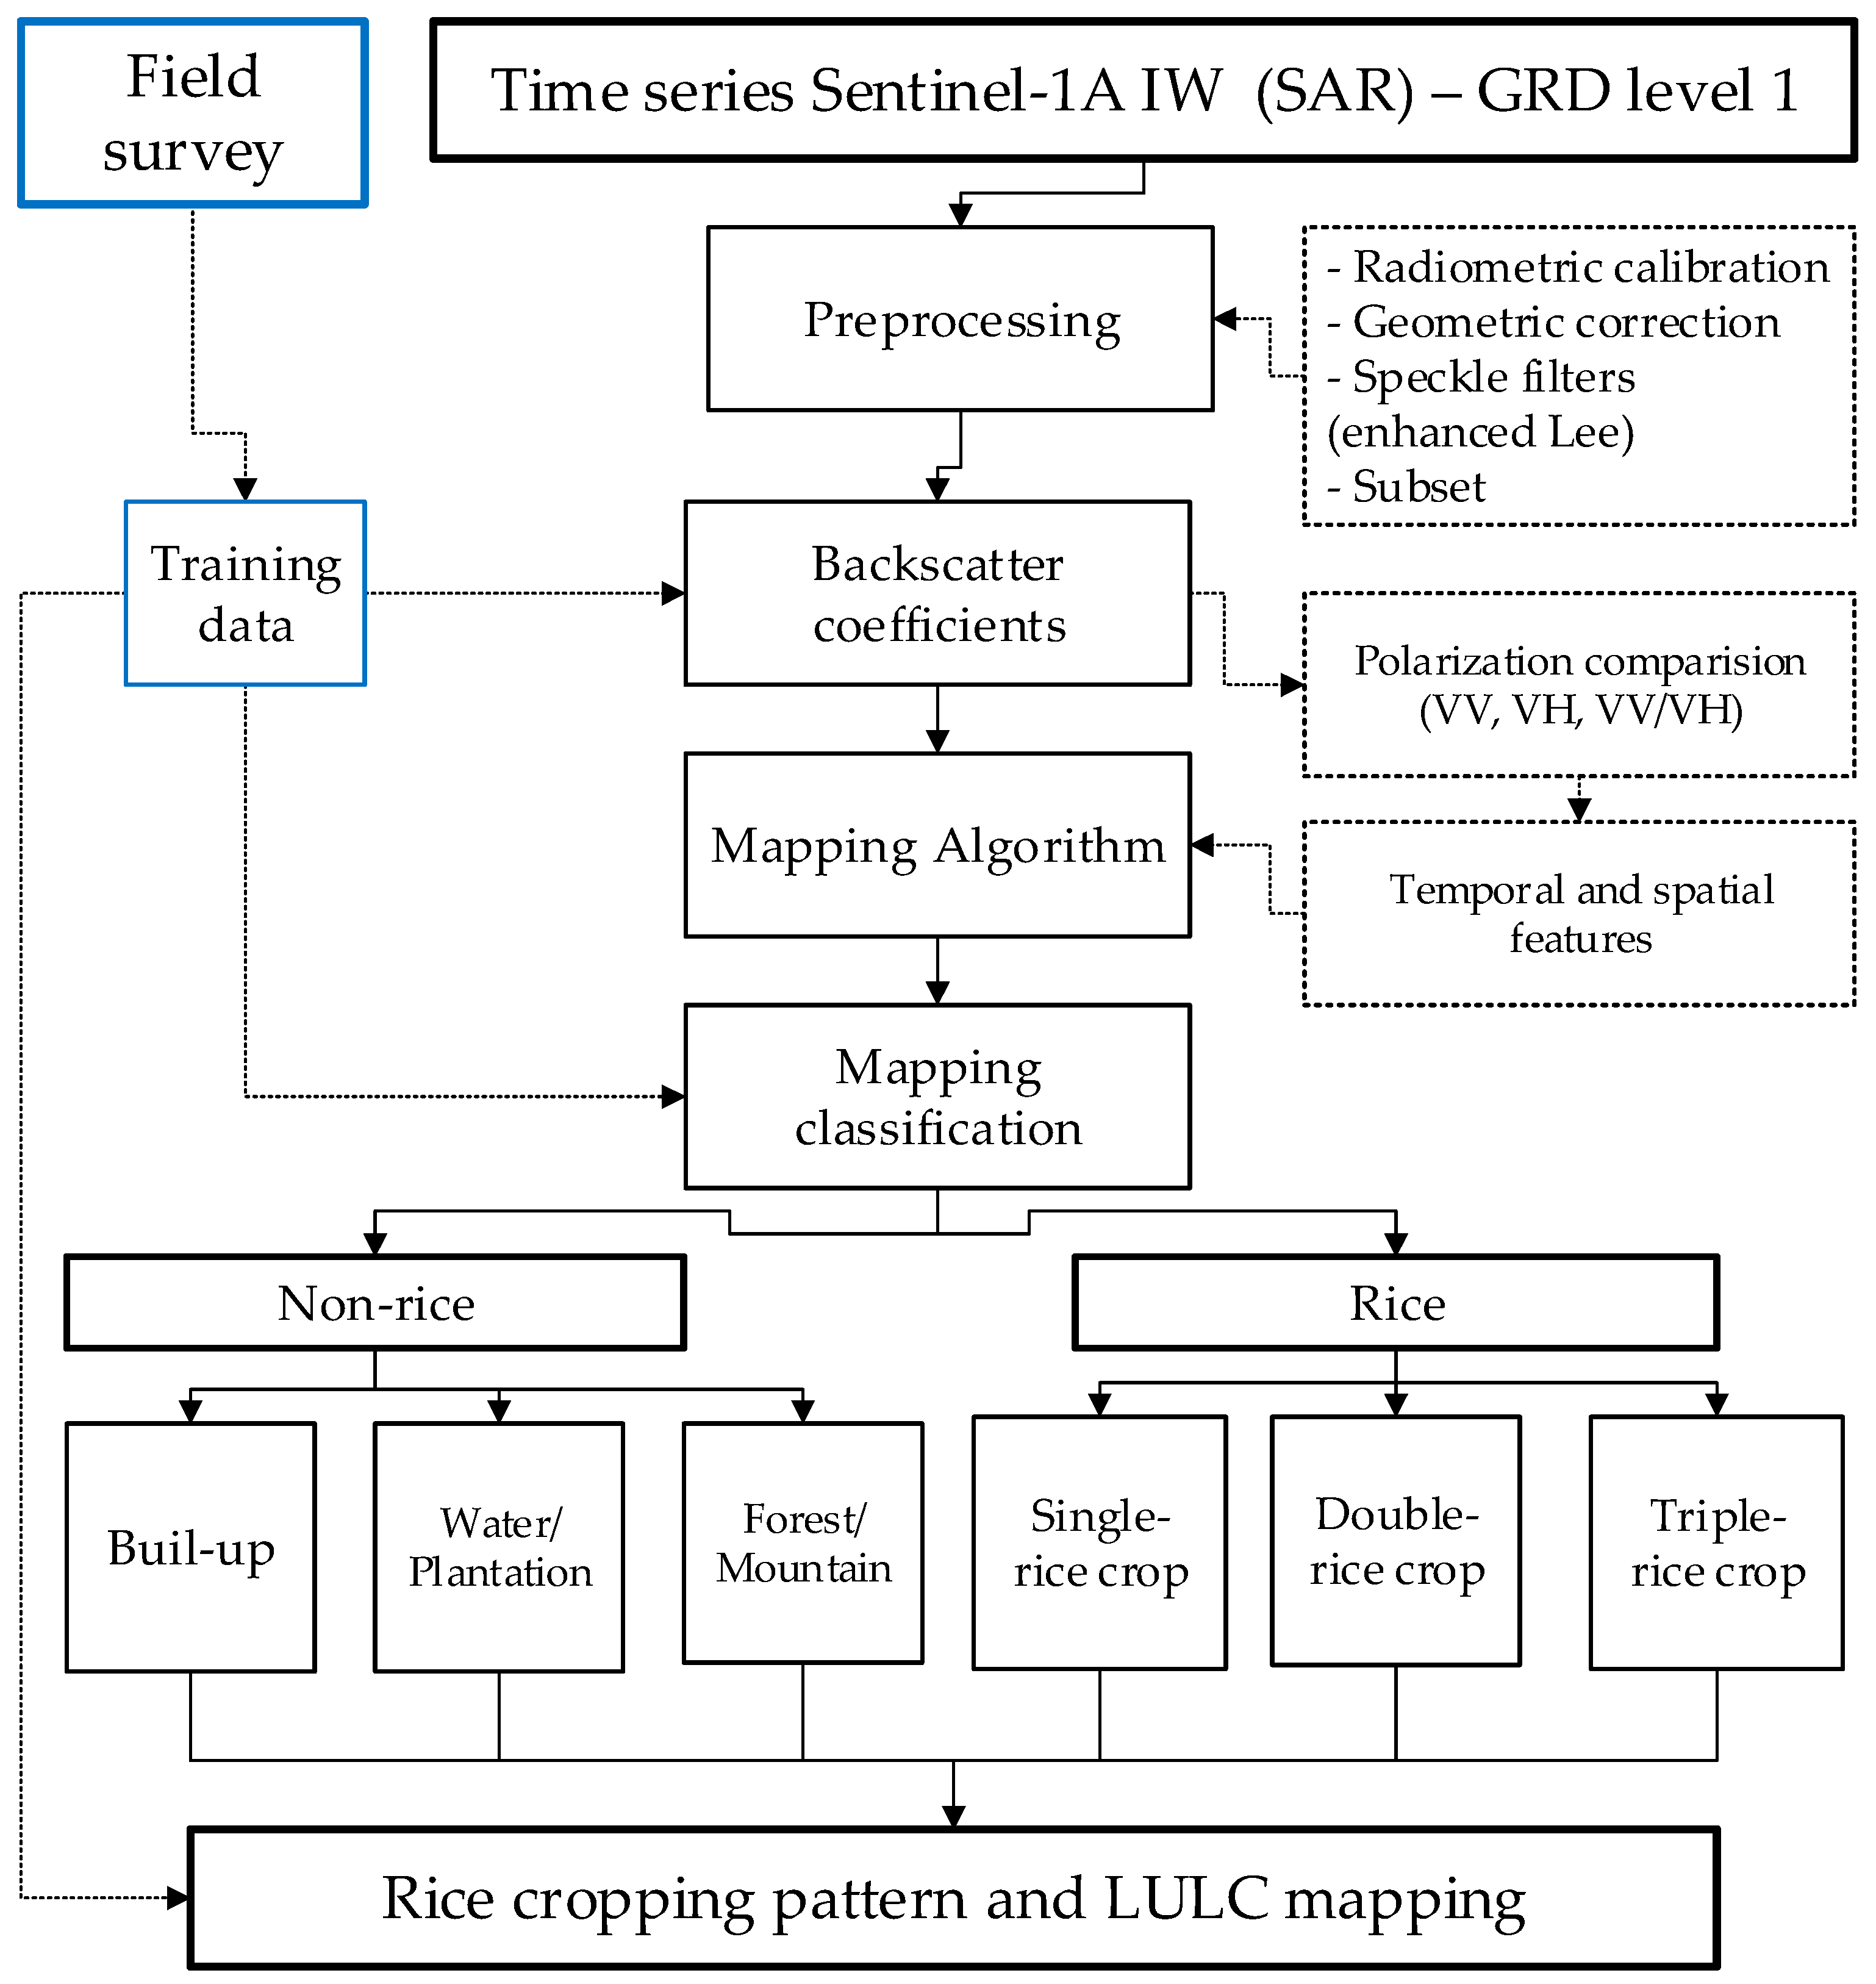
2.4. Data Analysis and Accuracy Assessment

Training polygons were digitized over the triple-rice, double-rice, and single-rice cropping areas using field-based GPS location and fine-resolution Google Earth imagery. Backscattering information of multitemporal Sentinel-1A data at σ°VH and σ°VV polarization was analyzed to investigate backscattering characteristics of triple-, double-, and single-rice crops. Dual-polarization Sentinel-1A data were also analyzed to detect rice phenological changes in the rice cultivation from sowing to harvesting and finally to delineate rice cultivation area and different LULC. Besides, the local maxima and minima of VH backscattering and crop duration were utilized to consider the cropping intensity and cropping season.
The scattering mechanism depends on various properties of objects such as dielectric properties, surface roughness, soil moisture, plant growth, orientation, etc. [71]. The σ°VV and σ°VH polarization can detect variation in scattering behaviors of targets such as volume scattering, and double-bounce scattering in the agricultural area. Previous studies noted that the σ°VV polarization is more sensitive to water bodies while the σ°VH polarization is able to delineate various rice growth stages [5,41,45]. The observed σ°VV is generally higher than σ°VH polarization because of the higher double-bounce. Support Vector Machine (SVM) classification with the Kernel function [72,73,74] was used for LULC mapping. The RBF parameters were optimal based on the classification results of the polarimetric SAR data [73,74,75,76,77,78]. The optimal parameters were grid search and cross-validation, which were introduced by previous studies [79,80]. The supervised classification, which proves highly successful in solving regression and classification tasks [81,82]. The confusion matrix and Kappa coefficient were used to assess the accuracy of classification in this study. Although the Kappa coefficient was used in many study fields, Kappa has been noted to have weaknesses as an accuracy metric [83,84,85,86,87]. For example, the Kappa coefficient is dependent on the proportion of objects in each category and number of categories [88], and the Kappa fails in case measurements have been made in ordered categories [89]. Thus, in this study, we presented all object proportion features and number of categories via the confusion matrix that provides clear information for users. Moreover, since land use categories were unordered in this study so that the Kappa coefficient can be used [89]. We performed an accuracy assessment of the resulting rice maps by selecting the remaining sampling points.

3. Results

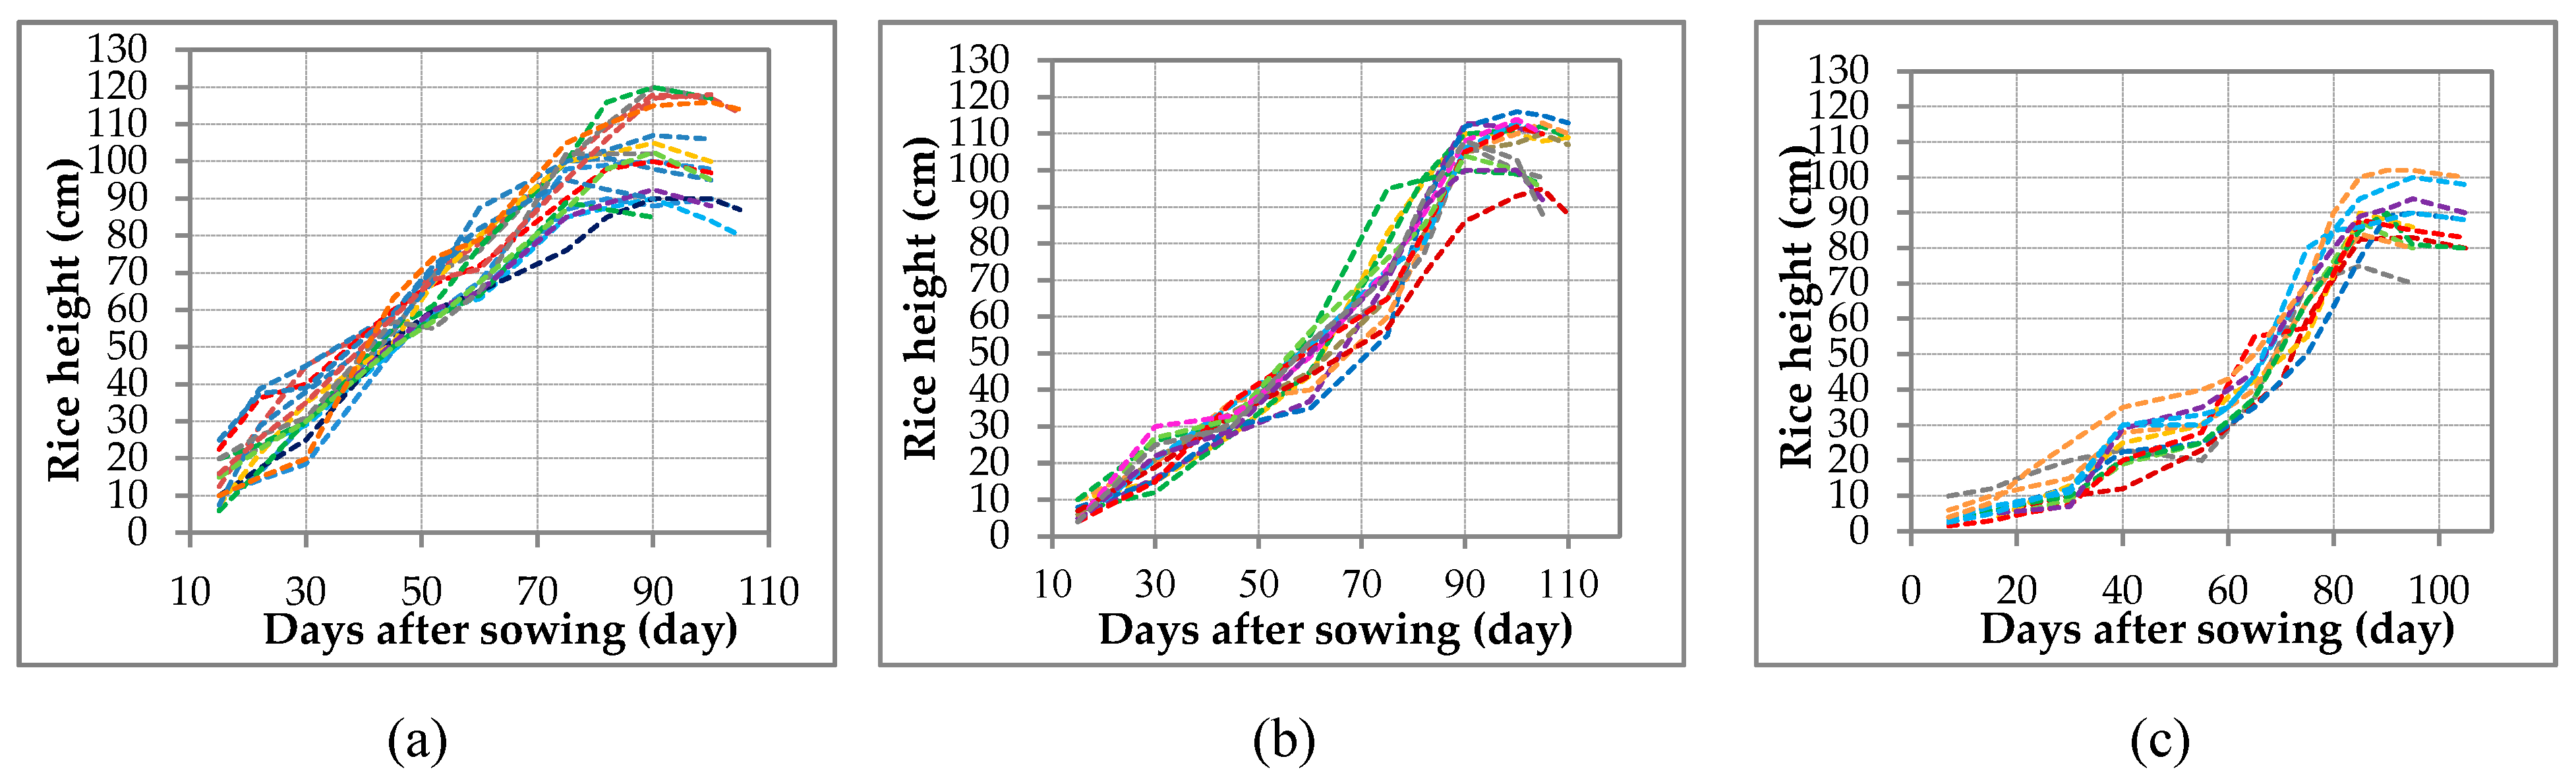
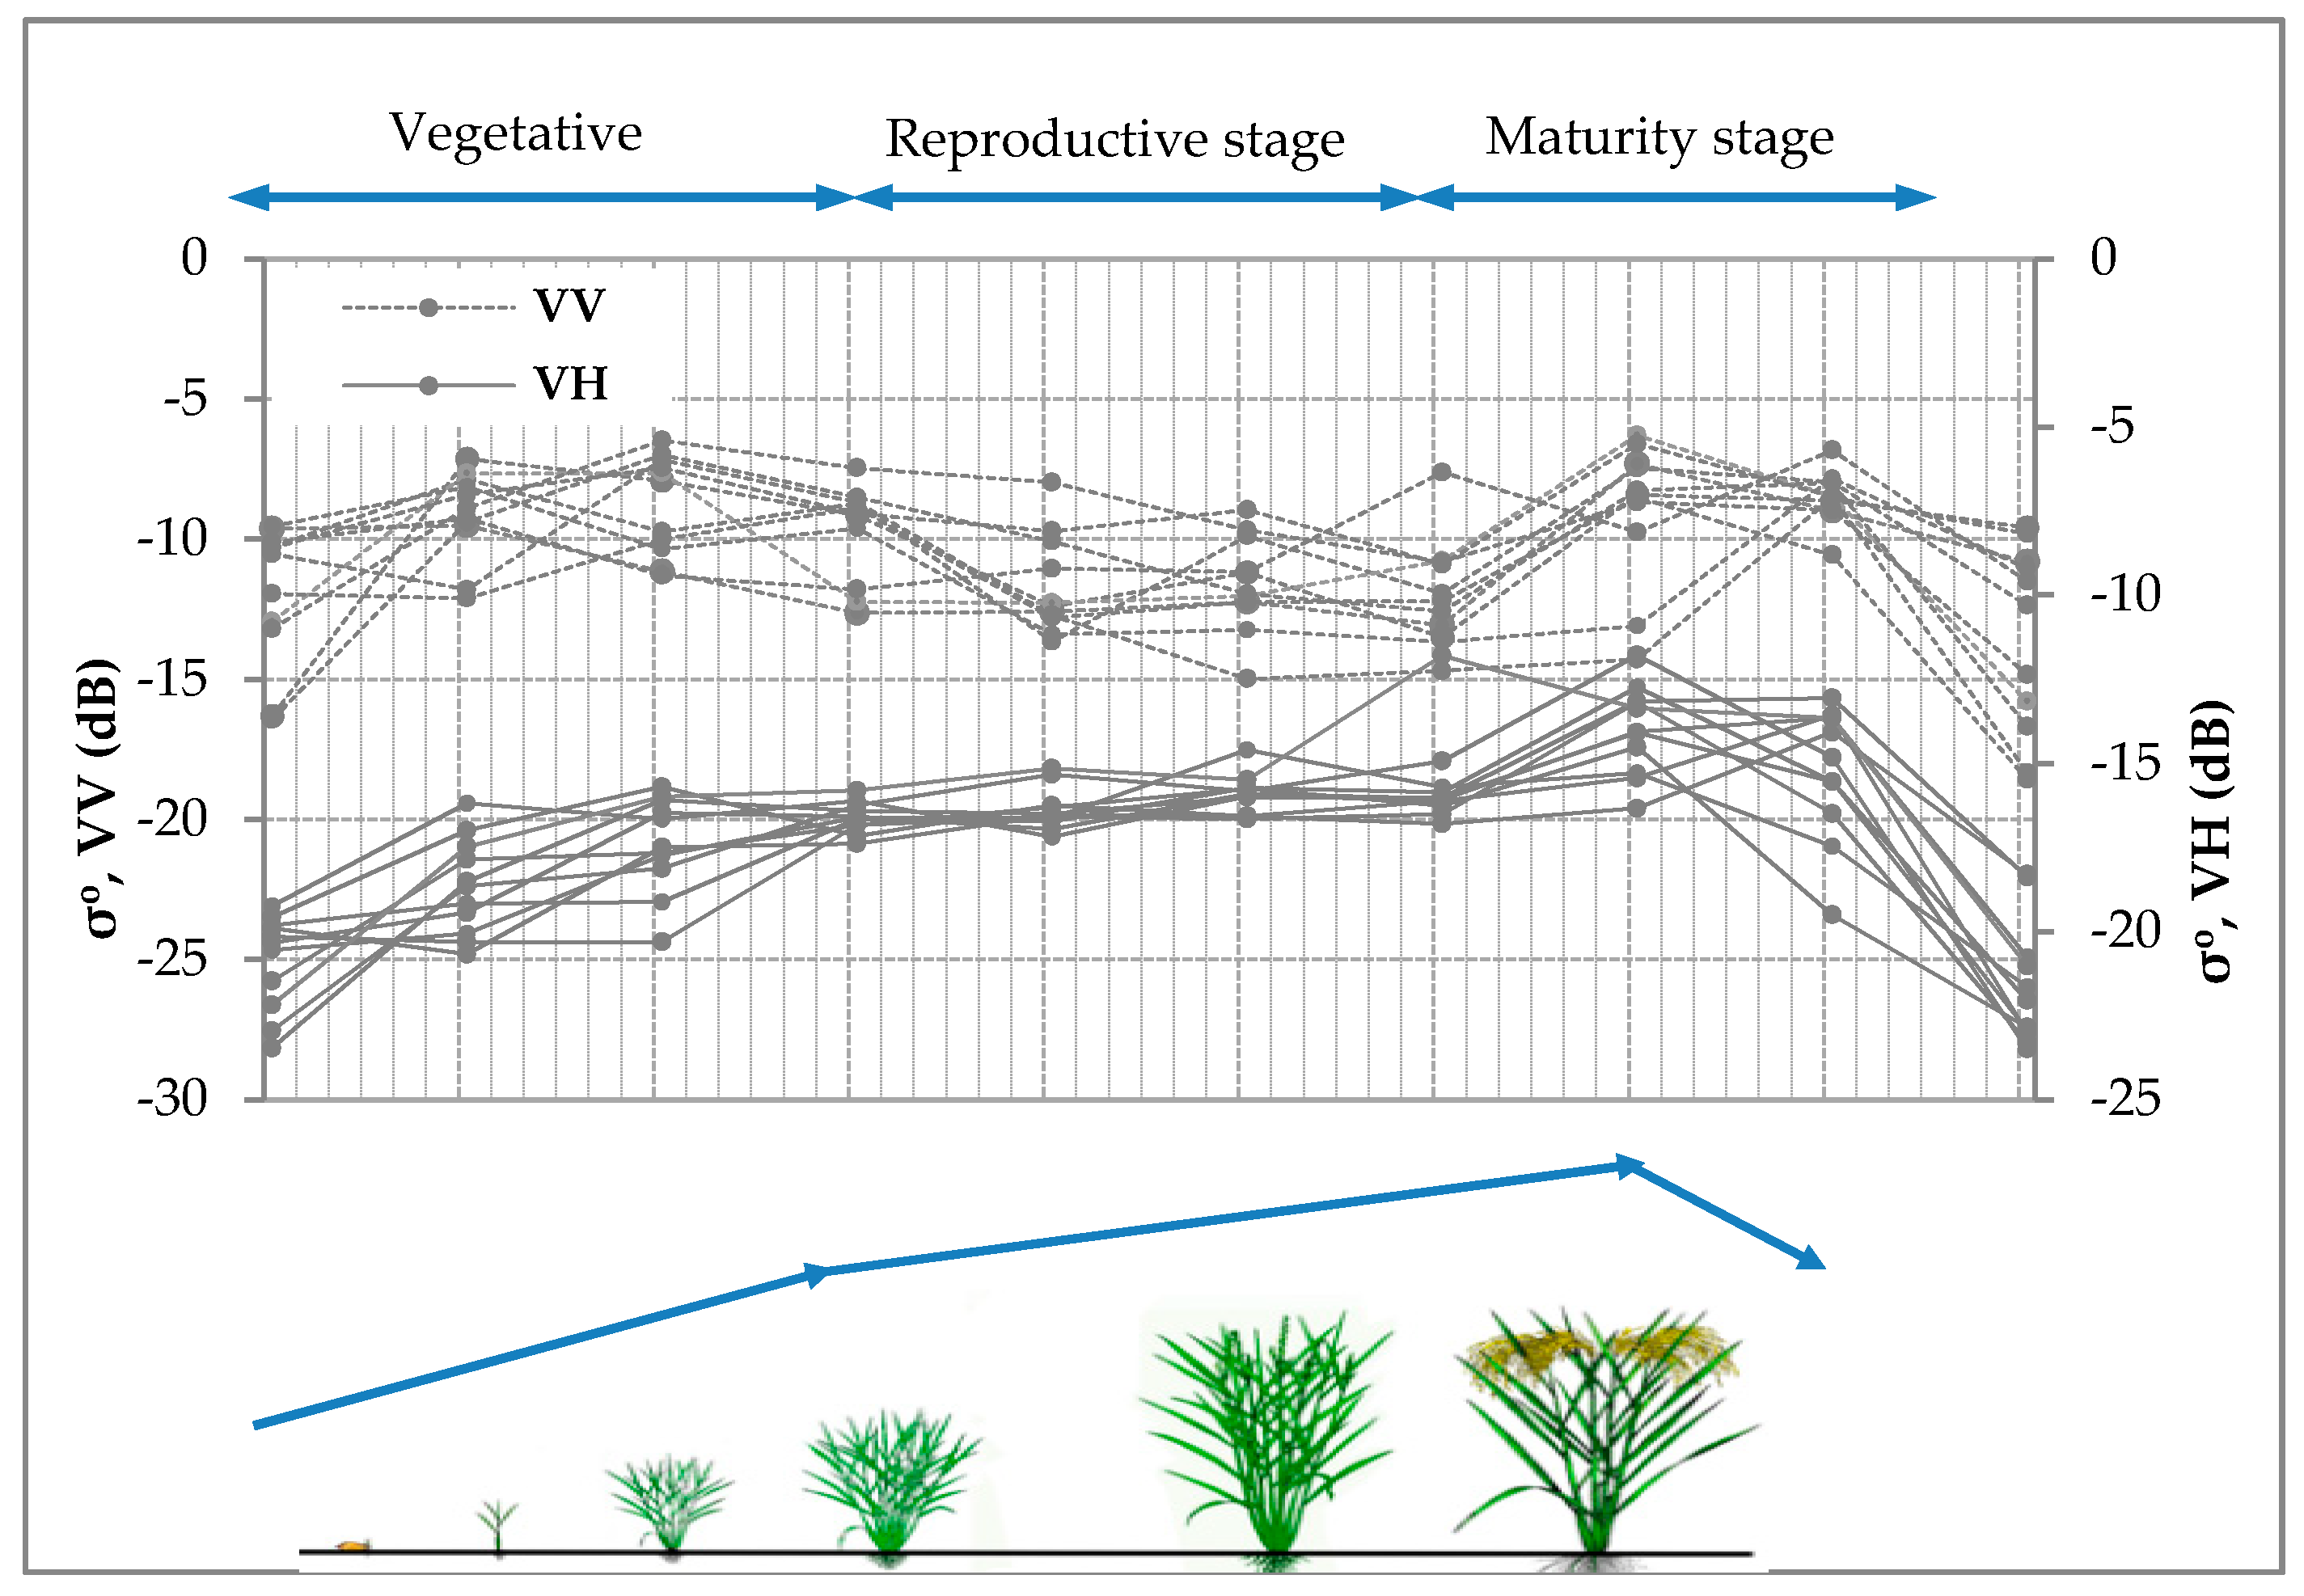
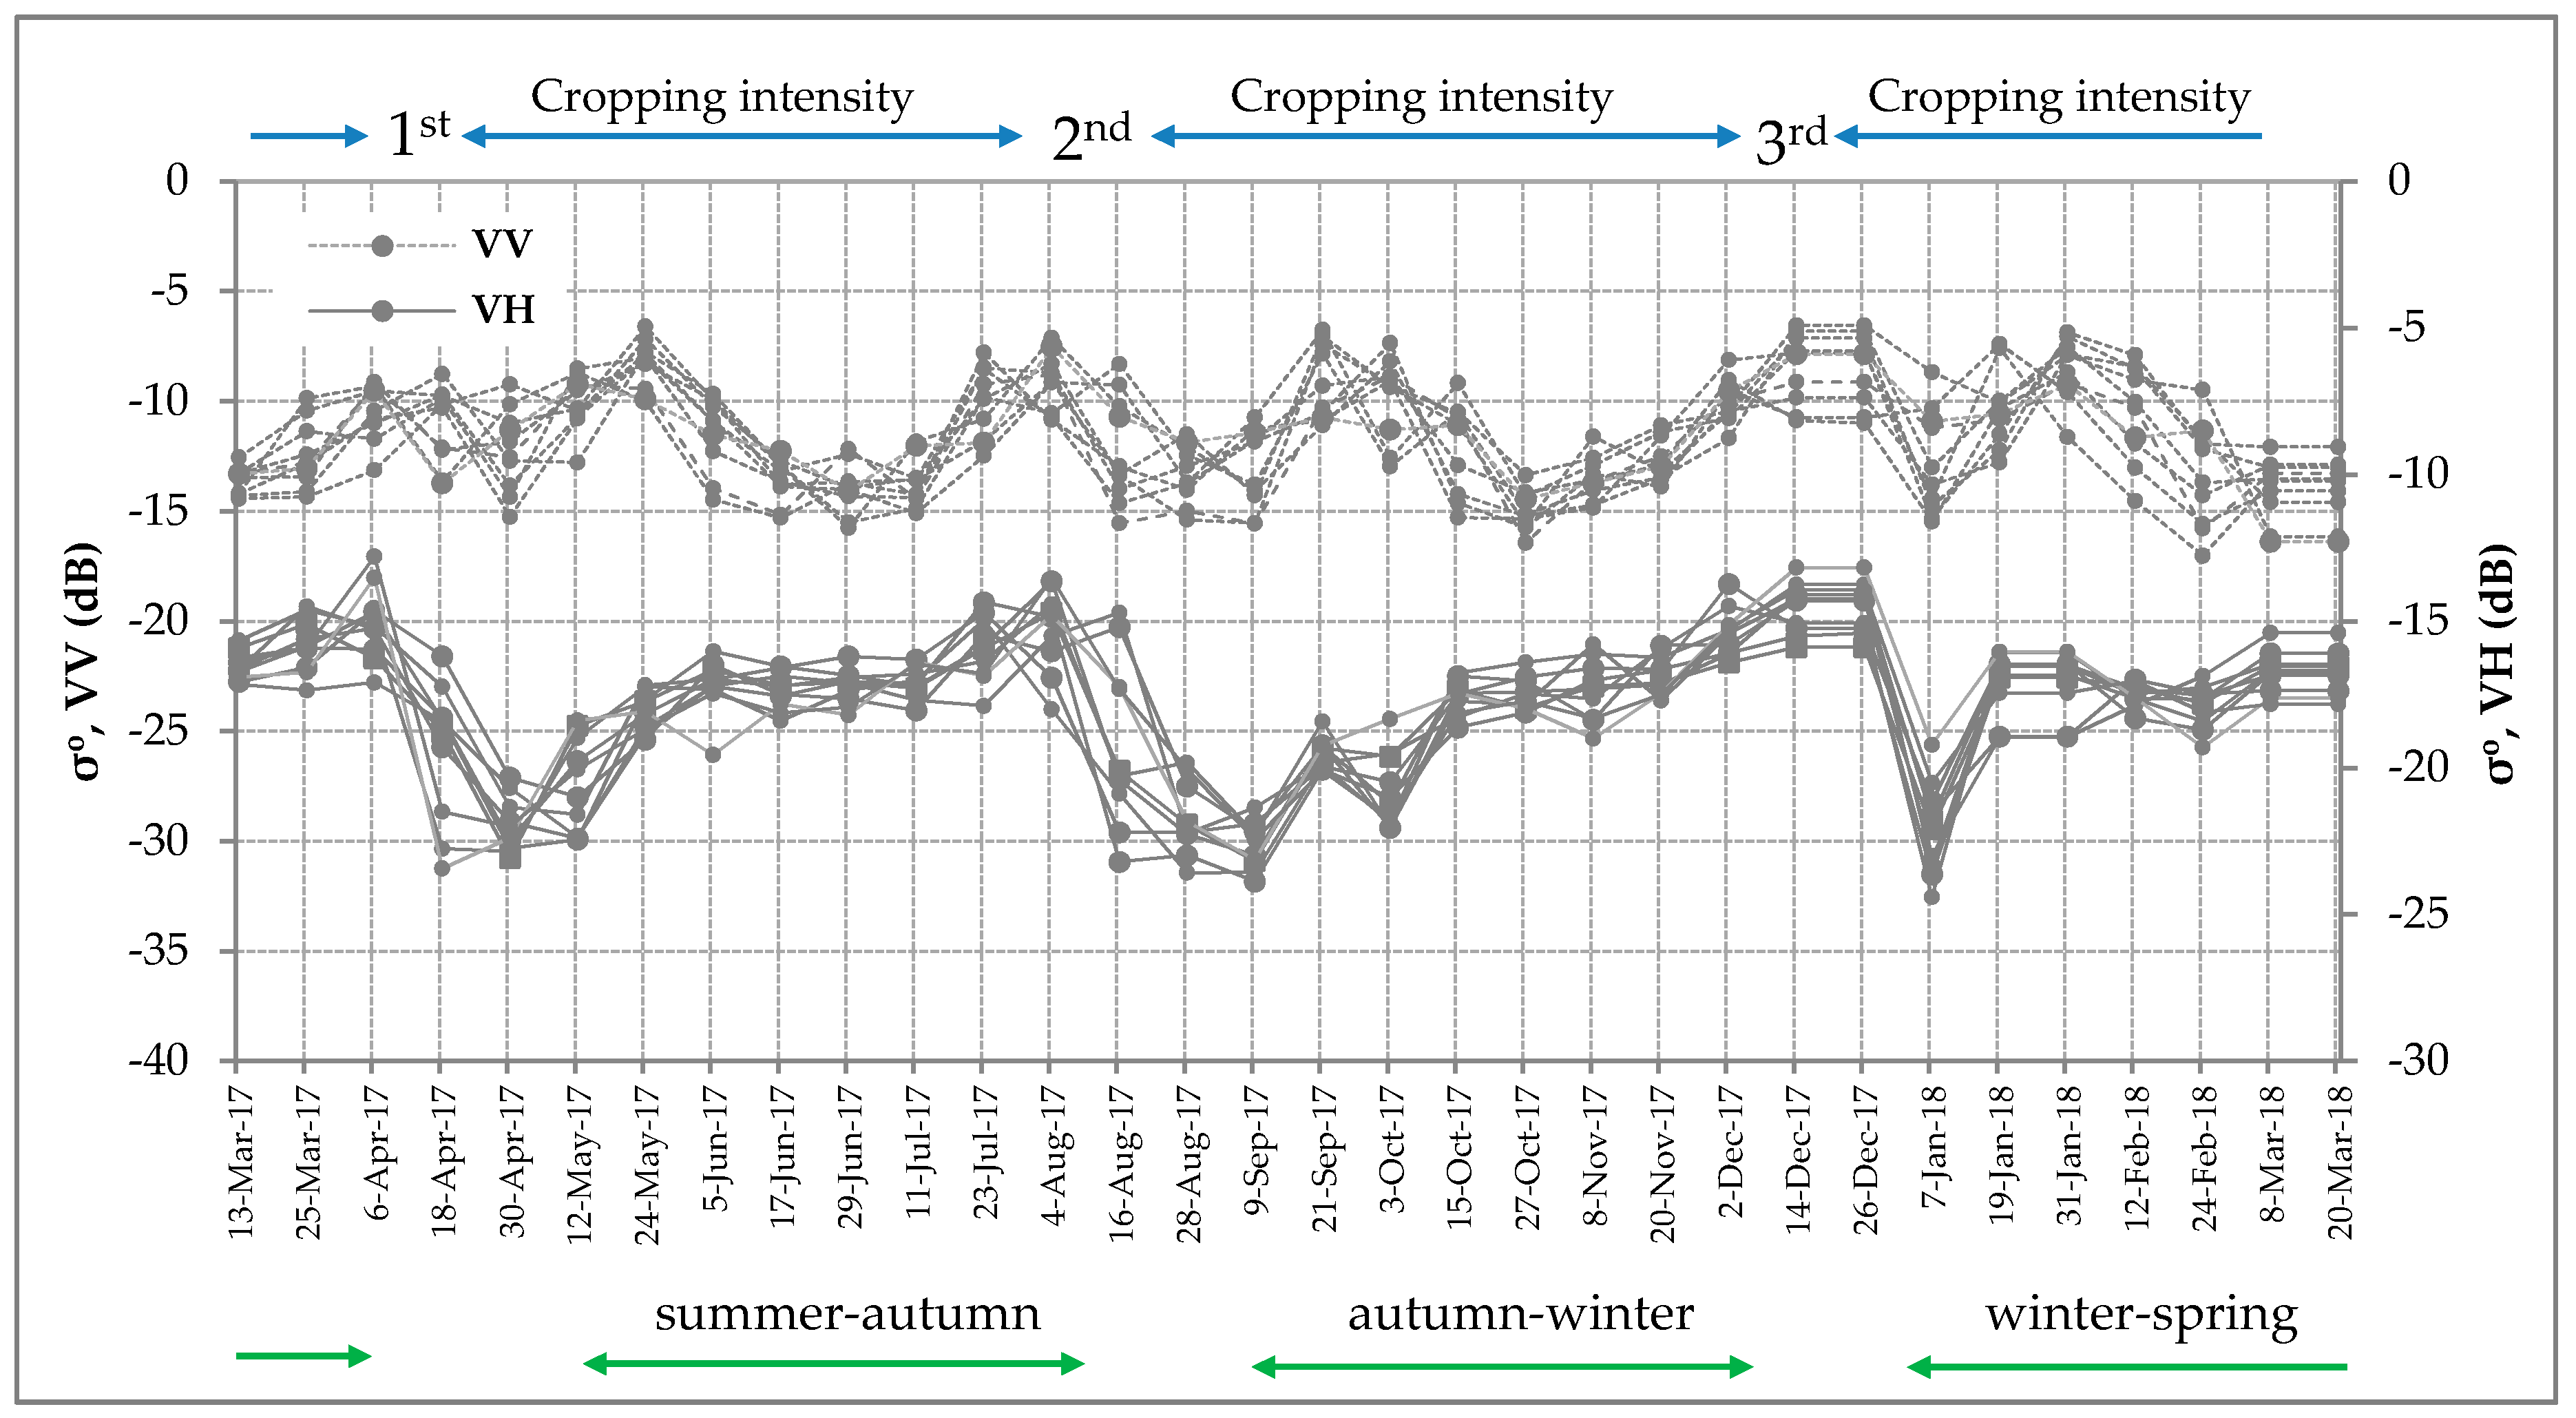
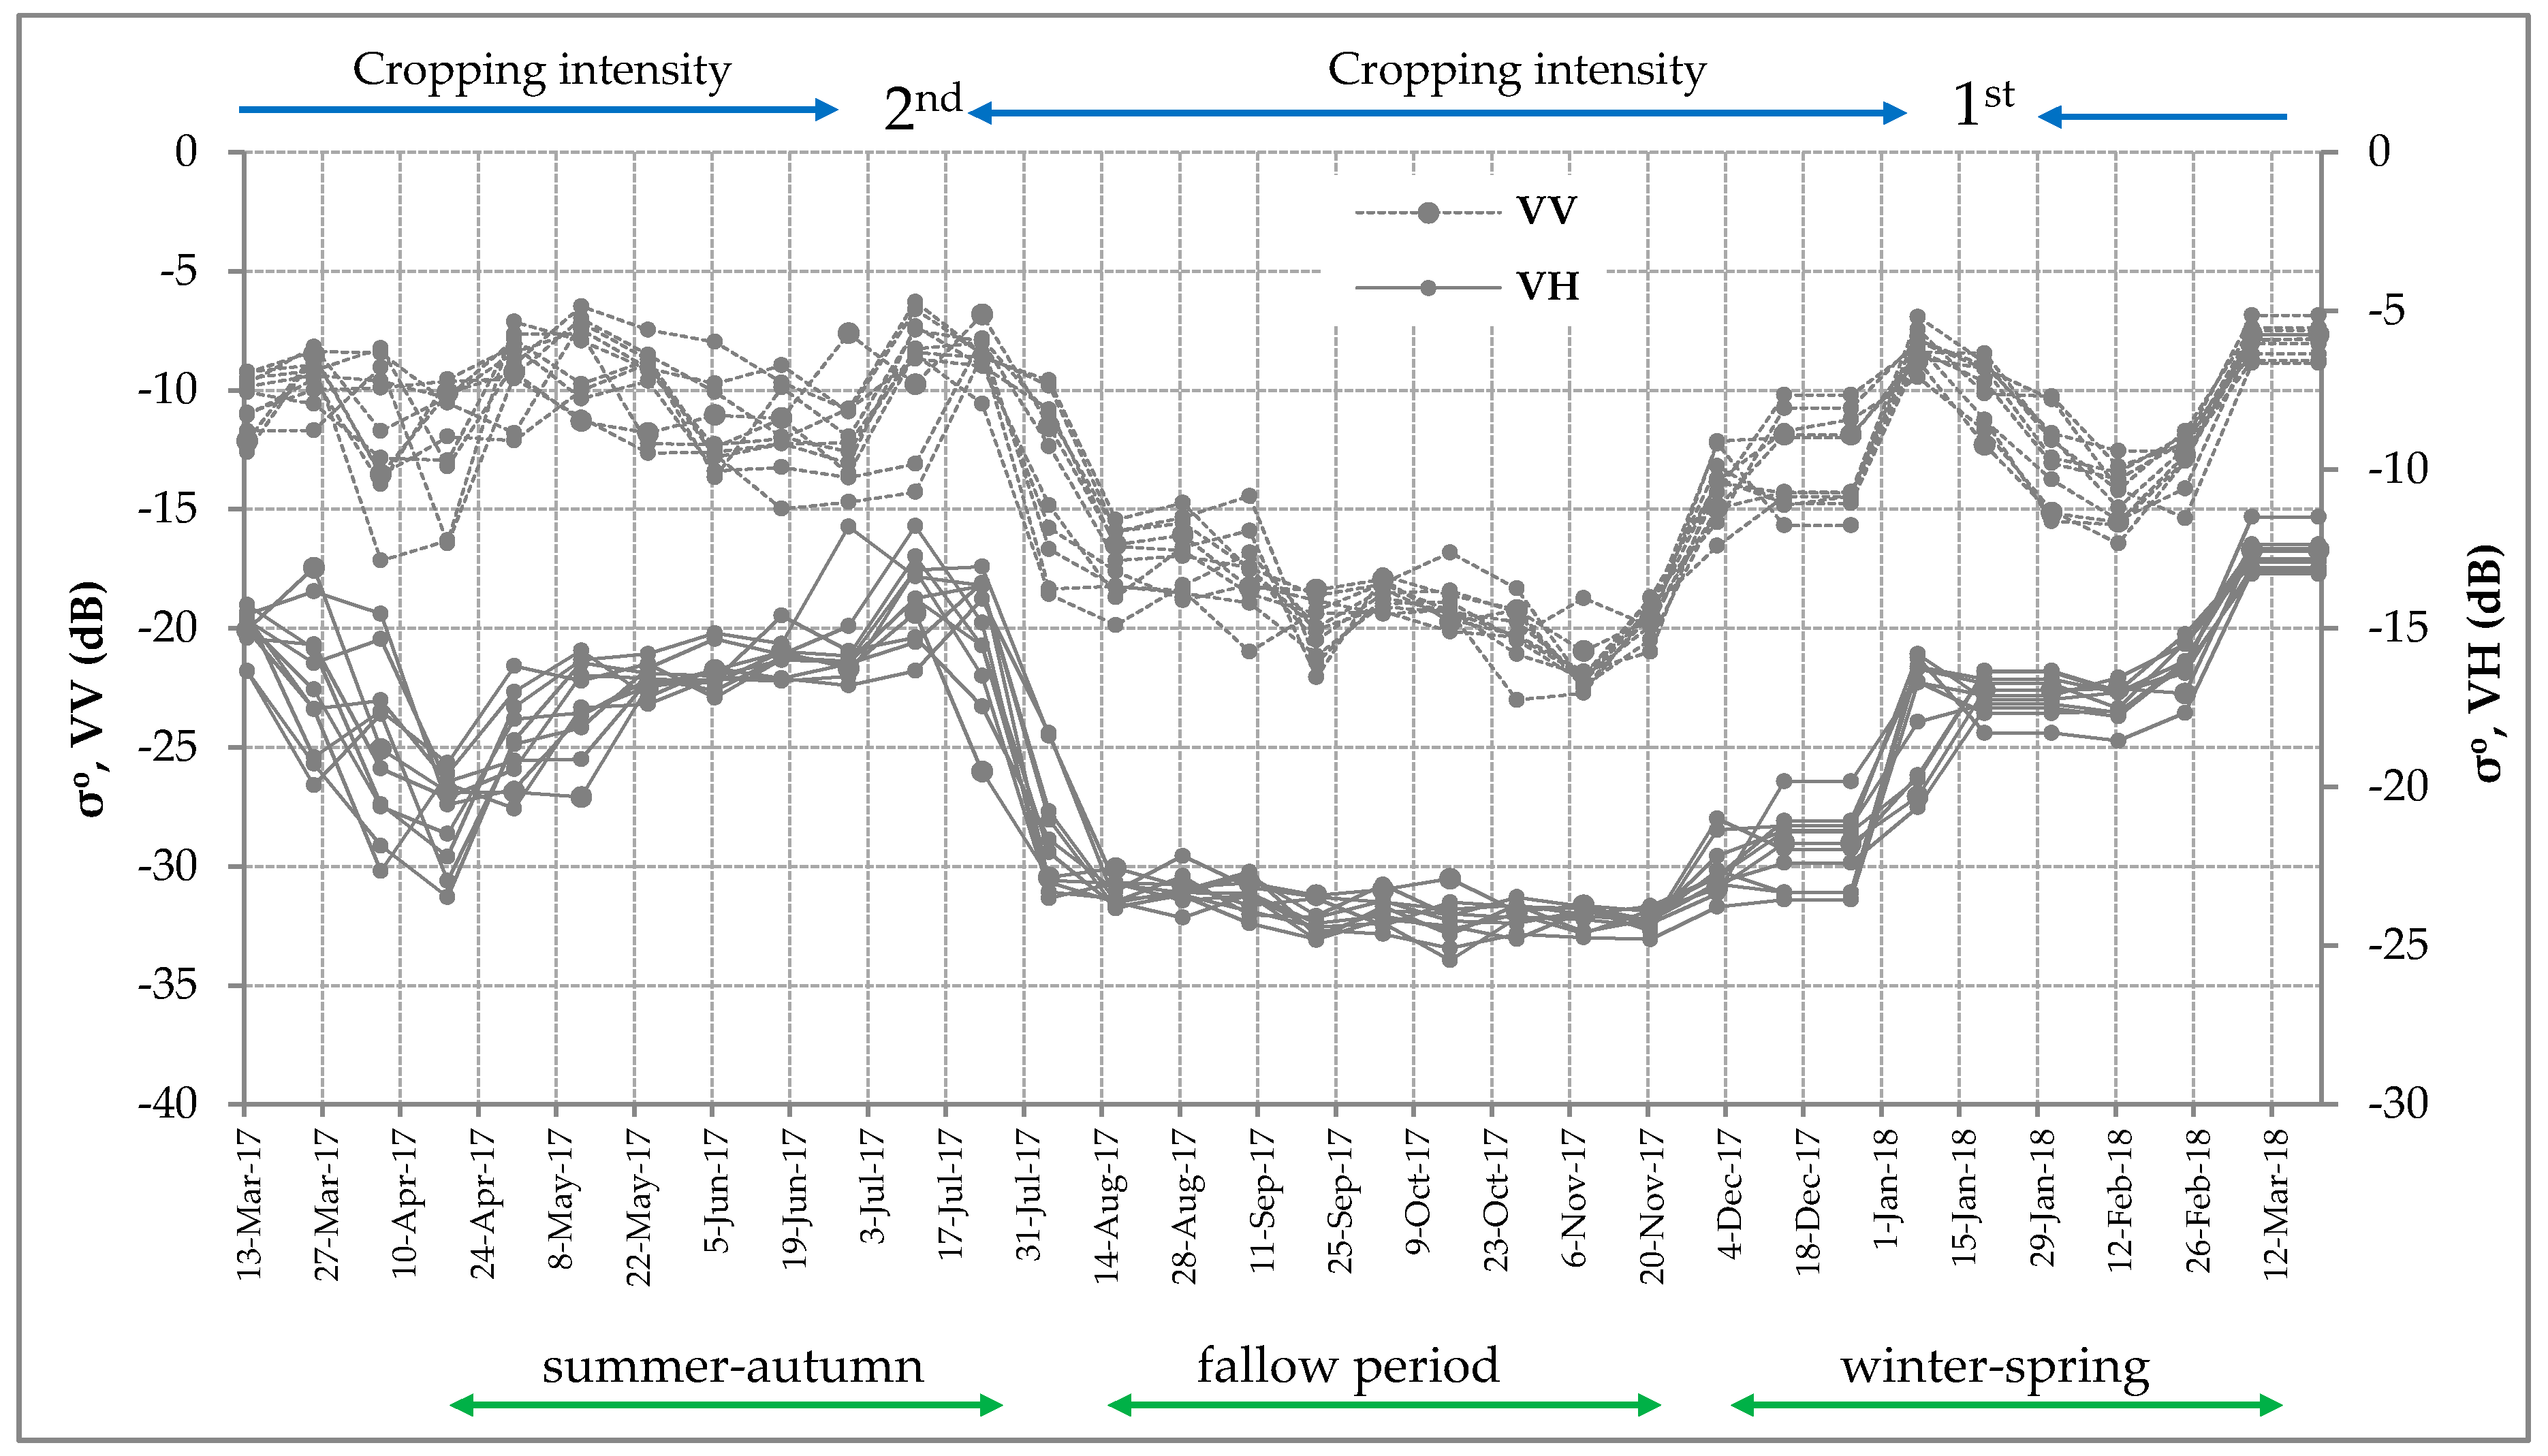
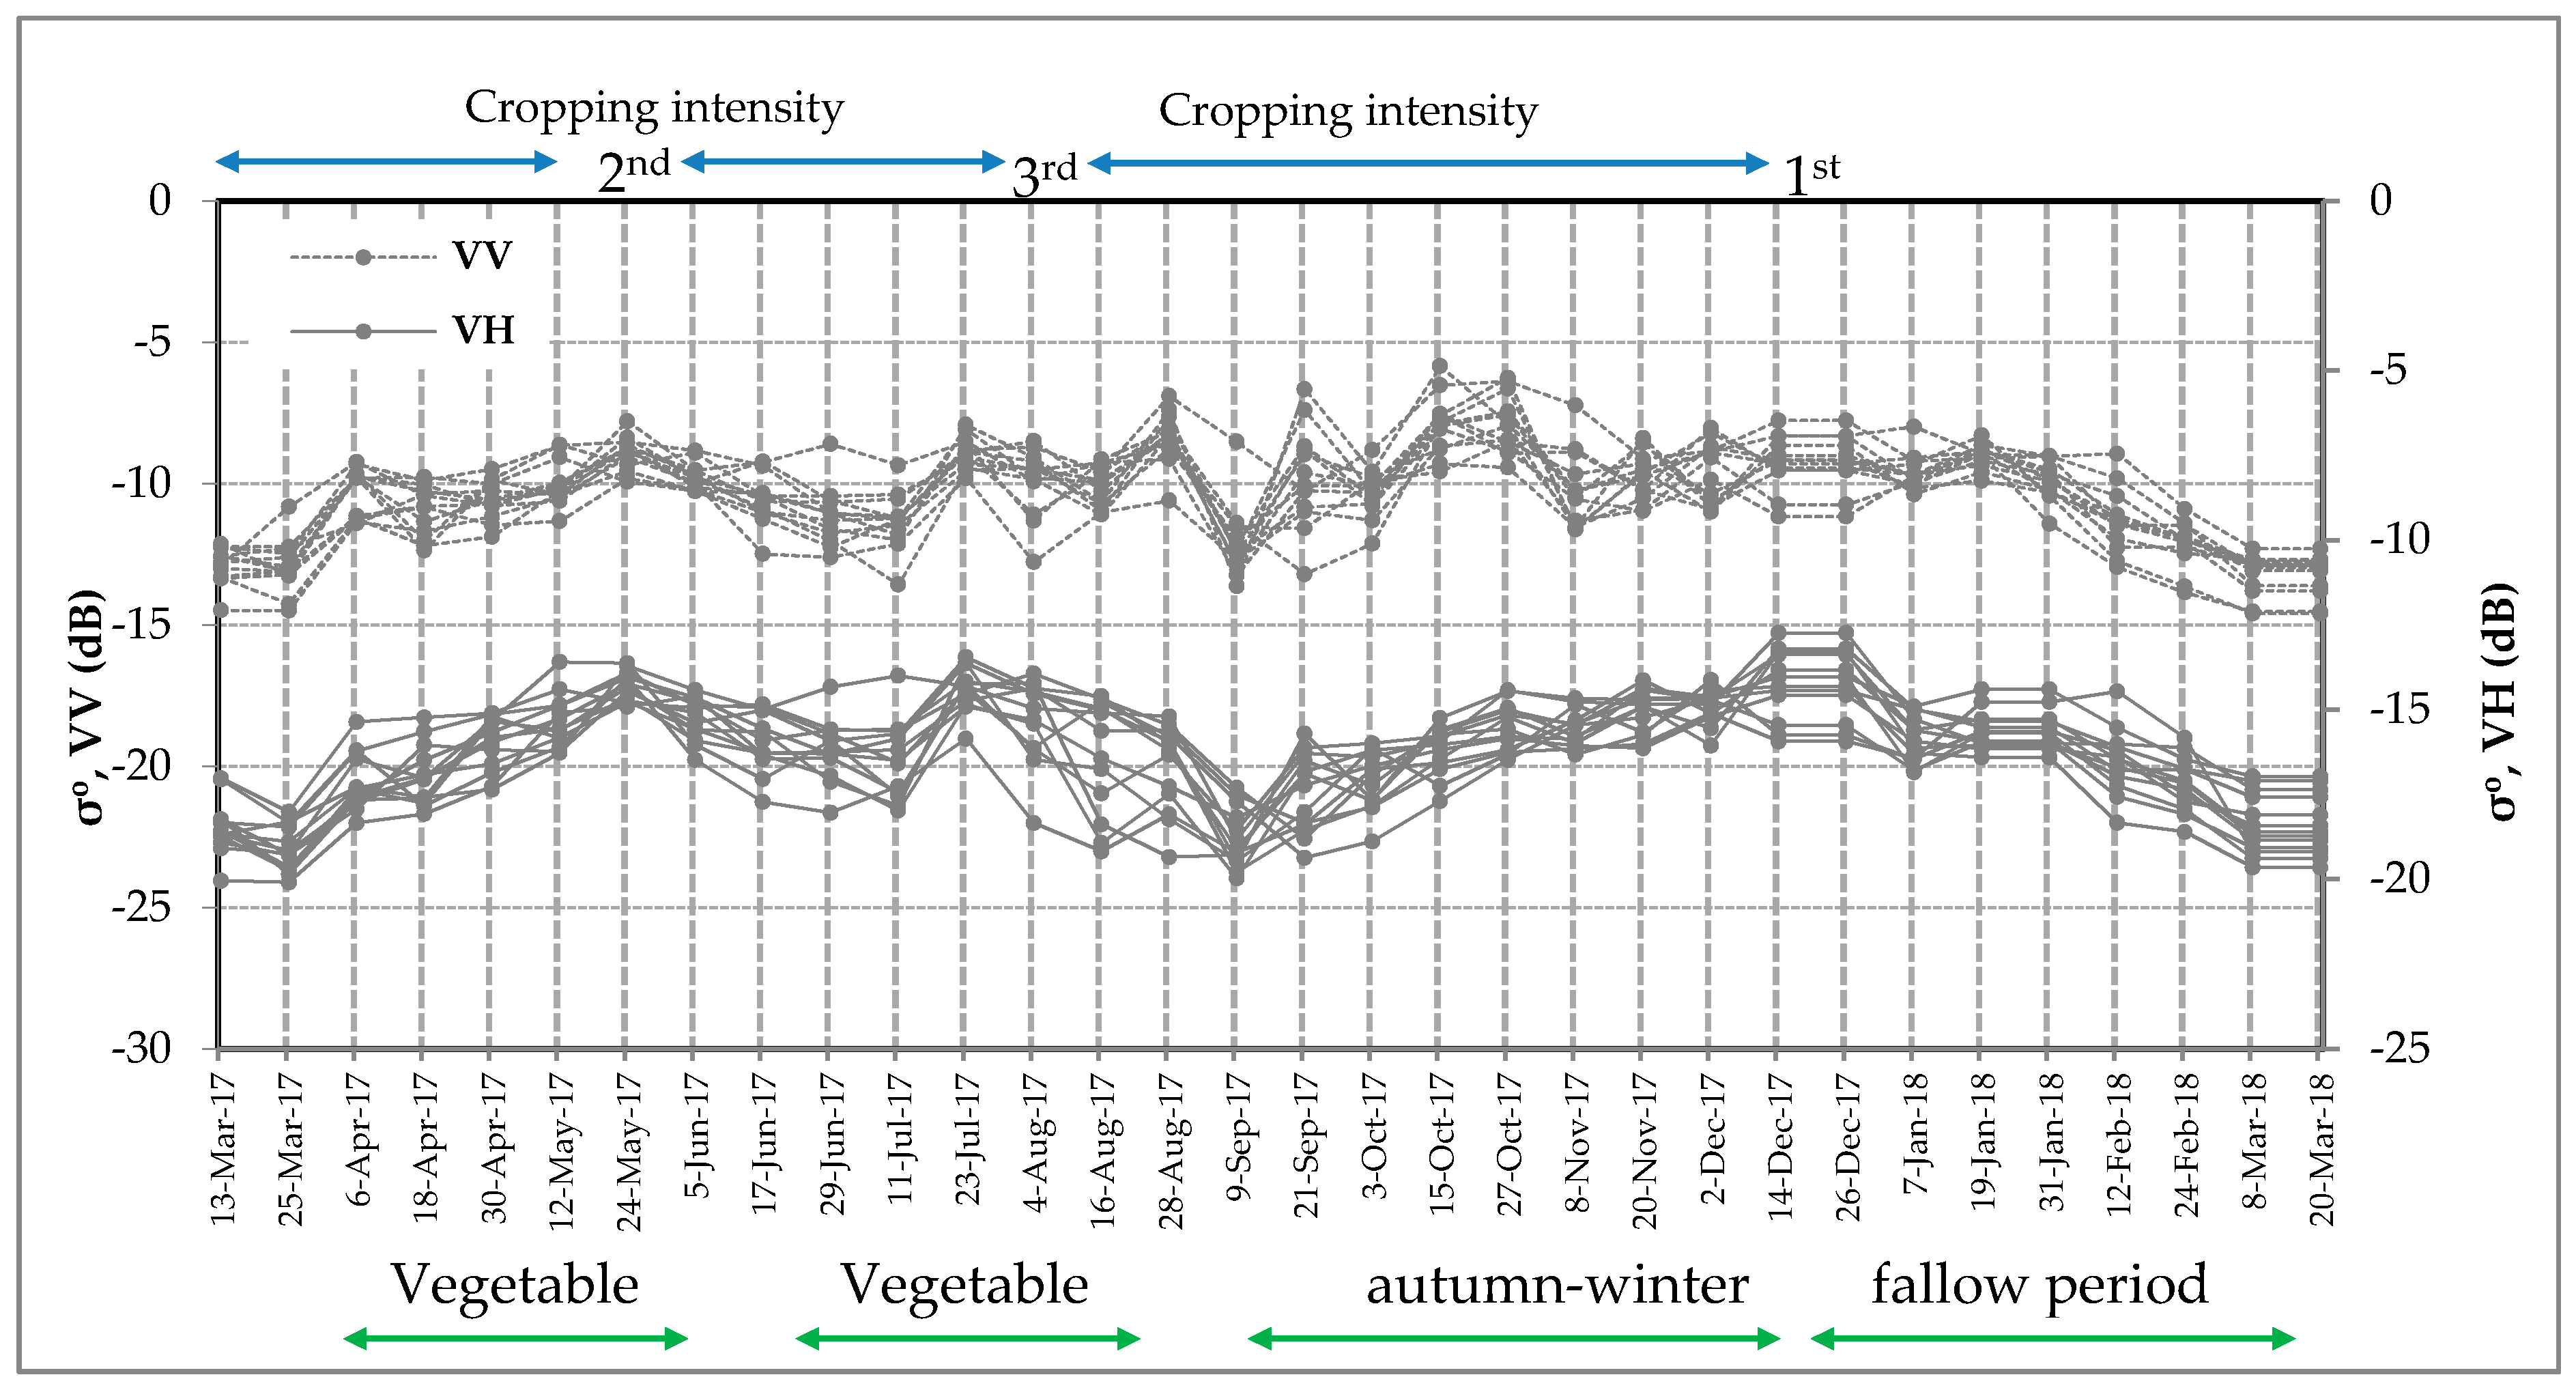
3.1. Polarization Analysis of Triple, Double and Single-rice Crops

Figure 7 shows the rice growth stages of the summer–autumn season for double-rice cropping area. Low backscattering was noticed in the VV and VH polarizations at the vegetative stage in April 2017. It can be explained that rice seedling is small, short, and sparse. Thus, only surface scattering is dominant. During the vegetative phase, σ°VH gradually increased with the rice growth stage. From the vegetative to the maturity stage, σ°VV and σ°VH reached the maximum value at rice maturity stage in July 2017. In the reproductive period, σ°VH and σ°VV increased with the growth of rice height and canopy (Figure 4). The σ°VV and σ°VH values had a strong correlation with rice development during the reproductive phase. In the maturity stage, σ°VV and σ°VH continued to increase until they reached a maximal value on July 11, 2017. A decrease in backscattering was noticed near the harvesting period because plants started drying up. Water in the agricultural field was also drained out causing a soil moisture reduction in August 2017. Moreover, we can see the maximal values of σ°VV and σ°VH appearing at the maturity stage after the maximum of greenness index are consistent with the study of He et al. [90]. Previous studies showed that σ°VH correlated with the rice development stage [5,41,45]. Thus, we use local maxima of σ°VH to consider the rice cropping intensity and cropping season.
Figure 8 shows σ°VV and σ°VH during the entire period of the triple-rice crop. Low backscattering was noticed in the σ°VV and σ°VH due to the sowing of rice time at the early stage in April 2017, September 2017, and January 2018. During the vegetative phase, σ°VH increased gradually whereas the σ°VV increased rapidly because of the high soil moisture or high water level in the fields. In the reproductive phase, the moderate backscatters of σ°VV and σ°VH were found and gradually increase with the growth of rice plants. In the maturity stage, σ°VV and σ°VH continued to rise until they reached a maximal value before experiencing a sharp fall during harvesting time in August, December 2017, and March 2018, respectively.
Figure 9 illustrates the behavior of σ°VV and σ°VH during the entire period of the double-rice crop. The observed σ°VH and σ°VV showed an increase after sowing because of the increased volume and double-bounce scattering with the plant growth (Figure 9). Before sowing rice, the field was bare soil and, thus, lower values of σ°VH and σ°VV were obtained in April 2017. A gradual increase in the σ°VH was observed when rice grew from the vegetative stage to maturity stage. The highest value of σ°VH and σ°VV were noticed in July 2017 during the second cropping season of the double-rice crop. There is a fallow period in the double-rice crop from August to November. During the fallow period, the rice cropping area can accumulate nutrients, enhance productivity, and remove toxic substances from pesticides and pathogens in the monsoon season [91]. We also found the lowest value of σ°VV and σ°VH between August and November, which shows the fallow period to prepare the soil for the next planting of rice. The next sowing period starts at the end of December 2017 when low backscattering has been noticed in the σ°VV and σ°VH polarization (Figure 9). The σ°VV and σ°VH gradually increased with the growth stage from the vegetative to the maturity stage and reached the maximum value near harvesting time in March 2018. When the winter–spring season is considered, the σ°VH clearly had two peaks in July 2017 and March 2018. The peaks matched well with the crop calendar (Figure 2). Thus, the use of multitemporal Sentinel-1A data presents a promising approach to identify double-rice crop, rice growth stages, and standing water during the fallow period, which was indicated at −23 dB of σ°VH.
The minimum and maximum values of VH backscatter for each rice crop were also identified. The minimum average of VH polarizations was −22 dB in triple- and double-rice crops, and was −18 dB for the single-rice crop. These values were consistent with previous studies [41,92]. Oyoshi et al. [92] also found −20.5 dB (±3 dB) of minima VH polarizations. The mean of VH backscatter thresholds varied from −13 to −15 dB in the triple-rice crop, from −13 to −14 dB in the double-rice crop, and −15 dB for the single-rice crop. The mean maximal values of σ°VH in three cropping patterns were not much different from each other. In this study, we also compared the maxima of σ°VH among rice cropping season in double and triple-rice crops. The results show that the mean values of σ°VH in the winter–spring season were usually higher than in summer–autumn and autumn–winter seasons; in the triple rice crop, the mean values of σ°VH was −15 dB and −15.2 dB were found in winter–spring and autumn–winter, respectively. In the double-rice crop, the mean values of σ°VH were −12.5 dB and −14 dB, found in winter–spring and autumn–winter, respectively. Moreover, the σ°VH was often higher in the double-rice crop than in the triple-rice crop [93].
Figure 10 shows the increase in the observed σ°VH and σ°VV after sowing of rice in September 2017 because of the increase in volume and double-bounce scattering with the plant growth. Before sowing rice, vegetables were planted between March and July 2017. There was a gradual increase in the σ°VH with the growth of the rice plant during the vegetative–reproductive stages. The highest value of σ°VH was noticed in December 2017. There was a fallow period after December 2017. Thus, farmers started growing vegetables for extra income. The σ°VH and σ°VV showed the changes in the backscattering properties with the difference in the objects in the agriculture field. The changes in σ°VH and σ°VV matched well with the crop calendar shown in Figure 2 and Figure 6. The single-rice cropping system includes rice–vegetable–vegetable and rice fallow period models. In the rice fallow model, farmers can grow traditional rice crop (landrace rice and floating rice) during July and December. Floating rice is often cultivated in the Luong An Tra Commune, Tri Ton district during August–September and harvested in December or January. Thus, the single-rice crop is mostly grown in Tinh Bien and Tri Ton districts with low annual yield.

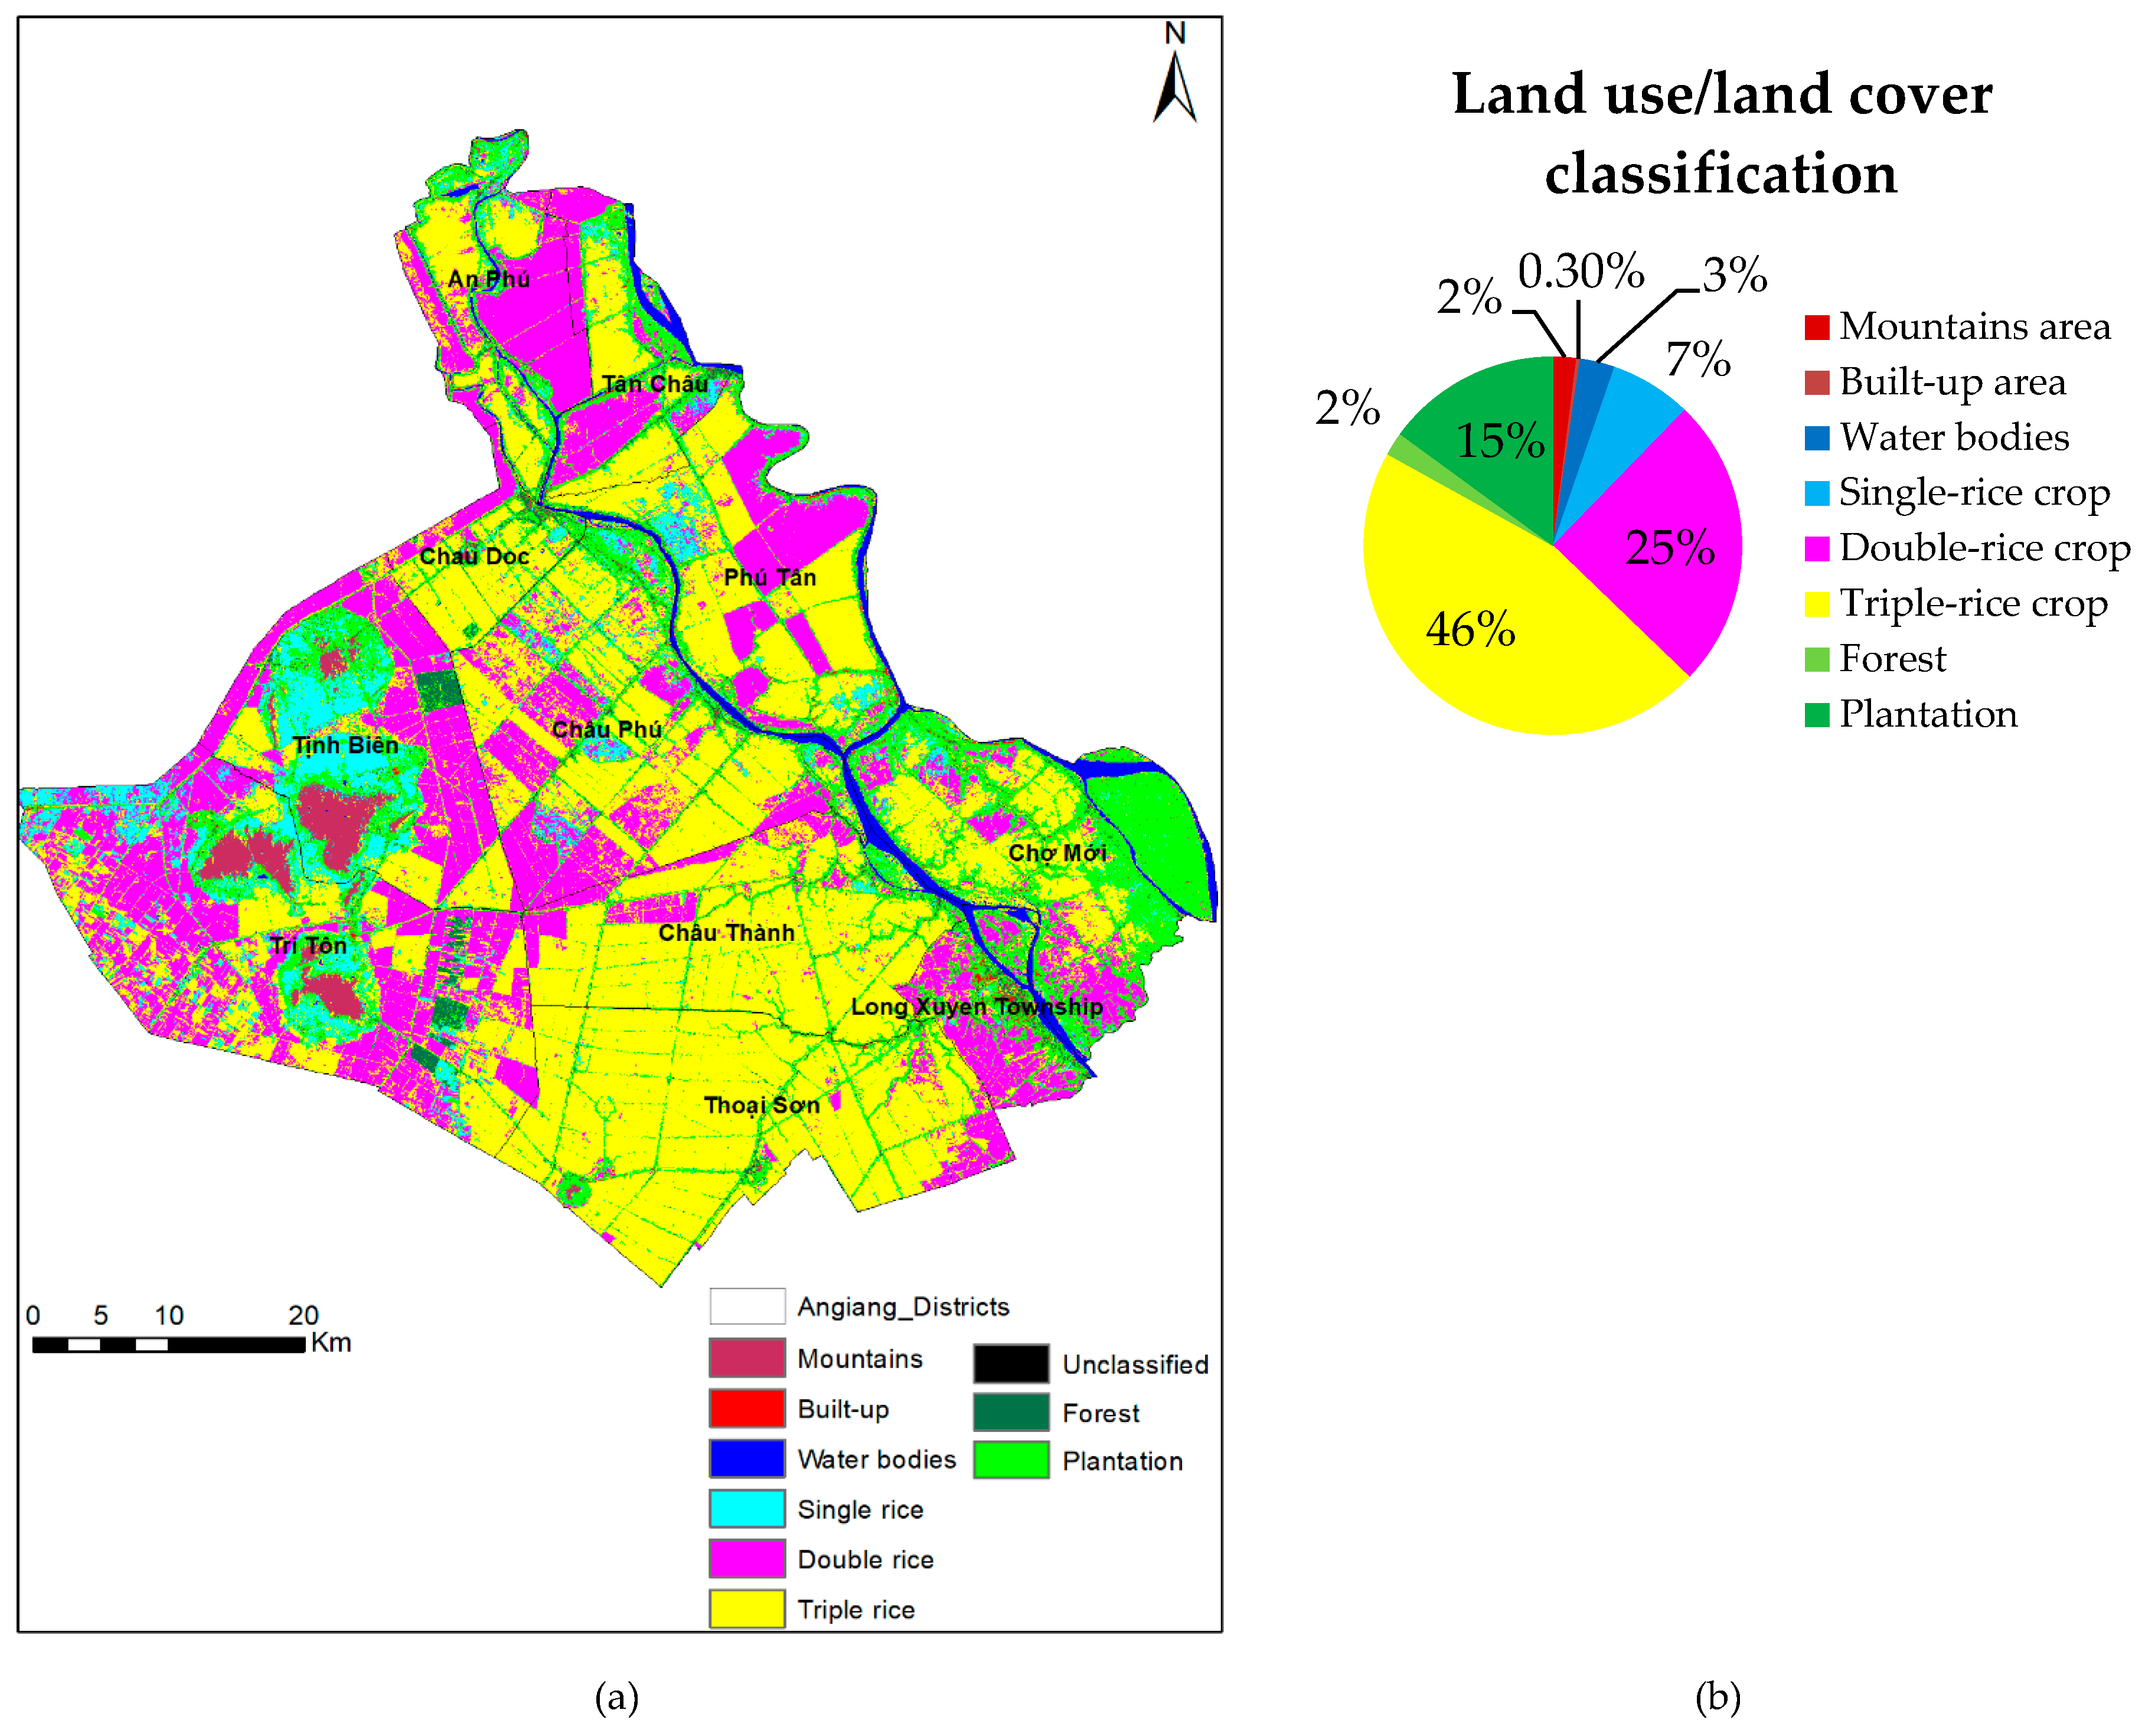
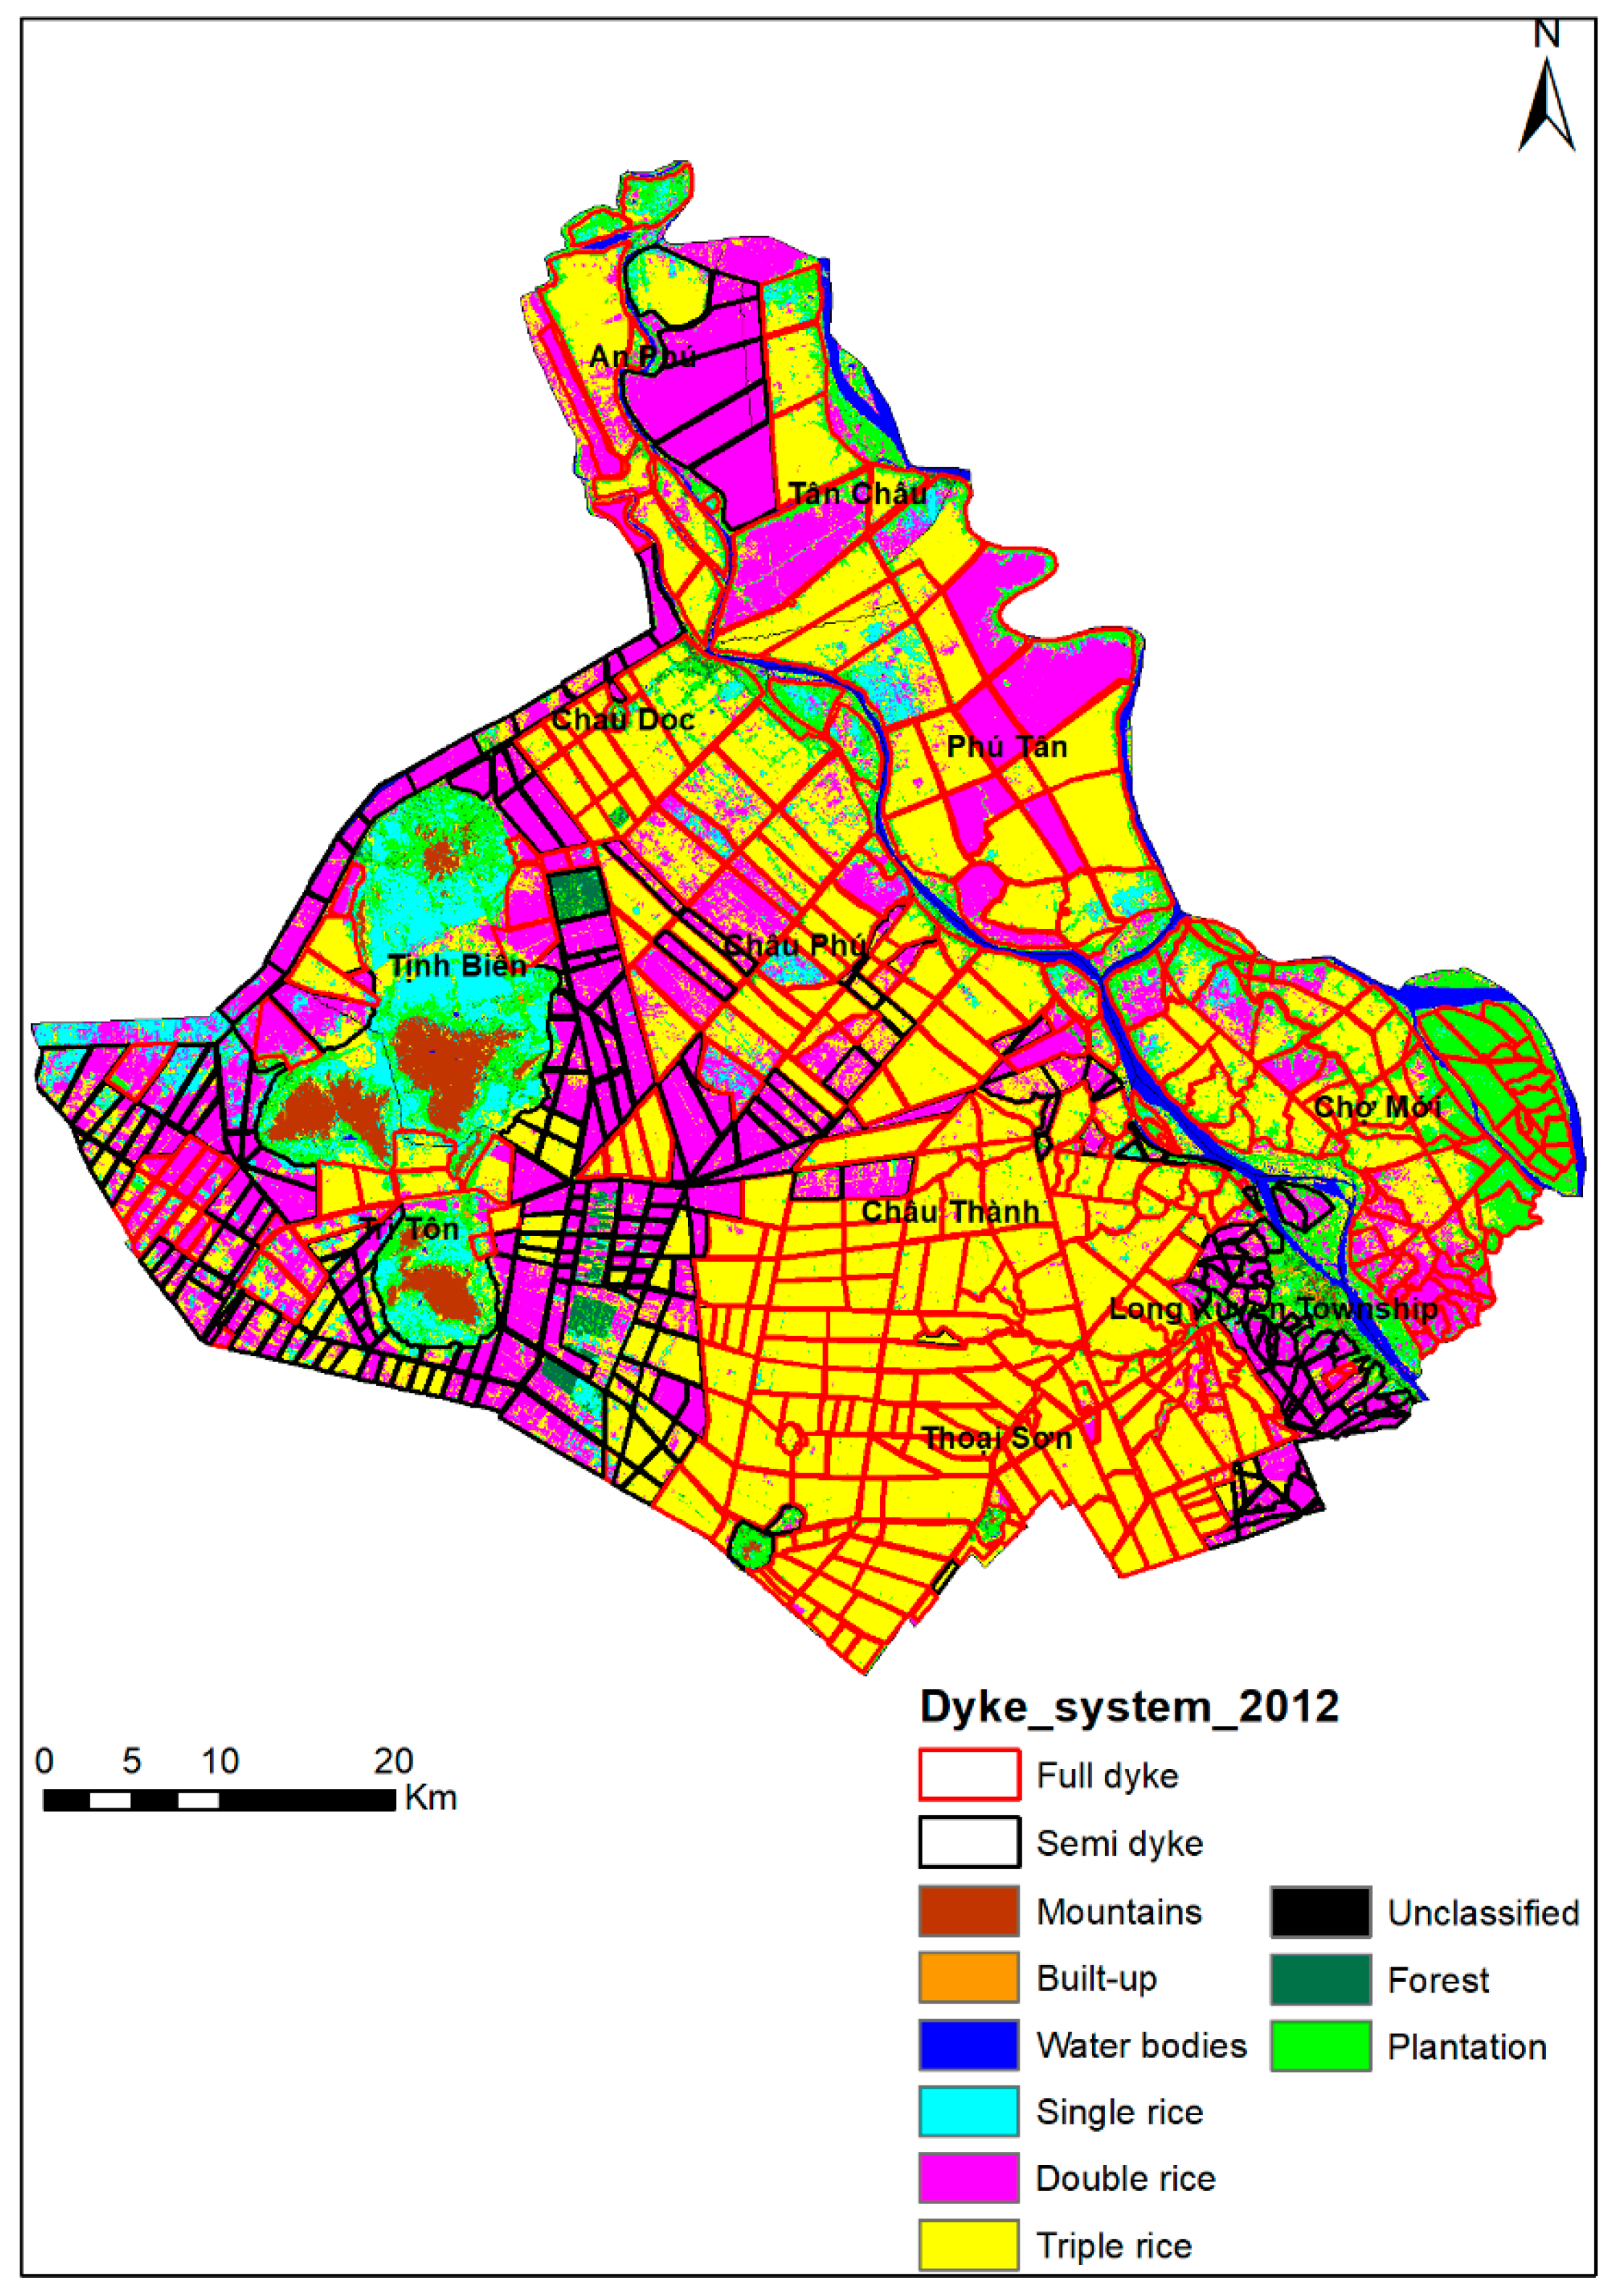
3.2. Delineation of the Rice Cropping Area

The study area of LULC was classified into eight categories: single-rice crop, double-rice crop, triple-rice crop, forest, plantation, mountains, built-up, and water bodies. Figure 11a shows the results of the classification that rice crops at all season were distinguished. Figure 11b represents the statistical distribution of various LULC classes in An Giang. The estimated LULC for An Giang was 46.6% in the triple-rice cropping area, 870.4 sq.km (24.7%) for the double-cropping area, 258.5 sq.km (7.3%) for the single-cropping area, and 21.4% for the others. The total rice planted area from March 2017 to March 2018 was 2770.8 sq.km. Table 2 shows the distribution of various LULC classes at the district level. The three largest triple-rice cropping areas are Thoai Son, followed by Chau Thanh, and Chau Phu. The three largest double-rice cropping areas are Tri Ton, Chau Phu, and Tinh Bien.
The most common method to assess the accuracy of classification is the confusion matrix [32,33]. The error matrix shows a tabulated view of map accuracy, which allows the calculation of specific measures such as overall accuracy and user’s and producer’s accuracies [87]. We used SVM classification with radial basis function kernel to classify the Sentinel-1A data and Kappa coefficient for accuracy assessment of rice cropping patterns in the study area. Table 3 illustrates the confusion matrix of the SVM classification. The producer’s accuracy is derived by dividing the number of correct pixels in one class divided by the total number of pixels derived from reference data. It measures how well a certain area is classified. The user’s accuracy is a measure of the reliability of the map [94]. In this study, there is no significant difference in the user’s and producer’s accuracy. Therefore we focused on the overall accuracy and Kappa coefficient. The overall accuracy of the classification was 80.7% with a 0.78 Kappa coefficient. Triple-rice crop, water, and mountain areas showed some misclassification. Figure 12 shows the dike system overlaid on the classified map. Most of the triple-rice cropping area comes under the full-dike system whereas, the double-rice cropping area comes under the semi-dike system.

4. Discussion

We presented a study of rice cropping pattern monitoring and mapping in An Giang based on Sentinel-1A SAR data, during March 2017 and March 2018. The backscattering behavior of Sentinel-1A SAR shows a good relationship with rice phenological changes in three rice cropping patterns. The σ°VH polarization showed better information about rice growth than σ°VV.
The Sentinel-1A data showed the trajectory of rice growth stages, and the trajectory also matched well with the crop calendar in the area (Figure 2 and Figure 6). For example, the behavior of σ°VH and σ°VV during the entire period of triple-, double-, and single-rice crops were greatly correlated with rice growth stages especially in mature stages due to the weaker effect of standing water in rice fields. The σ°VV had two peaks in each growing seasons except the vegetable crop in the single-rice crop. The result has agreed with [41], in which σ°VV got maximal values 30 days after sowing days. In this study, we found the first peak appeared at 30 days after the sowing date and the second occurred ~12 days after the reproductive stage. These two peaks were approximately equal to each other. The first peak in the σ°VV polarization is probably related to the appearing of water level in the agriculture fields, which causes double-bounce scattering right after the sowing. Although Sentinel-1A data with σ°VH and σ°VV polarization can be used to identify various growth stages of the rice crop, the responses of σ°VH polarization were more consistent with rice growth stages than the σ°VV polarization responses. Moreover, both σ°VH and σ°VV are not sufficient to distinguish backscattering from the surface, steam, and canopy; however, the use of full polarimetric data can be useful to distinguish surface, stem, and canopy scattering. σ°VV polarization also holds signals from volume or double-bounce (e.g., water stem and water canopy). The σ°VH backscatter is less affected by standing water conditions [41], and thus is expected to represent the actual rice growth cycle better.
Regarding rice phenology, the low values of backscattering of σ°VV and σ°VH were found in the early stages such as sowing days and soil preparation, and the fallow periods in semi-dike area. it was also agreed that during sowing dates there was low backscattering [41,42,48,95]. Moreover, Oyoshi et al. [92] noticed that there was low backscattering during the sowing stage and high backscattering during the maturity stage based on the unique phenological changes of rice crop using SAR data. Thus, this feature of SAR data can be utilized for discriminating between rice crop and other objects. Interestingly, the mean of the maximal values of σ°VH was found to be higher in the winter–spring season than other seasons. A higher maximal mean σ°VH value in the double-rice pattern compared to the triple-rice pattern was also detected. This result also coincides with high rice yields in winter–spring and in the double-rice patterns; however, it needs to be confirmed in further studies. The approximate length of the growing season can be monitored in the triple- and double-rice crops, but the single-rice cropping area has a mixture of vegetable signatures. In the single-rice crop, it was hard to determine the beginning and the end of the seasons due to the growth of weeds in the rice fields during the season and end of the season leading to stable high values of σ°VH polarization even when the crop season ends.
Based on the mapping of LULC, we detected that most of the triple-rice crop was distributed close to main rivers (Bassac and Mekong rivers) as compared to double-rice crop. However, we also noticed some double-rice cropping close to the main river during the study period due to farmers applying a three–three–two cropping cycle model. The single-rice cropping pattern was dominant in Tinh Bien and Tri Ton districts that are far away from Bassac River; since most of single-rice cropping area is near mountains and usually face a shortage of water supply. Nguyen et al. [41] also detected rainfed single rice has less optical growing conditions in the Mekong Delta in Vietnam.
The accuracy assessment was applied to quantify how good the LULC mapping was. Overall the accuracy and Kappa coefficient were popularly used to assess the accuracy of rice mapping in many studies [41,75,96]. In this study, the confusion matrix showed a classification error in the triple-rice cropping which was affected mainly by double-rice crop and water bodies. One more rice crop was added to the smaller double-rice area in scatter plots inside the semi-dike area in autumn–winter by local farmers, which was omitted. The farmers temporally upgraded to full-dike from semi-dike to boost rice production; however, it may cause high-risk of dike-break. Some local farmers have converted the third rice crop to vegetable or fallow since farmers need to diversify crops. Land degradation was also one of the factors that led to the conversion of rice crop to other uses. The water bodies had little effect on misclassification in the triple- and double-rice classes. The standing water often appeared in rice fields leading to an inundated area especially during August and November in semi-dike area. Some single-rice plots were misclassified as built-up or double-rice due to some of them not yet producing any cultivations or due to the vegetable-rice model application, respectively. Thus, the use of PALSAR-2 data can improve the accuracy as introduced by [56] to distinguish between the inundated rice fields and noninundated rice fields.

5. Conclusions

This study clearly shows the strong response of dual-polarization (σ°VV and σ°VH) to rice phenology and cropping system by using Sentinel-1A SAR data. The low and high backscattering values are noticed at the vegetative and maturity stages, respectively. The detection of rice growth stages and patterns matched well with the crop calendar. The σ°VH is strongly correlated with the three rice growth stages compared to σ°VV, especially the reproductive stage because of the reduction in soil moisture and water drainage in the rice fields. Since we considered all general rice patterns throughout the study and found that the average maxima of VH polarization are higher than other crops in the winter–spring season. The mean of maximal values of VH polarization is also higher in the double-rice copping system than that in other cropping patterns. We detected that the Sentinel-1A with dual-polarization (VV and VH) is useful to distinguish various growth stages of rice cultivation and rice cropping patterns.
The above finding is associated with a rice cropping pattern distribution in the water infrastructure of the An Giang province. The triple-rice crop is present in the full-dike system and is close to the Bassac and Mekong Rivers with an abundant supply of irrigation water. Double-rice crop areas are located in semi-dikes, which are away from the main rivers. However, some double-rice cropping systems were found next to the main rivers inside full-dike due to a three–three–two cropping cycle instead of triple-rice cropping during the study period. Single-rice crops are located in areas with less low-quality river network soil, and nonusage of fertilizer, which leads to low rice productivity; however, it has less of an impact on water and soil quality. Interestingly, we noticed an increasing trend of traditional rice crop cultivation after 2013. This change has been detected in recent years; however, we expect that An Giang will be able to retrieve single-rice crop to keep traditional rice culture in the future.
The classification approach performed with an overall accuracy of 80.7% with a 0.78 Kappa coefficient. The misclassification was mainly found in the triple-rice cropping system. Further work is needed to refine the use of TanDEM-X, RADARSAT-2, and PALSAR-2, which can be incorporated to improve various growth stages identification and enhance accuracy for rice cropping pattern detection. Polarimetric decomposition algorithm can also be used to detect various objects more accurately in the future. The development of SAR-based rice yield and methane emission models will be significant contributions to determining the impact of rice production on the economy and environment in the VMD and in the world.

Author Contributions

Conceptualization, Ram Avtar, Masaaki Kurasaki, and Huynh Vuong Thu Minh; Methodology, Ram Avtar and Huynh Vuong Thu Minh; Formal Analysis, Ram Avtar, Huynh Vuong Thu Minh, Geetha Mohan, Prakhar Misra, and Masaaki Kurasaki; Software, Ram Avtar, Geetha Mohan, and Prakhar Misra; Data Curation, Ram Avtar and Huynh Vuong Thu Minh; Writing—Original Draft Preparation, Ram Avtar, Masaaki Kurasaki, Huynh Vuong Thu Minh, Geetha Mohan, and Prakhar Misra; Writing—Review and Editing, Ram Avtar and Masaaki Kurasaki.

Funding

We would like to thank JAXA EO-RA2 (ER2A2N133) for their kind support. This study is funded in part by the Can Tho University Improvement Project VN14-P6. The authors also appreciate the contributions made by anonymous reviewers.

Acknowledgments

The Sentinel-1A data used in this study were provided by Copernicus Sentinel data hub (European Space Agency). The authors are thankful for the Japan International Cooperation Center (JICE) for providing a PhD scholarship at Hokkaido University.

Conflicts of Interest

The authors declare no conflict of interest.

Appendix A

Figure A1. Multitemporal Sentinel-1A data: The display of An Giang province in composite image R:G:B by bands (VV:VH:VV/VH) (scale: 1/3,000,000).
Ijgi 08 00211 g0a1aIjgi 08 00211 g0a1b

References

  1. International Rice Research Institute (IRRI). Bringing Hope, Improving Lives: Strategic Plan. 2007–2015; International Rice Research Institute (IRRI): Manila, Philippines, 2006. [Google Scholar]
  2. Maclean, J.; Hardy, B.; Hettel, G. Rice Almanac, 4th ed.; International Rice Research Institute: Los Bahos, Philippines, 2013; ISBN 978-971-22-0300-8. [Google Scholar]
  3. Hossain, M. Rice Supply and Demand in Asia: A Socioeconomic and Biophysical Analysis; Springer: Dordrecht, The Netherlands, 1997; pp. 263–279. ISBN 978-94-011-5416-1. [Google Scholar]
  4. Food and Agriculture Organization (FAO). Save and Grow: Maize, Rice and Wheat—A Guide to Sustainable Crop Production; UN Food and Agriculture Organization: Rome, Italy, 2016; ISBN 978-92-5-108519-6. [Google Scholar]
  5. Ndikumana, E.; Ho Tong Minh, D.; Dang Nguyen, T.H.; Baghdadi, N.; Courault, D.; Hossard, L.; El Moussawi, I. Estimation of Rice Height and Biomass Using Multitemporal SAR Sentinel-1 for Camargue, Southern France. Remote Sens. 2018, 10, 1394. [Google Scholar] [CrossRef]
  6. Bouman, B.A.; Tuong, T. Field water management to save water and increase its productivity in irrigated lowland rice. Agric. Water Manag. 2001, 49, 11–30. [Google Scholar] [CrossRef]
  7. Intergovernmental Panel on Climate Change (IPCC). Climate Change 2007: Impacts, Adaptation and Vulnerability. Contribution of Working Group II to the Fourth Assessment Report of the Intergovernmental Panel on Climate Change; Cambridge University Press: Cambridge, UK, 2007. [Google Scholar]
  8. Wassmann, R.; Jagadish, S.V.K.; Sumfleth, K.; Pathak, H.; Howell, G.; Ismail, A.; Serraj, R.; Redona, E.; Singh, R.K.; Heuer, S. Chapter 3 Regional Vulnerability of Climate Change Impacts on Asian Rice Production and Scope for Adaptation. In Advances in Agronomy; Academic Press: Cambridge, MA, USA, 2009; Volume 102, pp. 91–133. ISBN 0065-2113. [Google Scholar]
  9. Le, N.K.; Jha, K.M.; Jeong, J.; Gassman, W.P.; Reyes, R.M.; Doro, L.; Tran, Q.D.; Hok, L. Evaluation of Long-Term SOC and Crop Productivity within Conservation Systems Using GFDL CM2.1 and EPIC. Sustainability 2018, 10, 2665. [Google Scholar] [CrossRef]
  10. Van Ty, T.; Sunada, K.; Ichikawa, Y. Water resources management under future development and climate change impacts in the Upper Srepok River Basin, Central Highlands of Vietnam. Water Policy 2012, 14, 725–745. [Google Scholar] [CrossRef]
  11. Toan, T.Q. Climate Change and Sea Level Rise in the Mekong Delta: Flood, Tidal Inundation, Salinity Intrusion, and Irrigation Adaptation Methods. In Coastal Disasters and Climate Change in Vietnam; Thao, N.D., Takagi, H., Esteban, M., Eds.; Elsevier: Oxford, UK, 2014; pp. 199–218. ISBN 978-0-12-800007-6. [Google Scholar]
  12. Mekong Delta Plan (MDP). Long-Term Vision and Strategy for a Safe, Prosperous and Sustainable Delta; Consortium Royal HaskoningDHV, WUR, Deltares, Rebel: Amersfoort, The Netherlands, 2013. [Google Scholar]
  13. Minh, N.T.H.; Kawaguchi, T. Overview of rice production system in the Mekong Delta-Vietnam. J.-Faculty Agric. Kyushu Univ. 2002, 47, 221–231. [Google Scholar]
  14. Chea, R.; Grenouillet, G.; Lek, S. Evidence of Water Quality Degradation in Lower Mekong Basin Revealed by Self-Organizing Map. PLoS ONE 2016, 11, e0145527. [Google Scholar] [CrossRef]
  15. General Statistics Office of Vietnam (GSO). Statistical Yearbook of Viet Nam 2016; General Statistics Office of Vietnam (GSO): Hanoi, Vietnam, 2016. [Google Scholar]
  16. Guan, X.; Huang, C.; Liu, G.; Meng, X.; Liu, Q. Mapping Rice Cropping Systems in Vietnam Using an NDVI-Based Time-Series Similarity Measurement Based on DTW Distance. Remote Sens. 2016, 8, 19. [Google Scholar] [CrossRef]
  17. Miller, F. Environmental Risk in Water Resources Management in the Mekong Delta: A Multiscale Analysis; I.B. Tauris: London, UK, 2006; Volume 1, ISBN 978-1-85043-445-0. [Google Scholar]
  18. Kono, Y. Canal development and intensification of rice cultivation in the Mekong Delta: A case study in Cantho Province, Vietnam. Southeast Asian Stud. 2001, 39, 70–85. [Google Scholar]
  19. Le Meur, P.Y.; Hauswirth, D.; Leurent, T.; Lienhard, T. The Local Politics of Land and Water: Case Studies from the Mekong Delta; Groupe de Recherche et d’ Echanges Technologiques: Paris, France, 2005. [Google Scholar]
  20. Liew, S.C.; Kam, S.P.; Tuong, T.P.; Chen, P.; Minh, V.Q.; Lim, H. Application of multitemporal ERS-2 synthetic aperture radar in delineating rice cropping systems in the Mekong River Delta, Vietnam. IEEE Trans. Geosci. Remote Sens. 1998, 36, 1412–1420. [Google Scholar] [CrossRef]
  21. Minister of Agriculture and Rural Development (MARD). The Action Plan Framework for Adaptation to Climate Change in the Agriculture and Rural Development Sector Period 2008–2020; Minister of Agriculture and Rural Development (MARD): Hanoi, Vietnam, 2008.
  22. Nguyen, Q. Outcomes of Vietnam’s Agrarian policies after “Doi Moi”: A case of attempted agricultural intensification in a village in Vietnam’s Mekong Delta. Glob. J. Hum. Soc. Sci. Arts Hum. 2013, 13, 37–47. [Google Scholar]
  23. Pham, C.H. Planning and Implementation of the Dyke Systems in the Mekong Delta, Vietnam. Ph.D. Thesis, Bonn University, Bonn, Germany, 2011. [Google Scholar]
  24. General Statistics Office of Vietnam (GSO). Statistical Yearbook of VietNam 2014; General Statistics Office of Vietnam: Hanoi, Vietnam, 2014.
  25. Ni, D.V.; Maltby, E.; Stafford, R.; Tuong, T.; Xuan, V.T. Status of the Mekong Delta: Agricultural Development, Environmental Pollution and Farmer Differentiation. In Wetlands Management in Vietnam: Issues and Perspectives; WorldFish Center: Hanoi, Vietnam, 2003. [Google Scholar]
  26. Hung, N.N.; Delgado, J.M.; Güntner, A.; Merz, B.; Bárdossy, A.; Apel, H. Sedimentation in the floodplains of the Mekong Delta, Vietnam Part II: Deposition and erosion. Hydrol. Process. 2014, 28, 3145–3160. [Google Scholar] [CrossRef]
  27. Manh, N.V.; Dung, N.V.; Hung, N.N.; Merz, B.; Apel, H. Large-scale suspended sediment transport and sediment deposition in the Mekong Delta. Hydrol. Earth Syst. Sci. 2014, 18, 3033–3053. [Google Scholar] [CrossRef] [Green Version]
  28. Tran, V.H. Understanding Farmer Production Strategies in Context of Policies for Adaptation to Floods in Vietnam Case Study at Two Communes, An Giang Province, Vietnam. Master’s Thesis, Swedish University of Agricultural Sciences: Uppsala, Swedish, 2011. [Google Scholar]
  29. Sakamoto, T.; Phung, V.C.; Nhan, V.N.; Kotera, A.; Yokozawa, M. Agro-ecological interpretation of rice cropping systems in flood-prone areas using MODIS imagery. Photogramm. Eng. Remote Sens. 2009, 75, 413–424. [Google Scholar] [CrossRef]
  30. Xuan, V.T. Rice Cultivation in the Mekong Delta. Jpn. J. Southeast Asian Stud. 1975, 13, 88–111. [Google Scholar]
  31. Bouvet, A.; Le Toan, T.; Lam-Dao, N. Monitoring of the Rice Cropping System in the Mekong Delta Using ENVISAT/ASAR Dual Polarization Data. IEEE Trans. Geosci. Remote Sens. 2009, 47, 517–526. [Google Scholar] [CrossRef] [Green Version]
  32. Avtar, R.; Suzuki, R.; Sawada, H. Natural Forest Biomass Estimation Based on Plantation Information Using PALSAR Data. PLoS ONE 2014, 9, e86121. [Google Scholar] [CrossRef]
  33. Avtar, R.; Herath, S.; Saito, O.; Gera, W.; Singh, G.; Mishra, B.; Takeuchi, K. Application of remote sensing techniques toward the role of traditional water bodies with respect to vegetation conditions. Environ. Dev. Sustain. 2014, 16, 995–1011. [Google Scholar] [CrossRef]
  34. Sakamoto, T.; Van Nguyen, N.; Ohno, H.; Ishitsuka, N.; Yokozawa, M. Spatio–temporal distribution of rice phenology and cropping systems in the Mekong Delta with special reference to the seasonal water flow of the Mekong and Bassac rivers. Remote Sens. Environ. 2006, 100, 1–16. [Google Scholar] [CrossRef]
  35. Vo, Q.M.; Huynh, T.T.H.; Nguyen, T.H.D.; Ho, V.C. Application of MODIS images to monitoring the progress of rice sowing and cropping calendar assisting in early warning rice brown hopper in the Mekong Delta, Vietnam. In Proceedings of the the 33rd Asian Conference on Remote Sensing, Pattaya, Thailand, 26–30 November 2012. [Google Scholar]
  36. Chen, C.F.; Son, N.T.; Chang, L.Y. Monitoring of rice cropping intensity in the upper Mekong Delta, Vietnam using time-series MODIS data. Adv. Space Res. 2012, 49, 292–301. [Google Scholar] [CrossRef]
  37. Kontgis, C.; Schneider, A.; Ozdogan, M. Mapping rice paddy extent and intensification in the Vietnamese Mekong River Delta with dense time stacks of Landsat data. Remote Sens. Environ. 2015, 169, 255–269. [Google Scholar] [CrossRef]
  38. Dinesh Kumar, S.; Srinivasa Rao, S.; Sharma, J.R. Radar Vegetation Index as an Alternative to NDVI for Monitoring of Soyabean and Cotton. In Proceedings of the Indian Cartographer, Jodhpur, India, 19–21 September 2013; Volume XXXIII, pp. 91–96. [Google Scholar]
  39. Xiao, X.; Boles, S.; Frolking, S.; Li, C.; Babu, J.Y.; Salas, W.; Moore, B. Mapping paddy rice agriculture in South and Southeast Asia using multi-temporal MODIS images. Remote Sens. Environ. 2006, 100, 95–113. [Google Scholar] [CrossRef]
  40. Peng, D.; Huete, A.R.; Huang, J.; Wang, F.; Sun, H. Detection and estimation of mixed paddy rice cropping patterns with MODIS data. Int. J. Appl. Earth Obs. Geoinform. 2011, 13, 13–23. [Google Scholar] [CrossRef]
  41. Nguyen, D.B.; Gruber, A.; Wagner, W. Mapping rice extent and cropping scheme in the Mekong Delta using Sentinel-1A data. Remote Sens. Lett. 2016, 7, 1209–1218. [Google Scholar] [CrossRef]
  42. Lasko, K.; Vadrevu, K.P.; Tran, V.T.; Justice, C. Mapping Double and Single Crop Paddy Rice with Sentinel-1A at Varying Spatial Scales and Polarizations in Hanoi, Vietnam. IEEE J. Sel. Top. Appl. Earth Obs. Remote Sens. 2018, 11, 498–512. [Google Scholar] [CrossRef] [PubMed]
  43. Choudhury, I.; Chakraborty, M.; Santra, S.C.; Parihar, J.S. Methodology to classify rice cultural types based on water regimes using multi-temporal RADARSAT-1 data. Int. J. Remote Sens. 2012, 33, 4135–4160. [Google Scholar] [CrossRef]
  44. Nelson, A.; Setiyono, T.; Rala, B.A.; Quicho, D.E.; Raviz, V.J.; Abonete, J.P.; Maunahan, A.A.; Garcia, A.C.; Bhatti, Z.H.; Villano, S.L.; et al. Towards an Operational SAR-Based Rice Monitoring System in Asia: Examples from 13 Demonstration Sites across Asia in the RIICE Project. Remote Sens. 2014, 6, 10773–10812. [Google Scholar] [CrossRef] [Green Version]
  45. Phan, H.; Le Toan, T.; Bouvet, A.; Nguyen, D.L.; Pham Duy, T.; Zribi, M. Mapping of Rice Varieties and Sowing Date Using X-Band SAR Data. Sensors 2018, 18, 316. [Google Scholar] [CrossRef]
  46. Le Toan, T.; Ribbes, F.; Wang, L.-F.; Floury, N.; Ding, K.-H.; Kong, J.A.; Fujita, M.; Kurosu, T. Rice crop mapping and monitoring using ERS-1 data based on experiment and modeling results. IEEE Trans. Geosci. Remote Sens. 1997, 35, 41–56. [Google Scholar] [CrossRef]
  47. Mansaray, R.L.; Huang, W.; Zhang, D.; Huang, J.; Li, J. Mapping Rice Fields in Urban Shanghai, Southeast China, Using Sentinel-1A and Landsat 8 Datasets. Remote Sens. 2017, 9, 257. [Google Scholar] [CrossRef]
  48. Torbick, N.; Chowdhury, D.; Salas, W.; Qi, J. Monitoring Rice Agriculture across Myanmar Using Time Series Sentinel-1 Assisted by Landsat-8 and PALSAR-2. Remote Sens. 2017, 9, 119. [Google Scholar] [CrossRef]
  49. Ferrant, S.; Selles, A.; Le Page, M.; Herrault, P.-A.; Pelletier, C.; Al-Bitar, A.; Mermoz, S.; Gascoin, S.; Bouvet, A.; Saqalli, M.; et al. Detection of Irrigated Crops from Sentinel-1 and Sentinel-2 Data to Estimate Seasonal Groundwater Use in South India. Remote Sens. 2017, 9, 1119. [Google Scholar] [CrossRef]
  50. Mandal, D.; Kumar, V.; Bhattacharya, A.; Rao, Y.S.; Siqueira, P.; Bera, S. Sen4Rice: A Processing Chain for Differentiating Early and Late Transplanted Rice Using Time-Series Sentinel-1 SAR Data with Google Earth Engine. IEEE Geosci. Remote Sens. Lett. 2018, 15, 1947–1951. [Google Scholar] [CrossRef]
  51. Wakamori, K.; Ichikawa, D. The Combined Use of Sentinel-1, Sentinel-2 and Landsat 7&8 Data for Estimating Heading Date of Paddy Rice. In Proceedings of the IGARSS 2018–2018 IEEE International Geoscience and Remote Sensing Symposium, Valencia, Spain, 22–27 July 2018; pp. 7715–7718. [Google Scholar]
  52. Aschbacher, J.; Milagro-Pérez, M.P. The European Earth monitoring (GMES) programme: Status and perspectives. Remote Sens. Environ. 2012, 120, 3–8. [Google Scholar] [CrossRef]
  53. Bacong, P.; Bargellini, P.; Laur, H.; Rosich, B.; Schmuck, S. Sentinel-1 mission operations concept. In Proceedings of the 2012 IEEE International Geoscience and Remote Sensing Symposium, Munich, Germany, 22–27 July 2012; pp. 1745–1748. [Google Scholar]
  54. Clauss, K.; Ottinger, M.; Leinenkugel, P.; Kuenzer, C. Estimating rice production in the Mekong Delta, Vietnam, utilizing time series of Sentinel-1 SAR data. Int. J. Appl. Earth Obs. Geoinf. 2018, 73, 574–585. [Google Scholar] [CrossRef]
  55. Ottinger, M.; Clauss, K.; Kuenzer, C. Opportunities and Challenges for the Estimation of Aquaculture Production Based on Earth Observation Data. Remote Sens. 2018, 10, 1076. [Google Scholar] [CrossRef]
  56. Arai, H.; Takeuchi, W.; Oyoshi, K.; Nguyen, D.L.; Inubushi, K. Estimation of Methane Emissions from Rice Paddies in the Mekong Delta Based on Land Surface Dynamics Characterization with Remote Sensing. Remote Sens. 2018, 10, 1438. [Google Scholar] [CrossRef]
  57. Tuan, L.A.; Minh, H.V.T.; Tuan, D.D.A.; Thao, N.T.P. Baseline Study for Community Based Water Management Project; Mekong Water Governance Program Vietnam: Hanoi, Vietnam, 2015. [Google Scholar]
  58. Dat, Q.T.; Kanchit, L.; Thares, S.; Trung, N.H. Modeling the Influence of River Discharge and Sea Level Rise on Salinity Intrusion in Mekong Delta. In Proceedings of the the 1st EnvironmentAsia International Conference, Bangkok, Thailand, 22–25 March 2011; Volume 35, pp. 685–701. [Google Scholar]
  59. Pokhrel, Y.; Burbano, M.; Roush, J.; Kang, H.; Sridhar, V.; Hyndman, W.D. A Review of the Integrated Effects of Changing Climate, Land Use, and Dams on Mekong River Hydrology. Water 2018, 10, 266. [Google Scholar] [CrossRef]
  60. Torres, R.; Snoeij, P.; Geudtner, D.; Bibby, D.; Davidson, M.; Attema, E.; Potin, P.; Rommen, B.; Floury, N.; Brown, M.; et al. GMES Sentinel-1 mission. Remote Sens. Environ. 2012, 120, 9–24. [Google Scholar] [CrossRef]
  61. Paul, S.; Dirk, G.; Ramón, T.; Malcolm, D.; David, B.; Svein, L. GMES Sentinel-1 System Overview. In Proceedings of the POLinSAR 2013 Workshop Presentations, ESA ESRIN, Frascati, Italy, 28 January–1 February 2013; p. 21. [Google Scholar]
  62. Kaplan, G.; Avdan, U. Monthly Analysis of Wetlands Dynamics Using Remote Sensing Data. ISPRS Int. J. Geo-Inf. 2018, 7, 411. [Google Scholar] [CrossRef]
  63. Numbisi, F.N.; Van Coillie, F.M.B.; De Wulf, R. Delineation of Cocoa Agroforests Using Multiseason Sentinel-1 SAR Images: A Low Grey Level Range Reduces Uncertainties in GLCM Texture-Based Mapping. ISPRS Int. J. Geo-Inf. 2019, 8, 179. [Google Scholar] [CrossRef]
  64. Zhu, J.; Wen, J.; Zhang, Y. A new algorithm for SAR image despeckling using an enhanced Lee filter and median filter. In Proceedings of the 2013 6th International Congress on Image and Signal Processing (CISP), Hangzhou, China, 16–18 December 2013; Volume 1, pp. 224–228. [Google Scholar]
  65. Shamsoddini, A.; Trinder, J.C. Edge-detection-based filter for SAR speckle noise reduction. Int. J. Remote Sens. 2012, 33, 2296–2320. [Google Scholar] [CrossRef]
  66. Jonsson, P.; Eklundh, L. Seasonality extraction by function fitting to time-series of satellite sensor data. IEEE Trans. Geosci. Remote Sens. 2002, 40, 1824–1832. [Google Scholar] [CrossRef]
  67. Nguyen, D.B.; Wagner, W. European Rice Cropland Mapping with Sentinel-1 Data: The Mediterranean Region Case Study. Water 2017, 9, 392. [Google Scholar] [CrossRef]
  68. International Rice Research Institute (IRRI). Rice Knowledge Bank 2015; International Rice Research Institute (IRRI): Los Baños, Philippines, 2015. [Google Scholar]
  69. Tuong, T.P.; Bouman, B.; Mortimer, M. More rice, less waterintegrated approaches for increasing water productivity in irrigated rice-based systems in Asia. Plant Prod. Sci. 2005, 8, 231–241. [Google Scholar] [CrossRef]
  70. Thuy, P.T.; Van Geluwe, S.; Nguyen, V.-A.; Van der Bruggen, B. Current pesticide practices and environmental issues in Vietnam: Management challenges for sustainable use of pesticides for tropical crops in (South-East) Asia to avoid environmental pollution. J. Mater. Cycles Waste Manag. 2012, 14, 379–387. [Google Scholar] [CrossRef]
  71. Le Toan, T.; Beaudoin, A.; Riom, J.; Guyon, D. Relating forest biomass to SAR data. IEEE Trans. Geosci. Remote Sens. 1992, 30, 403–411. [Google Scholar] [CrossRef]
  72. Jiang, T.; Liu, X.; Wu, L. Method for Mapping Rice Fields in Complex Landscape Areas Based on Pre-Trained Convolutional Neural Network from HJ-1 A/B Data. ISPRS Int. J. Geo-Inf. 2018, 7, 418. [Google Scholar] [CrossRef]
  73. Fukuda, S.; Hirosawa, H. Support vector machine classification of land cover: Application to polarimetric SAR data. In Proceedings of the IGARSS 2001. Scanning the Present and Resolving the Future. Proceedings. IEEE 2001 International Geoscience and Remote Sensing Symposium (Cat. No.01CH37217), Sydney, Australia, 9–13 July 2001; Volume 1, pp. 187–189. [Google Scholar]
  74. Abdikan, S. Land cover mapping using sentinel-1 sar data. ISPRS—Int. Arch. Photogramm. Remote Sens. Spat. Inf. Sci. 2016, XLI-B7, 757–761. [Google Scholar] [CrossRef]
  75. Son, N.-T.; Chen, C.-F.; Chen, C.-R.; Minh, V.-Q. Assessment of Sentinel-1A data for rice crop classification using random forests and support vector machines. Geocarto Int. 2018, 33, 587–601. [Google Scholar] [CrossRef]
  76. Küçük, Ç.; Taşkın, G.; Erten, E. Paddy-Rice Phenology Classification Based on Machine-Learning Methods Using Multitemporal Co-Polar X-Band SAR Images. IEEE J. Sel. Top. Appl. Earth Obs. Remote Sens. 2016, 9, 2509–2519. [Google Scholar] [CrossRef]
  77. Kavzoglu, T.; Colkesen, I. A kernel functions analysis for support vector machines for land cover classification. Int. J. Appl. Earth Obs. Geoinf. 2009, 11, 352–359. [Google Scholar] [CrossRef]
  78. Mountrakis, G.; Im, J.; Ogole, C. Support vector machines in remote sensing: A review. ISPRS J. Photogramm. Remote Sens. 2011, 66, 247–259. [Google Scholar] [CrossRef]
  79. Hsu, C.-W.; Chang, C.-C.; Lin, C.-J. A Practical Guide to Support. Vector Classification; Department of Computer Science, National Taiwan University: Taipei City, Taiwan, 2016; p. 16. [Google Scholar]
  80. Achirul Nanda, M.; Boro Seminar, K.; Nandika, D.; Maddu, A. A Comparison Study of Kernel Functions in the Support Vector Machine and Its Application for Termite Detection. Information 2018, 9, 5. [Google Scholar] [CrossRef]
  81. Cortes, C.; Vapnik, V. Support-vector networks. Mach. Learn. 1995, 20, 273–297. [Google Scholar] [CrossRef] [Green Version]
  82. Bayro-Corrochano, E.J.; Arana-Daniel, N. Clifford Support Vector Machines for Classification, Regression, and Recurrence. Trans. Neural Netw. 2010, 21, 1731–1746. [Google Scholar] [CrossRef] [PubMed]
  83. Avtar, R.; Suzuki, R.; Takeuchi, W.; Sawada, H. PALSAR 50 m Mosaic Data Based National Level Biomass Estimation in Cambodia for Implementation of REDD+ Mechanism. PLoS ONE 2013, 8, e74807. [Google Scholar] [CrossRef] [PubMed]
  84. Avtar, R.; Takeuchi, W.; Sawada, H. Full polarimetric PALSAR-based land cover monitoring in Cambodia for implementation of REDD policies. Int. J. Digit. Earth 2013, 6, 255–275. [Google Scholar] [CrossRef]
  85. Aronoff, S. The map accuracy report: A user’s view. Photogramm. Eng. Remote Sens. 1982, 48, 1309–1312. [Google Scholar]
  86. Ginevan, M. Testing land-use map accuracy: Another look. Photogramm. Eng. Remote Sens. 1979, 45, 1371–1377. [Google Scholar]
  87. Congalton, R.G. A Review of Assessing the Accuracy of Classifications of Remotely Sensed Data. Remote Sens. Environ. 1991, 37, 35–46. [Google Scholar] [CrossRef]
  88. Ashby, D. Practical statistics for medical research. Douglas G. Altman, Chapman and Hall, London, 1991. No. of pages: 611. Price: £32.00. Stat. Med. 1991, 10, 1635–1636. [Google Scholar] [CrossRef]
  89. Ludbrook, J. Statistical Techniques for Comparing Measurers and Methods of Measurement: A Critical Review. Clin. Exp. Pharmacol. Physiol. 2002, 29, 527–536. [Google Scholar] [CrossRef] [PubMed]
  90. He, Z.; Li, S.; Wang, Y.; Dai, L.; Lin, S. Monitoring Rice Phenology Based on Backscattering Characteristics of Multi-Temporal RADARSAT-2 Datasets. Remote Sens. 2018, 10, 340. [Google Scholar] [CrossRef]
  91. Rose, J.B.; Epstein, P.R.; Lipp, E.K.; Sherman, B.H.; Bernard, S.M.; Patz, J.A. Climate variability and change in the United States: Potential impacts on water- and foodborne diseases caused by microbiologic agents. Environ. Health Perspect. 2001, 109 (Suppl. 2), 211–221. [Google Scholar] [PubMed]
  92. Oyoshi, K.; Tomiyama, N.; Okumura, T.; Sobue, S.; Sato, J. Mapping rice-planted areas using time-series synthetic aperture radar data for the Asia-RiCE activity. Paddy Water Environ. 2016, 14, 463–472. [Google Scholar] [CrossRef]
  93. Department of Natural Resources and Environment (DONRE). The Result Survey of Land Degradation (Complementary Report); DONRE: Long Xuyen, Vietnam, 2016. [Google Scholar]
  94. Banko, G. A Review of Assessing the Accuracy of Classifications of Remotely Sensed Data and of Methods Including Remote Sensing Data in Forest Inventory; International Institute for Applied Systems Analysis: Laxenburg, Austria, 1998; p. 42. [Google Scholar]
  95. Koppe, W.; Gnyp, M.L.; Hütt, C.; Yao, Y.; Miao, Y.; Chen, X.; Bareth, G. Rice monitoring with multi-temporal and dual-polarimetric TerraSAR-X data. Int. J. Appl. Earth Obs. Geoinf. 2013, 21, 568–576. [Google Scholar] [CrossRef]
  96. Qiu, B.; Li, W.; Tang, Z.; Chen, C.; Qi, W. Mapping paddy rice areas based on vegetation phenology and surface moisture conditions. Ecol. Indic. 2015, 56, 79–86. [Google Scholar] [CrossRef]
Figure 1. Location of the An Giang province in the Vietnamese Mekong Delta. The display of An Giang province in composite image R:G:B by bands (VV:VH:VV/VH) (date: 2017.10.15).
Ijgi 08 00211 g001
Figure 2. Average monthly discharge at Chau Doc station in Bassac River, between 2000 and 2014, and average monthly rainfall, and crop calendar. Discharge and rainfall data were obtained from the Southern Regional Hydro-meteorological Center (SRHMC), Vietnam.
Ijgi 08 00211 g002
Figure 3. Flowchart of Sentinel-1A processing and rice cropping classification.
Ijgi 08 00211 g003
Figure 4. Temporal changes in rice height at 43 locations for different growth stages: (a) triple-rice crop, (b) double-rice crop, and (c) single-rice crop.
Ijgi 08 00211 g004
Figure 5. Multitemporal Sentinel-1A data color composite with training polygons overlaid. R:G:B = HV2017.03.13: HV2017.03.25: HV 2017.04.06.
Ijgi 08 00211 g005
Figure 6. Rice growth stages for (a) triple-rice crop, (b) double-rice crop, and (c) single-rice crop. In the triple- and double-rice crops: (1) harvesting time and (2) soil preparation; 310: summer–autumn season in the triple-rice system and fallow period in the double–rice system; in the single-rice crop: 14 show the vegetable season; 510: autumn–winter season.
Ijgi 08 00211 g006
Figure 7. Growth cycle of rice in summer–autumn in the double-rice crop. The primary vertical axis is σ°VV and the secondary vertical axis is σ°VH. Growth cycle of a rice plant was collected from the International Rice Research Institute (IRRI) [68].
Ijgi 08 00211 g007
Figure 8. Graph representing the multitemporal Sentinel-1A backscattering in the triple rice cropping area. The first vertical axis is σ°VV and the second vertical axis is σ°VH.
Ijgi 08 00211 g008
Figure 9. Graph representing the multitemporal Sentinel-1 A backscattering in the double-rice cropping area. The first vertical axis is σ°VV and the second vertical axis is σ°VH.
Ijgi 08 00211 g009
Figure 10. Graph representing the multitemporal Sentinel-1 A backscattering in the single-rice cropping area. The first vertical axis is σ° VV and the second vertical axis is σ° VH.
Ijgi 08 00211 g010
Figure 11. (a) Sentinel-1A-based land cover classification of An Giang province. (b) Distribution of LULC classes in An Giang.
Ijgi 08 00211 g011
Figure 12. Distribution of various land cover classes and dike system.
Ijgi 08 00211 g012
Table 1. Multitemporal Sentinel-1A data with specification and date of acquisition.
SensorSAR C-band
Product LevelLevel 1 Ground Range Detected (GRD)
Date Acquisition
(YYYY.MM.DD)
2017.03.13; 2017.03.25; 2017.04.06; 2017.04.18; 2017.04.30; 2017.05.12; 2017.05.24; 2017.06.05; 2017.06.17; 2017.06.29; 2017.07.11; 2017.07.23; 2017.08.04; 2017.08.16; 2017.08.28; 2017.09.09; 2017.09.21; 2017.10.03; 2017.10.15; 2017.10.27; 2017.11.08; 2017.11.20; 2017.12.02; 2017.12.14; 2017.12.26; 2018.01.07; 2018.01.19; 2018.01.31; 2018.02.12; 2018.02.24; 2018.03.08; 2018.03.20
Frequency (GHz)5.405
Image ModeInterferometric Wide swath (IW)
PolarizationDual VV + VH
Table 2. District level distribution of various land use/land cover (LULC) classes.
DistrictSingle-Rice Cropping Area (sq km)Double-Rice Cropping Area (sq km)Triple-Rice Cropping Area (sq km)Plantation Area (sq km)Others Area (sq km)
An Phu11.1 88.3 72.1 34.0 14.4
Chau Phu28.2 119.3 235.5 48.0 20.4
Chau Thanh5.9 38.1 266.1 34.7 9.9
Cho Moi17.0 46.2 118.0 150.4 38.1
Chau Doc4.0 14.9 63.0 13.7 7.0
Long Xuyen3.0 48.2 14.6 31.3 17.1
Phu Tan20.3 88.2 159.0 37.6 21.5
Tan Chau9.4 51.0 61.6 31.216.7
Tinh Bien74.1 114.0 70.9 51.9 40.9
Thoai Son5.0 23.6 392.939.1 7.5
Tri Ton80.5 238.7 188.1 45.4 45.6
Total258.5 870.4 1641.9 517.2 239.1
Table 3. Confusion matrix for accuracy assessment.
ClassifiedGround Survey
MountainBuilt-UpWaterSingle-Rice CropDouble-Rice CropTriple-Rice CropForestPlantationTotalUser’s Accuracy (%)
Mountain1100000111384.6
Built-up090200001181.8
Water0018002002090.0
Single-rice Crop0201210001580.0
Double-rice Crop0010183002281.8
Triple-rice Crop0020320012676.9
Forest2000001521978.9
Plantation1001002101471.4
Total1411211522251814140
Producer’s Accuracy (%)78.681.885.780.081.880.083.371.4

