Navigation in Indoor Environments: Does the Type of Visual Learning Stimulus Matter?


Abstract
:1. Introduction
2. Related Work
2.1. TASK: Navigation
2.2. STIMULI: Realism vs. Abstraction
2.3. PARTICIPANTS: Spatial Abilities, Expertise and Gender
2.4. Analyzing Navigation Performance
3. Materials and Methods
3.1. Experimental Design
3.1.1. Personal Profile
3.1.2. Intro Stage
3.1.3. Learning Stage
3.1.4. Before Navigation Stage
3.1.5. Navigation
3.1.6. After Navigation Stage
3.2. Determination of Experimental Hypotheses
3.3. Participants
4. Results
5. Discussion
6. Conclusions and Future Work
Supplementary Materials
Author Contributions
Funding
Acknowledgments
Conflicts of Interest
References
- Directive 2014/24/EU of the European Parliament and of the Council of 26 February 2014 on Public Procurement and Repealing. Available online: https://eur-lex.europa.eu/legal-content/EN/TXT/?uri=celex%3A32014L0024 (accessed on 19 November 2018).
- Kinateder, M.; Ronchi, E.; Nilsson, D.; Kobes, M.; Müller, M.; Pauli, P.; Mühlberger, A. Virtual Reality for Fire Evacuation Research. In Proceedings of the Federated Conference on Computer Science and Information Systems, Warsaw, Poland, 7–10 September 2014; Krasuski, A., Rein, G., Eds.; IEEE—Institute of Electrical and Electronics Engineers Inc.: Piscataway, NJ, USA, 2014; Volume 2, pp. 313–321. [Google Scholar]
- Šašinka, Č. Interindividual Differences in Perception of Space and Maps. Ph.D. Thesis, Masaryk University, Brno, Czech Republic, 2012; 210p. (In Czech). [Google Scholar]
- Çöltekin, A.; Lokka, I.; Zahner, M. On the usability and usefulness of 3D (geo)visualizations—A focus on virtual reality environments. In Proceedings of the ISPRS Archives of the Photogrammetry, Remote Sensing and Spatial Information Sciences, Prague, Czech Republic, 12–19 July 2016; Volume XLI-B2. [Google Scholar]
- Montello, D.R. Cognitive map-design research in the twentieth century: Theoretical and empirical approaches. Cartogr. Geogr. Inf. Sci. 2002, 29, 283–304. [Google Scholar] [CrossRef]
- MacEachren, A.M. Application of environmental learning theory to spatial knowledge acquisition from maps. Ann. Am. Assoc. Geogr. 1992, 82, 245–274. [Google Scholar] [CrossRef]
- Siegel, A.W.; White, S.H. The Development of Spatial Representations of Large-Scale Environments. Adv. Child Dev. Behav. 1975, 10, 9–55. [Google Scholar] [CrossRef]
- Stankiewicz, B.J.; Kalia, A.A. Acquisition of structural versus object landmark knowledge. J. Exp. Psychol. Hum. Percept. Perform. 2007, 33, 378–390. [Google Scholar] [CrossRef]
- Hillier, B.; Leaman, A.; Stansall, P.; Bedford, M. Space syntax. Environ. Plan B 1976, 32, 147–185. [Google Scholar] [CrossRef]
- Hillier, B.; Iida, S. Network effects and psychological effects: A theory of urban movement. In Proceedings of the 5th International Symposium on Space Syntax, Delft, The Netherlands, 13–17 June 2005; Volume 1, pp. 553–564. [Google Scholar]
- Dalton, C.R. The secret is to follow your nose: Route path selection and angularity. Environ. Behav. 2003, 35, 107–131. [Google Scholar] [CrossRef]
- Bailenson, J.N.; Shum, M.S.; Uttal, D.H. The initial segment strategy: A heuristic for route selection. Mem. Cognit. 2000, 28, 306–318. [Google Scholar] [CrossRef] [Green Version]
- Emo, B. Choice zones: Architecturally relevant areas of interest. Spat. Cogn. Comput. 2018, 3, 173–193. [Google Scholar] [CrossRef]
- Montello, D.R. The contribution of space syntax to a comprehensive theory of environmental psychology. In Proceedings of the 6th International Space Syntax Symposium, Istanbul, Turkey, 12–15 June 2007. [Google Scholar]
- Bahm, C.R.; Hirtle, S.C. Cognition for the navigation of complex Indoor environments. In Indoor Wayfinding and Navigation; CRC Press: Boca Raton, FL, USA, 2001; pp. 1–12. ISBN 9781482230857. [Google Scholar]
- Gwynne, S.; Galea, E.R.; Owen, M.; Lawrence, P.J.; Filippidis, L. A review of the methodologies used in the computer simulation of evacuation from the built environment. Build. Environ. 1999, 34, 741–749. [Google Scholar] [CrossRef]
- Vorst, H.C.M. Evacuation Models and Disaster Psychology. Proceed. Eng. 2010, 3, 15–21. [Google Scholar] [CrossRef]
- Evans, G.W.; Pezdek, K. Cognitive mapping: Knowledge of real-world distance and location information. J. Exp. Psychol. Hum. Lear Mem. 1980, 6, 13–24. [Google Scholar] [CrossRef]
- Thorndyke, P.W.; Hayes-Roth, B. Differences in spatial knowledge acquired from maps and navigation. Cogn. Psychol. 1982, 14, 560–589. [Google Scholar] [CrossRef]
- MacEachren, A.M. An Evolving Cognitive-Semiotic Approach to Geographic Visualization and Knowledge Construction. IDJ 2001, 10, 26–36. [Google Scholar] [CrossRef]
- Maceachren, A.M.; Edsall, R.; Haug, D.; Baxter, R.; Otto, G.; Masters, M.; Fuhrmann, S.; Qian, L. Virtual Environments for Geographic Visualization: Potential and Challenges. In Proceedings of the 8th International Conference on Information and Knowledge Management, Kansas City, MO, USA, 2 November 1999; pp. 35–40. [Google Scholar]
- St. John, M.; Cowen, M.B.; Smallman, H.S.; Oonk, H.M. The use of 2D and 3D displays for shape understanding vs. relative position tasks. Hum. Factors 2001, 79–98. [Google Scholar] [CrossRef]
- Wilkening, J. Maps users’ preferences and performance under time pressure. In Proceedings of the 6th International Conference on Geographic Information Science, Zurich, Switzerland, 14–17 September 2010; pp. 1–7. [Google Scholar]
- Griffin, A.L.; Fabrikant, S.I. More maps, more users, more devices means more cartographic challenges. Cartogr. J. 2012, 46, 298–301. [Google Scholar] [CrossRef]
- Boér, A.; Çöltekin, A.; Clarke, K.C. An Evaluation of Web-based Geovisualizations for Different Levels of Abstraction and Realism—What do users predict? In Proceedings of the 26th International Cartographic Conference—From Pole to Pole, Dresden, Germany, 25–30 August 2013. [Google Scholar] [CrossRef]
- Juřík, V.; Herman, L.; Šašinka, Č.; Stachoň, Z.; Chmelík, J. When the Display Matters: A Multifaceted Perspective on 3D Geovisualizations. Open Geosci. 2017, 9, 89–100. [Google Scholar] [CrossRef]
- Juřík, V.; Herman, L.; Šašinka, Č. Interaction Primitives in 3D Geovisualizations. In Proceedings of the 25th Central European Conference, Useful Geography: Transfer from Research to Practice, Brno, Czech Republic, 12–13 October 2017; pp. 294–303. [Google Scholar]
- Herman, L.; Juřík, V.; Stachoň, Z.; Vrbík, D.; Russnák, J.; Řezník, T. Evaluation of User Performance in Interactive and Static 3D Maps. ISPRS Int. J. Geoinf. 2018, 7, 415. [Google Scholar] [CrossRef]
- Loomis, J.M.; Blascovich, J.J.; Beall, C. Immersive virtual environment technology as a basic research tool in psychology. Behav. Res. Meth. Instrum. Comp. 1999, 31, 557–564. [Google Scholar] [CrossRef] [Green Version]
- Dennehy, M.T.; Nesbitt, D.W.; Sumey, R.A. Real-time three-dimensional graphics display for antiair warfare command and control. Johns Hopkins APL Tech. Dig. 1994, 15, 110–119. [Google Scholar]
- Mania, K.; Chalmers, A. The effects of levels of immersion on memory and presence in virtual environments: A reality centered approach. CyberPsych. Behav. 2001, 4, 247–264. [Google Scholar] [CrossRef]
- Höffler, T.N. Spatial ability: Its influence on learning with visualizations—A meta-analytic review. Educ. Psychol. Rev. 2010, 22, 245–269. [Google Scholar] [CrossRef]
- Borkin, M.; Vo, A.A.; Bylinskii, Z.; Isola, P.; Sunkavalli, S.; Oliva, A.; Pfister, H. What makes a visualization memorable? IEEE Trans. Vis. Comput. Gr. 2013, 19, 2306–2315. [Google Scholar] [CrossRef] [PubMed]
- Kattenbeck, M. Empirically Measuring Salience of Objects for Use in Pedestrian Navigation. In Proceedings of the 23rd SIGSSPATIAL International Conference on Advances in Geographic Information Systems, Seattle, WA, USA, 3–6 November 2015. [Google Scholar]
- Juřík, V.; Herman, L.; Šašinka, Č.; Stachoň, Z.; Chmelík, J.; Strnadová, A.; Kubíček, P. Behavior Analysis in Virtual Geovisualizations: Towards Ecological Validity. In Proceedings of the 7th International Conference on Cartography and GIS, Sofia, Bulgaria, 18–23 June 2018; Bandrova, T., Konečný, M., Eds.; Bulgarian Cartographic Association: Sofia, Bulgaria, 2018; Volume 1, pp. 518–527. [Google Scholar]
- MacEachren, A.M. How Maps Work; The Guilford Press: New York, NY, USA, 1995; 513p, ISBN 978-1572300408. [Google Scholar]
- Cowan, N. The magical number 4 in short-term memory: A reconsideration of mental storage capacity. Behav. Brain Sci. 2001, 24, 87–114; discussion 114–185. [Google Scholar] [CrossRef]
- Shepherd, I.D.H. Travails in the third dimension: A critical evaluation of three-dimensional geographical visualization. In Geographic Visualization: Concepts, Tools and Applications; Dodge, M., McDerby, M., Turner, M., Eds.; Wiley: Chichester, UK, 2008; pp. 199–210. [Google Scholar]
- Seipel, S. Evaluating 2D and 3D geovisualisations for basic spatial assessment. Behav. Inf. Tech. 2013, 32, 845–858. [Google Scholar] [CrossRef]
- Bertin, J. Semiology of Graphics: Diagrams, Networks, Maps; Translated by Berg, W.J.; University of Wisconsin Press: Madison, WI, USA, 1983; p. 415. [Google Scholar]
- Lowe, R.K. Selectivity in diagrams: Reading beyond the lines. Educ. Psychol. 1994, 14, 467–491. [Google Scholar] [CrossRef]
- Tufte, E.R. The Visual Display of Quantitative Information; Graphics Press: Cheshire, CT, USA, 1983. [Google Scholar]
- Sanchez, C.H.A.; Branaghan, R.J. The Interaction of Map Resolution and Spatial Abilities on Map Learning. Int. J. Hum. Comp. Stud. 2009, 67, 475–481. [Google Scholar] [CrossRef]
- Smallman, H.S.; St. John, M. Naïve Realism: Misplaced faith in the utility of realistic displays. Ergon. Des. 2005, 13, 6–13. [Google Scholar] [CrossRef]
- Smallman, H.S.; Cook, M.B. Naïve Realism: Folk Fallacies in the Design and Use of Visual Displays. Top Cogn. Sci. 2010, 579–608. [Google Scholar] [CrossRef]
- Hegarty, M.; Smallman, H.S.; Stull, A.T.; Canham, M. Naive Geography: How Intuitions about Display Configuration Can Hurt Performance. Cartographica 2009, 44, 171–186. [Google Scholar] [CrossRef]
- Kray, C.; Coors, V.; Elting, C.; Laakso, K. Presenting Route Instructions on Mobile Devices. In Proceedings of the 8th International Conference on Intelligent User Interfaces, Miami, FL, USA, 12–15 January 2003. [Google Scholar] [CrossRef]
- Fabrikant, S.I.; Lobben, A. Introduction: Cognitive Issues in Geographic Information Visualization. Cartographica 2009, 44, 139–143. [Google Scholar] [CrossRef] [Green Version]
- Wilkening, J.; Fabrikant, S.I. The Effect of Gender and Spatial Abilities on Map Use Preferences and Performance in Road Selection Tasks. In Proceedings of the 25th International Cartographic Conference, International Cartographic Association, Paris, France, 3–8 July 2011. [Google Scholar]
- Lokka, I.E.; Çöltekin, A. Toward optimizing the design of virtual environments for route learning: Empirically assessing the effects of changing levels of realism on memory. Int. J. Digit. Earth 2019, 12, 137–155. [Google Scholar] [CrossRef]
- Lei, T.C.; Wu, S.C.; Chao, C.W.; Lee, S.H. Evaluating differences in spatial visual attention in wayfinding strategy when using 2D and 3D electronic maps. GeoJ. 2014, 81, 153–167. [Google Scholar] [CrossRef]
- Bleisch, S.; Dykes, J. Quantitative data graphics in 3D desktop-based virtual environments—An evaluation. Int. J. Digit. Earth 2015, 8, 623–639. [Google Scholar] [CrossRef]
- Liao, H.; Dong, W.; Peng, C.; Liu, H. Exploring differences of visual attention in pedestrian navigation when using 2D maps and 3D geo-browsers. Cartogr. Geogr. Inf. Sci. 2017, 44, 474–490. [Google Scholar] [CrossRef]
- Stachoň, Z.; Kubíček, P.; Málek, F.; Krejčí, M.; Herman, L. The Role of Hue and Realism in Virtual Reality. In Proceedings of the 7th International Conference on Cartography and GIS, Sofia, Bulgaria, 18–23 June 2018; Bandrova, T., Konečný, M., Eds.; Bulgarian Cartographic Association: Sofia, Bulgaria, 2018; Volume 2, pp. 932–941. [Google Scholar]
- Ishikawa, T.; Yamazaki, T. Showing where to go by maps or pictures: An empirical case study at subway exits. In Spatial Information Theory. COSIT 2009; Hornsby, K.S., Claramunt, C., Denis, M., Ligozat, G., Eds.; LNCS; Springer: Berlin/Heidelberg, Germany, 2009; Volume 5756, pp. 330–341. [Google Scholar] [CrossRef]
- De Cock, L.; Viaene, P.; Ooms, K.; Van de Weghe, N.; Mi-chels, R.; De Wulf, A.; Vanhaeren, N.; De Maeyer, P. Comparing written and photo-based indoor wayfinding instructions through eye fixation measures and user ratings as mental effort assessments. J. Eye Mov. Res. 2019, 12. [Google Scholar] [CrossRef]
- Boumenir, Y.; Georges, F.; Rebillard, G.U.Y.; Valentin, J.; Dresp-Langley, B. Wayfinding through an unfamiliar environment. Percept Mot. Skills 2010, 111, 829–847. [Google Scholar] [CrossRef]
- Schnitzler, V.; Giannopoulos, I.; Hölscher, C.; Barisic, I. The interplay of pedestrian navigation, wayfinding devices, and environmental features in indoor settings. In Proceedings of the 2016 Symposium on Eye Tracking Research & Applications (ETRA ‘16), Charleston, SC, USA, 14–17 March 2016; ACM: New York, NY, USA, 2016; pp. 85–93. [Google Scholar] [Green Version]
- Golledge, R.G.; Jacobson, R.D.; Kitchin, R.; Blades, M. Cognitive Maps, Spatial Abilities and Human Wayfinding. Geogr. Rev. Jpn. 2000, 73, 93–104. [Google Scholar] [CrossRef]
- Liao, H.; Dong, W. An Exploratory Study Investigating Gender Effects on Using 3D Maps for Spatial Orientation in Wayfinding. ISPRS Int. J. Geo-Inf. 2017, 6, 60. [Google Scholar] [CrossRef]
- Pellegrino, J.W.; Golledge, R.G.; Gale, N.D.; Ruggles, A. Effects of route complexity, age and gender on route learning processes. In Integrating Spatial Knowledge: The Transition from Landmark to Route to Configurational Knowledge; Golledge, R.G., Pellegrino, J.W., Gale, N., Doherty, S., Eds.; University of California: Santa Barbara, CA, USA, 1990; pp. 224–243. [Google Scholar]
- Lokka, I.E.; Çöltekin, A.; Wiener, J.M.; Fabrikant, S.I.; Röcke, C. Virtual environments as memory training devices in navigational tasks for older adults. Sci. Rep. 2018, 8. [Google Scholar] [CrossRef]
- Kozhevnikov, M. Cognitive styles in the context of modern psychology: Toward an integrated framework of cognitive style. Psychol. Bull. 2007, 133, 464–481. [Google Scholar] [CrossRef]
- Blazhenkova, O.; Kozhevnikov, M. The New Object-Spatial-Verbal Cognitive Style Model: Theory and Measurement. Appl. Cogn. Psychol. 2008, 23, 638–663. [Google Scholar] [CrossRef]
- Štěrba, Z.; Šašinka, Č.; Stachoň, Z.; Štampach, R.; Morong, K. Selected Issues of Experimental Testing in Cartography; Masaryk University: Brno, Czech Republic, 2015; 120p, ISBN 978-80-210-7893-2. [Google Scholar]
- Čížková, K. The Differences in Spatial Knowledge Acquired during Wayfinding in Nature between Spatial and Object Visualizers. Ph.D. Thesis, Masaryk University, Brno, Czech Republic, 2016; p. 98. (In Czech). [Google Scholar]
- Šašinka, Č.; Stachoň, Z.; Kubíček, P.; Tamm, S.; Matas, A.; Kukaňová, M. The Impact of Global/Local Bias on Task-solving in Map-related Tasks Employing Extrinsic and Intrinsic Visualization of Risk Uncertainty Maps. Cartogr. J. 2018, 1–17. [Google Scholar] [CrossRef]
- Roth, R.E. Quantitative versus Qualitative user research: Selecting the right approach. In Proceedings of the Training workshop on Designing and conducting user studies Module 2, Albena, Bulgaria, 13–17 June 2016. [Google Scholar]
- Roth, R.E.; Çöltekin, A.; Delazari, L.; Filho, H.F.; Griffin, A.; Hall, A.; Korpi, J.; Lokka, I.; Mendonça, A.; Ooms, K.; et al. User studies in cartography: Opportunities for empirical research on interactive maps and visualizations. Int. J. Cartogr. 2017, 3 (Suppl. 1), 61–89. [Google Scholar] [CrossRef]
- Just, M.A.; Carpenter, P.A. A theory of reading: From eye fixations to comprehension. Psychol. Rev. 1980, 87, 329–354. [Google Scholar] [CrossRef]
- Foulsham, T.; Underwood, G. What can saliency models predict about eye movements? Spatial and sequential aspects of fixations during encoding and recognition. J. Vis. 2008, 8, 1–17. [Google Scholar] [CrossRef]
- Viaene, P.; Vansteenkiste, P.; Lenoir, M.; De Wulf, A.; De Maeyer, P. Examining the validity of the total dwell time of eye fixations to identify landmarks in a building. J. Eye Mov. Res. 2016, 9, 1–11. [Google Scholar] [CrossRef]
- Van Gog, T.; Kester, L.; Nievelstein, F.; Giesbers, B.; Paas, F. Uncovering cognitive processes: Different techniques that can contribute to cognitive load research and instruction. Comp. Hum. Behav. 2009, 25, 325–331. [Google Scholar] [CrossRef]
- Williams, A.M.; Davids, K. Assessing cue usage in performance contexts: A comparison between eye-movement and concurrent verbal report methods. Behav. Res. Methods Instrum. Comp. 1997, 29, 364–375. [Google Scholar] [CrossRef]
- Sorrows, M.; Hirtle, S. The nature of landmarks for real and electronic spaces. In Proceedings of the International Conference on Spatial Information Theory, in Cognitive Computing Found GIS, Morro Bay, CA, US, 19–23 September 1999; pp. 37–50. [Google Scholar] [CrossRef]
- Popelka, S.; Brychtová, A. Eye-tracking Study on Different Perception of 2D and 3D Terrain Visualisation. Cartogr. J. 2013, 50, 240–246. [Google Scholar] [CrossRef]
- Ourique, L.; Eloy, S.; Resende, R.; Dias, M.S.; Pedro, T.; Migel, R.; Marques, S. Spatial perception of landmarks assessed by objective tracking of people and Space Syntax techniques. In Proceedings of the 11th Space Syntax Symposium, Lisbon, Portugal, 3–7 July 2017; pp. 2086–2101. [Google Scholar]
- Richter, K.; Winter, S. Landmarks; Springer: Cham, Switzerland; Heidelberg, Germany; New York, NY, USA; Dordrecht, The Netherlands; London, UK, 2014. [Google Scholar] [CrossRef]
- Van Elzakker, C.P.J.M. The Use of Maps in The Exploration of Geographic Data. Ph.D. Thesis, Utrecht University, Utrecht, The Netherlands, 2004. [Google Scholar]
- Mehl, M.R. Quantitative Text Analysis. In Handbook of Multimethod Measurement in Psychology; Eid, M., Diener, E., Eds.; American Psychological Association: Washington, DC, USA, 2006; pp. 141–156. [Google Scholar] [CrossRef]
- Duckham, M.; Winter, S.; Robinson, M. Including landmarks in routing instructions. J. LBS 2010, 4, 28–52. [Google Scholar] [CrossRef]
- Ohm, C.; Manuel, M.; Ludwig, B.; Bienk, S. Where is the Landmark? Eye Tracking Studies in Large-Scale Indoor Environments. In Proceedings of the 2nd International Workshop on Eye Tracking for Spatial Research, Volume I, Vienna, Austria, 23 September 2014; pp. 47–51. [Google Scholar]
- Agrawala, M. Visualizing Route Maps. Ph.D. Thesis, Stanford University, Stanford, CA, USA, January 2002. [Google Scholar]
- Kim, H.; Hirtle, S.C. Spatial metaphors and disorientation in hypertext browsing. Behav. Inf. Tech. 1995, 14, 239–250. [Google Scholar] [CrossRef]
- Griffin, A.L.; White, T.; Fish, C.; Tomio, B.; Huang, H.; Sluter, C.R.; Bravo, J.V.M.; Fabrikant, I.; Bleisch, S.; Yamada, M.; et al. Designing across map use contexts: A research agenda. Int. J. Cartogr. 2017, 3 (Suppl. 1), 90–114. [Google Scholar] [CrossRef]
- Ohmi, M. Egocentric perception through interaction among many sensory systems. Cognit. Brain Res. 1996, 5, 87–96. [Google Scholar] [CrossRef]
- Kettunen, P.; Sarjakoski, T.; Sarjakoski, L.T. Elements of Geospatial Images to Support Cognitive Tasks in Wayfinding. In Proceedings of the 27th International Cartographic Conference, Rio de Janeiro, Brazil, 23–28 August 2015. [Google Scholar]
- Shapiro, S.S.; Wilk, M.B. An analysis of variance test for normality (complete samples). Biometrika 1965, 52, 591–611. [Google Scholar] [CrossRef]
- Welch, B.L. The generalization of “Student’s” problem when several different population variances are involved. Biometrika 1947, 34, 28–35. [Google Scholar] [CrossRef]
- Mann, H.B.; Whitney, D.R. On a Test of Whether one of Two Random Variables is Stochastically Larger than the Other. Ann. Math. Stat. 1947, 18, 50–60. [Google Scholar] [CrossRef]
- Wilcoxon, F. Individual comparisons by ranking methods. Biometr. Bull. 1945, 1, 80–83. [Google Scholar] [CrossRef]
- Cohen, J. A power primer. Psychol. Bull. 1992, 112, 155–159. [Google Scholar] [CrossRef]
- Tukey, J.W. Exploratory Data Analysis; Addison-Wesley Publishing Company: Don Mills, ON, Canada, 1977; 688p, ISBN 978-0-201-07616-5. [Google Scholar]
- Bao, F.; Yan, D.M.; Mitra, N.J.; Wonka, P. Generating and exploring good building layouts. ACM Trans. Gr. 2013, 32, 122. [Google Scholar] [CrossRef]


| MED | MEAN | MIN | MAX | SD | ||
|---|---|---|---|---|---|---|
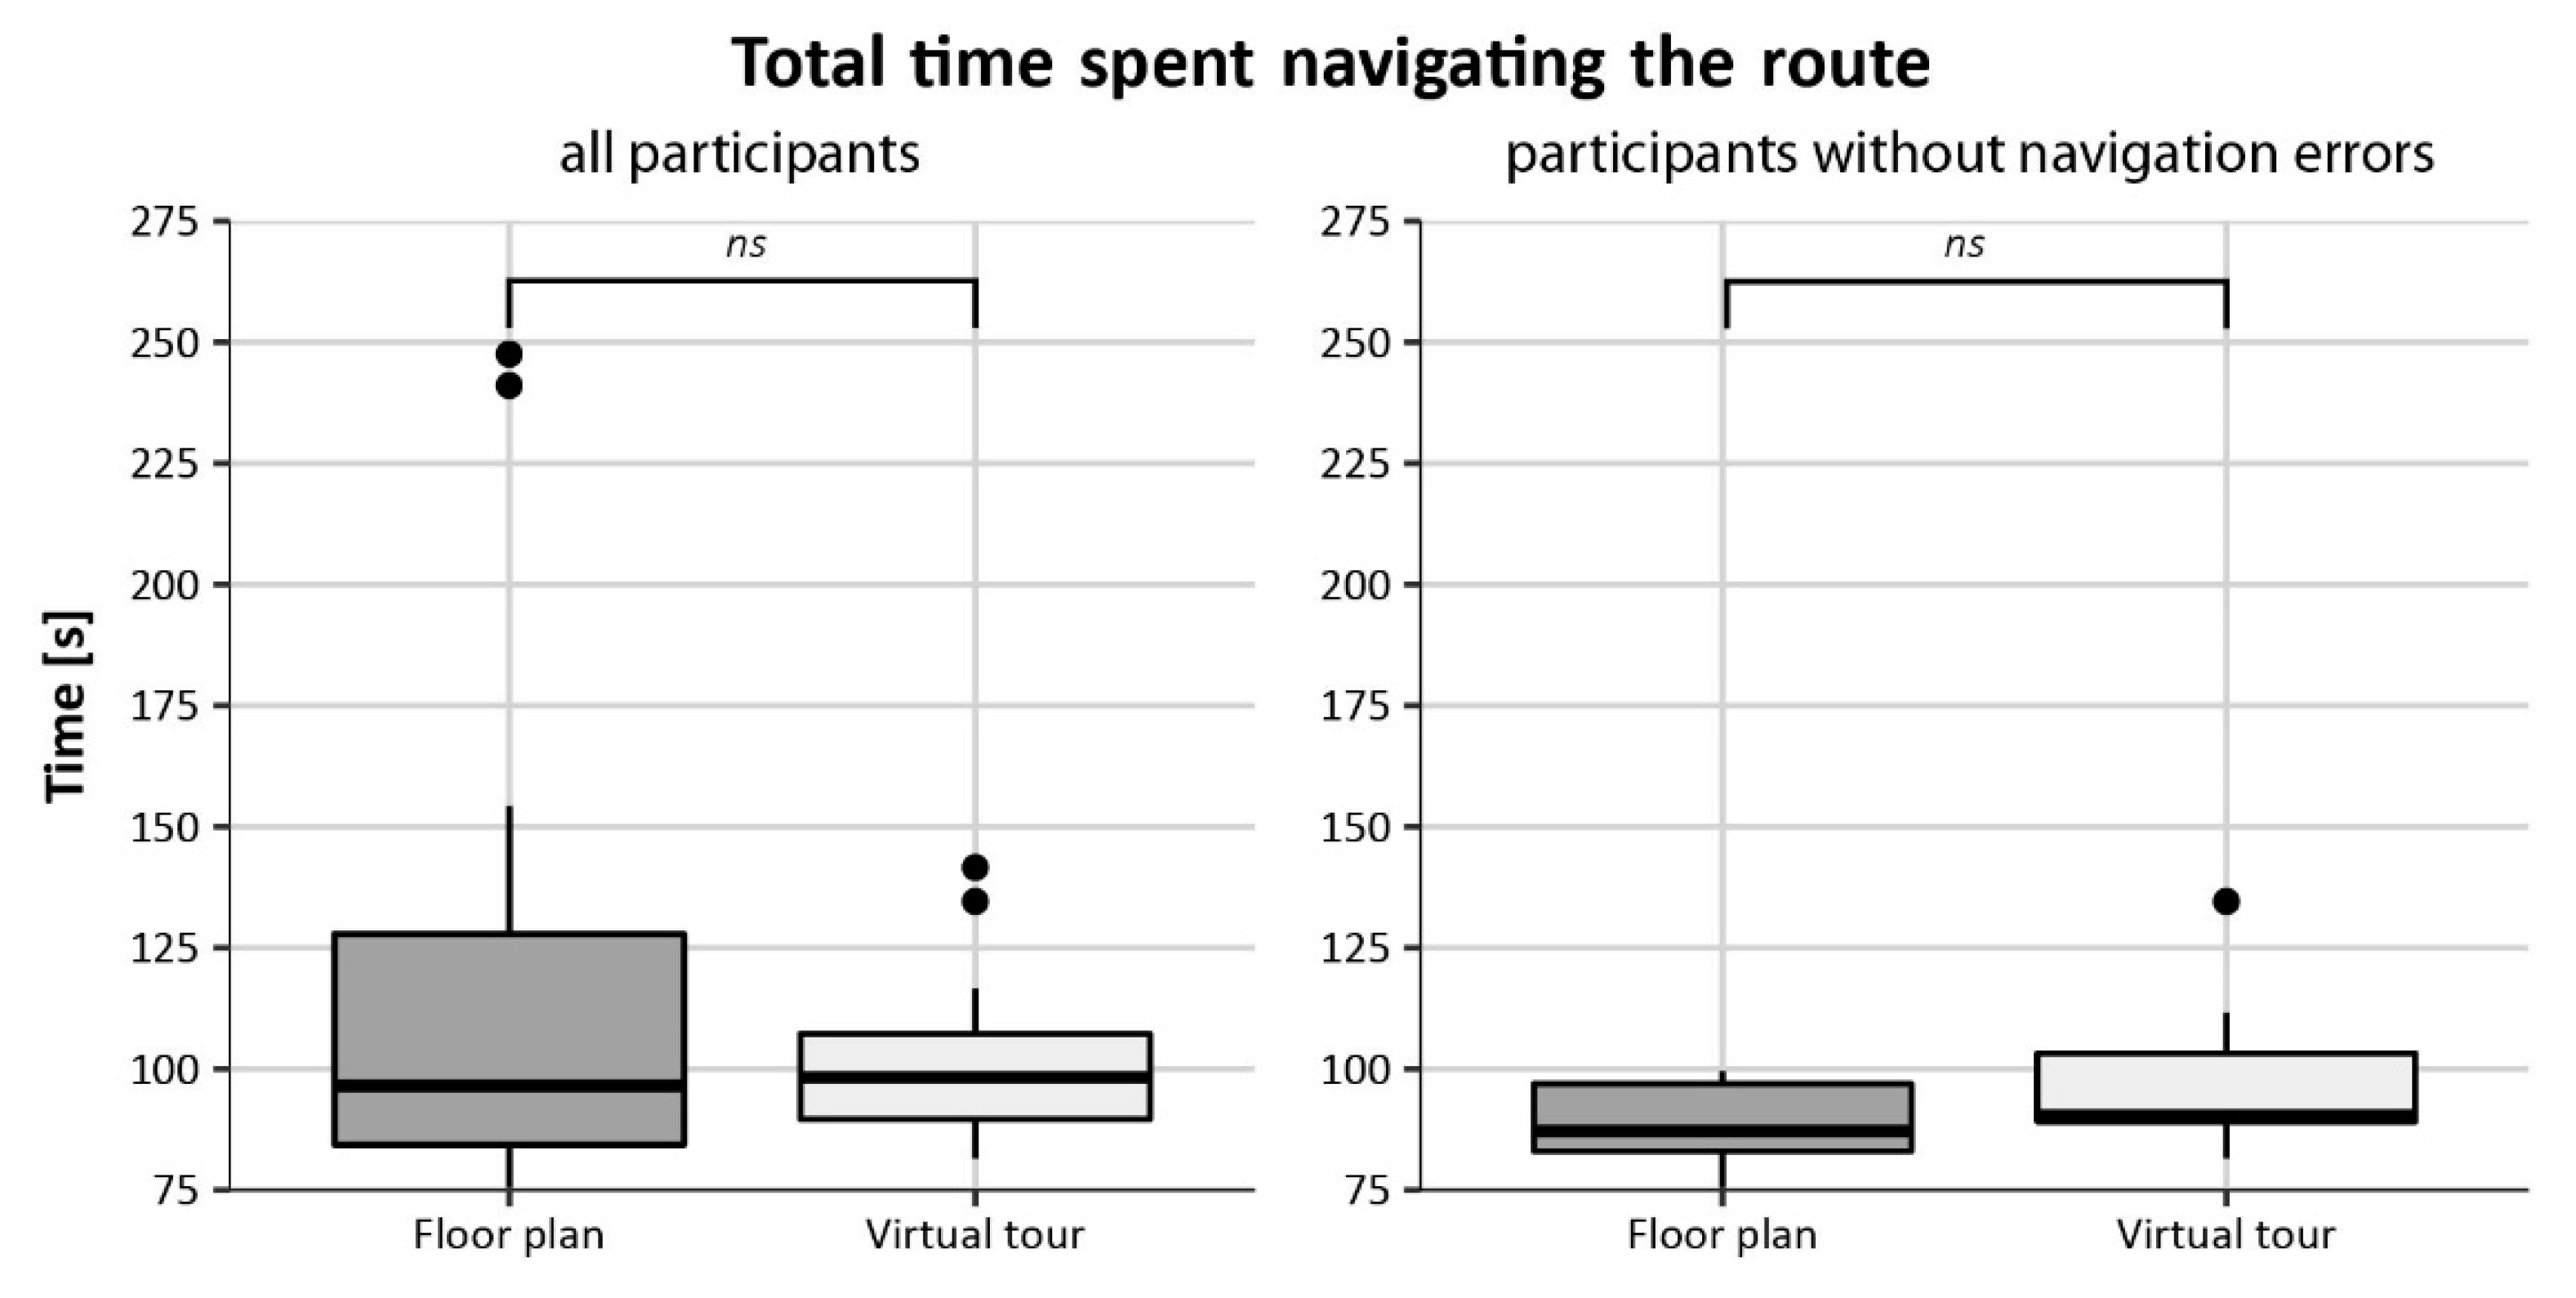
| Time spent [s] | FP | 95.56 | 115.11 | 74.23 | 247.54 | 53.74 |
| VT | 98.21 | 100.81 | 81.56 | 141.60 | 16.48 | |
| Time spent (p. without nav. errors) [s] | FP | 85.07 | 87.46 | 74.23 | 99.55 | 9.37 |
| VT | 90.45 | 97.06 | 81.56 | 134.59 | 14.02 | |
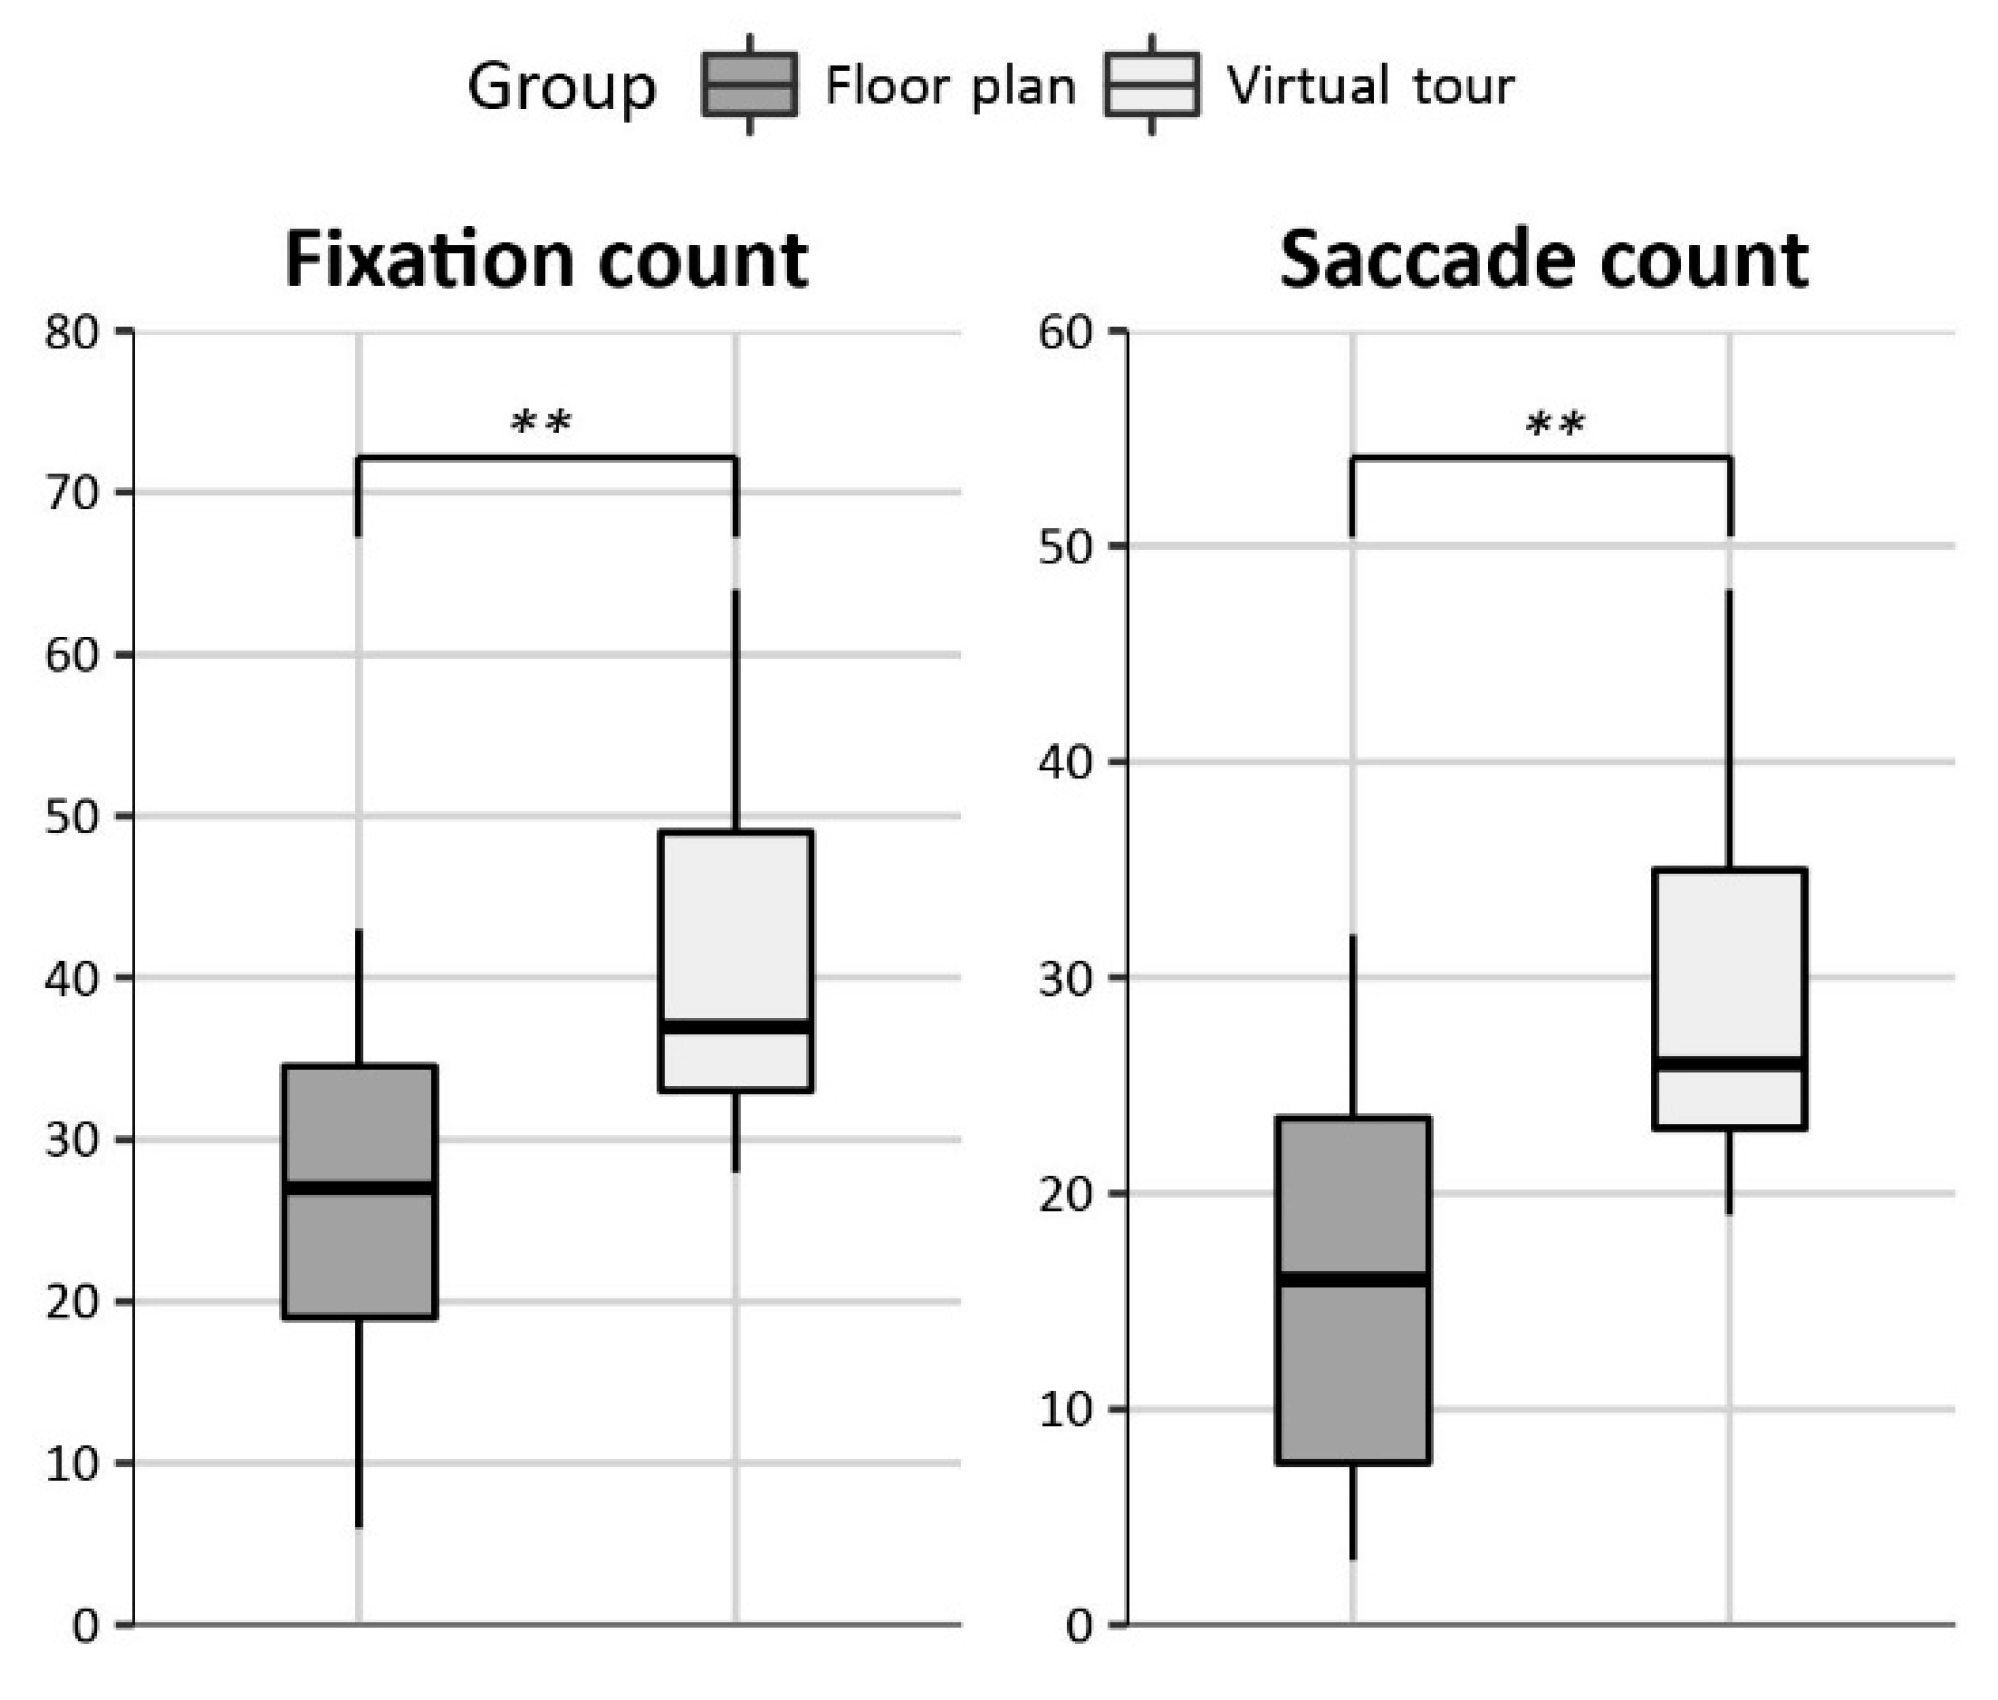
| Fixation count | FP | 27 | 26 | 6 | 43 | 12 |
| VT | 37 | 41 | 28 | 64 | 11 | |
| Saccade count | FP | 16 | 17 | 3 | 32 | 10 |
| VT | 26 | 29 | 19 | 48 | 9 | |
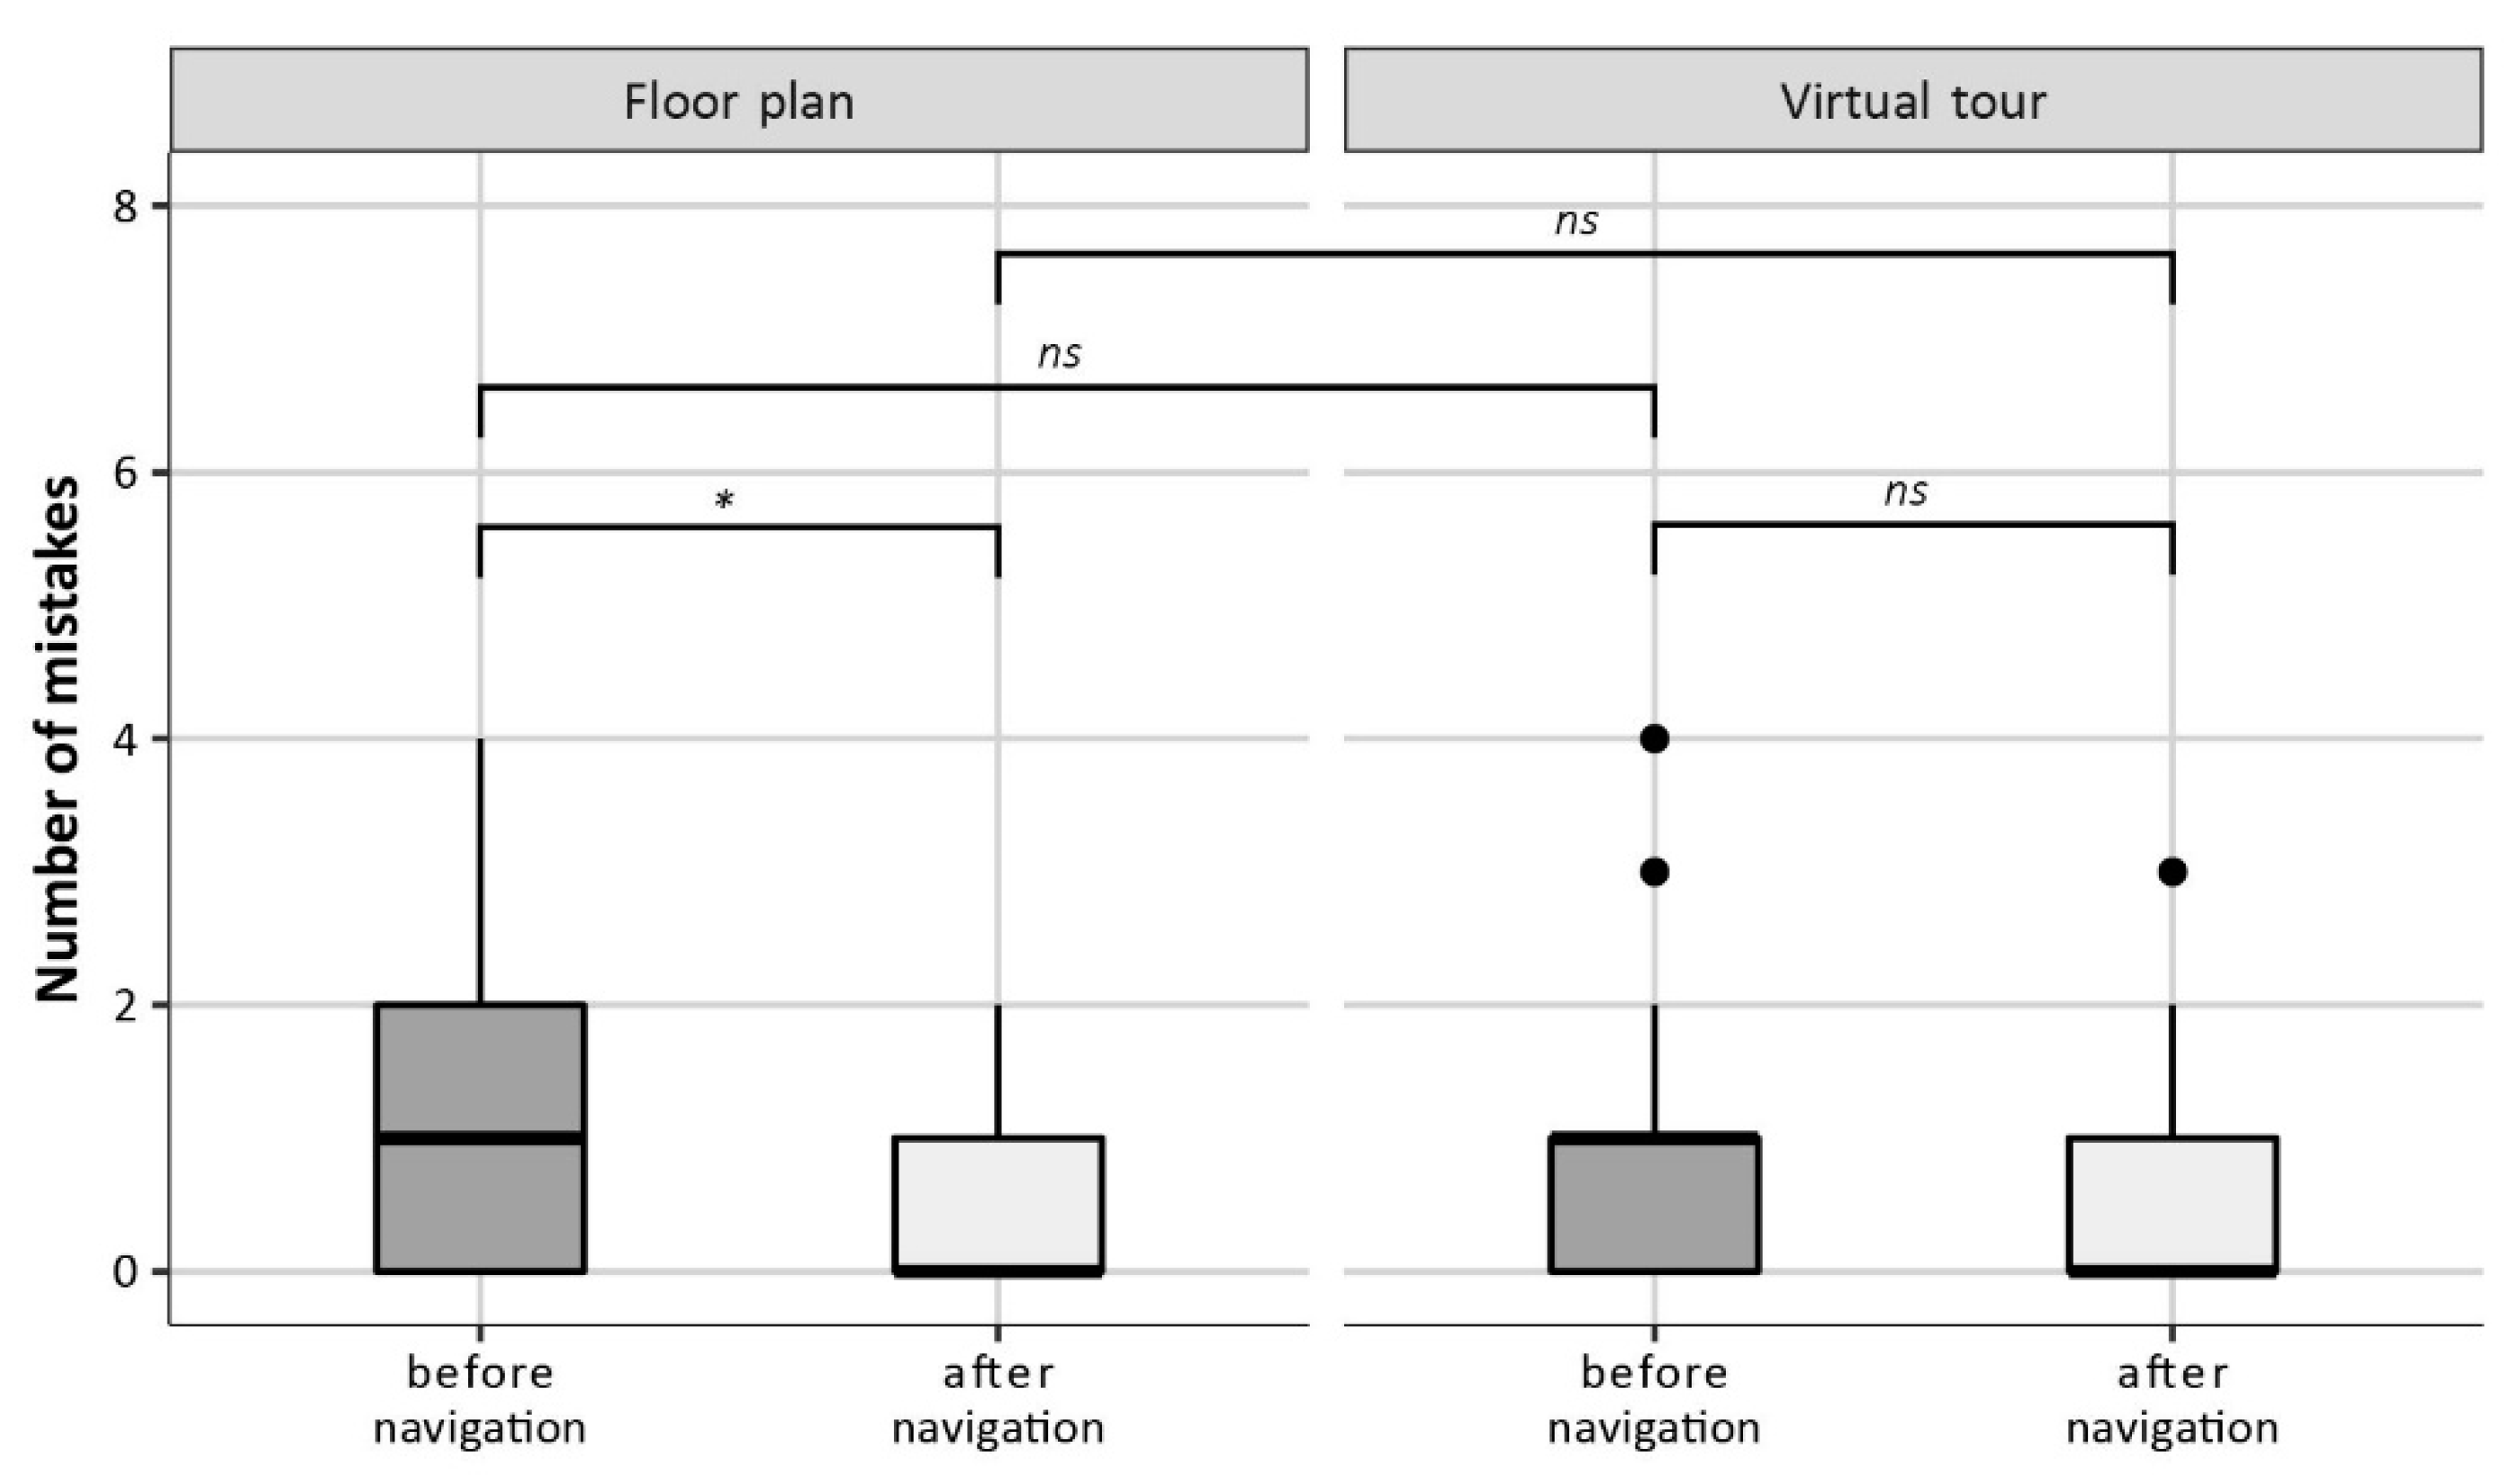
| Instruction correctness [number of errors] | FP before nav. | 1 | 1 | 0 | 4 | 1 |
| FP after nav. | 0 | 0 | 0 | 2 | 1 | |
| VT before nav. | 1 | 1 | 0 | 4 | 1 | |
| VT after nav. | 0 | 1 | 0 | 3 | 1 | |
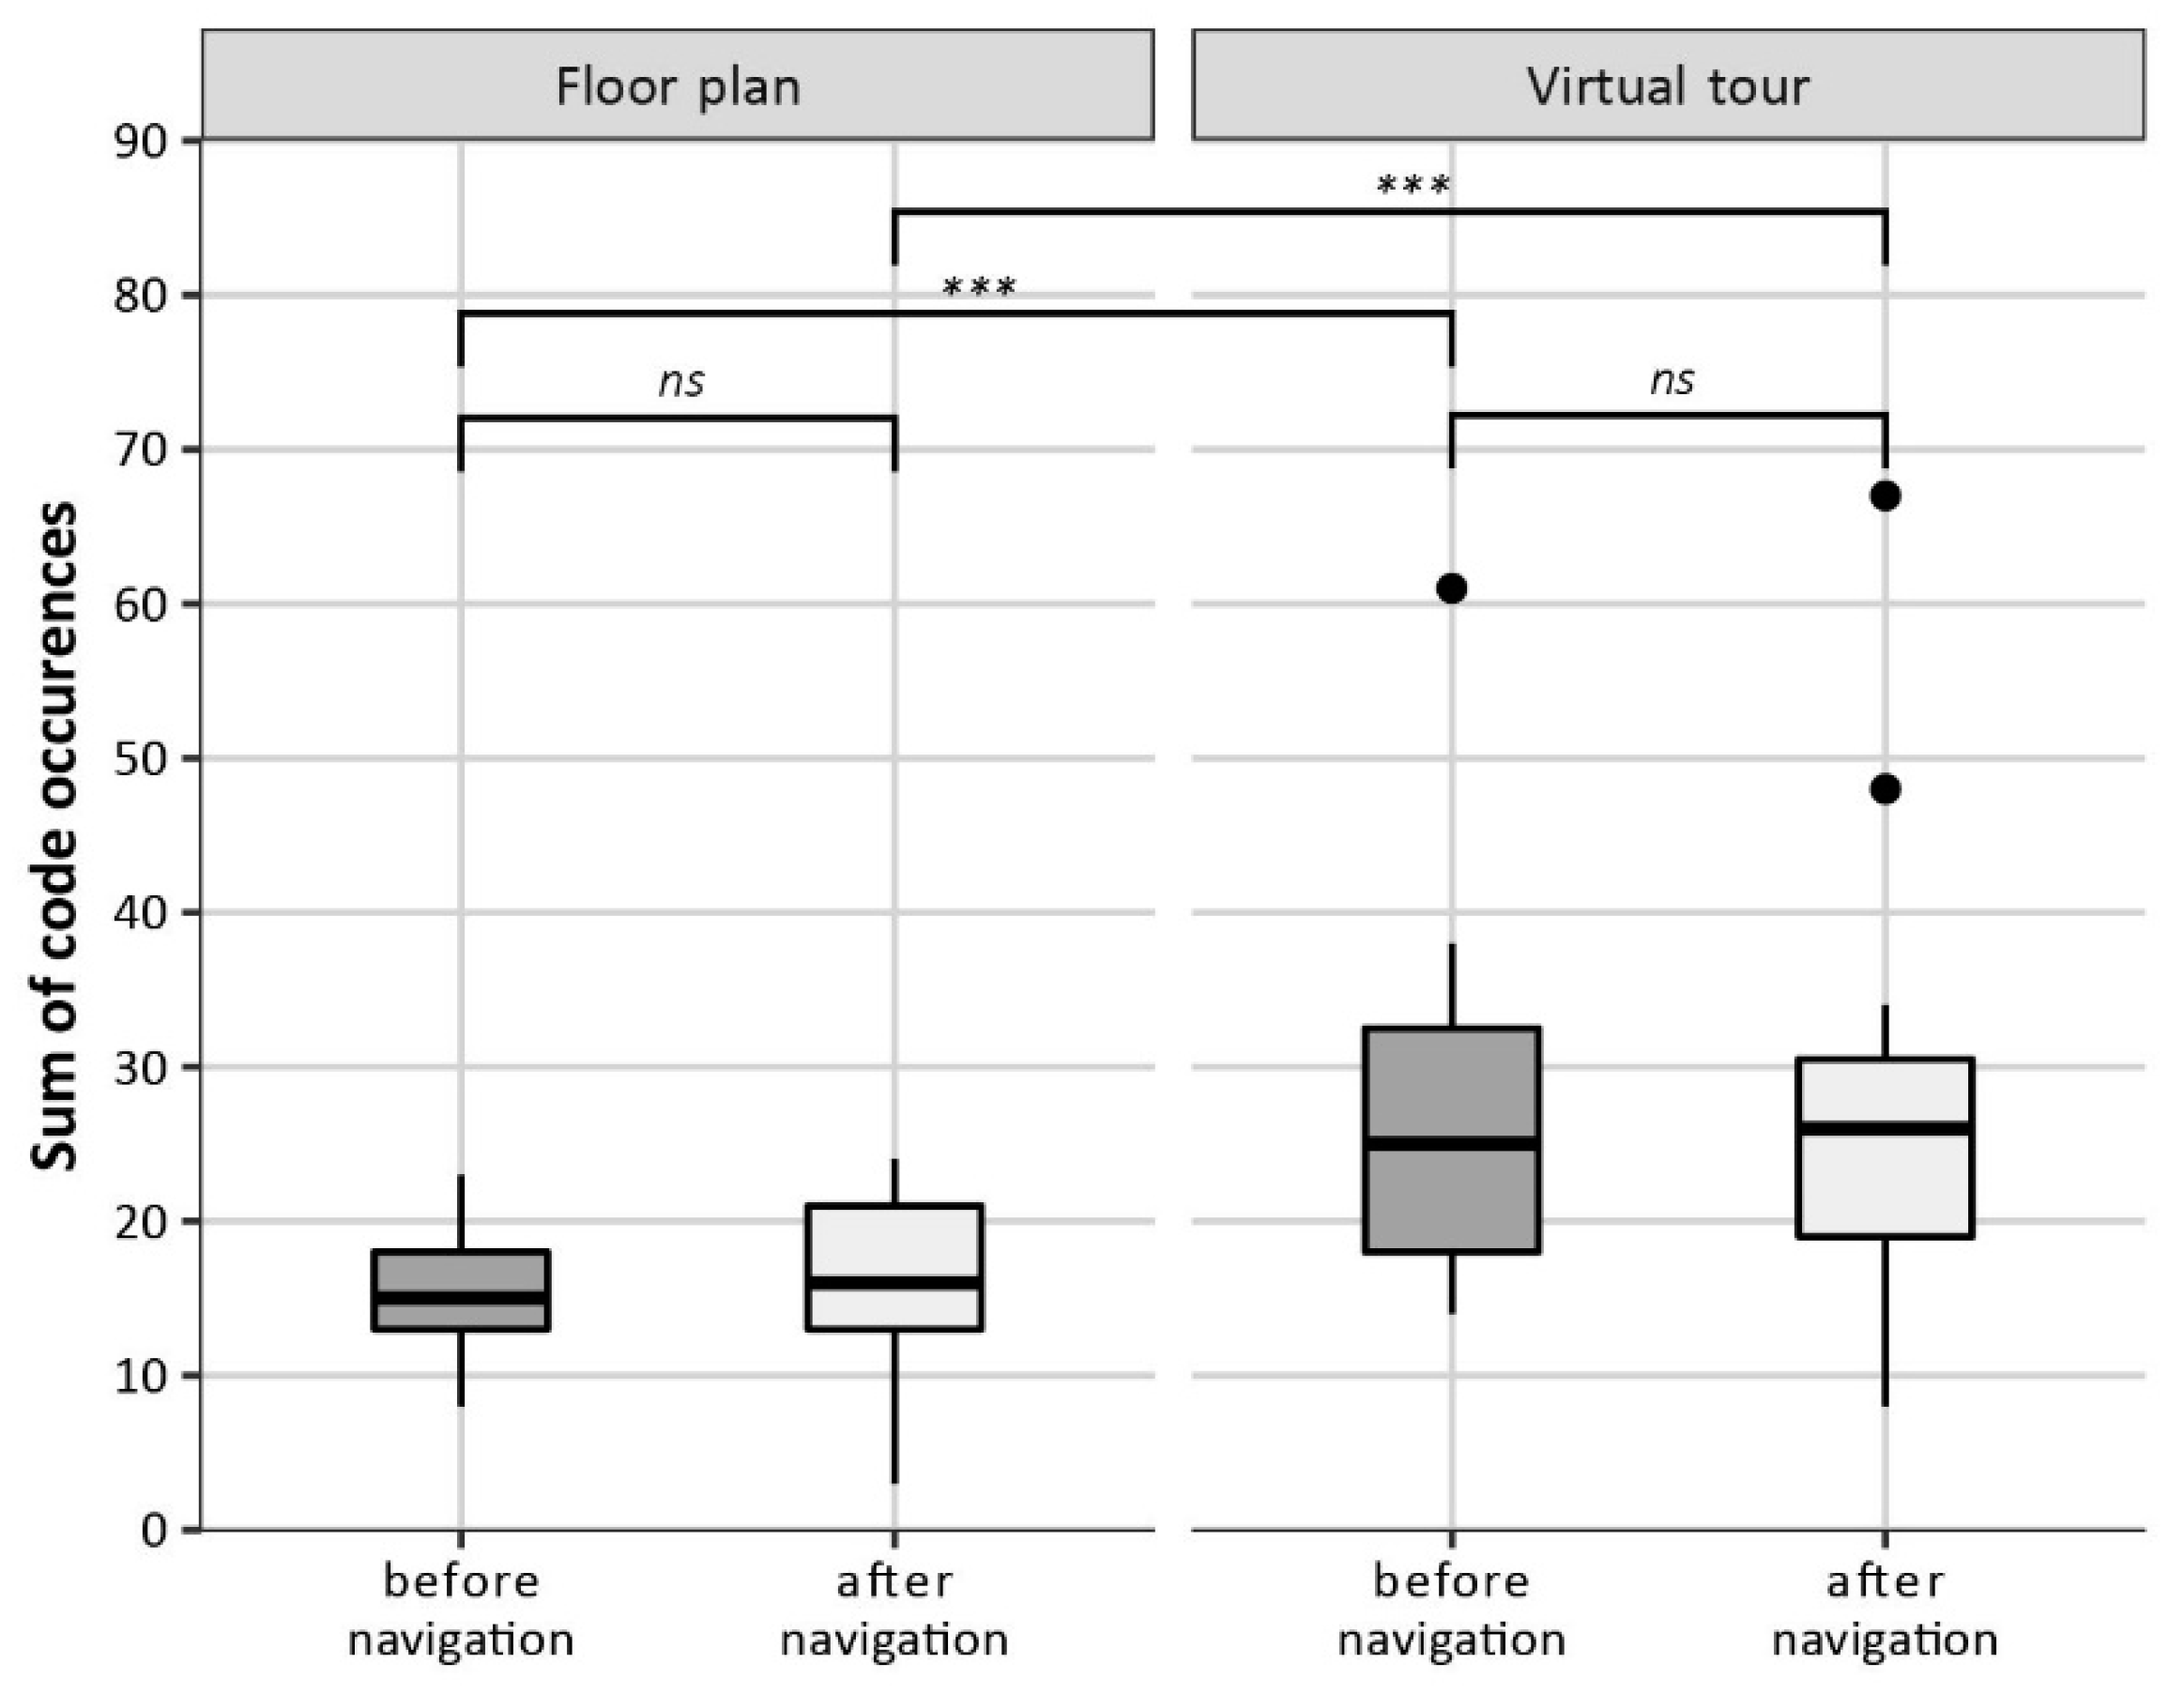
| Instruction richness [sum of all occurrences in navigation instructions] | FP before nav. | 15.00 | 15.71 | 8.00 | 23.00 | 4.30 |
| FP after nav. | 16.00 | 15.94 | 3.00 | 24.00 | 6.00 | |
| VT before nav. | 25.00 | 26.16 | 14.00 | 61.00 | 11.36 | |
| VT after nav. | 26.00 | 27.37 | 8.00 | 67.00 | 12.85 | |
| Landmark char. [number of occurrences in navigation instructions] | FP before nav. | 0 | 0 | 0 | 2 | 1 |
| FP after nav. | 1 | 1 | 0 | 2 | 1 | |
| VT before nav. | 2 | 2 | 0 | 13 | 2 | |
| VT after nav. | 3 | 3 | 0 | 14 | 2 | |
| Doors [number of occurrences in navigation instructions] | FP before nav. | 1 | 1 | 0 | 5 | 1 |
| FP after nav. | 2 | 2 | 1 | 6 | 1 | |
| VT before nav. | 4 | 4 | 1 | 7 | 2 | |
| VT after nav. | 4 | 4 | 0 | 7 | 2 | |
| Stairs [number of occurrences in navigation instructions] | FP before nav. | 2 | 2 | 2 | 3 | 0 |
| FP after nav. | 2 | 2 | 0 | 3 | 1 | |
| VT before nav. | 2 | 2 | 1 | 3 | 1 | |
| VT after nav. | 2 | 2 | 0 | 4 | 1 | |
| Evacuation signs [number of occurrences in navigation instructions] | FP before nav. | 0 | 0 | 0 | 0 | 0 |
| FP after nav. | 0 | 0 | 0 | 2 | 1 | |
| VT before nav. | 1 | 1 | 0 | 5 | 1 | |
| VT after nav. | 0 | 0 | 0 | 3 | 1 | |
| Other landmarks [number of occurrences in navigation instructions] | FP before nav. | 0 | 0 | 0 | 2 | 1 |
| FP after nav. | 0 | 0 | 0 | 3 | 1 | |
| VT before nav. | 1 | 1 | 0 | 6 | 2 | |
| VT after nav. | 2 | 2 | 0 | 7 | 2 |
| before navigating | |||||||
| instr. accuracy | instr. richness | Landmark char. | doors | Stairs | evacuation signs | other landmarks | |
| Mann–Whitney–Wilcoxon (W) | 180.50 | 52.50 | 134.00 | 61.00 | 280.00 | 102.00 | 112.50 |
| p-value | 0.5321 | 0.0003 | 0.1471 | 0.0008 | 0.9999 | 0.0034 | 0.0401 |
| R | 0.0134 | 0.5746 | 0.1748 | 0.5290 | 0.6296 | 0.4509 | 0.2916 |
| after navigating | |||||||
| Mann–Whitney–Wilcoxon (W) | 133.00 | 51.00 | 155.50 | 141.50 | 234.50 | 185.00 | 72.50 |
| p-value | 0.3073 | 0.0002 | 0.4287 | 0.2679 | 0.9902 | 0.8244 | 0.0007 |
| r | 0.0839 | 0.5818 | 0.0299 | 0.1032 | 0.3890 | 0.1554 | 0.5320 |
| Floor plan | |||||||
| instr. accuracy | instr. richness | Landmark char. | doors | Stairs | evacuation signs | other landmarks | |
| Mann–Whitney–Wilcoxon (W) | 58.00 | 50.00 | 10.00 | 45.50 | 119.00 | 0.00 | 13.00 |
| p-value | 0.0243 | 0.1817 | 0.0253 | 0.1487 | 0.0090 | 0.0360 | 0.1775 |
| R | 0.2910 | 0.0593 | 0.3784 | 0.2542 | 0.2737 | 0.4066 | 0.0780 |
| Virtual tour | |||||||
| Wilcoxon signed rank (V) | 21.00 | 59.50 | 17.00 | 125.00 | 119.00 | 18.00 | 25.00 |
| p-value | 0.2402 | 0.2164 | 0.1682 | 0.2413 | 0.1507 | 0.1422 | 0.2896 |
| R | 0.0319 | 0.0403 | 0.0863 | 0.0493 | 0.0142 | 0.0175 | 0.0137 |
| MED | MEAN | MIN | MAX | SD | ||
|---|---|---|---|---|---|---|
| Landmark identification [points scored] | females after nav. | 7.5 | 7.4 | 3 | 10 | 1.92 |
| males after nav. | 6 | 6.25 | 3.75 | 9.5 | 1.6 | |
| Direction estimation [deviation in °] | females before nav. | 35 | 40.62 | 0 | 100 | 31.51 |
| females after nav. | 20 | 33.12 | 10 | 80 | 22.43 | |
| males before nav. | 20 | 17 | 0 | 50 | 14.55 | |
| males after nav. | 25 | 35 | 0 | 120 | 28.93 | |
| Route length estimation [deviation in m] | females before nav. | 152 | 173 | 14 | 414 | 127.84 |
| females after nav. | 129 | 168 | 11 | 814 | 190.93 | |
| males before nav. | 85 | 85 | 4 | 314 | 93 | |
| males after nav. | 39 | 63 | 4 | 214 | 58.06 |
| before navigating | |||
| direction estimation | route length estimation | landmark identification* | |
| Mann–Whitney–Wilcoxon (W) | 237.50 | 234.00 | - |
| p-value | 0.0064 | 0.0094 | - |
| R | 0.4152 | 0.3918 | - |
| after navigating | |||
| Mann–Whitney–Wilcoxon (W) | 159.00 | 232.50 | t = 1.91; df = 29.28 |
| p-value | 0.5198 | 0.0107 | 0.0332 |
| r | 0.0083 | 0.3833 | 0.6500 |
| * Welch’s two sample t-test (t) | |||
© 2019 by the authors. Licensee MDPI, Basel, Switzerland. This article is an open access article distributed under the terms and conditions of the Creative Commons Attribution (CC BY) license (http://creativecommons.org/licenses/by/4.0/).
Share and Cite
Snopková, D.; Švedová, H.; Kubíček, P.; Stachoň, Z. Navigation in Indoor Environments: Does the Type of Visual Learning Stimulus Matter? ISPRS Int. J. Geo-Inf. 2019, 8, 251. https://0-doi-org.brum.beds.ac.uk/10.3390/ijgi8060251
Snopková D, Švedová H, Kubíček P, Stachoň Z. Navigation in Indoor Environments: Does the Type of Visual Learning Stimulus Matter? ISPRS International Journal of Geo-Information. 2019; 8(6):251. https://0-doi-org.brum.beds.ac.uk/10.3390/ijgi8060251
Chicago/Turabian StyleSnopková, Dajana, Hana Švedová, Petr Kubíček, and Zdeněk Stachoň. 2019. "Navigation in Indoor Environments: Does the Type of Visual Learning Stimulus Matter?" ISPRS International Journal of Geo-Information 8, no. 6: 251. https://0-doi-org.brum.beds.ac.uk/10.3390/ijgi8060251