Detecting Urban Polycentric Structure from POI Data

1
School of Resource and Environmental Science, Wuhan University, 129 Luoyu Road, Wuhan 430079, China
2
Research Center of Government GIS, Chinese Academy of Surveying and Mapping, Beijing 100830, China
3
Beijing Institute of Applied Science and Technology, Beijing 100091, China
*
Author to whom correspondence should be addressed.
ISPRS Int. J. Geo-Inf. 2019, 8(6), 283; https://0-doi-org.brum.beds.ac.uk/10.3390/ijgi8060283
Submission received: 30 April 2019
/
Revised: 3 June 2019
/
Accepted: 15 June 2019
/
Published: 17 June 2019
(This article belongs to the Special Issue Algorithms and Techniques in Urban Monitoring)
Abstract
:It is meaningful to analyze urban spatial structure by identifying urban subcenters, and many methods of doing so have been proposed in the published literature. Although these methods are widely applied, they exhibit obvious shortcomings that limit their further application. Therefore, it is of great value to propose a new urban subcenter identification method that can overcome these shortcomings. In this paper, we propose the density contour tree (DCT) method for detecting urban polycentric structures and their spatial distributions. Conceptually, this method is based on an analogy between urban spatial structure and terrain. The point-of-interest (POI) density is visualized as a continuous mathematical surface representing the urban terrain. Peaks represent the regions of the most frequent human activity, valleys represent regions with small population densities in the city, and slopes represent spatial changes in urban land-use intensity. Using this method, we have detected the urban “polycentric” structure of Beijing and determined the corresponding spatial relationships. In addition, several important properties of the urban centers have been identified. For example, Beijing has a typical urban polycentric structure with an urban center area accounting for 5.9% of the total urban area, and most of the urban centers in Beijing serve comprehensive functions. In general, the method and the results can serve as references for the later research on analyzing urban structure.
1. Introduction
As the basis of a new set of tools and a new perspective for understanding the spatial structure of urban areas, ‘polycentricity’ has been receiving increasing attention in urban research and planning circles in recent years [1,2]. The concept of polycentricity can be traced back to the early history of modern urban planning. The original intention was to use a polycentric spatial structure to increase the separation between population centers and centers of economic activity relative to a monocentric structure [3]. The concept of polycentricity has been extensively studied since the EU Regional Development Fund established the cooperative international research project titled “Sustainable Management of European Polycentric Mega-City Regions” (POLYNET) [4]. Since that time, the United States has also listed polycentricity as a major issue of interest in the "American 2050" report [5]. However, due to either a lack of attention or a lack of reliable research data, there are few empirical studies on urban polycentric structure in many developing countries. In China, urbanization is occurring at an unprecedented rate, similar to that in the majority of the developing world [6]. With the continuous expansion of the scale of cities, the transportation costs and time costs of daily travel for residents have continued to rise [7], and traffic congestion has become increasingly severe [8,9,10]. The “happiness” of residents has been decreasing [11], and the overall productivity of cities has gradually declined [12]. In efforts to address this problem, it has been shown that decentralization and the development of polycentric cities can effectively alleviate ‘big city disease’ [13]. Moreover, the production efficiency and annual average wage in polycentric areas are generally higher than those in monocentric areas [14,15,16]. Therefore, there is an urgent need to study urban polycentric structure to guide the relevant governmental departments in formulating scientific methods of urban planning to promote the transformation of cities from monocentric to polycentric [17]. The traditional way of identifying urban polycentric structure relies on remote sensing data [18] and census data [19]. As a result, its accuracy is limited by the accuracy and scale of these data. For example, Chen implemented a localized contour tree method of delimiting urban centers using nighttime light (NTL) data. Although remote sensing data of this type have contributed significantly to urban polycentric structure studies [20], NTL data offer rather low precision in reflecting the agglomeration of urban activities, thus limiting the interpretability of the results.
With the rapid development of internet-based information collection technology, voluminous networks of geographic information, such as the point-of-interest (POI) data obtained from web maps, are becoming readily available. POI data are point data on real geographical entities, with spatial and attribute information, high precision, wide coverage, rapid updates, and large data volumes, and they are widely used in urban research [21,22]. Differences in the spatial distribution of POI density reflect different levels of regional development [23]. Therefore, such information has been widely used for discovering regions with different functions in a city [6,24,25,26], extracting urban boundaries [27] and identifying spatiotemporal changes in urban population [28].
We propose a method of detecting urban polycentric structure based on the underlying connection between POI data and the spatial distribution of urban activities. The basic idea is to represent a POI density surface in the form of terrain and use the density contour tree (DCT) method to analyze the structure of multiple urban centers. With this approach, a graph-theory-based method can be applied to identify the topographic peaks as the urban centers and to delimit the spatial relationships between adjacent urban centers. The main contributions of this work are three-fold. First, a method of identifying the boundaries of polycentric urban regions and their relationships is proposed, in which the DCT method is used for inference. Second, the boundary thresholds between urban centers and unbuilt areas are quantitatively explored using the density curve method. Third, the attributes of urban polycentric structure (e.g., relationships, functions, density, areas, and perimeters) are characterized.
The remainder of this paper is organized as follows. Section 2 reviews related work. Section 3 introduces the proposed method of characterizing the urban polycentric structure. Section 4 reports a case study in which the spatial distribution of and relationships among urban centers are explored. Section 5 presents a discussion of the results and limitations of this study. In Section 6, the paper is concluded with a brief summary.
2. Related Work
With the rapid development of geographic information technology and remote sensing technology, many theories and methods have been proposed for detecting and describing urban polycentric structure. The methods in the existing literature can be classified into three groups.
Methods in the first group identify polycentric structure based on census data (e.g., population and employment density). For example, Giuliano defined an urban sub center as a continuous set of adjacent transportation analysis zones that contains more than 10,000 employees in total, where each transportation analysis zone has a minimum density of ten employees per acre [29]. McMillen used locally weighted regression (LWR) to identify regions with more than 10,000 employment groups as urban centers [30]. Daniel proposed a density function for identifying urban employment subcenters as significant maxima on a numerical surface representing employment density [31]. Using population density and residential population density indexes, Sun measured urban polycentric structure from the perspective of residential centers and employment centers [32]. However, this method requires the threshold for identifying a center to be selected subjectively, which is a difficult task for researchers who lack local knowledge and can often lead to inaccurate results.
Methods in the second group identify polycentric structure based on remote sensing data. Shi extracted the built-up urban areas of cities from NPP-VIIRS and DMSP-OLS data by using statistical data as a reference [33]. Chen applied the local contour tree method to NTL data to classify urban centers and analyze their spatial relationships [18]. Despite the relatively high spatial stability of NTL data and the ability to conduct large-scale urban multicenter studies using such data, it is still not possible to use these data to accurately predict various socioeconomic attributes and human dynamics, such as daily activities [34]. For example, not only urban centers but also roads, large construction sites, ports, and industrial areas emit considerable light at night, which may lead to errors in the extraction of urban centers [35].
Methods in the third group identify polycentric structure based on location-based social network [36] data (e.g., volunteered geographic information [37], POI data, automatic smart card records, and taxi trips). Hollenstein calculated the locations with the highest density of Flickr photos to define the scope of an urban center [38]. Cai proposed a method of combining NTL satellite images and social media check-in data for urban polycentric structure detection [39]. Using 408 768 POIs data in Chongqing urban area, Duan identified the overall pattern of polycentric structure and the polycentric structures of different functions by considering the spatial distribution and the degree of aggregation of POIs [40]. However, social media check-in data have the same limitations as all volunteered geographic information, such as the fact that their accuracy is limited by the user volume, data incompleteness, and other factors. Roth identified London’s polycentric structure using data collected from the Oyster card (an electronic ticketing system used to record public transport passenger movements and fare tariffs within Greater London) [41]. Liu introduced complex network science methods to analyze taxi GPS data and discovered a two-level hierarchical polycentric urban structure of Shanghai [42]. However, there are still some limitations. First, Oyster card or taxi trips are able to represent only a part of intra-urban travel. Second, buses and taxi passengers are biased samples of a city’s population. Therefore, the results may be biased. Although these methods have contributed significantly to the detection of urban polycentric structure, the following limitations must still be addressed:
- The threshold for urban boundaries is unstable and requires repeated trials to determine. Thus, determining the appropriate thresholds for delineating cities remains a challenge [43]. For example, Chen [18] selected this threshold value, mainly based on trial-and-error experiments and local knowledge.
- Previous studies have heavily relied on census data and local knowledge for urban polycentric structure characterization and analysis. Census data are easily limited by the sample size [44] and spatiotemporal resolution [45]. Most previous studies detected urban centers only at one specific spatial scale. They were unable to construct and characterize hierarchies of urban structure involving multiple spatial scales.
- The census or survey data used in these methods are often collected for predefined geographic units, such as census blocks or administrative regions. The shapes of the identified urban centers are thus limited by these predefined boundaries and the way in which the areal units are defined. The interpretations of urban centers may thus be affected by the modifiable areal unit problem.
To address these issues, we employ POI data in place of either census data or NTL data for urban polycentric structure analysis. In our approach, the DCT method is applied to POI data to delimit multiple urban centers and analyze their spatial relationships.
3. Methodology
3.1. Theoretical Basis
The concentration, or density, of employment and other human activities, is higher in urban centers than in surrounding areas. Since the POI density is positively correlated with the density of human activity, the POI density of a region can be conceptualized as a continuous surface representing the intensity of human activity, where the terrain corresponding to an urban center is similar to that of a mountaintop. Such a peak can be represented by a set of contour lines on a topographic map. By analogy, urban center detection can be viewed as the detection of a set of POI density contours on a digital surface.
Driven by this analogy between urban structure and terrain, we propose a four-step approach for exploring urban polycentric structure based on POI data. The flowchart of the proposed framework is illustrated in Figure 1. First, we generate a spatial density map from the POI data. Second, we identify ‘seed contours’ from which to construct one or more DCTs to capture the urban structure based on graph theory. Third, multiple urban centers are identified from the simplified DCTs. Fourth, we calculate a set of attributes for each urban center, including geometric parameters and statistical values.
3.2. Generating the POI Density Contour Map
To generate the POI density contour map, we use a kernel density function to establish the spatial distribution of the POI probability density. Because urban centers must be located in an urban area, we select a certain density threshold value as the base density contour value when generating the POI density contour map. This density threshold value is determined via the density curve method. The density contour map is generated based on two important types of parameters: The base contour lines and the contour interval. Because the purpose is to detect urban centers, all open contours are ignored in the subsequent analysis.
3.2.1. Building the POI Density Distribution Using a Kernel Function
Nonparametric estimation is an effective means of probability density estimation. Kernel density estimation can be used to estimate the density at any arbitrary point and does not depend on any selected grid size. The kernel density at any point i in space can be defined with respect to the point with the highest density and is decreasing at points moving outward from this center point. When the distance reaches a certain value , the density is 0:
where is the weight of research target , is the distance between spatial point and research target , is the number of research targets in the range of the bandwidth , and is the bandwidth of the selected regular region ().
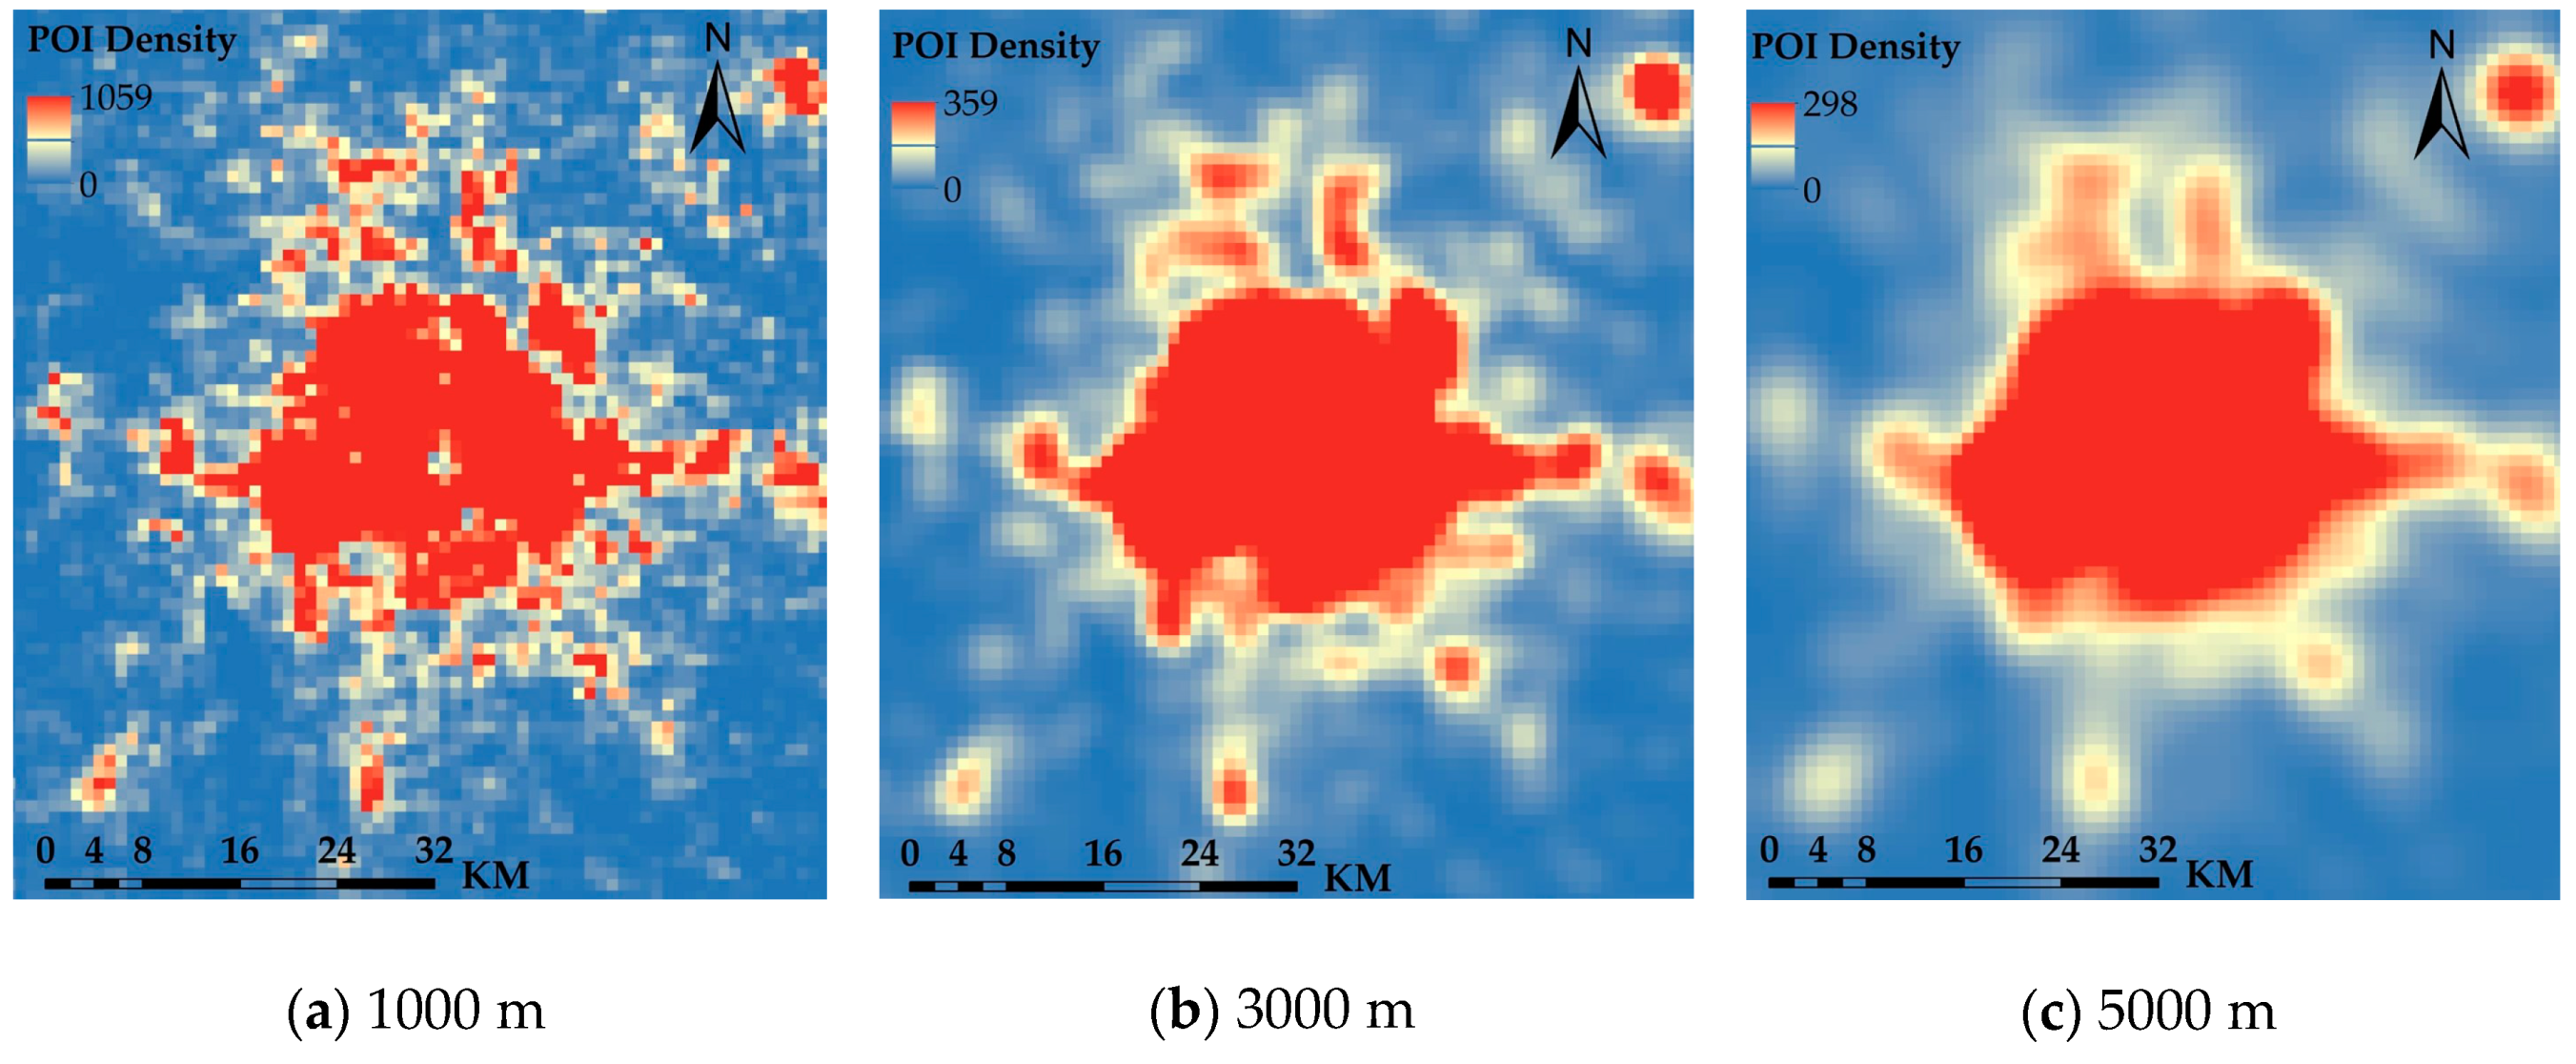
Studies have shown that the choice of the bandwidth R has a critical impact on the results of nuclear density analysis [46]. According to the existing urban research case [40,47] and the actual situation of the study area, we set the search radius to 1000, 3000, and 5000 m. The results show the following (Figure 2): As the search radius increases, the local POI aggregation area is continuously fused, and the smoothness of the nuclear density contour is gradually increased. Within the inner ring, each POI gathering area has a tendency to gradually merge. The POI aggregation areas for different search radii are mainly concentrated in the main urban area of Beijing. The spatial locations are basically the same, mainly distributed in Dongcheng, Xicheng, Chaoyang, Haidian, Fengtai, and Shijingshan. When the search radius is 1000 m, many small POI aggregation areas may be generated, but these small areas cannot be called urban centers because their areas are too small. For example, considering the Lion Camp in Yanqing District, Kangying Middle Road in Chaoyang District and Shangdi in Haidian District, when the search radius increases, these small areas must be merged with the surrounding area into a large area to be called a city center. When the search radius is from 3000 to 5000 m, the POI aggregation characteristics around Beijing are weakened. For example, some urban centers in the Yizhuang High-Tech Industrial Development Zone, the People’s Park in Pinggu District, Fangshan Liangxiang, and the Huairou District Construction Committee may be ignored during the identification process. In general, a smaller search radius can identify smaller POI aggregation areas, and a larger search radius can reflect the polycentric pattern at the macro scale, with a good smoothing effect. The purpose of this study is to identify the polycentric urban structure of the study area and, comprehensively weigh the overall effect of polycentric recognition and local recognition results. Based on this analysis, a search radius of 3000 m was selected for further analysis. With this value, the analysis results are stable and can meet the needs of urban spatial structure analysis.
3.2.2. Identifying the Threshold for the Boundaries of Built-Up Urban Areas Using the Density Curve Method
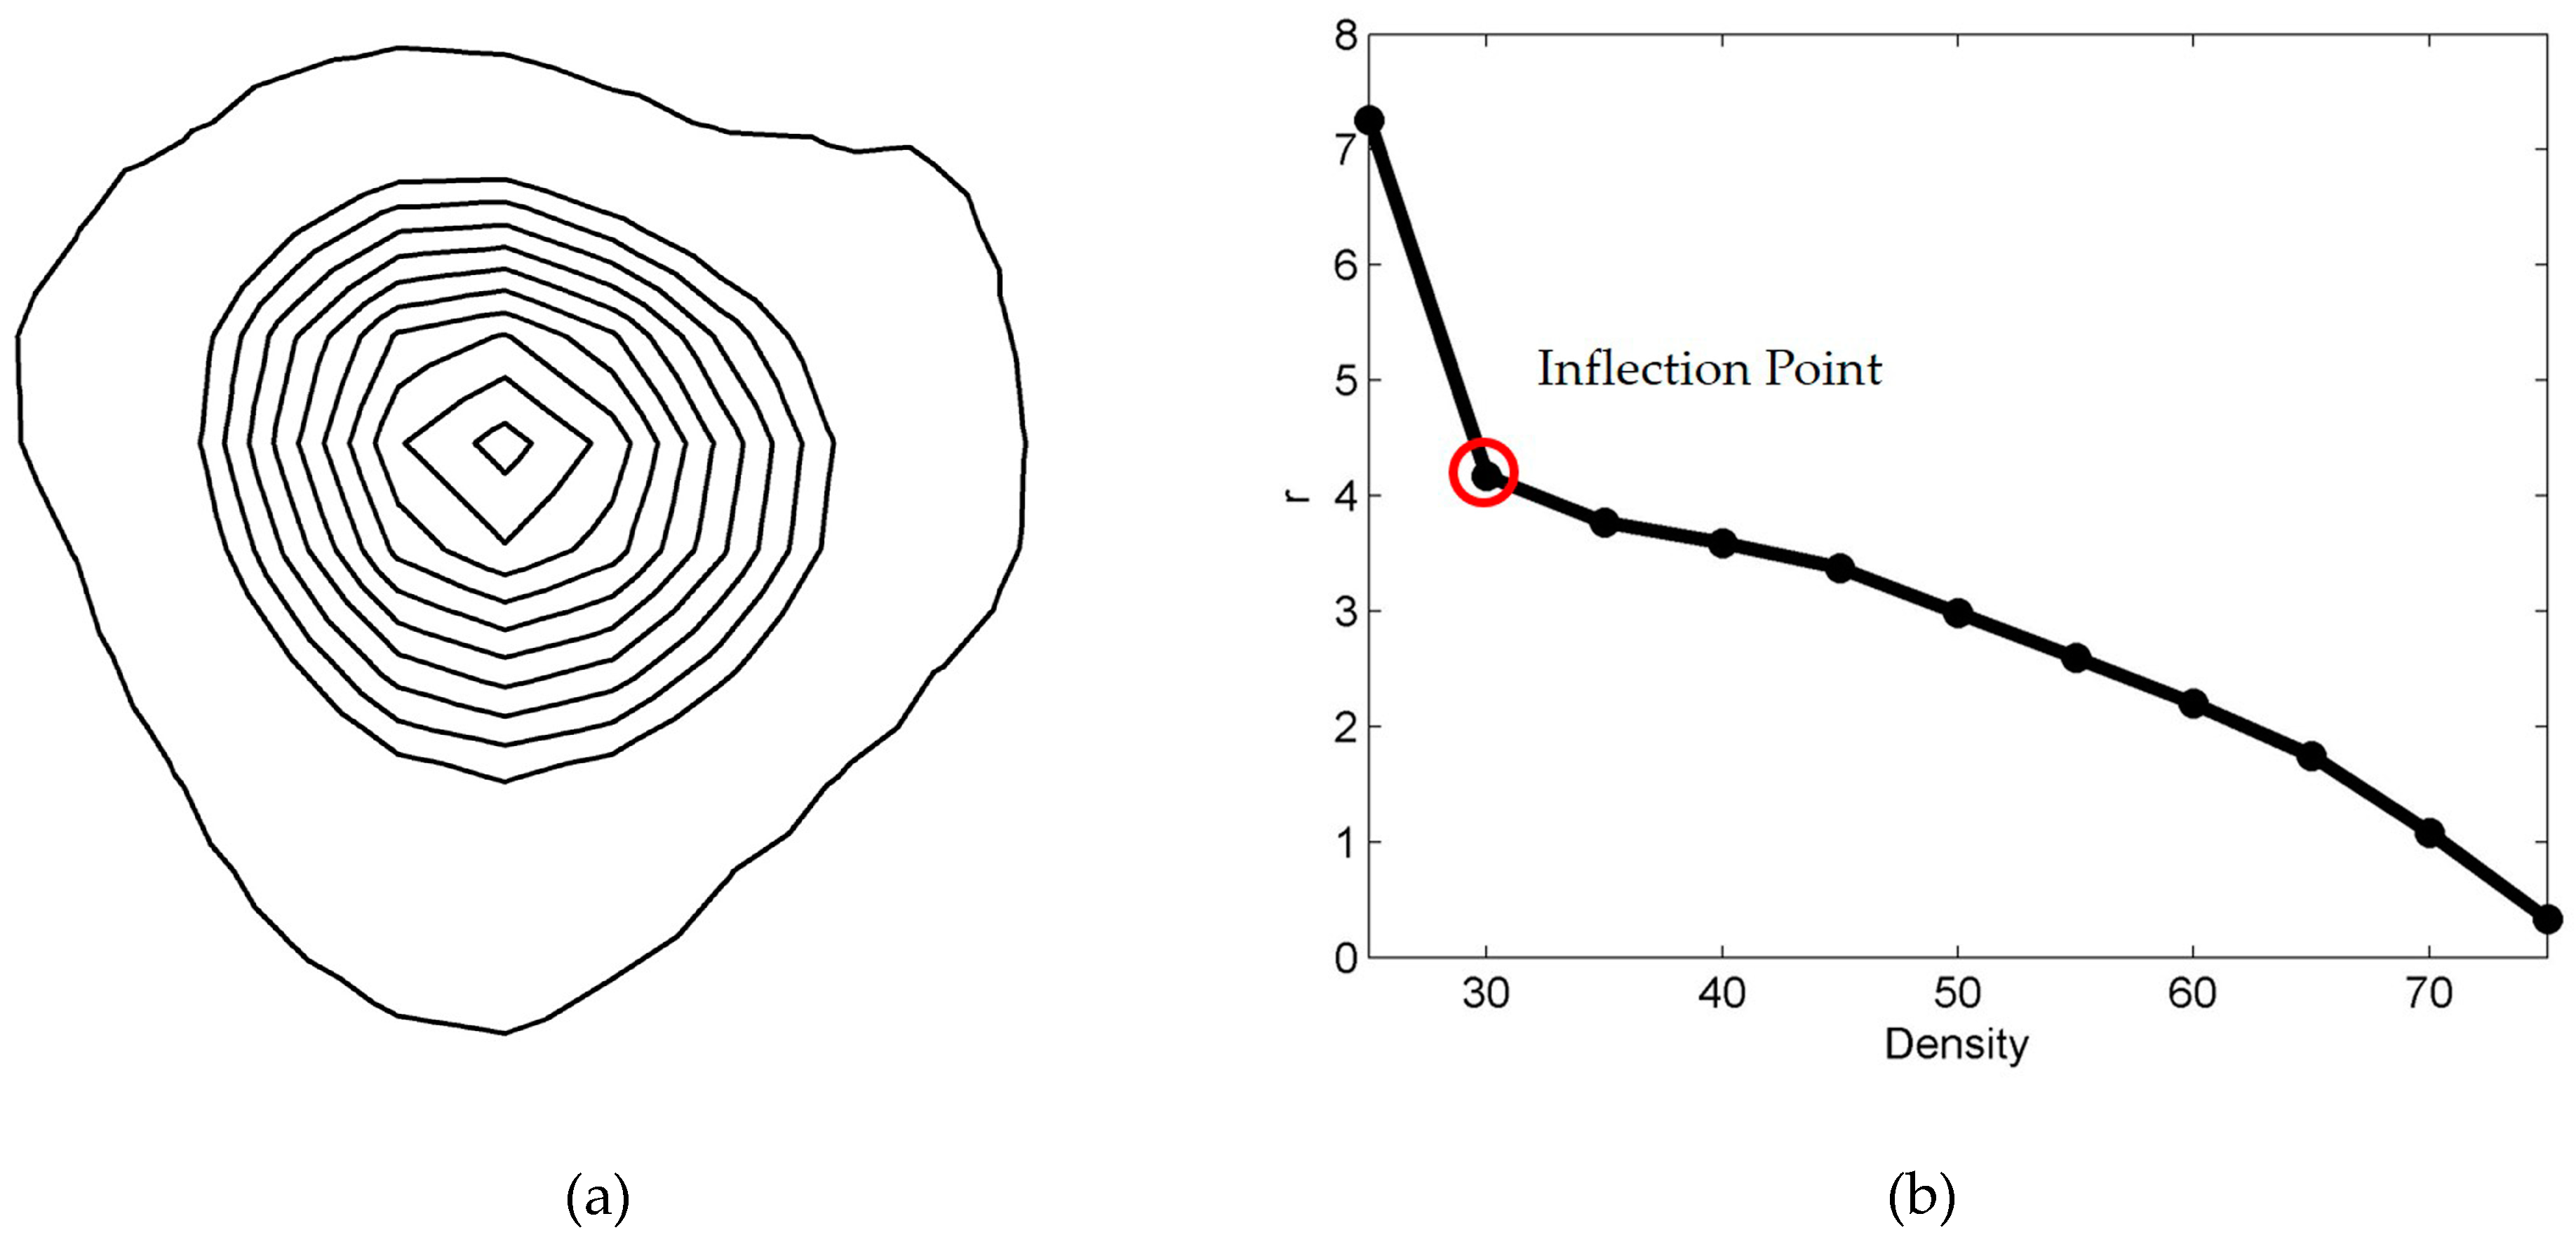
An urban center is generally located in a built-up area. Therefore, the boundaries of built-up urban areas are key factors in identifying urban centers and determining their scopes. The spatial distribution of the POI density is mainly characterized by gradual enlargement of the distance between the density contours from the center to the periphery and by the sparseness of the density contours at the periphery. The basic idea is to observe the change in the ratio of the theoretical closed radius () to the density value () and find the inflection point to determine the boundary of the built-up area. The computational efficiency and accuracy of this method are higher than those of a series of trial-and-error threshold tests. Specifically, the method consists of two steps:
Step 1: Characterize the relationship between the theoretical radius and the density value . In theory, the ratio of the theoretical radius to the density should be a constant:
Step 2: Determine the boundary density value of the built-up area. In fact, for a given rural-to-urban transition, the density curve will show significant fluctuations. However, there is a globally important point at which the theoretical boundary radius changes the most (as indicated by the red circle in Figure 3b). The density corresponding to this theoretical radius is the boundary density value of the urban built-up area.
3.3. Generating the Contour Tree
Contour trees are useful graphical tools for representing the spatial relations among contour lines and have been successfully used for map generalization [48], terrain analysis [49], urban structure analysis [18], and other purposes [50]. The DCT method is developed based on local contour trees [49]. It uses one or more trees to quantitatively represent a contour map. A DCT is composed of nodes and links. Each node represents a density contour line, while a link represents the topological relationship between two adjacent nodes. The flowchart in Figure 1 shows the data processing steps and algorithm components of our density contour tree method. To derive the initial contours, we used ArcGIS “Spatial Analyst Tools”, which realizes the transformation from POI to POI density contour. The POI density map was first generated by using the "Kernel Density tool" and then the contour map is generated by using the ArcGIS “Surface Analysis tool” with a certain initial contour and a contour interval. Remove the unclosed contours and the use the closed contour as the input data to construct the DCT. We construct a DCT in a ‘bottom-up’ manner using a tree growing algorithm. It consists of three steps [49]: (1) Generate contours from the POI density map by choosing the basic contour and the contour interval, (2) identify seed contours and construct density contour tree based on the topological relationship between the concentric closed contours, and (3) searching and construct all contours and simplify the density contour tree. More detail about the breadth-first priority search algorithm can be found in Sedgewick [51] and Wu [49].
Definition 1.
A seed contour is a closed contour that may be surrounded by other contours but may not contain any other contours inside it.
Definition 2.
A parent contour is a closed contour with two or more child nodes.
For a simple density contour tree shown in Figure 4, the contour tree is initiated with the seed contours A and B as the leaf nodes, which are the first-level contours at the bottom of the tree. Then, the contour tree is grown by searching the map and adding the adjacent closed contours C and D, which contain these seed contours, as the parent nodes of A and B, respectively. This iterative process continues until the surrounding outermost closed contour H is included in the tree as the root node. Thus, the initial contour tree is constructed (Figure 4b). Then, this contour tree should be simplified to reflect the hierarchical structure of the urban center. As shown in Figure 4c, contours A and C belong to the same branch of the contour tree, and there is no topological change within this branch. Therefore, these contours can be regarded as the same. The last node of the branch represents the urban center boundary. Therefore, only contours C and F are kept to represent the entire branches consisting of nodes C-A and F-E-D-B, respectively, in the simplified tree. This procedure is applied to all similar branches in the contour tree, such as the branch composed of contours G and H, in Figure 4c. H represents a composite urban center since it encloses two separate elemental urban centers at level 1.
3.4. Urban Polycentric Structure Detection
As an important part of the urban spatial structure, an urban center can be defined as a continuous area characterized by highly concentrated or intensive employment and other human activities [29]. A DCT can represent either a polycentric or monocentric urban structure. For a monocentric structure, there is only one branch. After simplification, only one leaf node will remain. The contour line corresponding to this leaf node represents the range of the urban center. By contrast, the DCT for a polycentric structure has two or more branches, the simplified tree has multiple leaf nodes, and the number of layers reflects the complexity of the polycentric area. Therefore, the largest leaf node in the main tree represents the main center of the city. The simplified contour tree in Figure 4c represents an urban polycentric structure that has two subcenters indicated by two leaf nodes C and F. The contour lines in Figure 4c corresponding to nodes C and F delimit the spatial extents of urban centers C and F. The simplified contour tree has two levels, indicating a relatively simple polycentric structure. The Node H at level 2 represents a composite urban center at a larger spatial scale, which contains two subcenters C and F. The spatial extent of the composite urban center H is delimited by the contour line corresponding to contour H in Figure 4c.
3.5. Derivation of Urban Polycentric Attributes
(1) Functional attributes
Based on a simplified DCT, the frequency density index () and category ratio index of the urban center represented by each leaf node can be calculated as follows to identify the functional properties of these centers:
where denotes the POI type, denotes the number of POIs of the ith type in the unit represented by the current leaf node, denotes the total number of POIs of the ith type, denotes the frequency density of the unit in terms of the ith POI type, relative to the total number of POIs of this type, and denotes the ratio of the frequency density of the unit in terms of the ith POI type to the total frequency density of the unit in terms of all types of POIs. indicates that the urban center is a single-function center, where the function category is determined by the POI type. indicates that the urban center is a mixed-function center, and its hybrid type is determined by the top three POI types.
(2) Geometric and statistical properties
In a simplified DCT, the leaf nodes represent the elemental urban centers. Each elemental urban center is characterized by four geometric properties and four statistical values (Table 1): The perimeter (P), area (S), compactness index (CI), elongateness (ELG), minimum density (MIN), maximum density (MAX), average density (MEAN), and polycentricity value (PV).
3.6. Uncertainty and Sensitivity Analysis
There are three main uncertain values in the proposed approach. First, we need to determine the initial contours of the DCT, for which it is necessary to determine the boundary threshold for urban built-up areas to confirm that the extracted urban centers are indeed located in urban areas. Second, we need to choose the contour interval for the POI density map. Third, we need to determine the minimum area of an urban center. Here, we analyze the uncertainty of these results.
Regarding the first uncertain value, as the initial contour value increases, the number of detected urban centers will decrease. In this paper, the proposed density curve method is mainly used to automatically determine the initial contours of the urban DCTs, thereby eliminating the effects of this uncertainty.
Regarding the second uncertain value, according to research, a smaller contour interval enables more accurate detection of the urban centers and their spatial extents, but the calculation cost simultaneously increases. Conversely, larger contour intervals may obscure details of the locations and extents of some urban centers. Therefore, we selected three different contour intervals (5, 10, and 15) to analyze the sensitivity of the proposed method to the contour interval when an initial contour value of 11 and a minimum urban center area of 5 km2 are used for DCT generation.
Regarding the third uncertain value, an excessively small threshold on the minimum urban center area may result in the detection of too many small urban centers or the division of a single urban center into several small parts, whereas an excessively large minimum area threshold may cause some urban centers to be missed. A number of minimum area thresholds (from 1 to 7 km2) were tested to estimate their impact on urban center detection when an initial contour value of 11 and a contour interval of 10 are used for DCT generation.
4. Case Study
4.1. Data Description
4.1.1. Overview of the Study Area
For this study, we considered Beijing, the capital of the People’s Republic of China, as our study area and the established administrative divisions as the boundaries (Figure 5). The area of Beijing is 16410.54 km2, and its population is more than 21.7 million (2017). It is the world’s most populous capital city and the third most populous city overall. The city, located in northern China, is governed as a municipality under the direct administration of the central government and is separated into 16 districts, including the districts of Dongcheng, Xicheng, Chaoyang, Fengtai, Shijingshan, Haidian, Mentougou, Fangshan, Tongzhou, Shunyi, Changping, Daxing, Huairou, Pinggu, Miyun, and Yanqing. Beijing is surrounded by Hebei Province, with the exception of the neighboring Tianjin Municipality to the southeast. Together, these three divisions form the Jingjinji metropolitan region and the national capital region of China.
4.1.2. POI Data
The POI data used in this paper were collected in 2018 from Gaode Maps (https://map.gaode.com/), which is one of the most popular online map service providers in China. We compiled the crawler program and crawled the POI data of Beijing using the free interface provided by Gaode API (https://lbs.amap.com/api/android-sdk/guide/map-data/poi/). With coordinate correction and incomplete data elimination, we obtained a total of 159,027 POIs in the Beijing area. The POI data include attributes such as codes, names, descriptions, coordinates, addresses, and categories.
The Gaode POI classification includes twenty-three categories, some of which are redundant. For example, there are overlaps in many categories, such as automotive services, automotive sales and life services. According to the ”Classification of Urban Land Use and Planning Standards of Development Land (GBJ50137-2011)” (http://www.mohurd.gov.cn/), we excluded three types of POIs that are irrelevant to urban spatial structure: Place name and address information, event activities and indoor facilities. Then, we reclassified the remaining twenty Gaode POI categories into seven new categories. A comparison of the POI data categories before and after reclassification is presented in Table 2.
4.2. Generation of the Density Contour Map
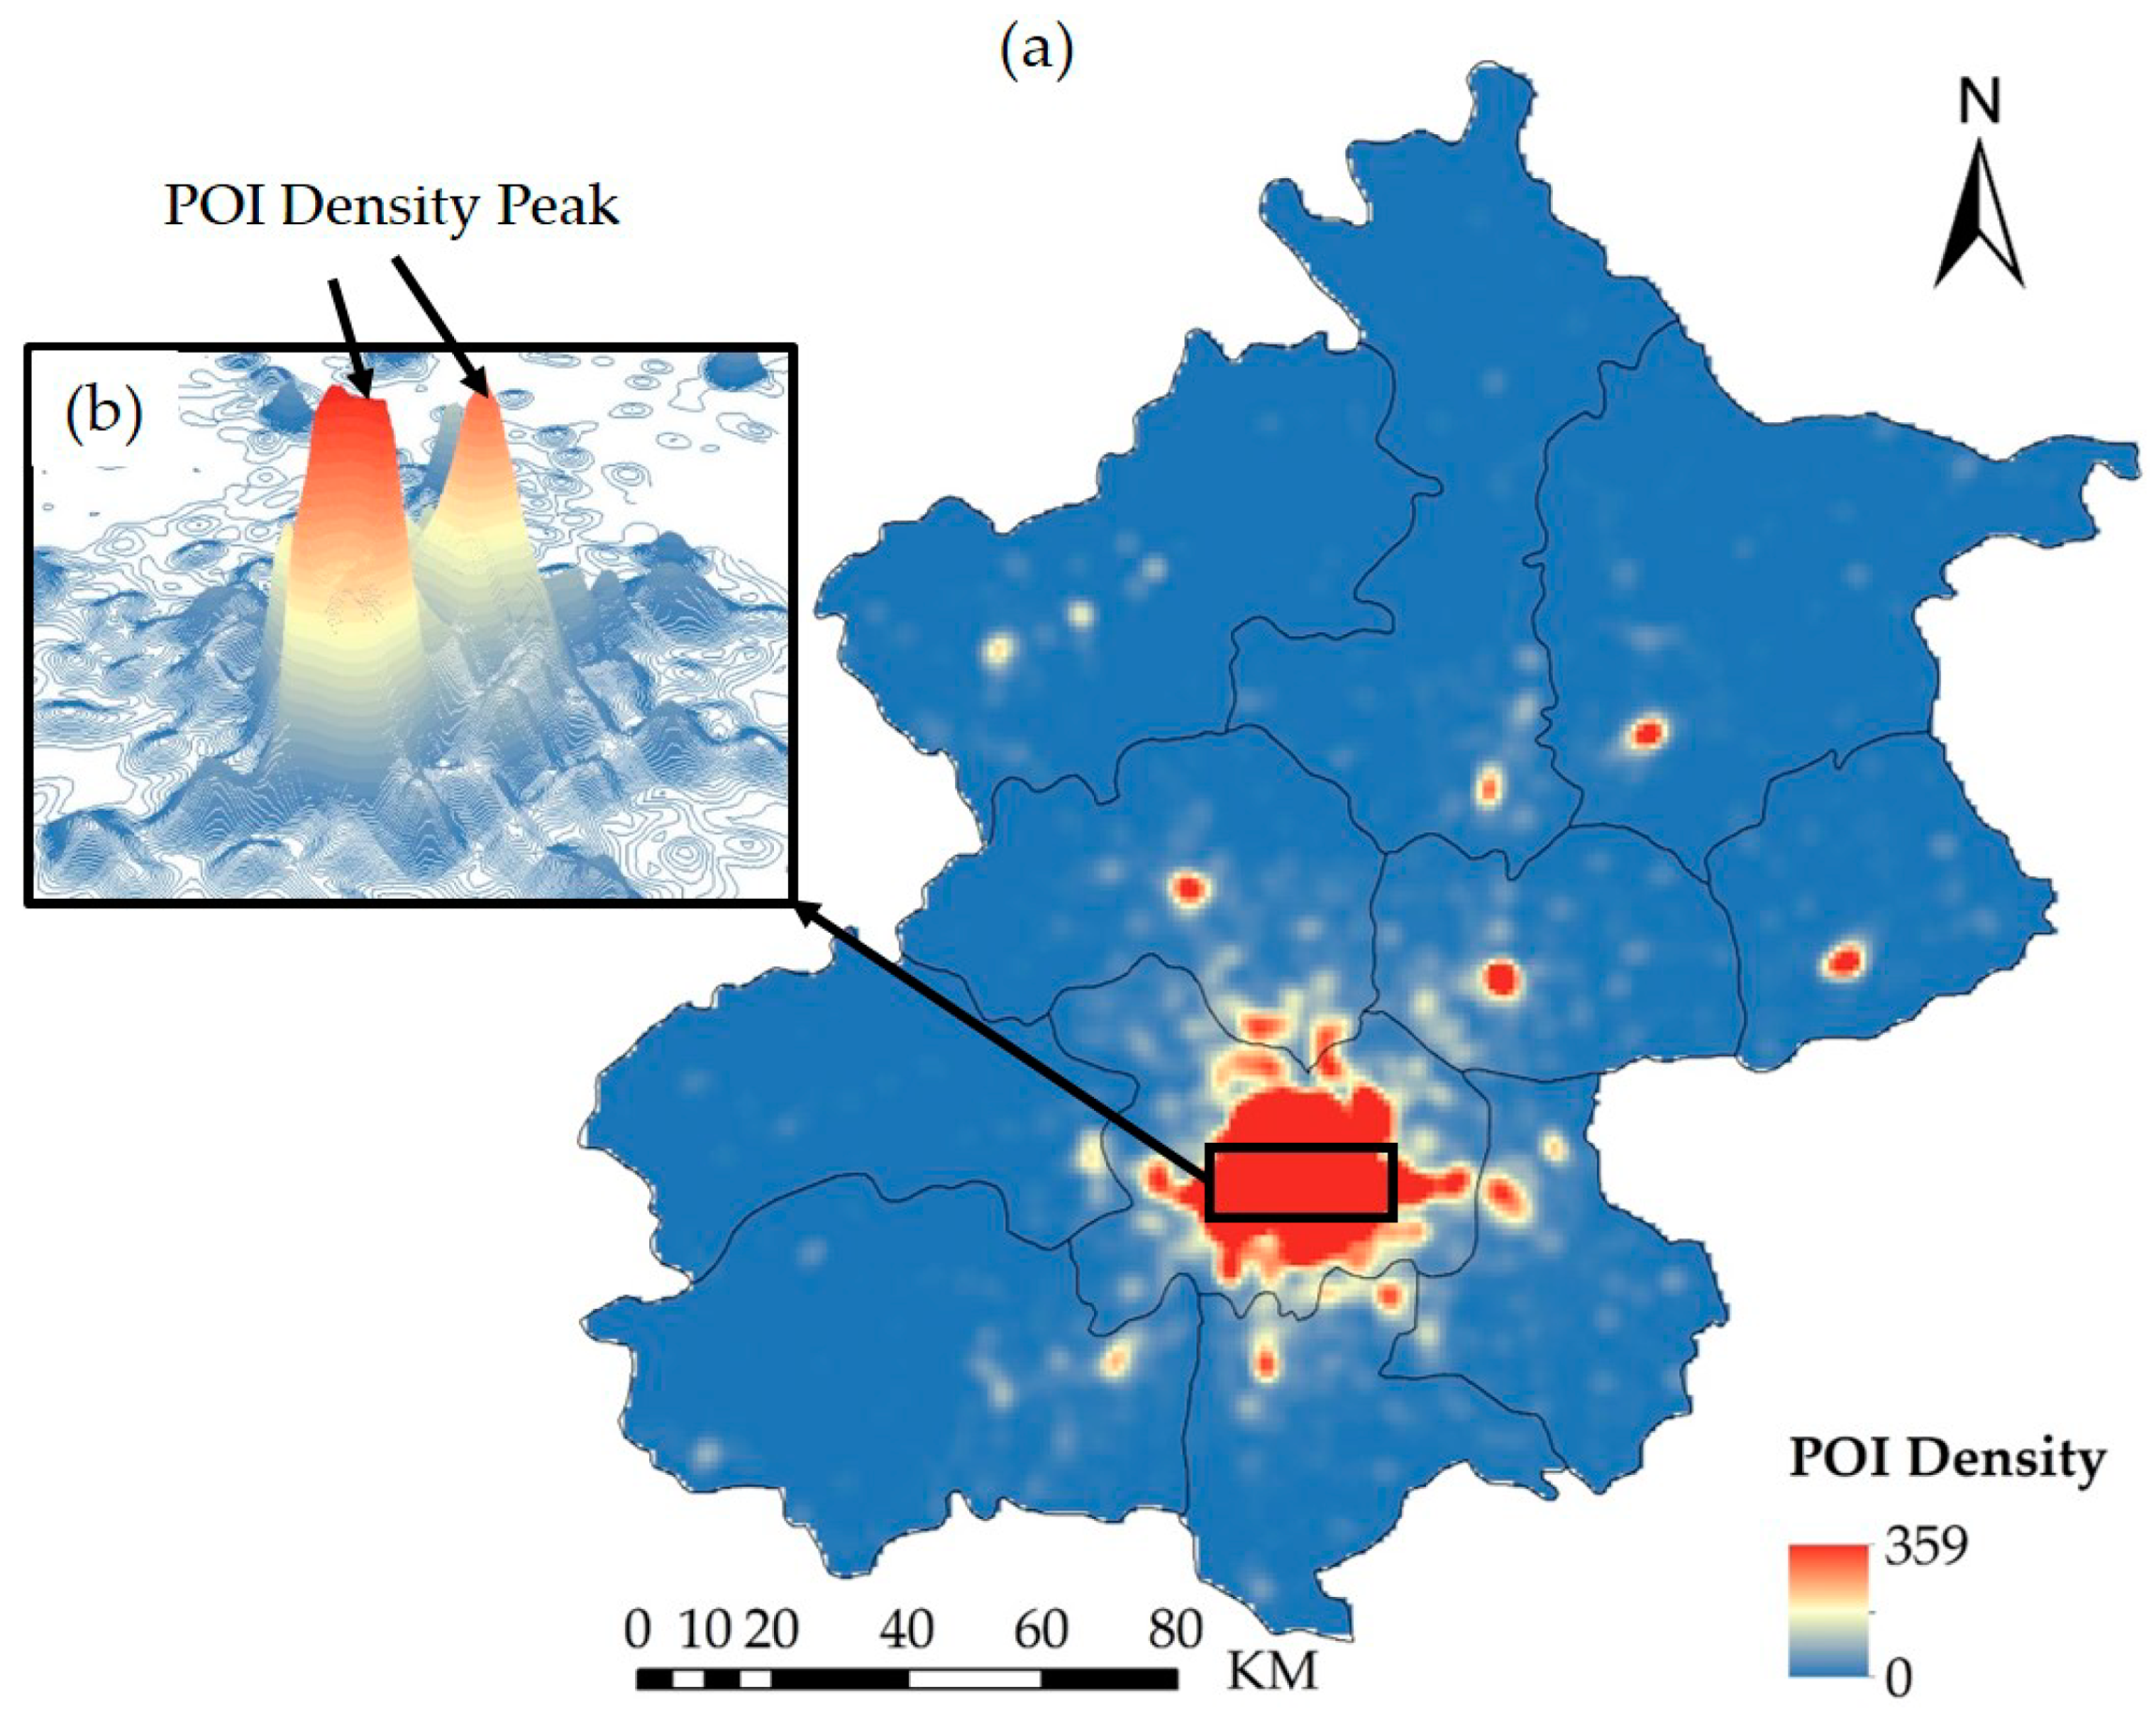
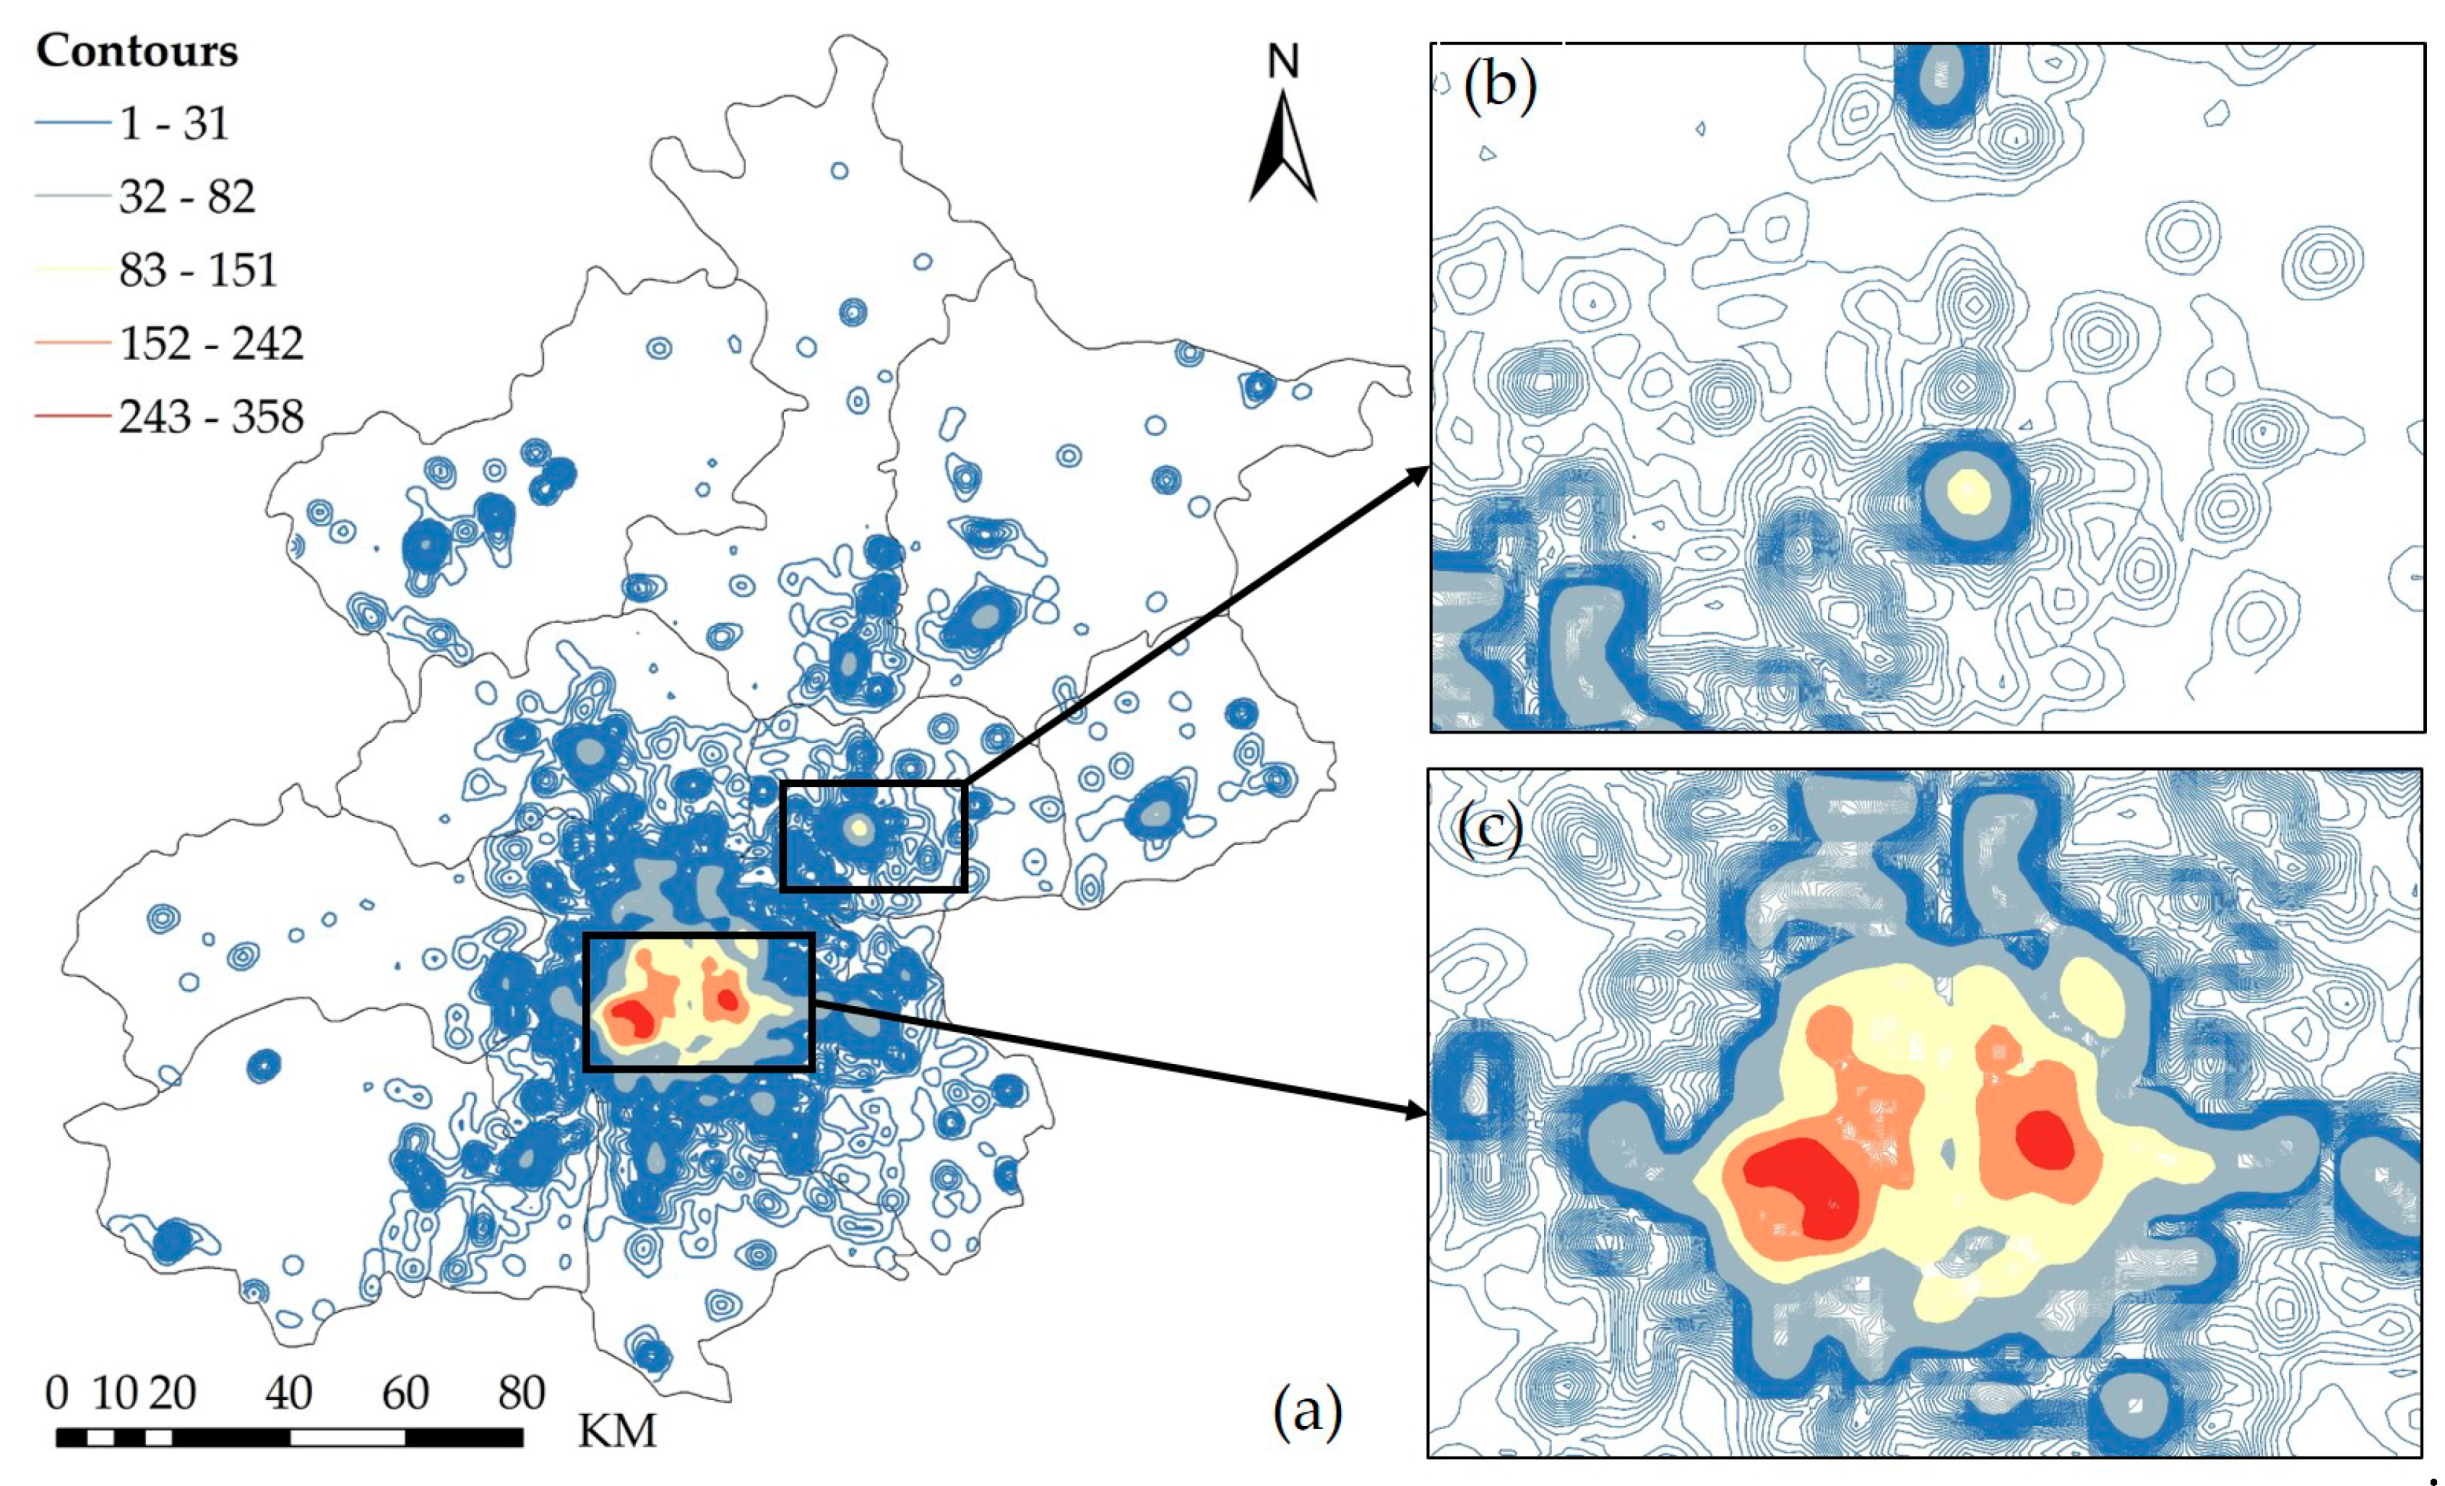
The POI density map (Figure 6) was generated from the POI data using the kernel function and a bandwidth value of 3000 m (Figure 2b). The POI density contour map was then generated from the POI density map with a base contour value of 1 and a contour interval of 10 (Figure 7). The color progression from blue to red in Figure 6 and Figure 7 represents the variation in the POI density from lowest to highest.
4.3. Identification of Urban Polycentric Structure
In accordance with the results of the density curve calculations, the DCTs were generated using 11 as the initial contour value. Figure 8a depicts the spatial extents of the urban polycentric structure in Beijing based on the simplified DCTs constructed from the POI density contour map. A total of 20 contour trees were derived, with a total of 37 leaf nodes, representing 37 urban centers. Among these simplified DCTs, there are 19 single-branch trees, indicating monocentric structures, and one tree, denoted by L, that indicates a polycentric structure, with more than two branches and multiple leaf nodes. Tree L occupies almost the entire central city region (main area) of Beijing. Figure 8b shows the detailed polycentric structure of tree L. The colors from blue to red represent the increasing complexity of this composite urban center.
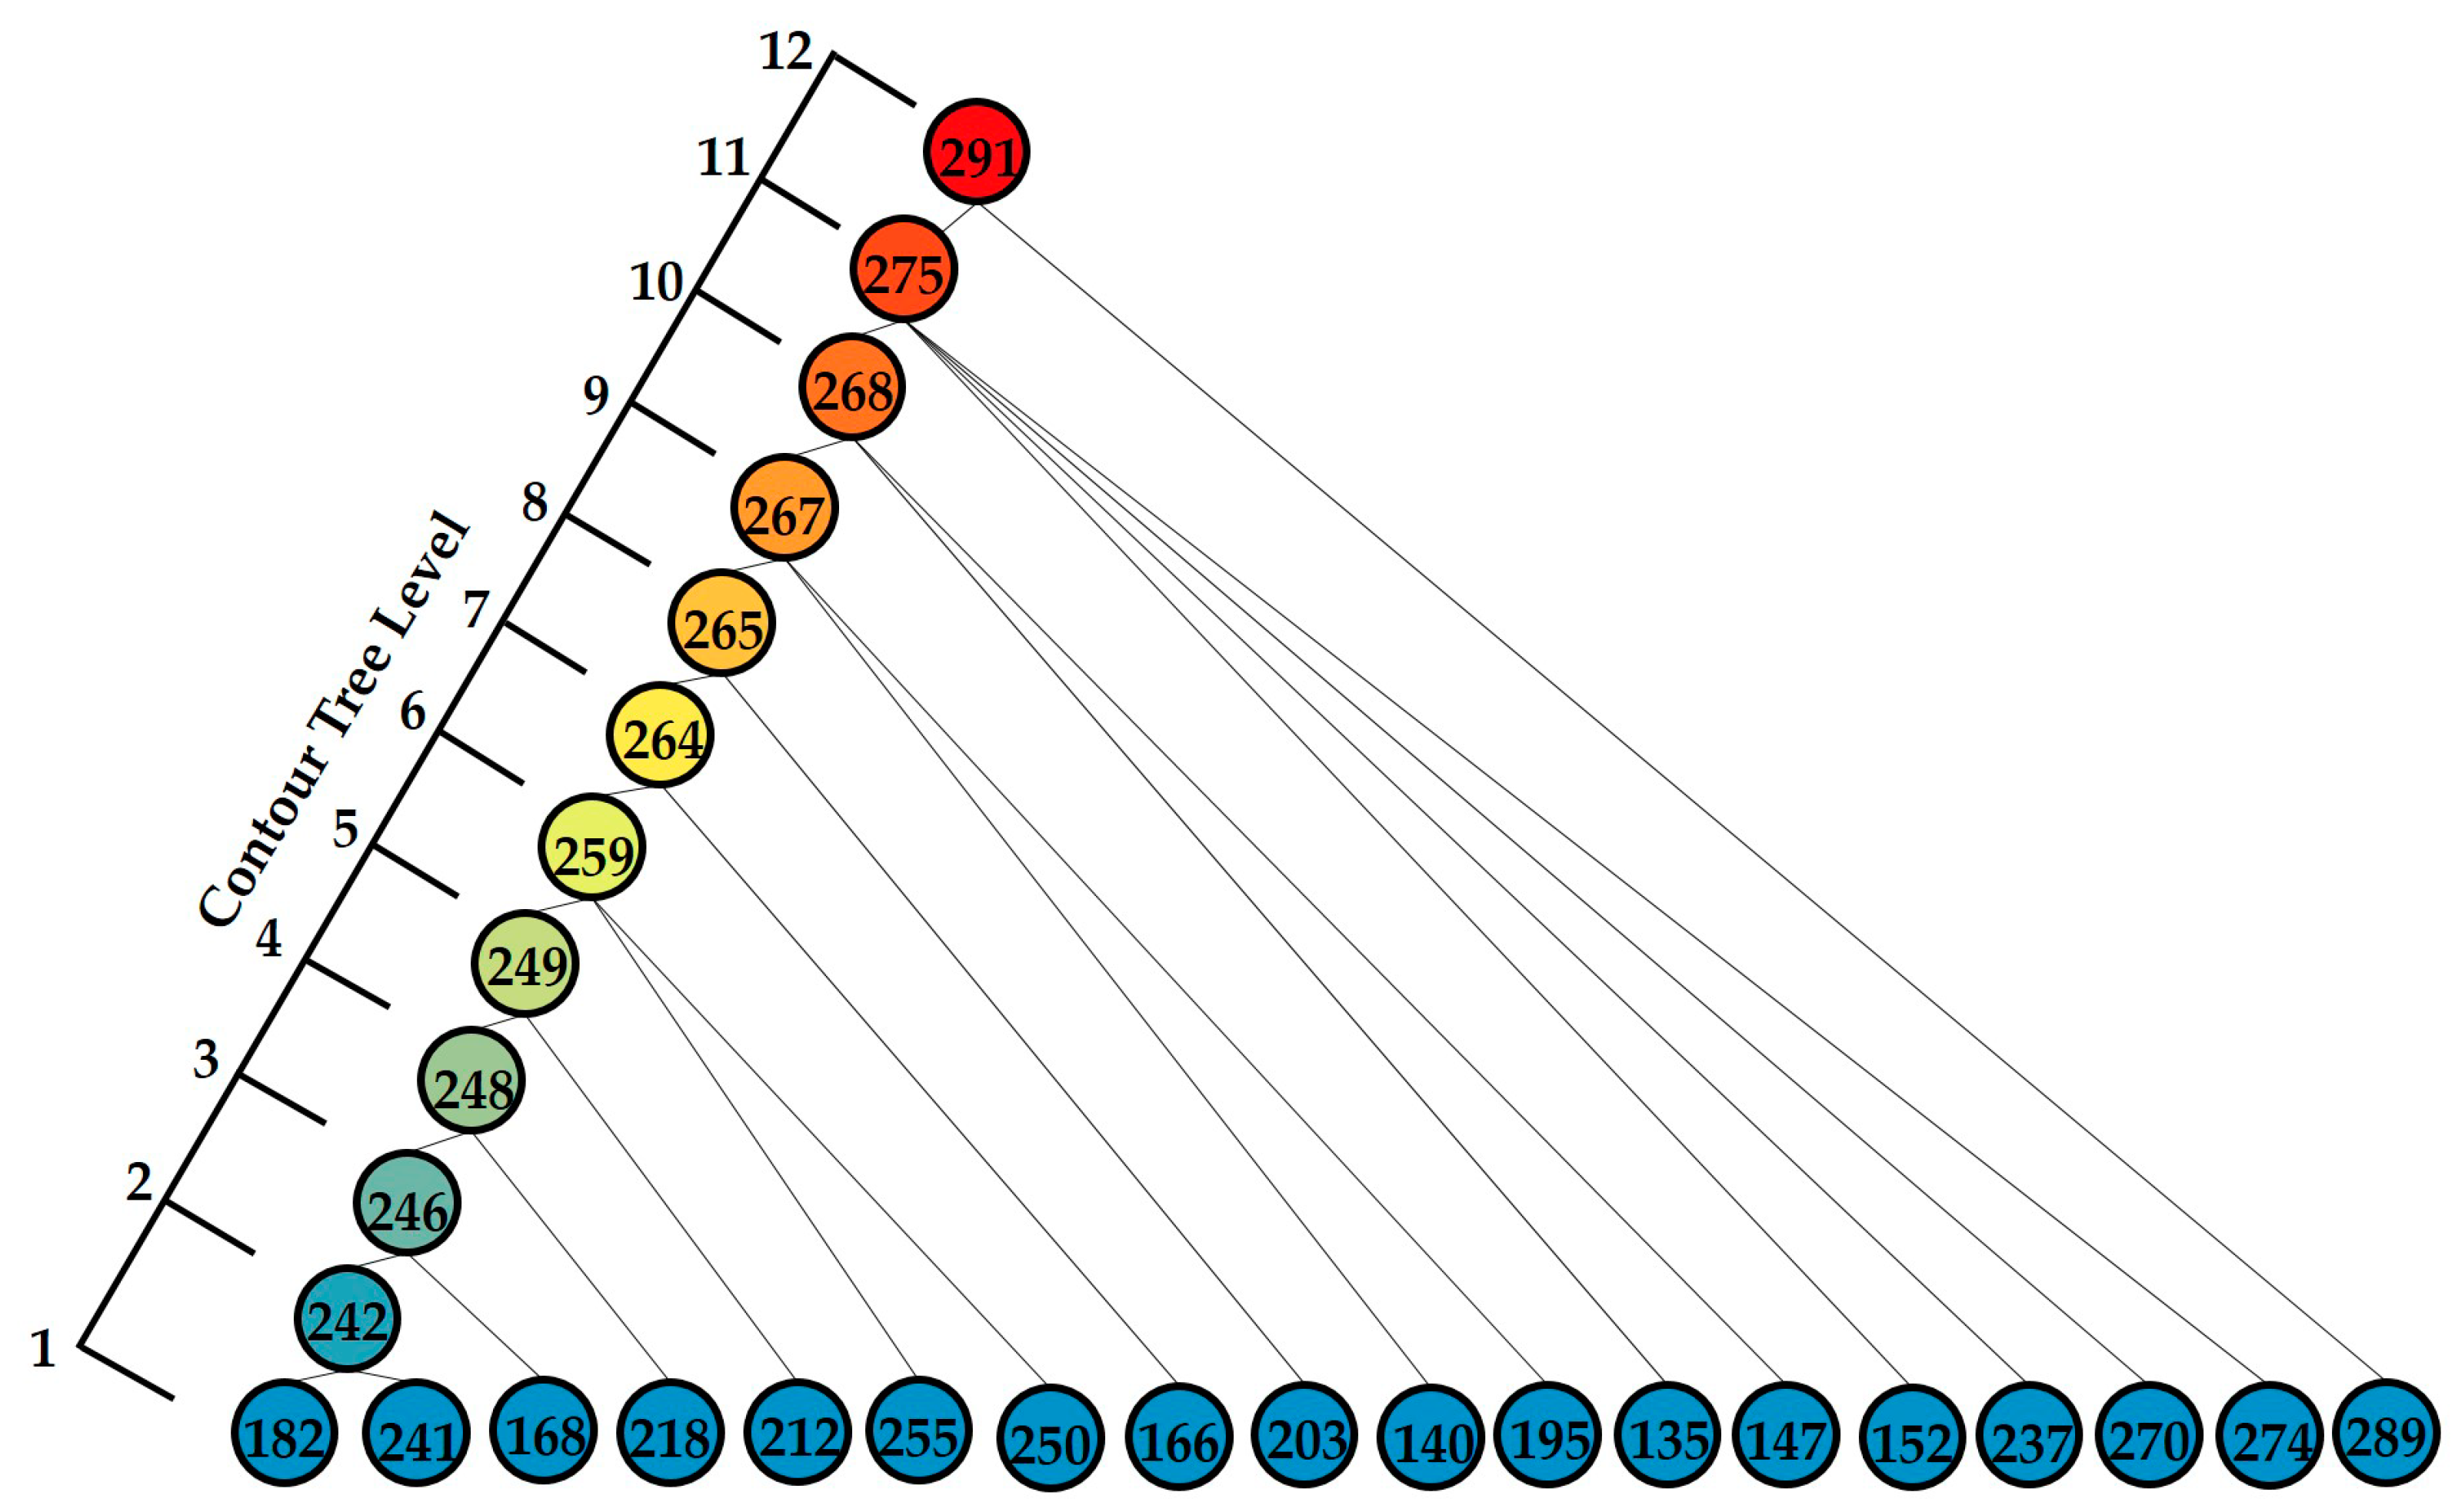
Figure 9 shows the tree structure of the main tree L, which consists of 29 nodes in 12 layers. For example, the first-level leaf nodes 182 and 241 represent two independent elemental urban centers. The second-level node 242 is a composite urban center (composed of leaf nodes 182 and 241). The leaf node 168 and the second-level composite node 242 constitute a more complex third-level composite urban center, represented by node 246. The fourth-level node 248 is composed of the third-level node 246 and an independent urban center. The twelfth-level node 291 is the most complex urban center, consisting of 18 independent elemental centers and 10 complex composite centers.
4.4. Analysis and Validation of Detected Urban Centers
Figure 10 shows the specific geographic locations of the detected urban centers. A total of 37 elemental urban centers were detected in Beijing. The main center of Beijing is a composite area consisting of the Sanlitun region, Tian’anmen Square, the Wukesong region and the Zhongguancun region in the main tree, with a high POI density. Of the 37 urban centers, 18 are located in the main tree L, corresponding to the 18 leaf nodes in Figure 9. The remaining centers are located in the suburbs, with most of them corresponding to districts surrounding government organizations (Figure 10). The finding may be consistent with Max Weber’s views in his book “The Religion of China: Confucianism and Taoism”: The spatial distribution of Chinese cities is mostly influenced by political factors, and the city administrative centers and commercial and financial centers are located in the same areas to ensure efficient operation of the city. Overall, the results suggest that most of the urban centers in Beijing serve comprehensive functions, with only a small number of urban centers having only a single function.
For validation, eight functional centers were chosen, represented by “×” symbols in Figure 11. These centers are part of the “two-axis, dual-frequency, multicenter” urban spatial structure proposed by the Beijing Urban Master Plan (2004–2020) and include the Zhongguancun Science Park Core Area, the Olympic Center, the Central Business District, the Science and Technology Innovation Center of the Haidian Mountain Area, the Shunyi Modern Manufacturing Base, the Tongzhou Comprehensive Service Center, the Yizhuang High-Tech Industrial Development Zone and the Shijingshan Comprehensive Service Center. Our method is capable of identifying the locations and spatial extents of seven of these centers, the exception is the Olympic Center.
4.5. Characteristics of Urban Centers
Table 3 displays the results for the four geometric attributes and three of the statistical attributes of the elemental urban centers in Figure 10. The average area of an elemental urban center in Beijing is 23.92 km2, while the total area of all urban centers is 973.8 km2. The total area of the urban centers accounts for approximately 9% of the total area of the administrative divisions of Beijing. The largest urban center is located in the Central Business District, Chaoyang District, with a spatial area larger than 80 km2, and the smallest is located in Zhongguancun, Haidian District, with a spatial area of only 5 km2. The CI values of the city’s elemental centers range from 0.99 to 0.65, and the average value of ELG is less than 2. The large CI values and small ELG values indicate that most of Beijing’s elemental urban centers are compact.
Table 4 displays the results for the polycentricity values of the urban centers in Beijing. All composite urban centers in the main tree L (levels 2–12 in Figure 9) have a polycentricity value larger than 0.63. For example, the polycentricity value of the root node of the main tree L, node 291, is 0.64, indicating that the area has a polycentric structure. The composite urban center represented by node 248 has the highest polycentricity value (0.84) since the two urban centers (218 and 246) located in it are equally strong. A similar situation exists for the composite urban centers represented by nodes 242 and 246. By contrast, the urban centers far from the central region have a monocentric structure, with a polycentricity value of 0.
4.6. Results of the Uncertainty and Sensitivity Analysis
As shown in Figure 11, urban centers far from the center of the city are not sensitive to changes in the contour interval, while urban centers in the central area are more sensitive to such changes. The main reason for this difference in sensitivity is that the POI density in the central area is much higher than that in the marginal areas. When the contour interval is small, many smaller urban centers can be detected. As shown in Table 5, by setting contour intervals of 5, 10, and 15, we found that a larger contour interval resulted in a smaller total city area. By contrast, a smaller contour interval can result in the detection of more urban centers and an increase in the total urban center area, but at the cost of an increase in the computational burden. When the contour interval is greater than 10, the total urban center area decreases, but the number of urban centers remains unchanged. Based on this finding, we believe that 10 is the appropriate contour interval.
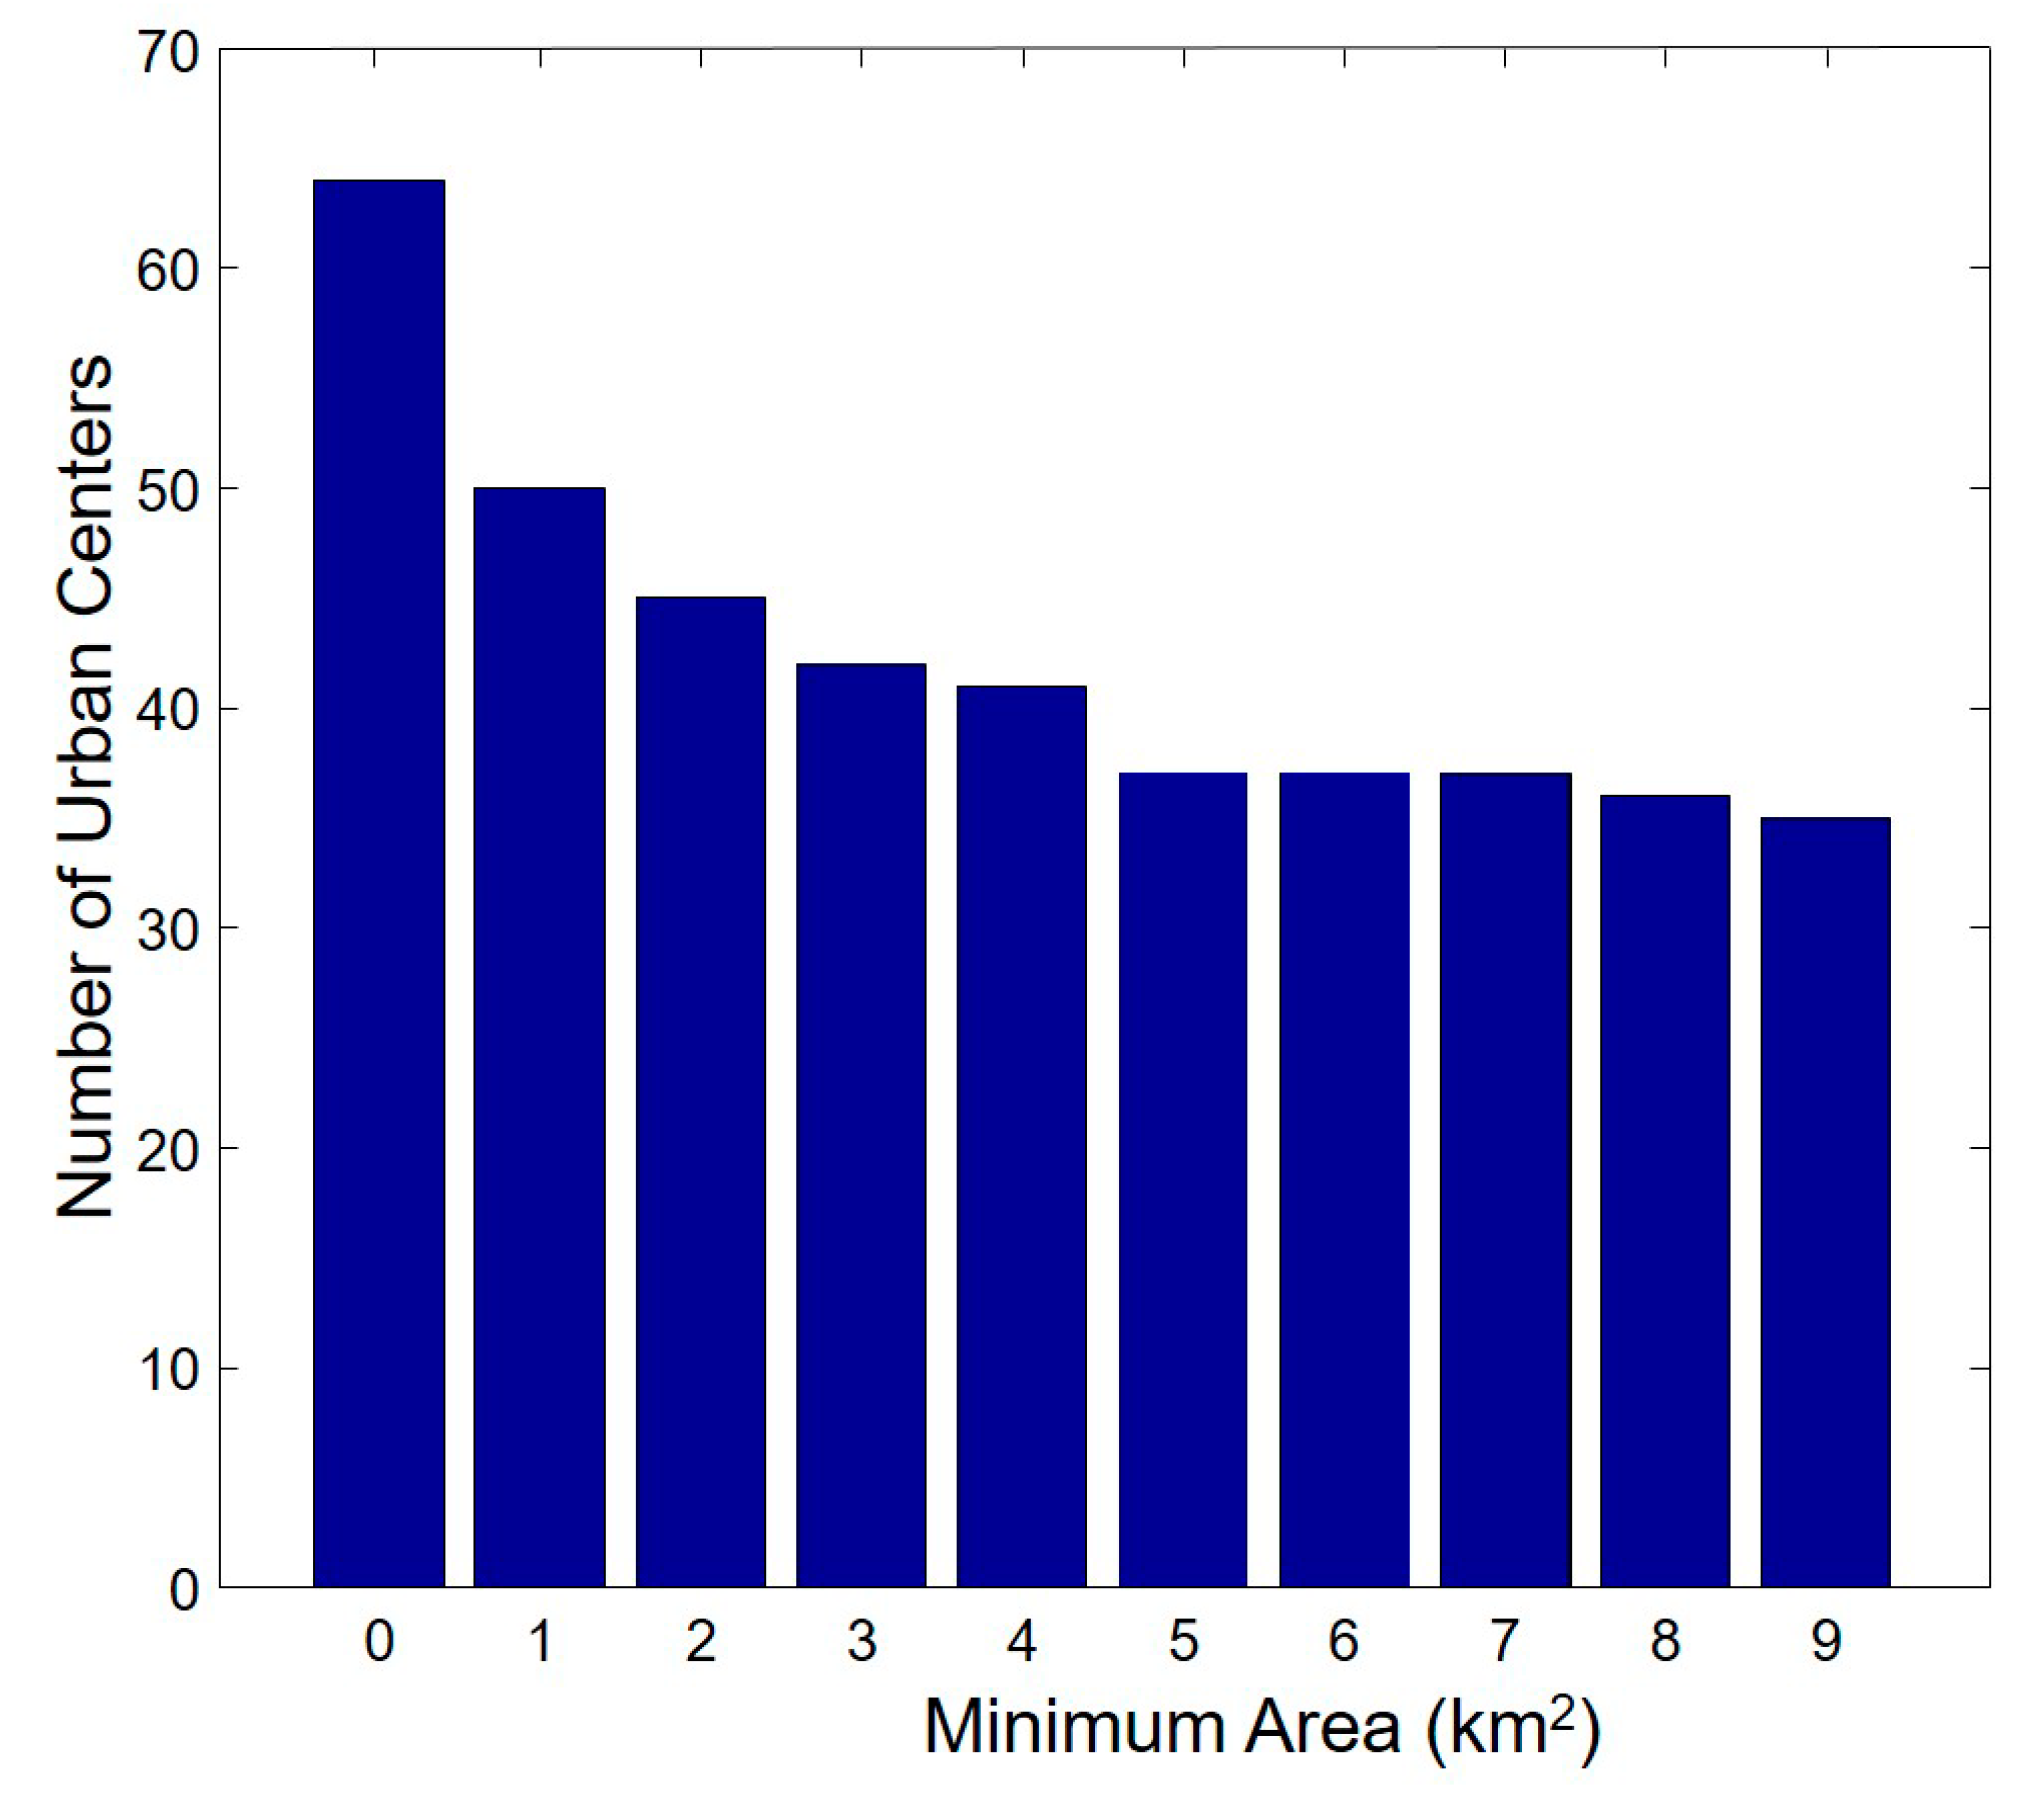
Figure 12 illustrates that the number of urban centers significantly decreases when the minimum area parameter is reduced from 0 to 5 km2. When the parameter is larger than 5 km2, the number of urban centers is stable. This parameter may differ for different experimental areas.
5. Discussion
(1) Spatial structure of the urban centers in Beijing
Using the POI data obtained from an electronic map service, we explored the polycentric structure of Beijing. In addition, we deduced the POI intensity, location and morphological attributes of each urban center. Based on their identified functions, we have marked the main functions of all detected urban centers in Figure 10.
Comprehensive centers are the most predominant overall, followed by commercial centers and public service centers. On the other hand, the number of urban centers in the suburbs has increased. Rudimentary commercial centers have appeared in Daxing, Tongzhou, and Shunyi. With the further development of the city, these commercial centers may be integrated into comprehensive urban centers in the suburbs, and these areas may become the cores of future suburban development. For example, Daxing International Airport will develop into an important center for transportation services in the Beijing-Tianjin-Hebei region. Tongzhou will become the deputy center of Beijing.
(2) Superiority of the proposed method
In this study, the POI density data were treated as topographical elevation data reflecting the centrality of the city. The DCT method has multiple advantages in urban polycentric structure detection. First, the DCT method identifies both the semantic information (area, shape, and density) of urban centers and the spatial relationships (e.g., proximity relationships) between urban centers. Thus, it assists in analyzing other characteristics of urban centers, such as the POI density and the total urban center area. Second, the detection of urban centers is not restricted by administrative boundaries, meaning that the results can better reflect the natural form of urban centers. Third, this method can capture the spatial hierarchy of urban centers and is suitable for multicenter recognition at different spatial scales. In accordance with the specific needs of the situation, we can flexibly use either composite urban centers or elemental urban centers to describe the urban structure.
It is worth noting that when the DCT method is applied to different cities, the selected parameters are expected to be different. The parameter values should be determined in accordance with the real local situation. In addition, the recognition accuracy for urban centers is greatly affected by the quality of the POI data. For example, the Olympic Center is not recognized by this method. A possible reason is that although the Olympic Center covers a large area, its POI density is lower than that of its surroundings. In future research, different types of POIs should be weighted in accordance with their areas and other attributes.
6. Conclusions
Although political and urban planning is crucial to the formation of urban centers, exploring the locations of urban centers and their spatial structure from a morphological perspective can serve as a basis for future urban development and planning. In this study, we conceptualize the spatial density of POIs in the form of a topographic surface to capture different levels of urban development. The areas with the highest POI densities represent urban centers. Taking Beijing as an example, by using POI data and the proposed DCT method, we have successfully detected 37 urban centers and their spatial relationships and have revealed the polycentric morphological characteristics of this urban region. In addition, the characteristics of urban centers have been analyzed. Compared with previous census-data-based methods, our method has the advantages of high computational efficiency, high spatial resolution, and highly accurate results.
In addition, uncertainty and incompleteness of POI data from Internet maps should be noted. First, the POI data are only a representative point of the spatial geographic entity and do not have the size attribute of the entity. All POIs are considered equally in the analysis, but in fact, some larger or more well-known POIs (e.g., schools and hospitals) should be given greater weight. Future work should assign different weights according to the area attribute or popularity of the POI, which can more accurately reflect the spatial structure characteristics of the city. Second, there is a situation in the Internet map that uses only one POI to represent a residential building or a hospital clinic, and POI data are also able to reflect city characteristics only from a specific perspective. Future studies could take advantage of each type of data and combine the results to identify comprehensive patterns of urban polycentric structure.
Author Contributions
Data curation and visualization, A.L.; formal analysis and software, Y.L.; funding acquisition and project administration, J.L.; methodology and writing original draft, Y.D.
Funding
This research was supported by the National Key Research and Development Plan of China (Project Numbers 2016YFC0803106, 2017YBF0503601 and 2017YFB0503502)
Conflicts of Interest
The authors declare no conflict of interest.
References
- Davoudi, S. European Briefing: Polycentricity in European spatial planning: From an analytical tool to a normative agenda. Eur. Plan. Stud. 2003, 11, 979–999. [Google Scholar] [CrossRef]
- Meijers, E. Measuring Polycentricity and its Promises. Eur. Plan. Stud. 2008, 16, 1313–1323. [Google Scholar] [CrossRef]
- Mumford, L.; Turner, B.S. The Culture of Cities; Harcourt, Brace and Company: New York, NY, USA, 1938. [Google Scholar]
- Timberlake, M. The Polycentric Metropolis: Learning from Mega-City Regions in Europe; Routledge: Abingdon, UK, 2009. [Google Scholar]
- Halbert, L.; Convery, F.J.; Thierstein, A. Reflections on the Polycentric Metropolis. Built. Environ. 2006, 32, 110–113. [Google Scholar] [CrossRef]
- Wang, Y.; Gu, Y.; Dou, M.; Qiao, M. Using Spatial Semantics and Interactions to Identify Urban Functional Regions. ISPRS Int. J. Geo-Inf. 2018, 7, 130. [Google Scholar] [CrossRef]
- Zhao, P.; Lü, B.; Roo, G.D. Urban expansion and transportation: The impact of urban form on commuting patterns on the city fringe of Beijing. Environ. Plan. A 2010, 42, 2467–2486. [Google Scholar] [CrossRef]
- Chen, M.-C.; Chang, K. Reasoning the causality of city sprawl, traffic congestion, and green land disappearance in Taiwan using the CLD model. Int. J. Environ. Res. Public Health 2014, 11, 11464–11480. [Google Scholar] [CrossRef] [PubMed]
- Garouani, A.E.; Mulla, D.J.; Garouani, S.E.; Knight, J. Analysis of urban growth and sprawl from remote sensing data: Case of Fez, Morocco. Int. J. Sustain. Built Environ. 2017, 6, 160–169. [Google Scholar] [CrossRef]
- Gao, Z.; Kii, M.; Nonomura, A.; Nakamura, K. Urban expansion using remote-sensing data and a monocentric urban model. Comput. Environ. Urban Syst. 2017. [Google Scholar] [CrossRef]
- Bloom, D.E.; David, C.; Günther, F. Urbanization and the wealth of nations. Science 2008, 319, 772–775. [Google Scholar] [CrossRef]
- Meijers, E.J. Metropolitan Labor Productivity and Urban Spatial Structure. In Metropolitan Regions. Advances in Spatial Science (The Regional Science Series); Klaesson, J., Johansson, B., Karlsson, C., Eds.; Springer: Berlin/Heidelberg, Germany, 2013. [Google Scholar]
- Lv, Y.; Zheng, X.; Lin, Z.; Zhang, L. Decentralization and Polycentricity: Spatial Changes of Employment in Beijing Metropolitan Area, China. Sustainability 2017, 9, 1880. [Google Scholar] [CrossRef]
- Garcia-López, M.À.; Moreno-Monroy, A.I. Income segregation in monocentric and polycentric cities: Does urban form really matter? Reg. Sci. Urban Econ. 2018, 71, 62–79. [Google Scholar] [CrossRef] [Green Version]
- Veneri, P. Assessing Polycentric Urban Systems in the OECD: Country, Regional and Metropolitan Perspectives. Eur. Plan. Stud. 2014, 23, 1128–1145. [Google Scholar]
- Arribas-Bel, D.; Sanz-Gracia, F. The validity of the monocentric city model in a polycentric age: US metropolitan areas in 1990, 2000 and 2010. Urban Geogr. 2014, 35, 980–997. [Google Scholar] [CrossRef] [Green Version]
- Sun, B.; Ting, T.U.; Shi, W.; Guo, Y. Test on the Performance of Polycentric Spatial Structure as a Measure of Congestion Reduction in Megacities: The Case Study of Shanghai. Urban Plann. Forum. 2013, 2, 17–23. [Google Scholar]
- Taubenböck, H.; Standfuß, I.; Wurm, M.; Krehl, A.; Siedentop, S. Measuring morphological polycentricity—A comparative analysis of urban mass concentrations using remote sensing data. Comput. Environ. Urban Syst. 2017, 64, 42–56. [Google Scholar]
- Fu, Z.; Zhou, K.; Liang, F. Identifying Urban Subcenters from Commuting Fluxes: A Case Study of Wuhan, China. IEEE Access 2017, 5, 10161–10171. [Google Scholar] [CrossRef]
- Chen, Z.; Yu, B.; Song, W.; Liu, H.; Wu, Q.; Shi, K.; Wu, J. A New Approach for Detecting Urban Centers and Their Spatial Structure with Nighttime Light Remote Sensing. IEEE Trans. Geosci. Remote Sens. 2017, 99, 1–15. [Google Scholar] [CrossRef]
- Wang, S.; Xu, G.; Guo, Q. Street Centralities and Land Use Intensities Based on Points of Interest (POI) in Shenzhen, China. Isprs Int. J. Geo-Inf. 2018, 7, 425. [Google Scholar] [CrossRef]
- Zhang, X.; Li, W.; Zhang, F.; Liu, R.; Du, Z. Identifying Urban Functional Zones Using Public Bicycle Rental Records and Point-of-Interest Data. Isprs Int. J. Geo-Inf. 2018, 7, 459. [Google Scholar] [CrossRef]
- Zhao, W.; Qingquan, L.I. Extracting hierarchical landmarks from urban POI data. J. Remote Sens. 2011, 15, 973–988. [Google Scholar]
- Ying, L.; Shen, Z. Discovering Functional Zones Using Bus Smart Card Data and Points of Interest in Beijing. In Geospatial Analysis to Support Urban Planning in Beijing. GeoJournal Library; Springer: Cham Switzerland, 2016; Volume 116. [Google Scholar]
- Yuan, J.; Zheng, Y.; Xie, X. Discovering regions of different functions in a city using human mobility and POIs. In Proceedings of the 18th SIGKDD conference on Knowledge Discovery and Data Mining, Beijing, China, 12–16 August 2012. [Google Scholar]
- Hu, Y.; Han, Y. Identification of Urban Functional Areas Based on POI Data: A Case Study of the Guangzhou Economic and Technological Development Zone. Sustainability 2019, 11, 1385. [Google Scholar] [CrossRef]
- Mangiarotti, L. Advanced Classical Field Theory; World Scientific: Singapore, 2009. [Google Scholar]
- Becker, R.A.; Cáceres, R.; Hanson, K.; Ji, M.L.; Urbanek, S.; Varshavsky, A.; Volinsky, C. A Tale of One City: Using Cellular Network Data for Urban Planning. IEEE Pervasive Comput. 2011, 10, 18–26. [Google Scholar] [CrossRef]
- Giuliano, G.; Small, K.A. Subcenters in the Los Angeles Region. Reg. Sci. Urban Econ. 1991, 21, 163–182. [Google Scholar] [CrossRef]
- Mcmillen, D.P.; Smith, S.C. The number of subcenters in large urban areas. J. Urban Econ. 2015, 53, 321–338. [Google Scholar] [CrossRef]
- Mcmillen, D.P. Nonparametric Employment Subcenter Identification. J. Urban Econ. 2001, 50, 448–473. [Google Scholar] [CrossRef]
- Sun, B.; Shi, W.; Ning, Y. An Empirical Study on the Polycentric Urban Structure of Shanghai and Strategies in Future. Urban Plan. Forum 2010, 23, 58–63. [Google Scholar]
- Shi, K.; Chang, H.; Yu, B.; Bing, Y.; Huang, Y.; Wu, J. Evaluation of NPP-VIIRS night-time light composite data for extracting built-up urban areas. Remote Sens. Lett. 2014, 5, 358–366. [Google Scholar] [CrossRef]
- Yu, L.; Xi, L.; Song, G.; Li, G.; Kang, C.; Ye, Z.; Chi, G.; Li, S. Social Sensing: A New Approach to Understanding Our Socioeconomic Environments. Ann. Assoc. Am. Geogr. 2015, 105, 512–530. [Google Scholar]
- Zhang, Q.; Schaaf, C.; Seto, K.C. The Vegetation Adjusted NTL Urban Index: A new approach to reduce saturation and increase variation in nighttime luminosity. Remote Sens. Environ. 2013, 129, 32–41. [Google Scholar] [CrossRef]
- Steiniger, S.; Neun, M.; Edwardes, A. Foundations of Location Based Services; University of Zurich, ETH Zurich: Zürich, Switzerland, 2006. [Google Scholar]
- Goodchild, M.F. Citizens as sensors: The world of volunteered geography. GeoJournal 2007, 69, 211–221. [Google Scholar] [CrossRef]
- Hollenstein, L.; Purves, R. Exploring place through user-generated content: Using Flickr to describe city cores. J. Spat. Inf. Sci. 2010, 1, 21–48. [Google Scholar]
- Cai, J.; Bo, H.; Song, Y. Using multi-source geospatial big data to identify the structure of polycentric cities. Remote Sens. Environ. 2017, 202, 210–221. [Google Scholar] [CrossRef]
- Duan, Y.M.; Liu, Y.; Liu, X.H.; Wang, H.L. Identification of Polycentric Urban Structure of Central Chongqing Using Points of Interest Big Data. J. Nat. Resourc. 2018, 33, 788–800. [Google Scholar]
- Camille, R.; Soong Moon, K.; Michael, B.; Marc, B. Structure of urban movements: Polycentric activity and entangled hierarchical flows. Plos ONE 2011, 6, e15923. [Google Scholar]
- Liu, X.; Gong, L.; Gong, Y.; Liu, Y. Revealing travel patterns and city structure with taxi trip data. J. Transp. Geogr. 2015, 43, 78–90. [Google Scholar] [CrossRef] [Green Version]
- Henderson, M.; Yeh, E.T.; Gong, P.; Elvidge, C.; Baugh, K. Validation of urban boundaries derived from global night-time satellite imagery. Int. J. Remote Sens. 2003, 24, 595–609. [Google Scholar] [CrossRef]
- Identifying Spatial Structure of Urban Functional Centers Using Travel Survey Data: A Case Study of Singapore. In Proceedings of the First ACM SIGSPATIAL International Workshop on Computational Models of Place, Orlando, FL, USA, 5–8 November 2013; pp. 28–33.
- Liu, X.; Wang, M. How polycentric is urban China and why? A case study of 318 cities. Landsc. Urban Plan. 2016, 15, 110–120. [Google Scholar] [CrossRef]
- Heidenreich, N.B.; Schindler, A.; Sperlich, S. Bandwidth selection for kernel density estimation: A review of fully automatic selectors. Asta Adv. Stat. Anal. 2013, 97, 403–433. [Google Scholar] [CrossRef]
- Okabe, A.; Satoh, T.; Sugihara, K. A kernel density estimation method for networks, its computational method and a GIS-based tool. Int. J. Geogr. Inf. Sci. 2009, 23, 7–32. [Google Scholar] [CrossRef]
- Guilbert, E. Multi-level representation of terrain features on a contour map. Geoinformatica 2013, 17, 301–324. [Google Scholar] [CrossRef]
- Wu, Q.; Liu, H.; Wang, S.; Yu, B.; Beck, R.; Hinkel, K. A localized contour tree method for deriving geometric and topological properties of complex surface depressions based on high-resolution topographical data. Int. J. Geogr. Inf. Sci. 2015, 29, 2041–2060. [Google Scholar] [CrossRef]
- Chen, J.; Qiao, C.; Zhao, R. A Voronoi interior adjacency-based approach for generating a contour tree. Editor. Board Geomat. Inf. Sci. Wuhan Univ. 2004, 30, 355–367. [Google Scholar] [CrossRef]
- Sedgewick, R.; Wesley, A. Algorithms in C++, Parts 1-4: Fundamentals, Data Structure, Sorting, Searching; Addison-Wesley Professional: Boston, MA, USA, 1998. [Google Scholar]
- Davis, J.C. Statistics and Data Analysis in Geology, 3rd ed.; Wiley: Hoboken, NJ, USA, 1973. [Google Scholar]
- Lei, W. An object-based conceptual framework and computational method for representing and analyzing coastal morphological changes. Int. J. Geogr. Inf. Sci. 2010, 24, 1015–1041. [Google Scholar]
- Wu, K. Measuring Polycentric Urban Development in China: An Intercity Transportation Network Perspective. Reg. Stud. 2015, 8, 1302–1315. [Google Scholar]
Figure 1.
Flowchart of the proposed method.
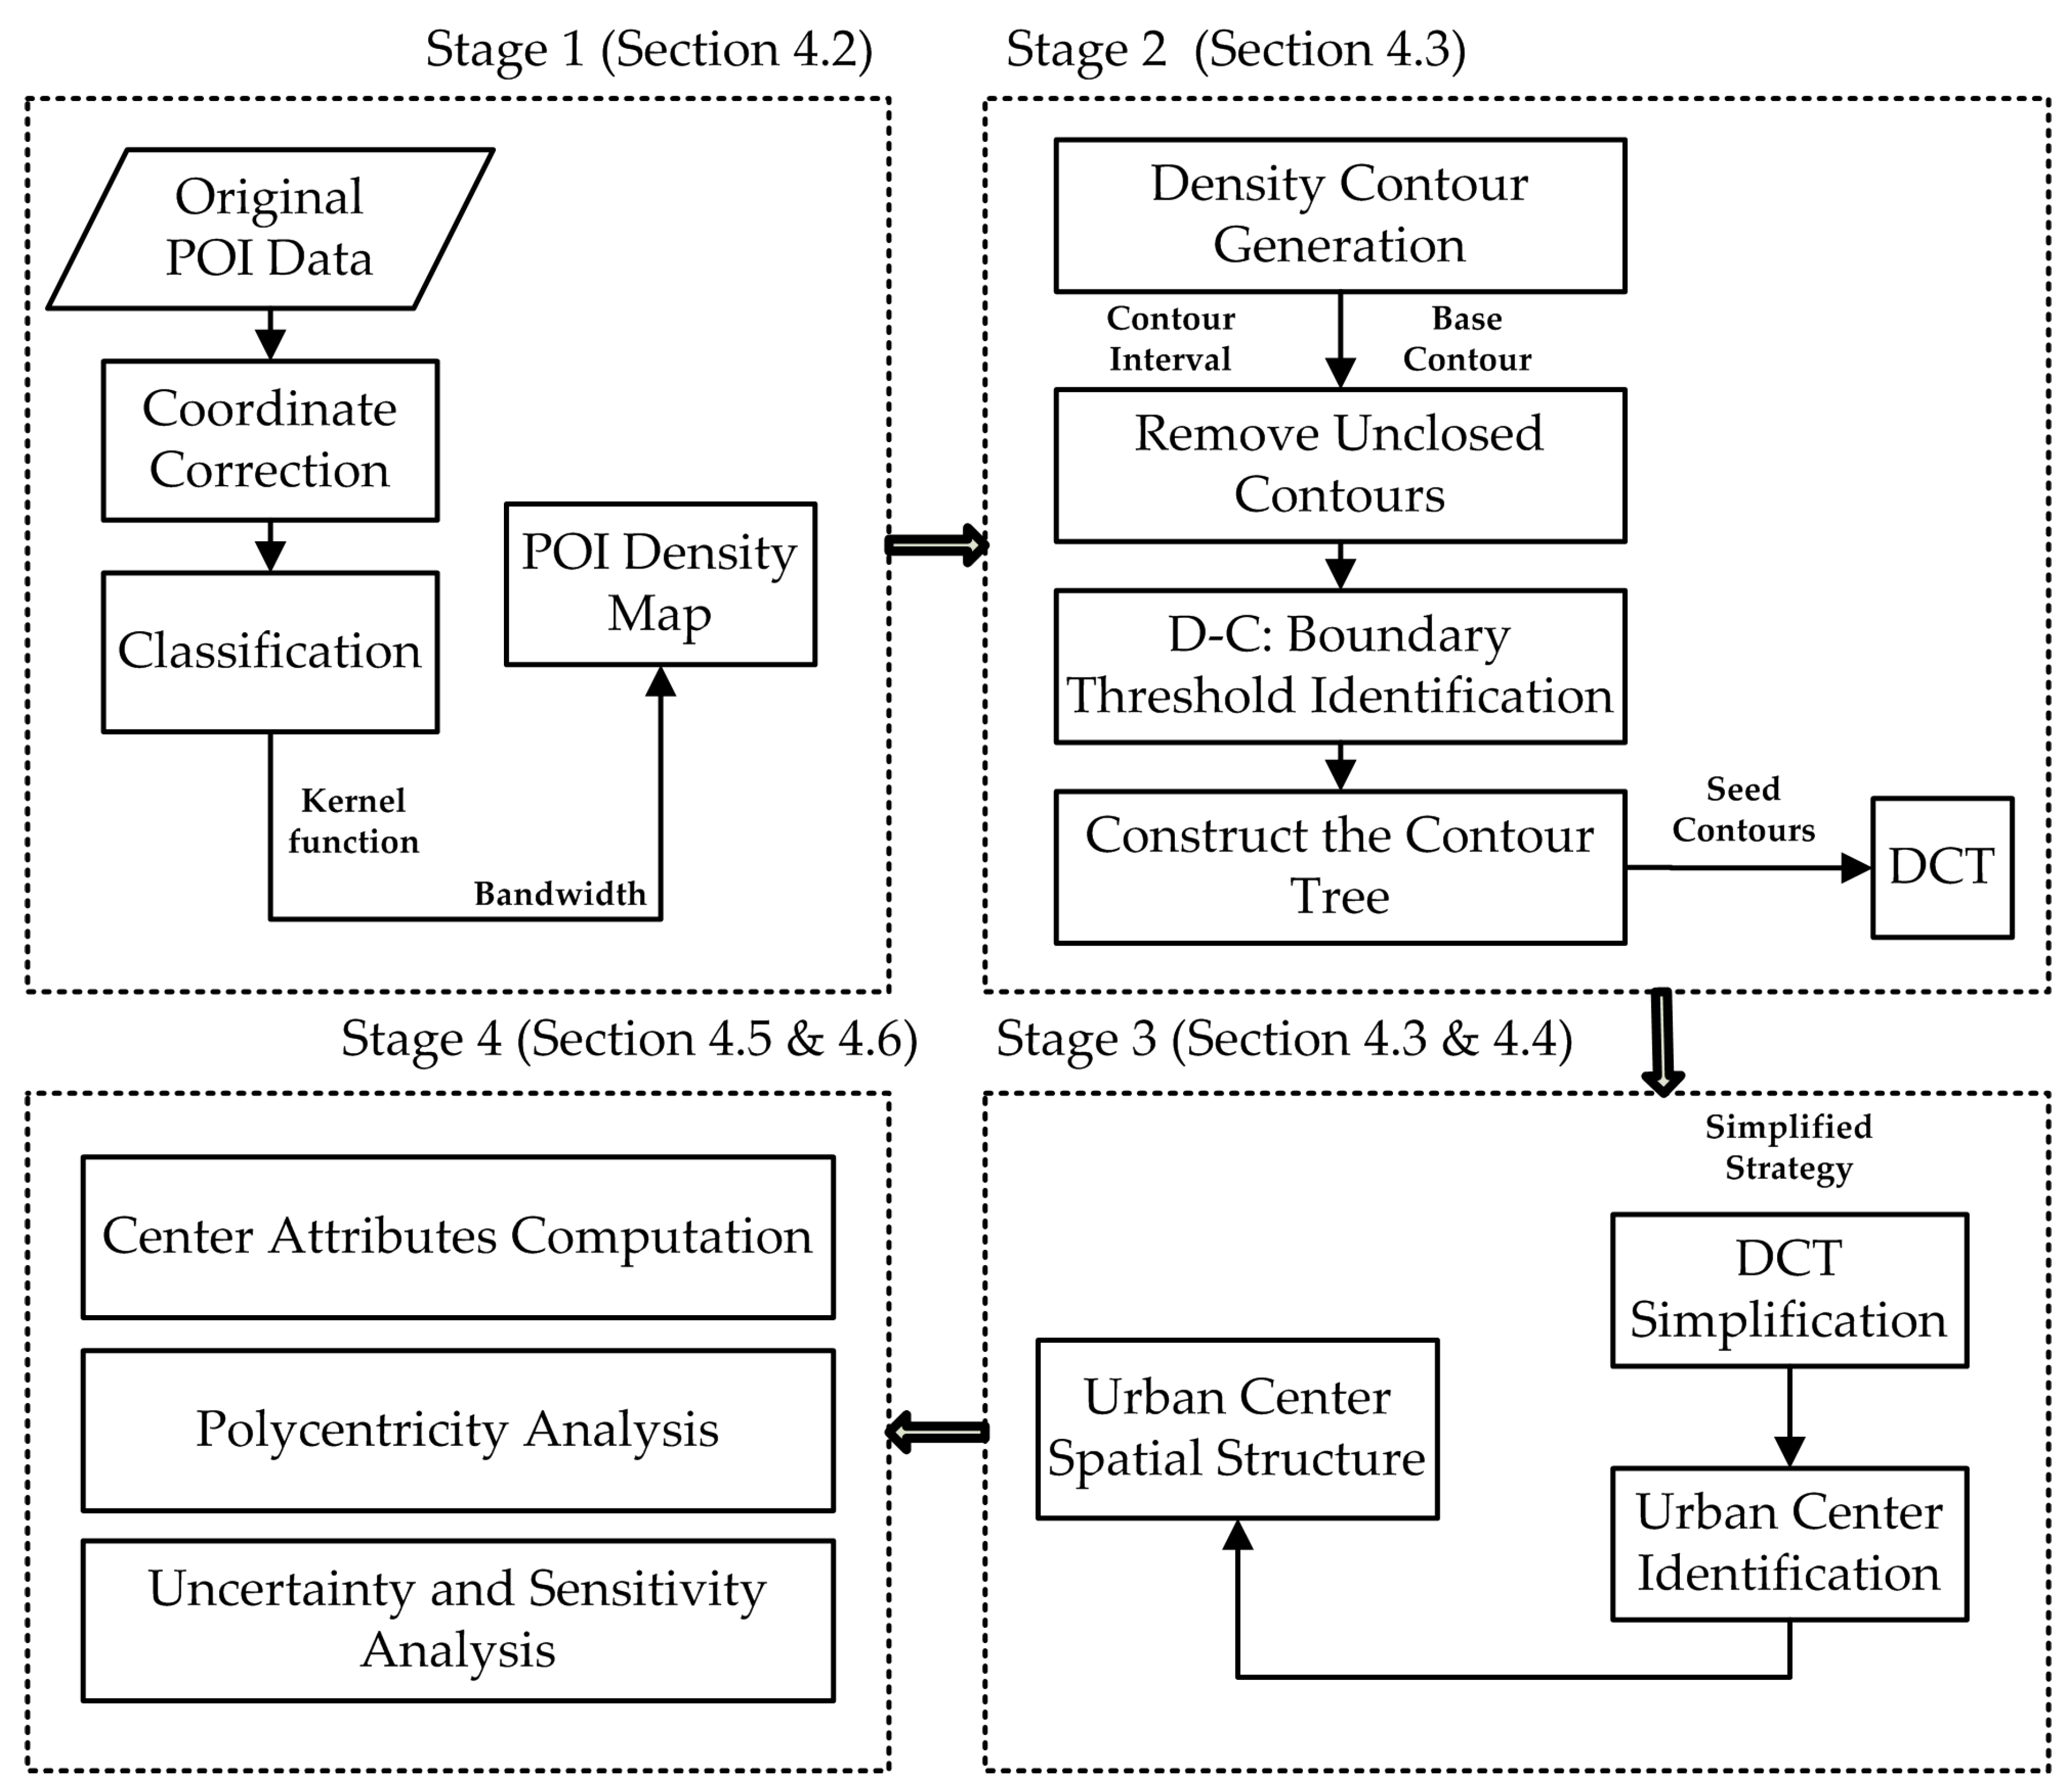
Figure 2.
Kernel estimation with different bandwidths.

Figure 3.
Density curve analysis of the point-of-interest (POI) density contours for a built-up area. (a) Density contours of the rural-urban region. (b) Density curve of the rural-urban region.
Figure 3.
Density curve analysis of the point-of-interest (POI) density contours for a built-up area. (a) Density contours of the rural-urban region. (b) Density curve of the rural-urban region.

Figure 4.
Contour tree generation diagrams. (a) Contour map of the POI density. (b) Regular contour tree. (c) Simplified contour tree.
Figure 4.
Contour tree generation diagrams. (a) Contour map of the POI density. (b) Regular contour tree. (c) Simplified contour tree.
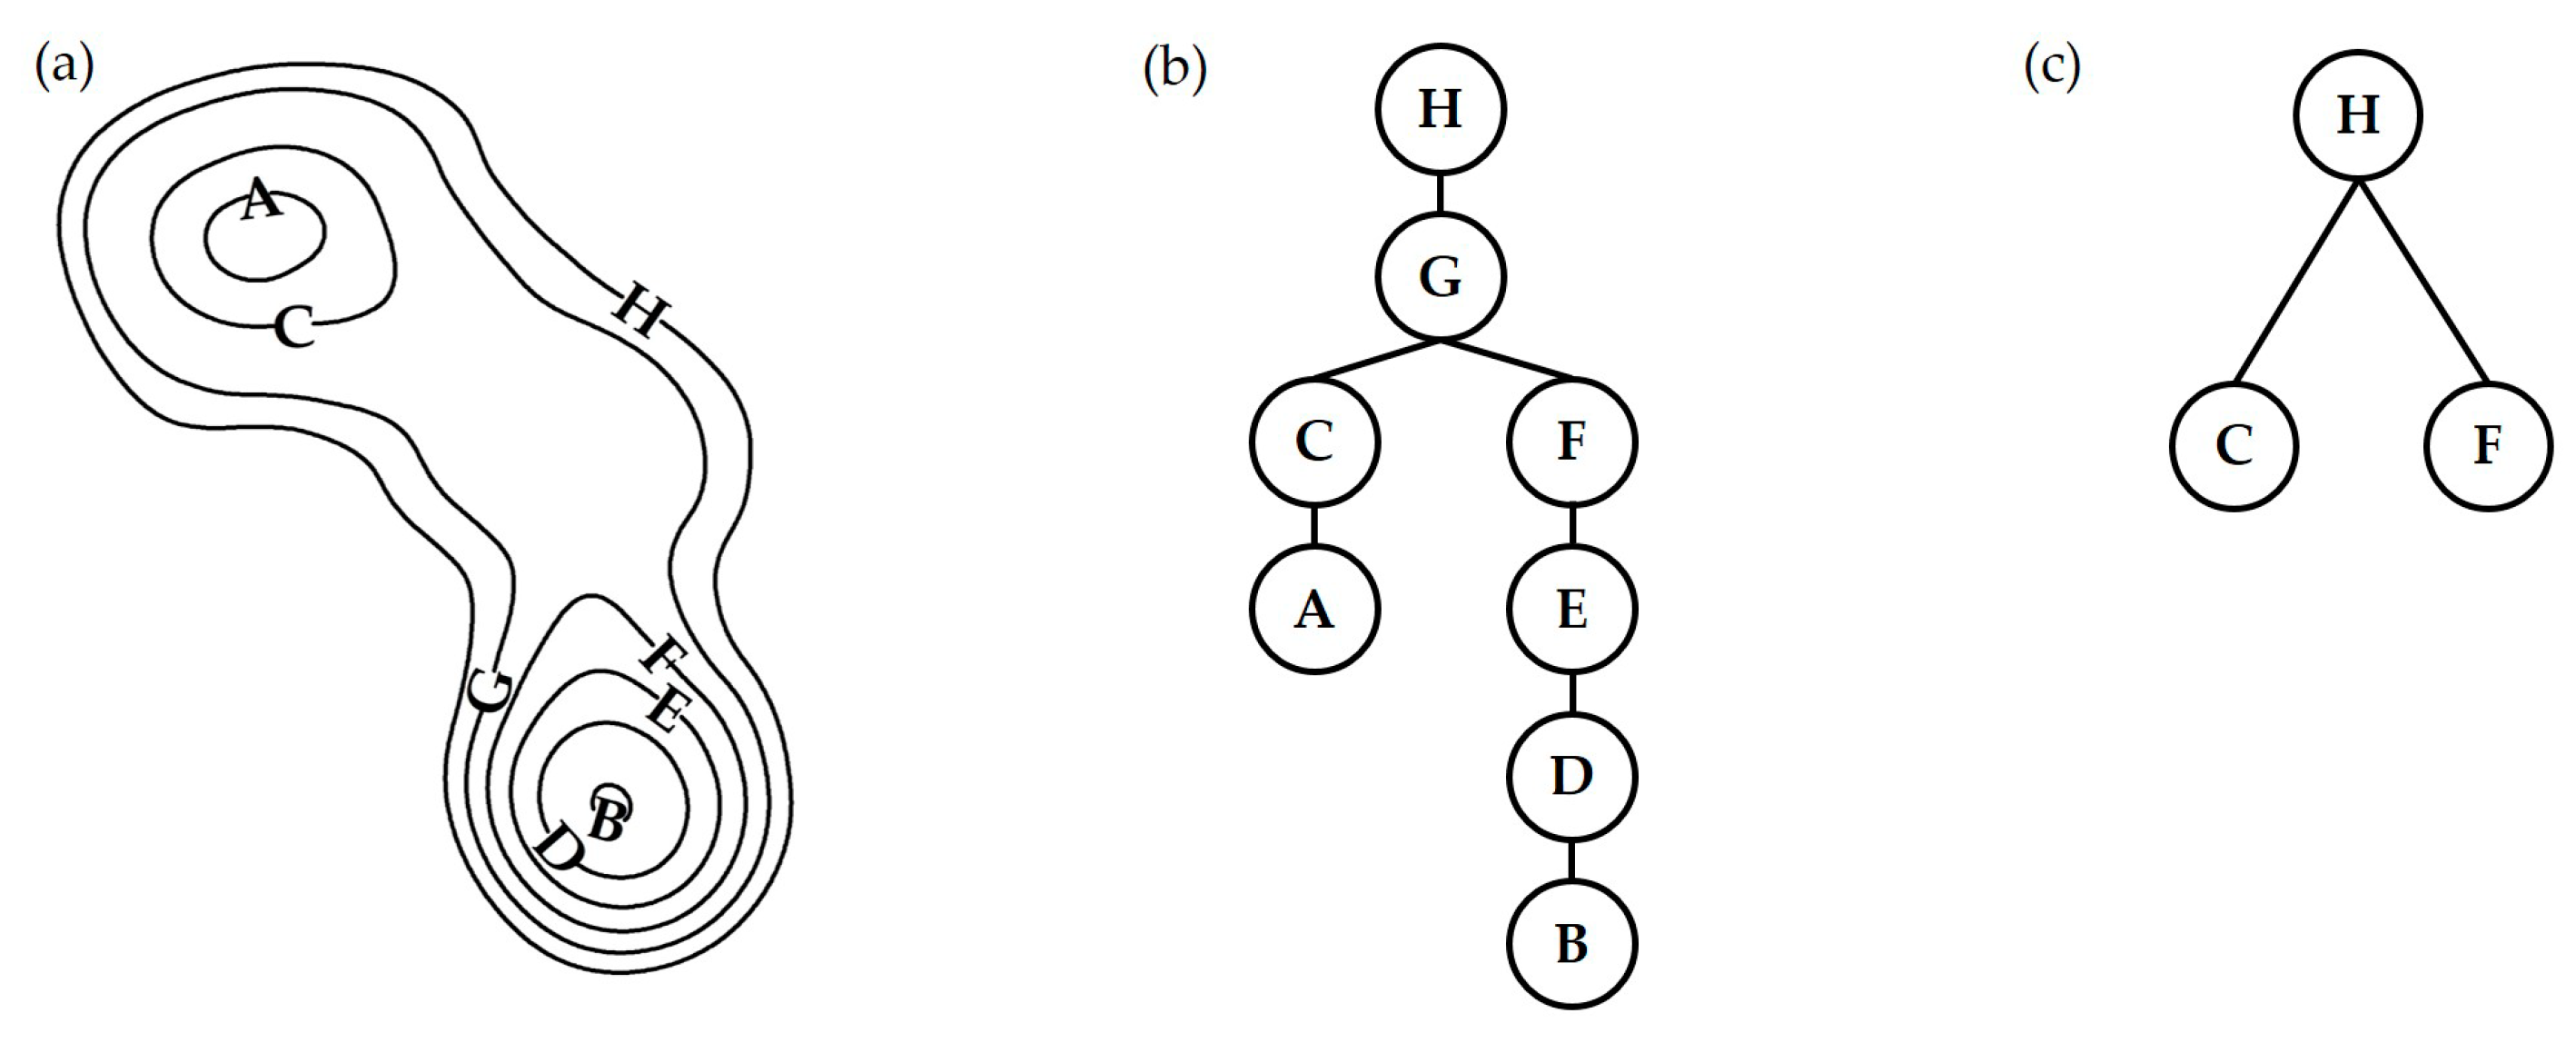
Figure 5.
Geographical location of the study area.
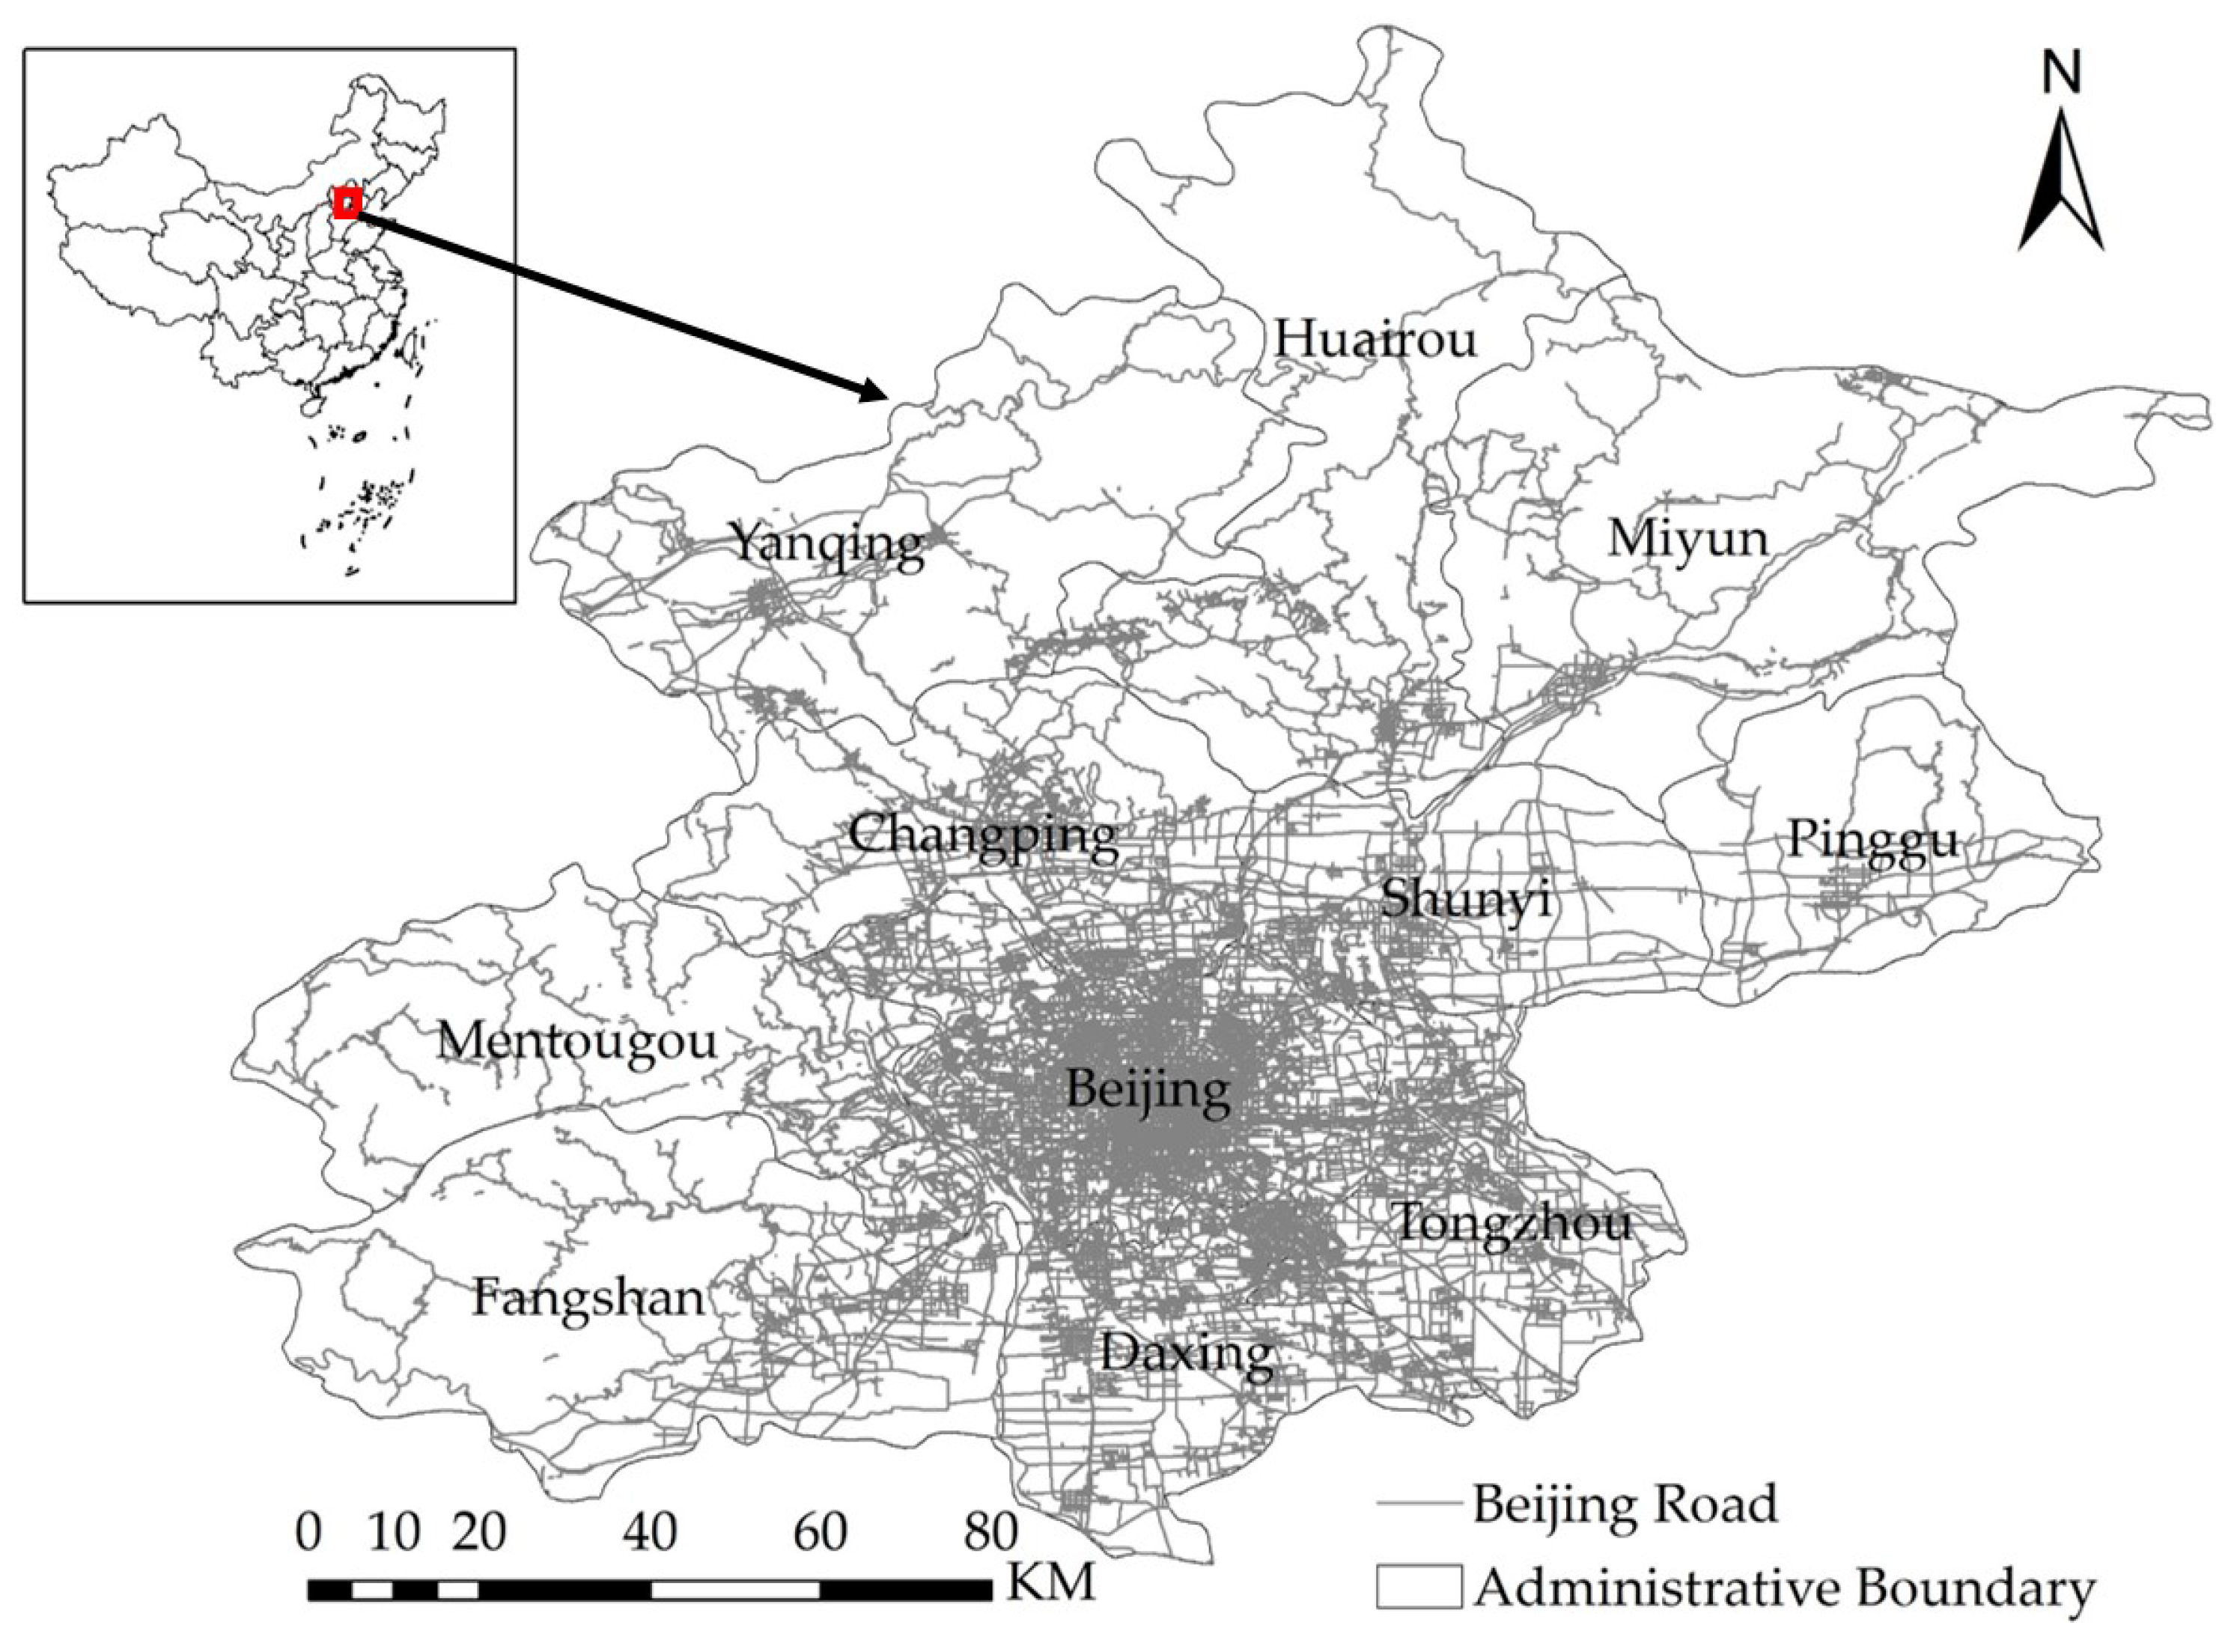
Figure 6.
(a) POI density map of Beijing. (b) 3-D view of POI density peaks in the main urban center area.
Figure 6.
(a) POI density map of Beijing. (b) 3-D view of POI density peaks in the main urban center area.

Figure 7.
(a) Density contour map of Beijing. (b,c) Views of (b) the Shunyi region and (c) the main region of Beijing, enlarged to show details.
Figure 7.
(a) Density contour map of Beijing. (b,c) Views of (b) the Shunyi region and (c) the main region of Beijing, enlarged to show details.

Figure 8.
(a) Boundaries of the density contour trees (DCTs) in Beijing. (b) Largest DCT (L) for Beijing.
Figure 8.
(a) Boundaries of the density contour trees (DCTs) in Beijing. (b) Largest DCT (L) for Beijing.
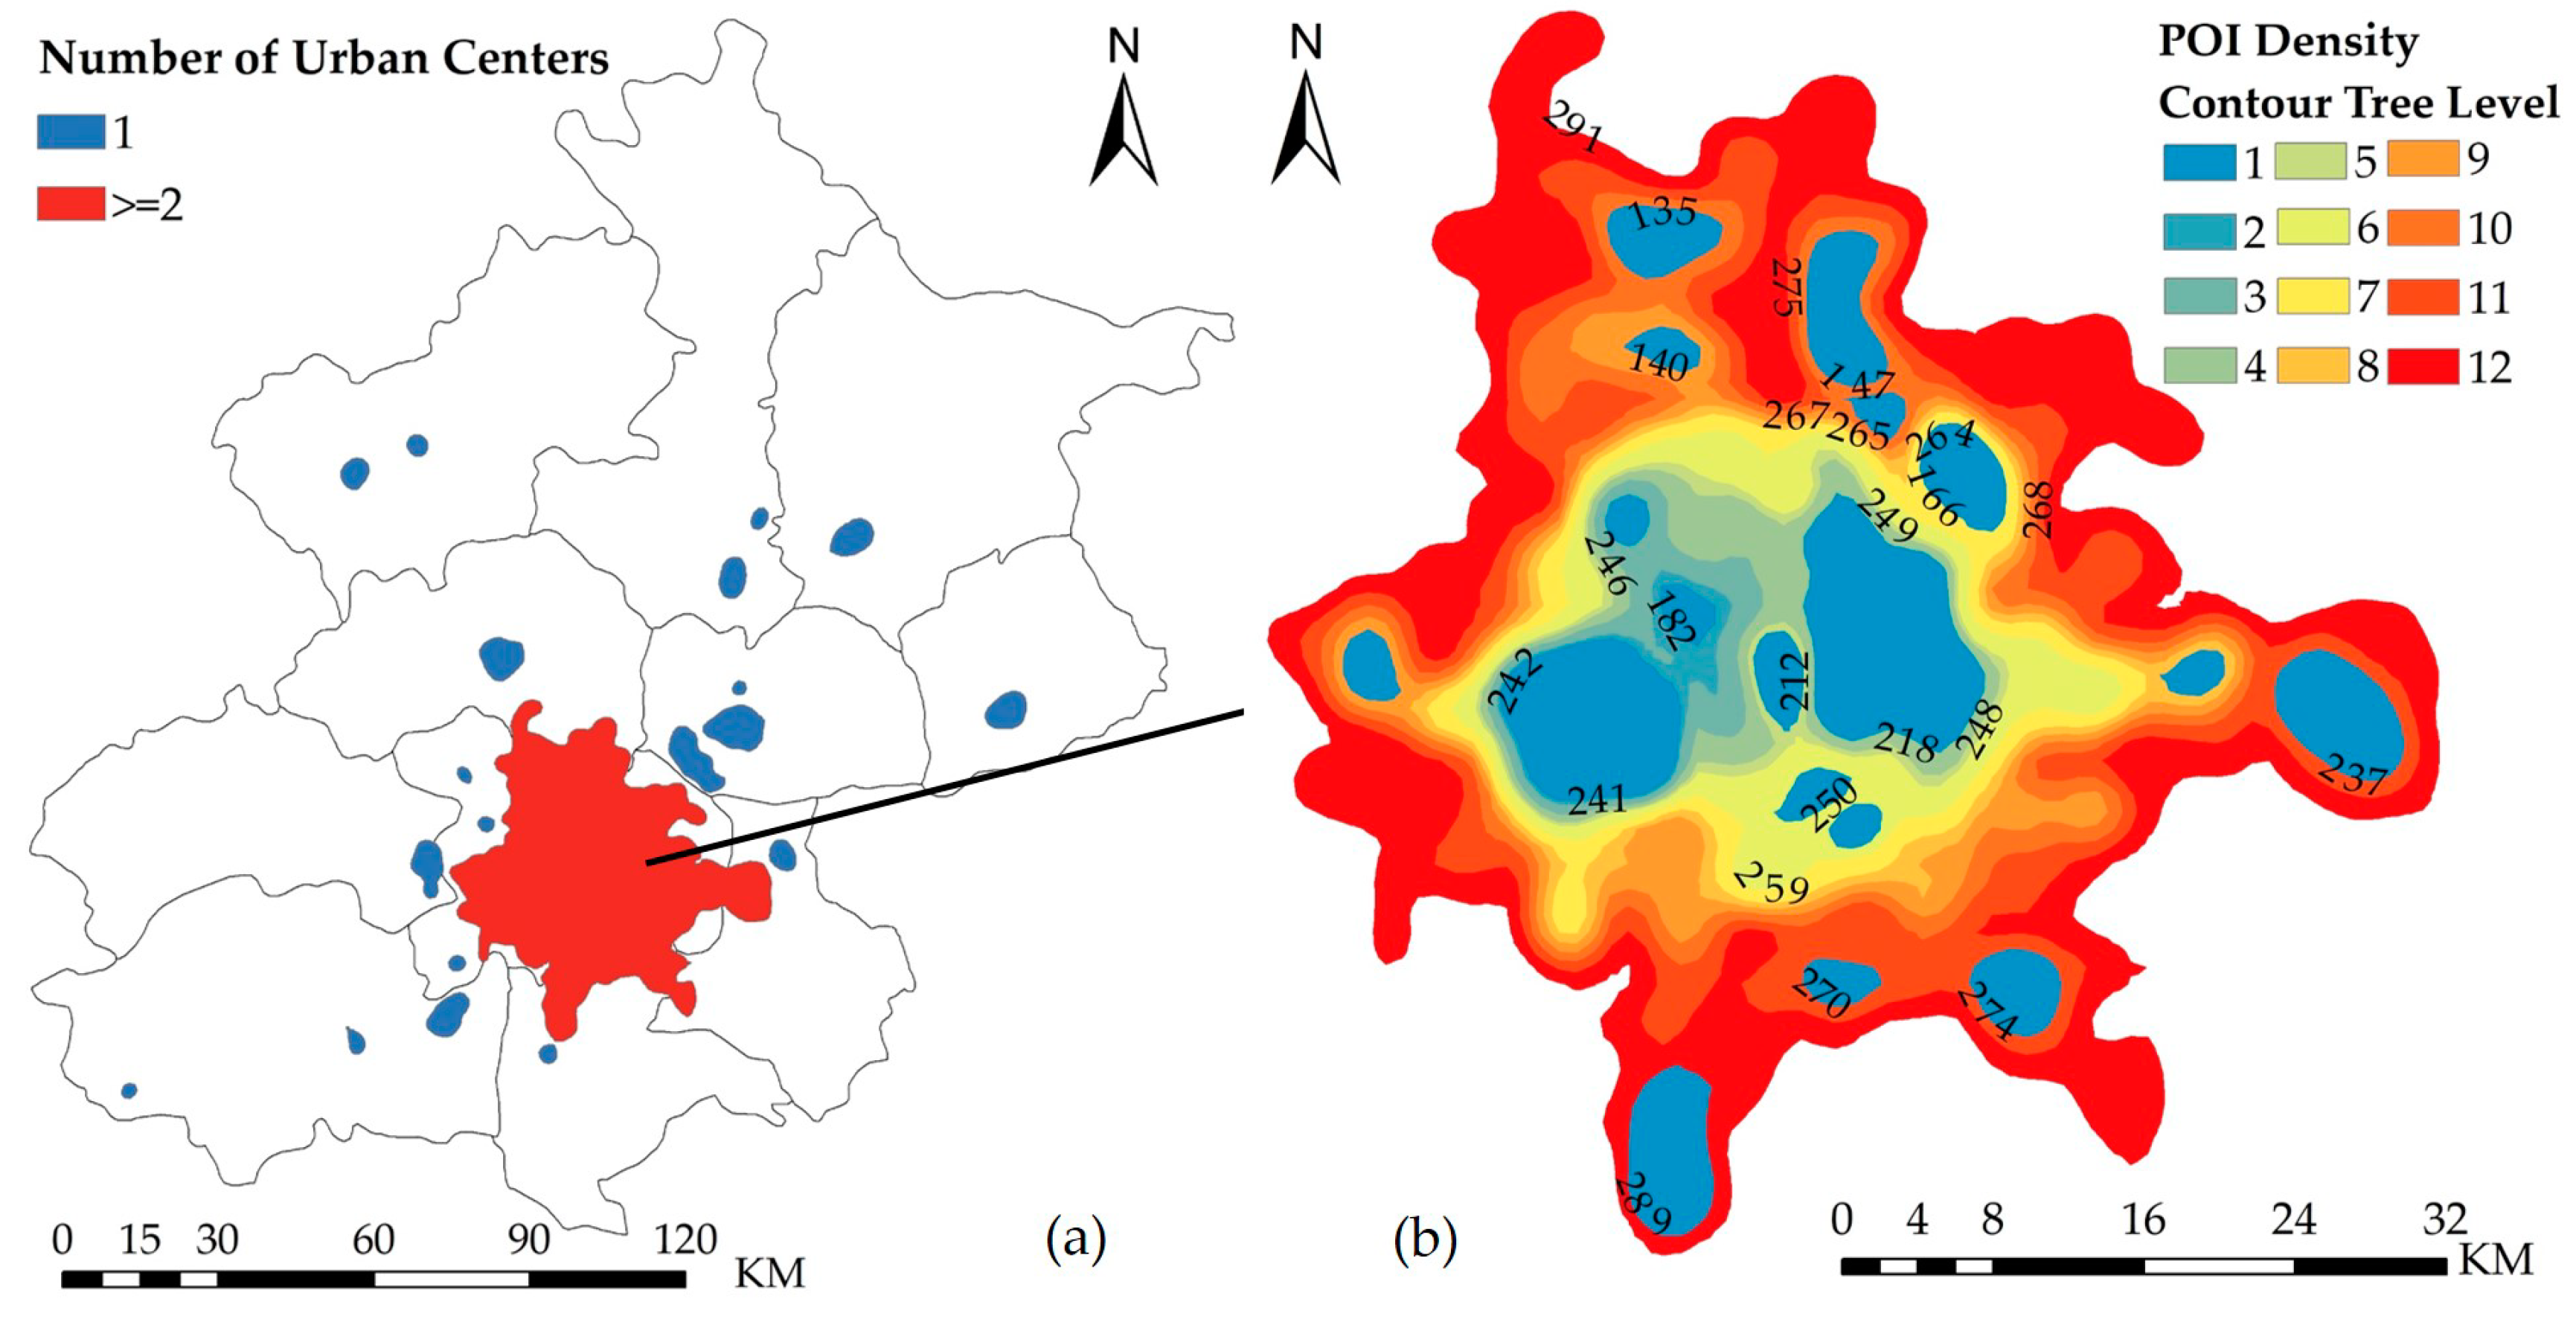
Figure 9.
Structure of the main tree L.

Figure 10.
Reference urban centers and elemental urban centers in Beijing, with their primary functions indicated.
Figure 10.
Reference urban centers and elemental urban centers in Beijing, with their primary functions indicated.
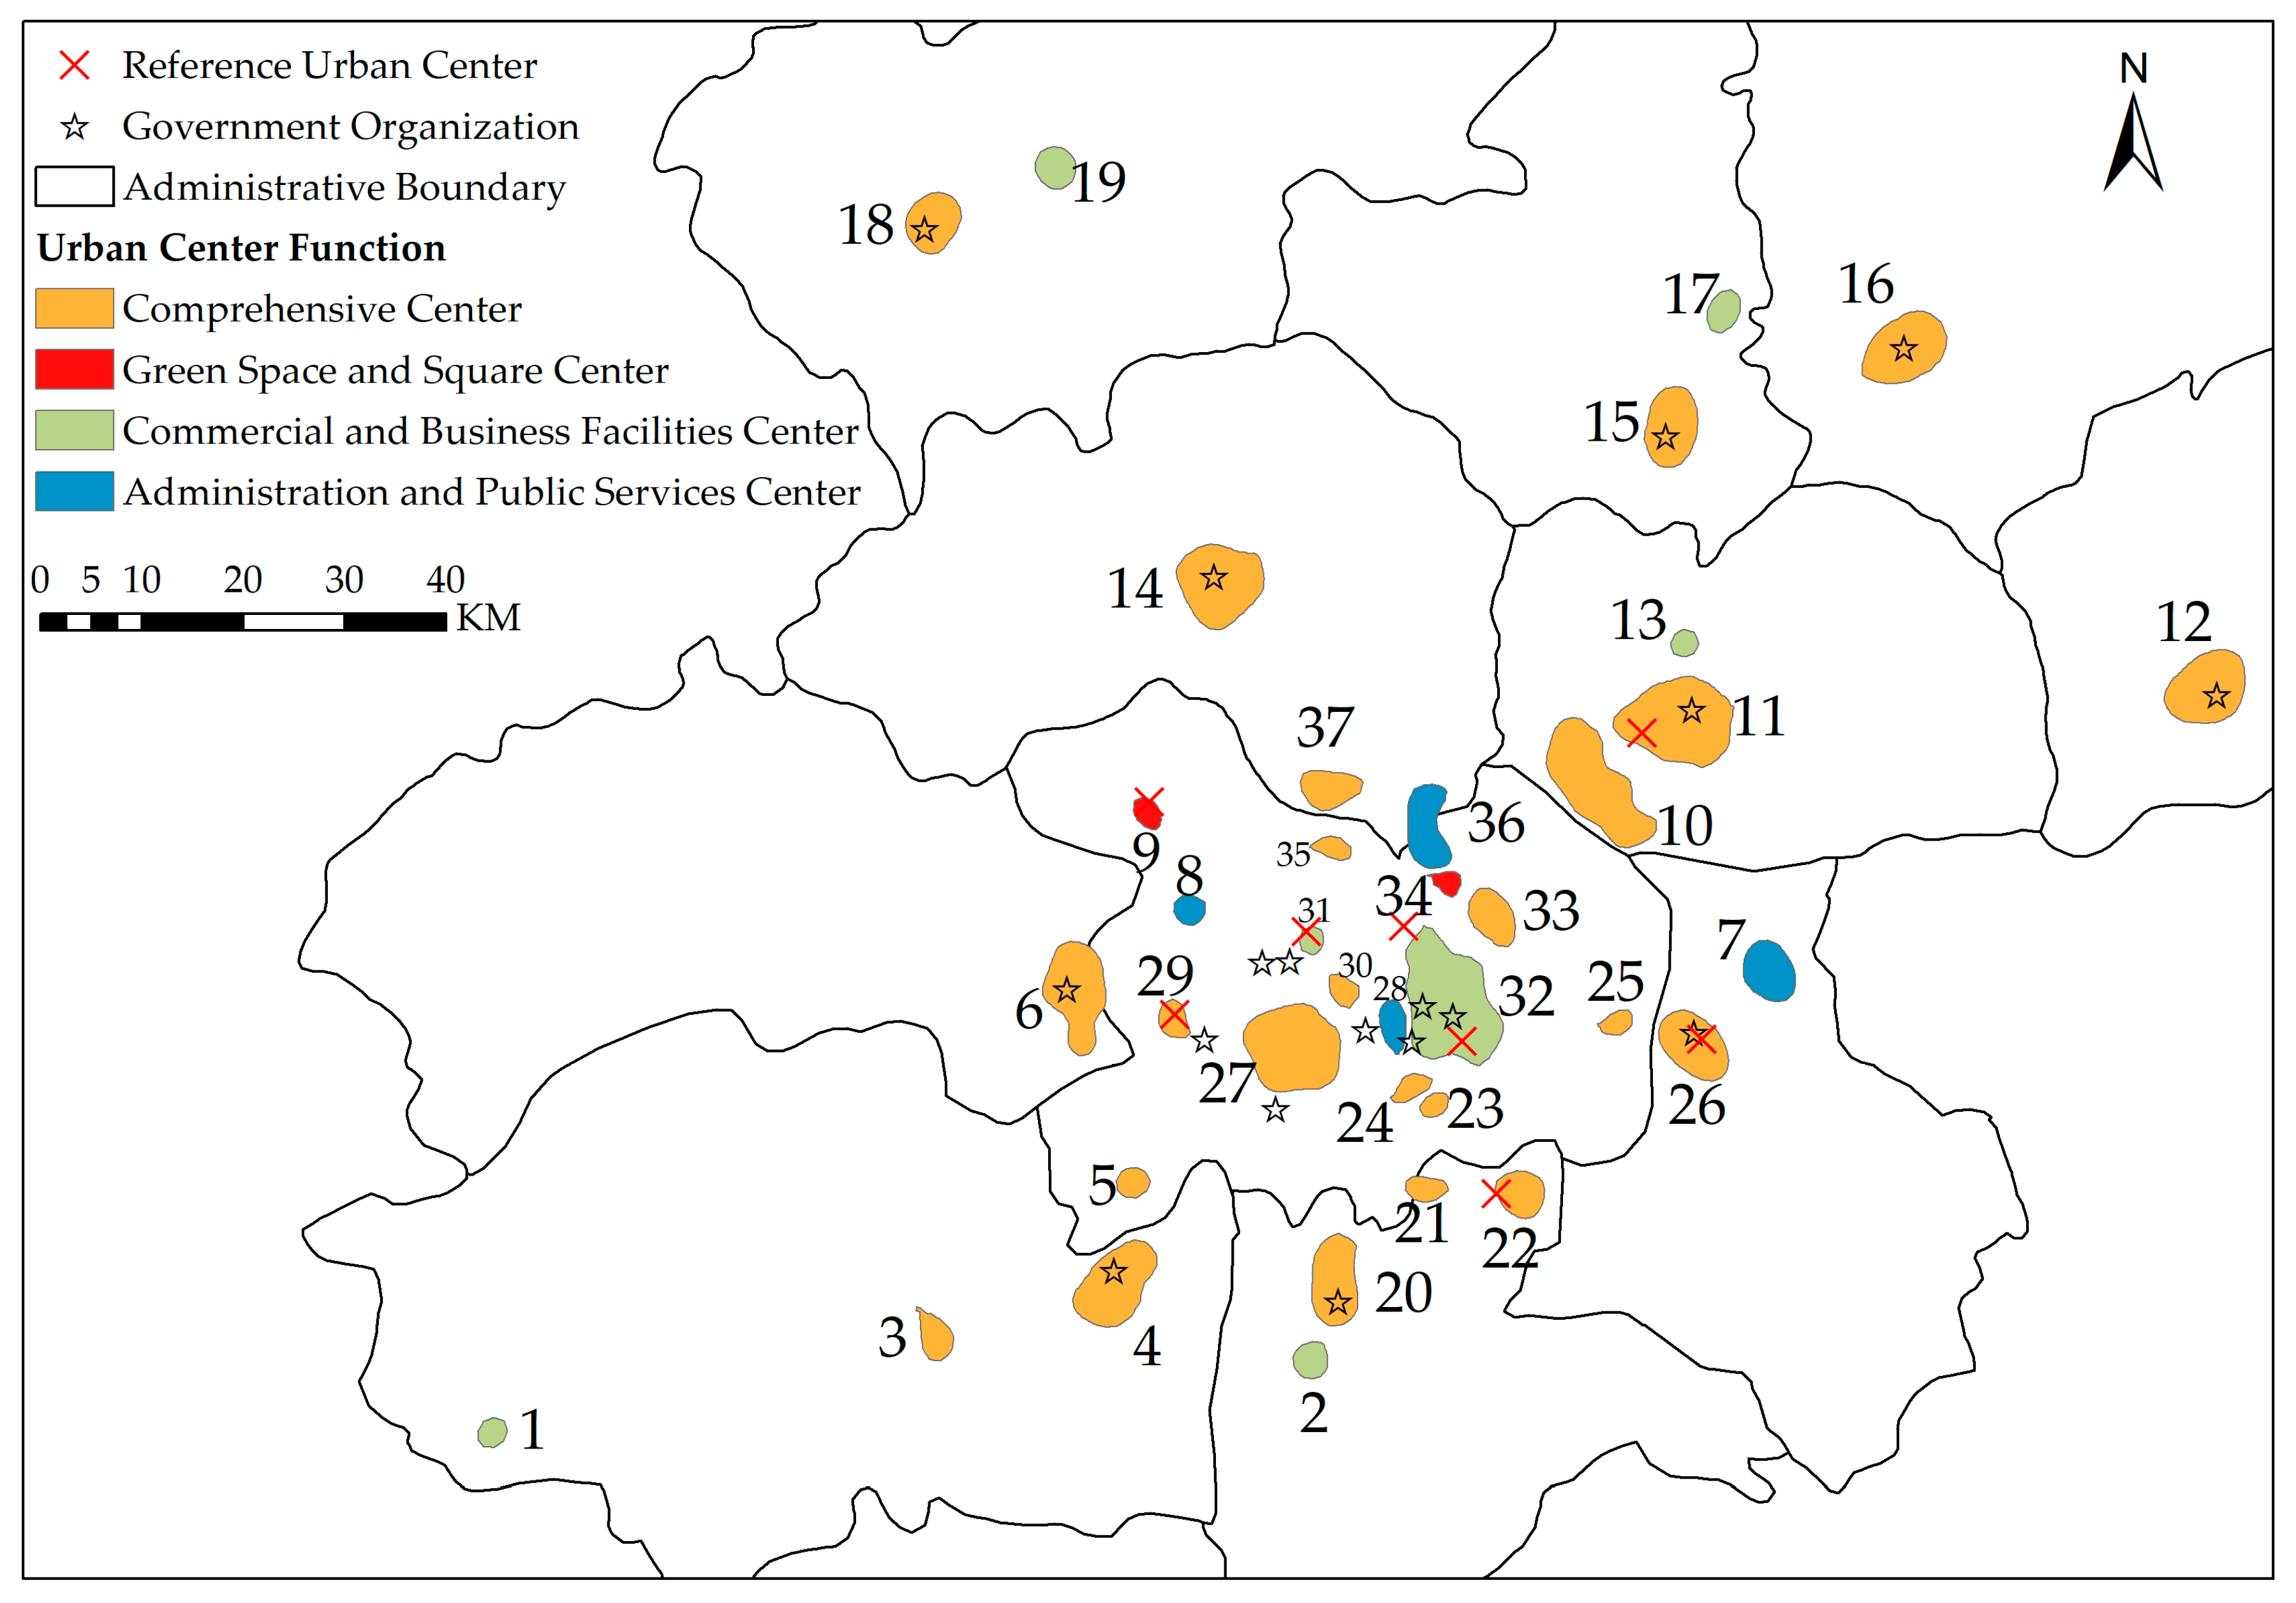
Figure 11.
Sensitivity of the detected urban centers to the contour interval value.
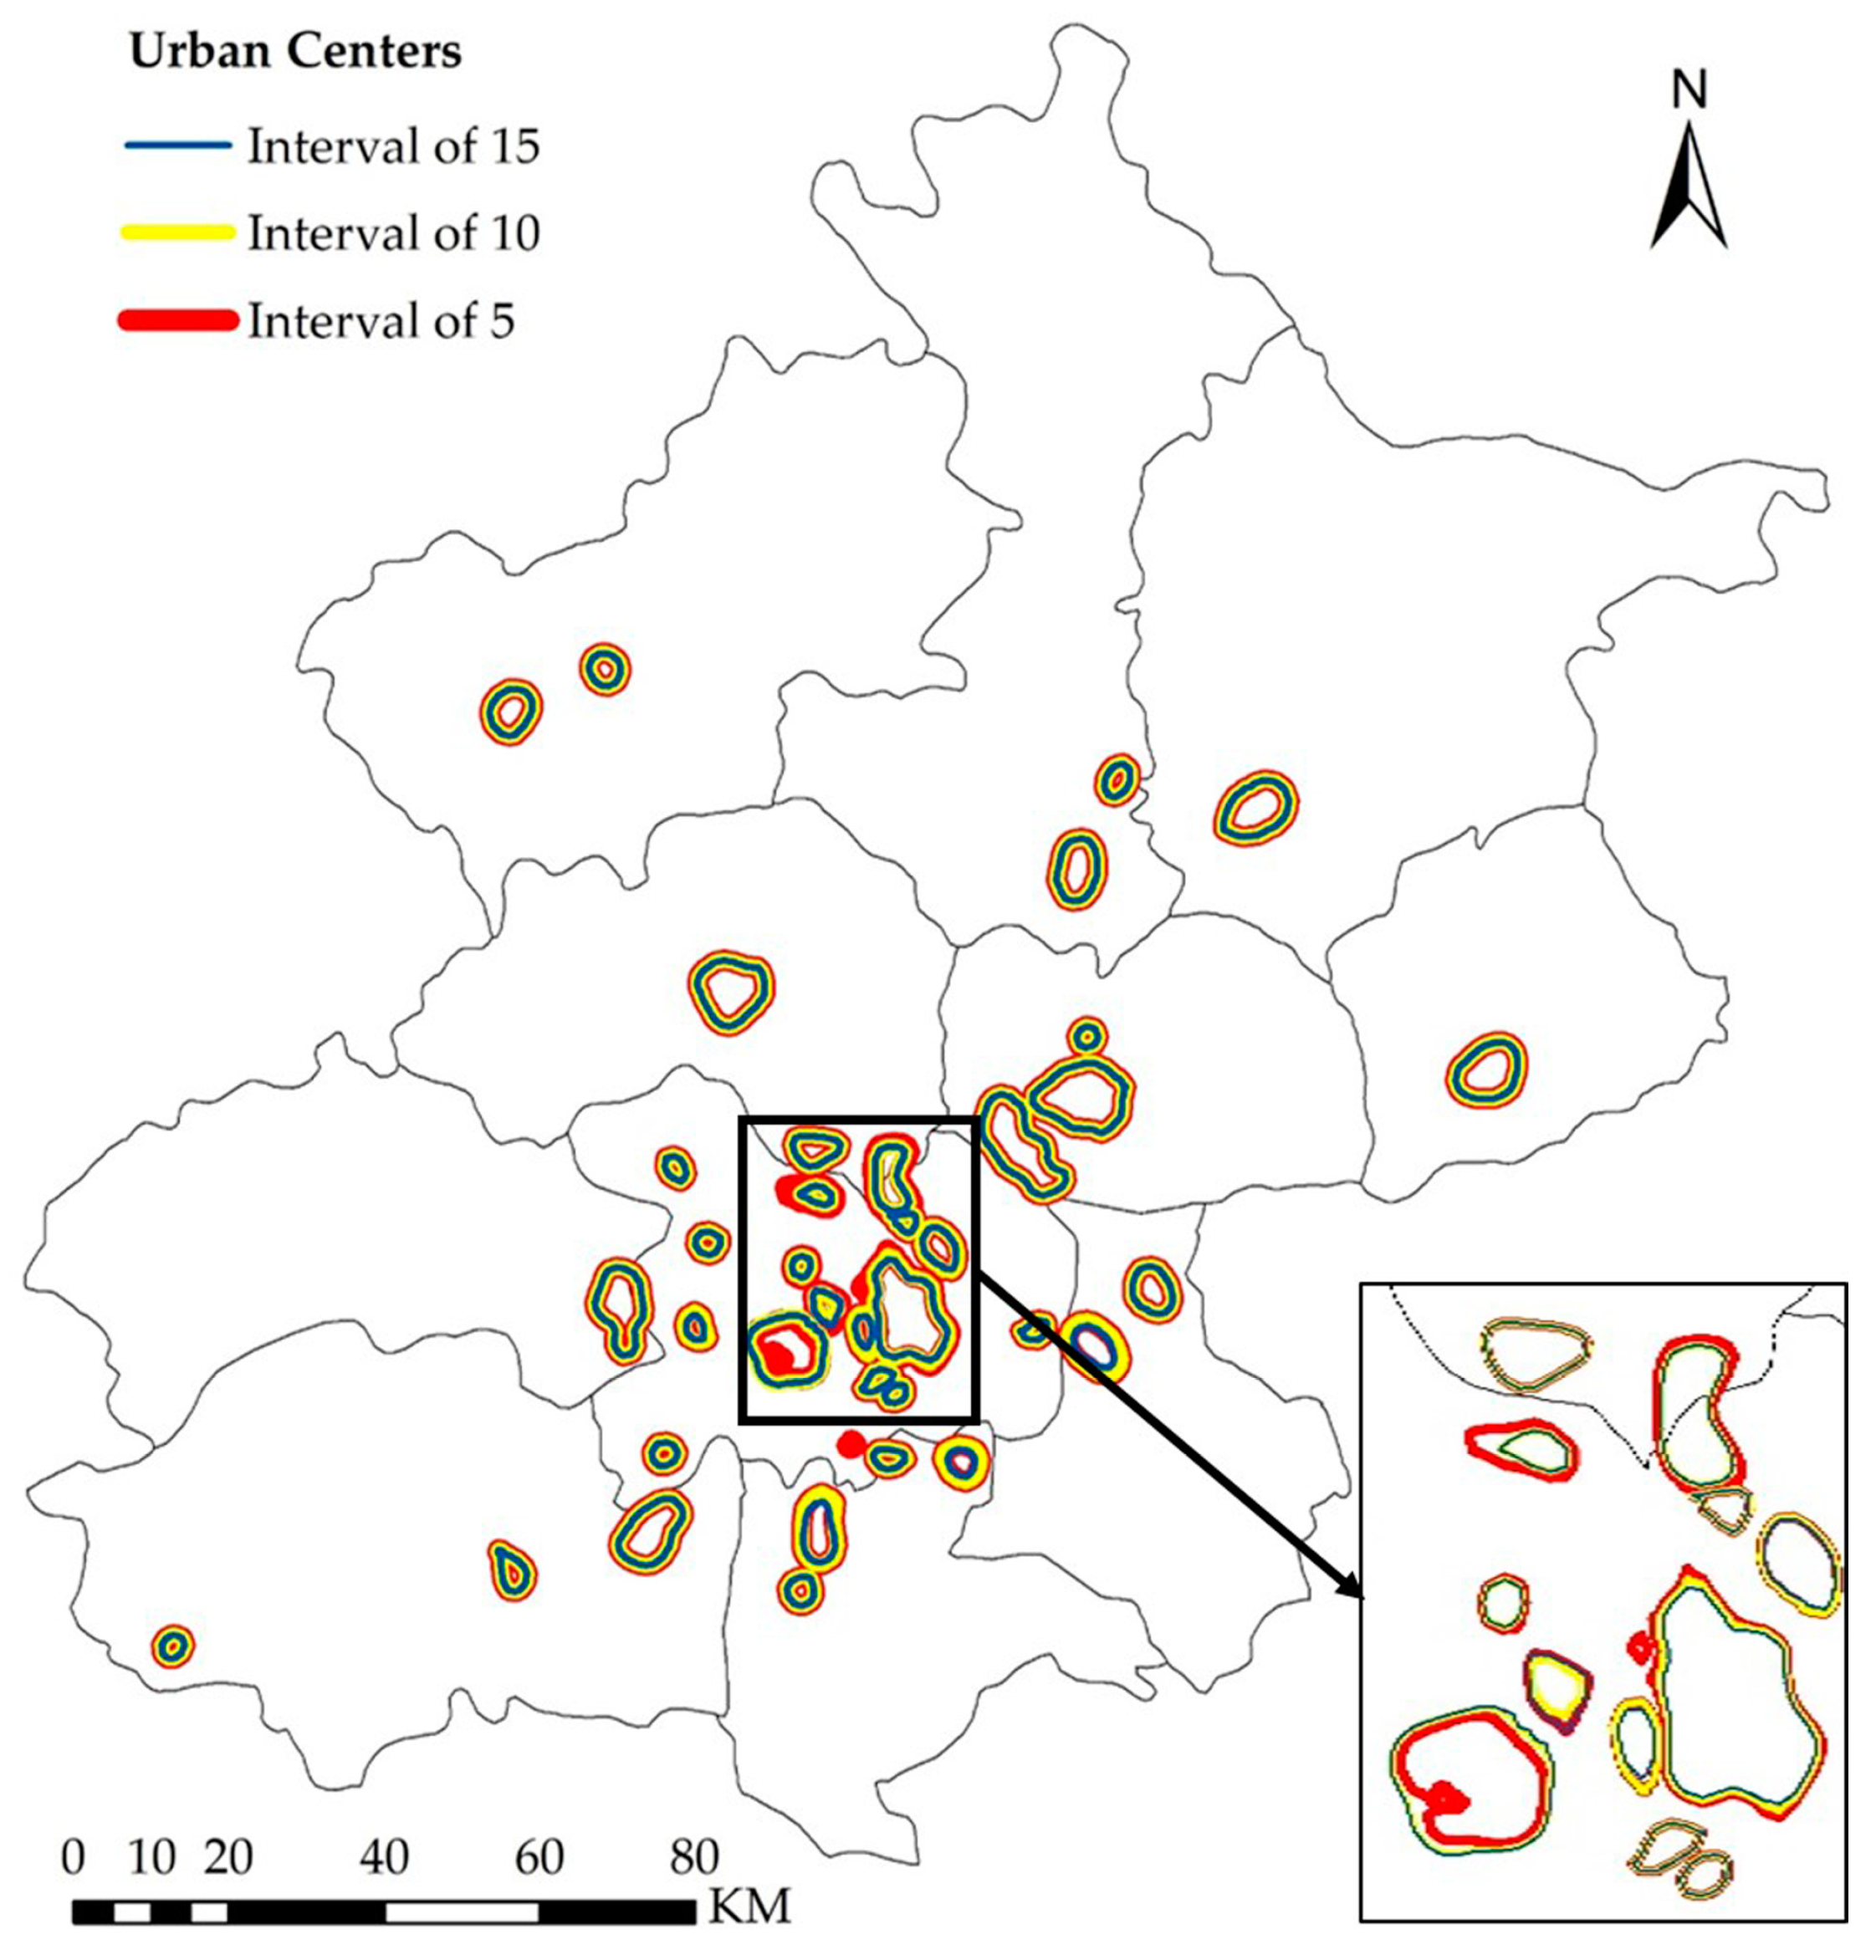
Figure 12.
Sensitivity of the detected urban centers to the minimum area parameter.


Table 1.
Definitions of Geometric and Statistical Attributes.
| Attribute | Definition | Further Information |
|---|---|---|
| Area (S) | Area of the urban center | km2 |
| Perimeter (P) | Perimeter of the urban center | km |
| Compactness Index (CI) | , where p is the perimeter of the urban center | CI is a shape indicator defined in terms of the perimeter and area of the urban center [52]. In Euclidean space, a circle is the most compact shape, with a CI value of 1 |
| Elongateness (ELG) | , where and are the lengths of the major and minor axes, respectively, of the minimum bounding rectangle surrounding the urban center | Graphically represents the shape of the urban center [53] |
| Minimum Density (MIN) | Minimum POI density in the urban center | Per square meter |
| Maximum Density (MAX) | Maximum POI density in the urban center | Per square meter |
| Average Density (MEAN) | Average POI density in the urban center | Per square meter |
| Polycentricity Value (PV) | where represents the polycentricity value of the urban center, is the number of centers in the region, is the average POI density value of these centers, is the standard deviation of the POI density of these centers, is the highest POI density value among these centers, and 0 represents a fictional center with a POI density of 0 | The value of Pv ranges from 0 (single center) to 1 (absolute polycentricity). More detailed definitions are also available in the related literature [18,54] |
Table 2.
Categories of POIs.
| ID | New Categories | Gaode Categories |
|---|---|---|
| 1 | Residential (R) | Business residence |
| 2 | Administrative and public services (A) | Health care services, Government agencies and social groups, Cultural services for science and education |
| 3 | Commercial and business facilities (B) | Car services, Car sales, Car repair, Motorcycle services, Catering services, Shopping services, Domestic services, Accommodation services, Financial and insurance services, Corporate (subset) |
| 4 | Industry and manufacturing (M) | Corporate (subset) |
| 5 | Roads, streets and transportation (S) | Transportation facilities and services, Road auxiliary facilities, Access facilities |
| 6 | Municipal utilities (U) | Public utilities |
| 7 | Green spaces and squares (G) | Sports and leisure services, Famous tourist sites |
Table 3.
Summary of the geometric and statistical attributes of elemental urban centers.
| Location | S (km2) | P (km) | CI | ELG | MIN | MAX | MEAN | |
|---|---|---|---|---|---|---|---|---|
| #1 | Shidu, Fangshan | 6.50 | 9.22 | 0.96 | 1.21 | 10.35 | 15.47 | 12.75 |
| #2 | Subway Station of Biomedical Base, Daxing | 9.96 | 11.36 | 0.97 | 1.09 | 11.19 | 15.49 | 13.21 |
| #3 | Fangshan South Street, Fangshan | 11.96 | 14.66 | 0.70 | 1.83 | 10.25 | 16.96 | 13.37 |
| #4 | Hongzhen South Street, Fangshan | 45.35 | 25.87 | 0.86 | 1.69 | 9.40 | 43.48 | 21.63 |
| #5 | Yungang South District, Fengtai | 7.65 | 9.95 | 0.98 | 1.11 | 10.18 | 15.35 | 12.75 |
| #6 | Xinqiao South Street, Mentougou | 45.93 | 28.50 | 0.72 | 1.79 | 7.57 | 35.41 | 19.20 |
| #7 | Beijing Iron and Steel International Logistics City, Tongzhou | 23.81 | 17.78 | 0.95 | 1.32 | 9.23 | 39.82 | 20.90 |
| #8 | Beijing Botanical Garden, Haidian | 7.22 | 9.73 | 0.96 | 1.09 | 9.47 | 13.68 | 12.03 |
| #9 ** | Science and Technology Innovation Center of the Haidian Mountain Area, Haidian | 6.28 | 9.33 | 0.91 | 1.49 | 9.84 | 12.98 | 11.82 |
| #10 | Beijing Capital International Airport, Shunyi | 69.64 | 36.70 | 0.65 | 2.35 | 9.39 | 27.24 | 15.62 |
| #11 ** | Shunyi Modern Manufacturing Base, Shunyi | 73.95 | 32.79 | 0.87 | 1.32 | 8.62 | 119.75 | 34.73 |
| #12 | People’s Park, Pinggu | 44.02 | 24.28 | 0.94 | 1.34 | 9.02 | 87.54 | 35.14 |
| #13 | Shunyi 15th Middle School, Shunyi | 5.59 | 8.55 | 0.97 | 1.01 | 10.95 | 13.88 | 12.16 |
| #14 | Drum Tower, Shichahai, Xicheng | 52.66 | 26.74 | 0.93 | 1.07 | 8.55 | 77.21 | 30.35 |
| #15 | Huairou District Construction Committee, Huairou | 32.85 | 21.36 | 0.91 | 1.58 | 8.04 | 53.25 | 26.25 |
| #16 | Miyun District Government, Miyun | 43.54 | 24.51 | 0.92 | 1.52 | 7.72 | 81.72 | 31.85 |
| #17 | Lake Yanxi, Huairou | 10.34 | 11.82 | 0.93 | 1.49 | 9.86 | 16.29 | 12.99 |
| #18 | Yanqing County Hospital, Yanqing | 24.55 | 17.91 | 0.97 | 1.19 | 9.89 | 37.43 | 21.00 |
| #19 | Second District of Baolin Temple, Yanqing | 13.03 | 12.91 | 0.99 | 1.06 | 8.72 | 26.81 | 18.64 |
| #20 | Fire God Temple, Daxing | 33.97 | 22.98 | 0.81 | 2.03 | 18.22 | 59.10 | 34.01 |
| #21 | Eastern Highlands, Fengtai | 8.02 | 10.87 | 0.86 | 1.71 | 30.39 | 38.74 | 34.58 |
| #22 ** | Yizhuang High-Tech Industrial Development Zone, Daxing | 17.25 | 15.02 | 0.97 | 1.03 | 30.03 | 58.22 | 43.43 |
| #23 | Fangzhuang, Fengtai | 5.08 | 8.33 | 0.92 | 1.39 | 93.58 | 100.44 | 96.12 |
| #24 | Tiantan Park, Dongcheng | 6.98 | 10.87 | 0.75 | 2.03 | 68.83 | 78.04 | 73.69 |
| #25 | Chinese Academy of Building Materials Science, Chaoyang | 5.88 | 9.44 | 0.83 | 1.55 | 59.07 | 75.38 | 66.80 |
| #26 ** | Tongzhou Comprehensive Service Center, Tongzhou | 33.16 | 21.36 | 0.92 | 1.55 | 26.34 | 62.54 | 44.65 |
| #27 | Wukesong, Liuliqiao, Haidian | 65.31 | 29.52 | 0.95 | 1.13 | 162.84 | 358.99 | 254.06 |
| #28 | Tian’anmen Square, Dongcheng | 10.56 | 13.13 | 0.77 | 2.11 | 74.04 | 111.06 | 93.80 |
| #29 ** | Shijingshan Comprehensive Service Center, Shijingshan | 8.56 | 11.01 | 0.89 | 1.55 | 50.14 | 67.25 | 58.49 |
| #30 | Beijing Jiaotong University, Beijing Architectural University, Peking University Hospital, Haidian | 6.96 | 10.06 | 0.87 | 1.43 | 176.28 | 193.66 | 184.90 |
| #31 ** | Zhongguancun Science Park Core Area, Haidian | 5.00 | 8.13 | 0.95 | 1.18 | 171.60 | 200.69 | 184.98 |
| #32 ** | Central Business District, Chaoyang | 88.90 | 38.80 | 0.75 | 1.58 | 135.05 | 314.25 | 188.88 |
| #33 | Wangjing, SOHO, Chaoyang | 18.87 | 16.33 | 0.89 | 1.58 | 79.99 | 144.99 | 110.04 |
| #34 | New Home of Asian Games, Chaoyang | 5.16 | 9.57 | 0.71 | 1.29 | 17.83 | 30.30 | 24.62 |
| #35 | Qinghe, Haidian | 6.27 | 10.16 | 0.77 | 1.80 | 49.76 | 59.56 | 53.82 |
| #36 | Tiantongyuan, Changping | 6.51 | 22.28 | 0.68 | 2.10 | 37.71 | 66.46 | 52.15 |
| #37 | Huilongguan, Changping | 17.63 | 16.15 | 0.86 | 1.60 | 38.46 | 60.24 | 49.15 |
| MAX | 88.90 | 38.80 | 0.99 | 2.35 | 176.28 | 358.99 | 254.06 | |
| MIN | 5.00 | 8.13 | 0.65 | 1.01 | 7.57 | 12.98 | 11.82 | |
| MEAN | 23.92 | 17.24 | 0.87 | 1.49 | 45.50 | 76.48 | 54.72 |
All values in the table are rounded to the last two decimal places. ID ** indicates that urban center is included in the Beijing Urban Master Plan (2004–2020).
Table 4.
Polycentricity values of composite centers.
| ID | #242 | #246 | #248 | #249 | #259 | #264 | #265 | #267 | #268 | #275 | #291 | Elemental Centers |
|---|---|---|---|---|---|---|---|---|---|---|---|---|
| PV | 0.81 | 0.82 | 0.84 | 0.72 | 0.66 | 0.67 | 0.66 | 0.64 | 0.63 | 0.64 | 0.64 | 0 |
All values in the table are rounded to the last two decimal places.
Table 5.
Impact of the Contour Interval on the Detection of Urban Centers.
| Contour Interval | Number of Centers | Total Area of Centers |
|---|---|---|
| 5 | 40 | 977.15 |
| 10 | 37 | 973.80 |
| 15 | 37 | 864.13 |
© 2019 by the authors. Licensee MDPI, Basel, Switzerland. This article is an open access article distributed under the terms and conditions of the Creative Commons Attribution (CC BY) license (http://creativecommons.org/licenses/by/4.0/).
Share and Cite
MDPI and ACS Style
Deng, Y.; Liu, J.; Liu, Y.; Luo, A. Detecting Urban Polycentric Structure from POI Data. ISPRS Int. J. Geo-Inf. 2019, 8, 283. https://0-doi-org.brum.beds.ac.uk/10.3390/ijgi8060283
AMA Style
Deng Y, Liu J, Liu Y, Luo A. Detecting Urban Polycentric Structure from POI Data. ISPRS International Journal of Geo-Information. 2019; 8(6):283. https://0-doi-org.brum.beds.ac.uk/10.3390/ijgi8060283
Chicago/Turabian StyleDeng, Yue, Jiping Liu, Yang Liu, and An Luo. 2019. "Detecting Urban Polycentric Structure from POI Data" ISPRS International Journal of Geo-Information 8, no. 6: 283. https://0-doi-org.brum.beds.ac.uk/10.3390/ijgi8060283
Note that from the first issue of 2016, this journal uses article numbers instead of page numbers. See further details here.