Evaluating the Suitability of Urban Expansion Based on the Logic Minimum Cumulative Resistance Model: A Case Study from Leshan, China


Abstract
:
1. Introduction
- (1)
- What were the impact factors related to urban expansion in LS?
- (2)
- How suitable was the urban expansion?
- (3)
- What was the appropriate direction for UE and how were the urban rural areas connected under a specific scale scenario?
2. Materials and Methods
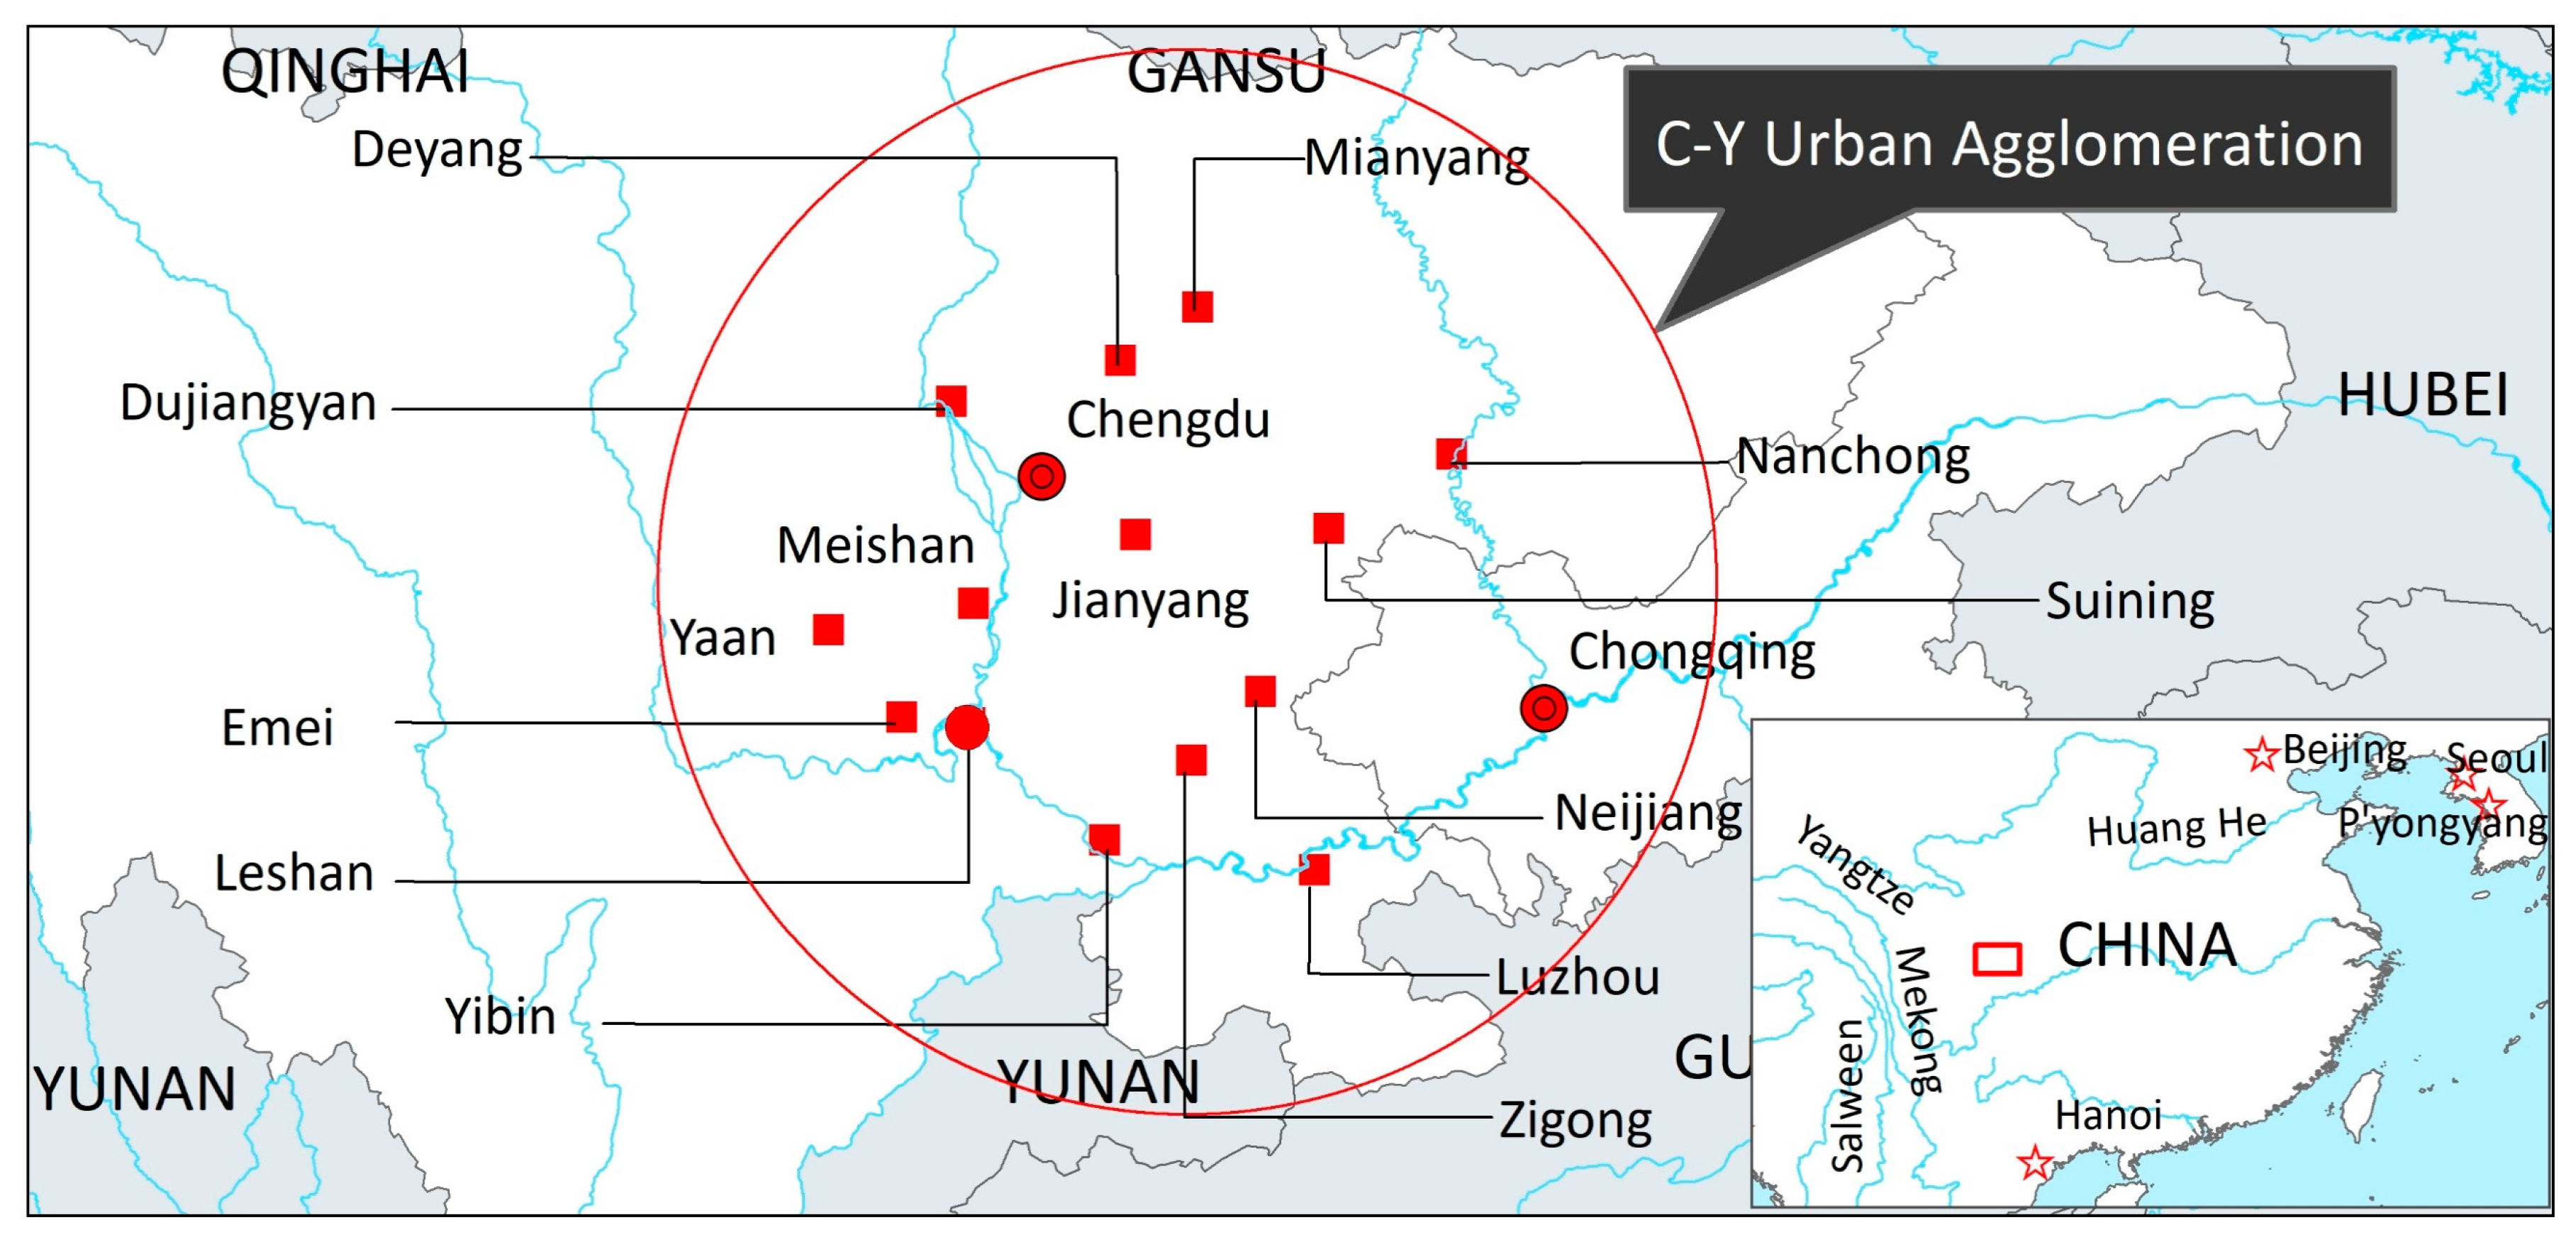
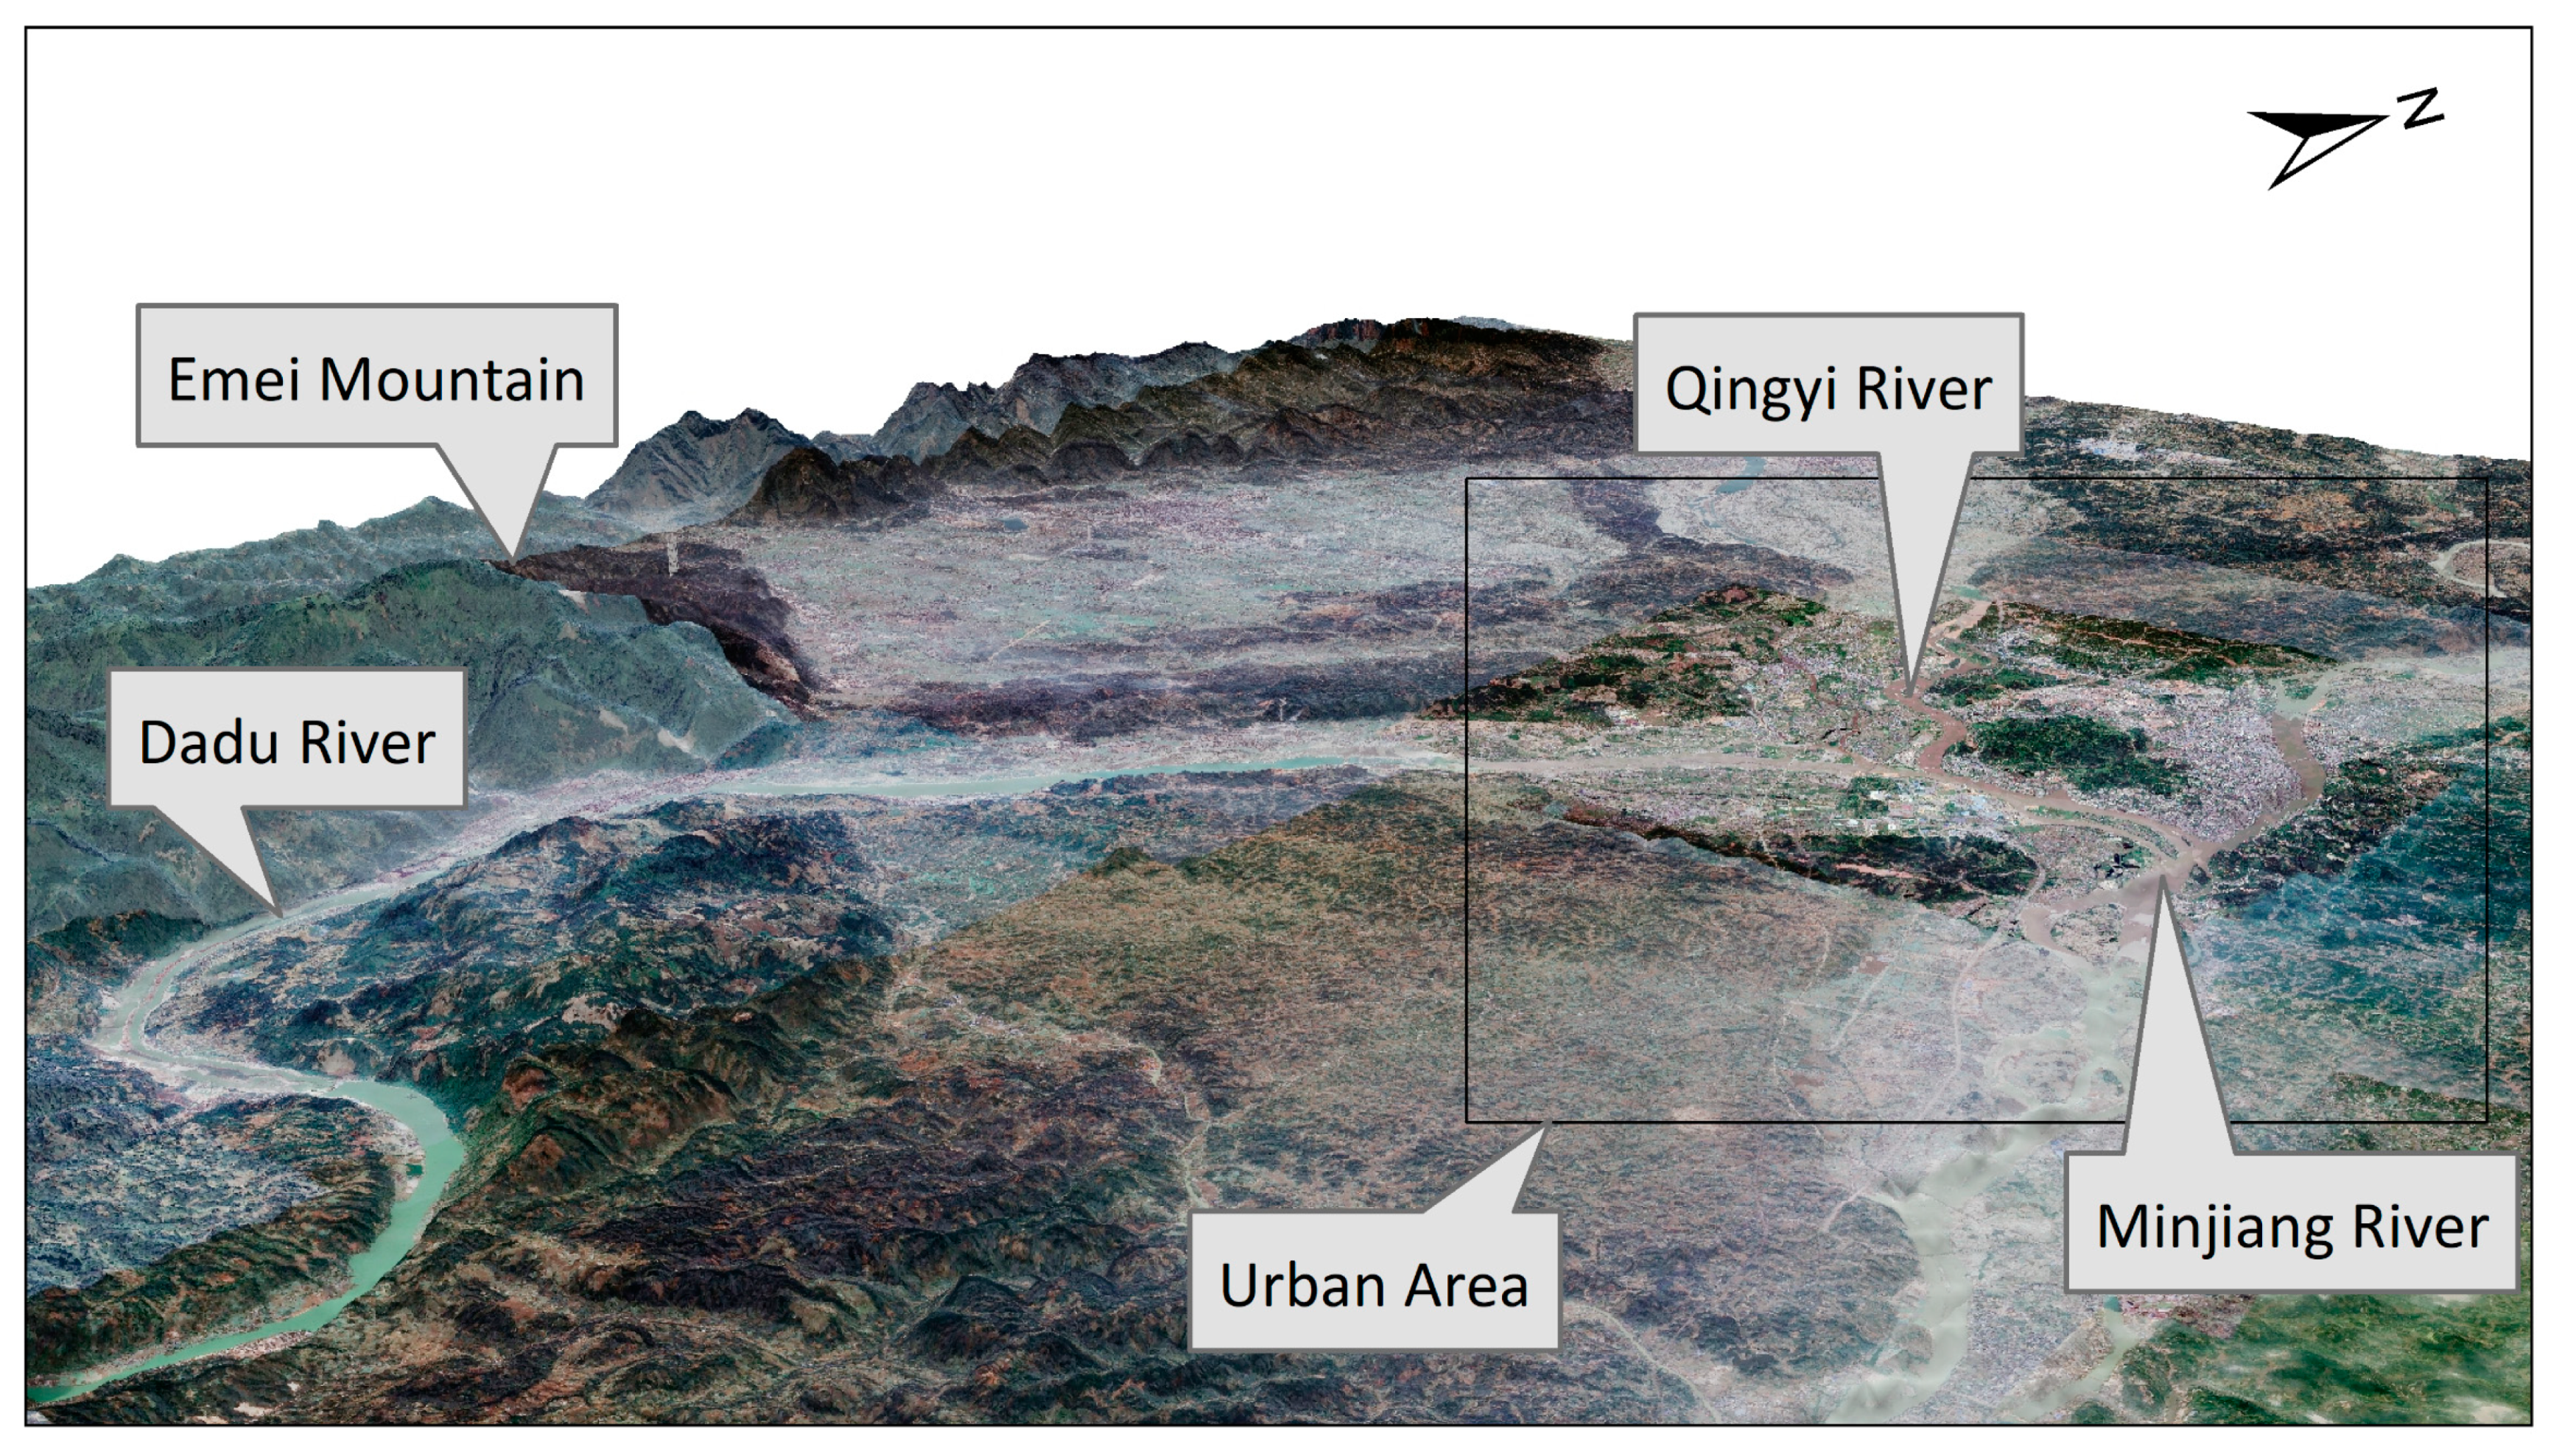
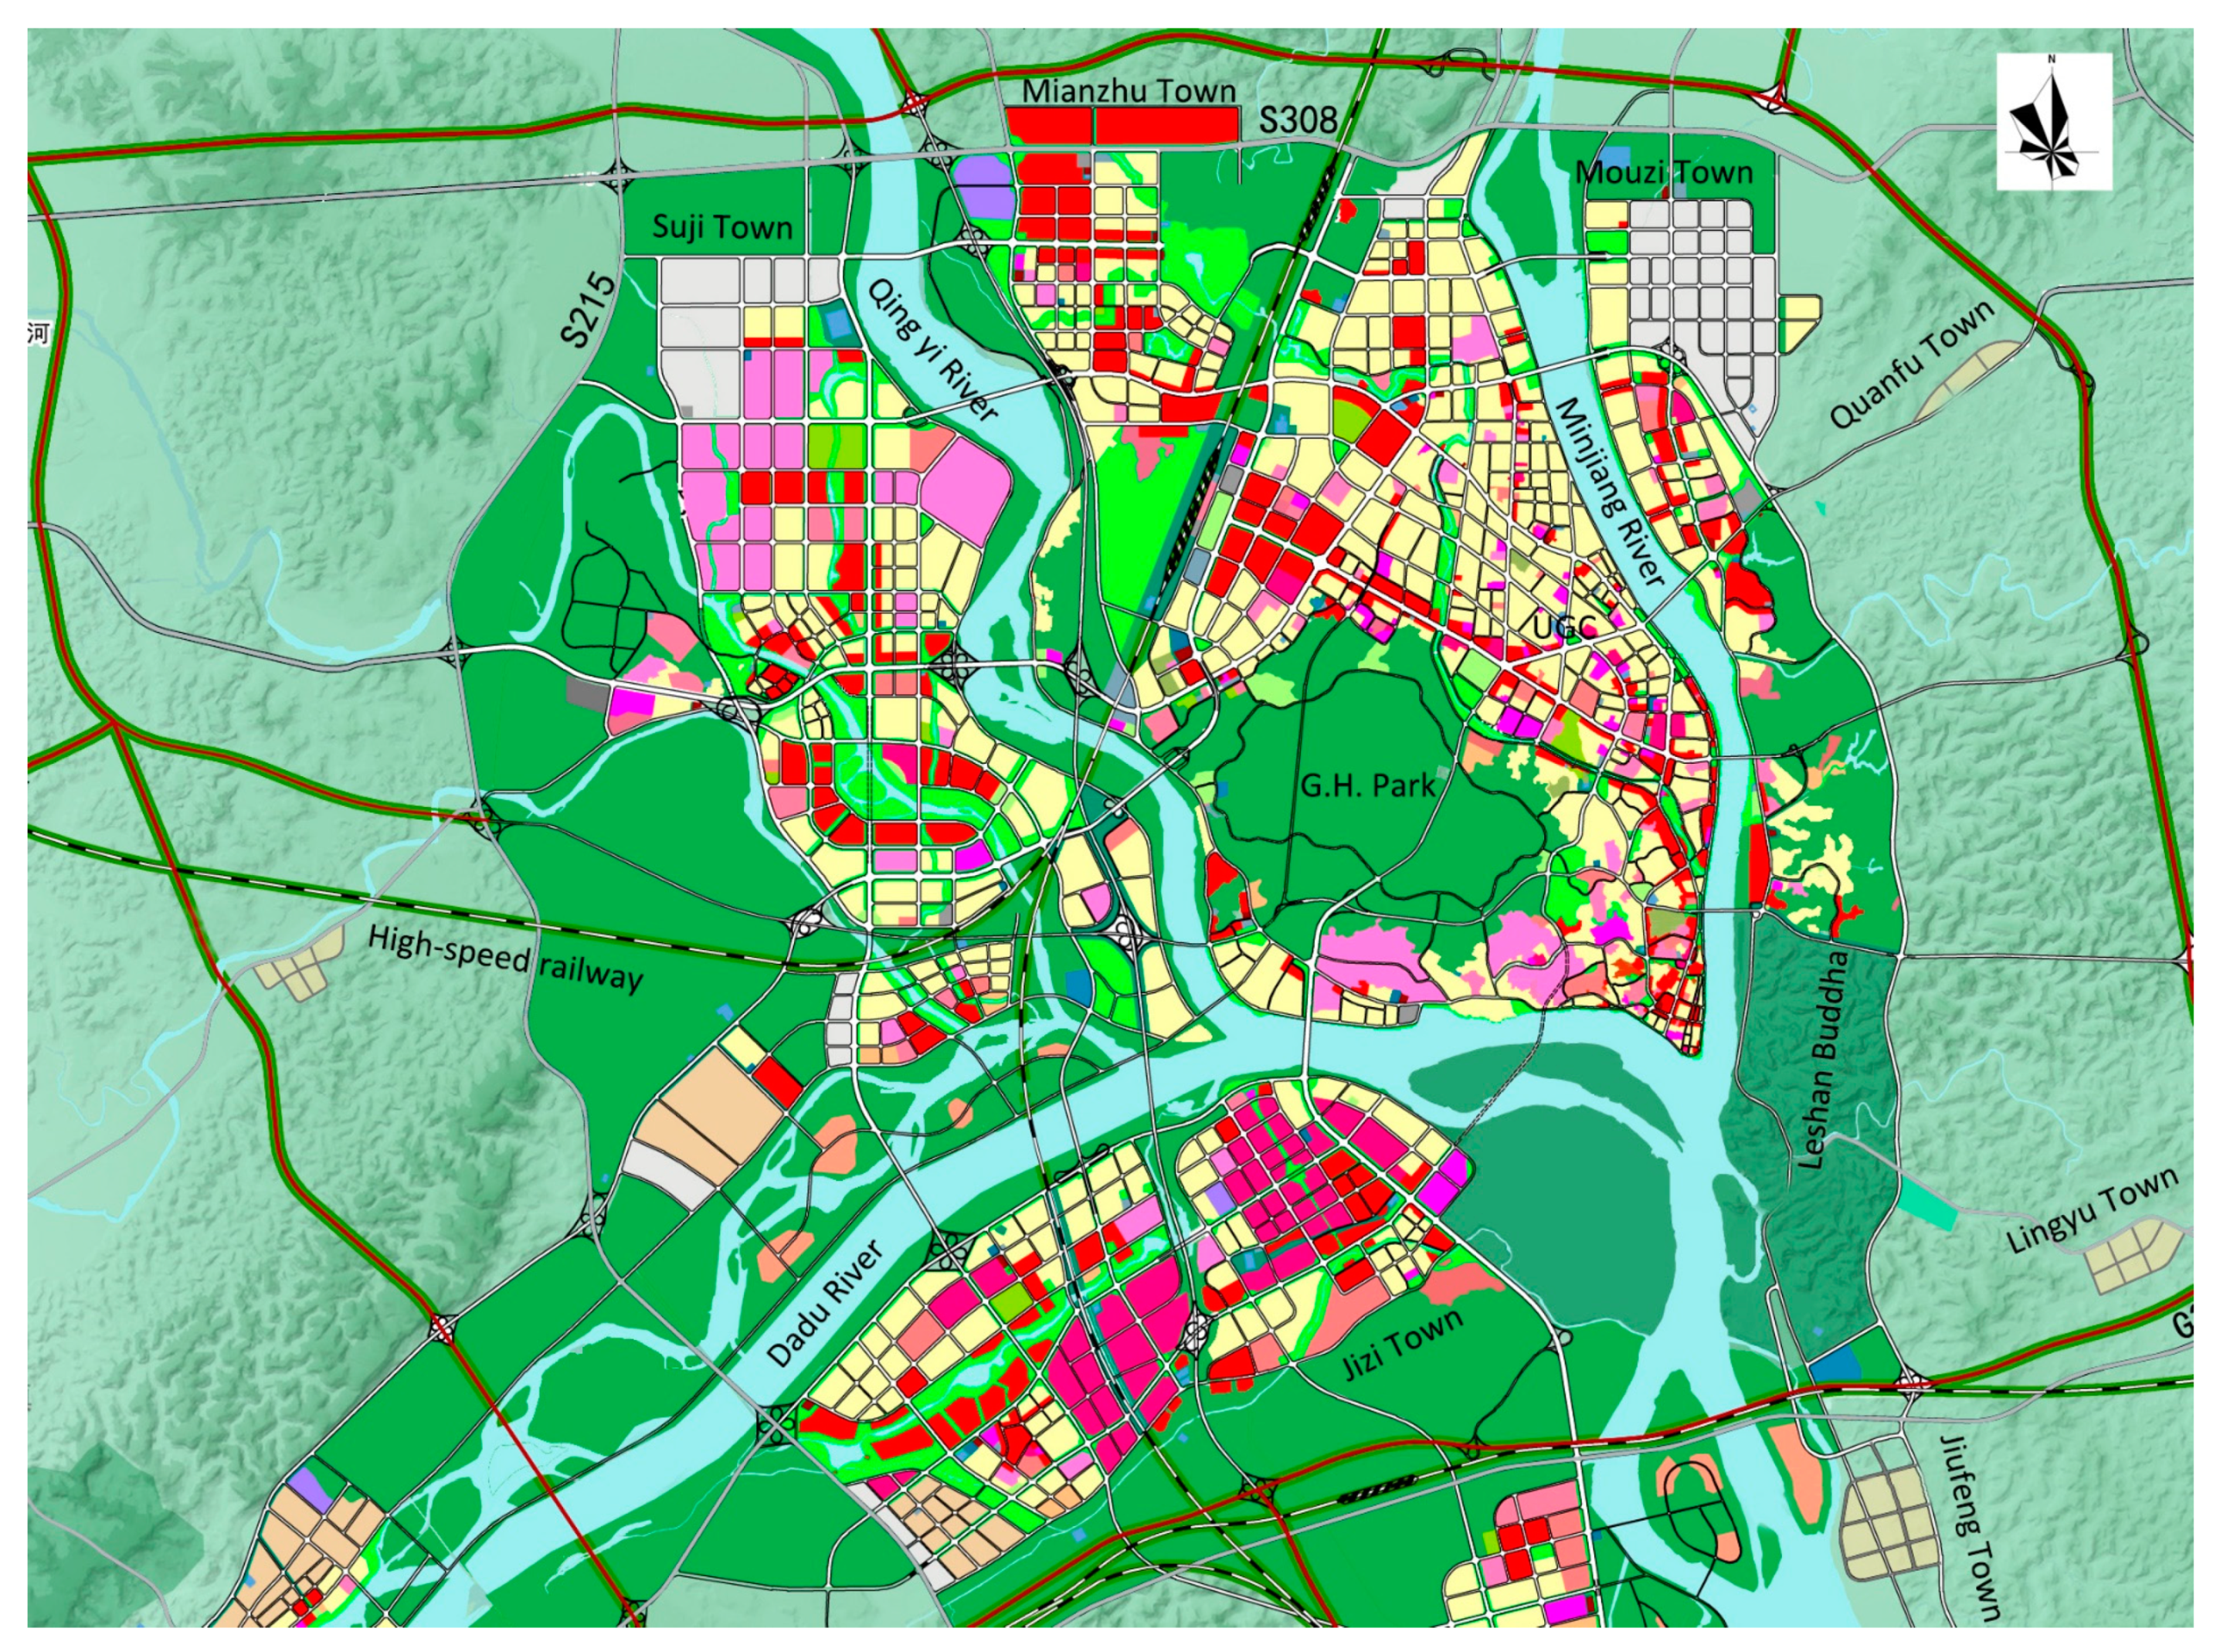
2.1. Study Area
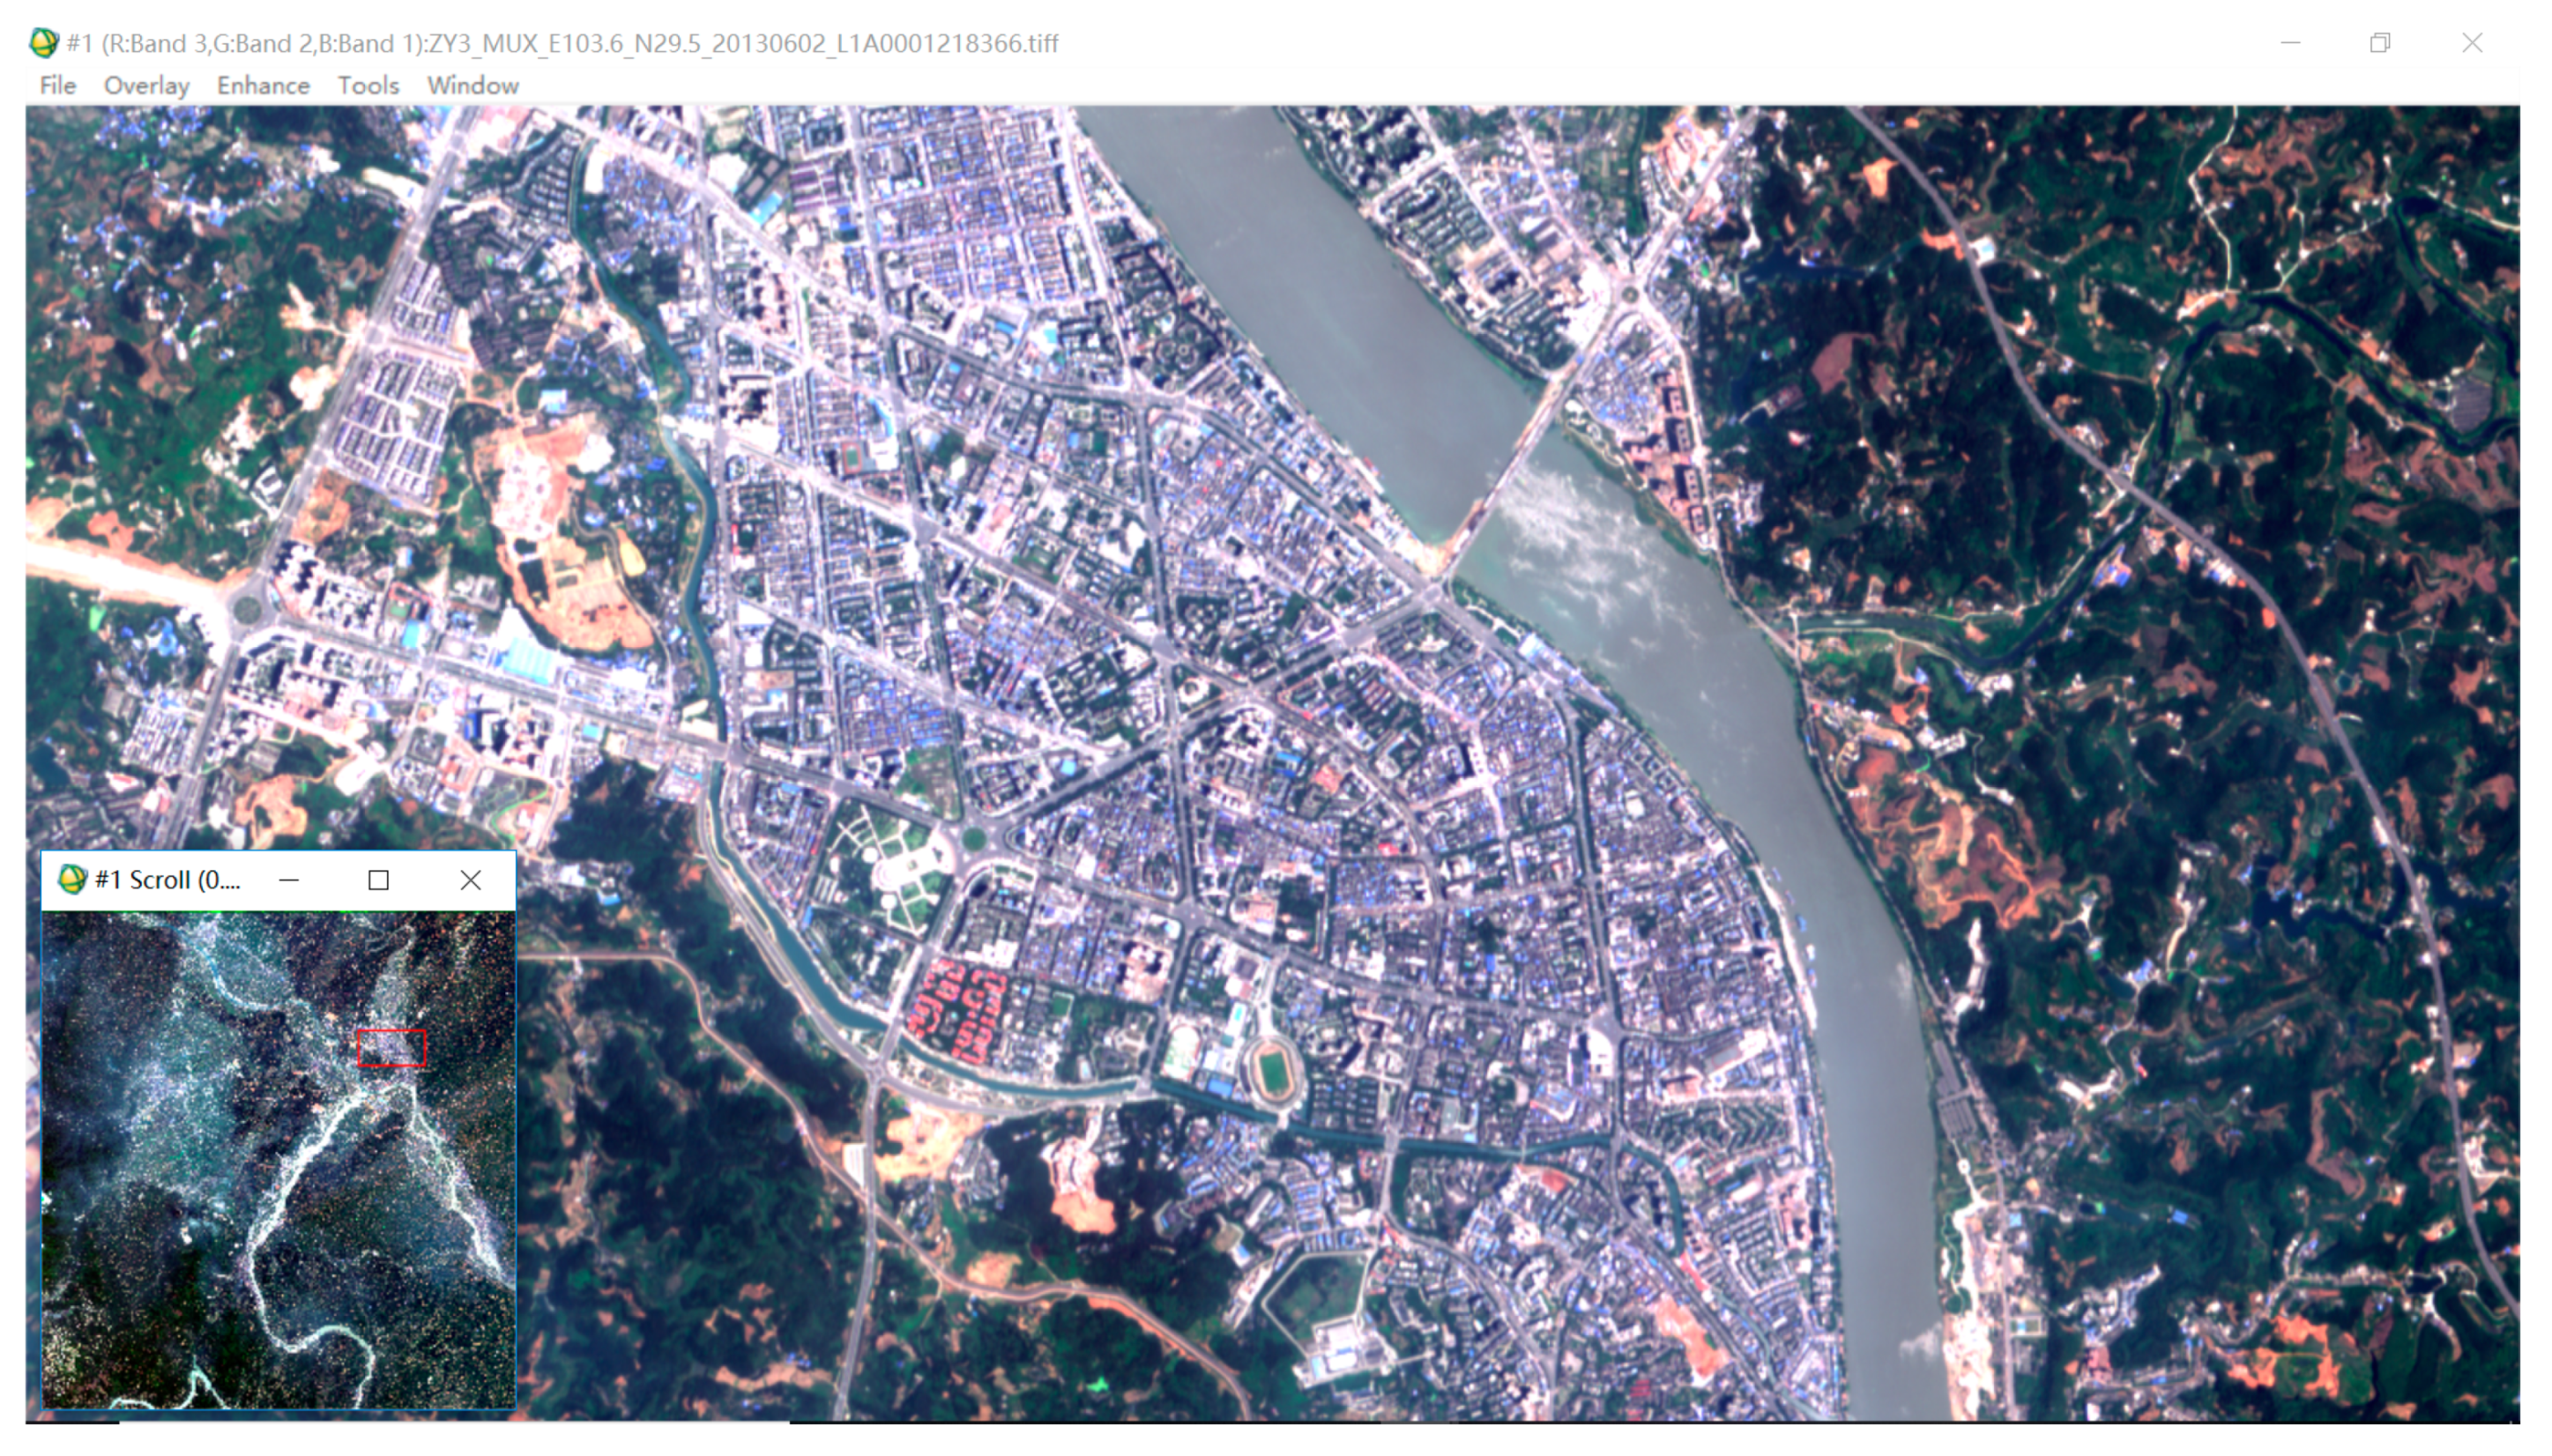
2.2. Materials
2.3. Methods
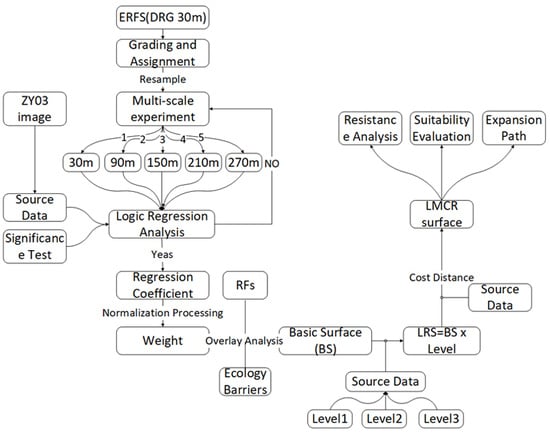
2.3.1. Principle of the LMCR Model
2.3.2. Assumptions of the LMCR Model
- (1)
- The urban area is divided into two types by its use: constructed land, which is land that is suitable for urban expansion, and green space (e.g., park, grass land, and garden plots), which is land that is suitable for protection.
- (2)
- To accelerate economic development and urban construction, constructed land requires expansion. Conversely, to improve the quality of the urban ecosystem, green spaces require expansion. The challenge is to realize a dynamic balance between green space and constructed land.
- (3)
- Unreasonable urban expansion, in other words, the “sprawl” can be corrected by setting up ecological barriers (such as natural reserves, eco-parks). These control urban sprawl. Moreover, ecological barriers effectively protect the urban ecosystem. That is to say, green spaces could be restrictive factors or driving factors in different processes.
- (4)
- The urban expansion source is heterogeneous and whether a zone is suitable for urban expansion is identified by the LMCR value.
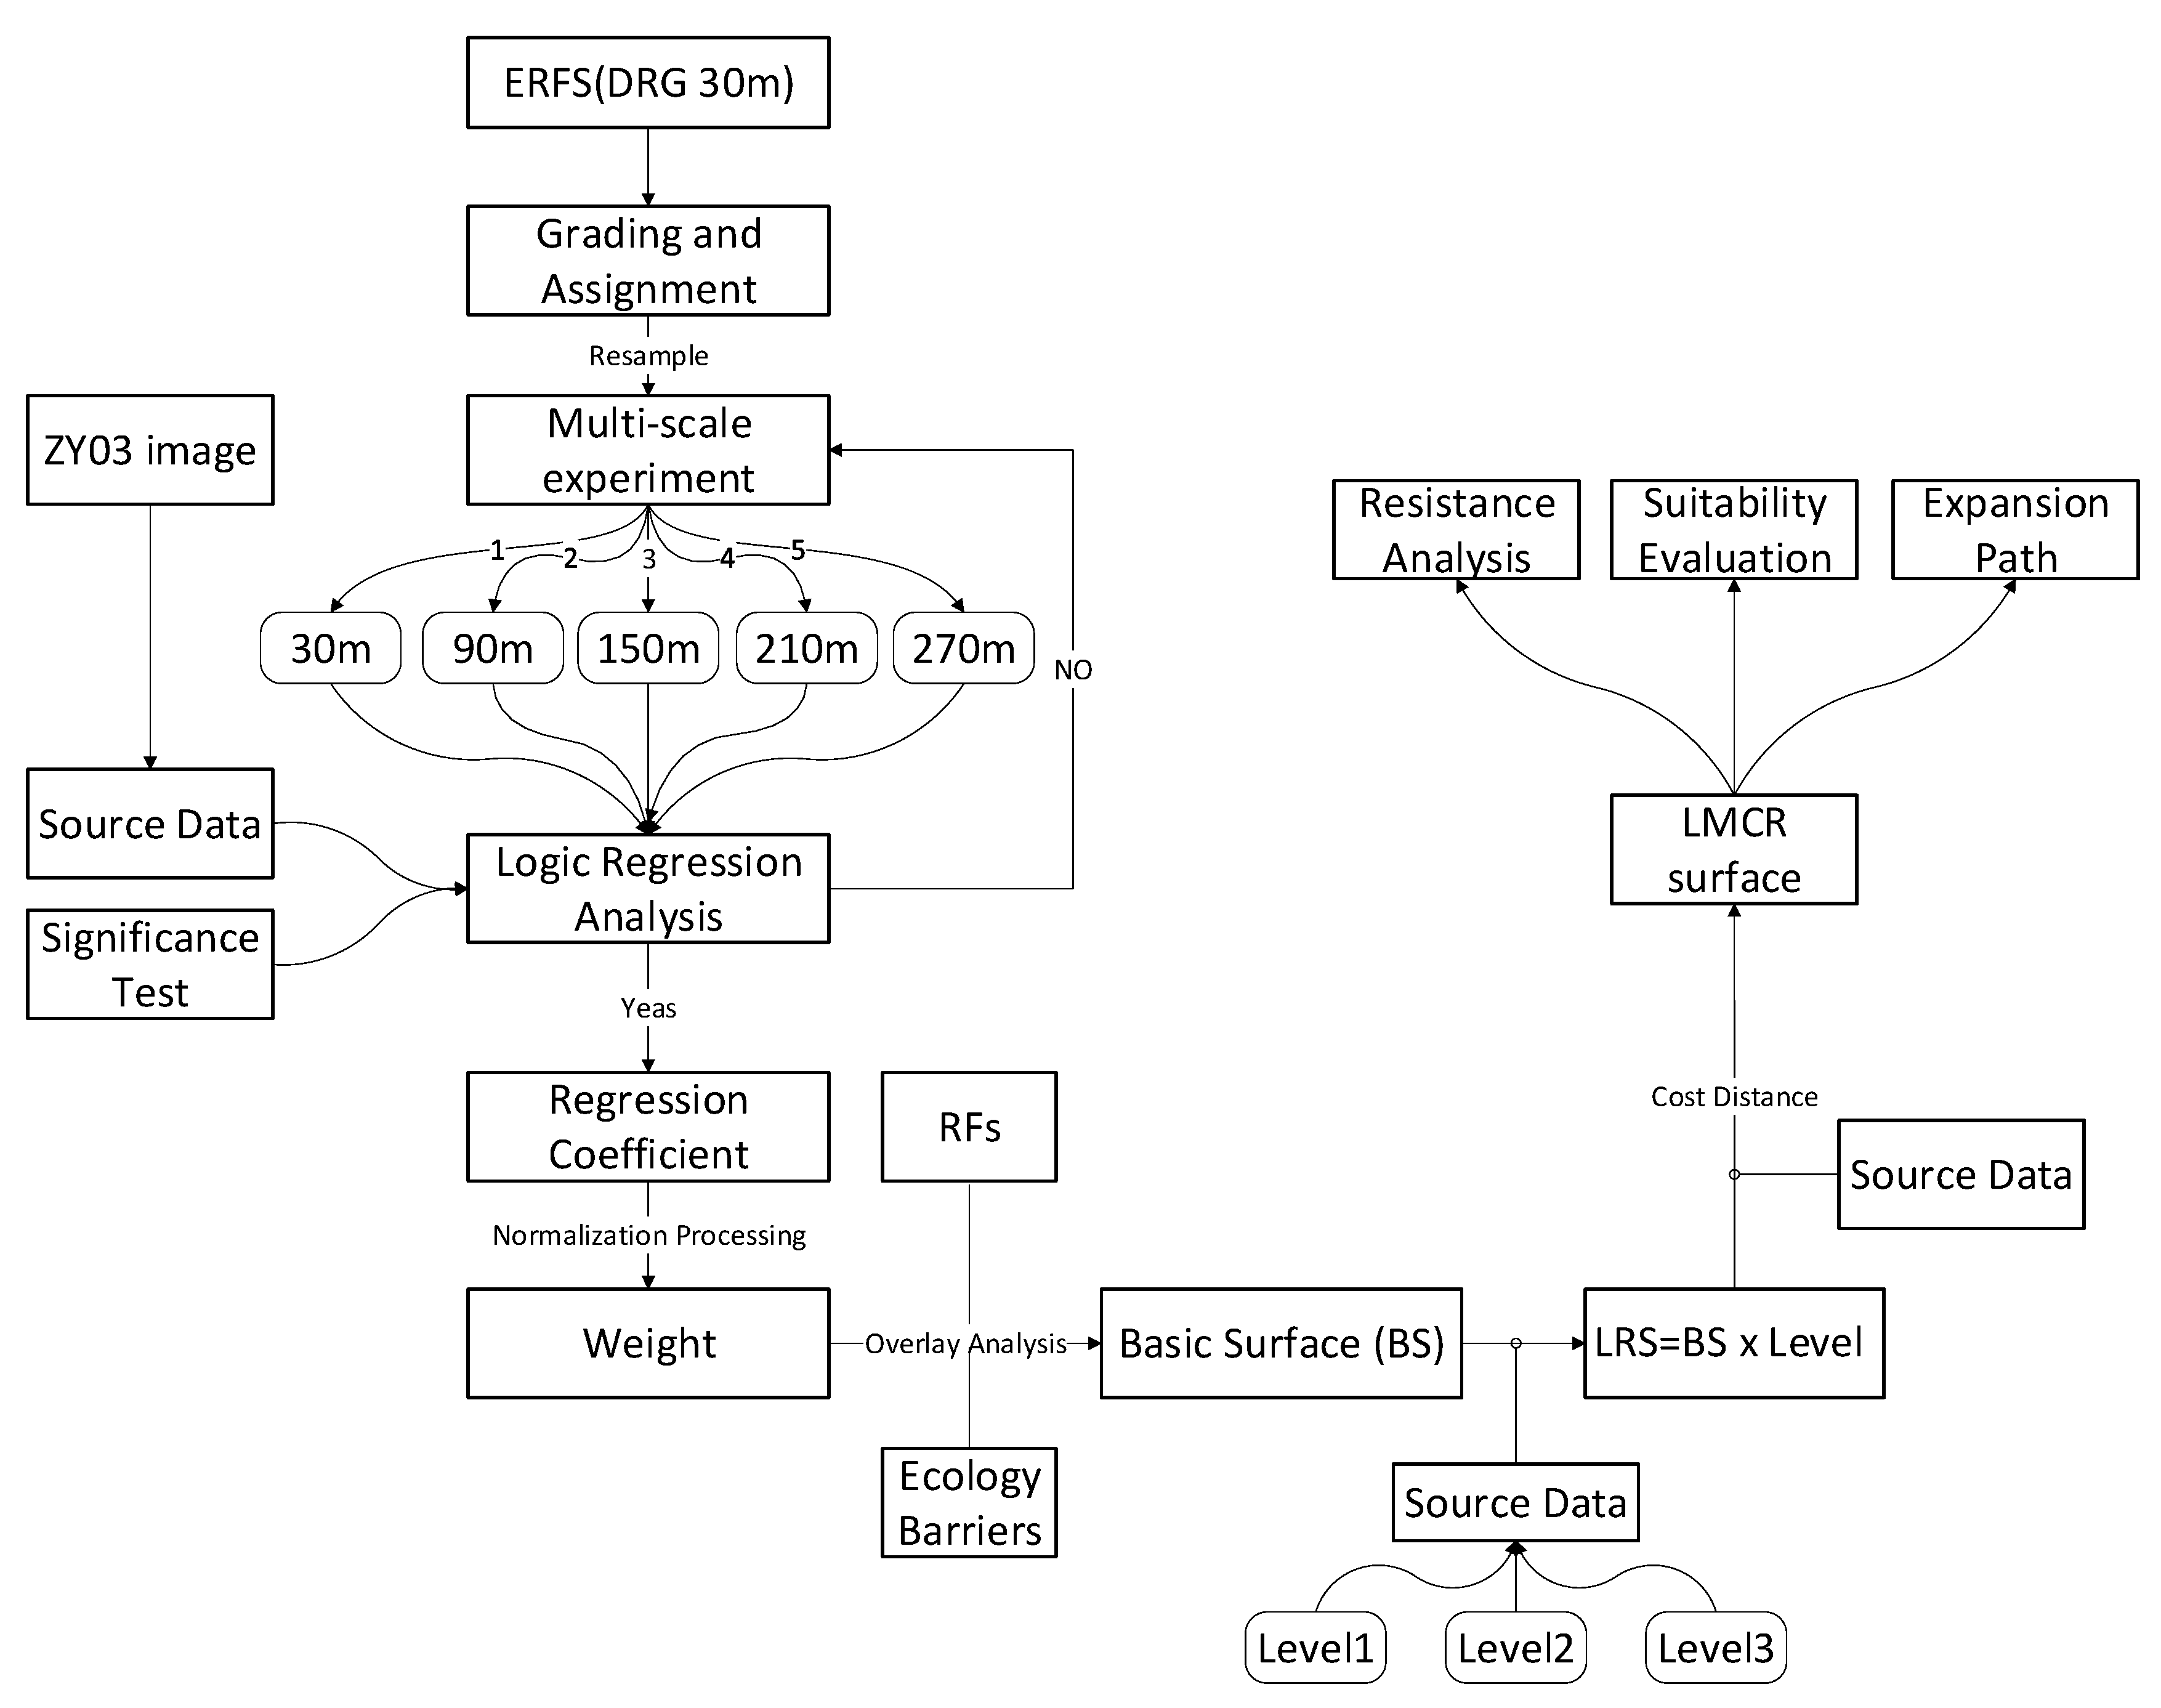
2.3.3. Implementation of the LMCR Model
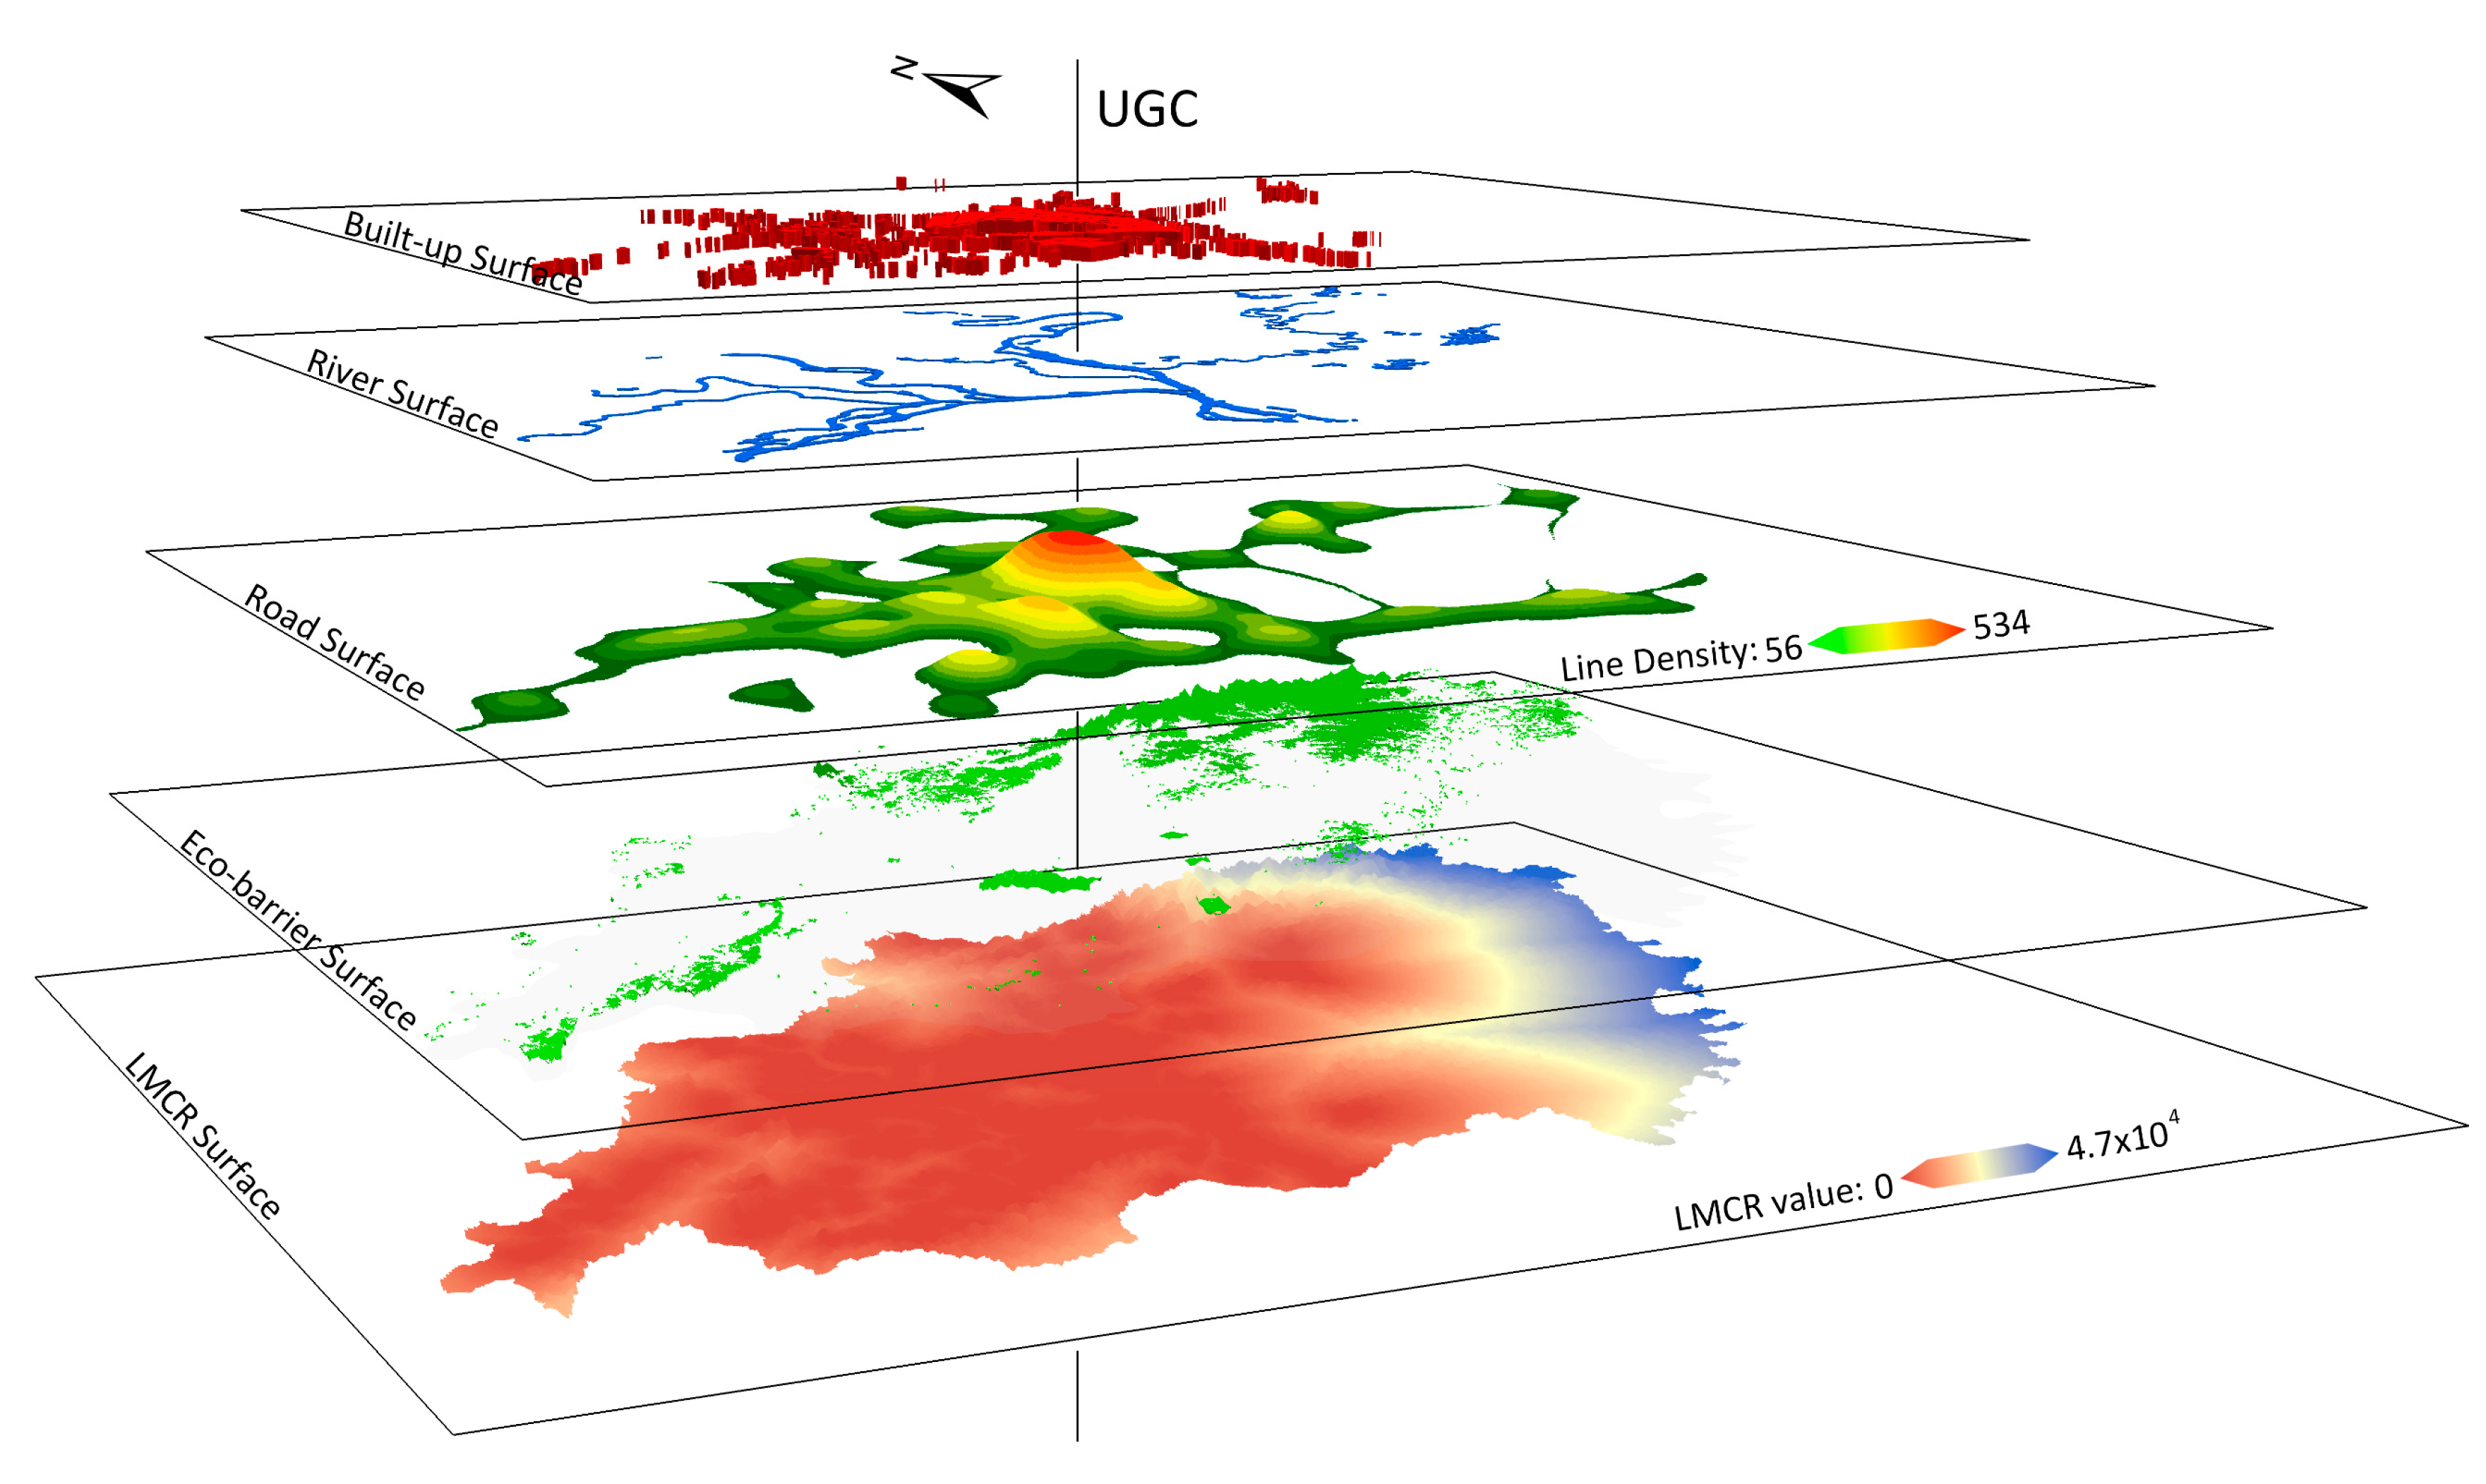
- (1)
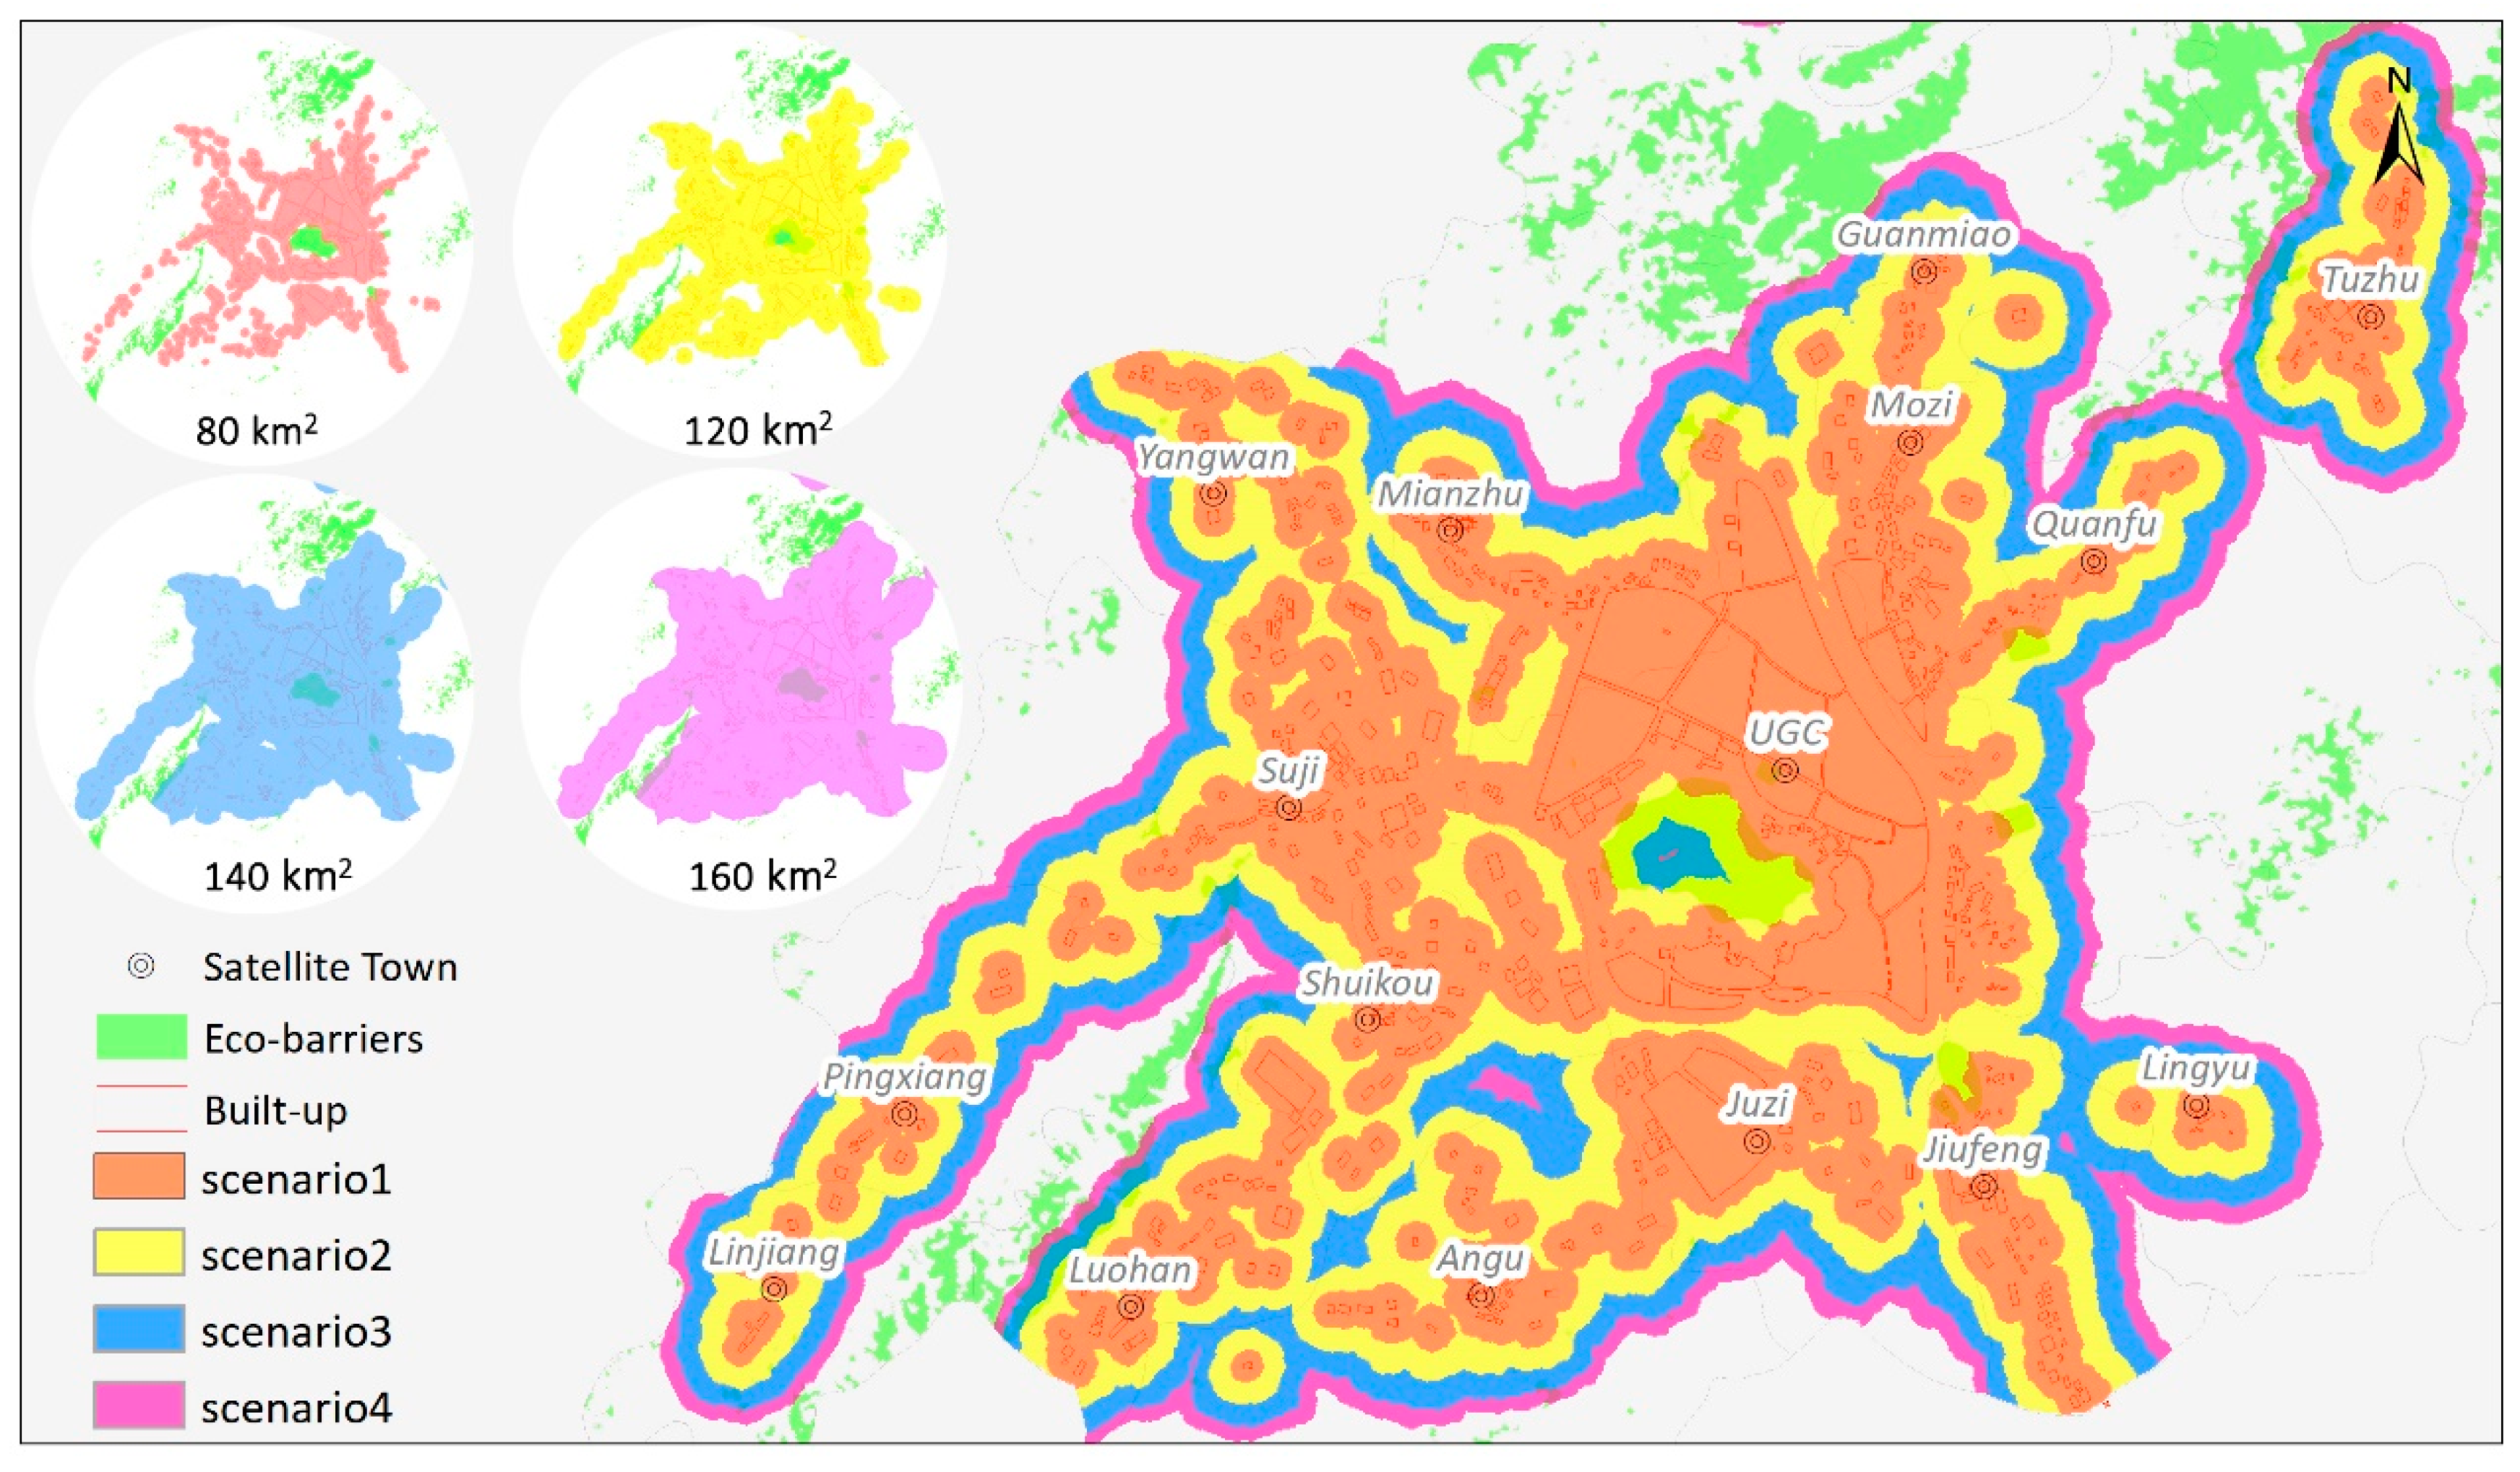
- To evaluate the suitability of urban expansion, we used the LMCR surface to conduct suitability zoning (the reclassification method); thus, we achieved the suitability distribution of urban expansion (Figure 7B).
- (2)
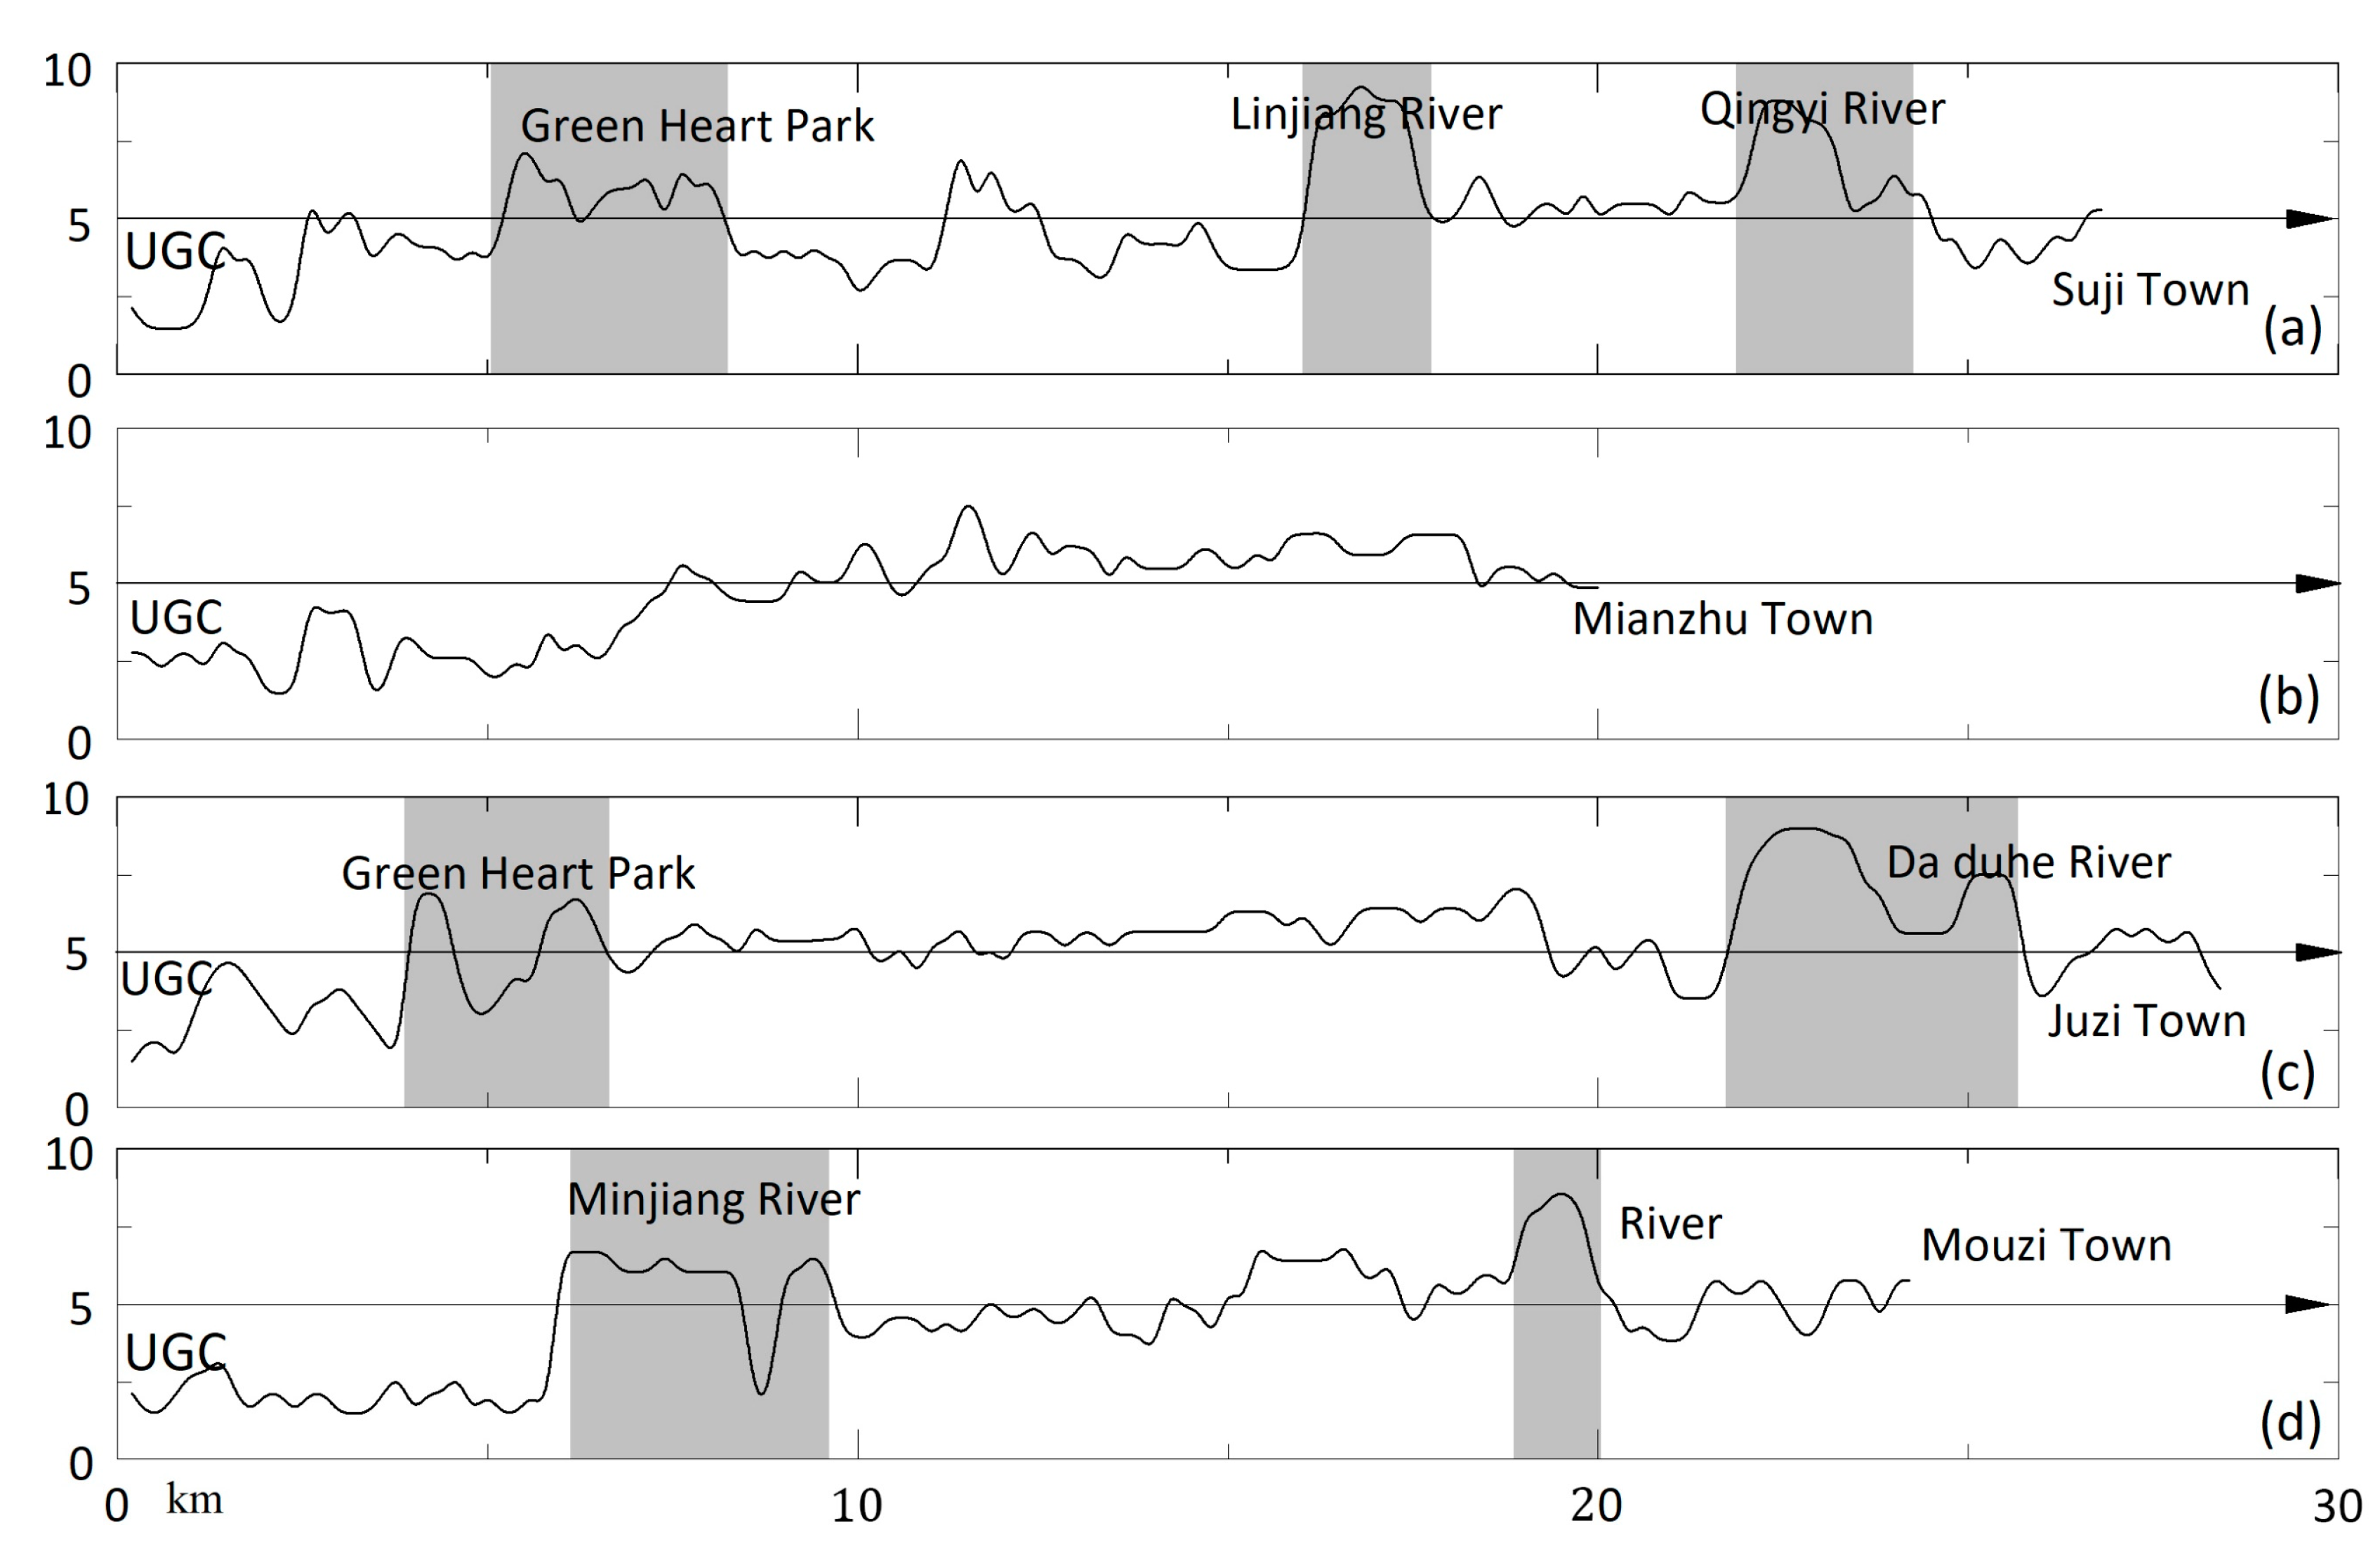
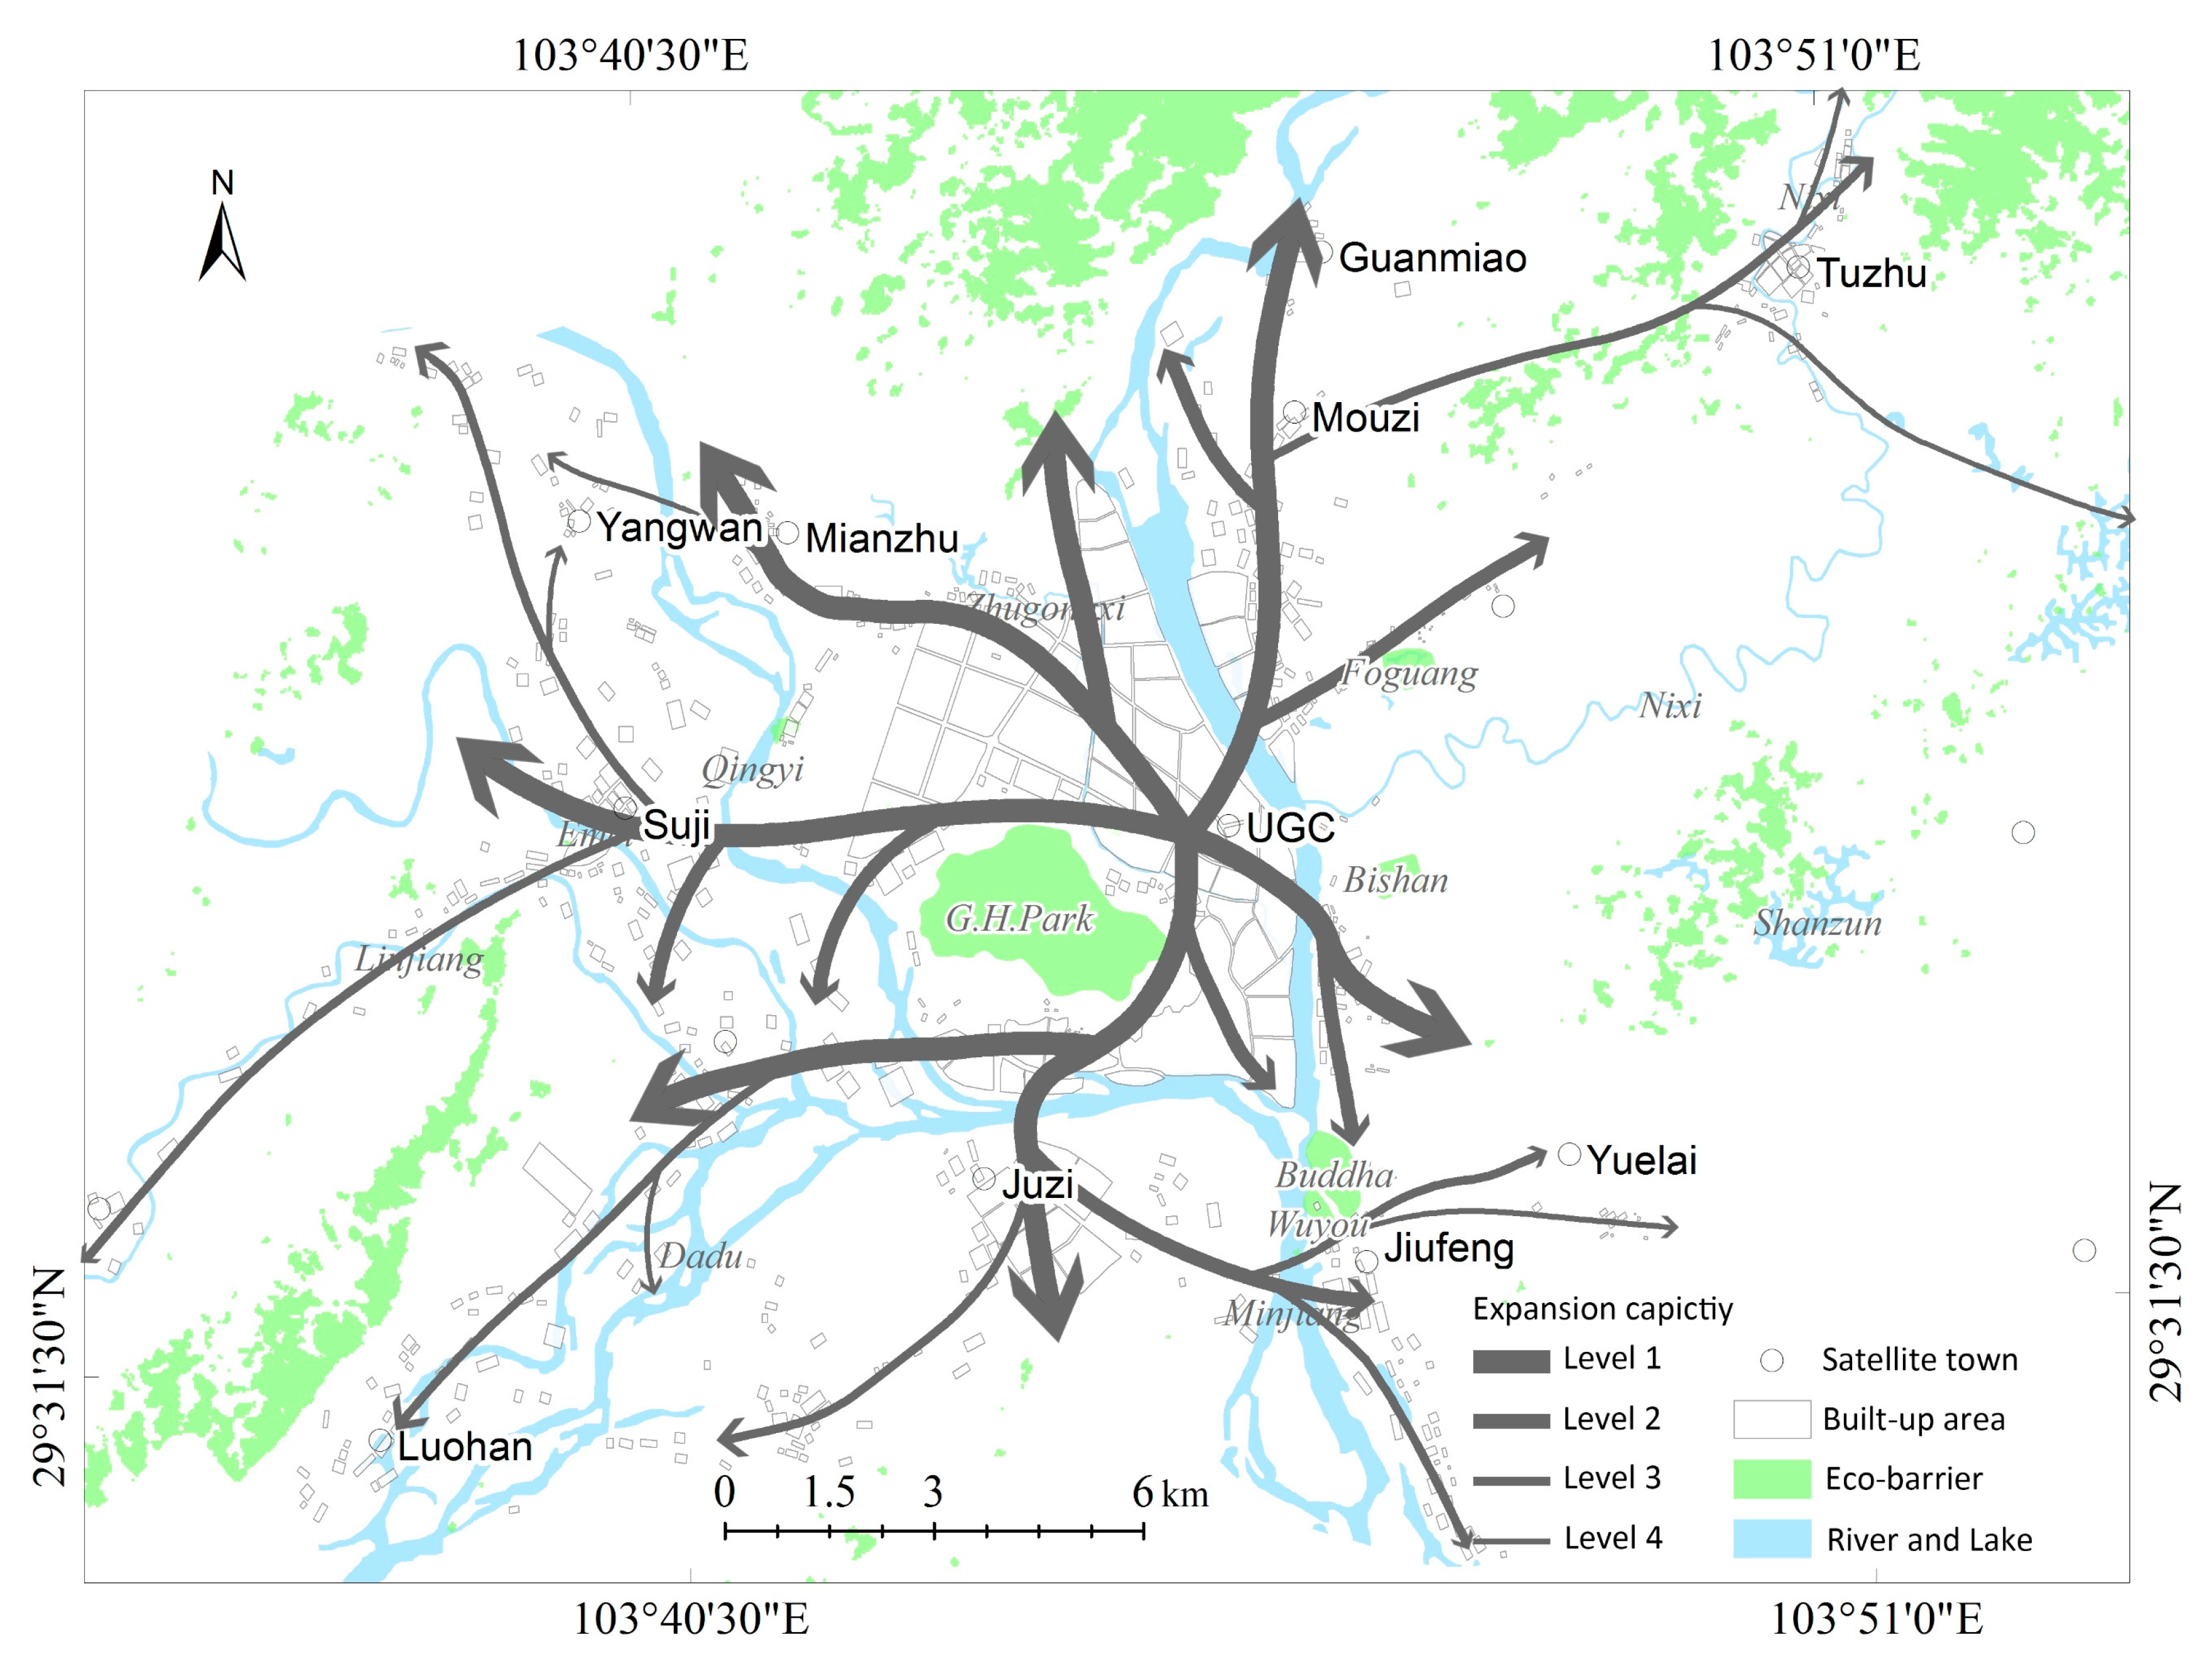
- We extracted the resistance curve of the LMCR surface from the urban geographic center (UGC) to satellite towns to evaluate the resistance variation in different directions (Figure 7C).
- (3)
- The expansion path and direction were calculated from the LMCR surface using cost path analysis (Figure 7D). R represents the value of the LMCR from landscape unit to source unit . , , and are defined as the expansion path.
3. Results
3.1. Resistance Analysis of UE
3.2. Suitability Evaluation of UE
3.3. Simulation of Direction and Scale of UE
4. Discussion
4.1. Validation of Results
4.2. Strategies for UE
5. Conclusions
Author Contributions
Funding
Acknowledgments
Conflicts of Interest
References
- Christopher, S.; Daniel, S.; Gregory, Y.; Christopher, E.; Kytt, M. Decades of urban growth and development on the Asian megadeltas. Global Planet. 2018, 165, 62–89. [Google Scholar]
- Daniel, R.; Paul, P.; Rachel, R.Y. Impacts of population density and wealth on the quantity and structure of urban green space in tropical Southeast Asia. Landsc. Urban Plan. 2017, 157, 553–560. [Google Scholar]
- Jiao, L.M.; Liu, J.F.; Shi, Z.K.; Zeng, C.; Liu, Y.L. Understanding urban expansion combining macro patterns and micro dynamics in three Southeast Asian megacities. Sci. Total Environ. 2019, 66, 375–383. [Google Scholar]
- Statistical bulletin on national economic and social development. 2019. Available online: http://www.stats.gov.cn/tjsj/zxfb/201902/t20190228_1651265.html. (accessed on 26 June 2019).
- Zheng, S.F.; Hou, W.L. Based on the ecological orientation of city spatial structure control. J. Mt. Sci. 2013, 31, 482–488. [Google Scholar]
- Mao, Z.Y.; Mao, Y.L. Fractal thinking about mountainous town planning. J. Mt. Sci. 2016, 34, 223–232. [Google Scholar]
- Wang, Q.F.; Zhang, X.C. The scenario analysis on urban ecological land spatial conflict and ecological security hidden danger in Guangzhou. J. Naturl. Res. 2015, 30, 1305–1317. [Google Scholar]
- Cao, K.; Xiao, J. Road system planning based on topographic analysis. J. Mt. Sci. 2013, 32, 473–481. [Google Scholar]
- Li, X.R. The urban population and urbanization had a steady growth. 2019. Available online: http://www.stats.gov.cn/tjsj/sjjd/201901/t20190123_1646380.html. (accessed on 26 June 2019).
- Luo, F.H.; Liu, Y.X.; Peng, J.; Wu, J.S. Assessing urban landscape ecological risk through an adaptive cycle framework. Landsc. Urban Plan. 2018, 180, 125–134. [Google Scholar] [CrossRef]
- Gao, P.P.; Li, Y.P.; Sun, J.; Li, H.W. Coupling fuzzy multiple attribute decision-making with Analytic hierarchy process to evaluate urban ecological security. Ecol. Complex. 2018, 34, 23–34. [Google Scholar] [CrossRef]
- Han, B.L.; Liu, H.X.; Wang, R.S. Urban ecological security assessment for cities in the Beijing-Tianjin-Hebei metropolitan region based on fuzzy and entropy methods. Ecol. Model. 2015, 318, 217–225. [Google Scholar] [CrossRef]
- Wang, S.D.; Zhang, X.Y.; Wu, T.X.; Yang, Y.Y. The evolution of landscape ecological security in Beijing under the influence of different policies in recent decades. Sci. Total Environ. 2019, 646, 49–57. [Google Scholar] [CrossRef] [PubMed]
- Wang, H.J.; Kong, X.D.; Zhang, B. The simulation of LUCC based on logistic-CA-Markov model in qilian mountain area, China. Sci. Cold Arid Regions 2016, 8, 350–358. [Google Scholar]
- Siddiqui, A.; Siddiqui, A.; Maithani, S.; Jha, A.K.; Kumar, P.; Srivastav, S.K. Urban growth dynamics of an Indian metropolitan using CA Markov and Logistic Regression. Egyptian J. Remote Sens. Space Sci. 2018, 21, 229–236. [Google Scholar] [CrossRef]
- Chakraborti, S.; Das, D.N.; Mondal, B.; Shafizadeh, H.; Feng, Y. A neural network and landscape metrics to propose a flexible urban growth boundary: A case study. Ecol. Indic. 2018, 93, 952–965. [Google Scholar] [CrossRef]
- Liu, Q.Y.; Peng, J.; Zhang, T.; Li, Y.R.; Hu, Y.N. Linking GRNN and neighborhood selection algorithm to assess land suitability in low-slope hilly areas. Ecol. Indic. 2018, 93, 581–590. [Google Scholar] [CrossRef]
- Li, M.J.; Jia, F.; Gang, X. Proximity Expansion Index: An improved approach to characterize evolution process of urban expansion. Comput. Environ. Urban Syst. 2018, 70, 102–112. [Google Scholar]
- Saxena, A.; Jat, M.K. Capturing heterogeneous urban growth using SLEUTH model. Remote Sens. Appl. Soc. Environ. 2019, 13, 426–434. [Google Scholar] [CrossRef]
- Kiavarz, M.; Jelokhani, M. Geothermal prospectivity mapping using GIS-based Ordered Weighted Averaging approach: A case study in Japan’s Akita and Iwate provinces. Geothermic 2017, 70, 295–304. [Google Scholar] [CrossRef]
- Aburas, M.M.; Ho, Y.M.; Ramli, M.F. Improving the capability of an integrate CA-Markov model to Simulate spatio-temporal urban growth trends using an Analytical Hierarchy Process and Frequency Ratio. Int. J. Appl. Earth OBS. 2017, 59, 65–78. [Google Scholar] [CrossRef]
- Mokarram, M.; Mirsoleimani, A. Using Fuzzy-AHP and order weight average (OWA) methods for land suitability determination for citrus cultivation in ArcGIS. Physica A 2018, 508, 506–518. [Google Scholar] [CrossRef]
- Knaapen, J.P.; Scheffer, M.; Harms, B. Estimating habitat isolation in landscape planning. Landsc. Urban Plan. 1992, 23, 10–16. [Google Scholar] [CrossRef]
- Adriaensen, F.; Chardon, J.P.; De Blust, G. The application of least cost modelling as functional landscape model. Landsc. Urban Plan. 2003, 64, 233–247. [Google Scholar] [CrossRef]
- Li, F.; Ye, Y.P.; Song, B.W.; Wang, R.S. Evaluation of urban suitable ecological land based on the minimum cumulative resistance model: a case study from Changzhou, China. Ecol. Model. 2015, 318, 194–203. [Google Scholar] [CrossRef]
- Andreia, M.M.; Carlos, R.; Pedro, M. Landscape resistance influences effective dispersal of endangered golden lion tamarins within the Atlantic Forest. Biol. Conserv. 2018, 224, 178–187. [Google Scholar] [Green Version]
- Huang, M.Y.; Yue, W.Z.; Feng, S.R.; Chai, J.J. Analysis of spatial heterogeneity of ecological security based on MCR model and ecological pattern optimization in the Yuexi county of the Dabie Mountain Area. J. Nat. Res. 2019, 34, 771–784. [Google Scholar]
- Qiu, S.; Wang, Y.; Wang, Pi.; Lin, C. Construction of urban ecological security pattern and construction land development based on MCR Mode. Trans. CSAE 2018, 34, 257–265. [Google Scholar]
- Huang, L.M.; Chen, J.F. Suitability Evaluation of Urban Construction Land Based on Features Extraction of a MCR Surface. Res. Sci. 2014, 36, 1348–1354. [Google Scholar]
- Isaaks, E.H.; Srivastava, M.R. An introduction to applied geo-statistics; Oxford University Press: Oxford, UK, 1990. [Google Scholar]
- Di Fazio, S.; Modica, G. Historic Rural Landscapes: Sustainable Planning Strategies and Action Criteria. The Italian Experience in the Global and European Context. Sustainability 2018, 10, 3834. [Google Scholar] [CrossRef]
- Modica, G.; Vizzari, M.; Pollino, M.; Fichera, C.R.; Zoccali, P.; Di Fazio, S. Spatio-temporal analysis of the urban–rural gradient structure: an application in a Mediterranean mountainous landscape (Serra San Bruno, Italy). Earth Syst. Dynam. 2012, 3, 263–279. [Google Scholar] [CrossRef]
- Fichera, C.R.; Modica, G.; Pollino, M. GIS and Remote Sensing to Study Urban-Rural Transformation During a Fifty-Year Period. In Computational Science and Its Applications–ICCSA 2011; Murgante, B., Gervasi, O., Iglesias, A., Taniar, D., Apduhan, B.O., Eds.; Springer: Berlin/Heidelberg, Germany, 2011. [Google Scholar]
- Azhdari, A.; Sasani, M.A.; Soltani, A. Exploring the relationship between spatial driving forces of urban expansion and socioeconomic segregation: The case of Shiraz. Habitat Int. 2018, 81, 33–34. [Google Scholar] [CrossRef]
- Karimi, A.; Sultana, S.; Babakan, A.S.; Suthaharan, S. An enhanced support vector machine model for urban expansion prediction. Comput. Environ. Urban Syst. 2018, 75, 61–75. [Google Scholar]
- Moein, M.; Asgarian, A.; Sakieh, Y.; Soffianian, A. Scenario-based analysis of land-use competition in central Iran: Finding the trade-off between urban growth patterns and agricultural productivity. Sustainable Cities Soc. 2018, 39, 557–567. [Google Scholar] [CrossRef]
- Gong, J.M.; Hu, Z.R.; Chen, W.L. Urban expansion dynamics and modes in metropolitan Guangzhou, China. Land Use Pol. 2018, 72, 100–109. [Google Scholar] [CrossRef]
- Zhang, W.; Li, W.; Zhang, C.; Hanink, D.M.; Liu, Y.; Zhai, R. Analyzing horizontal and vertical urban expansions in three East Asian megacities with the SS-co-MCRF model. Landsc. Urban Plan. 2018, 177, 114–127. [Google Scholar] [CrossRef]
- Ye, B.; Cheng, M.J.; Zhang, Y.M. Suitability evaluation of development land in urban master plan. City Plan. Rev. 2011, 35, 42–44. [Google Scholar]
- Yang, Y.Y.; Liu, Y.S.; Du, G.M. Quantifying spatio-temporal patterns of urban expansion in Beijing during 1985–2013 with rural-urban development transformation. Land Use Pol. 2017, 74, 220–230. [Google Scholar] [CrossRef]


| RF | Ecological Analysis |
|---|---|
| Elevation | LS is located in a hilly area with altitudes ranging from 147 to 641 m. The built-up areas are mainly distributed on relatively flat areas on both sides of the river, and the available construction land is limited. Mountain terrain is the restrictive factor of urban expansion. In view of this, elevation was determined to have an important impact on urban expansion. |
| Slope | The slope of LS ranges from 0° to 70.4°, and the proportion from 14.3° to 27.8° is about 49%. There is a high incidence of landslides and debris flows. Therefore, slope and elevation are combined to evaluate the resistance of urban expansion in this case study. |
| Geological hazards (GH) | According to the survey data, the types of geological hazards in LS include landslides, debris flows, and earthquakes. They mainly occur in the central district, Suji, Juzi, and Mianzhu. Geological hazards are regarded as an important resistance factor for urban expansion (UE). |
| Subgrade bearing capacity (SBC) | The urban expansion toward higher terraces and low hill areas, the thickness distribution of Quaternary overburden, and the physical properties of rocks and soil vary greatly. All of these lead to an uneven pattern of settlement. |
| Natural reserve (NR) | LS is a natural and cultural heritage city with many scenic spots, nature reserves, national forests, and geological parks. All of these play an important role in regional economic development and ecological resources protection. |
| Landscape type (LST) | Land use and cover was reclassified into six types (woodland, grassland, farmland, water area, constructed land, and bare land). The basic farmland, green space (e.g., mountain forest parks), and nature reserves are unsuitable for expansion and so the resistance is infinity (ecological barrier). In addition, we allocate resistance values based on the location of grasslands and woodlands and their ecological values. |
| Density of the urban population (DUP) | The urban population is the driving force of urbanization. The higher the density of the urban population, the lower the resistance to urban expansion, and vice versa. |
| GDP | GDP reflects the development level of the regional economy, as well as regional input and output. It shows the vitality of various type of production and construction in the region. |
| Convenient transportation (CT) | Compared with other types of cities, the road networks in mountain cities are more conducive to urban expansion. Therefore, road network data are processed to analyze the convenience of transportation and urban expansion resistance. |
| Water supply-drainage conditions (WSDC) | There are dense river networks often affected by floods. Accordingly, WSDC was select as a resistance factor of UE. |
| Resistance Factors | Sub-factors | Level | Assignment | Weight |
|---|---|---|---|---|
| Terrain | Elevation (m) | <374 | 1 | 0.11 |
| 374–400 | 3 | |||
| 400–431 | 5 | |||
| 431–478 | 7 | |||
| >478 | 9 | |||
| Slope (°) | <6.5 | 1 | 0.07 | |
| 6.5–11.5 | 3 | |||
| 11.5–18.5 | 5 | |||
| 18.5–27.5 | 7 | |||
| >27.5 | 9 | |||
| Engineering Geology | GH (Freq.) | <1 | 1 | 0.11 |
| 1–2 | 3 | |||
| 3–4 | 5 | |||
| 5–6 | 7 | |||
| >7 | 9 | |||
| SBC (t/ m2) | >70 | 1 | 0.09 | |
| 55–70 | 3 | |||
| 40–55 | 5 | |||
| 25–40 | 7 | |||
| <25 | 9 | |||
| Urban Ecology | LST | Built-up area | 1 | 0.13 |
| Grassland | 3 | |||
| Farmland | 5 | |||
| Woodland | 7 | |||
| Water bodies | 9 | |||
| NR | Ecological barrier | +∞ | 0.06 | |
| Socioeconomic | DUP (sq. km) | >3000 | 1 | 0.11 |
| 200–3000 | 3 | |||
| 1000–2000 | 5 | |||
| 500–1000 | 7 | |||
| <500 | 9 | |||
| CT (km) | <1 | 1 | 0.1 | |
| 1–2 | 3 | |||
| 2–3 | 5 | |||
| 3–4 | 7 | |||
| >4 | 9 | |||
| WSDC (km) | <1 | 1 | 0.1 | |
| 1–5 | 3 | |||
| 5–0 | 5 | |||
| 10–15 | 7 | |||
| >15 | 9 | |||
| GDP (¥) | >100,000 | 1 | 0.12 | |
| 50,000–100,000 | 3 | |||
| 30,000–50,000 | 5 | |||
| 10,000–30,000 | 7 | |||
| <10,000 | 9 |
| Zone | Sub-zone | Percent | LMCR | Distribution |
|---|---|---|---|---|
| Source | Source | 9.9% | 0 | Boshui (BS) street, Buddha street, Zhangogngqiao (ZGQ) street, Shanghe (SH) street, Boyang (BY) street, Tianjian (TJ) street, and Xiaoba (XB) street. |
| Suitable expansion | Level 1 | 23.5% | 0–4570 | Mianzhu, Juzi, Suji, and Mouzi. |
| Level 2 | 27.3% | 4570–9733 | The north part of Mianzhu, including Mouzi, Guanmiao town and Shawan district. | |
| Unsuitable expansion | Buffer | 29.1% | 9733–30633 | Buffer zones of nature reserves and scenic spots. |
| Core | 10.2% | 30633–4700 | LS Buddha, mountain forest park, Minjiang water-source reserves, basic farmland, and protected mountain ecological areas. |
© 2019 by the authors. Licensee MDPI, Basel, Switzerland. This article is an open access article distributed under the terms and conditions of the Creative Commons Attribution (CC BY) license (http://creativecommons.org/licenses/by/4.0/).
Share and Cite
Wang, H.; Peng, P.; Kong, X.; Zhang, T.; Yi, G. Evaluating the Suitability of Urban Expansion Based on the Logic Minimum Cumulative Resistance Model: A Case Study from Leshan, China. ISPRS Int. J. Geo-Inf. 2019, 8, 291. https://0-doi-org.brum.beds.ac.uk/10.3390/ijgi8070291
Wang H, Peng P, Kong X, Zhang T, Yi G. Evaluating the Suitability of Urban Expansion Based on the Logic Minimum Cumulative Resistance Model: A Case Study from Leshan, China. ISPRS International Journal of Geo-Information. 2019; 8(7):291. https://0-doi-org.brum.beds.ac.uk/10.3390/ijgi8070291
Chicago/Turabian StyleWang, Haijun, Peihao Peng, Xiangdong Kong, Tingbin Zhang, and Guihua Yi. 2019. "Evaluating the Suitability of Urban Expansion Based on the Logic Minimum Cumulative Resistance Model: A Case Study from Leshan, China" ISPRS International Journal of Geo-Information 8, no. 7: 291. https://0-doi-org.brum.beds.ac.uk/10.3390/ijgi8070291