Article

A GIS-Based Support Vector Machine Model for Flash Flood Vulnerability Assessment and Mapping in China

1
School of Civil Engineering and Architecture, Southwest Petroleum University, Chengdu 610500, China
2
State Key Laboratory of Resources and Environmental Information System, Institute of Geographic Sciences and Natural Resources Research, CAS, Beijing 100101, China
3
University of Chinese Academy of Sciences, Beijing 100049, China
4
Jiangsu Center for Collaborative Innovation in Geographical Information Resource Development and Application, Nanjing 210023, China
5
China Institute of Water Resources and Hydropower Research, Beijing 100038, China
*
Author to whom correspondence should be addressed.
ISPRS Int. J. Geo-Inf. 2019, 8(7), 297; https://0-doi-org.brum.beds.ac.uk/10.3390/ijgi8070297
Submission received: 11 June 2019 / Revised: 9 July 2019 / Accepted: 9 July 2019 / Published: 12 July 2019

Abstract

:
Flash floods are one of the natural disasters that threaten the lives of many people all over the world every year. Flash floods are significantly affected by the intensification of extreme climate events and interactions with exposed and vulnerable socio-economic systems impede regional development processes. Hence, it is important to estimate the loss due to flash floods before the disaster occurs. However, there are no comprehensive vulnerability assessment results for flash floods in China. Fortunately, the National Mountain Flood Disaster Investigation Project provided a foundation to develop this proposed assessment. In this study, an index system was established from the exposure and disaster reduction capability categories, and is based on analytic hierarchy process (AHP) methods. We evaluated flash flood vulnerability by adopting the support vector machine (SVM) model. Our results showed 439 counties with high and extremely high vulnerability (accounting for 10.5% of the land area and corresponding to approximately 100 million hectares (ha)), 571 counties with moderate vulnerability (accounting for 19.18% of the land area and corresponding to approximately 180 million ha), and 1128 counties with low and extremely low vulnerability (accounting for 39.43% of the land area and corresponding to approximately 370 million ha). The highly-vulnerable counties were mainly concentrated in the south and southeast regions of China, moderately-vulnerable counties were primarily concentrated in the central, northern, and southwestern regions of China, and low-vulnerability counties chiefly occurred in the northwest regions of China. Additionally, the results of the spatial autocorrelation suggested that the “High-High” values of spatial agglomeration areas mainly occurred in the Zhejiang, Fujian, Jiangxi, Hunan, Guangxi, Chongqing, and Beijing areas. On the basis of these results, our study can be used as a proposal for population and building distribution readjustments, and the management of flash floods in China.

1. Introduction

Worldwide mountain communities have continuously suffered from flash floods, which have regularly caused losses of agricultural land, buildings, infrastructure, and life. China is one of the countries that has suffered the most serious flash floods in the world [1], and the occurrence of flash floods is increasing. Flash floods are primarily affected by extreme precipitation and the overuse of natural resources [2]. First, extreme precipitation has increased in China, and the areas that experience extreme precipitation are also increasing [3]. Second, due to the over-exploitation of natural resources and vegetation destruction, the instability of soil surface has increased [4]. A statistic from the National Mountain Flood Disaster Investigation Project shows that approximately 60,000 flash floods occurred in China from 1950 to 2015. These disasters caused more than 230,000 deaths, damaged 36.3 million houses, transferred more than 43.2 million people, and resulted in 250 million yuan in direct economic losses [5]. For example, a flash flood caused 1471 deaths, 294 persons were missing, and more than 300 families were buried, and was attributed to continuous rainfall on August 8th, 2010 in Zhouqu County of the Gansu province [6]. To alleviate the adverse effects of flash floods on society, it is necessary to quantitatively evaluate community vulnerability and analyze various reduction measures of vulnerability. Such studies can strengthen our understanding of the community vulnerabilities resulting from flash floods, and such an endeavor will contribute to the development of prevention and control measures of flash floods.
In recent years, researchers have conducted several vulnerability assessments on flash floods, debris flow, landslides, and other disasters based on global, national, and regional scales [7,8,9]. Many studies now pay more attention to vulnerability research and confirm its significance. Currently, studies have principally focused on the following aspects: (1) The concept of the index system for vulnerability assessments of flash floods [10,11]. For example, Ding et al. selected six indices (building structure, construction year, floor area, floor number, number of exposed people, and family income) to evaluate debris flow vulnerability in Dongchuan City of the Yunnan Province using a neural network method [12]. (2) Models for flash flood vulnerability assessments [13,14,15]. Vulnerability assessments of flash floods can adopt qualitative [16], quantitative [17,18], or semi-quantitative analyses [19]. The methods of quantitative assessment include statistical analysis methods [11], mathematical models [20], and machine learning methods [21]. (3) The vulnerability assessments of flash floods have primarily concentrated on the provincial or watershed scales [22,23,24]. Vranken, Hung, and Ding conducted quantitative vulnerability studies on small, regional, and watershed scales [19,25,26], and these studies provide an important foundation to alleviate disasters resulting from regional flash floods. However, there are no reliable vulnerability assessment results for national flash floods due to China’s vast amount of territory, huge differences in regional socio-economics, and uneven distribution of disaster intensity and frequency. In addition, the Chinese government urgently needs to strengthen the construction of non-engineering measures and rationally allocate resources on the basis of vulnerability assessment results. Therefore, it is imperative to fully understand the spatial patterns of community vulnerability to flash floods in China. With the implementation of the National Mountain Flood Disaster Investigation Project (NMFDIP), various basic data on flash flood vulnerability assessments have been obtained, and provide a foundation for this study.
In this study, based on the need for flash flood disaster prevention and mitigation in China, we adopted the flash flood disaster prevention and control area in China (designated by the Research Center on Flood and Drought Disaster Reduction of the Ministry of Water Resources of China, RCFDDRMWRC) as the research area. A vulnerability assessment of national flash floods is conducted. The main objectives are as follows: (1) Establish a vulnerability evaluation index system for flash floods in China, including exposure and disaster reduction capabilities. (2) Build a vulnerability evaluation model based on the support vector machine model to obtain flash flood vulnerability assessment results in China. (3) Analyze the spatial characteristics of flash flood exposure, disaster reduction capability, and vulnerability in China using the assessment results. Such research can provide a scientific and technological basis for the mitigation of flash floods in China.

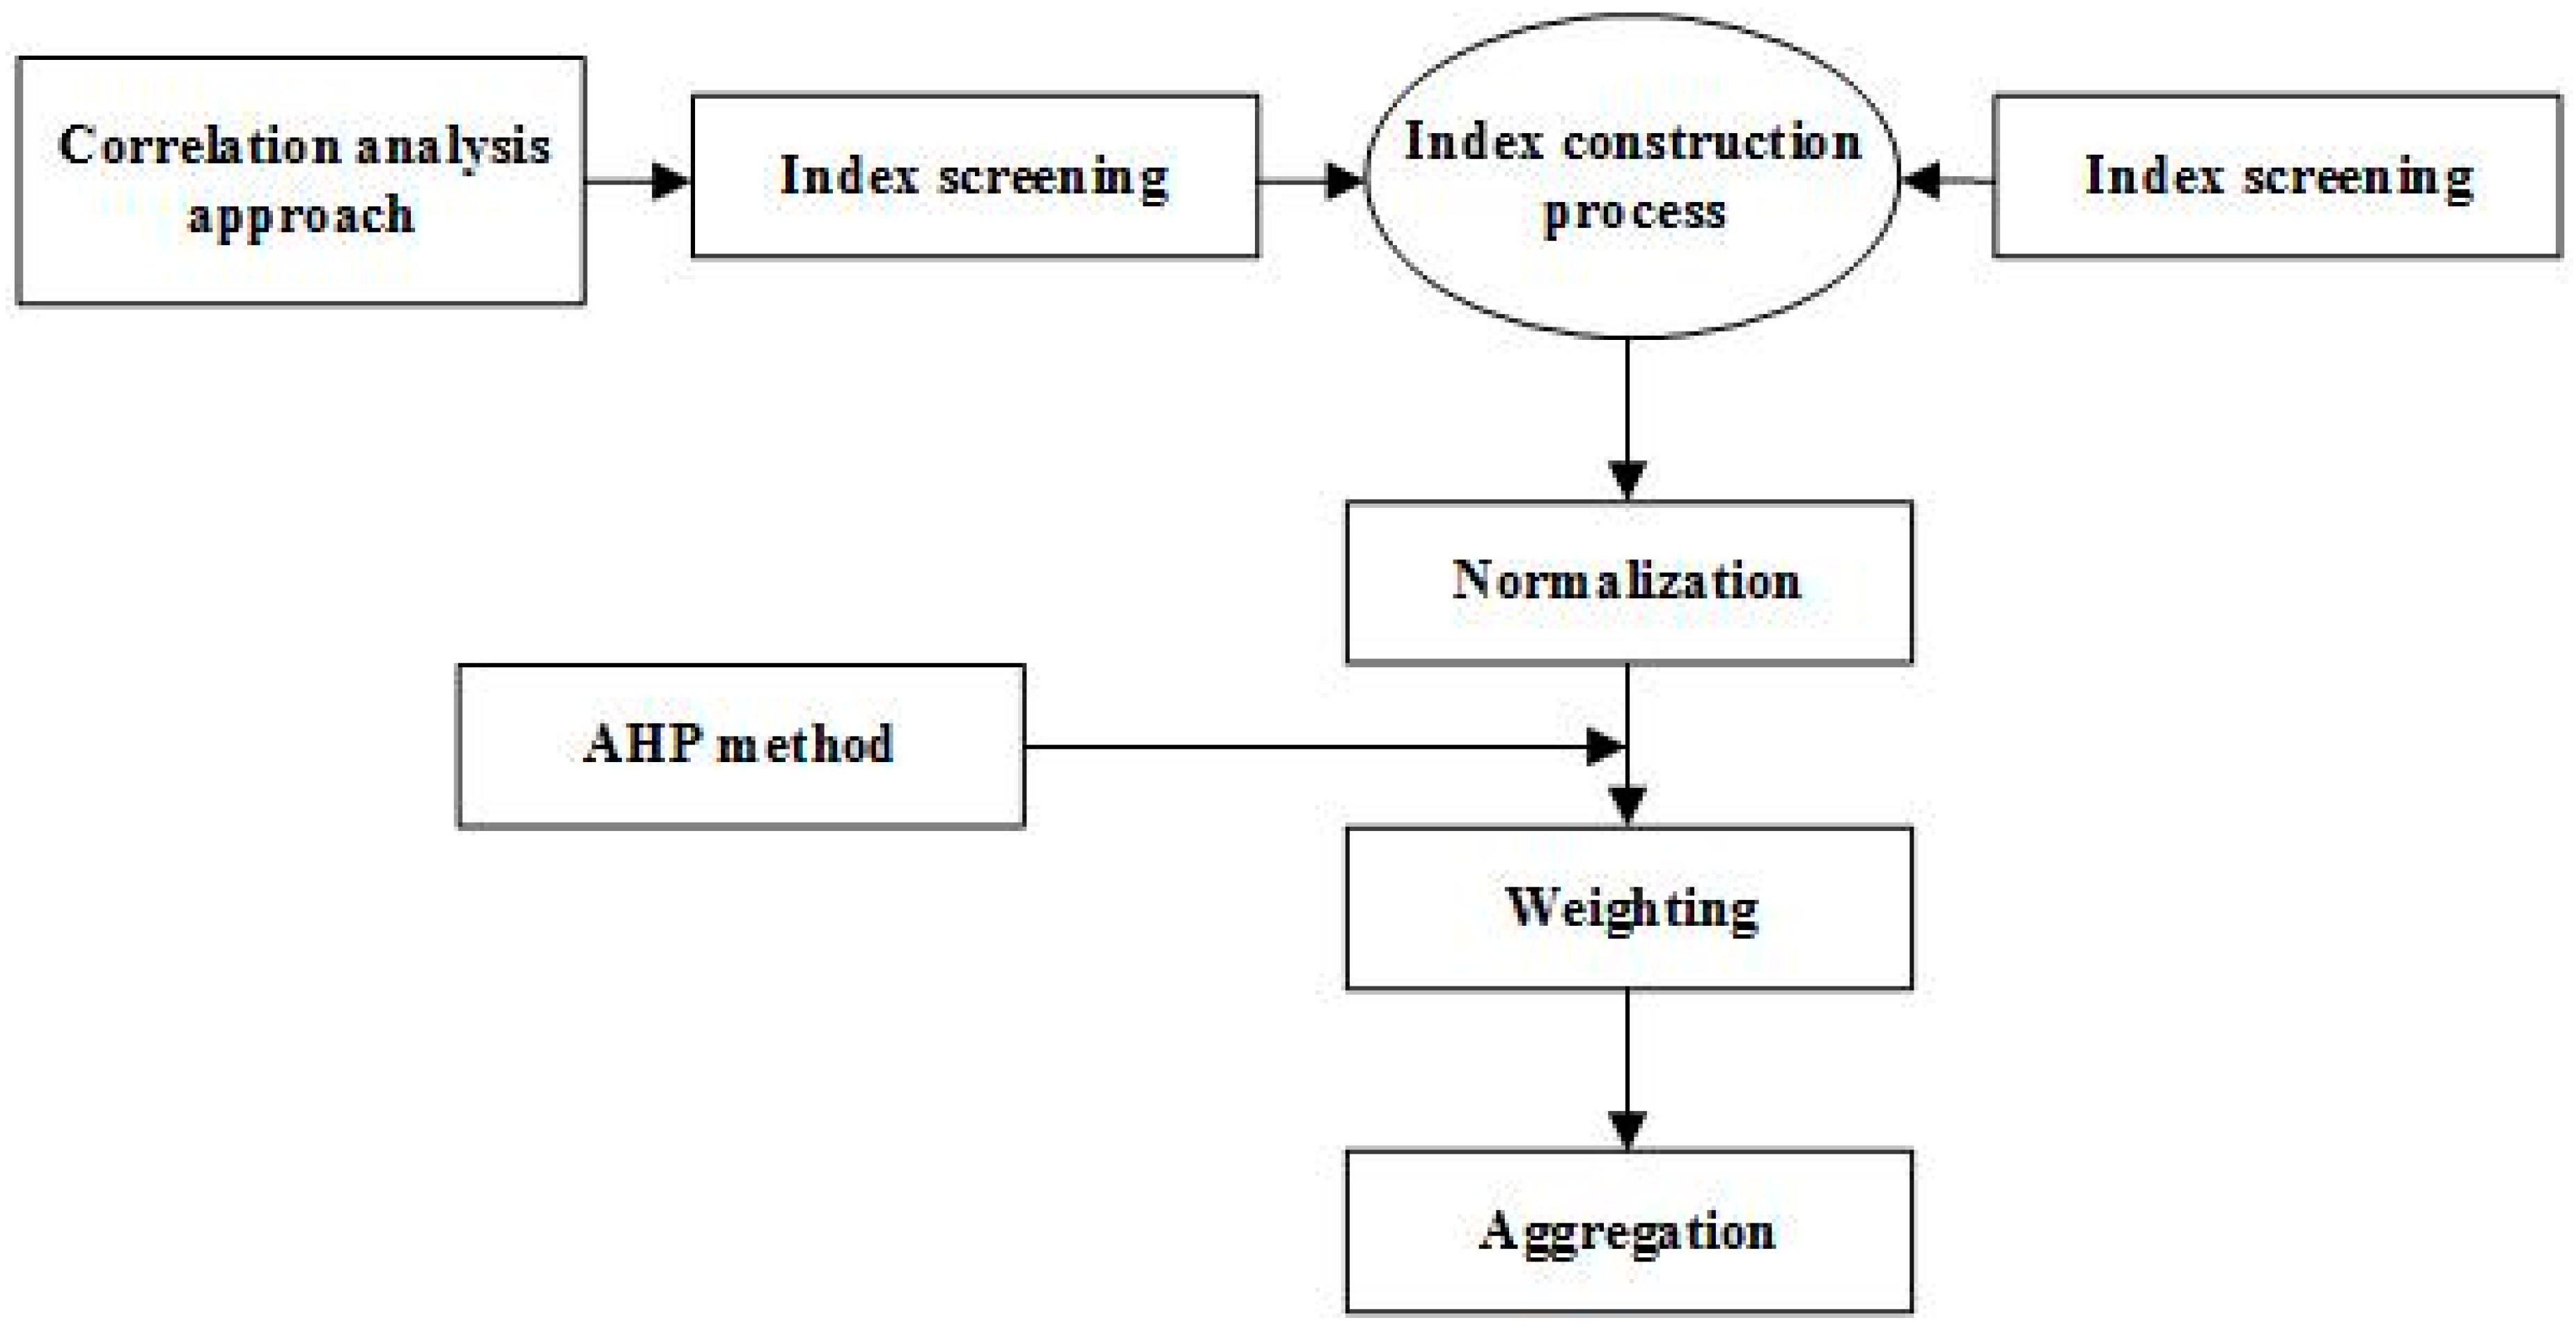
2. Materials and Methods
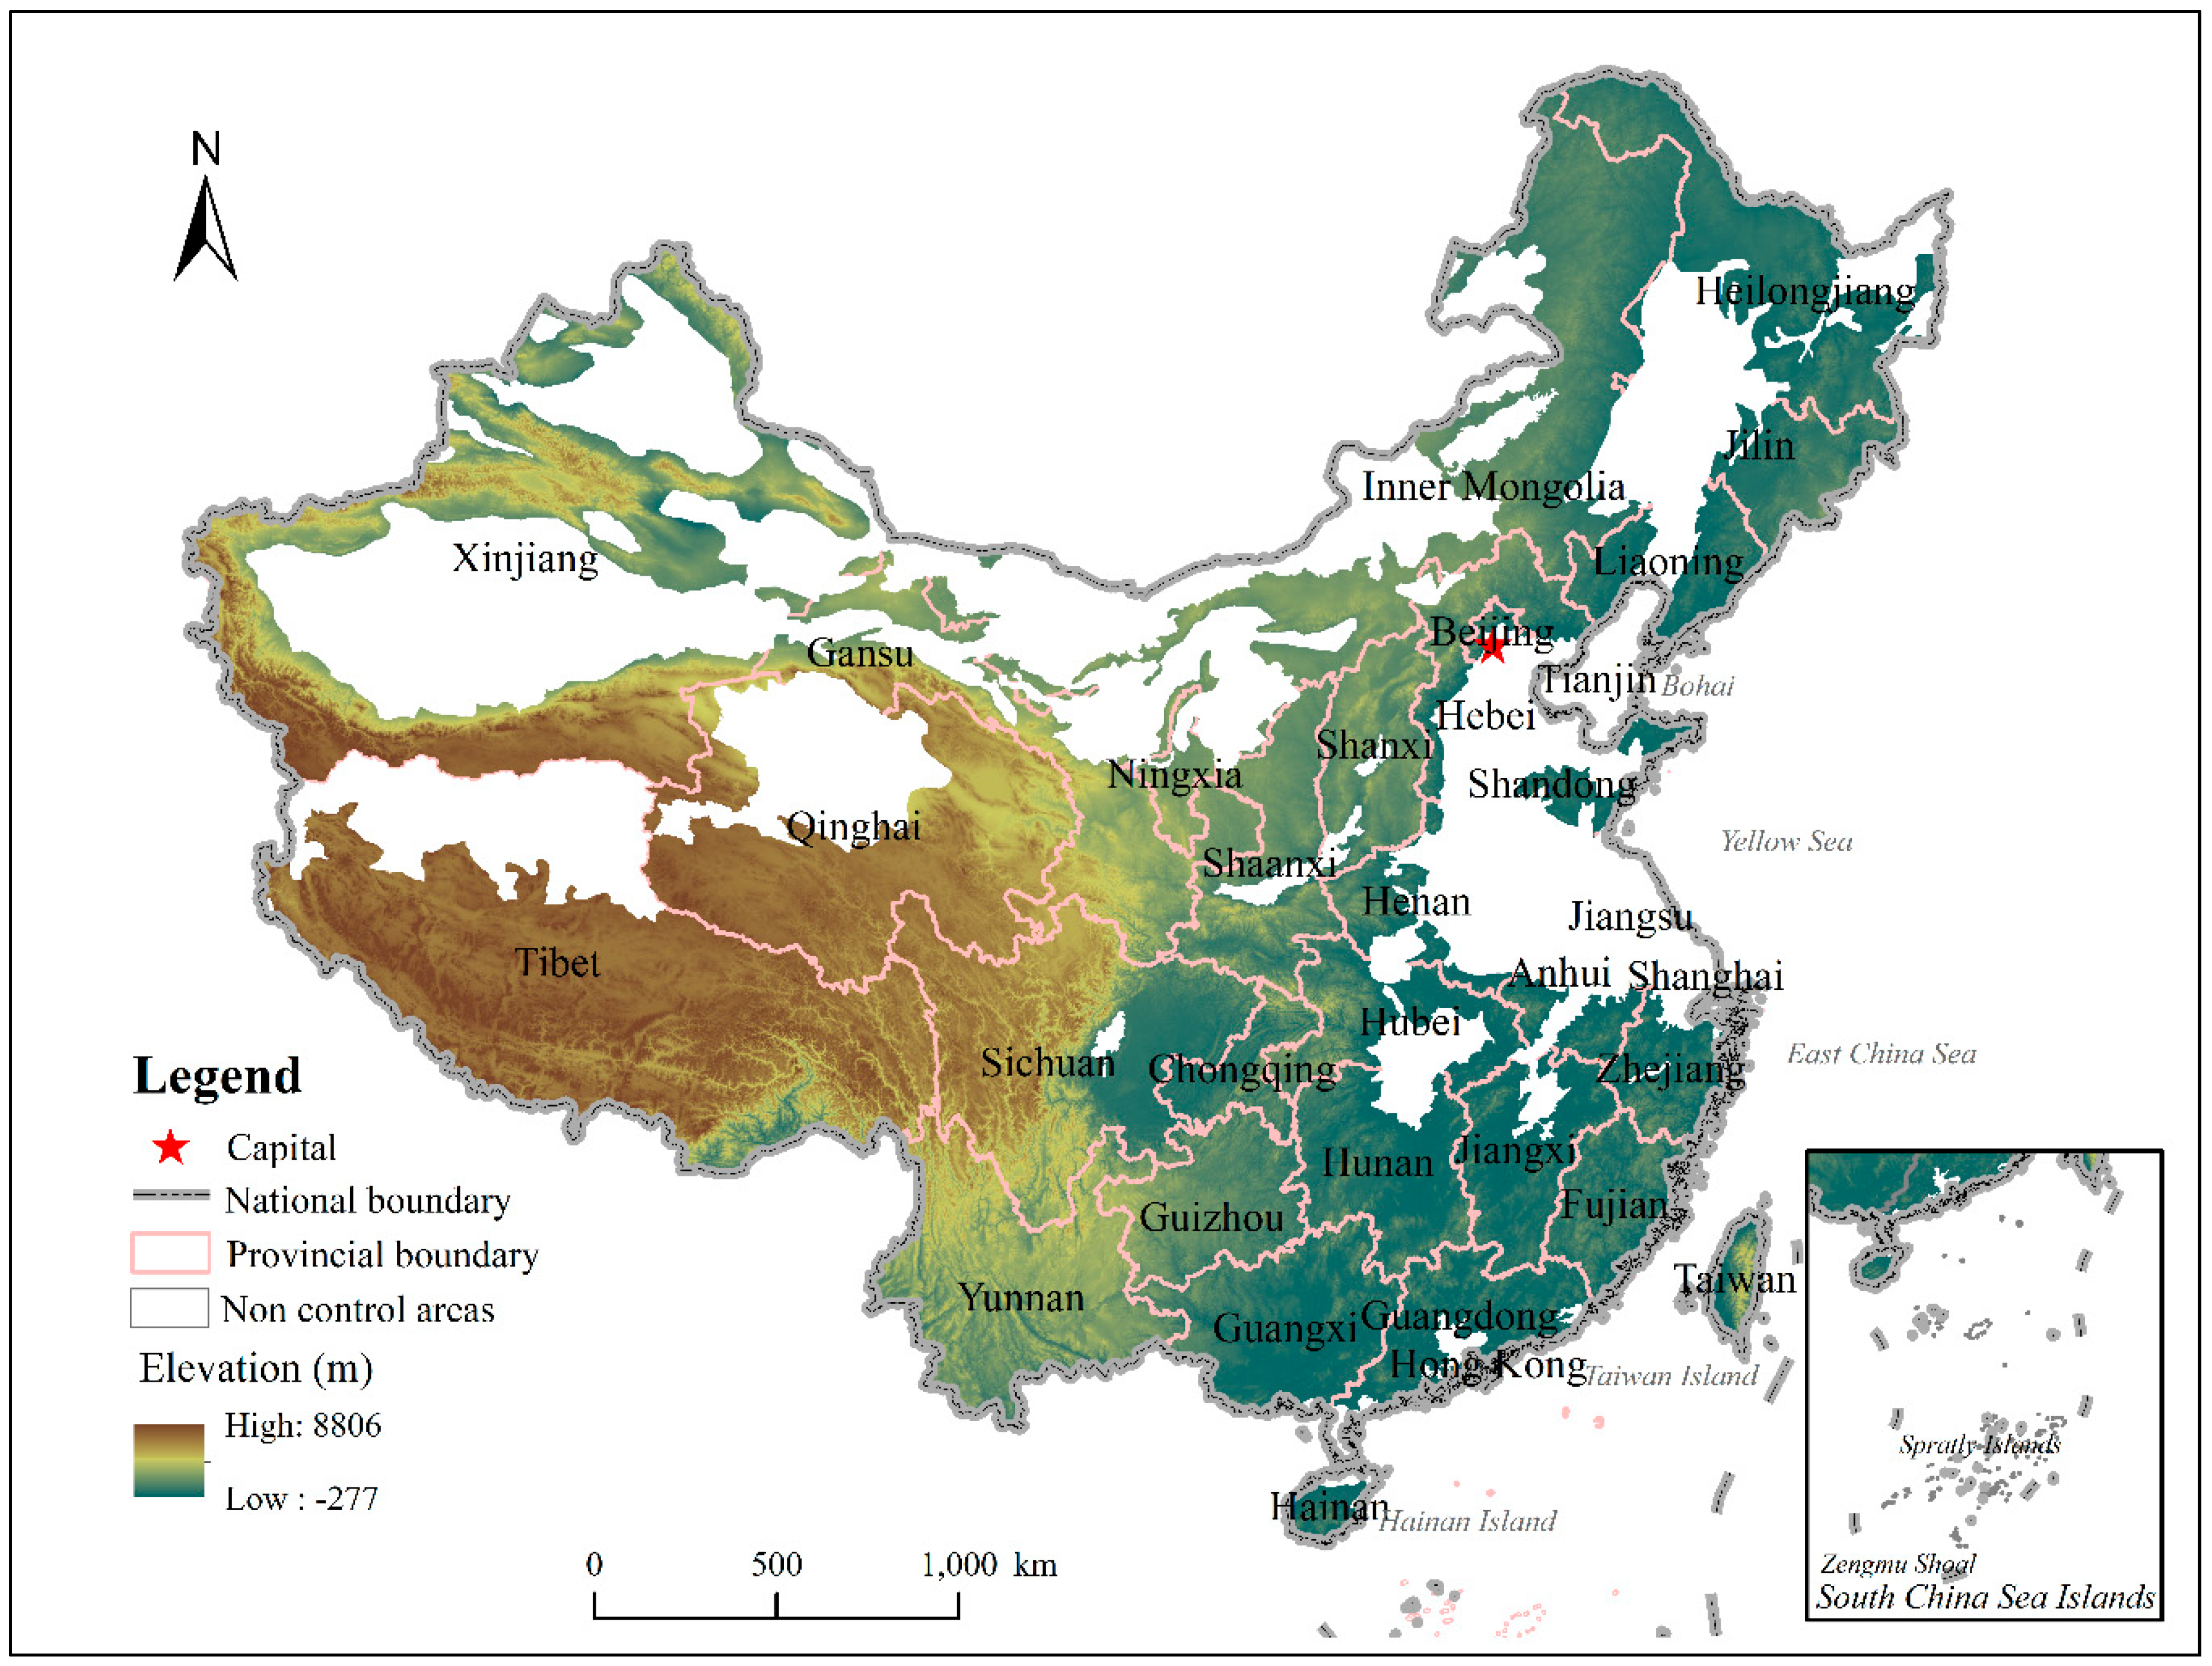
2.1. Study Area

China is situated in East Asia (3°51′–53°33′N, 73°33′–135°05′E), as shown in Figure 1. In this study, the prevention and control area of flash floods in China designated by RCFDDRMWR was used as the research area. This area contains 30 provinces, 305 cities, and 2138 counties (districts), with a land area of 7550 million hectares (ha) and a population of nearly 900 million [5]. China has high altitude in the west and low altitude in the east. The lowest altitude is less than 100 m and the highest altitude is more than 8000 m. The terrain is composed of four main plateaus, four basins, and three plains, which are distributed in a step-like manner. Moreover, the terrain is diverse, with a vast mountainous area. As to the precipitation, the average annual precipitation in China is approximately 630 mm, which gradually decreases from the coast to the inland and from the southeast to the northwest. The average annual precipitation can reach up to 2000 mm in coastal areas, such as Guangdong and Fujian, and be no more than 100 mm in northwest areas, such as Tibet and Xinjiang. China experiences a south subtropical monsoon climate with high temperatures and plentiful rainfall, which often contributes to causing geological hazards, such as landslides, debris flows, and hurricanes. According to survey data from NMFDIP, there were approximately 60,000 flash floods from 1950 to 2015. In this area, the flash floods primarily occur in hilly areas [27]. A map of the topography and administrative divisions in China is shown in Figure 1.

2.2. Data Sources

In this study, the data emphasized four aspects related to flash flood vulnerability: (1) Data related to roads, buildings, flood control projects, enterprises, institutions, monitoring and warning facilities, and river data were obtained from NMFDIP. The NMFDIP data included topography, soil, vegetation, hydrology, social economy, and other information, and the RCFDDRMWRC organization generated more than 120 T of data from 2013 to 2016. (2) Data related to the social, economic, and land use data, which were collected from the Earth System Scientific Data Sharing Platform, ESSDSP (http://www.geodata.cn), (3) Digital Elevation Model (DEM) data were obtained from the Geospatial Data Cloud (GDC) with a resolution of 90 m (http://www.gscloud.cn). (4) Geomorphological regionalization data were collected from the State Key Laboratory of Resources and Environment Information System (SKLREIS), Chinese Academy of Sciences. The data types and sources are shown in Table 1.

2.3. Methodology

2.3.1. Data Normalization

The purpose of data normalization is to eliminate the numerical differences between the columns of vectors due to different dimensions, which can avoid the existence of singular values. Data normalization was used to limit the data to a range (this interval is 0 to 1) using a certain mathematical method. In this study, the mapminmax function in MATLAB software was adopted to normalize the column matrix vectors to 0–1. The formula is given as follows [18]:
X = x x min x max x min
where X is the normalized data, x is the raw data, xmin is the minimum value of each column vector, and xmax is the maximum value of each column vector.

2.3.2. Analytic Hierarchy Process

The analytic hierarchy process (AHP) is a multi-criteria decision-making method that was proposed by Saaty in the early 1980s [28]. AHP can decompose a complex problem into different layers or factors [29] and assign proper weights to various factors, hence it is suitable to the vulnerability system in this study [30]. In this study, AHP was used to confirm the relative significance of each pair of criteria (or sub-criteria) elements using a 9-point system from 1 (equal importance) to 9 (absolute importance) (Table 2), and then form a comparison matrix (Table 3).
Saaty’s 1–9 score was applied to determine the weight of each factor [23,28]. The factor weights were calculated, then the normalized weights, and last the consistency ratios (CR) were tested, which are given as follows:
C R = C I R I
where RI is the random index (value depends on the weighted order in the matrix) and CI is the consistency index. The CR must be below 0.1, which indicates that the comparison is consistent. Otherwise, it needs to be revised [28,31]. The CI is obtained using the following equation:
C I = λ max n n 1
where λmax is the biggest eigenvalue of the framework and can be effectively decided from the specified matrix and n is the number of vulnerability assessment factors.

2.3.3. Support Vector Machine

The support vector machine (SVM) is a new approach developed in recent years that is based on nonlinear transformation [32], and is a nonlinear mathematical structure that can represent complex nonlinear processes between inputs and outputs of any system [33]. In addition, it can also explore the hidden relationships between inputs and outputs [34,35]. The mechanism of vulnerability assessment of a flash flood is complex due to incomplete information and many uncertainties [19]. The SVM model can calculate intrinsic rules from a lot of complex and fuzzy input and output variables. The major steps of the algorithm are as follows:
(1)
Supposing the training set of known sample set is T = {x1, x2, …, xn, y} where xi is the ith input data (xiRn), y is the output data, and i = 1, 2, …, n.
(2)
Then, these data are divided into two categories using an n-dimensional hyperplane to get the maximum interval. This is shown in Equations (4) and (5):
1 2 w 2
Subject   to   y i ( ( w x i ) + b ) 1
where w is the norm of the hyperplane normal, b is a scalar base, and (·) denotes the scalar product operation.
(3)
Using the Lagrange multiplier, the cost function can be defined as follows:
L = 1 2 w 2 i = 1 n λ i ( y i ( ( w · x i ) + b ) 1 )
where λi is the Lagrangian multiplier. The solution can be achieved using the dual minimization of Equation (6) with respect to w and b using standard procedures [36].
(4)
For the non-separable case, one can modify the constraints by introducing slack variables, ξi [36]:
y i ( ( w · x i ) + b ) 1 ξ i .
So Equation (6) becomes:
L = 1 2 w 2 1 v n i = 1 n ξ i
where v ∈ (0, 1], which is introduced to account for misclassification [35,37].
In this study, a kernel function, K(xi, xj), is used to account for the nonlinear decision boundary [36]. At present, the linear kernel functions, the polynomial function, and the RBF and sigmoid kernel function are commonly used kernel functions, and the radial basis function was selected in this study, as shown in Equation (9):
K ( x i , x j ) = e γ ( x i x j ) 2 , γ > 0
where γ is the parameter of the kernel function. Sometimes kernel functions are parameterized using γ = 1/2σ2, where σ is an adjustable parameter that governs the performance of the kernel.

2.3.4. Vulnerability Assessment

Previous research has shown that flash flood vulnerability is negatively correlated with disaster reduction capability and positively correlated with exposure degree [19,38]. The vulnerability (V) was calculated by using regional data as a proxy for exposure (E) and disaster reduction capability (Re). The vulnerability model was established by using Equation (10):
V = E ( 1 R e ) .

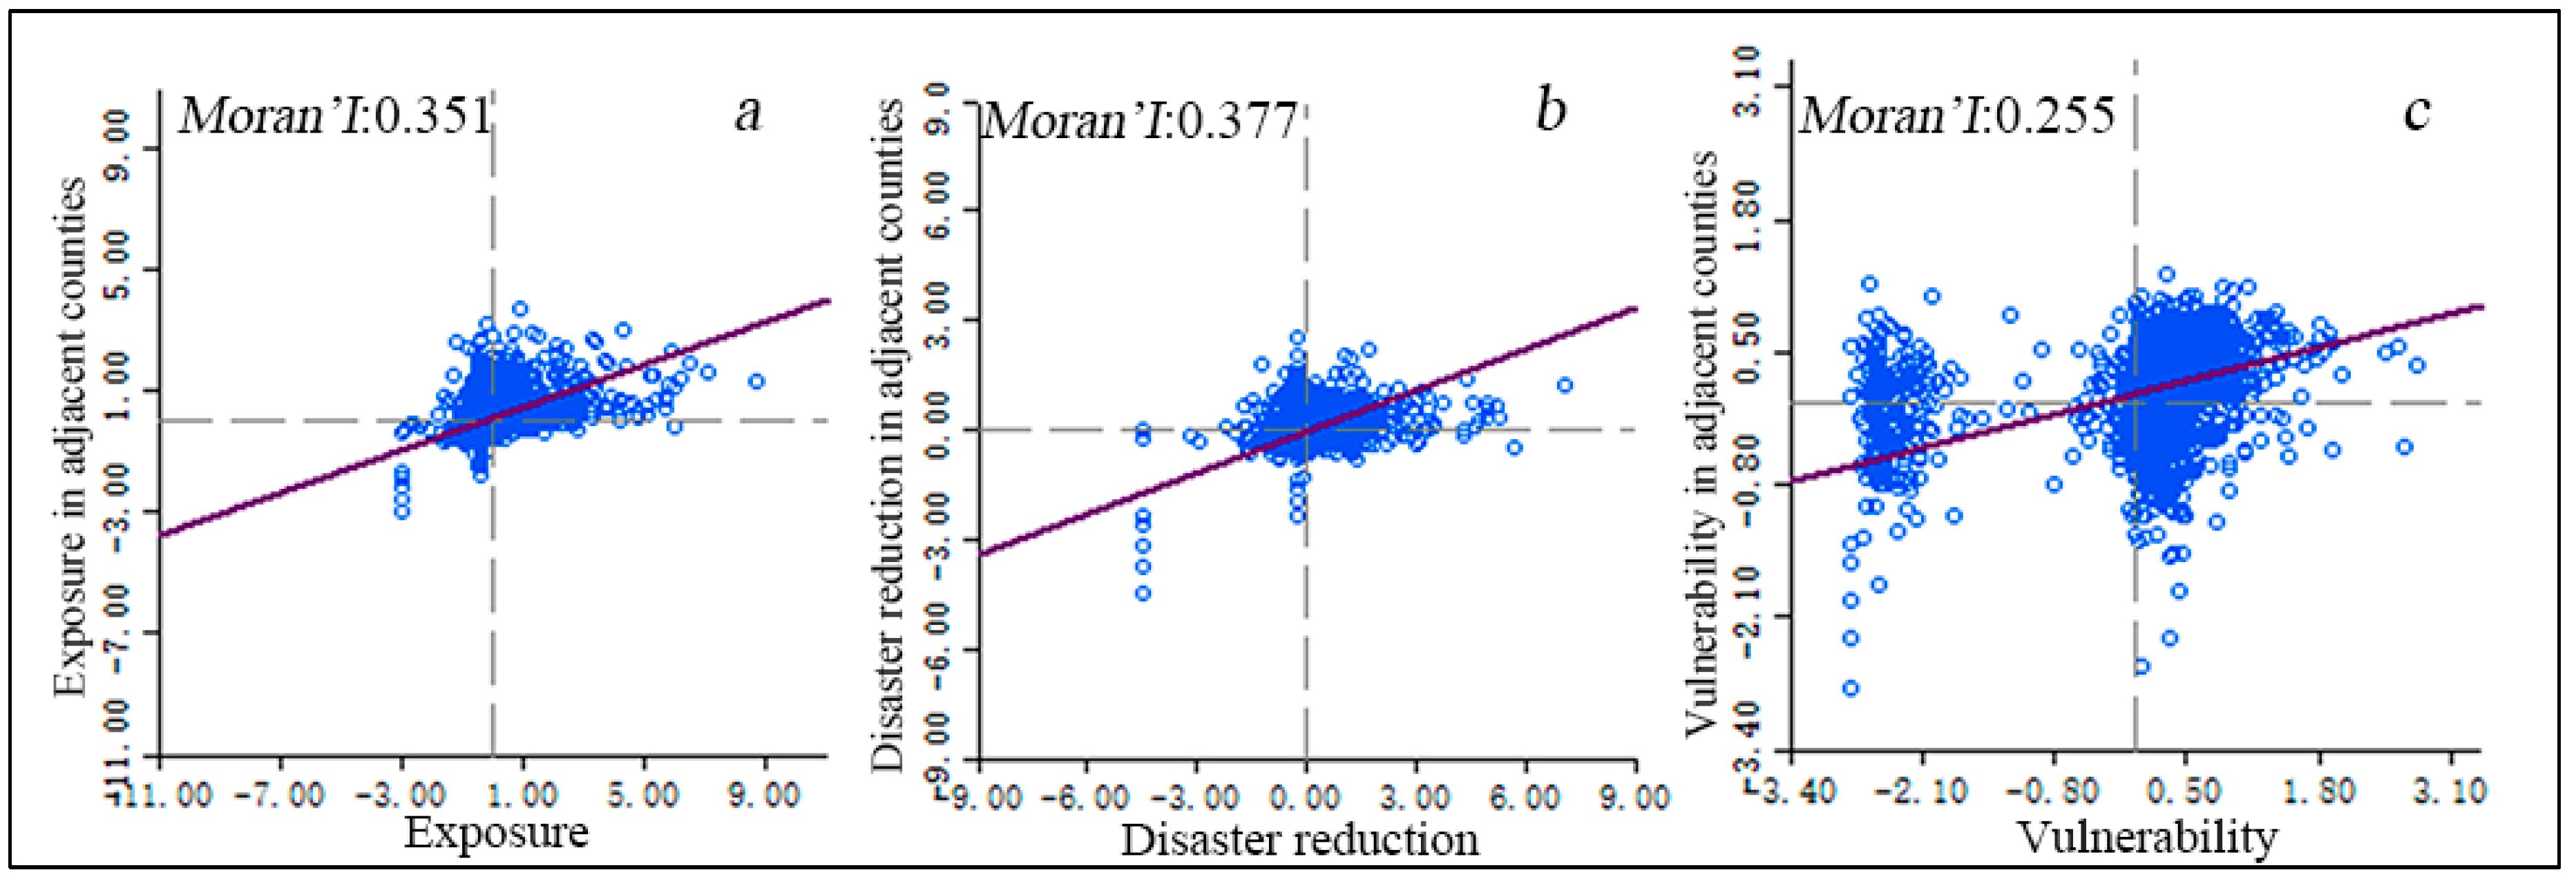
2.3.5. Spatial Autocorrelation Analysis

Spatial autocorrelation is used to check whether the attribute values of an element are significantly correlated with that of its adjacent spatial points [39]. It is divided into global indicators of spatial association (GISA) and local indicators of spatial association (LISA).
(1)
Measuring the overall spatial correlation degree of flash flood vulnerability in China was based on global Moran’s I. The global indicators of spatial association Moran’s I are given as follows:
I = n i = 1 n j = 1 n W i j ( x i x ¯ ) ( x j x ¯ ) i = 1 n j = 1 n W i j i = 1 n ( x i x ¯ ) 2
where I is the global Moran index, xi and xj are the vulnerability values of county i and j, respectively, x ¯ is the average vulnerability of the study area, and Wij is a the spatial relationship between county i and j (1 denotes adjacent relationship and 0 denotes non-adjacent relationship). A Moran’s I value greater than 0 indicates a positive spatial correlation, and less than 0 indicates negative spatial correlation.
(2)
Global spatial autocorrelation can not accurately reflect the specific spatial location of an agglomeration or anomaly. Therefore, it is necessary to use a local spatial autocorrelation method to explore the vulnerability correlation in some local spatial locations. The LISA Moran’s Ii are given as follows:
I i = n ( x i x ¯ ) j = 1 n W i j ( x j x ¯ ) ( x i x ¯ ) 2 .

3. Model for Flash Flood Vulnerability

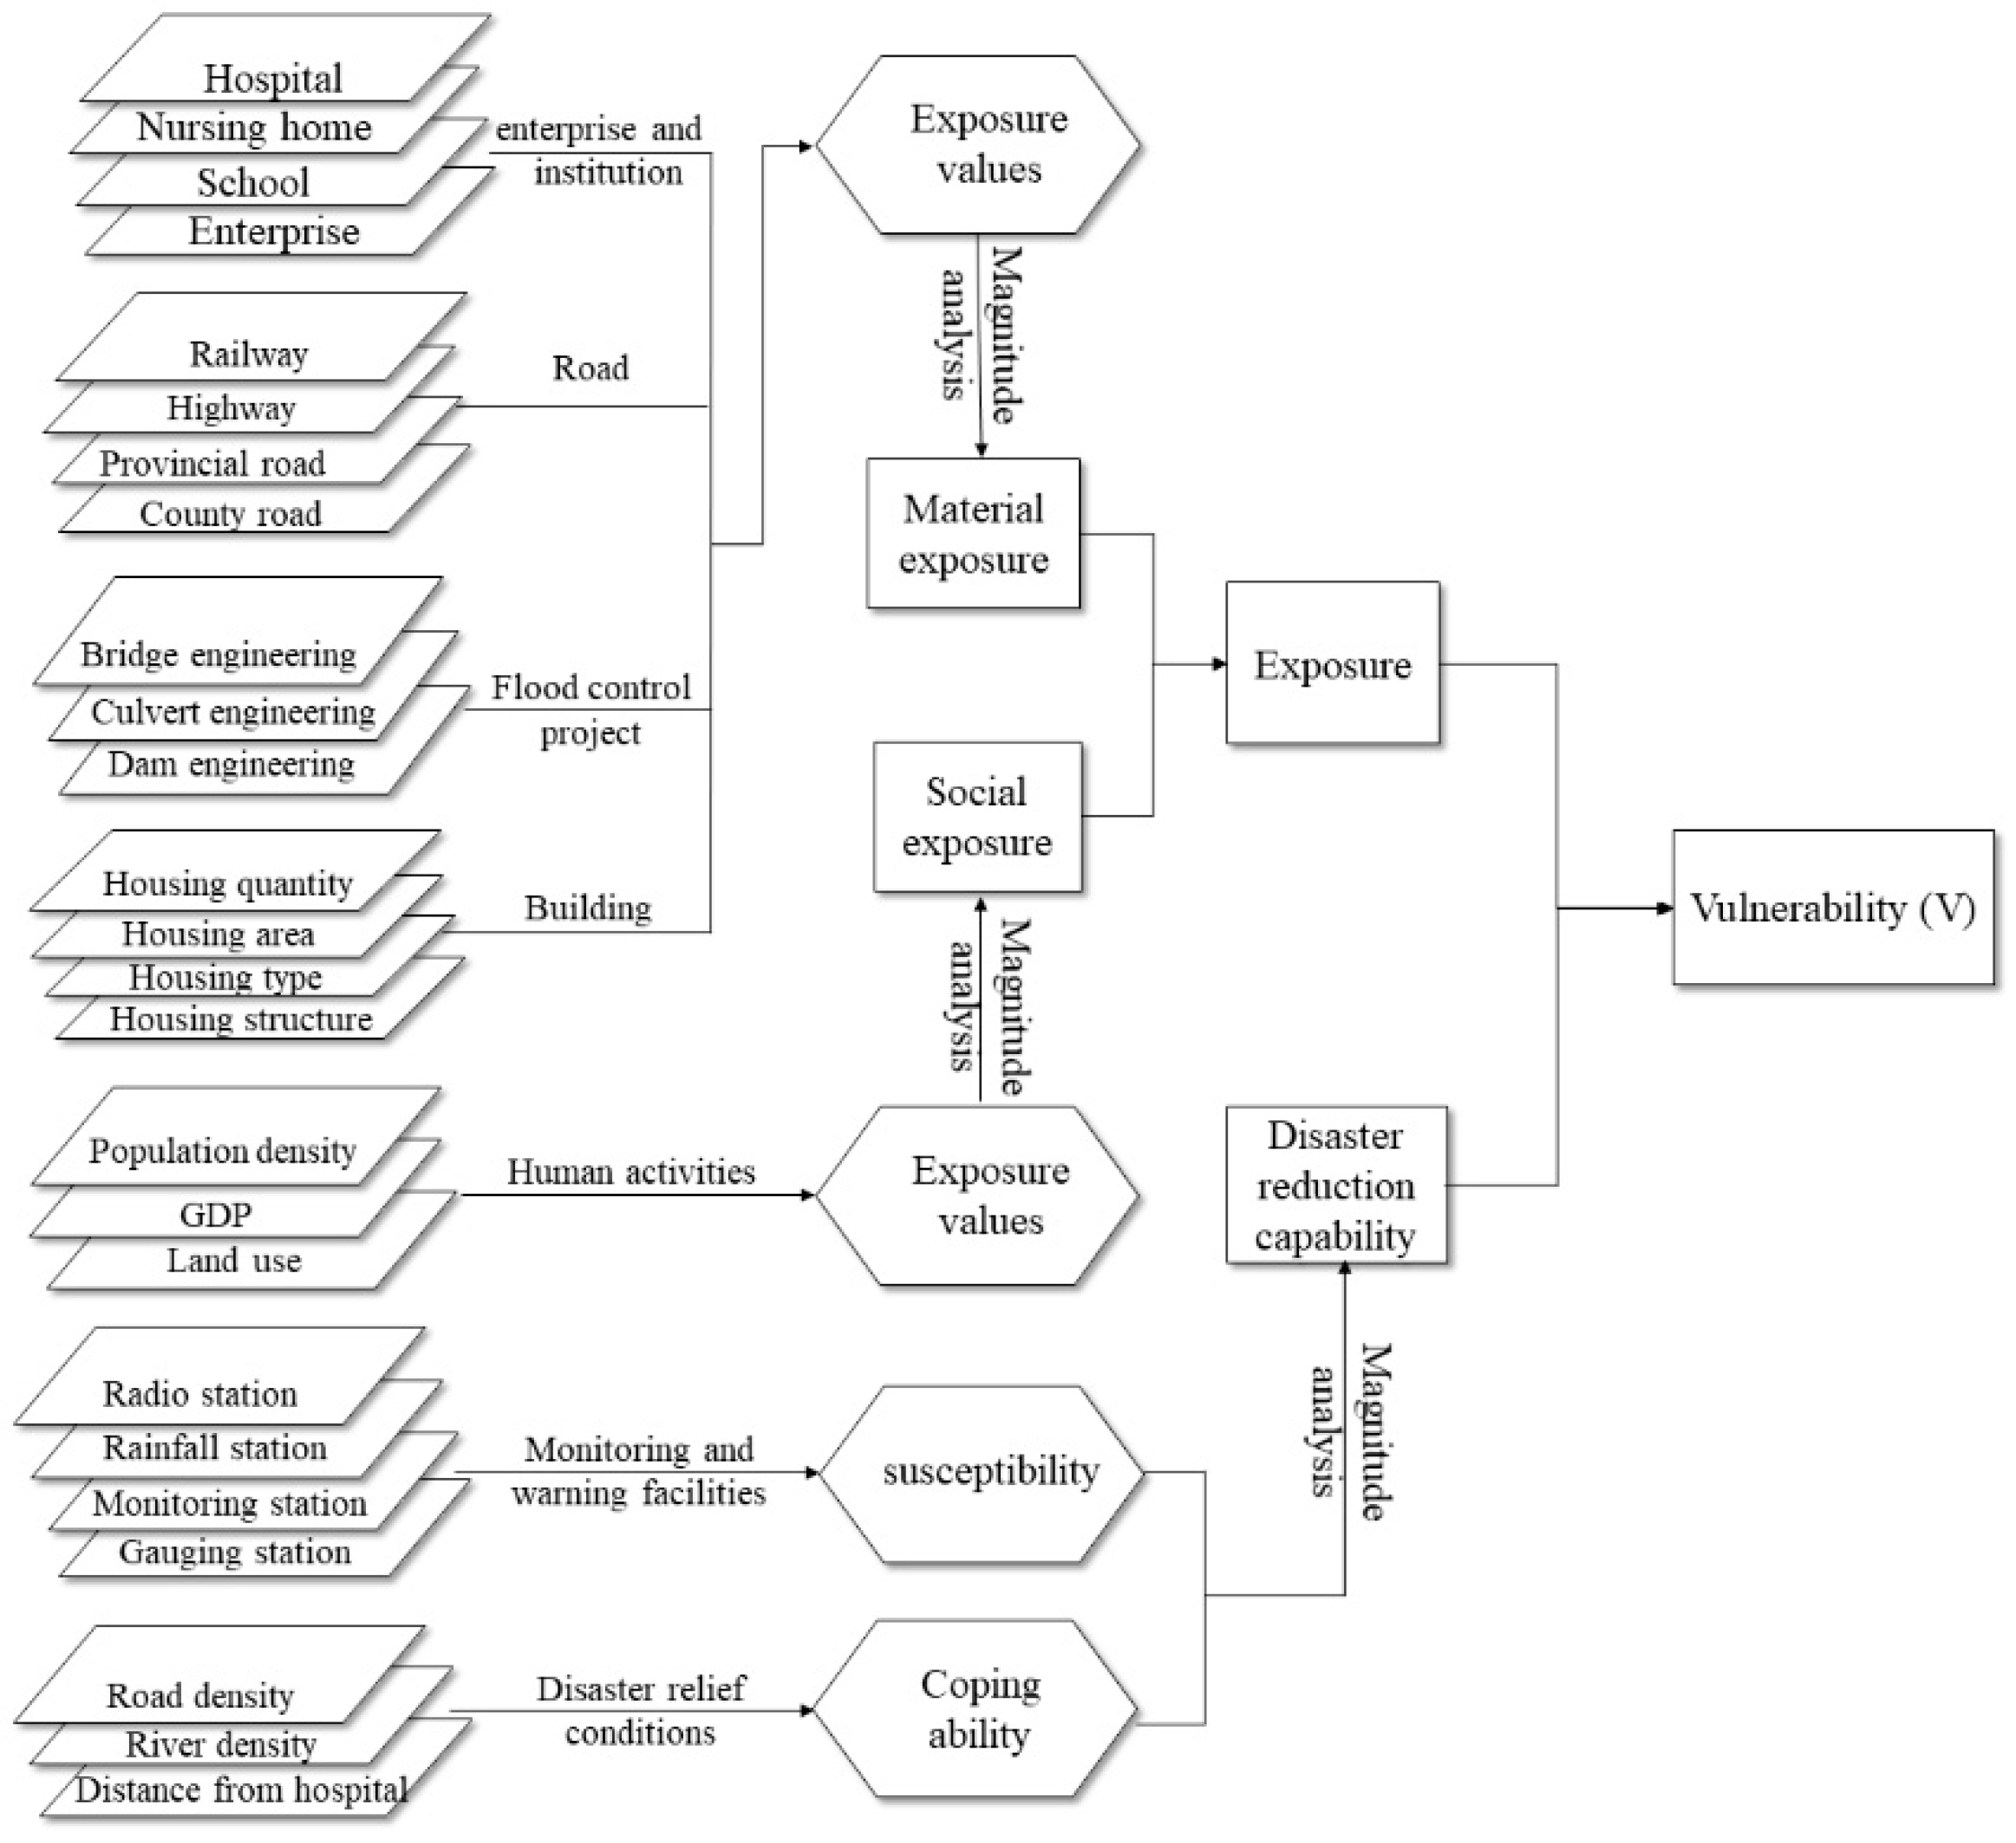
3.1. Establishment of the Assessment Index System

The index system was established by summarizing previous research results to define vulnerability [19,40]. Disaster vulnerability was defined by the loss extent of a specific element (or a group of elements) suffered from a disaster of certain size (or strength) [8]. For humans, vulnerability refers to the probability that a given life might be lost. For property, vulnerability is the loss of all the damaged material [41]. This study divides the vulnerability of flash floods into two parts: exposure and disaster reduction capability. The vulnerability assessment indicators are shown in Figure 2.

3.1.1. Exposure

According to previous studies, in regions with the higher exposure, flash floods will cause greater loss. The loss objects of flash floods include material and socio-economic factors [13,18,19]. Among them, material exposure includes enterprises and institutions, roads, flood control projects, and buildings. Social exposure only includes human activities (Figure 2). The specific initial exposure indicators were selected as follows:
(1)
Material exposure
  • Enterprises and institutions (ENI) include hospitals (HOS), nursing homes (NUH), schools (SCH), and enterprises (ENT). Exposure refers to the number of ENI per unit (D = Ei/Si), with D being the ENI density, Ei being the ENI in the region i, and Si being the area of region i.
  • Roads includes railways (RAI), highways (HIG), provincial roads (PRO), and national highways (NAT). Exposure refers to the length of all road per unit (D = Ri/Si), with D being the RAI density, Ri being the length of road in the region i, and Si being the area of region i.
  • Flood control project (FCP) includes bridges (BRI), culverts (CUL), and dams (DAM). Exposure refers to the number of FCP per unit (D = Wi/Si), with D being the FCP density, Wi being the FCP in the region i, and Si being the area of region i.
  • Building information includes the number of houses (NUM), the floor area (ARE), the number of floors (FLO), and the structure of houses (STR). Exposure refers to the area of building per unit (D = Bi/Si) with D being the building density, Bi being the building area in the region i, and Si being the area of region i.
(2)
Social exposure
  • Population density (POD) is the population per assessment unit (D = Pi/Si), with D being the population density, Pi being the population in the region i, and Si being the area of region i.
  • Conomic density (GDP) is the gross domestic product (GDP) per assessment unit (D = Gi/Si), with D being the economic density, Gi being the GDP in the region i, and Si being the area of region i.
  • Land use type (LUT) includes arable land (ARA), construction land (CON), woodland (WOO), grassland (GRA), water area (WAT), and unused land (UNU).

3.1.2. Disaster Reduction Capability

Previous studies indicate the higher capability of disaster reduction will led to the lower loss from flash floods. Disaster reduction capability primarily includes regional susceptibility, resistance, and resilience [19,42,43,44,45]. Among them, susceptibility was calculated by using monitoring and warning facilities. Resistance and resilience are classified as coping abilities, which were calculated using the road network density, river network density, and distance between the hospital and settlements (Figure 2). The disaster reduction capability indicators of specific initial flash floods were selected as follows:
(1)
Susceptibility
Monitoring and warning facilities (MWF) include rainfall stations (RAS), monitoring stations (MOS), radio stations (RADS), and gauging stations (GAS). Susceptibility refers to the number of MWF in per unit (D = Mi/Si), with D being the MWF density, Mi being the facilities in the region i, and Si being the area of region i.
(2)
Coping ability
  • Road density (ROD) is the length of all roads in per assessment unit (D = Roi/Si), with D being the ROD, Roi being the length of all roads in the region i, and Si being the area of region i.
  • River density (RID) is the length of all rivers in per assessment unit (D = Rii/Si), with D being the RID, Rii being the length of all rivers in the region i, and Si being the area of region i.
  • Hospital density (HOD) is the number of hospitals in per assessment unit (D = Hi/Si), with D being the HOD, Hi being the number of hospital in the region i, and Si being the area of region i.

3.2. Assessment Units and Data Preprocessing

3.2.1. Assessment Unit

The size and boundary of an assessment unit will directly affect the assessment result, which is the basic unit of regional vulnerability assessment [46,47]. Previous studies commonly used assessment units that included uniform condition units, regional units, grid units, slope units, and topographic units [48,49,50]. Based on the results [48], we use the county as an assessment unit. China has 2138 control counties, among them, the maximum area is 22,330,000 ha and the minimum area is 5600 ha.

3.2.2. Data Preprocessing

The flow chart of model building is shown in Figure 3, which was used as the initial step to develop a new set of vulnerability indicators of flash floods. First, a set of indicators from different sources was collected. Then, a correlation analysis method was used to screen the more appropriate indicators for flash floods. These indicators (e.g., social, material, physical, and environmental factors) were selected in the final assessment system used to determine flash flood vulnerability (Figure 2). Finally, data normalization and AHP were used to quantify each index value. The weight values of each index are shown in Table 4.

4. Results

The exposure assessment factors (ENI, roads, FCP, and buildings) were expressed as vector maps, with the exception of the human activity factors (POD, GDP, and LUT), which were expressed in a raster format. In addition, the assessment factors of disaster reduction capability (MWF, ROD, RID, and HOD) were expressed as vector maps. These factors were input into the statistical analysis using an overlaying analysis based on the ArcGIS. Then, the index data was normalized and input into a SVM model for simulation. The exposure (E) and disaster reduction capability (Re) values of 2138 counties were output. Based on the classification criteria of the assessment indicators used to predict the flash flood exposure and disaster reduction degree, standard samples (training samples and test samples) were established using a specific mathematical method (Table A1). In this study, the degree of vulnerability to flash floods was divided into five grades: extremely low (I), low (II), moderate (III), high (IV), and extremely high (V). When establishing the empty matrix, the sample size of each grade was set to 200 and the training sample size was 1000. Interpolation theory was used to establish samples during the building process of the SVM model, which can avoid artificial interference. Exposure indicators and disaster reduction indicators were divided into five grades, 0–0.2, 0.2–0.4, 0.4–0.6, 0.6–0.8, and 0.8–1.0, based on the equal distance method. According to the order from low to high, 200 sets of random interpolation data for each interval were generated and were used as samples of the exposure and disaster reduction indicators. The output values were obtained by interpolating 1000 values. These values were equidistant over the interval of (0, 1) (Table A1). Furthermore, the AHP and SVM methods were conducted based on the package “e1071” in R software (R Core Development Team, R Foundation for Statistical Computing, Vienna, Austria). The degree of vulnerability (V) was calculated using Equation (10).

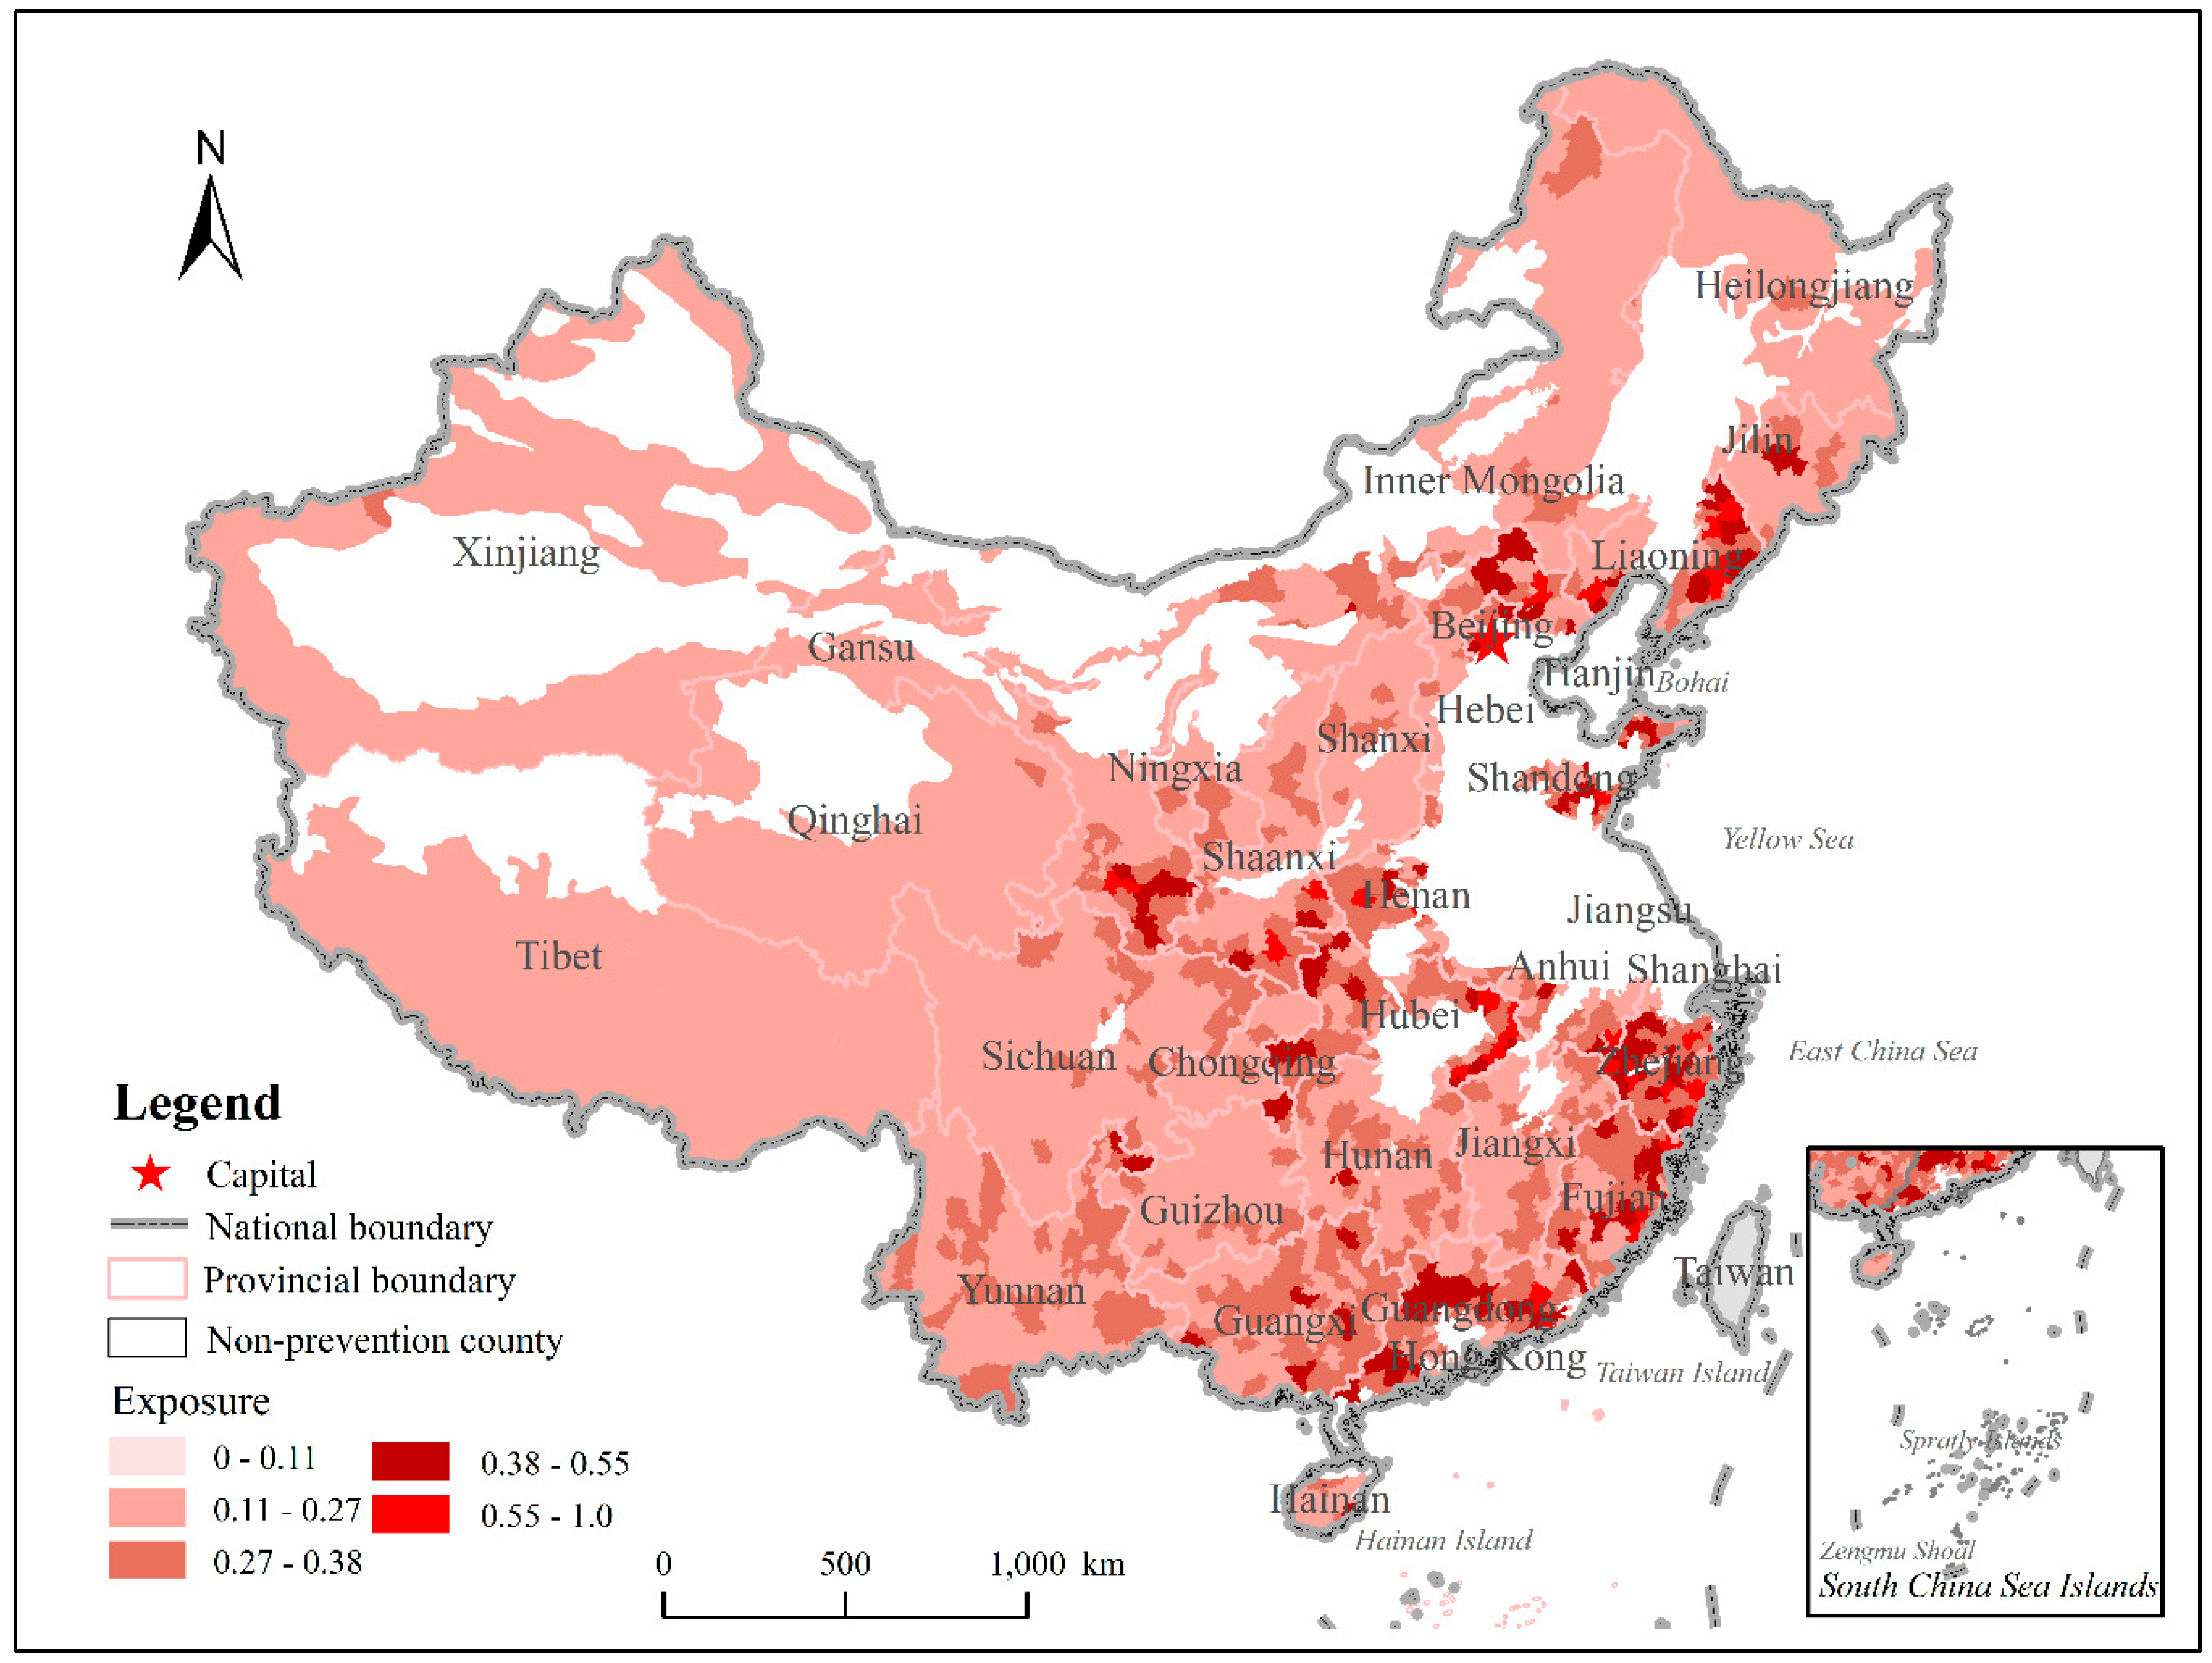
4.1. Exposure Assessment

The exposure assessment results calculated using the above method are shown in Figure 4. The assessment results were divided into extremely low (0–0.11), low (0.11–0.27), moderate (0.27–0.38), high (0.38–0.55), and extremely high (0.55–1.0) based on the natural break point method [51]. The spatial differentiation of flash flood exposure becomes more significant from the northwest to the southeast in China. The statistical results of exposure quantity, area, and proportion of each grade are shown in Table 5. Thirty-three counties (25,806,700 ha) had extremely high exposure, 111 counties (7,405,400 ha) had high exposure, 427 counties (101,239,400 ha) had moderate exposure, 1388 counties (519,503,800 ha) had low exposure, and 179 counties (339,800 ha) had extremely low exposure (Figure 4).
The high exposure areas were primarily located in the eastern coastal urban areas and Beijing-Tianjin-Hebei urban agglomerations, which includes the Yangtze River Delta, Pearl River Delta, and Bohai Rim (Figure 4). In addition, Zhengzhou, Wuhan, Changsha, Changchun, Chongqing, Chengdu, and Xi’an were also dominant (Figure 4). The areas and proportions of exposure (five grades) in China’s provinces are shown in Table 6. Guangdong (5.2 × 10⁶ ha), Zhejiang (4.7 × 10⁶ ha), Hubei (4.1 × 10⁶ ha), Liaoning (3.9 × 10⁶ ha) and Fujian (3.1 × 10⁶ ha) have the highest exposure, followed by Sichuan, Hunan, Jiangxi, and Henan. The lowest exposure areas include Tibet, Xinjiang, Qinghai, and Inner Mongolia (Table 6). Yongjia had the highest exposure degree (extremely high) to flash floods (Figure 4). In contrast, low exposure values were mainly distributed in economically less-developed regions, such as the Qinghai-Tibet, Xinjiang, and Inner Mongolia regions.

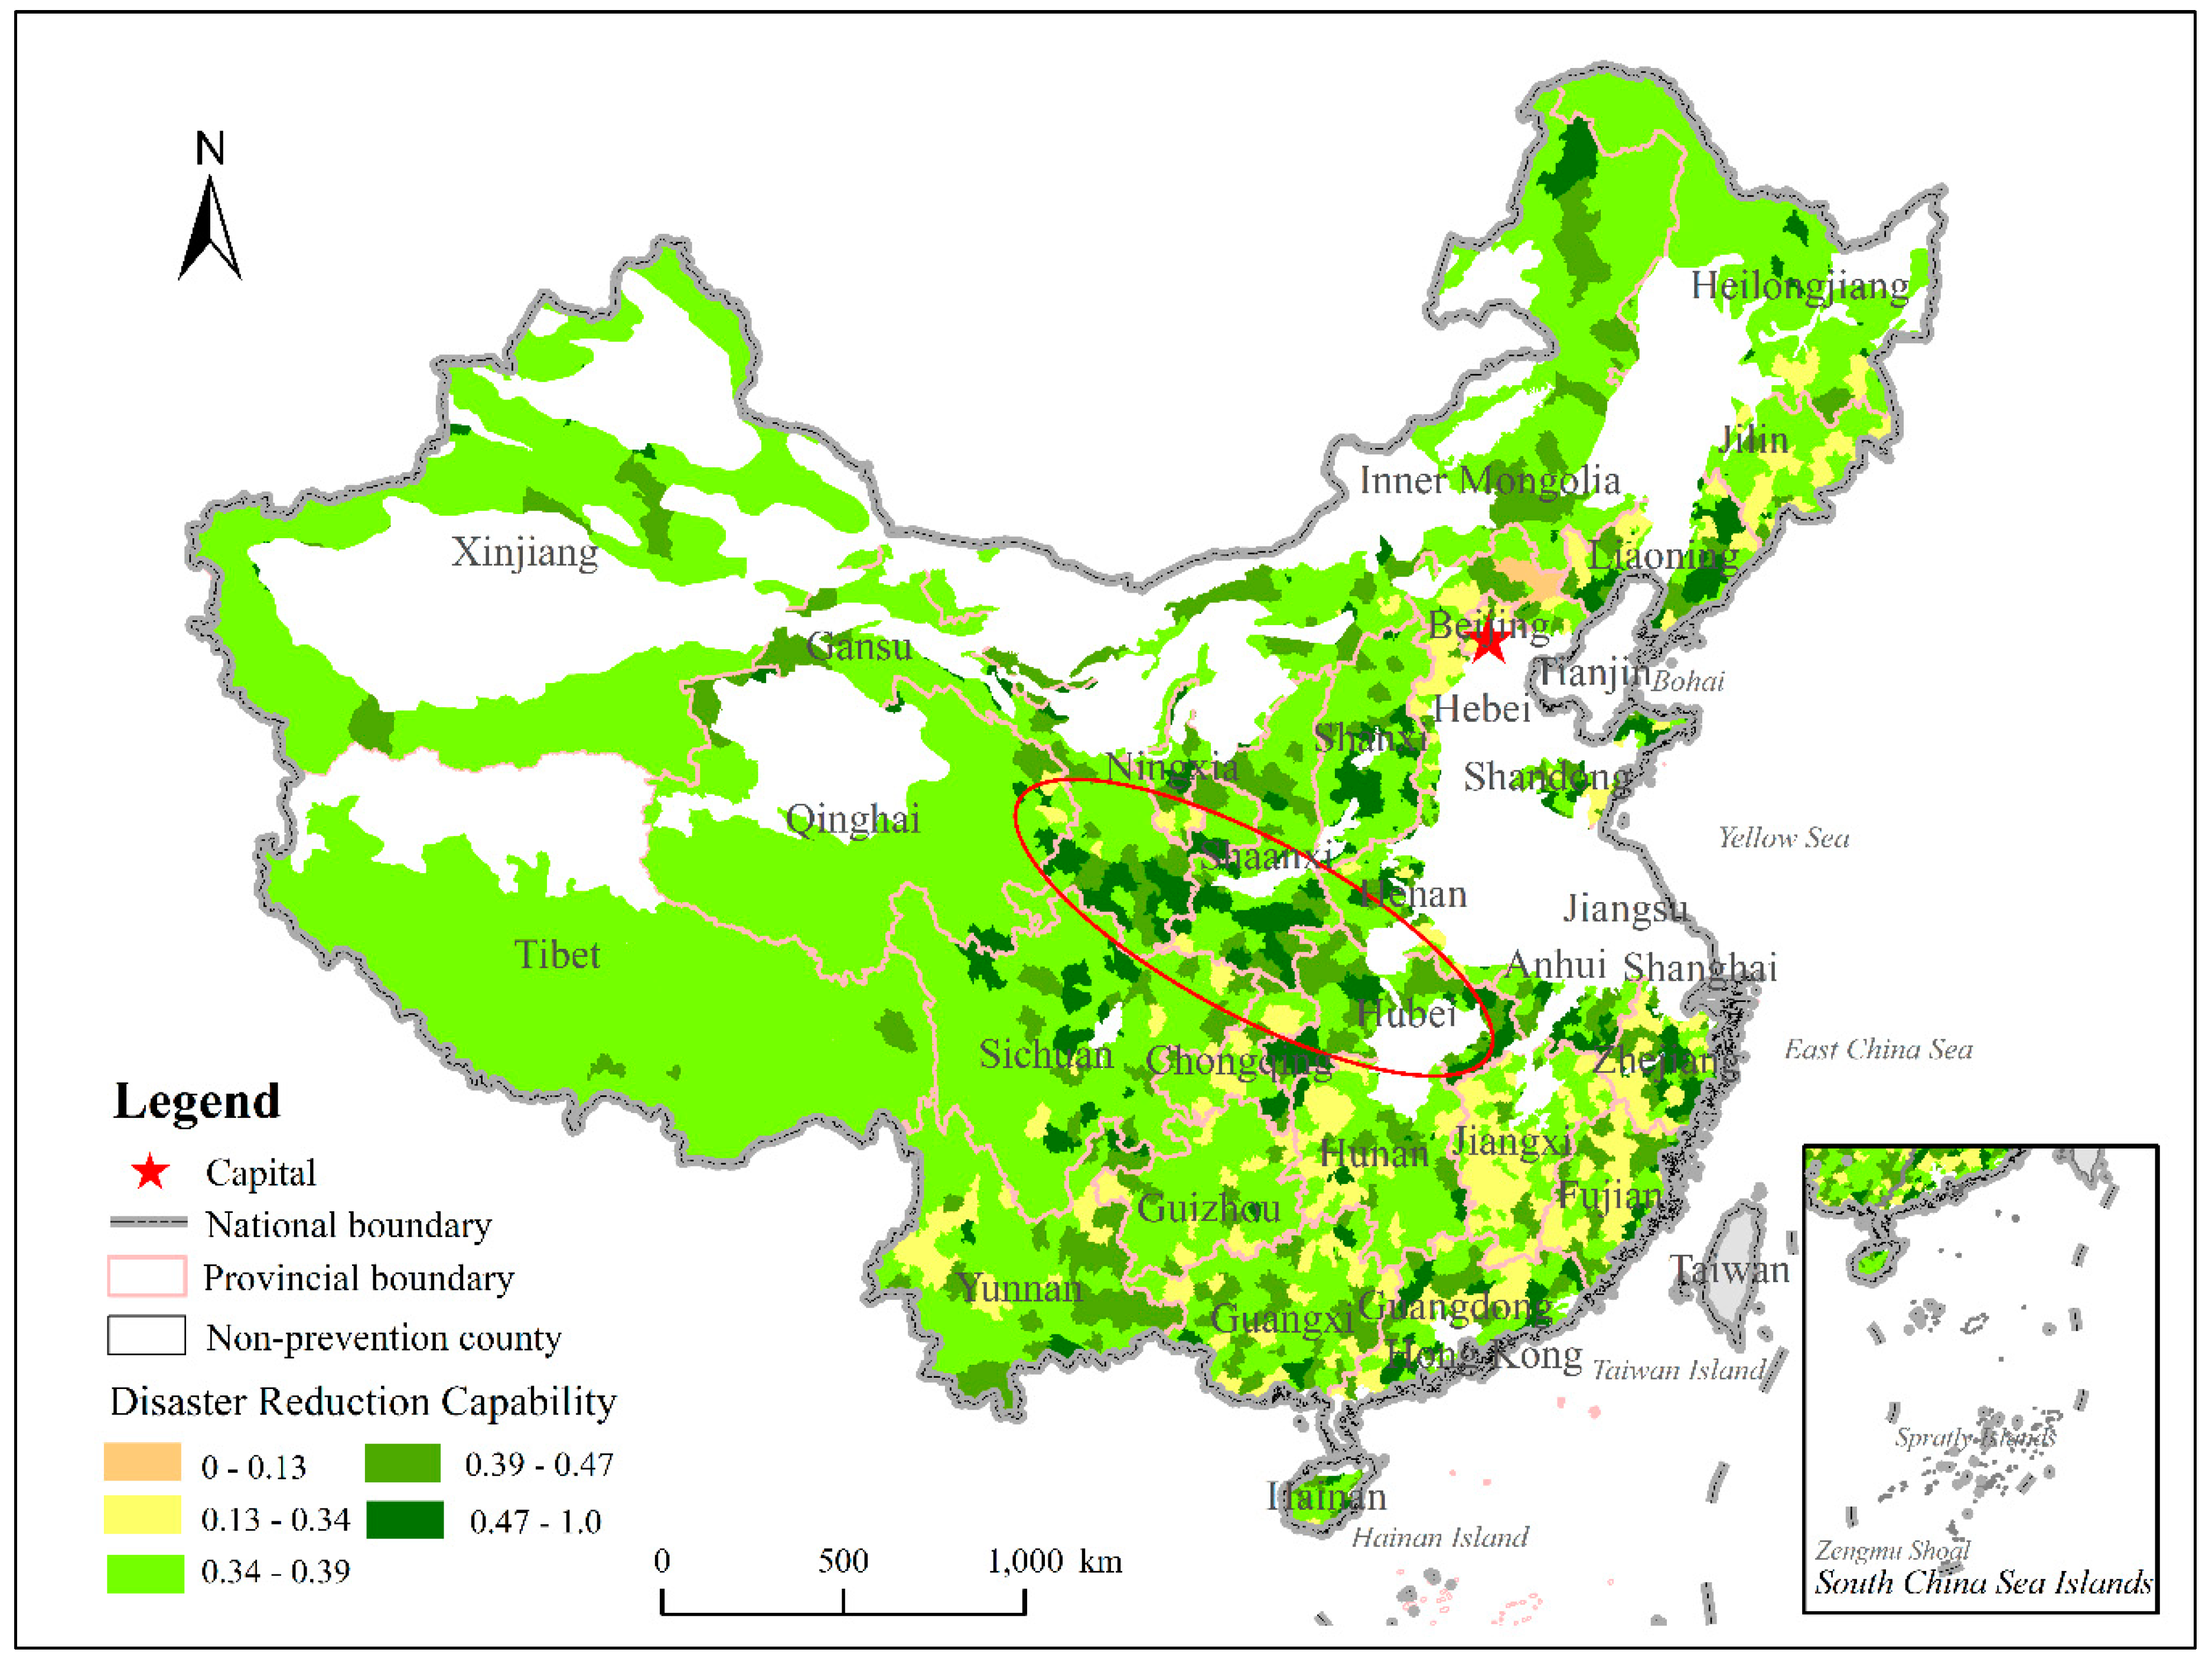
4.2. Disaster Reduction Capability Assessment

The assessment results of disaster reduction capability for flash floods in China were calculated based on the above methods, and are shown in Figure 5. The spatial pattern shows that the weakest disaster reduction capability mainly occurred in northwest China and the strongest disaster reduction capability was chiefly distributed in southeast China (Figure 5). Previous research has provided a grading method for disaster reduction capability: extremely low (0–0.13), low (0.13–0.34), moderate (0.34–0.39), high (0.39–0.47), and extremely high (0.47–1.0) [51]. The quantity, area, and proportion of disaster reduction capability for each grade are shown in Table 5. Three hundred sixty-six counties (43,441,600 ha) had extremely high disaster reduction capability, 344 counties (91,602,900 ha) had high reduction capability, 1043 counties (4,66,303,500 ha) had moderate reduction capability, 211 counties (52,172,500 ha) had low reduction capability, and 174 counties (774,600 ha) had extremely low reduction capability (Table 7).
As to spatial patterns, the high and extremely high disaster reduction capabilities were primarily concentrated in central China, such as the Qinling–Huaihe area (red ellipse). The low and extremely low disaster reduction capabilities were principally distributed in the middle and lower reaches of the Yangtze River (Figure 5). The areas and proportions of disaster reduction capabilities of flash floods for the 30 provinces in China are shown in Table 8. Jiangxi (6.5 × 10⁶ ha), Fujian (4.8 × 10⁶ ha), Yunnan (4.6 × 10⁶ ha), Hebei (4.3 × 10⁶ ha), Guangxi (4.4 × 10⁶ ha), and Hunan (4.4×10⁶ ha) had extremely low disaster reduction capabilities. These provinces have more than 40,000,000 ha of areas with low disaster reduction capability, of which Jiangxi is the largest, reaching 6,462,000 ha. Gansu (1.2 × 10⁷ ha), Hubei (1.0 × 10⁷ ha), Shaanxi (8.8 × 10⁶ ha), Sichuan (8.3 × 10⁶ ha), Liaoning (5.5 × 10⁶ ha), and Shanxi (4.6 × 10⁶ ha) had extremely high disaster reduction capabilities, and these provinces have more than 3,300,000 ha of areas with high disaster reduction capabilities (Table 8).

4.3. Vulnerability Assessment

According to the exposure and disaster reduction capability assessment results, the vulnerability value of each unit was calculated based on Equation (10). The vulnerability results are divided into five grades based on the natural break point method: extremely low (0–0.27), low (0.27–0.54), moderate (0.54–0.6), high (0.6–0.7), and extremely high (0.7–1.0) [51]. The quantity, area, and proportion of each vulnerability grade are shown in Table 9. Sixty-one counties (12,268,600 ha) had extremely high vulnerability, 378 counties (87,143,300 ha) had high vulnerability, 571 counties (181,575,400 ha) had moderate vulnerability, 692 counties (348,242,000 ha) had low vulnerability, and 436 counties (25,065,800 ha) had extremely low vulnerability (Table 9).
The flash flood vulnerability for 30 provinces in China are shown in Table 10. Fujian (1.1 × 10⁷ ha), Jiangxi (1.0 × 10⁷ ha), Guangxi (8.9 × 10⁶ ha), Hebei (7.8 × 10⁶ ha), and Zhejiang (5.2 × 10⁶ ha) had the highest vulnerability, followed by Sichuan, Guizhou, Yunnan, and Hunan. The lowest vulnerabilities occurred in Tibet, Xinjiang, Qinghai, and Inner Mongolia (Table 10). As to the spatial pattern, the highest vulnerabilities were mainly distributed in Chengde (1.0), Shahe (0.98), Kuancheng Manchu autonomous, Longhua, Xinglong, Pingquan, Tongan, Anxi, Jinzhou, and Ninghai (Figure 6a). By comparing China’s exposure and disaster reduction capabilities, there are two primary factors that lead to high vulnerability: one is that vulnerable areas have low disaster reduction capability, such as Ninghai, Qujiang, Shengzhou, Kaihua, Shanghang, Youxi, Da’tian, Minqing, Tong’an, and Chengde, and the other is that vulnerable areas have high exposures, such as Pingyang, Nanan, Fu’an, Ningde, Xunyang, Songxian, and Xixia.
The distribution of the Moran scatter points shows that the global indicators of spatial association (GISA) characteristics of flash flood exposure, disaster reduction capability, and vulnerability are obvious in China, and the GISA results indicated that the exposure, disaster reduction capability, and vulnerability for flash floods in China presents the pattern: disaster reduction capability > exposure > vulnerability (Moran’s I values are 0.351, 0.377, and 0.255, respectively). Many points mainly occurred in the I and III quadrants, indicating that the counties’ vulnerability in China, were characterized by “High-High” (H-H) and “Low-Low” (L-L) aggregation (Figure 7).
The results of local spatial autocorrelations of vulnerability in different counties of China showed that there are obvious aggregation areas (Figure 6b). The H-H spatial agglomerations mainly occurred in the Zhejiang, Fujian, Jiangxi, Hunan, Guangxi, Chongqing and Beijing areas. The L-L spatial agglomerations were chiefly distributed in Shanxi, Shaanxi, Gansu, Qinghai, and Xinjiang.
The statistical results of vulnerable counties in China’s first-level geomorphic areas are shown in Figure 8. There are 191 highly vulnerable counties and 29 extremely vulnerable counties in the southeast low-middle mountainous area (II), accounting for 29.5% of counties in those geomorphic areas. The counties with excessive medium vulnerability numbers are in eastern mountainous and plain areas (I) and southwest middle-high mountainous areas (V), which are second only to that of district II. The two regions contain 89 and 82 counties, respectively. Among them, the southwest middle-high mountainous area (V) has the largest number of medium vulnerability counties, totaling 311 medium vulnerable counties. There are no high vulnerability counties in the northwest middle-high mountainous basin area (IV) and the Qinghai-Tibetan Plateau (VI) (Figure 8).

5. Discussion

5.1. The Assessment Methodology

The vulnerability assessment methods are different in their description, theoretical framework, variables, and methodology. In this study, a multi-dimension analysis of indicators was proposed to calculate the flash flood vulnerability in China. In this study, the model can be extended into a more comprehensive assessment of flash flood vulnerability in China, including social exposure, material exposure, susceptibility, and coping ability. Compared with previous models, the SVM method not only avoids the influence of human factors, but also extends the information content [19]. In addition, the application of a comprehensive vulnerability assessment of flash floods can more accurately and locally identify the spatial patterns of vulnerable areas for flash floods in China [52]. Due to a lack of national data on resilience, the disaster reduction indicators only included susceptibility and coping ability. Hence, a fully objective vulnerability assessment of flash floods in China is impossible [53]. In this study, based on the principles of systematization, comparison, and regional applicability, an index system for vulnerability assessment was established by using the existing regional statistical data. However, there are other factors that contribute to regional vulnerability, such as disaster intensity and density. Disaster intensity can be defined as the shock and destructive capacity of mountain torrents on groups or communities. The "disaster density" defines the number of flash floods per unit area. This value indirectly suggests the frequency of flash floods in the evaluation unit. Furthermore, the allocation of relief funds depended largely on the spatial patterns of disaster density and loss in China. Therefore, it is suggested that these indexes be added to vulnerability assessments of specific local areas.

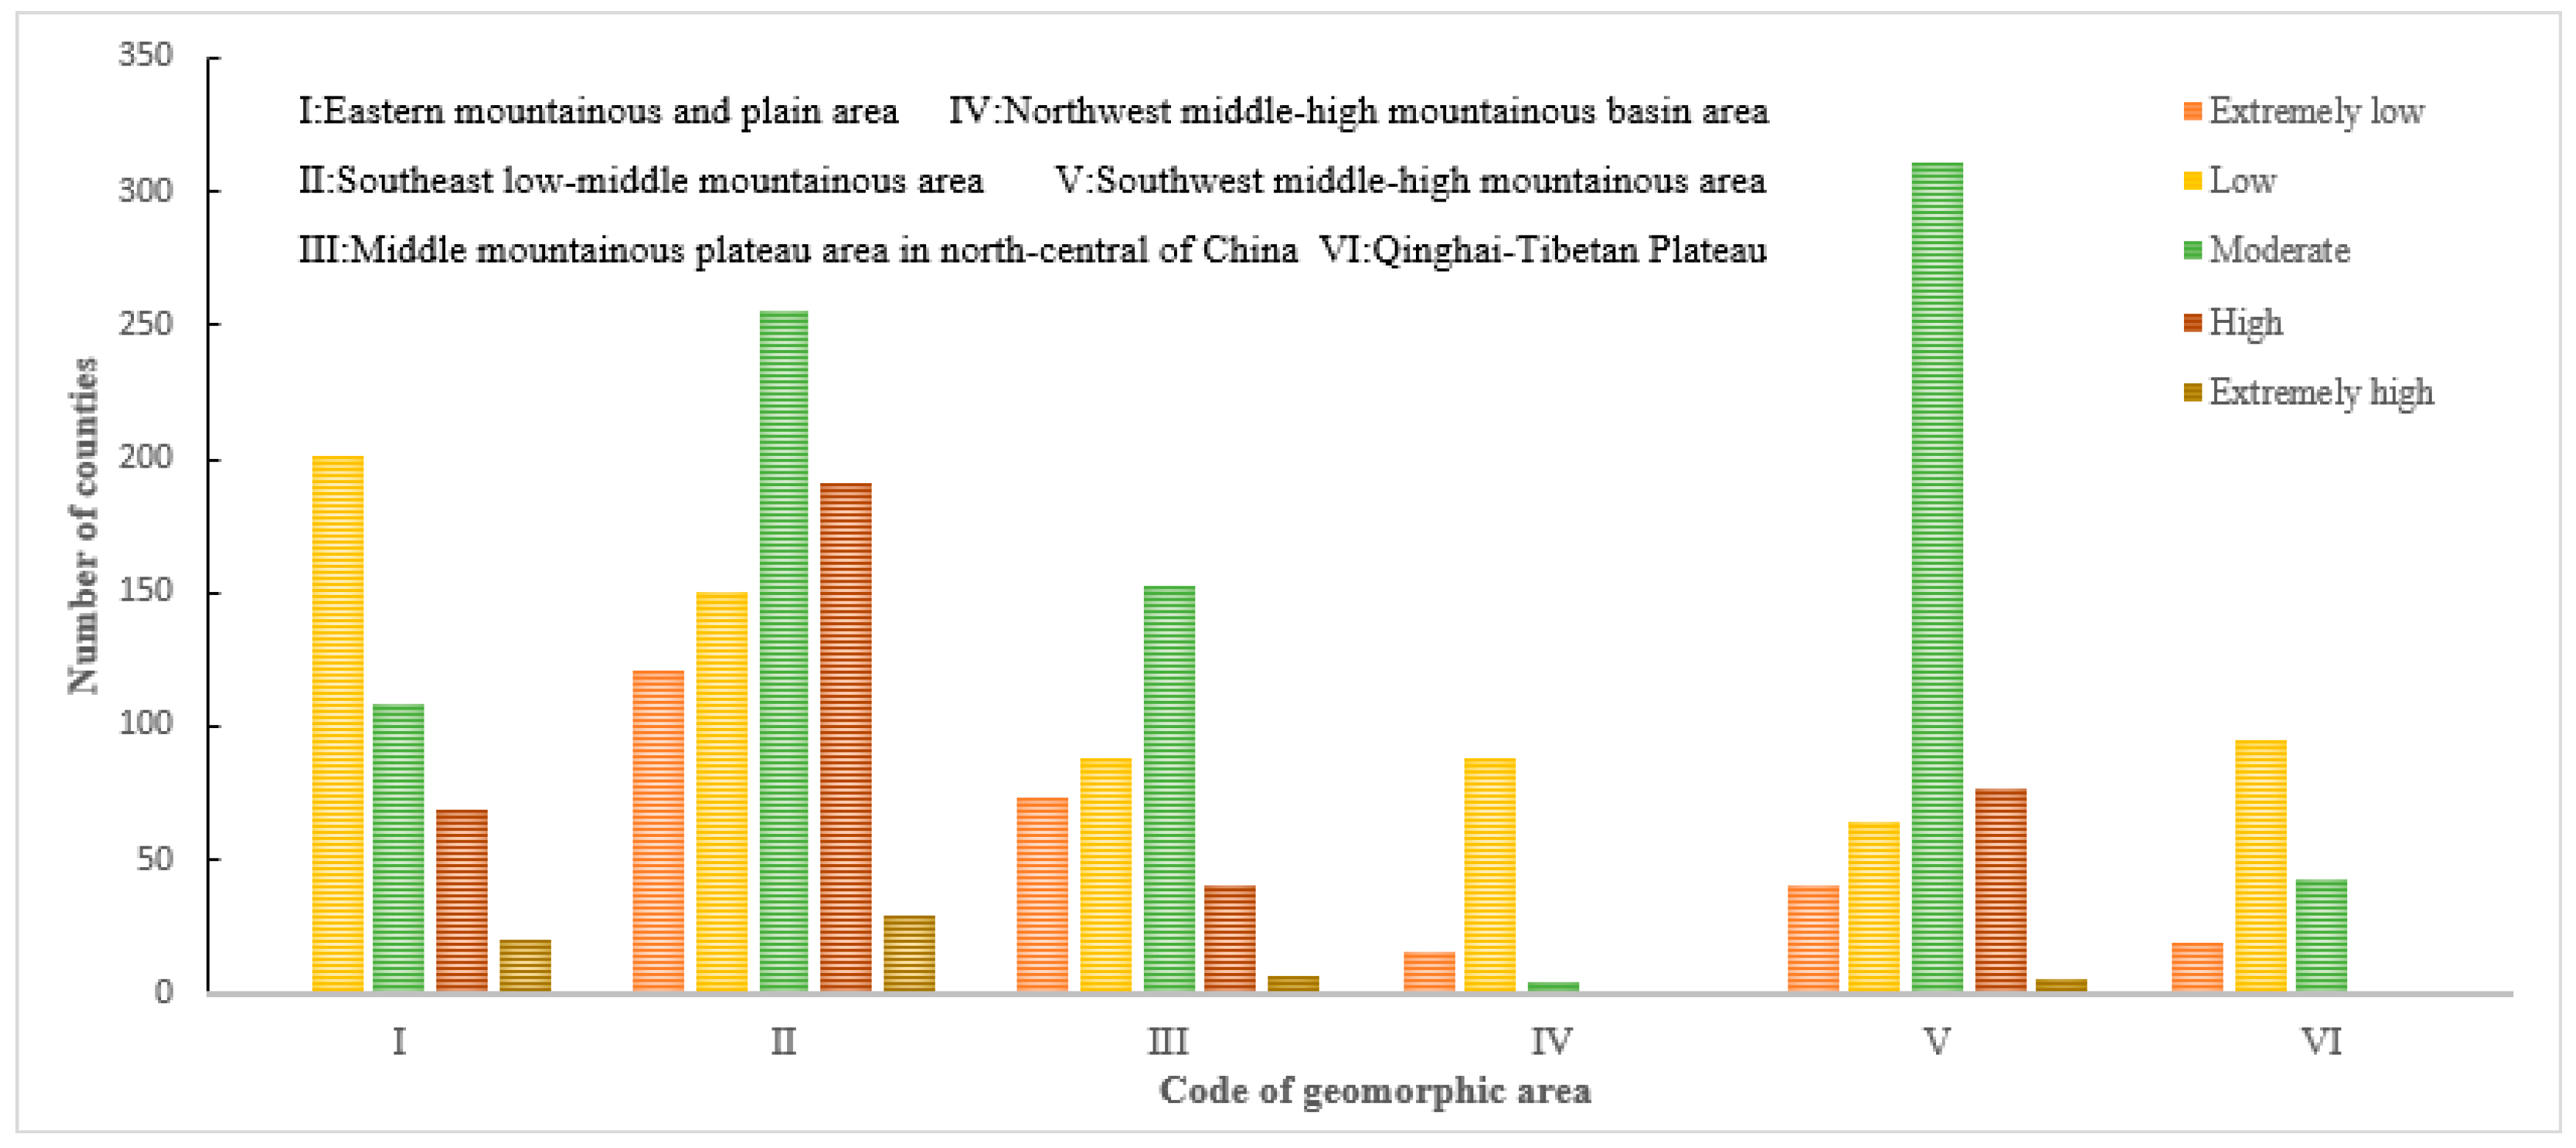
5.2. Exposure, Disaster Reduction Capability, and Vulnerability Analysis of Flash Floods in China

With respect to flash flood risk, the significance of quantifying exposure, disaster reduction capability, and vulnerability has been emphasized by previous research [18,54]. The results showed that vulnerability was positively correlated with exposure and negatively correlated with disaster reduction. This conclusion is consistent with the results of debris flow vulnerability in the Minjiang River Basin [19]. When the exposure value was equal to 0, the vulnerability did not exist. For example, Guangdong has a high exposure and disaster reduction capability. Finally, the vulnerability of flash floods is only moderate in Guangdong. Within the context of flash floods, the spatial patterns of exposure, disaster reduction capability, and vulnerability can assist managers in recognizing areas with sensitive populations and economies, lower capabilities to respond, and lower reduction capabilities of disaster. Thus an immediate response is required following flash flood events in these areas, and special attention is required during the process of disaster prevention and mitigation [54].
The spatial patterns of exposure revealed that areas with high population density, high GDP, and a high density of public infrastructure had a higher sensitivity to flash floods [52,55]. In the developed east and southeast coastal areas of China, due to the impact of dense populations, concentration of enterprises and institutions, and a high economic density, the region is extremely sensitive to flash floods. However, in the western and northwestern regions of China, such as Tibet, Xinjiang, and Gansu, where there are few people, backward economics, and imperfect infrastructure, which led to the extremely low exposure of flash floods in these regions (Figure 4). Overall, the exposure level gradually increases from west to east in China, which was supported by previous studies [48,56]. In addition, our results were also consistent with the economic activities in China [57], which also indirectly reflect the influence of China’s topography on flash floods.
It was observed that high disaster reduction capabilities were mainly distributed in the northern, central, and southwestern regions of China, indicating that people can quickly cope with losses and have a strong resistance capacity to flash floods in these zones (Figure 5). The spatial patterns of disaster reduction capabilities revealed that regions with high monitoring and early warning capabilities, high road densities, high river densities, and good medical rescue abilities had higher flash flood susceptibility and coping abilities [11,52]. As to the west areas of China, such as Tibet, Xinjiang, and Qinghai, people’s coping ability and resistance to flash floods are low, mainly due to an outdated social economy and low self-rescue and medical rescue capabilities [58]. Similarly, in the Qinling–Huaihe areas of China, the results of the disaster reduction assessment were consistent with the previous studies in the Gansu, Shaanxi, Henan, and Anhui provinces [24,59,60]. In the developed areas of eastern China, such as Fujian and Zhejiang, the disaster reduction capability of most counties was at low levels. This can be explained by low facility density of monitoring and early warning in the Fujian and Zhejiang provinces. Furthermore, these two regions are in highly exposed areas, and flash floods will lead to huge economic and property losses every year [61,62].
The vulnerability results will be used to estimate the maximum amount of loss resulting from flash floods. The vulnerability results indicated that the grade of vulnerability to flash floods in China presents the pattern: West and Northwest < Central < East and Southeast. Our results are consistent with the vulnerability results of geological disasters based on three-stage DEA analysis in China [63]. The distribution characters of vulnerability are similar to China’s population density and GDP distributions [27]. The results shown that high vulnerability to flash floods is mainly distributed in Fujian, Zhejiang, Jiangxi and Hebei, while low vulnerability occurs in regions with backward economics or high disaster reduction capabilities, including Beijing and Guangdong. The H-H spatial agglomeration areas are related to the high population density, social and economic development, and backward construction of disaster prevention and mitigation. The vulnerability distribution results were consistent with previous studies, which analyzed social vulnerability in China based on evaluation indicators of the social economy and building environment [48]. A comparison was performed between disaster reduction capability (Figure 5) and exposure (Figure 4). High exposure values were primarily distributed in areas with better social and economic development, but high disaster reduction ability had no correlation with high exposure. This indicates that the relationship between China’s disaster prevention and reduction work and social and economic development is uncoordinated, as has been seen in a previous study [64,65,66,67].
These results provide a basis for the exposure, disaster reduction capability, and vulnerability to flash floods in China. These maps can help the Chinese government organize and plan the future layout of cities, buildings, roads, populations, and economies. Vulnerability assessment results are an important part of risk assessments that promote risk zoning research of flash floods in China.

5.3. The Limitations and Implications

Although there are uncertainties in the vulnerability analyses, the proposed method can identify areas where the greatest loss results from flash floods. The final results should be conservative due to various assessment indexes [20]. Obviously, prevention and mitigation of flash floods should be emphasized in cities and regions with high vulnerability, whether this risk is to human life or economic factors. For future studies, dynamic flood risk assessment models should be established based on the assessment framework in this study by using the various datasets. In addition, there are other factors that will lead to regional vulnerability, such as population age, structure, cultural level, existing medical conditions, risk density, disaster intensity, etc. Therefore, for a flash flood vulnerability assessment in special areas, the selection assessment indicators should take into account the characteristics of the area. However, future research is needed to test the validity of vulnerability assessments by employing advanced statistical or quantitative methods. Since the 2008 Wenchuan earthquake, people are particularly aware of the capacity to restore and rebuild [68]. This can be extended to other aspects, such as frequency, process size, coping ability, resilience, and adaptability, by using more complex variables if the data is available [19,41,69], which will be another aspect to explore with regards to regional vulnerability to flash floods. For these reasons, the developed method can greatly benefit people in identifying flash flood vulnerability and taking measures for sustainable development.

6. Conclusions

A new vulnerability model was proposed based on previous studies that have investigated flash flood vulnerability. The present study mapped and analyzed the exposure, disaster reduction, and composite vulnerability of 30 provinces, 305 cities, and 2138 prevention and control counties in China. Using counties as research units, an assessment model was established based on the SVM. It was defined as a function of exposure (E) and disaster reduction capability (Re) of vulnerability elements. Exposure reflects the degree of disturbance by flash floods, and disaster reduction capability reflects the ability of exposed elements to withstand a certain intensity and the ability for resilience. In this study, a comprehensive understanding of the regional disparities of China’s exposure, disaster reduction capability, and vulnerability to flash floods and the correlation between these factors was obtained. The exposure revealed that central and southeast China areas have high-density residential, commercial, industrial buildings, roads, highways, tunnels, bridges, and populations. The spatial patterns of exposure showed that high-exposure areas mainly occurred in Yongjia, the Yujiang, Ninghai, Pingyang, Xiafu, Nanan, and Xianyou. Disaster reduction capability showed that the relationship is absonant between disaster reduction capability and socio-economic development in China. Most of the counties and cities with strong disaster reduction capabilities are mainly concentrated in the central part of China. Low disaster reduction capabilities were chiefly distributed in the eastern and southeastern regions of China, while the eastern and southeastern regions had high exposure. The spatial patterns of vulnerability showed that high-vulnerability areas were primarily distributed in counties with high population densities, more built-up land, developed transportation networks, and high property values, such as Minhou, Anxi, Tong’an, Ninghai, and Zhangzhou. The distribution of exposure, disaster reduction capability, and vulnerability of flash floods in China showed a positive spatial correlation, and the H-H spatial agglomeration areas mainly occurred in the Zhejiang, Fujian, Jiangxi, Hunan, Guangxi, Chongqing and Beijing areas.
The results indicated that regions with high economic and high population densities may be influenced by flash floods in the future. Although the model had limitations in terms of spatial resolution and temporal scale, the results for the high-vulnerability areas can alert local government officials to “hot spots.” In these places, a more favorable analysis should be conducted. These findings provide a scientific base for guiding policy decisions regarding flash flood prevention and mitigation in the future.

Author Contributions

J.X., and J.L. envisioned and designed this research and wrote the paper. W.C., and N.W. provided suggestions and modified the paper. L.G. processed the data and designed the charts and conducted the analysis. J.L. revised the manuscript draft.

Funding

This research was supported by the China Academy of Sciences Strategic Leading Science and Technology Project (XDA20030302), National Mountain Flood Disaster Survey and Evaluation Project of Chinese Academy of Water Sciences (SHZH-IWHR-57), China Geological Survey Project (DD20190637), The Science and Technology Project of Xizang Autonomous Region (Grant No. XZ201901-GA-07), Open Topic of Digital Fujian Institute of Large Data for Natural Disaster Monitoring (NDMBD2018003) and Scientific and Technological Innovation Team Project of Southwest Petroleum University (2017CXTD09). The authors also would like to thank the anonymous reviewers who gave valuable suggestions that have helped to improve the quality of the manuscript.

Conflicts of Interest

The authors declare no conflict of interest.

Appendix A

Table A1. Standard training sample matrix and standard test sample matrix.
Sample TypeIDInputOutput
ENIRAIFCPBuildingPODGDPLUTMWFRODRIDHOD
Training sample1000000011110
1500.14460.14580.1460.14480.1590.13820.14880.85030.85140.85610.84980.1602
2500.24870.2450.2420.24340.23770.24320.24460.74450.74570.75990.76430.2597
3500.35460.35060.34520.35820.33760.34450.34820.6410.65620.6620.65390.3456
4000.39980.39970.39940.39850.40.39950.39880.60040.60010.60210.60030.3959
5000.50630.50990.50560.49620.51160.49510.49860.51170.49970.5110.4930.5104
6000.59980.59960.60.59760.59990.59990.59940.40030.40040.40130.40150.59
7000.69460.69990.6950.70440.69180.70840.70250.28720.3030.29920.30790.694
8000.79960.79970.79830.79880.79920.79480.79910.20090.2010.20040.20050.789
9000.89670.89610.90850.89960.90570.89950.90920.10240.09440.10020.10240.9036
Test sample1000000011110
30.00060.00210.00140.00210.00240.00280.00230.99960.99510.99540.99820.0017
50.00280.00460.00290.00290.00520.00320.00520.99850.99450.99310.99640.0049
70.00330.00630.00520.0040.00590.00380.00770.9970.99340.99290.99460.0068
90.00460.00810.00590.00480.00750.00520.01320.9930.99130.99260.99290.0091
110.00650.01010.00870.00990.00840.00610.01430.99030.98940.9880.99140.0093
130.00820.01210.00870.01210.01050.00960.01890.98980.98510.9840.98820.0118
150.00950.01780.01040.01420.01140.0110.02020.98670.98420.98290.98680.0146

References

  1. Lin, Q.G.; Wang, Y. Spatial and temporal analysis of a fatal landslide inventory in China from 1950 to 2016. Landslides 2018, 15, 2357–2372. [Google Scholar] [CrossRef]
  2. Liu, Y.; Yang, Y.; Li, L. Major natural disasters and their spatio-temporal variation in the history of China. J. Geogr. Sci. 2012, 22, 963–976. [Google Scholar] [CrossRef]
  3. Fu, G.B.; Yu, J.J.; Yu, X.B.; Ouyang, R.L.; Zhang, Y.C.; Wang, P.; Liu, W.B.; Min, L.L. Temporal variation of extreme rainfall events in China, 1961–2009. J. Hydrol. 2013, 487, 48–59. [Google Scholar] [CrossRef]
  4. Nadim, F.; Kjekstad, O.; Peduzzi, P.; Herold, C.; Jaedicke, C. Global landslide and avalanche hotspots. Landslides 2006, 3, 159–173. [Google Scholar] [CrossRef]
  5. Guo, L.; Zhang, X.L.; Liu, R.H.; Liu, Y.S.; Liu, Q. Achievements and Preliminary Analysis on China National Flash Flood Disasters Investigation and Evaluation. J. Geo-Inf. Sci. 2017, 19, 1548–1556. [Google Scholar]
  6. Liu, C.Z.; Miao, T.B.; Chen, H.Q.; Dong, K.J.; Li, Z.H.; Li, H.J. Basic feature and origin of the “8 · 8” mountain torrent-debris flow disaster happened in Zhouqu County, Gansu, China, Aug. 8, 2010. Geol. Bull. China 2011, 30, 141–150. [Google Scholar]
  7. Cutter, S.L.; Finch, C. Temporal and Spatial Changes in Social Vulnerability to Natural Hazards. Proc. Natl. Acad. Sci. USA 2008, 105, 2301–2306. [Google Scholar] [CrossRef]
  8. Peng, L.; Xu, S.N.; Hou, J.W.; Peng, J.H. Quantitative risk analysis for landslides: The case of the Three Gorges area, China. Landslides 2015, 12, 1–18. [Google Scholar] [CrossRef]
  9. Galli, M.; Guzzetti, F. Landslide vulnerability criteria: A case study from Umbria, central Italy. Environ. Manag. 2007, 40, 649. [Google Scholar] [CrossRef]
  10. Totschnig, R.; Fuchs, S. Mountain torrents: Quantifying vulnerability and assessing uncertainties. Eng. Geol. 2013, 155, 31–44. [Google Scholar] [CrossRef] [Green Version]
  11. Dandapat, K.; Panda, G.K. Flood vulnerability analysis and risk assessment using analytical hierarchy process. Modeling Earth Syst. Environ. 2017, 3, 1–20. [Google Scholar] [CrossRef]
  12. Ding, M.T.; Wei, F.Q.; Hu, K.H. Property insurance against debris-flow disasters based on risk assessment and the principal-agent theory. Nat. Hazards 2012, 60, 801–817. [Google Scholar] [CrossRef]
  13. Lian, J.J.; Yang, W.C.; Xu, K.; Ma, C. Flash flood vulnerability assessment for small catchments with a material flow approach. Nat. Hazards 2017, 88, 699–719. [Google Scholar] [CrossRef]
  14. Du, J.; Wang, M.; Shi, P. A Probabilistic Approach of Assessing Rainstorm-induced Flood Loss Risk Based on Historical Event Records—Case Study in Hunan Province, China. J. Basic Sci. Eng. 2014, 22, 916–927. [Google Scholar]
  15. Velasco, D.; Semperetorres, D.; Corral, C.; Llort, X.; Velasco, E. A probabilistic approach of the Flash Flood Early Warning System (FF-EWS) in Catalonia based on radar ensemble generation. EGU Gen. Assem. 2010, 12, 10275. [Google Scholar]
  16. Borga, M.; Stoffel, M.; Marchi, L.; Marra, F.; Jakob, M. Hydrogeomorphic response to extreme rainfall in headwater systems: Flash floods and debris flows. J. Hydrol. 2014, 518, 194–205. [Google Scholar] [CrossRef]
  17. Quan, R. Risk assessment of flood disaster in Shanghai based on spatial–temporal characteristics analysis from 251 to 2000. Environ. Earth Sci. 2014, 72, 4627–4638. [Google Scholar] [CrossRef]
  18. Li, Z.; Nadim, F.; Huang, H.; Uzielli, M.; Lacasse, S. Quantitative vulnerability estimation for scenario-based landslide hazards. Landslides 2010, 7, 125–134. [Google Scholar] [CrossRef]
  19. Ding, M.; Heiser, M.; Hübl, J.; Fuchs, S. Regional vulnerability assessment for debris flows in China—A CWS approach. Landslides. 2016, 13, 1–14. [Google Scholar] [CrossRef]
  20. Zeleňáková, M.; Gaňová, L.; Purcz, P.; Satrapa, L. Methodology of flood risk assessment from flash floods based on hazard and vulnerability of the river basin. Nat. Hazards 2015, 79, 2055–2071. [Google Scholar]
  21. Xiong, J.N.; Sun, M.; Zhang, H.; Cheng, W.M.; Yang, Y.H.; Sun, M.Y.; Cao, Y.F.; Wang, J.Y. Application of the Levenburg–Marquardt back propagation neural network approach for landslide risk assessments. Nat. Hazards Earth Syst. Sci. 2019, 19, 629–653. [Google Scholar] [CrossRef]
  22. Vranken, L.; Turnhout, P.V.; Eeckhaut, M.V.D.; Vandekerckhove, L.; Poesen, J. Economic valuation of landslide damage in hilly regions: A case study from Flanders, Belgium. Sci. Total Environ. 2013, 447, 323–336. [Google Scholar] [CrossRef] [PubMed] [Green Version]
  23. Rahmati, O.; Samani, A.N.; Mahdavi, M.; Pourghasemi, H.R.; Zeinivand, H. Groundwater potential mapping at Kurdistan region of Iran using analytic hierarchy process and GIS. Arab. J. Geosci. 2015, 8, 7059–7071. [Google Scholar] [CrossRef]
  24. Pei, H.J.; Chen, J.; Li, W.; Sun, Y.P.; Chen, W.K. Spatiotemporal pattern & risk assessment of storm flood in Gansu province. J. Nat. Disasters 2017, 26, 167–175. [Google Scholar]
  25. Vranken, L.; Vantilt, G.; Van Den Eeckhaut, M.; Vandekerckhove, L.; Poesen, J. Landslide risk assessment in a densely populated hilly area. Landslides 2015, 12, 787–798. [Google Scholar] [CrossRef]
  26. Hung, L.Q.; Van, N.T.H.; Duc, D.M.; Ha, L.T.C.; Van Son, P.; Khanh, N.H.; Binh, L.T. Landslide susceptibility mapping by combining the analytical hierarchy process and weighted linear combination methods: A case study in the upper Lo River catchment (Vietnam). Landslides 2016, 13, 1285–1301. [Google Scholar] [CrossRef]
  27. Liu, Y.S.; Yang, Z.S.; Huang, Y.H.; Liu, C.J. Spatiotemporal evolution and driving factors of China’s flash flood disasters since 1949. Sci. China Earth Sci. 2019, 49, 60–72. [Google Scholar] [CrossRef]
  28. Bolturk, E.; Kahraman, C. A novel interval-valued neutrosophic AHP with cosine similarity measure. Soft Comput. 2018, 22, 4941–4958. [Google Scholar] [CrossRef]
  29. Pourghasemi, H.R.; Pradhan, B.; Gokceoglu, C. Application of fuzzy logic and analytical hierarchy process (AHP) to landslide susceptibility mapping at Haraz watershed, Iran. Nat. Hazards 2012, 63, 965–996. [Google Scholar] [CrossRef]
  30. Li, Z.W.; Zeng, G.M.; Zhang, H.; Yang, B.; Jiao, S. The integrated eco-environment assessment of the red soil hilly region based on GIS: A case study in Changsha City, China. Ecol. Model. 2007, 202, 540–546. [Google Scholar] [CrossRef]
  31. Murray, A.T. GIS and Multicriteria Decision Analysis (review). Geogr. Anal. 2002, 34, 91–92. [Google Scholar] [CrossRef]
  32. Xian, S.D. A new fuzzy comprehensive evaluation model based on the support vector machine. Fuzzy Inf. Eng. 2010, 2, 75–86. [Google Scholar] [CrossRef]
  33. Li, L.P.; Lan, H.X.; Guo, C.B.; Zhang, Y.S.; Li, Q.W.; Wu, Y.M. A modified frequency ratio method for landslide susceptibility assessment. Landslides 2016, 14, 1–15. [Google Scholar] [CrossRef]
  34. Yao, X.; Tham, L.G.; Dai, F.C. Landslide susceptibility mapping based on Support Vector Machine: A case study on natural slopes of Hong Kong, China. Geomorphology 2008, 101, 572–582. [Google Scholar] [CrossRef]
  35. Xu, C.; Dai, F.C.; Xu, X.W.; Yuan, H.L. GIS-based support vector machine modeling of earthquake-triggered landslide susceptibility in the Jianjiang River watershed, China. Geomorphology 2012, 145–146, 70–80. [Google Scholar] [CrossRef]
  36. Cherkassky, V. The nature of statistical learning theory. IEEE Trans. Neural Netw. 2002, 38, 409. [Google Scholar] [CrossRef] [PubMed]
  37. Franklin, J. The elements of statistical learning: Data mining, inference and prediction. J. R. Stat. Soc. 2010, 99, 567. [Google Scholar] [CrossRef]
  38. Rawat, P.K.; Pant, C.C.; Tiwari, P.C.; Pant, P.D.; Sharma, A.K. Spatial variability assessment of river-line floods and flash floods in Himalaya: A case study using GIS. Disaster Prev. Manag. 2012, 21, 135–159. [Google Scholar] [CrossRef]
  39. Jin, G.; Deng, X.Z.; Zhao, X.D.; Guo, B.S.; Yang, J. Spatio-temporal patterns of urban land use efficiency in theYangtze River Economic Zone during 2005–2014. Acta Geogr. Sin. 2018, 73, 1242–1252. [Google Scholar]
  40. Greiving, S.; Fleischhauer, M.; Lückenkötter, J. A Methodology for an integrated risk assessment of spatially relevant hazards. J. Environ. Plan. Manag. 2006, 49, 1–19. [Google Scholar] [CrossRef]
  41. Fell, R.; Corominas, J.; Bonnard, C.; Cascini, L.; Leroi, E.; Savage, W.Z. Guidelines for landslide susceptibility, hazard and risk zoning for land use planning. Eng. Geol. 2007, 102, 85–98. [Google Scholar] [CrossRef]
  42. Gallopín, G.C. Linkages between vulnerability, resilience, and adaptive capacity. Glob. Environ. Chang. 2006, 16, 293–303. [Google Scholar] [CrossRef]
  43. Li, H.; Zhang, P.Y.; Cheng, Y.Q. Concepts and Assessment Methods of Vulnerability. Prog. Geogr. 2008, 2, 18–25. [Google Scholar]
  44. Špitalar, M.; Gourley, J.J.; Lutoff, C.; Kirstetter, P.E.; Brilly, M.; Carr, N. Analysis of flash flood parameters and human impacts in the US from 2006 to 2012. J. Hydrol. 2014, 519, 863–870. [Google Scholar] [CrossRef]
  45. Bodoque, J.M.; Amerigo, M.; Díez-Herrero, A.; García, J.A.; Cortés, B.; Ballesteros-Cánovas, J.A.; Olcina, J. Improvement of resilience of urban areas by integrating social perception in flash-flood risk management. J. Hydrol. 2016, 541, 665–676. [Google Scholar] [CrossRef] [Green Version]
  46. Cascini, L. Applicability of landslide susceptibility and hazard zoning at different scales. Eng. Geol. 2008, 102, 164–177. [Google Scholar] [CrossRef]
  47. Li, L.T.; Xu, Z.X.; Pang, B.; Liu, L. Flood risk zoning in China. J. Hydraul. Eng. 2012, 43, 22–30. [Google Scholar]
  48. Zhou, Y.; Li, N.; Wu, W.X.; Wu, J.D. Assessment of provincial social vulnerability to natural disasters in China. Nat. Hazards 2014, 71, 2165–2186. [Google Scholar] [CrossRef]
  49. Guan, Y.; Cheng, Y.; Wang, D.X. Research on risk assessment of landslide hazard in Xinjiang. Eng. Surv. Mapp. 2018, 27, 26–31. [Google Scholar]
  50. Liu, X.L.; Miao, C.; Tian, C.S. Comparative Analysis of Two Methods for Assessing Hazard of Landslide and Debris-flow on a Regional Scale. J. Disaster Prev. Mitig. Eng. 2017, 37, 71–78. [Google Scholar]
  51. Yin, Z.E.; Tian, P.F.; Chi, X.X. Multi-scenario-based risk analysis of precipitation extremesin China during the past 60 years (1951–2011). Acta Geogr. Sin. 2018, 73, 405–413. [Google Scholar]
  52. Nasiri, H.; Yusof, M.J.M.; Ali, T.A.M.; Hussein, M.K.B. District flood vulnerability index: Urban decision-making tool. Int. J. Environ. Sci. Technol. 2019, 16, 2249–2258. [Google Scholar] [CrossRef]
  53. Uzielli, M.; Nadim, F.; Lacasse, S.; Kaynia, A.M. A conceptual framework for quantitative estimation of physical vulnerability to landslides. Eng. Geol. 2008, 102, 251–256. [Google Scholar] [CrossRef]
  54. Kim, S.E.; Choi, H.I. Assessment of vulnerability to extreme flash floods in design storms. Int. J. Environ. Res. Public Health 2011, 8, 2907–2922. [Google Scholar] [CrossRef] [PubMed]
  55. Huang, J.Y.; Liu, Y.; Ma, L.; Su, F. Methodology for the assessment and classification of regional; vulnerability to natural hazards in China: The application of a DEA model. Nat. Hazards 2013, 65, 115–134. [Google Scholar] [CrossRef]
  56. Wei, Y.M.; Fan, Y.; Lu, C.; Tsai, H.T. The assessment of vulnerability to natural disasters in China by using the DEA method. Environ. Impact Assess. Rev. 2004, 24, 427–439. [Google Scholar] [CrossRef]
  57. Ding, R.X.; Ni, P.-F. The New Pattern of Regional Economic Space in China: The Perspective of Urban Real Estate. China Ind. Econ. 2017, 5, 94–112. [Google Scholar]
  58. Tang, W.; Zhou, T.C.; Sun, J.; Li, Y.H.; Li, W.P. Accelerated Urban Expansion in Lhasa City and the Implications for Sustainable Development in a Plateau City. Sustainability 2017, 9, 1499. [Google Scholar] [CrossRef]
  59. Gu, L.W. GIS-based Risk Zone of Flood Hazard in Anhui Province. Meteorol. Environ. Res. 2011, 6, 67–70. [Google Scholar]
  60. Hui, Z.D. Mountain Disasters and Its Countermeasures in Qinling Daba Mountain Area. J. Nat. Disasters 1994, 3, 31–36. [Google Scholar]
  61. Nie, J.; Fan, Y.D.; Deng, L.; Guan, Y. Research and application of torrential flood loss assessment based on radar remote sensing technology. J. Nat. Disasters 2010, 19, 105–110. [Google Scholar]
  62. Lou, W.P.; Chen, H.Y.; Zheng, F.; Rui, W.U. Economic loss assessment of typhoon based on principal component analysis and neural network. Geogr. Res. 2009, 28, 1243–1254. [Google Scholar]
  63. Li, M.Z.; Lv, J.; Chen, X.; Jiang, N. Provincial evaluation of vulnerability to geological disaster in China and its influencing factors: A three-stage DEA-based analysis. Nat. Hazards 2015, 79, 1649–1662. [Google Scholar] [CrossRef]
  64. Xu, M.-J.; Yang, Z.-S. The Evaluation and Analysis of Coordinated Development on Resources and Environment Carrying Capacity in Southwestern Mountainous Area of China: A Case in Dehong Dai-Jingpo Autonomous Prefecture, Yunnan Province. J. Nat. Resour. 2016, 31, 1726–1738. [Google Scholar]
  65. Yang, J.X. Evaluation on Coordination of Tourism Economy and City Development in Southwest of China. J. Anhui Agric. Sci. 2012, 40, 3683–3685. [Google Scholar]
  66. Jiang, J.H.; Shi, J.S.; Li, Y.W. The Planning and Construction of City Parks from the Perspective of Disaster Prevention and Reduction: A Case Study of Chengdu City. J. Southwest Jiaotong Univ. 2008, 5, 72–77. [Google Scholar]
  67. Jiang, K.X.; Cao, S.M.; Yin, G.H. A Study on the Legislative System of Disaster Prevention and Reduction in China. J. Nat. Disasters 1999, 2, 110–114. [Google Scholar]
  68. Cui, P.; Zhuang, J.Q.; Chen, X.C.; Zhang, J.Q.; Zhou, X.J. Characteristics and Countermeasures of Debris Flow in Wenchuan Area after the Earthquake. J. Sichuan Univ. 2010, 42, 10–19. [Google Scholar]
  69. Westen, C.J.V.; Castellanos, E.; Kuriakose, S.L. Spatial data for landslide susceptibility, hazard, and vulnerability assessment: An overview. Eng. Geol. 2008, 102, 112–131. [Google Scholar] [CrossRef]
Figure 1. The digital elevation model (DEM) of China.
Ijgi 08 00297 g001
Figure 2. Flowchart of vulnerability for flash floods in China.
Ijgi 08 00297 g002
Figure 3. Flow chart of quantification process of flash flood vulnerability index.
Ijgi 08 00297 g003
Figure 4. Spatial distribution pattern of exposure in China.
Ijgi 08 00297 g004
Figure 5. Spatial pattern of disaster reduction capabilities in China (the areas shown in the red ellipse are scored high).
Ijgi 08 00297 g005
Figure 6. Spatial pattern of (a) vulnerabilities and (b) local indicators of spatial association (LISAs) in China.
Ijgi 08 00297 g006
Figure 7. Moran’s I scatter plot of (a) exposure, (b) disaster reduction, and (c) vulnerability in counties of China.
Ijgi 08 00297 g007
Figure 8. Vulnerability in different geomorphological regions of China.
Ijgi 08 00297 g008
Table 1. Sources and resolutions of the raw datasets.
FactorsSource
RoadChina: Flash Flood Investigation and Evaluation Dataset of China, 1949–2015, 1:1,000,000.
BuildingChina: Flash Flood Investigation and Evaluation Dataset of China, 2013, 1:50,000.
Flood control projectsChina: Flash Flood Investigation and Evaluation Dataset of China, 2013, 1:50,000.
Enterprises and InstitutionsChina: Flash Flood Investigation and Evaluation Dataset of China, 2013, 1:50,000.
DEMChina: Geospatial Data Cloud, 2000, 90 × 90 m.
Population density China: Resources and Environmental Sciences Data Center, 2010, 1 × 1 km.
GDPChina: Resources and Environmental Sciences Data Center, 2010, 1 × 1 km.
Land useChina: China: Resources and Environmental Sciences Data Center, 2010, 100 × 100 m.
Monitoring and warning facilitiesChina: Flash Flood Investigation and Evaluation Dataset of China, 2013, 1:50,000.
RiverChina: Flash Flood Investigation and Evaluation Dataset of China, 2013, 1:1,000,000.
Geomorphological regionalizationChina: State Key Laboratory of Resources and Environment Information System, 2013, 1:15,000,000.
Table 2. Interpretation of importance scores in a pairwise comparison matrix.
Comparative ImportanceDefinitionDescription
1Equal importanceTwo factors have same influence on parent decision.
3Weak importanceOne factor has a moderate influence on another factor.
5Essential or strong importanceOne factor has a strong influence on another factor.
7Demonstrated importanceOne factor has a significant influence on another factor.
9Absolute importanceEvidence favoring one decision factor over the other is the highest order of affirmation.
2, 4, 6, 8IntermediateWhen compromise is needed, values between two adjacent judgments are used.
ReciprocalsIf Ai is the judgment value when i is compared with j, then Aj has the reciprocal value when compared to AiA reasonable assumption.
Table 3. Example of a pairwise comparison matrix.
Road DensityRiver DensityBuilding Density
Road density135
River density1/313
Building density1/51/31
Table 4. Ranks and normalized weights of vulnerability factors.
FactorClassAssigned RankNormalized WeightsFactorClassAssigned RankNormalized Weights
RoadRAI10.565LUTARA10.468
HIG30.262CON30.248
NAT50.118WOO50.121
PRO70.055GRA60.080
FCPBRI10.333WAT70.054
CUL10.333UNU90.029
DAM10.333EconomicGDP11
BuildingNUM10.25PopulationPOD11
ARE10.25RiverRID11
FLO10.25RoadROD11
STR10.25HospitalHOD11
ENIHOS10.25MWFMOS10.522
NUH10.25RAS30.2
SCH10.25RADS30.2
ENT10.25GAS50.078
Table 5. Exposure of flash flood for control counties in China.
TypeExposure
ValueCountArea/Ratio (%)
10,000 ha
Extremely low0–0.1117933.980.04
Low0.11–0.27138851,950.3854.87
Moderate0.27–0.3842710,123.9410.69
High0.38–0.551112580.672.73
Extremely high0.55–1.033740.540.78
Non-Prevention and Control County--72429,248.4430.89
Table 6. Analysis of flash flood exposures in China *.
NAMEExtremely LowLowModerateHighExtremely High
Area/Ratio (%)Area/Ratio (%)Area/Ratio (%)Area/Ratio (%)Area/Ratio (%)
10,000 ha10,000 ha10,000 ha10,000 ha10,000 ha
Shaanxi001257.751.31491.820.5169.350.0764.770.07
Anhui00225.480.24199.500.2138.090.0421.180.02
Guizhou001503.281.57257.690.270000
Henan00183.110.19438.540.4633.100.0327.210.03
Sichuan004167.744.34626.780.650000
Xinjiang008091.978.4370.750.070000
Tibet009307.449.70000000
Liaoning13.860.01450.120.47254.870.27241.990.25149.730.16
Hebei6.310.01602.350.63195.350.20217.050.2339.900.04
Yunnan002483.812.591290.971.3557.180.0600
Jilin00926.110.971118.881.1765.240.0700
Gansu0.9202452.032.55519.410.54126.790.1335.760.04
Guangxi001844.651.921119.491.17199.070.2100
Shanxi001911.761.99297.210.3153.380.0600
Guangdong4.620.01446.000.47526.920.55477.770.5043.200.05
Hunan6.440.011317.031.37599.320.6221.750.0200
Beijing001.57068.050.0734.970.0400
Heilongjiang003012.953.1466.270.070000
Jiangxi001033.61.08479.060.500000
Hubei0.820279.170.29668.330.70289.550.30120.390.13
Fujian00344.100.36561.620.59244.090.2570.860.07
Ningxia00361.280.3849.930.050000
Qinghai004931.75.1431.580.030000
Zhejiang00101.320.11333.440.35316.600.33152.940.16
Shandong001276.441.33160.340.171.68000
Hainan00184.80.1940.820.0418.660.0200
Chongqing00635.310.66136.870.1451.690.0500
Tianjin008.150.01000000
Jiangsu006.670.01000000
Inner Mongolia0.0704999.575.21727.260.766.310.0100
* No statistics on Hong Kong, Macao, Taiwan, and Shanghai.
Table 7. Disaster reduction capability for flash floods for control counties in China.
TypeDisaster Reduction Capability
ValueCountArea/Ratio (%)
10,000 ha
Extremely Low0–0.1317477.460.08
Low0.13–0.342115217.255.51
Moderate0.34–0.39104346,630.3549.25
High0.39–0.473449160.299.68
Extremely High0.47–1.03664344.164.59
Non-Prevention and Control County--72429,248.4430.89
Table 8. Analysis of flash flood disaster reduction capabilities in China *.
NAMEExtremely LowLowModerateHighExtremely High
Area/Ratio (%)Area/Ratio (%)Area/Ratio (%)Area/Ratio (%)Area/Ratio (%)
10,000 ha10,000 ha10,000 ha10,000 ha10,000 ha
Shaanxi0032.520.03970.171.01455.680.48425.310.44
Anhui0000185.140.19152.380.16146.730.16
Guizhou00224.240.231349.201.41175.530.1812.010.18
Henan0063.020.07419.620.44118.490.1283.530.12
Sichuan00146.590.153815.963.98434.490.45397.480.45
Xinjiang00007445.427.76676.500.7140.810.71
Tibet00009176.069.56131.380.140.000.14
Liaoning00267.450.28291.820.30217.030.23334.270.23
Hebei72.840.08352.240.37434.500.45193.750.207.630.20
Yunnan00463.140.482149.402.241,109.631.16109.781.16
Jilin00374.810.39736.250.7768.220.074.830.07
Gansu009.680.011902.291.98681.820.71541.110.71
Guangxi00437.610.461247.541.30561.590.5992.590.59
Shanxi0000974.751.02149.410.16314.300.16
Guangdong4.620.05332.270.35617.370.64277.180.29267.060.29
Hunan00440.750.461108.971.16302.840.3291.990.32
Beijing0060.990.069.760.0133.690.040.150.04
Heilongjiang00153.640.162776.842.8975.260.0873.480.08
Jiangxi00646.200.67716.230.75149.450.160.790.16
Hubei0000342.220.36554.930.58461.110.58
Fujian00476.410.50316.520.33364.030.3863.700.38
Ningxia0056.480.06197.440.2193.650.1063.640.10
Qinghai00004564.224.75237.820.25161.240.25
Zhejiang00381.390.40131.100.14190.100.20201.720.20
Shandong0053.460.06165.150.1798.120.10123.450.10
Hainan0000155.040.1662.030.0727.210.07
Chongqing00218.190.23405.860.42148.130.1551.690.15
Tianjin0000008.150.0100.01
Jiangsu00006.670.010000
Inner Mongolia0026.150.034021.534.191438.981.50246.551.50
* No statistics on Hong Kong, Macao, Taiwan, and Shanghai.
Table 9. Flash flood vulnerability for control counties in China.
TypeVulnerability
ValueCountArea/Ratio (%)
10,000 ha
Extremely Low0–0.274362506.582.65
Low0.27–0.5469234,824.236.78
Moderate0.54–0.657118,157.5419.18
High0.6–0.73788714.339.20
Extremely High0.7–1.0611226.861.30
Non-Prevention and Control County--72429,248.4430.89
Table 10. Analysis of flash flood vulnerabilities in China *.
NAMEExtremely LowLowModerateHighExtremely High
Area/Ratio (%)Area/Ratio (%)Area/Ratio (%)Area/Ratio (%)Area/Ratio (%)
10,000 ha10,000 ha10,000 ha10,000 ha10,000 ha
Shaanxi360.550.38267.970.28808.390.84411.360.4335.420.04
Anhui9.880.01124.400.13341.270.368.700.0100
Guizhou12.010.0121.910.021617.591.69109.470.1100
Henan8.140.0144.170.05134.340.14298.250.31197.060.21
Sichuan388.610.412387.032.491817.331.89201.560.2100
Xinjiang40.810.047970.388.30151.530.160000
Tibet121.040.137727.498.051458.911.520000
Liaoning12.440.01194.820.20298.560.31542.180.5762.580.07
Hebei7.630.0127.830.03240.790.25501.000.52283.710.30
Yunnan92.390.10935.110.972380.472.48423.990.4400
Jilin18.300.02178.390.19569.670.59417.710.4400
Gansu517.520.541156.341.211118.821.17292.320.3149.900.05
Guangxi0.430114.930.121332.041.39891.930.9300
Shanxi314.300.33109.850.11902.840.94111.470.1200
Guangdong4.660.01378.960.40741.400.77373.490.3900
Hunan38.940.0464.770.07939.440.98849.680.8951.730.05
Beijing0.1501.42034.370.0448.130.0520.520.02
Heilongjiang73.480.082486.022.59519.720.540000
Jiangxi0.79017.350.02450.070.4691016.571.0627.880.03
Hubei56.550.0654.630.06738.860.77484.680.5123.540.03
Fujian0013.770.01116.370.12812.770.85277.760.29
Ningxia74.860.08140.850.15170.200.1825.300.0300
Qinghai303.640.324479.614.67180.040.190000
Zhejiang6.200.0190.800.10290.510.30347.850.36168.950.18
Shandong3.520118.620.12234.600.2455.690.0627.740.03
Hainan0097.440.10146.840.150000
Chongqing0093.860.10264.420.28465.590.4900
Tianjin0000008.150.0100
Jiangsu006.670.01000000
Inner Mongolia39.770.045518.795.75158.170.1716.410.020.070
* No statistics on Hong Kong, Macao, Taiwan, and Shanghai.

