1. Introduction
Over the years, there have been major changes in transportation concerning the introduction of Intelligent Transportation Systems (ITS). The data, generated by the ITS equipment and services, makes transportation systems more sophisticated, but at the same time the management of such huge quantities of transportation data is complex. Over the last two decades, various Public Trip Planner systems have been developed, and research in this field is still ongoing. The motivation of this research was based on improving citizens’ mobility by increasing multimodal public transport usage in citizens’ trips. In order to help citizens plan public transport routes and search for the most optimal ones, the Lithuanian Road Administration decided to create the VINTRA system for advanced multimodal public transport trip planning and the integration of timetables of all public transport modes in Lithuania.
The deployment and operational efficiency of an Advanced Public Transport Trip Planner (APTTP) is strongly related to the actual quality and completeness of GIS data of the public transport network and timetable [
1,
2,
3]. Transport optimization using geoinformatics in the geographical space is a computational procedure. This problem essentially refers to the well-known
traveling salesman problem, which reveals the role of the complexity of spatial data in solving spatial problems [
4], and is a persistently active field of research [
5,
6]. Travelers search for the optimal public transport route, and their decisions are influenced by personal attributes, responses to the supplied information, and situational factors such as time of day, selected mode of transport, trip purpose, traffic conditions, maximum walking distance, and maximum number of transfers [
7,
8,
9]. APTTP is a specialized search engine used to find an optimal means of traveling between two or more given locations, sometimes using more than one transport mode. Searches may be optimized based on different criteria; for example, the fastest, shortest, or cheapest route, or the route with the least number of changes. Advanced public transport trip planning uses all modes of public transport and real-time data from public transport vehicles to provide information about delays and timetable mismatches.
Some of the shortest path algorithms allow fast point-to-point queries in graphs using pre-processed data [
10]. A standard algorithm for this problem is the Dijkstra algorithm [
11].
Other scientists have adapted Dijkstra’s shortest path algorithm to decrease the size of the search space [
5]. The algorithm was the first to use a bidirectional search method. This algorithm consists of a forward search from an origin node to the destination node and a backwards search from the destination node to the origin node.
There are several trip alternatives in space (different stops) and in time (related to the user-entered arrival or departure time). In fact, transit networks are usually characterized by different boarding stops and available runs for the same OD pair for which different trip alternatives are suggested to different users according to their different weights on path attributes (e.g., walking time, waiting time, on board time, transfer time, etc.). This aspect highlights the frontier of the trip planners of advanced public transport, which have to provide personalized real-time information [
12,
13,
14,
15] proposed a multimodal trip planner, which supported the Park and Ride (P+R) mode. The transportation networks also used the consistency of parking lots beside the stops, stations, and intersections. In order to reach the quickest transfer, the system identifies the route with the shortest path. It has both web- and mobile phone-based user interfaces, which can be used for the prediction of arrival time and trip planning. Other scientists [
16] have developed a real-time mobile transit trip planner application. Vehicle positioning is provided from GPS and dynamic data (frequently changing link attributes), and the K shortest path is used to find the route. The data is processed for running the route, OD paths are pre-calculated and stored in the database [
17], developed another model which also supported the P+R mode of travel for public transportation. In this model, the algorithm search space is reduced by restricting the expansion of the search by a minimum bounding box that is applied to the geographical coordinates of the origin and destination pair. Similarly, [
18,
19] proposed a method for finding the shortest paths in a timetable based on the transit network. It finds all of the shortest paths available between the given origin and destination points. [
20,
21] proposed an algorithm to find the optimal paths in the multimodal public transport network. [
12,
22,
23] presented an intercity trip planner which combines different transport modes like buses, trains, high speed trains, airlines, and ferries. It also incorporates point-by-point travel planning as well as mode restriction and other constraint options. In comparison to other developed trip planners, it is oriented towards accessibility and result visualization [
24]. This calculation mechanism also has the ability to regularly update the network elements and the timetable. Other scientists have presented the development of a multimodal intercity transit trip planner using public transport [
25]. It incorporates delays from GPS signals into the transit network in real time to minimize the gap of our prediction model [
26,
27].
Public administrations are increasingly faced with tight budgets and, more than ever, must make the most of the available money for the provision of public services. When tackling budget limitations in public transport provision, decision makers may be able to resolve undifferentiated service cuts better. However, good data sources and analysis tools are crucial in making smart choices [
28,
29,
30].
GIS technologies could be applied to solve route choice tasks within the complex urban transport system: for cars, public transport, railway transport, and even pedestrians [
31,
32,
33]. Other scientists talk about algorithms supplemented by a traffic condition data search, which is stored on the road and street network segments, is different depending on the time of day [
34,
35], and is a scalable solution for multimodal travel information services across different countries [
36]. The general public might be the users of IS as a way of choosing rational public transport trips.
This research analyzes the Lithuanian advanced public trip planner VINTRA and the route planning functionality implemented in that system. The web portal for travelers in Lithuania is called VINTRA (this system can be accessed at
www.visimarsrutai.lt). This research presents how visualization of walking routes on a digital map was solved when a planned route requires transfers or the route start/end point is a particular place or address (not a public transport stop), and how walking routes can be visualized in a real trajectory, avoiding a straight line walking route visualization. This research can answer the following questions:
What calculation method for public trip planning is applied in the VINTRA?
How can pedestrian routes be visualized in web applications’ digital maps?
How are the calculation results of public transit routing integrated with the calculations of the walking route trajectory?
How similar are the results of public transit route planning compared to those of the VINTRA system created with Google?
2. Lithuanian Public Transport System Indicators and Description of the VINTRA Functionality
Growing the Lithuanian economy and increasing the quality of living conditions prompts increases in the population’s mobility, motorization level, and transport flow on the country’s streets and roads. This results in mobility increase (maximized) over time [
37].
The average percentage of public transport trips is increasing by about 2% per (every) year. The number of passengers carried by all modes of public transport in Lithuania rose from 394.998 million in 2012 to 436.503 in 2017. This situation indicates positive effects on public transport usage in Lithuania and has led to the requirement for state-of-the-art information services for passengers. Such services should make trips more comfortable and more attractive to travelers. The situation of public transport usage in Lithuania is presented in
Table 1.
We can see that the total number of passengers carried by public transport has increased for all modes, except trolley buses. The decrease in the number of trolley buses in the major cities of Lithuania can explain this. The passengers carried by modes of public road transport are presented in
Table 1.
The Lithuanian intercity public transportation system is cheap but rather slow. The system is dominated by buses. Each Lithuanian city has a single bus station where most buses leave from. Bus trips between the main cities are very frequent, with Vilnius-Kaunas buses leaving each terminal station every 15 minutes. Buses connecting the main cities to the regional towns usually run at least several times a day. When moving from one small town to another, it might be wise to connect through a larger city. Lithuanian railroads are not on par with those in Western Europe. Before planning to go somewhere by rail, one first has to check the map of Lithuanian railroads to determine whether both your origin and destination have a rail connection and whether there is a relatively direct route. Moreover, not every railway line has passenger traffic, as the railroads have lost in their competition with buses over the past 25 years. Even where railway services exist, they run less frequently than their bus counterparts. Lithuania has three international airports (Vilnius, Kaunas, and Palanga). There are no domestic flights. Generally, Western Europe and Southern Europe are both well served by air routes from Lithuania. The larger Lithuanian cities have extensive public transport systems. Buses and trolley buses are available in Vilnius and Kaunas. In the smaller cities (Klaipėda, Šiauliai, Panevėžys), only buses are available. There is no subway or local railroad anywhere, which means that the Lithuanian urban public transportation is relatively slow.
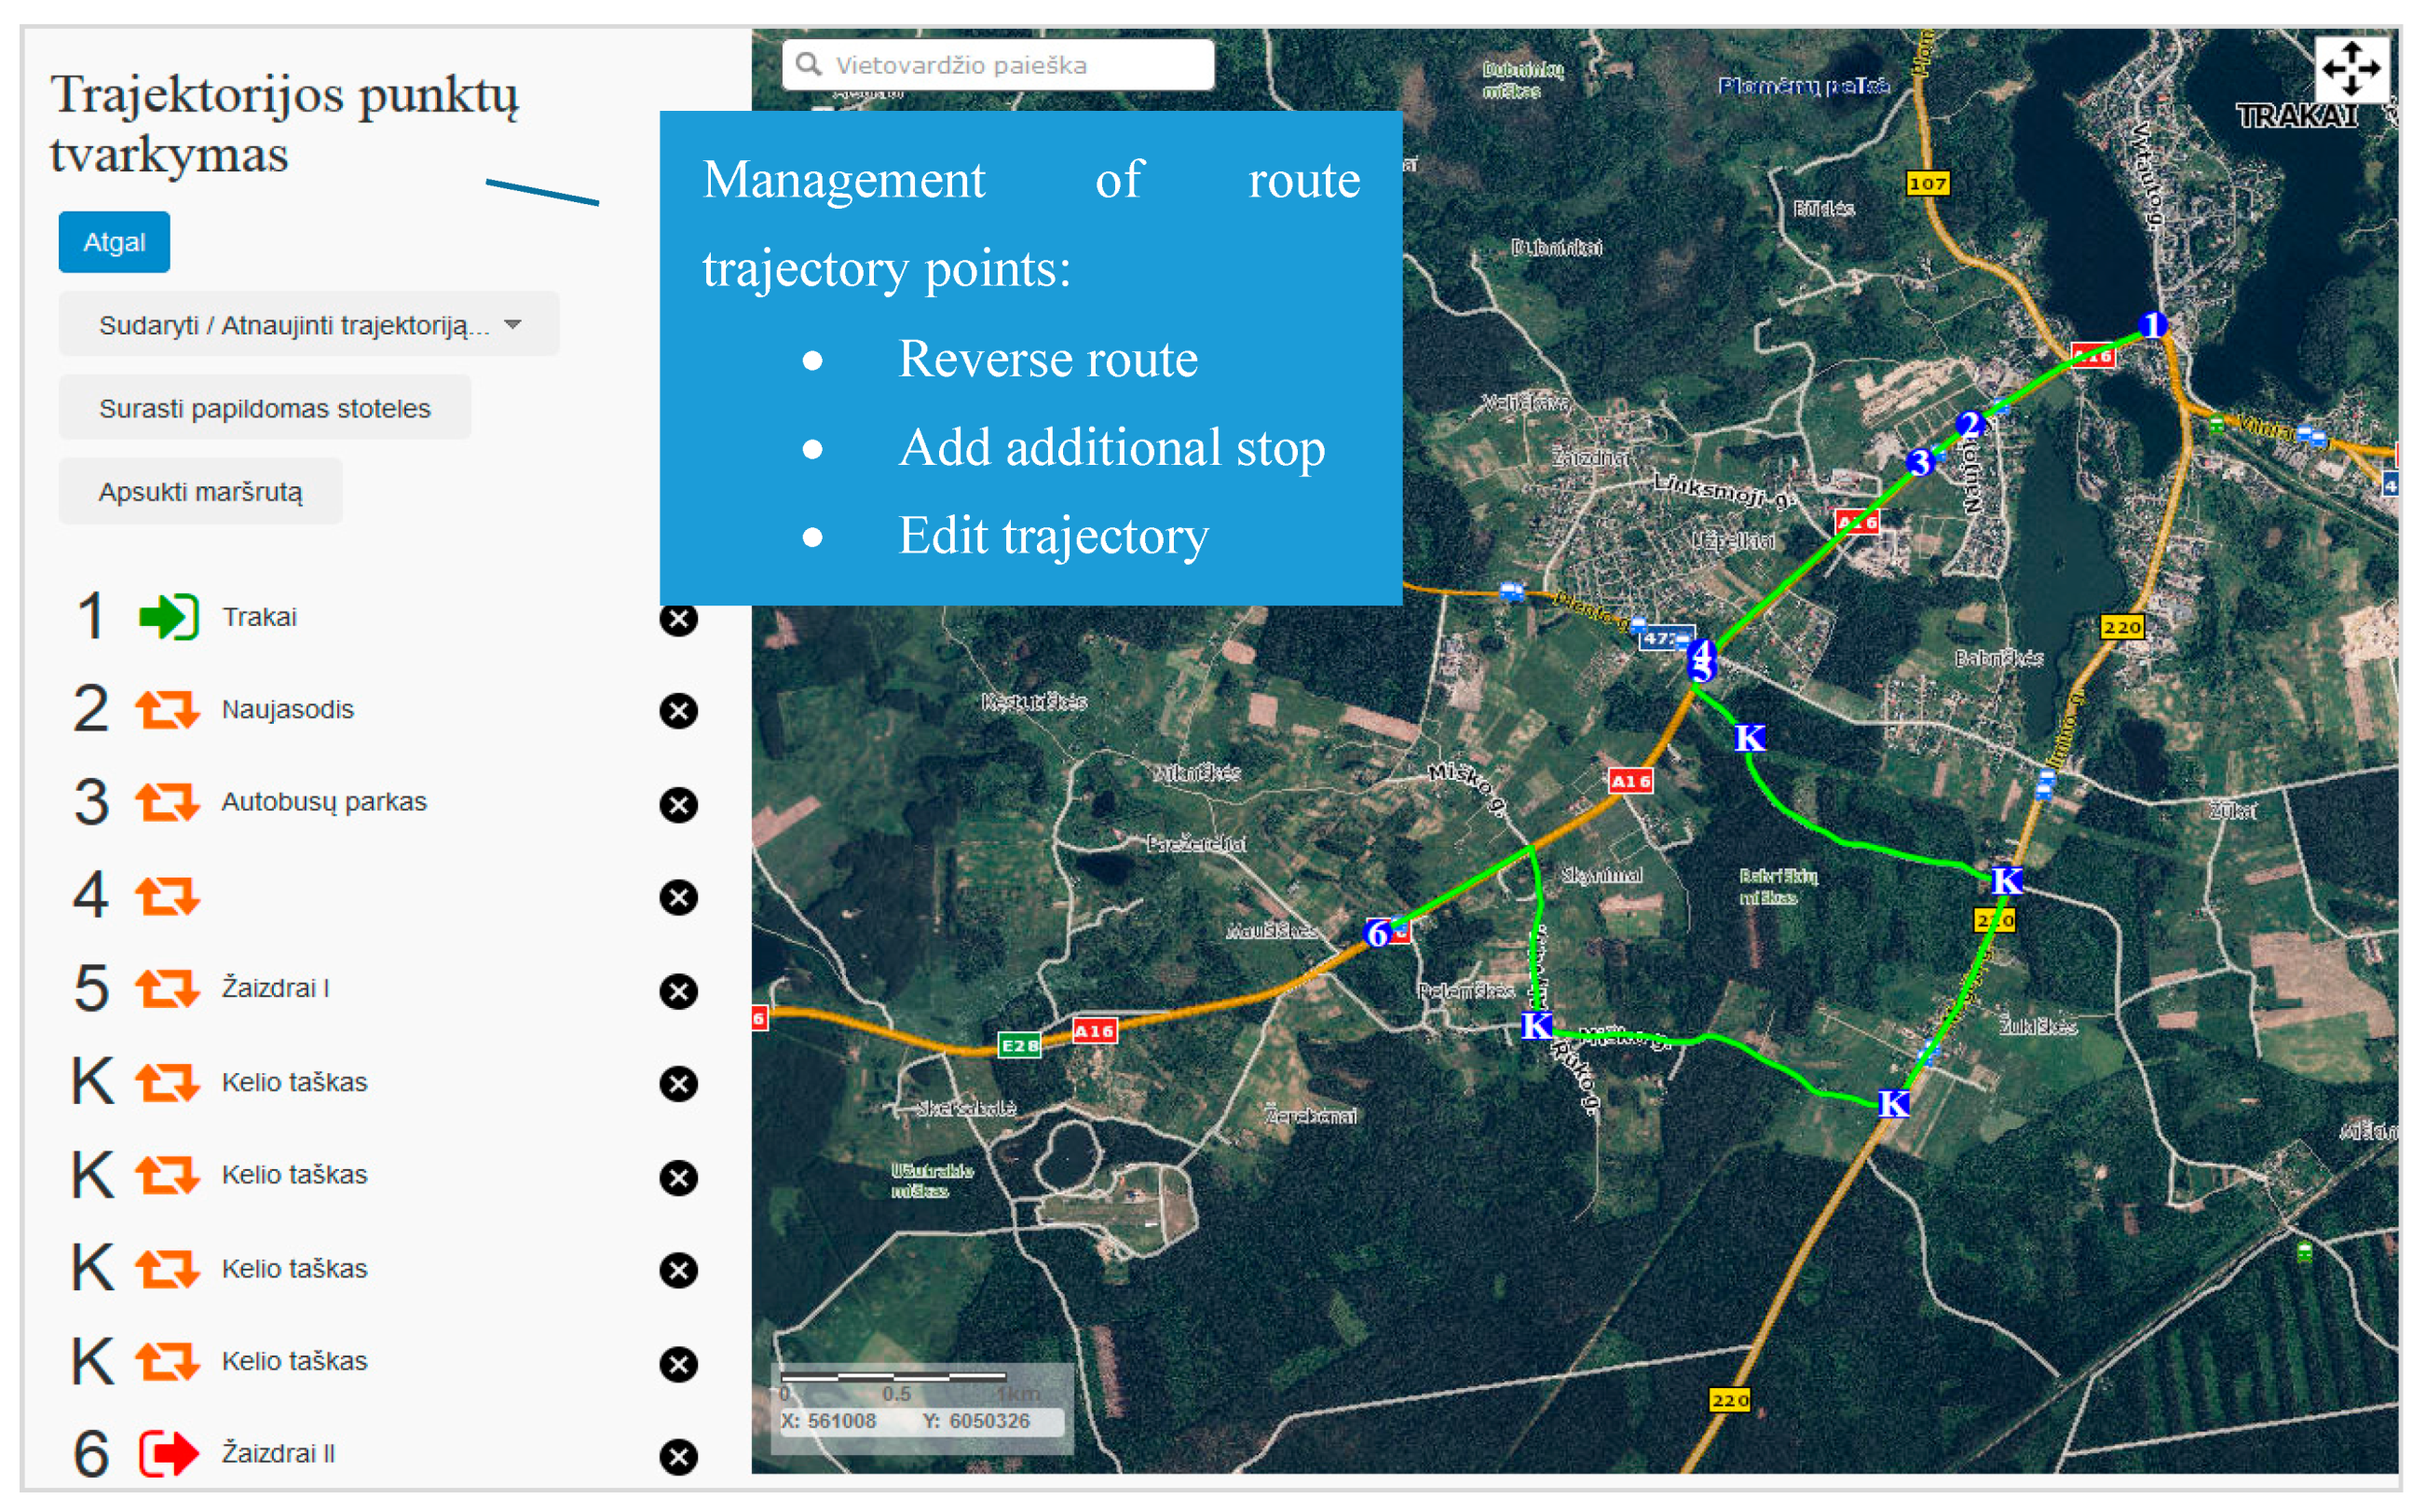
VINTRA is our developed Lithuanian information system for travelers and has two portals: internal and external. The internal portal is used for people who are responsible for creating and maintaining the public transport routes and schedules. The main role of the internal portal is to capture and store data on the public transport routes and timetables in a centralized database. Prior to its development, all VINTRA public transport service stored public transport routes and timetables in their own databases without any data synchronization among separate databases. For this reason, the timetables of different agency routes were not synchronized. Data from the central VINTRA database is used to provide optimal trip calculations in an external portal. On the contrary, the internal portal has a digital map function to plan and design the public road transport routes within the Lithuanian road and street network. The ESRI ArcGIS Network was designed with the ArcGIS Network Analyst Extension. The network parameters (such as restricted turns and one-way streets) were adopted for public transport, because there are places where turns are forbidden for private cars, but these are allowed for public transport. When the system operator wants to design a new public transport route or correct the existing one, he performs route planning from point A to point B and gets the route trajectory on the digital map.
Figure 1 shows the internal portal with route lines and collected stops in the neighborhood. When using GIS data in the internal portal, the operator can change the suggested route trajectory, add stops, and make entries on time schedule data (arrival times, departure times, different schedule exceptions related to holidays, etc.).
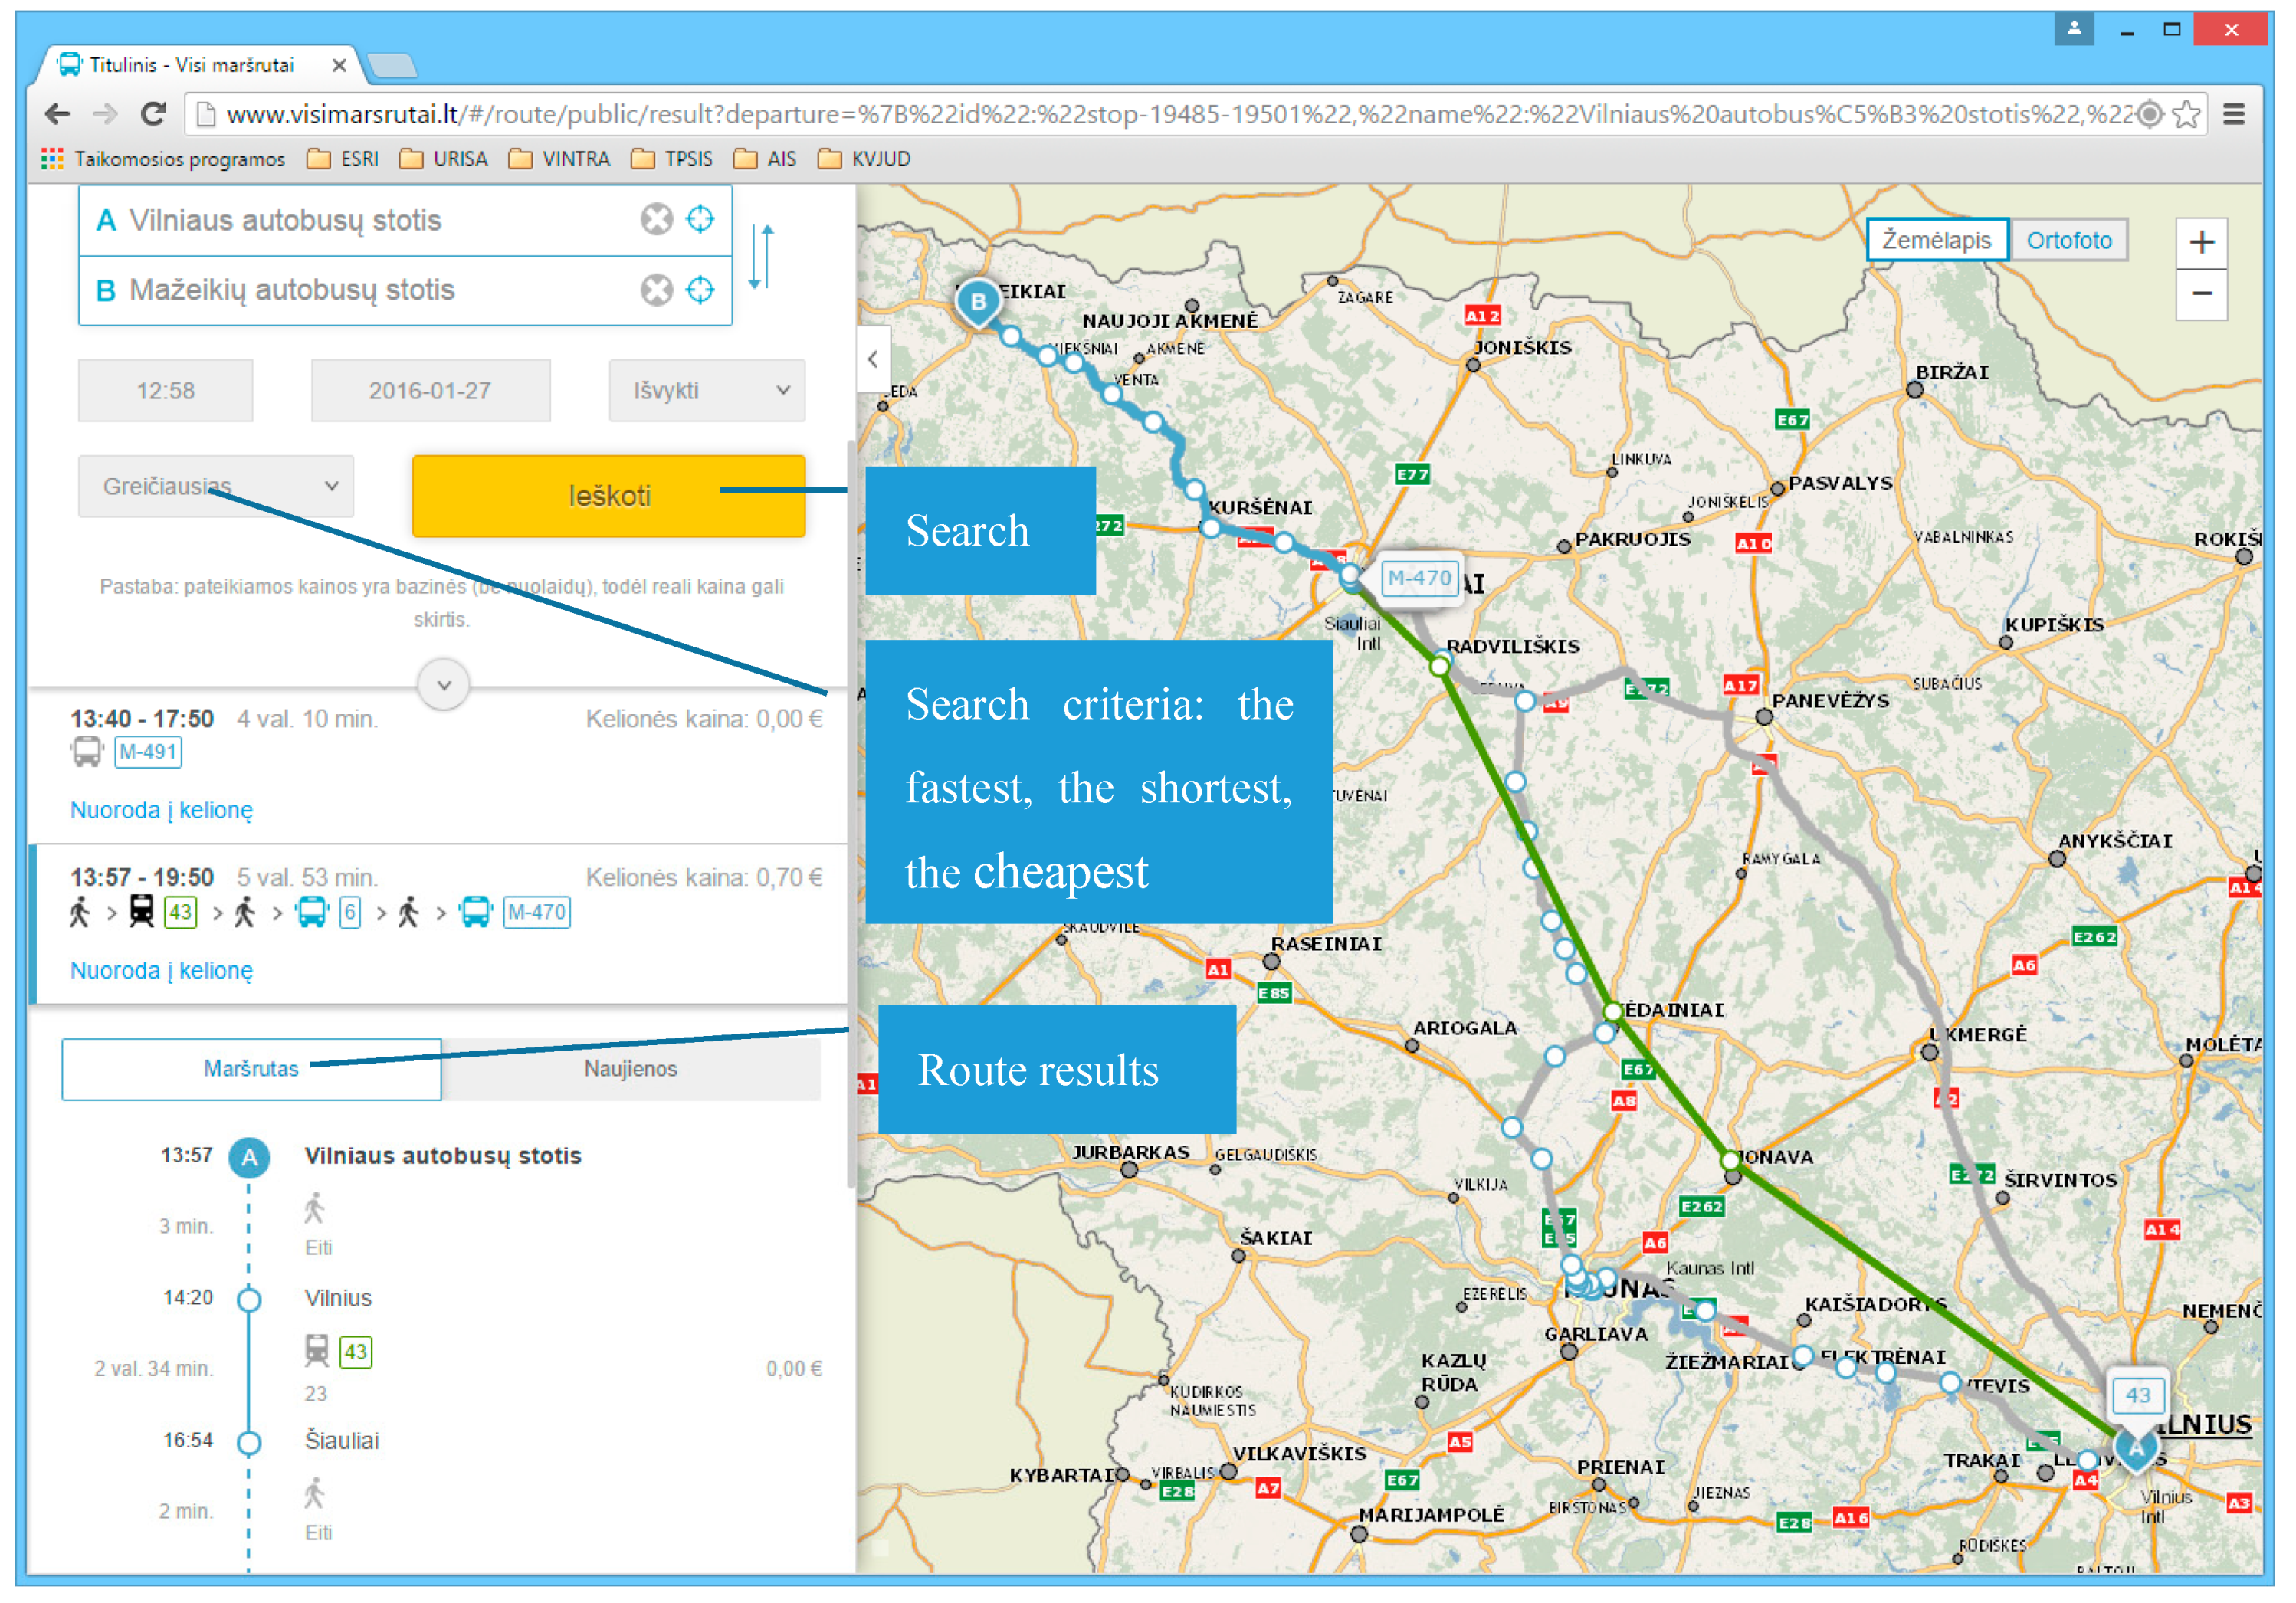
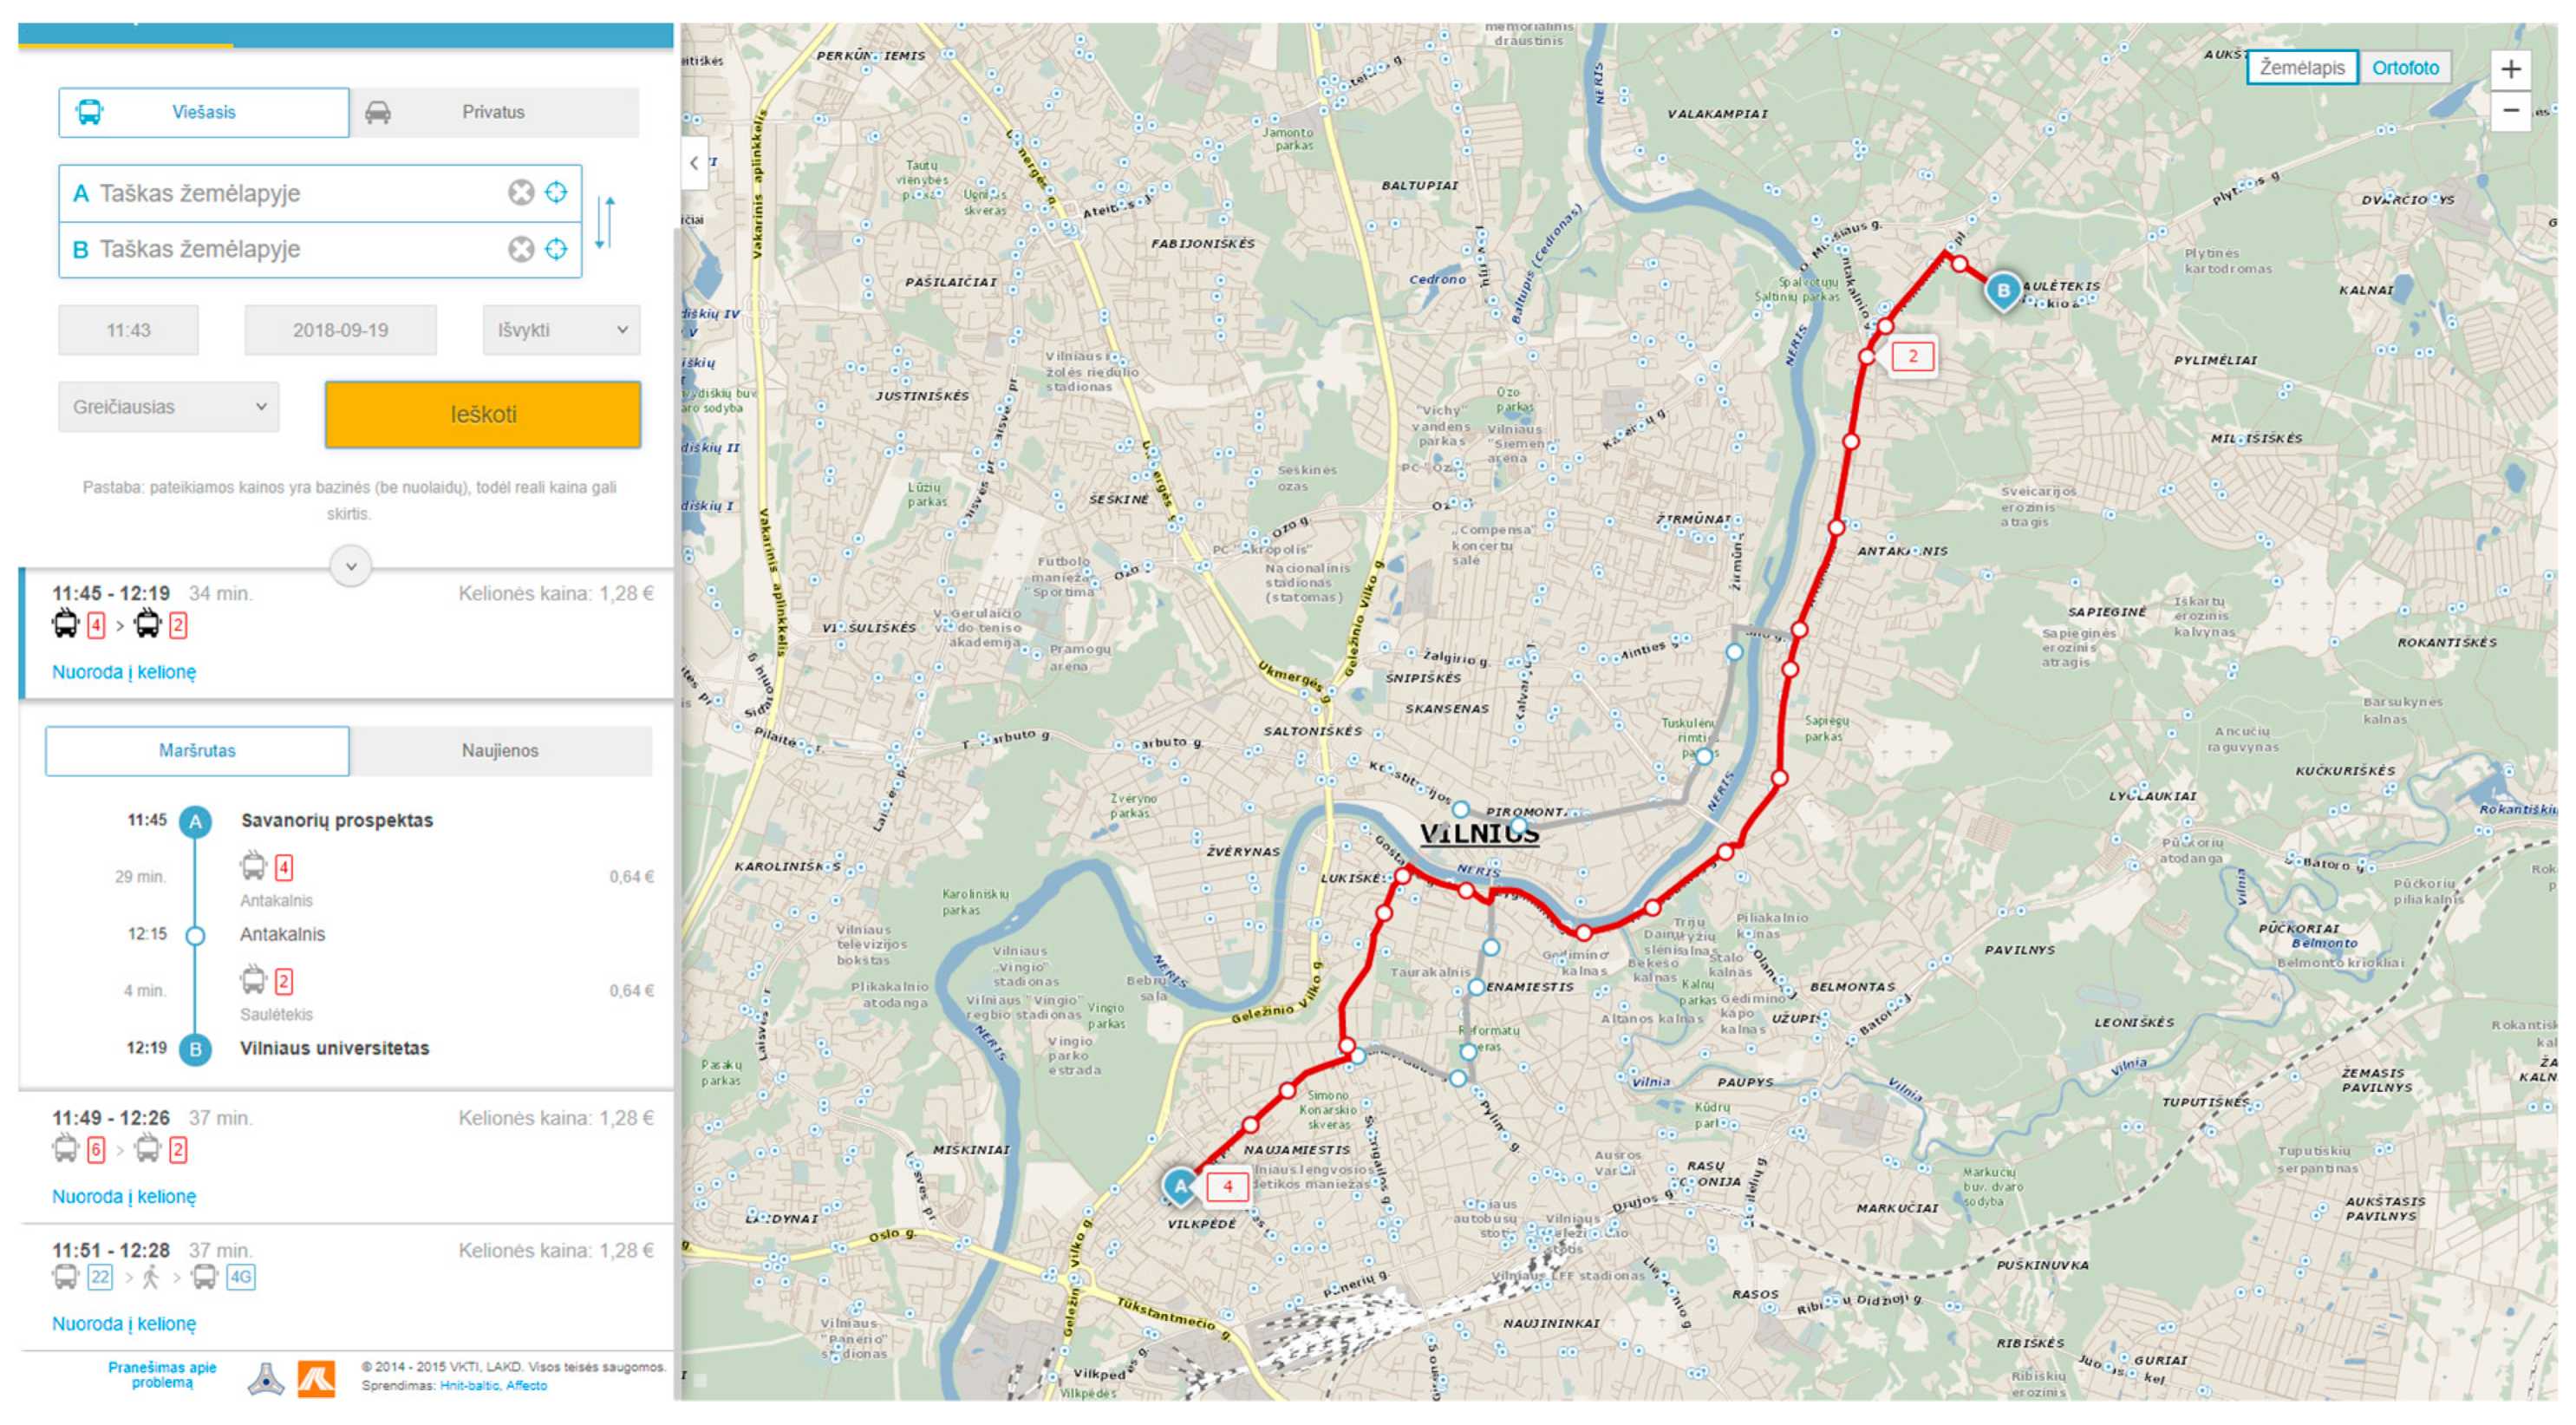
A web interface has been implemented in order to access the public transport trip planner on the external web portal. This interface is a part of VINTRA system external web portal and is dedicated to public transport trip planning and visualization.
Travelers need to enter data such as the location, destination of the trip, departure or arrival time, maximum possible transfers, maximum walking distance, and transport mode. The user can also select the desirable mode of public transportation (bus, trolley bus, train, airplane, ship, or ferry) or make a combination of different modes. Furthermore, the traveler may select the quickest, cheapest, or shortest route, or the one with a limited number of transfers. The planned trip includes instructions to reach the destination with all transit details, the total distance, the expected trip fare, and the arrival time. The trip route for each travel event is displayed with intermediate stops on the map using ESRI ArcGIS technology. The interface of the Lithuanian information system for travelers (external VINTRA portal) is presented in
Figure 2. This was designed for the search and planning of routes using multimodal public transportation.
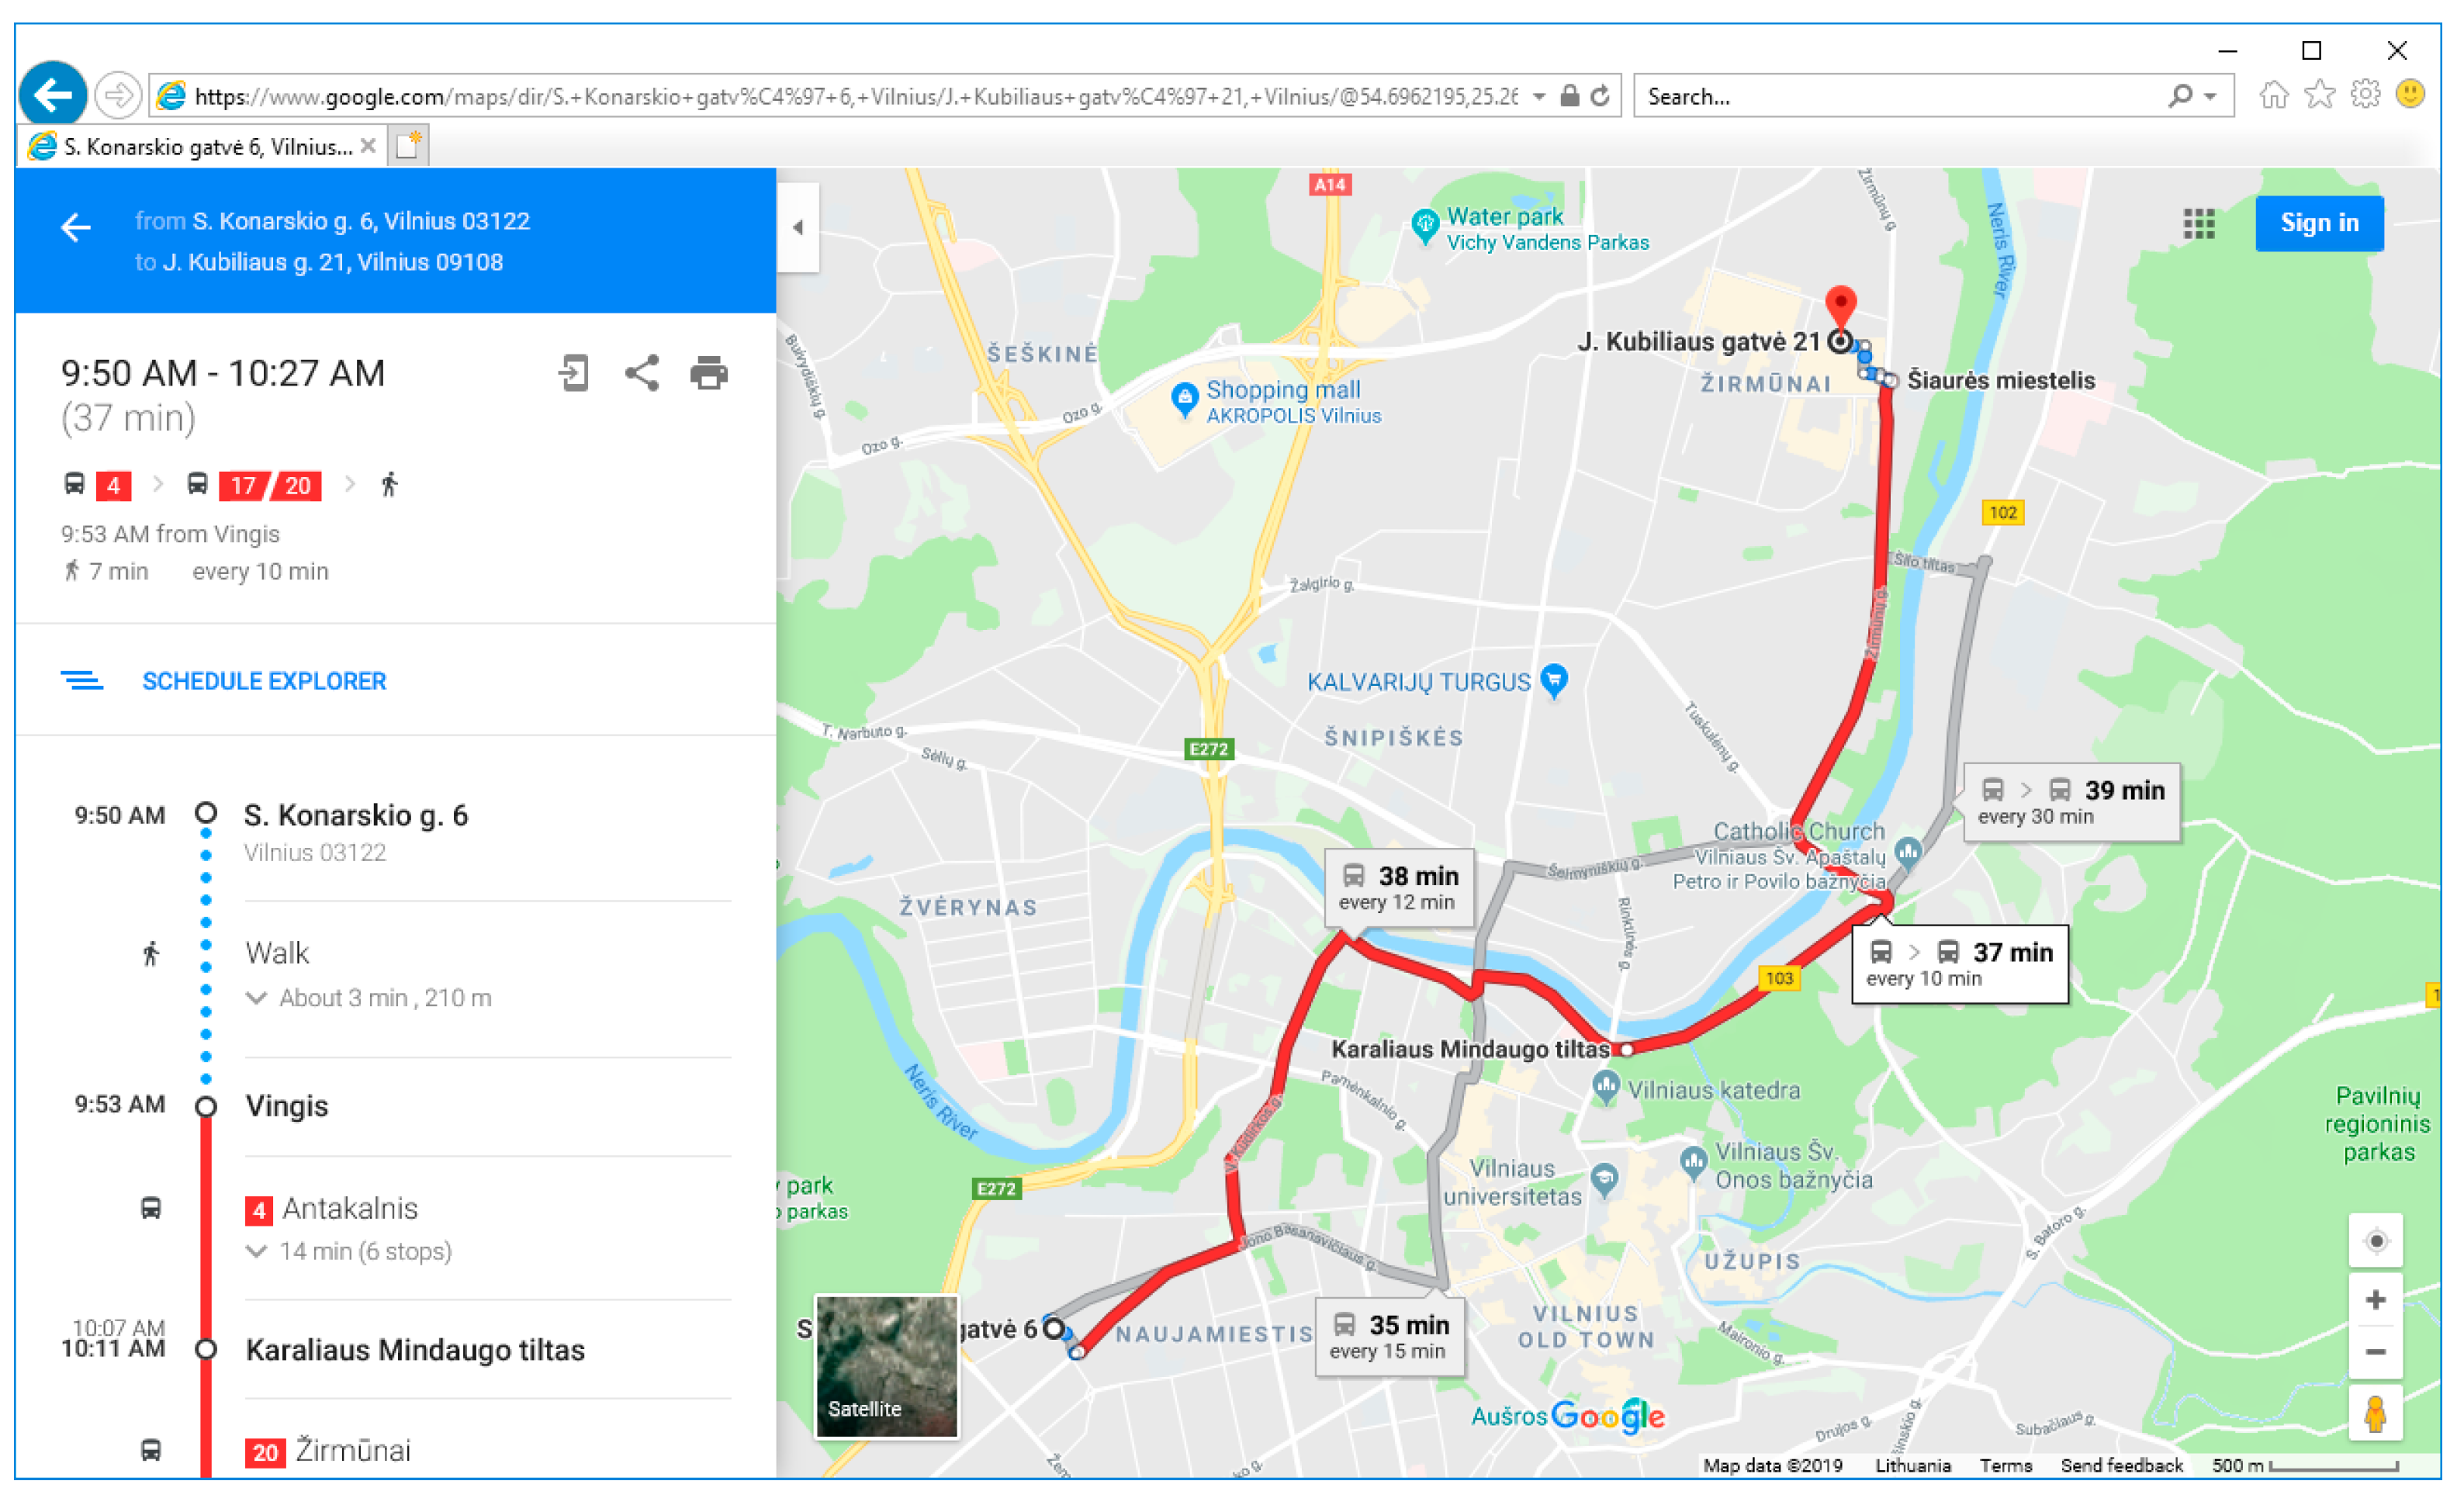
The system has the ability to maintain public transport data provided by GTFS specification. It can show the data according to GTFS specifications for different territorial degrees, or separately for each municipality, or indeed for the whole country. Provided GTFS data are used by third parties in order to develop different transport applications (web, mobile) or other information products related to this kind of data. Public transport GTFS data for Vilnius city was provided from the VINTRA system to Google, Inc. The Vilnius GTFS feed was successfully implemented for the planning of transit routes (see in
Figure 3).
3. Description of the VINTRA Public Transport Trip Planning Algorithm
The trip planner is responsible for search of optimal trips with alternatives in the transit network. When the user enters search parameters and the origin and destination points on the web map, the system begins generation of the trip plan. The algorithm for the plan search looks for reachable nodes from the origin node. After that, it visits each of these nodes one by one. Again, from these nodes, it looks for all possible reachable nodes and records them in order. This process works until the destination node is found.
The public transport network can be represented by a graph with nodes (public transport stops) and edges (public transport route lines between the pair of stops).
The public transit trip planning module of the Lithuanian information system is mathematically modeled as an augmented variant of Dijkstra. This method was combined with the basic weighted Dijkstra method for a better visualization of pedestrian paths and to avoid the visualization of paths by straight lines. This method is used for the calculation of pedestrian paths in areas near the trip origin, destination points, and in those areas where there are transfers at different public transport stops. The weighted Dijkstra method was used for pedestrian path calculation where the traveler performs a transfer to change public transport mode when going to/from a concrete address to a public transport stop. The classic Dijkstra’s algorithm solves the single-source, shortest-path problem on a weighted graph. Dijkstra’s algorithm maintains a set of junctions
S in order to find the shortest path from a starting location
s to a destination location
d, whose final shortest path from
s has already been computed. The algorithm repeatedly finds a junction in the set of junctions that has the minimum shortest-path estimate, adds it to the set of junctions
S, and updates the shortest-path estimates of all neighbors of this junction that are not in
S. The algorithm continues until the destination junction is added to
S. The weighted Dijkstra method was used instead of the traditional Dijkstra method, because the weight of the walking time was used to calculate walking routes in the trip planner. Each line edge in the pedestrian network has an average walking time, and this attribute was used for the calculation of optimal walking routes. The following weights were used on the graph edges to calculate public transport routes: passing time, distance, and cost. Details of the proposed mathematical model are presented in
Section 6.
Periodically, public transport routes and timetable data are synchronized into the adopted format of OD matrixes. The module of trip planning calculations uses these special adopted and simplified data. The periodical system creates a graph, which connects the timetabled trips by all possible trips. The graph is constructed according to public transport timetable data. The graph includes all possible connections between stops with public transport arrival and departure times. This graph is used to calculate public transport trips from one public transport stop to another.
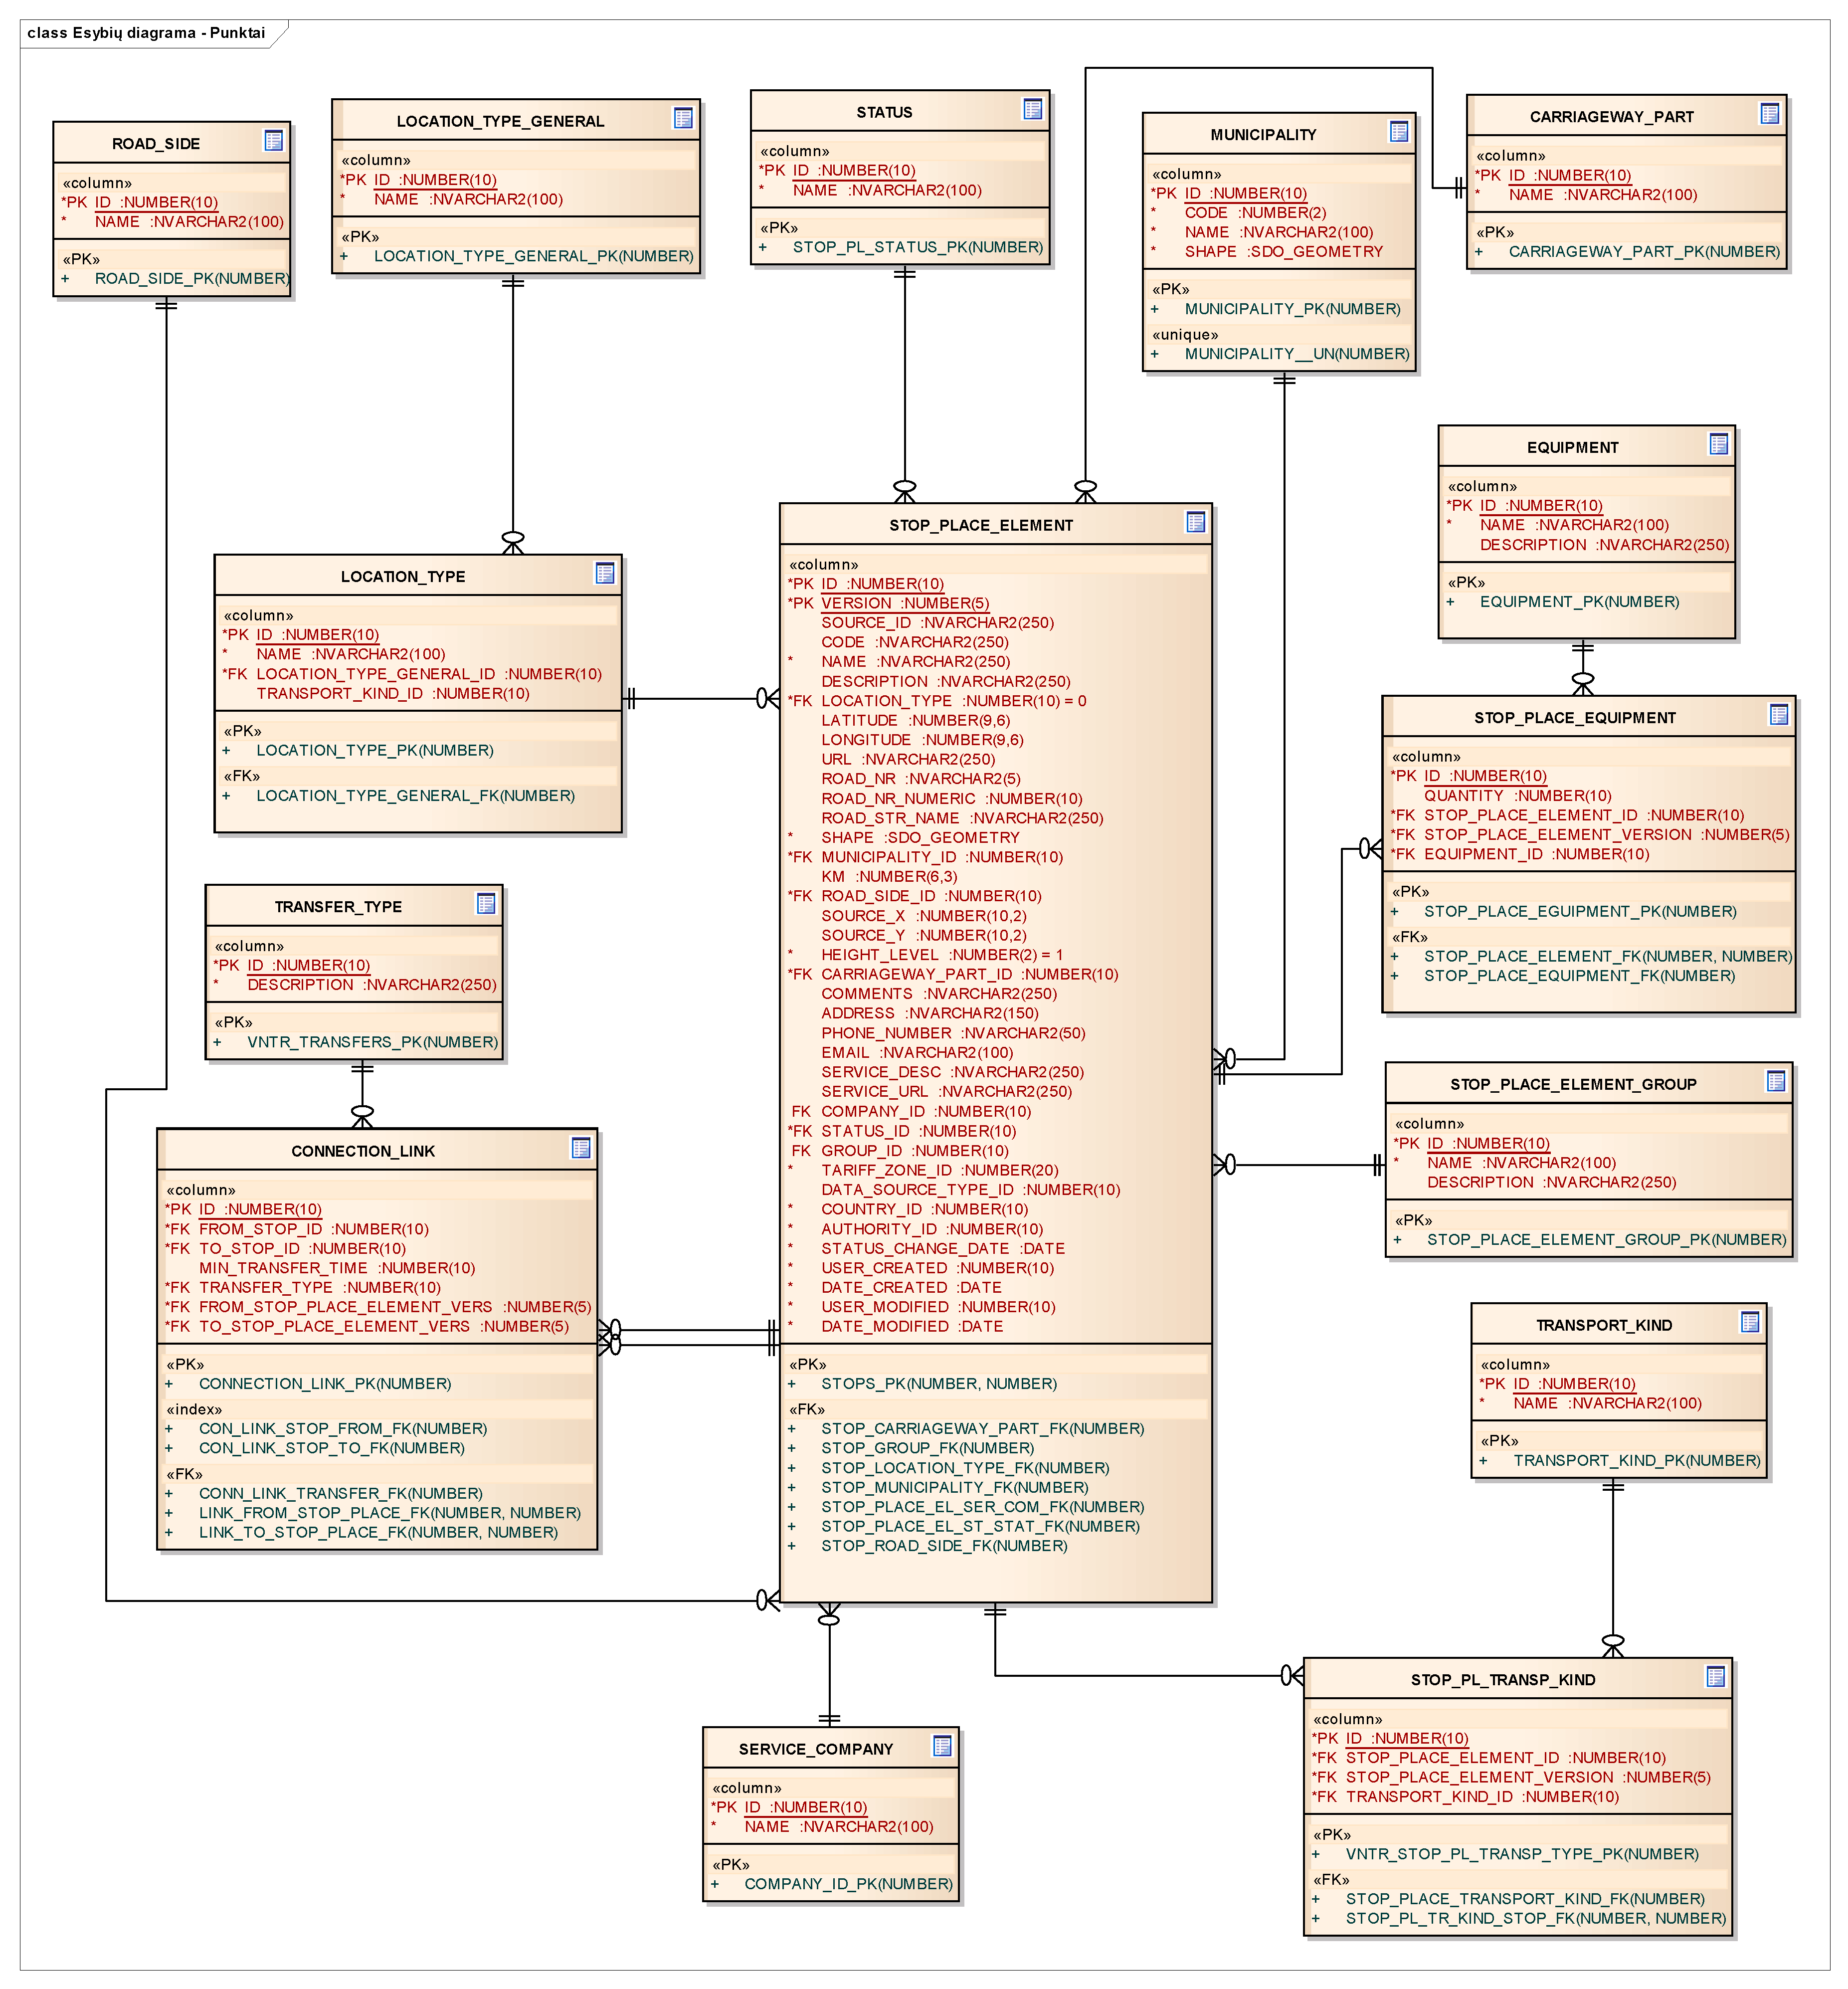
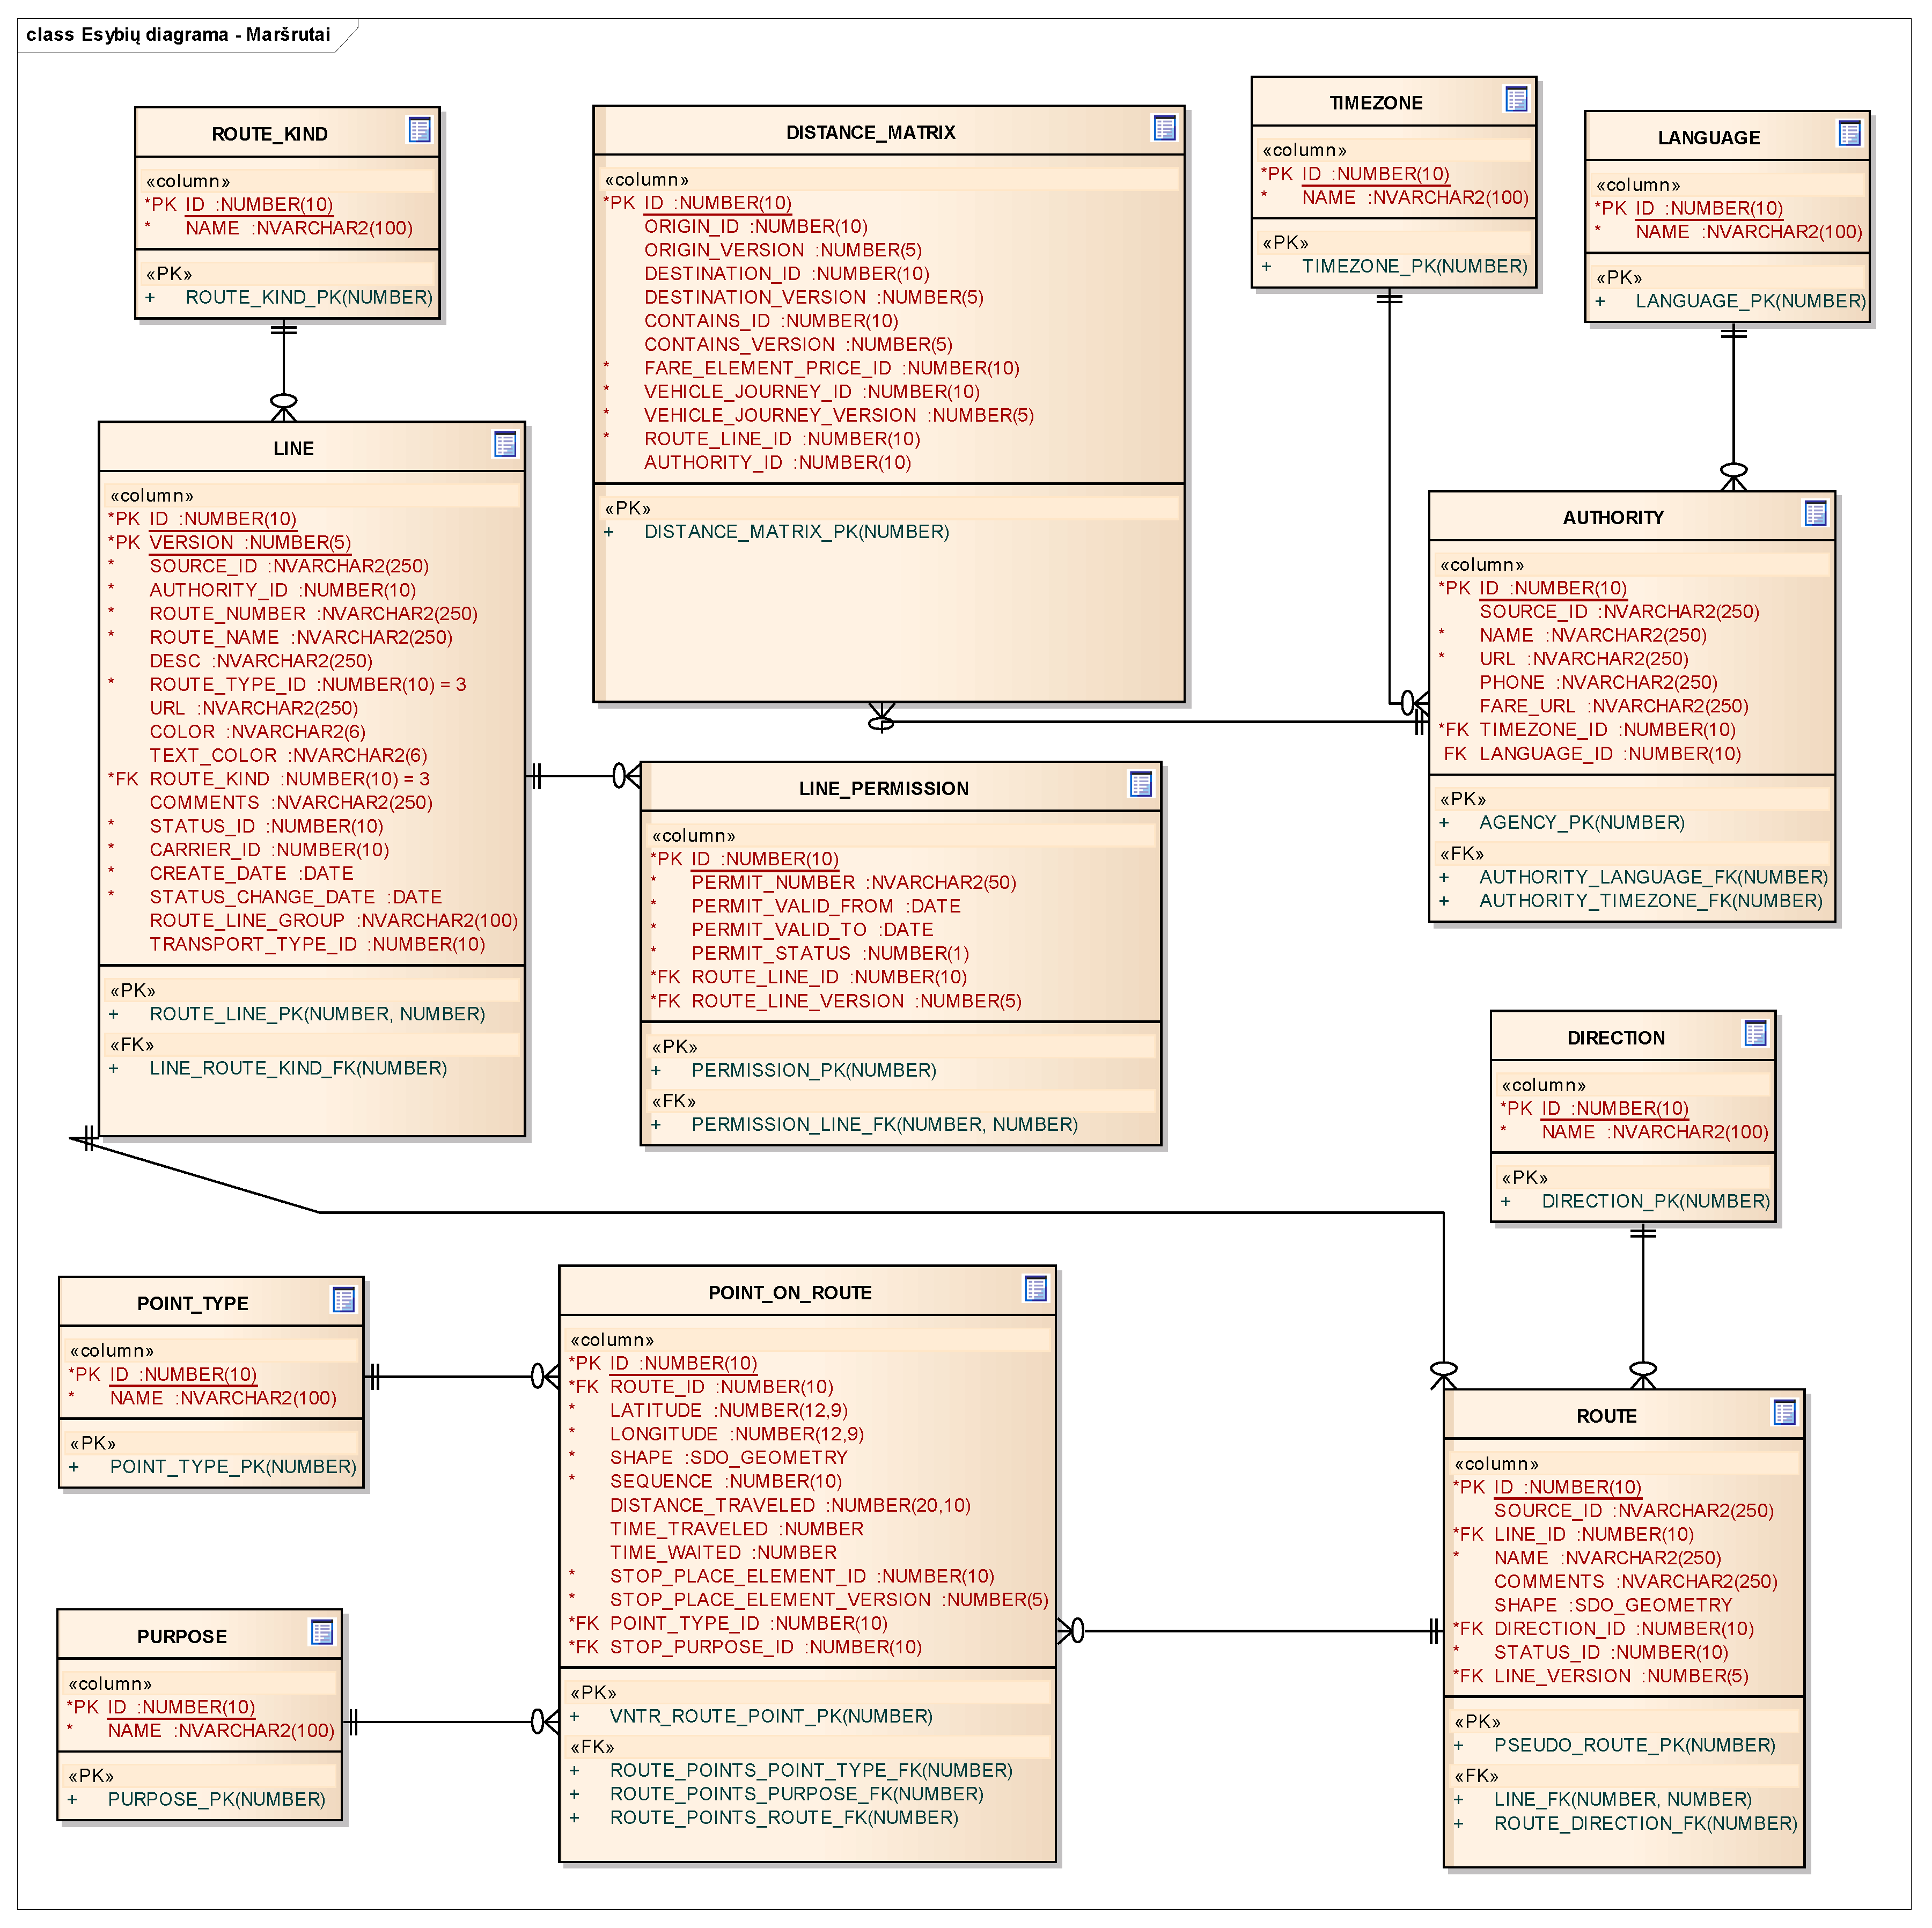
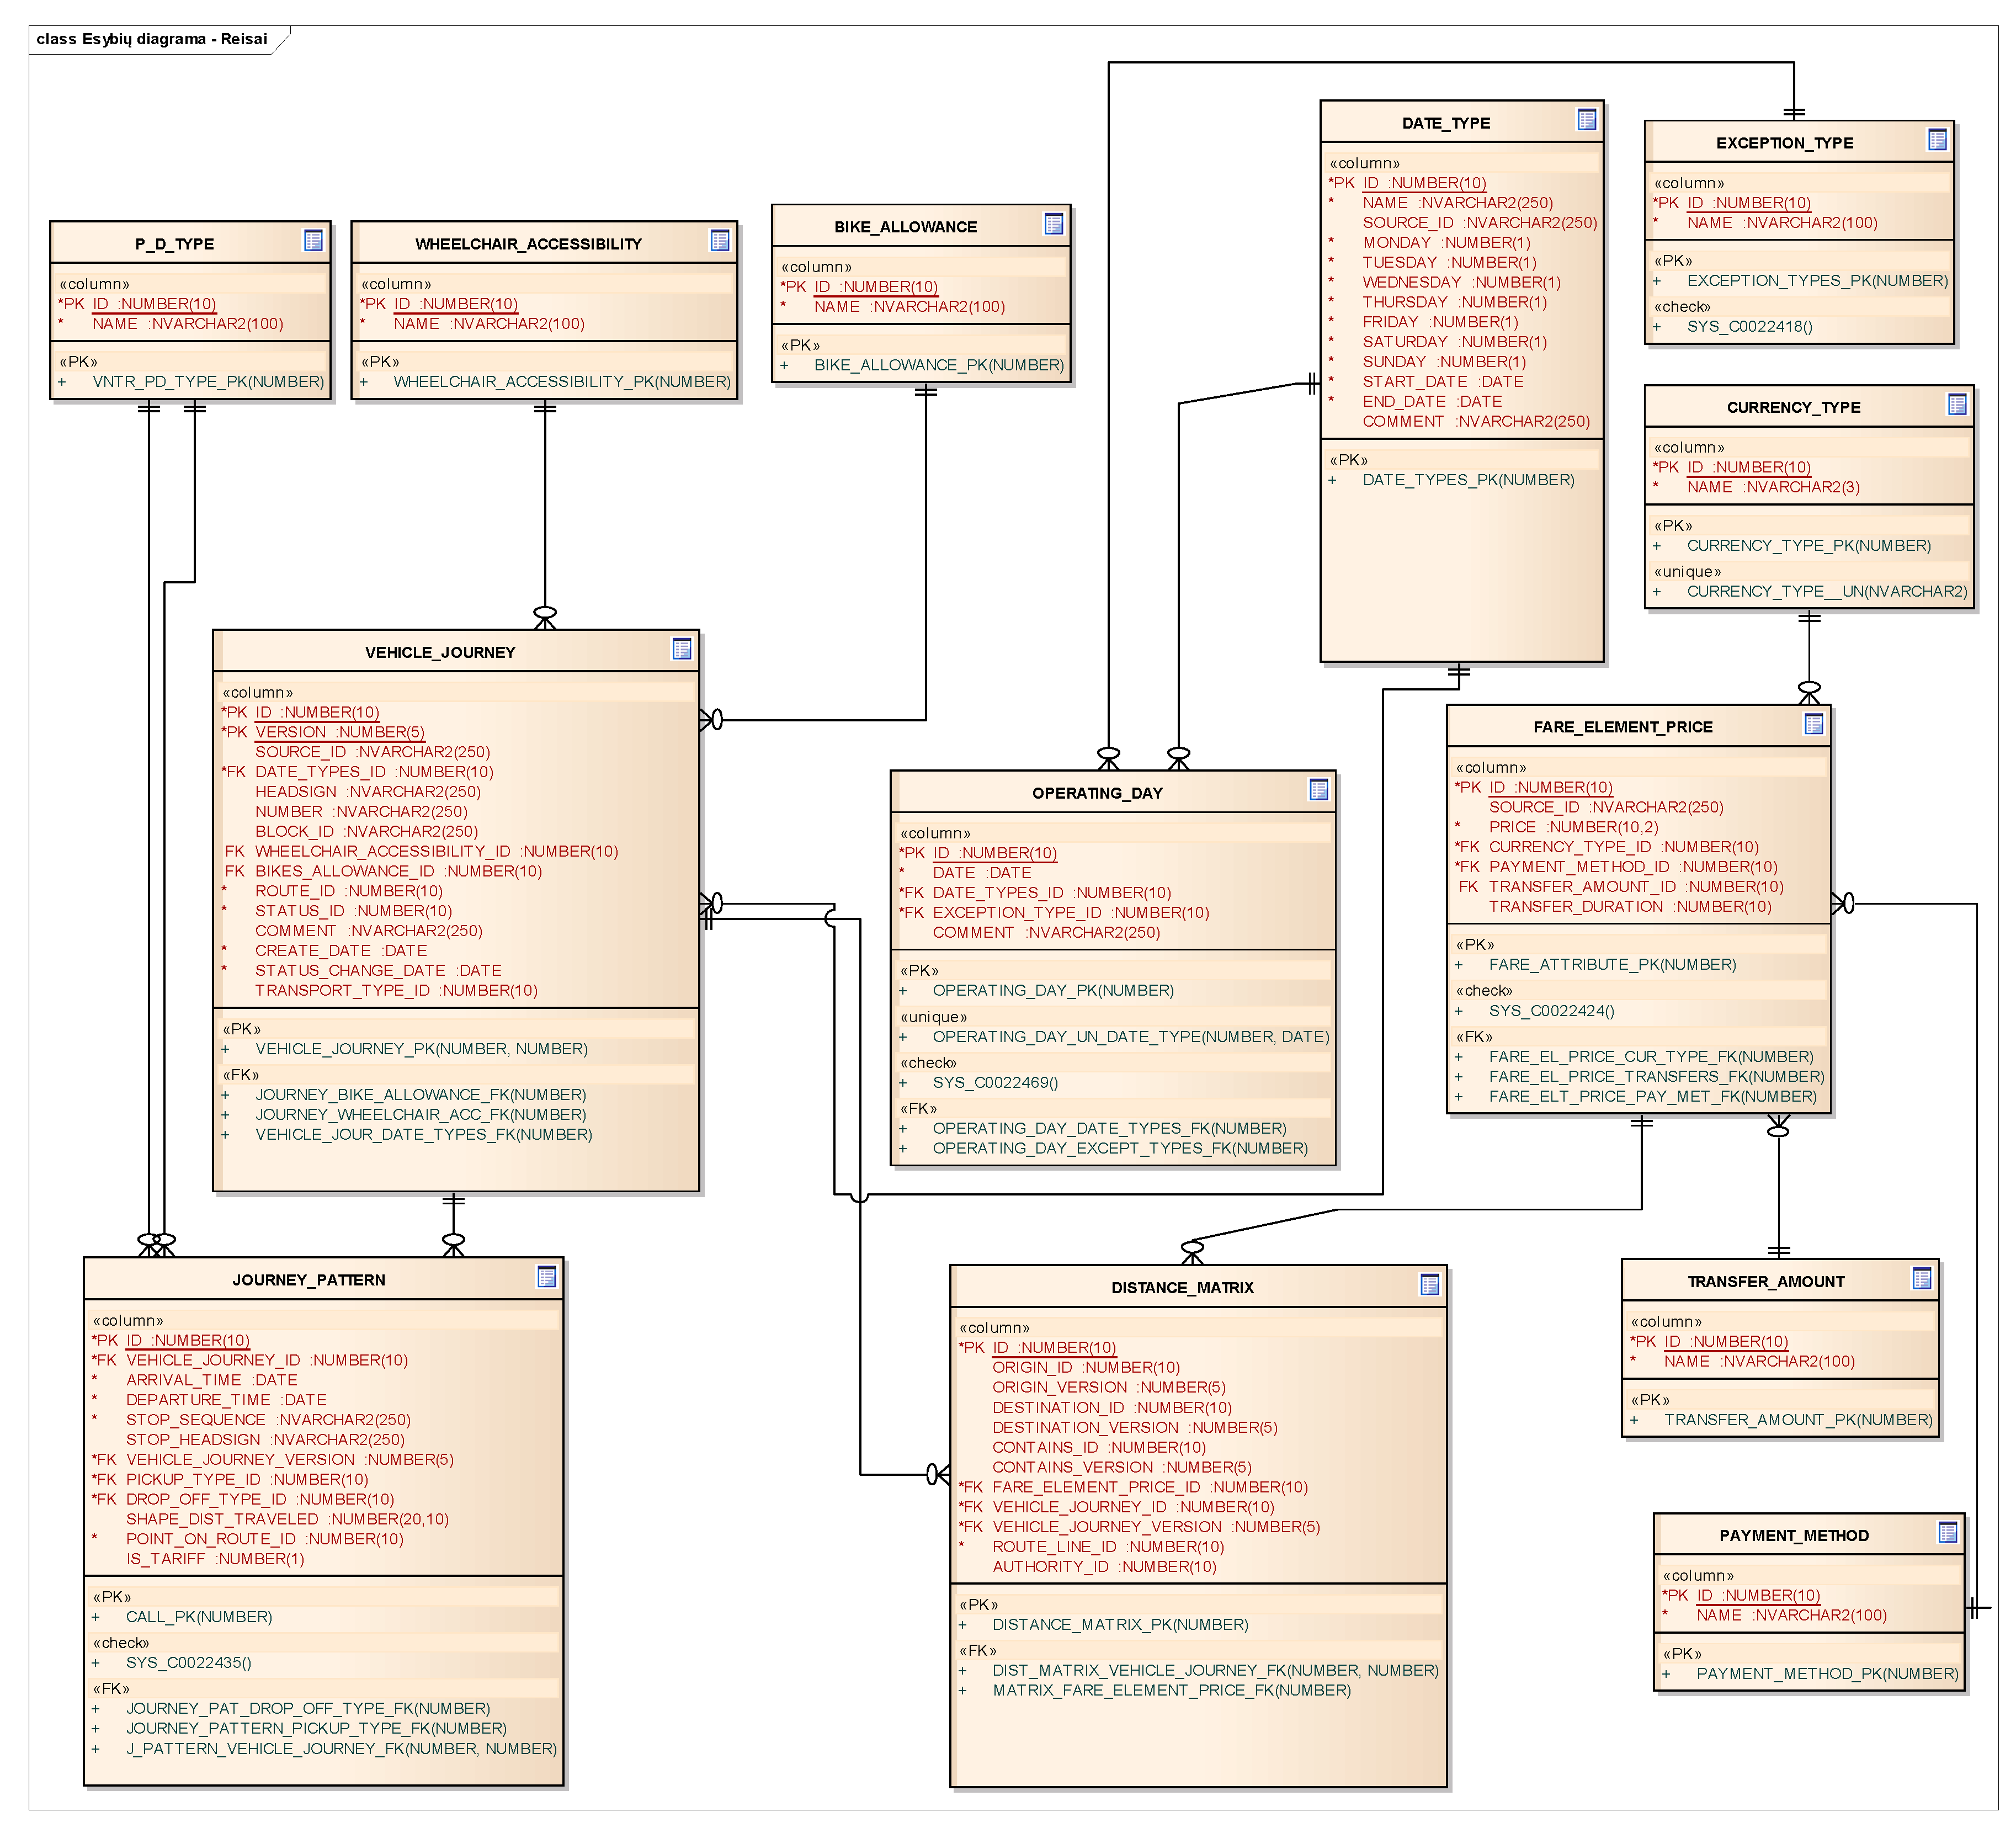
4. Data Model of the VINTRA Trip Planner
The public transport trip planner works with transport data, which is stored according to the TRANSMODEL specifications and data model. These data have the main entities of stops, routes, and trips, according to the TRANSMODEL specifications; these entities are named
stop_place_element, line and
vehicle_journey (see
Figure 4,
Figure 5 and
Figure 6).
The element route has a shape field. This entity is responsible for storage of the geometry of public transport routes. As geometry is stored, the trip planner can visualize and perform calculations according to the real trajectory of public transport routes.
Public transport routes and the data scheduler are created and edited in an internal portal, which is delivered only for dedicated users. This dataset is stored in the central VINTRA geodatabase.
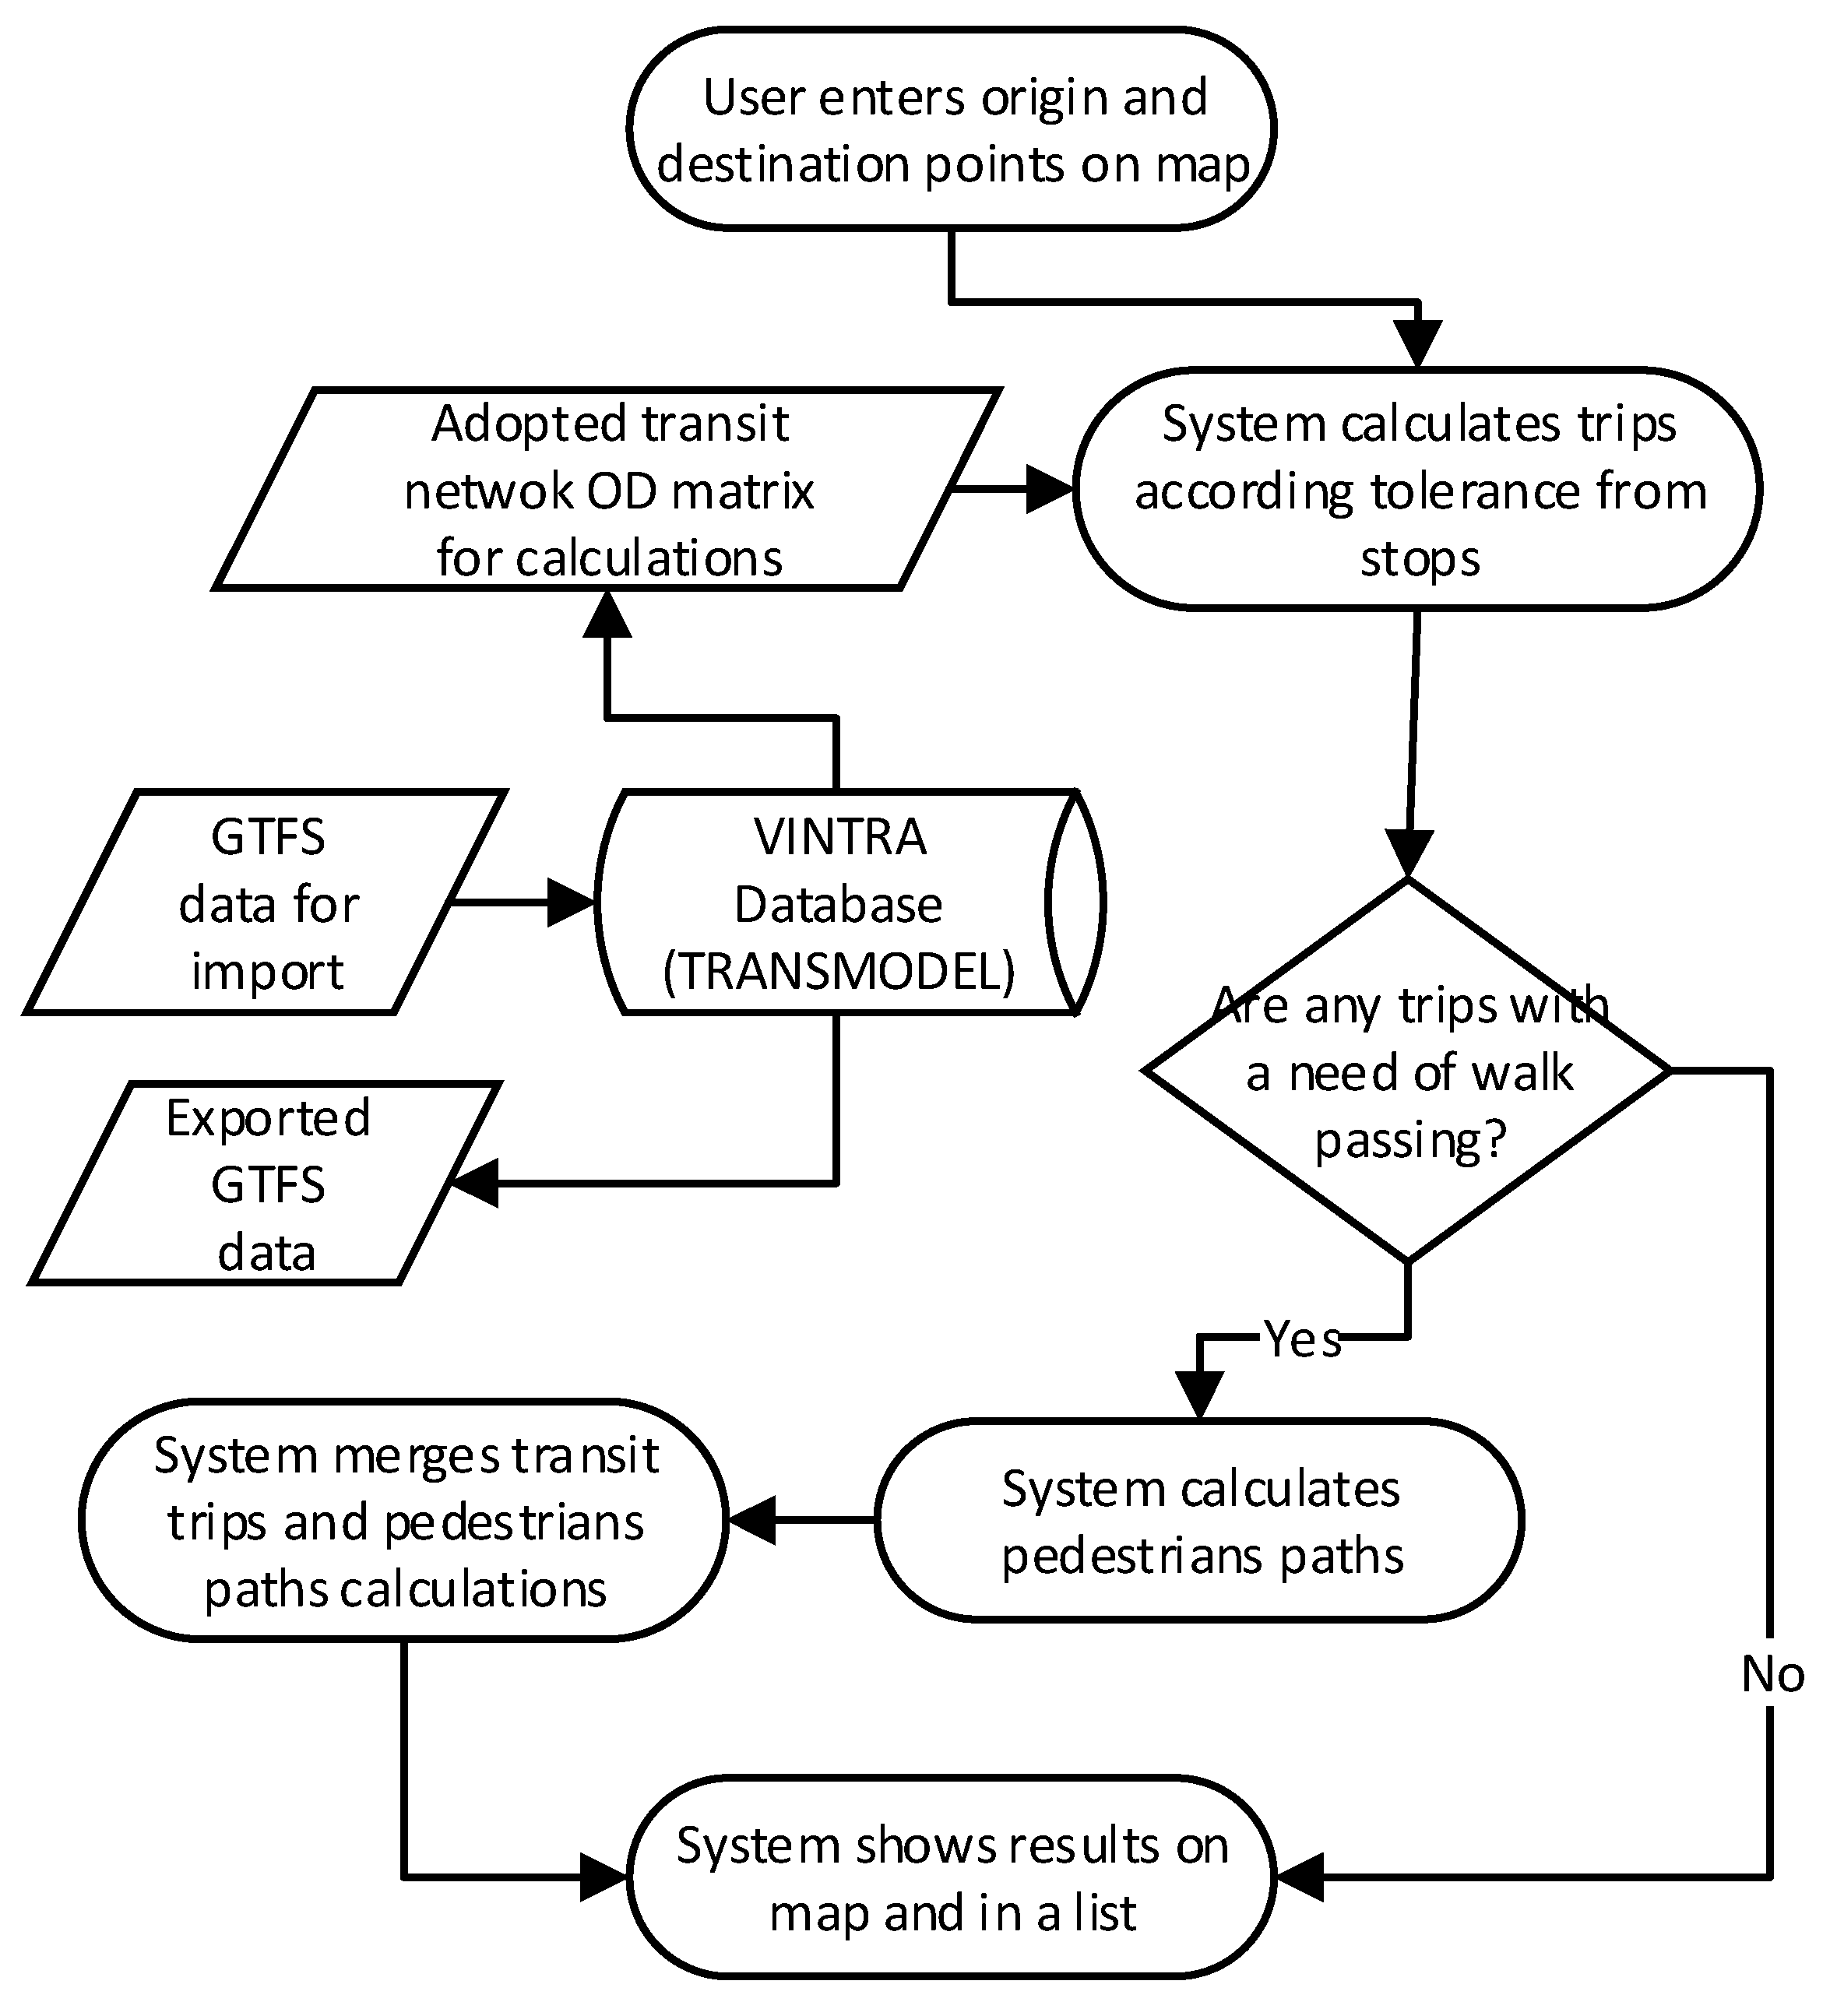
Figure 7 presents the logical model of trip planner performance is presented with the description of the processes of public transit data preparation and data exchange availability.
5. Logical Model of the VINTRA Trip Planner
The user of the external portal enters the trip origin (A) and destination (B) points. The system performs trip calculations according to the parameters, the maximum possible search tolerance from points A and B to public transport stops, and, if possible, the results of the return trip. The administrator of the system can control the mode of alternatives of the return trip by (a) allowing alternative trips on the same route (in this case, the system can return alternatives on the same route with the next departure time), or (b) not allowing alternative trips on the same route (in this case, the system returns the trip alternatives which go on the different public transport routes).
The calculation begins when the user enters the origin and destination points. The first iteration identifies graph edges which connect these two points. The edges in the potential path area can be selected. The potential path area is controlled according to the extent to which the origin and destination points plus the additional buffer surrounding this area are displayed. The distance of the additional buffer is a system parameter. When the edges are identified, the system performs further calculations, including the determination of timetable data.
The route calculation module has the possibility of controlling the time gap between the departure time and the real time when the trip starts. When this time gap is bigger than the system parameters, the calculation module does not return the result. The number of returned alternatives, the mode of alternatives, and the parameter of time gap control are described as configuration parameters.
The trip calculation module consists of two parts: the first is the calculation of the optimal trip by public transport between public transport stops; the second is the calculation of pedestrian paths at intersections and paths from the trip start and end to public transport stops. When the calculation module gets the results of the public transport trip, this module checks whether walking is required (to change public transport stops or to walk from/to a stop). This can occur when the origin and destination points are not exactly located at public transport stops or when a transfer from one public transport route to another starts and ends at different stops. If the module finds a need for walking, it calculates a pedestrian route using the road and street network data. Finally, the results of public transport trips and those of pedestrian paths are merged for visualization in digital map purposes.
This allows a good visualization effect of the digital map when pedestrian paths are visualized not by straight lines but by lines that follow streets and roads.
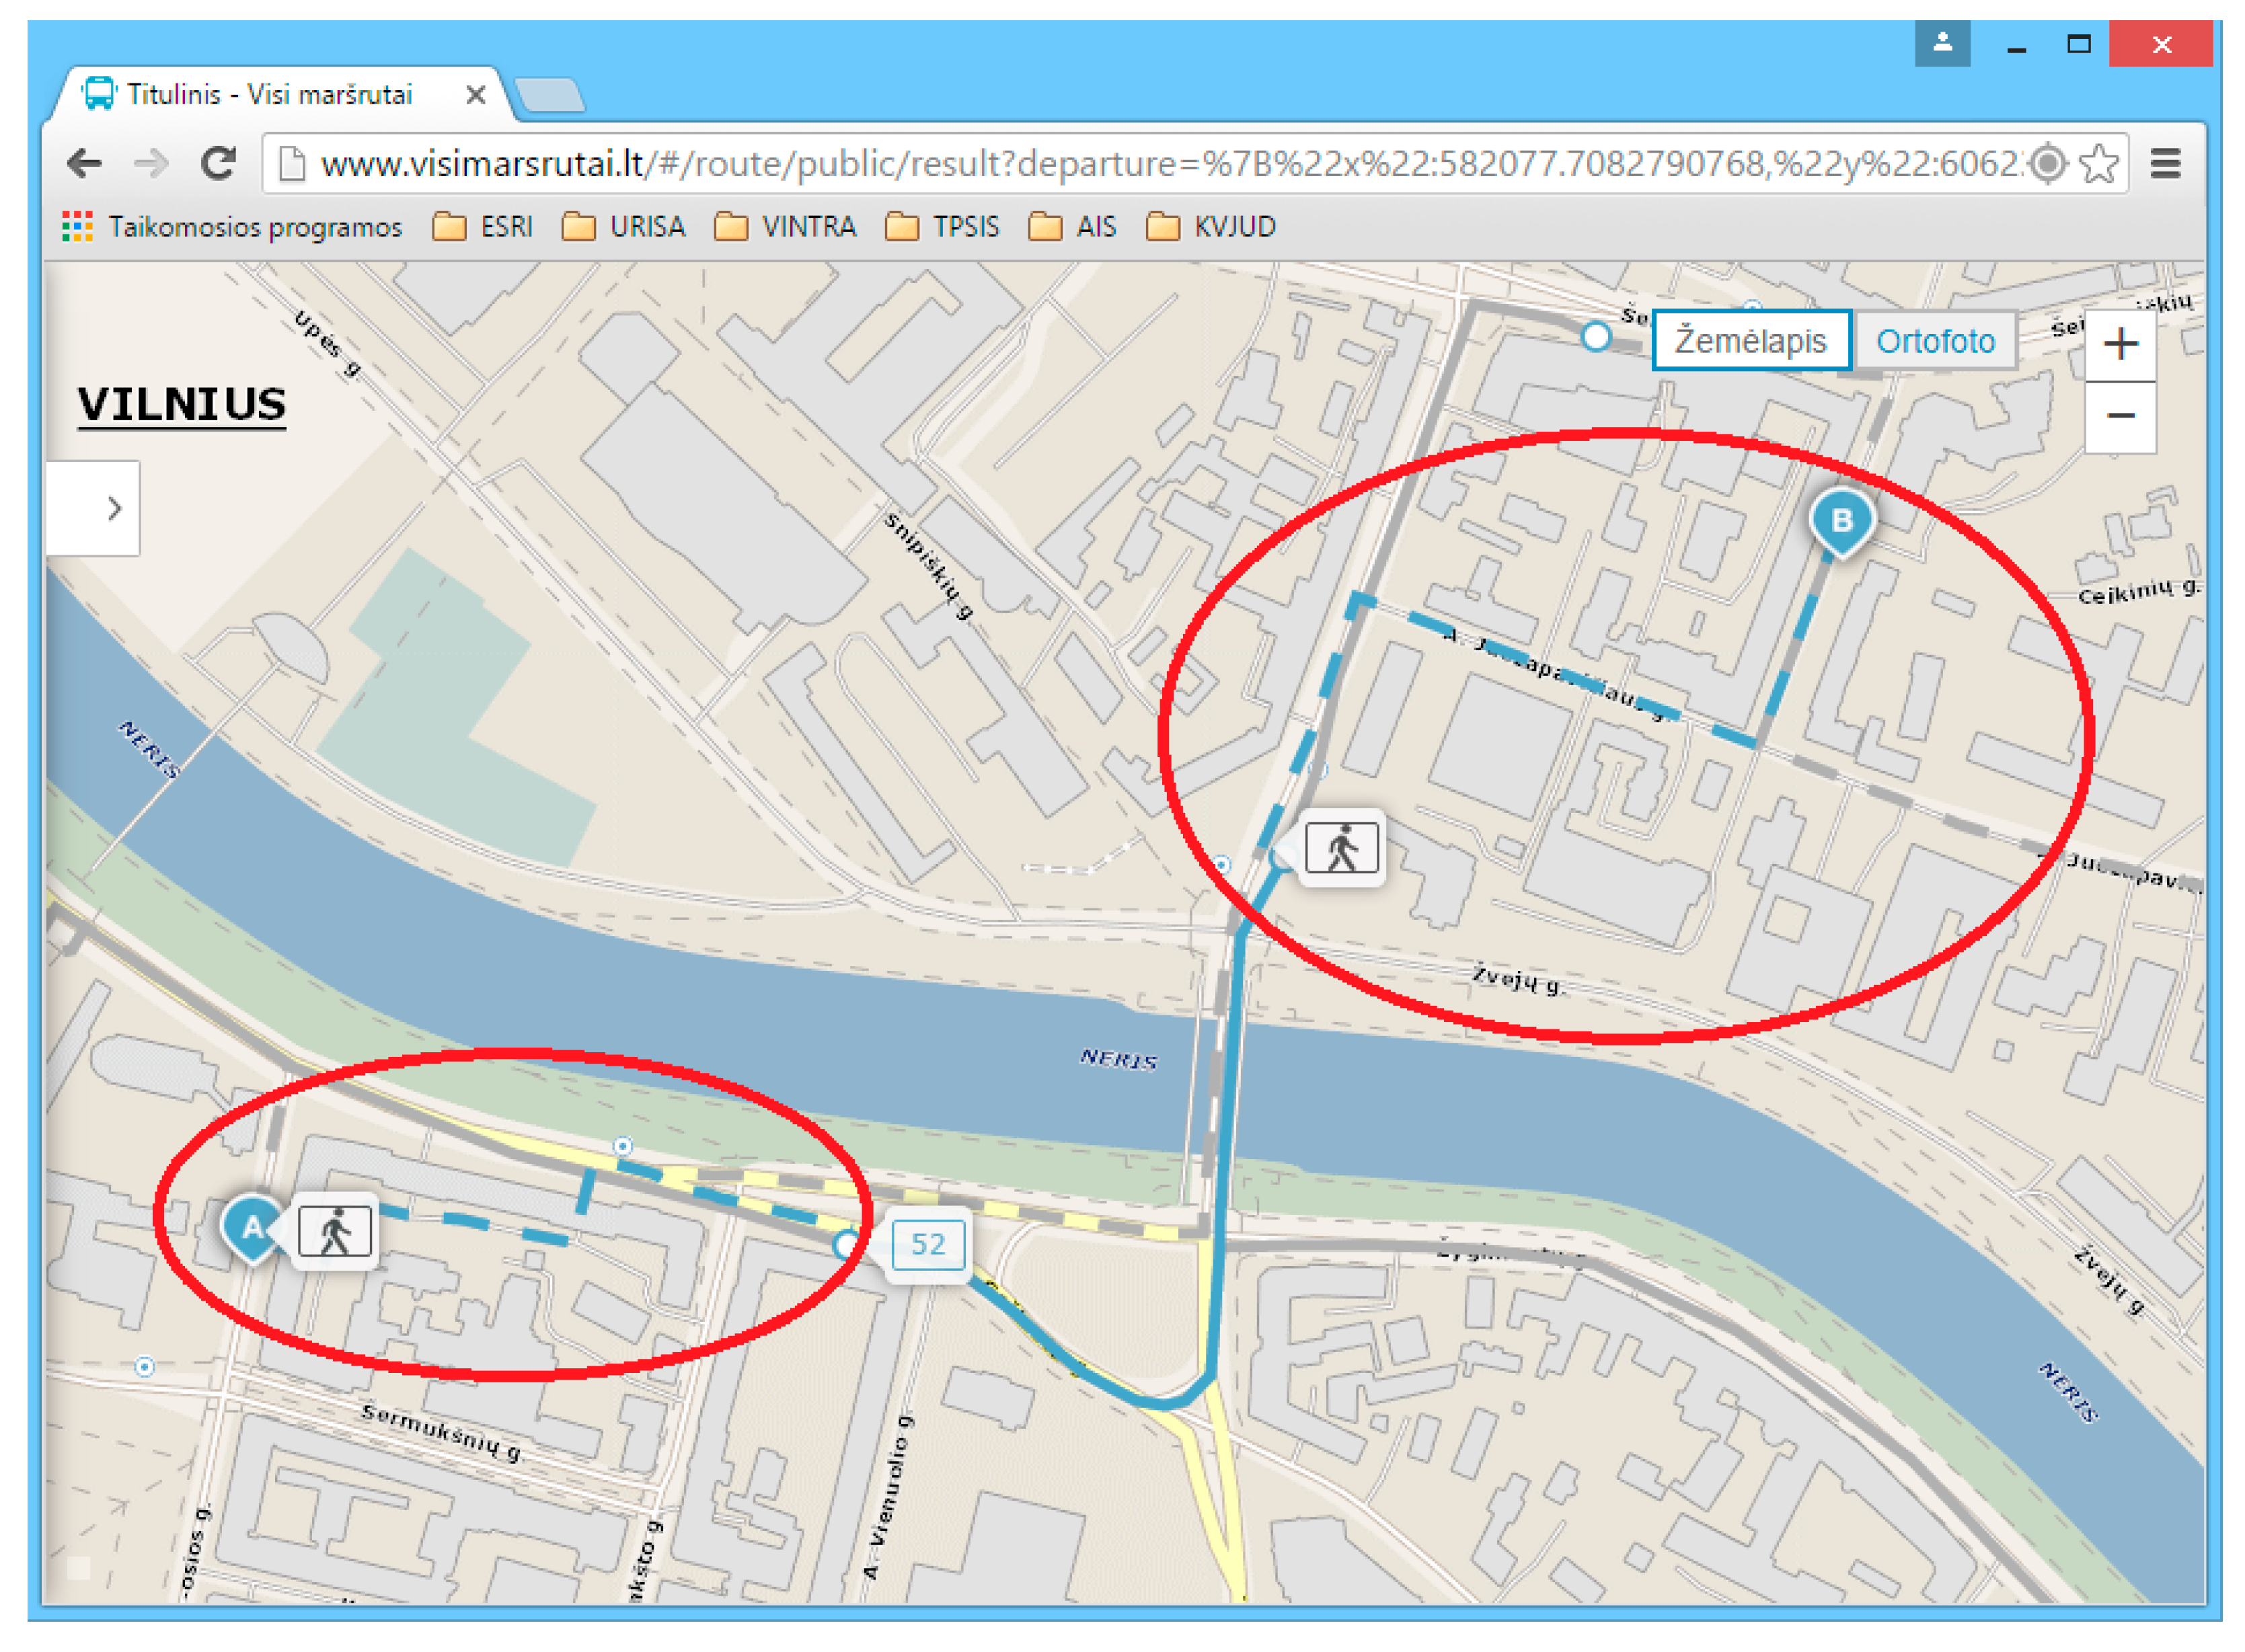
Figure 8 presents a walking route visualization on the road and street network. Pedestrian paths are presented with dashed lines.
Figure 8 represents the route: the pedestrian walks from point A to the stop, takes bus number 52, and thereafter walks to point B.
6. Mathematical Model of the VINTRA Trip Planner
An augmented variant of Dijkstra’s algorithm was used to solve public transport trips from a source, stop
ps, at time
t on the time-dependent model. It scans vertices with increasing arrival times, but evaluates each edge
e = (
u;
v) at time
dist(
u), which is the arrival time at
u. The algorithm stops as soon as the target stop-vertex is scanned. This model can support additional criterion besides the arrival time, such as the number of transfers, transport modes, the cheapest mode, etc. In order to calculate trips with many parameters, the module uses the Layered Dijkstra algorithm [
38,
39].
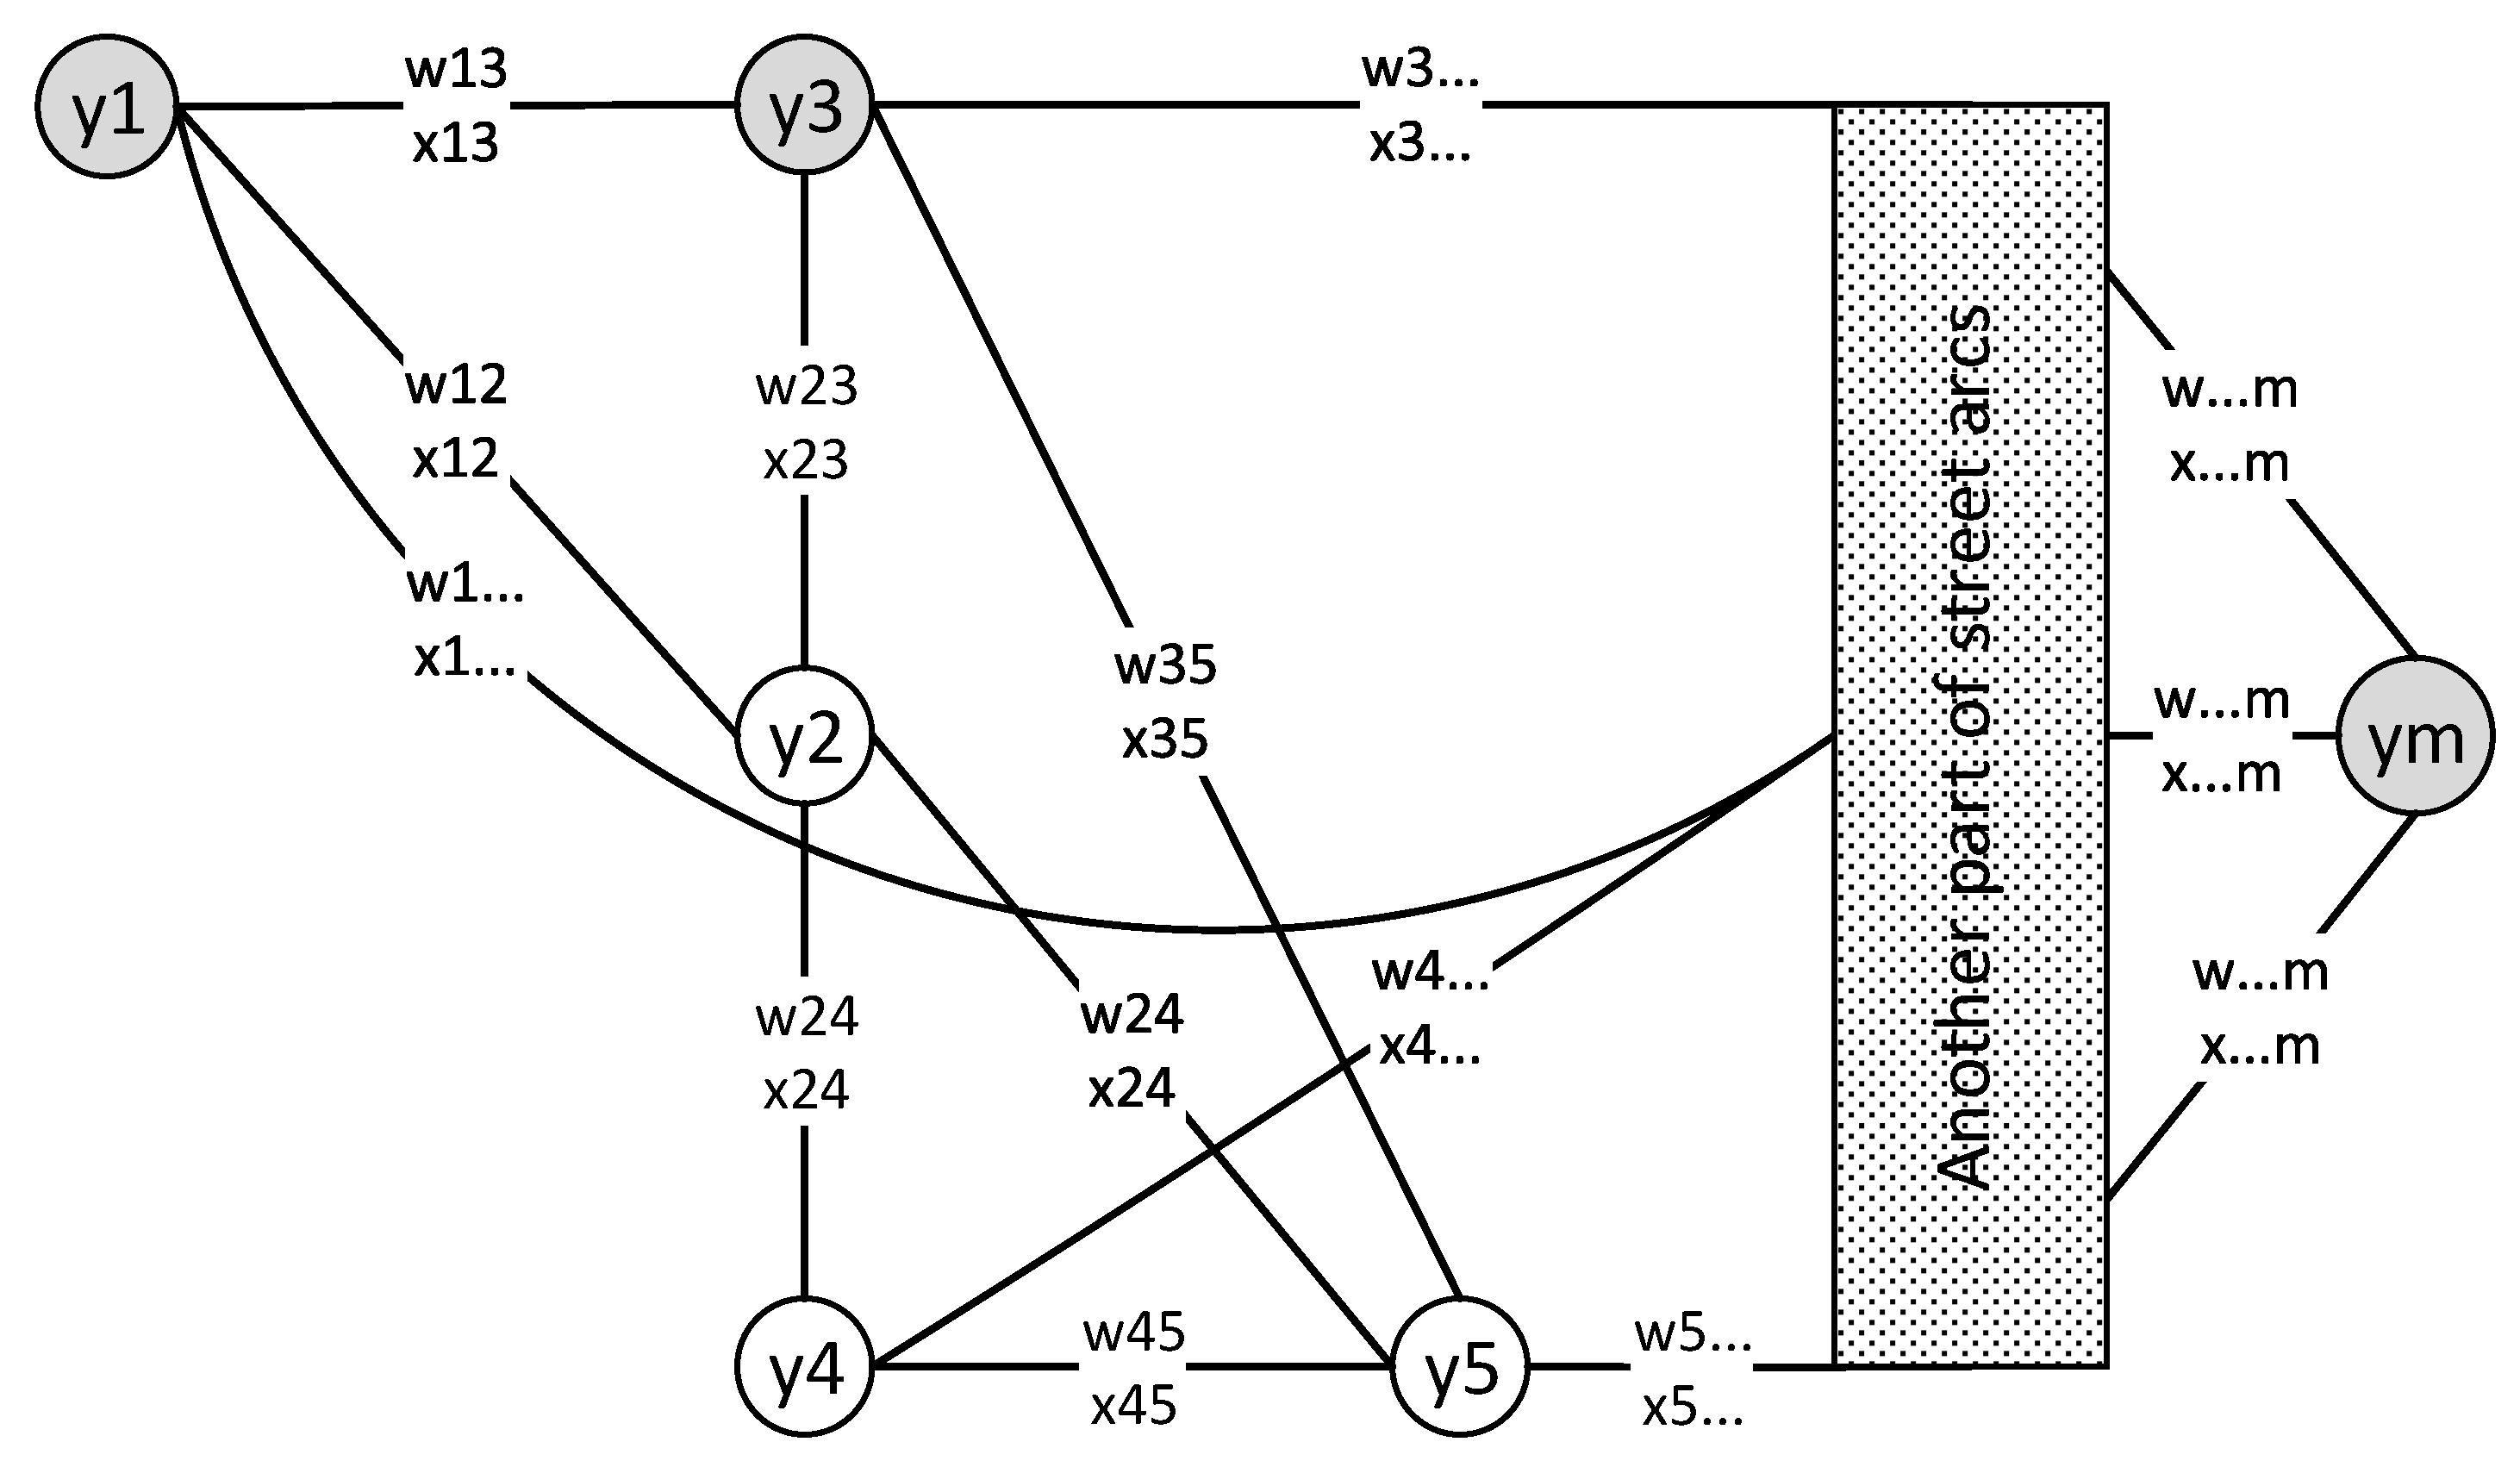
The GIS service created for the visualization of pedestrian walking routes uses the Esri ArcGIS Network Analyst function. This optimal pedestrian path calculation task belongs to the branch of linear network optimization. The main principle of the shortest calculation procedure of the optimal route is that the software tries to find the route from the start to the end point by minimizing the distance weights of road or street network segments. All of those weights are stored in the GIS road and street network database.
The modeling tasks of the optimal routes have the following features [
40]:
- -
The junction of the road and street network matches the node of the graph, and the section of the street segment matches the arc of the graph;
- -
The road and street network database has
m nodes (
Figure 9), and the distance weights are evaluated on the network arcs
Wij. According to the weight information, we can find optimal routes from the origin node
i = 1 to the destination node of the pedestrian path
i = m;
- -
The weight Wij is applied by segment distance value: the distance from node i to node j;
- -
The variable Xij just may have a value of 0 or 1. If the shortest walking distance passes nodes i and j, then Xij = 1; if the path does not go through nodes i and j, then Xij = 0;
- -
Ni− is the collection j of street segments which goes from node i; Ni+ is the collection j of street segments which goes to peak i.
When all alternatives have been calculated, the module has the iteration of the calculation of the shortest walking route for pedestrians. The mathematical model of this iteration is shown below:
where x
ij ; i = 1,2,3,…,m; j = 2,3,…,m.
The objective function (1) minimizes the path, depending on the street segments’ geometrical distance Wij values. The restrictions (2) are used to keep the equation in equilibrium. This describes the condition where one direction should be used from the first node in the calculation procedure of the pedestrian walking routes. The Equation (3) means that if a certain road and street network junction is taken to come to the concrete node, another junction is then taken to leave the concrete street network graph node.
7. Comparison of Public Trip Planning Results with the VINTRA System Created with Google
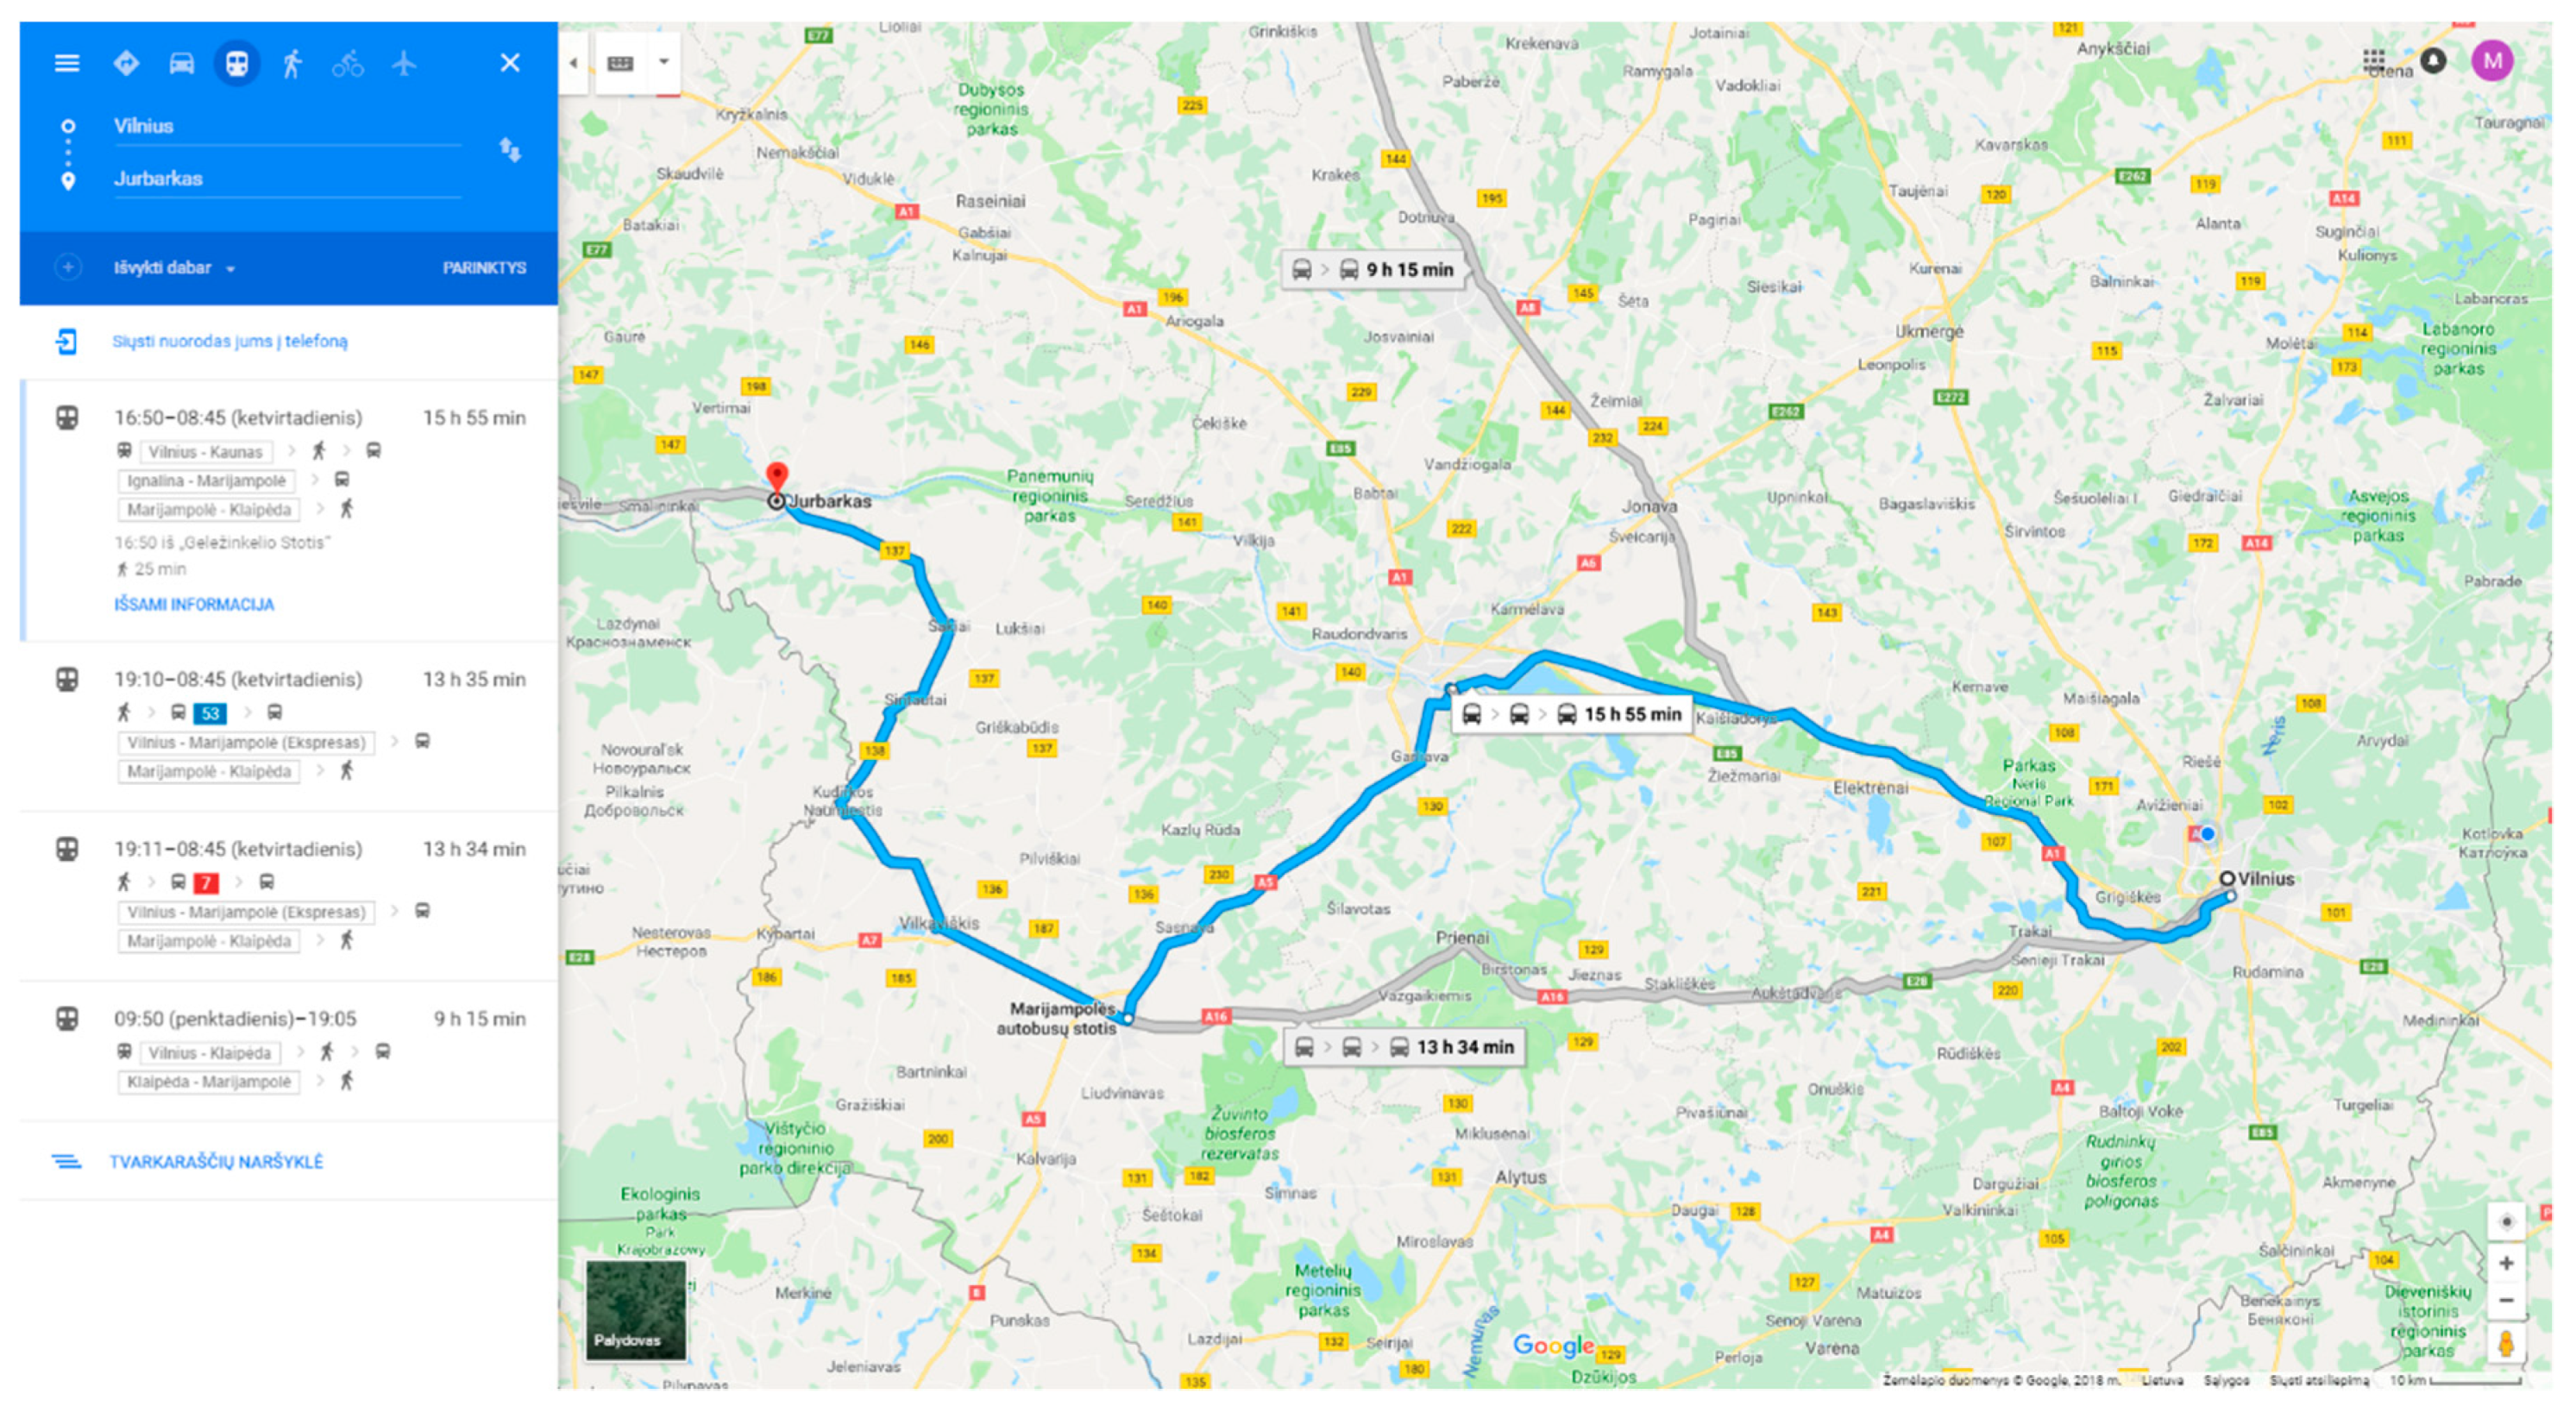
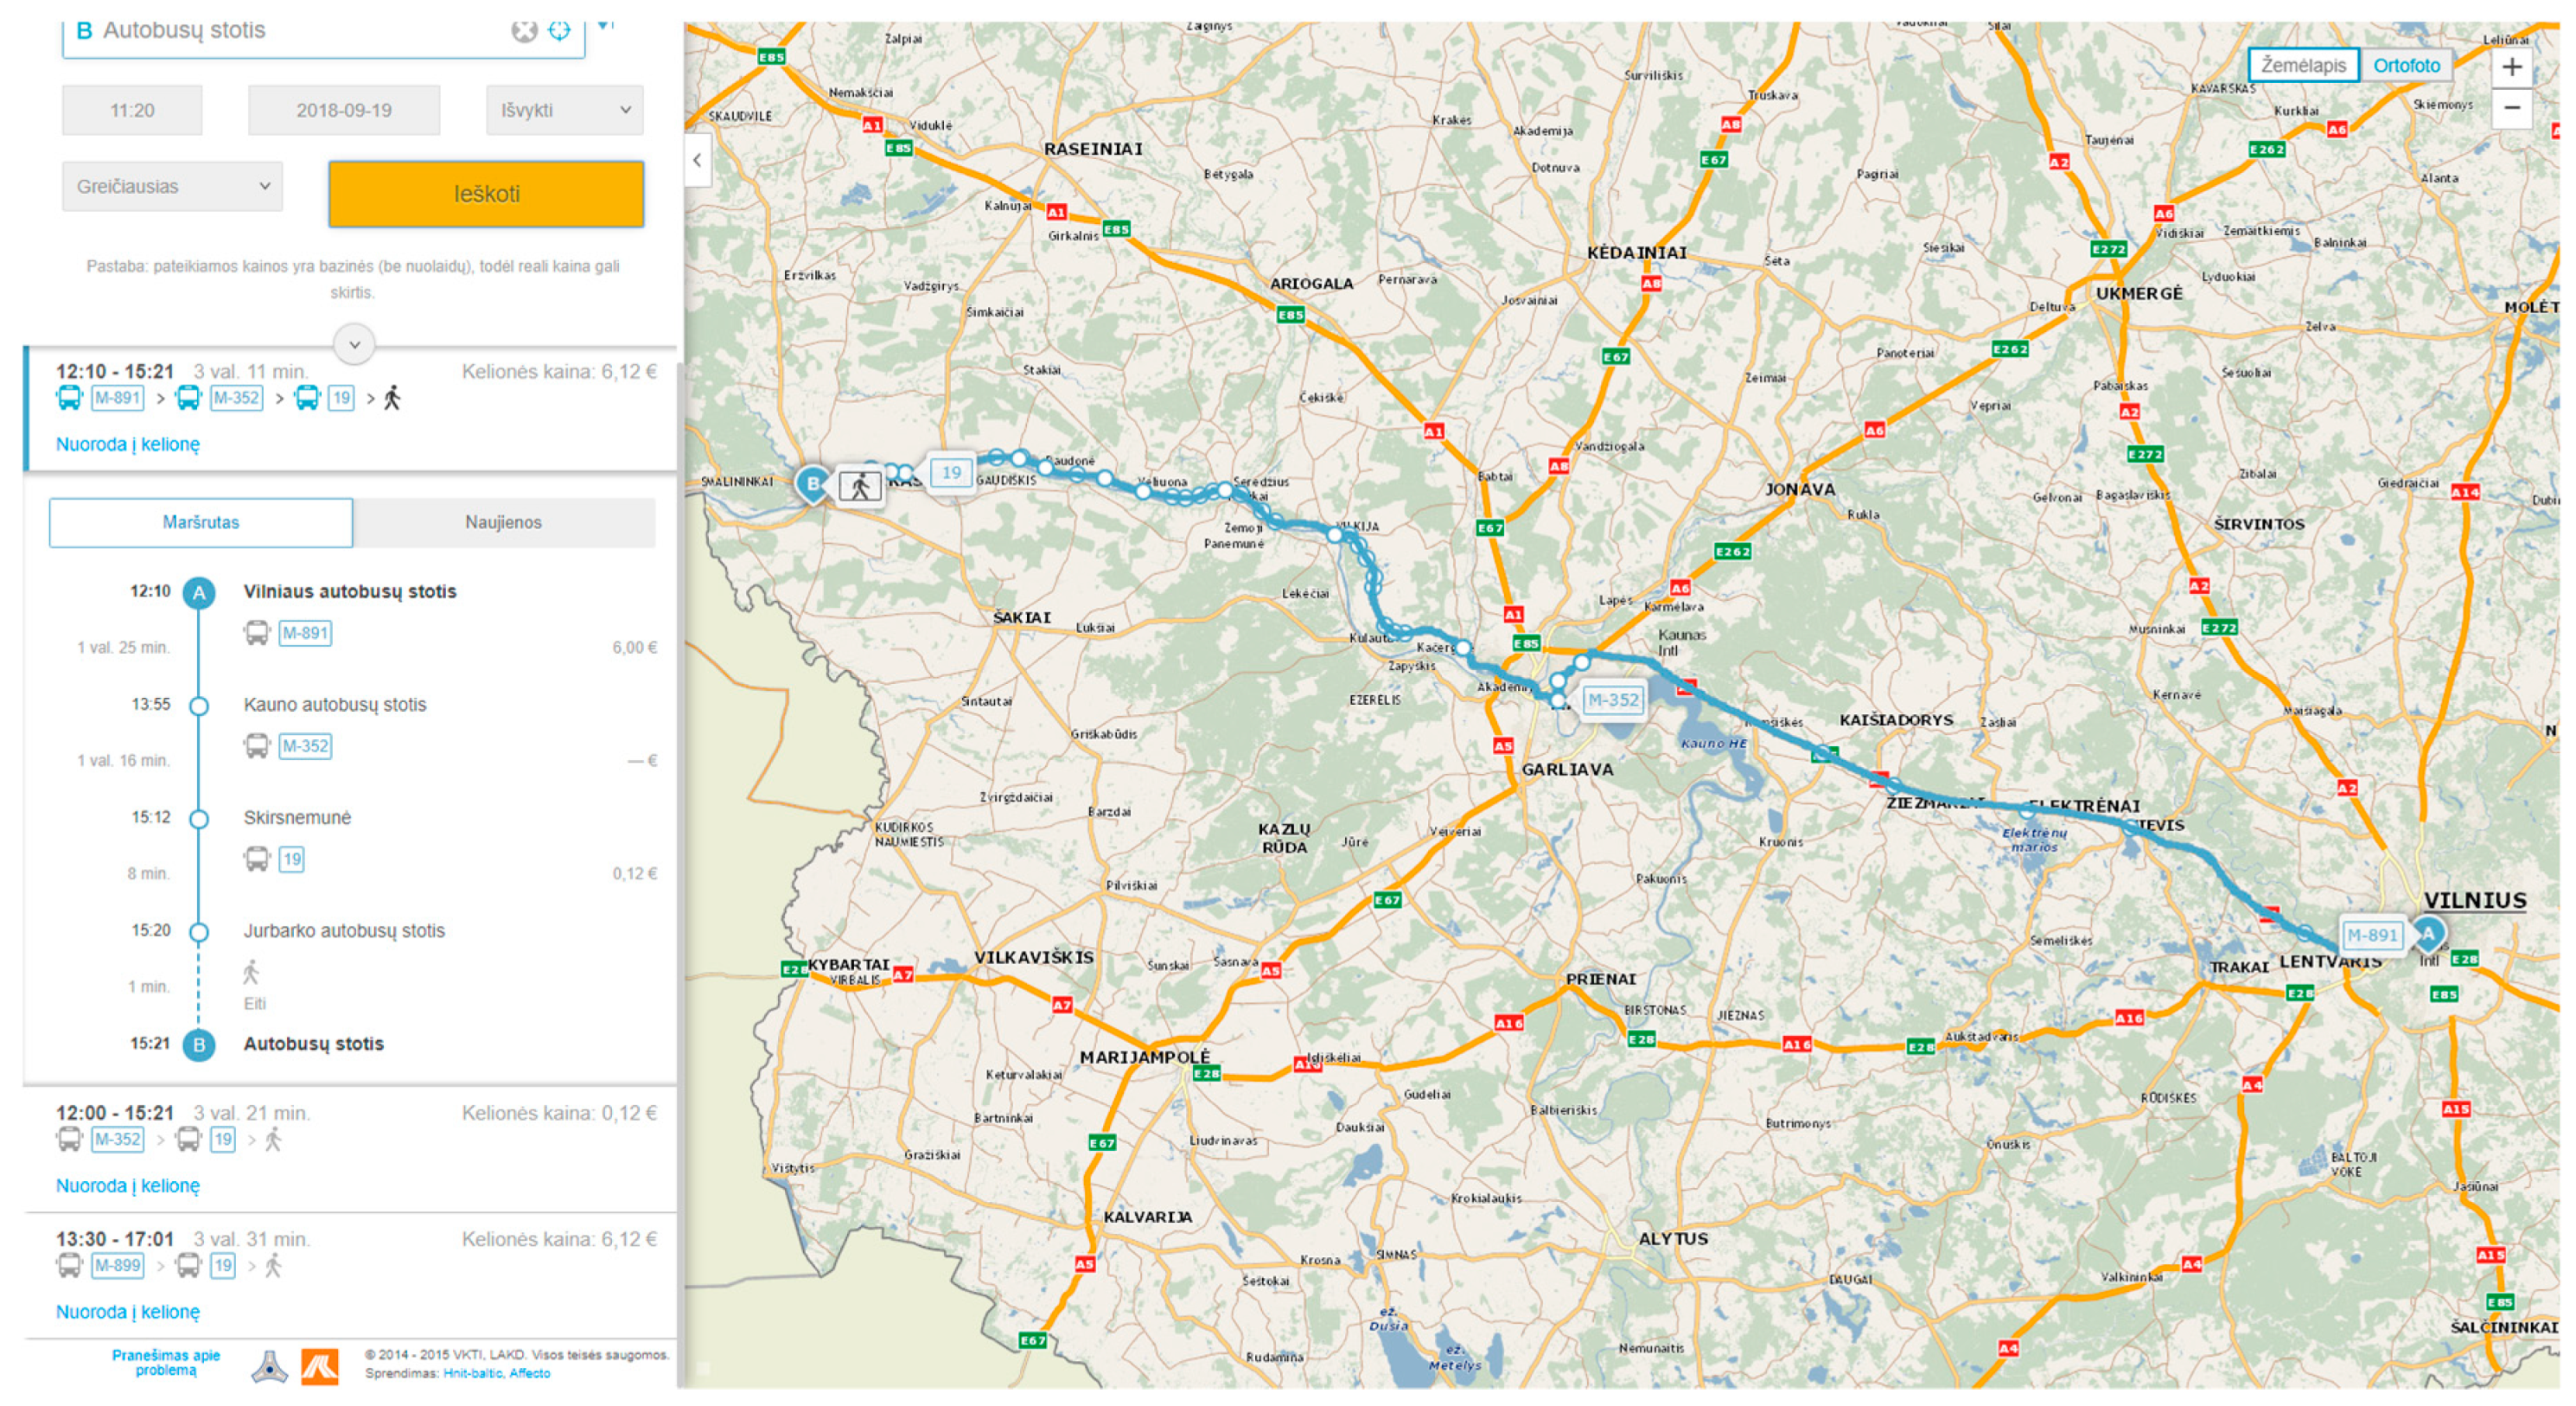
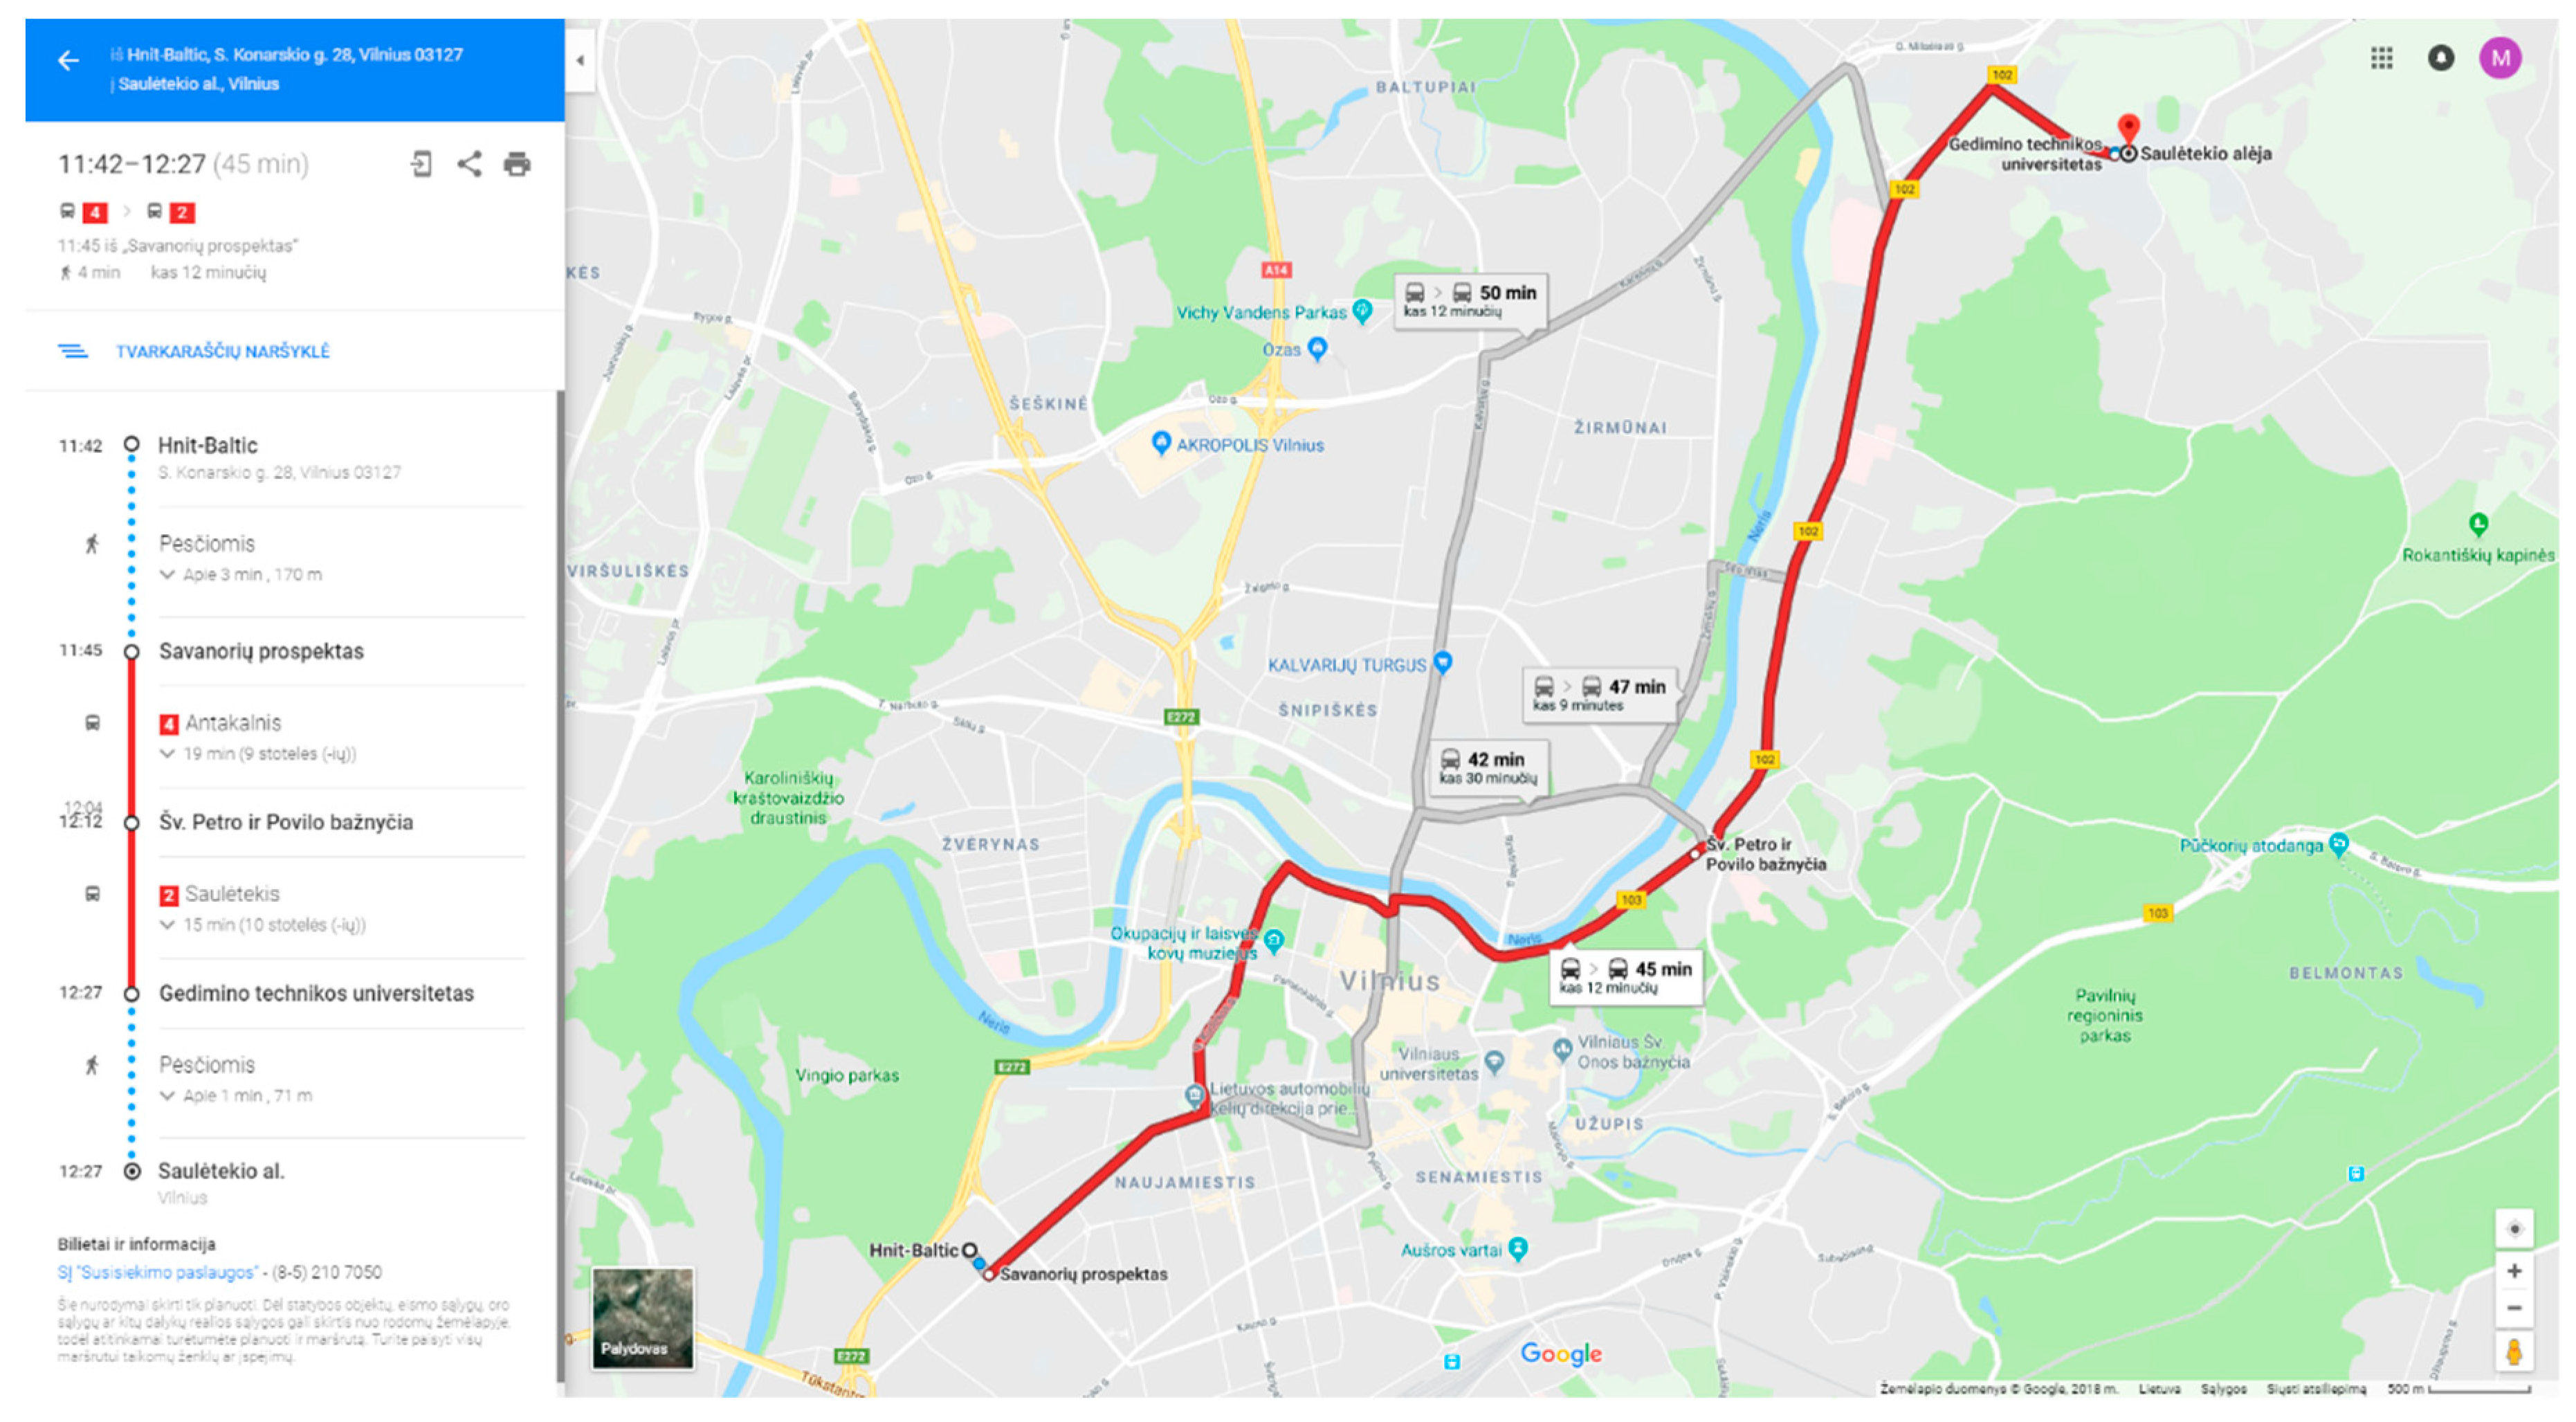
In order to validate the public transport trip planner results, the trip planner results were compared with the results from the Google trip planner. Two different trip origin and destination point pairs, located at the same place, were inserted into VINTRA and Google systems. The first pair of trip points was Vilnius (origin)–Jurbarkas (destination), and the second pair of travel points was two address points in Vilnius: Konarskio 28A (origin)–Sauletekio al. 2 (destination). The trip planning results are presented in
Figure 10,
Figure 11,
Figure 12 and
Figure 13.
Both public transit solvers returned results in less than one second. A detailed comparison of VINTRA and Google public transport trip solver results of the two trips is presented in
Table 2.
Examination of the first trip point pair, Vilnius (origin)–Jurbarkas (destination), showed that Google does not have full information about public transport routes and timetables. Google suggested taking a train to Kaunas and taking a bus to Marijampolė and then waiting for about 9 h for the bus to Jurbarkas. In this example, VINTRA generated a more precise trip. VINTRA suggested using the intercity bus to Kaunas and then taking two local buses from Kaunas to Skirsnemunė and from Skirsnemunė to Jurbarkas. VINTRA calculated a quicker trip by more than 12 h than Google for the same origin and destination. This trip comparison was performed under same trip conditions: the same trip start time, all public transport modes enabled, and the same search criteria (the fastest trip) used. The first trip origin and destination pair analysis showed that the Google trip planner does not have all public transport data for all routes and timetables; in particular, it is missing local bus transit data. The analysis of the second trip origin and destination pair in Vilnius city showed the same public transport route trajectory results for the best trip alternative: the use of two trolleybuses (2 and 4). The total trip time was 45 min with the Google route and 34 min with the VINTRA route, and the total waiting time for the Google route was 11 min longer. This difference may have occurred because Vilnius public transport timetables are not up to date in GOOGLE, which may cause public transport scheduler information to differ. Both solvers presented the same walking time and trajectories of walking routes in the trip planning results. In addition, the calculation of alternative public transport trips in Vilnius city presented the not the same results: the results of the best alternative of route planning is the same in both systems, while other additional alternatives showed different results. This could be related with the quality of public transit data. The VINTRA system has more trip planning parameters: the shortest public transit trip, the cheapest public transit trip, the maximum number of transfers, and the maximum walking distance. The VINTRA gives less public transport trip alternatives for users. The VINTRA system calculates an additional two alternatives and Google calculates the three fastest trip alternatives.
8. Discussion
The presented module of public transport trip calculations was successfully adopted in the Lithuanian information system for travelers (VINTRA). The iteration of the calculation of pedestrian paths in transit routing led to a good representation of the planned public transport trips on the map. This is also a new approach for trip visualization, which combines the results of public transit planning and pedestrian paths. Mostly, public transport trip planners visualize pedestrian walking routes by using straight lines; only the segments of public transport trips are presented by real trajectories from stop to stop. Some of the trip planners do not present real transit trajectories for public transport or public transport modes. In such cases, trips are shown on the map by straight lines from one stop to another.
An analysis of VINTRA and Google public transport trip planners identified that the quality and completeness of data is very important for trip solvers to present accurate trip planning results. The analysis identified that the trip planning solver calculates the same results in regions where they have the same public transport data, and when the same optimization criteria were provided, the fastest route was used. A methodological difference between Google’s route planning and VINTRA’s route planning algorithm was not identified from the point of trip planning results when the fastest trip optimization criteria were selected. The Google and VINTRA solvers differ in terms of possible input parameters and choices of optimization criteria. Google has just one criterion: determining the best trip, whereas VINTRA allows users to choose the fastest, shortest, or the cheapest trip. In addition, VINTRA has the ability to set different maximum walking distances and to set the numbers of transfers allowed in trip planning. Another difference is that the VINTRA system shows the approximate price of the planned trip in the results.
Google uses the same data for planning in Vilnius city, because Vilnius GTFS was provided to Google, and they added this data to the solver few years ago. The Google solver does not have local and intercity bus timetables and routes, and this is the reason why examination of the first trip point pair showed different results. In order to solve this problem, it is necessary for the owner of the VINTRA system to export a GTFS file of all public transport routes in Lithuania and provides this to Google, and Google should add this to their dataset. Until Google updates its data on public transport routes, stops, and schedules from the Lithuanian GTFS, then both systems will show different trip planning results between points crossing Lithuania. In addition, the VINTRA system should complement the Google route planner by providing GTFS files in order to allow Google users to plan public transport trips which crosses several countries.
9. Conclusions
The presented public transport trip planner calculation uses the weighted Dijkstra method. The probability of a higher calculation time increases in a large territory, because the calculations performed by the model are limited by origin and destination stop points, and an extra-added buffer.
Future work could include an examination of the public transport trip calculation performance in a large area of datasets, much bigger than Lithuania. In addition, datasets which have graphs with several more edges could be examined.
A comparison of the VINTRA system public transport trip solver with other state-of-the-art solvers like Google found that both solvers calculate almost the same results. In some cases, there are differences in trip results, and the reason for that is public transit data quality and completeness.
Future research could include examination of the solver with the Dijkstra method changed to A*. This could significantly improve the calculation performance, especially in large and very dense graph edge areas [
41].
A developed VINTRA external portal for optimal public trip calculation can help web users to find and choose optimal public transport trips depending on the chosen transportation mode, and selected optimality criteria; for example, the shortest route, the quickest route, the cheapest route, etc.
The Dijkstra algorithm has been applied in calculations to determine pedestrian walking routes, for example to the necessary stop from the first trip point, between the stops when there is a transfer in the trip, and from the last trip stop to the trip end point. The created mechanism of the walking route trajectory calculation was successfully integrated with the calculation module of public transport trips. This integration allowed good public transport trip visualization on a digital map.
The developed Lithuanian information system for travelers allows users to perform multimodal trip planning. It is possible to plan trips by combining different public transportation modes such as buses, trolleybuses, ships and ferries, trains, and airplanes. The developed system completely covers the regulations of the ITS directive related to multimodal trip planning.
The developed mechanism of multimodal public transport trip planning was implemented in the VINTRA external web portal with the help of ArcGIS API for JavaScript. For digital mapping, ArcGIS REST map services were used; the portal interface and web content management was built on Liferay. In the future, the created portal could be extended and integrated with different purchase systems for transportation tickets. If Lithuanian public transport had a single ticket system, this portal could be the main trip data (trip transport modes, visited stops, trip length) provider to that system. In terms of the ability to purchase a single ticket in the VINTRA system for multimodal public transport trips by city transport, intercity, and local buses and rail will additionally benefit the Lithuanian public transport system. This opportunity will increase passenger satisfaction, reduce transaction and administrative costs, and help to acquire accurate data on passenger behavior, enabling better capacity and network planning.


