Guest Editor’s Editorial “Cognitive Aspects of Human-Computer Interaction for GIS”


Institute for Photogrammetry & Institute of Distributed and Parallel Systems, University of Stuttgart, Stuttgart 70147, Germany
ISPRS Int. J. Geo-Inf. 2019, 8(8), 337; https://0-doi-org.brum.beds.ac.uk/10.3390/ijgi8080337
Submission received: 26 July 2019
/
Accepted: 29 July 2019
/
Published: 30 July 2019
(This article belongs to the Special Issue Cognitive Aspects of Human-Computer Interaction for GIS)
The first Hypertext System and HCI
It was Vannevar Bush [1] in the 1930s, working at the MIT, who was heading in the direction of hypertext linking and a pre-prototype system of human-computer-interaction (HCI). While George Stibitz and Konrad Zuse were trying to develop the circuitry that would eventually lead to the invention of a digital computer, Bush was developing a machine he later called the differential analyzer. This was an analog computer using all ten digits of the decimal system rather than using the binary system of digital computers. Claude Shannon, a student of Bush, was at the same time working on his Boolean algebra and electrical circuitry theories, by which finally the differential analyzer became obsolete. Bush went on to invent the rapid selector, a microfilm storage and retrieval device, that he expanded, at least in theory leading to the memory expander, just called memex [2], see Figure 1a. Memex, a proto-hypertext system, has foreshadowed modern computer and hypertext linking that gives Bush his place as a pioneer of the Internet and HCI.
Bush described the device as electronically linked to a library and able to display books and films from that library, with the capability to automatically follow cross-references from one work to another. A large desk was hiding a combination of electromechanical controls and microfilm cameras and readers. Most of the microfilm library would have been contained in this desk, but the user could add or remove microfilm at will. Obviously, the technology of memex is often confused with that of hypertext. Although Bush’s idea inspired the creation of hypertext, it is not considered to be hypertext. However, taking Bush’s idea of linking the device to a library and use it to display text, photographs and films comes very close to today’s performance of mobile devices and USB flash drives, see Figure 1b.
HCI and the NLS, ARPANET and Internet
The publication of V. Bush, “As We May Think” [3], has got the attention of another computer pioneer, Douglas Engelbart, who developed the basis for today’s computer interfaces, already during the 1960s. He liked Bush’s idea of a machine that would aid human cognition.
At that time, Engelbart founded the Augmentation Research Center (ARC), a development environment at the Stanford Research Institute (today SRI International, located in Menlo Park, near the Stanford University Campus) [4]. He and his colleagues, W.K. English and J.F. Rulifson, created the oN-Line System (NLS), the world’s first hypertext implementation. NLS was an integrated environment for natural idea processing, at a time when most people (and even programmers) had no direct contact with a computer. This environment created already the mouse-pointing device for on-screen selection, a full windowing SW architecture, a one-hand chording device for keyboard entry, on-line help systems and the concept of consistency in user interfaces. Engelbart’s work directly influenced the research and development at Xerox PARK, which in turn was the inspiration for Apple computers. NLS was able to do hypertext linking, tele-conferencing, word-processing, emails and could be individually configured and programmed by the user. In 1991, Engelbart and his colleagues got the prestigious ACM Software System Award for their work on NLS. The development of NLS was more or less finished in 1968. The Mother of All Demos demonstrated on December 9, 1968 its important features to a small crowd of specialists in San Francisco, via leased telephone lines which connected the ARC scientists to a huge screen at the meeting place.
Parallel to the developments of ARC at SRI another important innovation project was launched in the beginning of the 1960s—the Advanced Research Projects Agency Networks (ARPANET) [5]. It was the world’s first operational packet switching network, and the predecessor of the Internet. The packet switching concept revolutionized the methods of data communication. Previously, data communication was performed by circuit switching, in which a dedicated circuit is tied up for the duration of a phone call and communication takes place with a single user only, on the other end of the circuit. With packet switching, each packet could be routed independently of other packets. The system was able to use one communication link to communicate with more than one machine by assembling the data into several packets.
Packet switching is therefore the basis for today’s data transfer via the Internet, independent of its application which is quite diverse: Text messages, e-mails (with/without attachments), voice-over-IP (VoIP), MP3 audios (audio podcasts), MP4 videos, (video podcasts), video-on-demand (VoD), and IP Television (IPTV).
However, there was still a long way to go, from the first ideas of ARPANET to today’s largest library in the world—the Internet with its millions of web servers [6]. The earliest ideas of a computer network intended to allow general communication between users of various computers were formulated 1962 by the psychologist J.C.R. Licklider [7]). His memos discussing “The Galactic Network” contained almost everything that the Internet is today. When he was appointed head at the US Department of Defense Advanced Research Projects Agency (DARPA), he was the one who convinced Ive Sutherland and Bob Taylor for the necessity of such a computer network. Licklider left DARPA before any actual work on his vision was performed.
The initial plans for the ARPANET began late spring and summer 1967, more than 50 years ago. It was Larry Roberts, a former associate of MIT Lincoln Laboratory, who got the responsibility at DARPA for realizing the ARPANET idea (late 1966). The company Bolt, Beranek and Newman (BBN) was awarded with a contract to implement initial ARPANET deployments on April 7, 1969. A first, the ARPANET link was established on January 14, 1969, between the Network Measurement Center of UCLA and the D. Engelbart’s ARC at SRI (where the NLS was already operating). BBN finished as contracted the entire 4-node network linking UC Los Angeles, UC Santa Barbara, SRI, and the University of Utah, by December 5, 1969. BBN followed the plan of Roberts closely—small computers known as interface message processors (IMPs) performed at each site store-and-forward packet switching functions. They were connected to each other using modems to leased lines, running at 50 Kbit/s. The host computers were connected to the IMP and ARPANET via custom bit-serial interfaces. The first email via ARPANET was sent in 1971. By 1973, 75% of ARPANET traffic was email. In the same year, the file transfer protocol (FTP) was defined and implemented to enable file transfer via ARPANET. Also, a voice traffic protocol was worked out in the 1970s, but conference calls did not work well with the ARPANET.
At the beginning, the ARPANET relied on the 1822 protocol, which served well within the IMP nodes. With the growth of the network and its increased usage, this protocol was replaced by the Network Control Program (NCP) to use a more advanced standard method to establish reliable flow-controlled and bidirectional communication links between different processes running on different hosts.
In 1983, TCP/IP protocols replaced NCP as the standard protocol of the ARPANET, and the ARPANET became just one component of the fledgling Internet. Further in 1983, the US military portion of ARPANET was broken off as a separate network, called MILNET. Obviously, there is a myth telling that “… The ARPANET was designed to be a communication backbone that could survive a nuclear attack …”, which definitely is not true. The ARPANET was shut down in 1990. Most university computers that were connected to it were moved to networks connected to the NSFNET, the Internet of today.
The Internet entered the public arena in 1994, when Tim Berners-Lee’s World Wide Web became accessible through the commercial browser NETSCAPE. In the last 25 years, it has evolved to an indispensable tool transforming business and politics, spawning its own industry of search engines (e.g. Google, Yahoo, Bing, etc.), and contributing to new concepts in research, education and teaching.
HCI in general today
Since the evolution of digital computing in the 1940s, the human-computer-interaction (HCI) has been an issue. From the beginning, it was treated as a task-artifact-cycle and as technology advances, the interface between the user and the data and information to be processed has become most critical for creating effective, efficient and pleasant systems. According to [8], the task-artifact-cycle is described in more detail: (1) Humans have needs and preferences, (2) technologies are created to suit these needs, and (3) as humans use these technologies, the needs and preferences change continuously. Comparing the use of geographical information science (GIS) hardware and software in the last three decades (1990 to 2020) is completely different: First, closed and monolithical systems were used running on mainframes, workstations and desktop computers. Today, open architectures and cloud-based systems interconnecting desktop and mobile computing devices are used. Geospatial data and informations are used daily by everyone. Mobile devices changed completely the social behavior of humans and so did geographical data. The following question can be asked: How did people meet in town 1990 and 2019. The answer is simple: Nowadays, the mobile device tracks visits, movements and coordinates meetings with friends. Also, navigation on the mobile device has become very simple and people rarely get lost.
However, there are also conflicts to be resolved [9]. The user needs are sometimes conflicting needs and there are difficulties weighting them against each other, and moreover, many values are not explicitly communicated. Considering the weighting of values leads directly to the following questions: (1) Should all services be free-of-charge? (2) Should it be privacy-preserving? Then, there is the issue of the implicit values: (3) How to offer minimal efforts in getting started and using it? (4) What is the social status of a technology—the coolness factor? It seems today, that for most daily problems, people are using applications – in short “Apps” - running on smart phones and tablets, including also geospatial environments.
The HCI today is all about visible innovation. It is often not seen as a problem before there is a solution. If problems are identified, they are typically easy to understand by non-experts. Once a solution is there, people will generally not remember that there was a problem, and the good and in particular, great solutions often appear obvious—once they exist. Summarizing the problems, the challenges and solutions can be stated as follows: The step from problem to solution is, however, not trivial. However, this is often forgotten, once there is a solution.
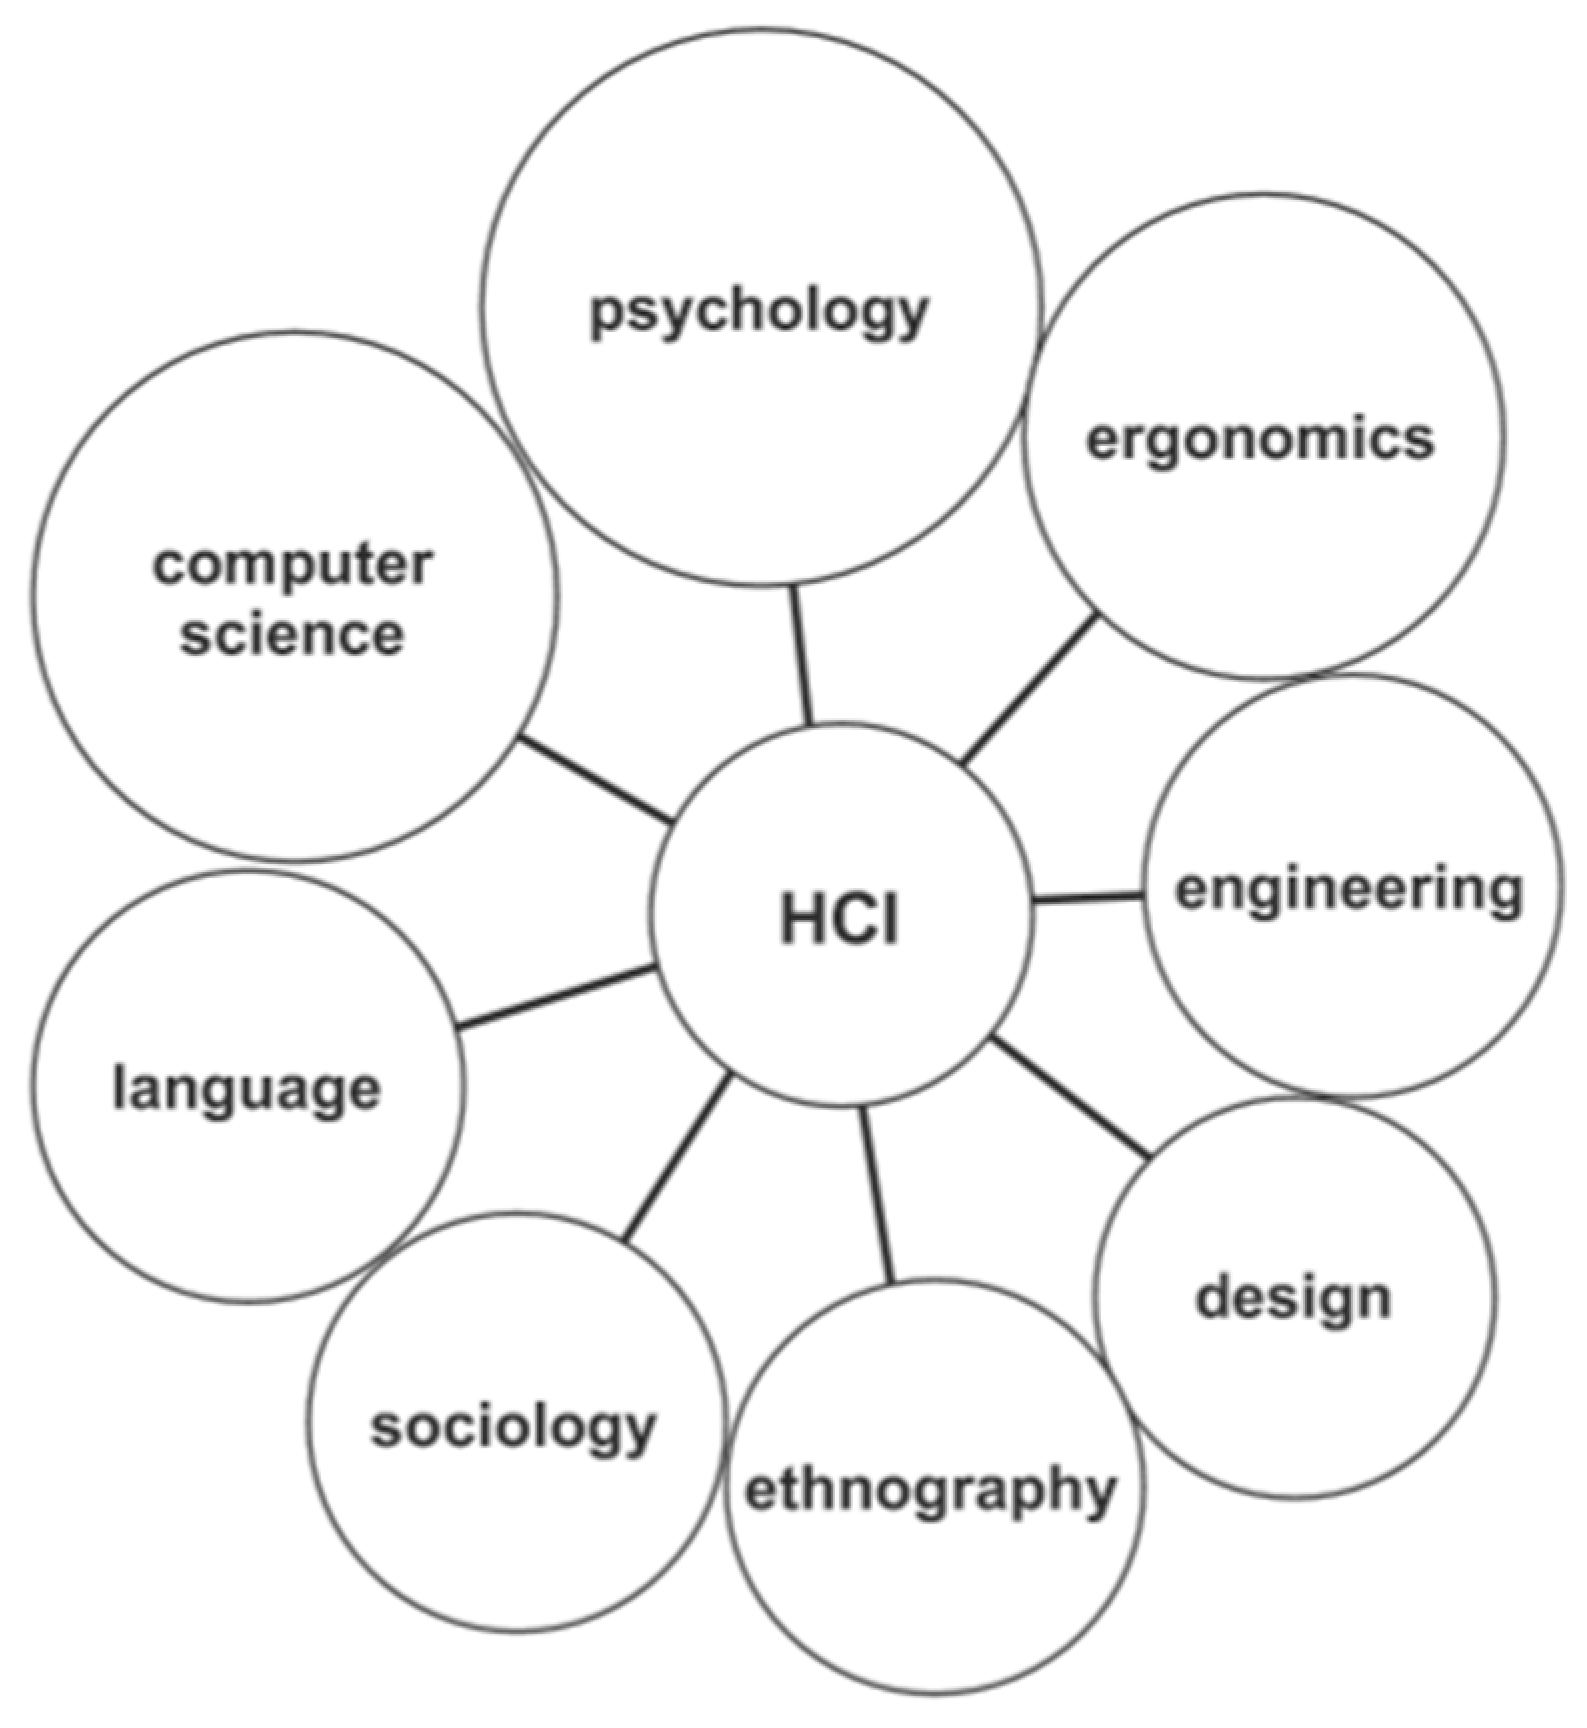
According to the working definition of the ACM SIGCHI [10] the HCI is generally understood as “A discipline concerned with the design, evaluation and implementation of interactive computing systems for human use and with the study of major phenomena surrounding them”. It needs the support of many disciplines (see Figure 2), like computer science to contribute with application design and engineering of human-computer interfaces; psychology contributing with the application of theories of cognitive processes and the empirical analysis of user behavior; sociology and anthropology considering interactions between technology, work and organization, and to design to create interactive products.
HCI and GIS
The widespread use of emerging technologies for 3D modelling and 3D visualization, such as augmented reality, virtual reality and 3D/4D Apps developments offers to the geographical information science (GIS)—also called geoinformatics or geoinformation science —new interfaces for human-computer interactions. This goes also along with the progress in big data analyses using machine learning and deep learning methods, but this is still in its infancy stage with GIS data analysis. Most of the high quality urban scenes, such as 3D vectorized buildings and city models are outputs of interactive workflows which should be replaced step by step by more automation in the near future. Therefore, this issue will deliver some articles reviewing the state-of-the-art in 2D and 3D modeling by interactive and semi-automated and fully automated workflows, in particular when 3D urban scenes have to be interpreted and vectorized.
Today, 2D and 3D objects tell their own stories, in text and messages, audio, and video [11,12,13]. This requires the definition of storyboards to present further geometries, images, and semantics. Therefore, an integration of semantic models/ontologies with geometric data and metadata is necessary, and also to offer semantic details in coarse-to-fine modes, just to adapt it to the user level. A child in Kindergarten may play with a 2D, 3D and 4D GIS App purely for fun. The school pupil might use it to learn about their home town and its history, while students and adults might expect more complex and dense information.
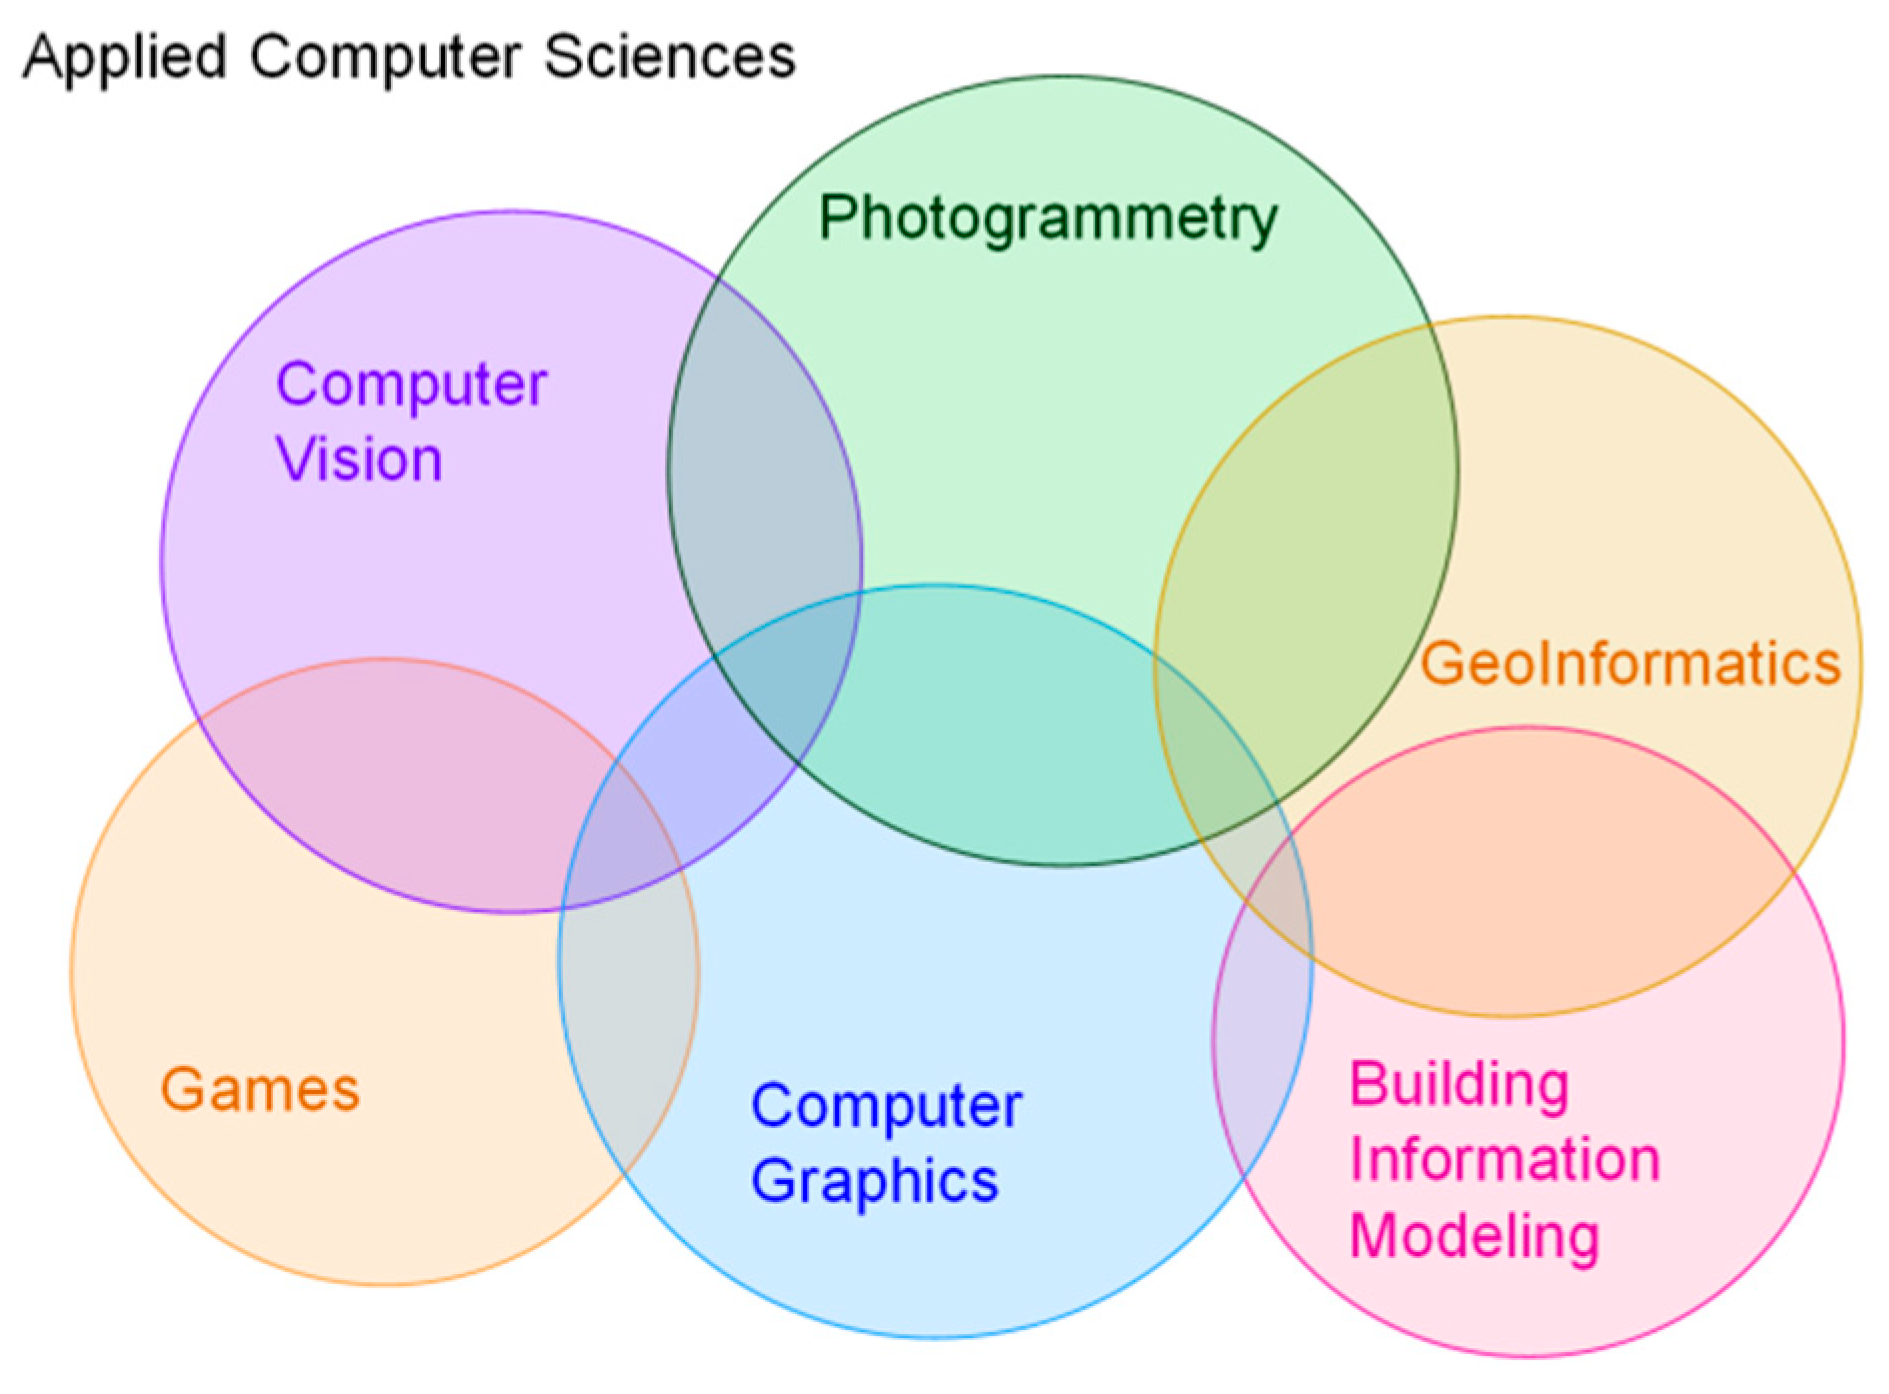
GIS is no longer the only bridge for disciplines in surveying—it has become one of many fascinating fields and technologies collaborating together, as given in Figure 3. This means the data collectors, data processors and data presenters should collaborate closely, for example, to link photogrammetry and computer vision with geoinformatics and building information modeling on the one hand, and with computer graphics and serious gaming on the other hand. The boundaries of the different fields intersect and it is exciting to see the output of these intersections. Serious gaming offers platforms for advanced 3D modeling and rendering and therefore, plays also an important role in cognitive aspects of human-computer-interaction.
Therefore, the issue of GIS human-computer-interaction just started and new developments, integrating mixed realities, 3D/4D App developments and progress in automated 3D urban scene modeling, machine learning and deep learning, visual analytics and many more are expected to further develop the general ideas and implementations of HCI.
The example taken from [13] illustrates the HCI and GIS experience by means of 3D and 4D Apps developments. Computer games have been used for real-time visualizations for the past three decades [14]. For the development of Apps, the software package, Unity, has been used. It is a cross-platform engine developed by Unity Technologies and accomplishes to develop video games for PCs, mobile devices and websites. With an emphasis on portability, the engine targets the following APIs: Direct3D on Windows and Xbox 360; OpenGL on Mac, Linux, and Windows; OpenGL ES on Android and iOS; proprietary APIs on video game consoles. Unity allows specification of texture compression and resolution settings for each platform that the game engine supports, and provides support for bump mapping, reflection mapping, parallax mapping, screen space ambient occlusion (SSAO), dynamic shadows using shadow maps, render-to-texture and full-screen post-processing effects. Unity’s graphics engine’s platform diversity can provide a shader with multiple variants and a declarative fallback specification, allowing Unity to detect the best variant for the current video hardware and, if none are compatible, to fall back to an alternative shader that may sacrifice features for performance.
In the European Union funded 4D-CH-World Project, the game engine Unity has been used to develop two applications:
- (1)
- The application, Calw VR
- (2)
- The application, Tracing Hermann Hesse in Calw.
The overall aims for the application development are given as follows: (1) Use operating systems Android, iOS and Windows; (2) provide real-time 3D environments using OpenGL ES 3.0; (3) the GUI should offer autoscaling and orientation; (4) allow for additional steering using embedded accelerometers and gyroscopes; (5) all text, audio and video narration must be available for at least two languages (English, German); (6) allow for augmentation through target tracking; (7) triggering scenes by using GPS sensors; (8) provide an interactive map display with turn-by-turn directions, and (9) overlay original site artefacts with reconstructions.
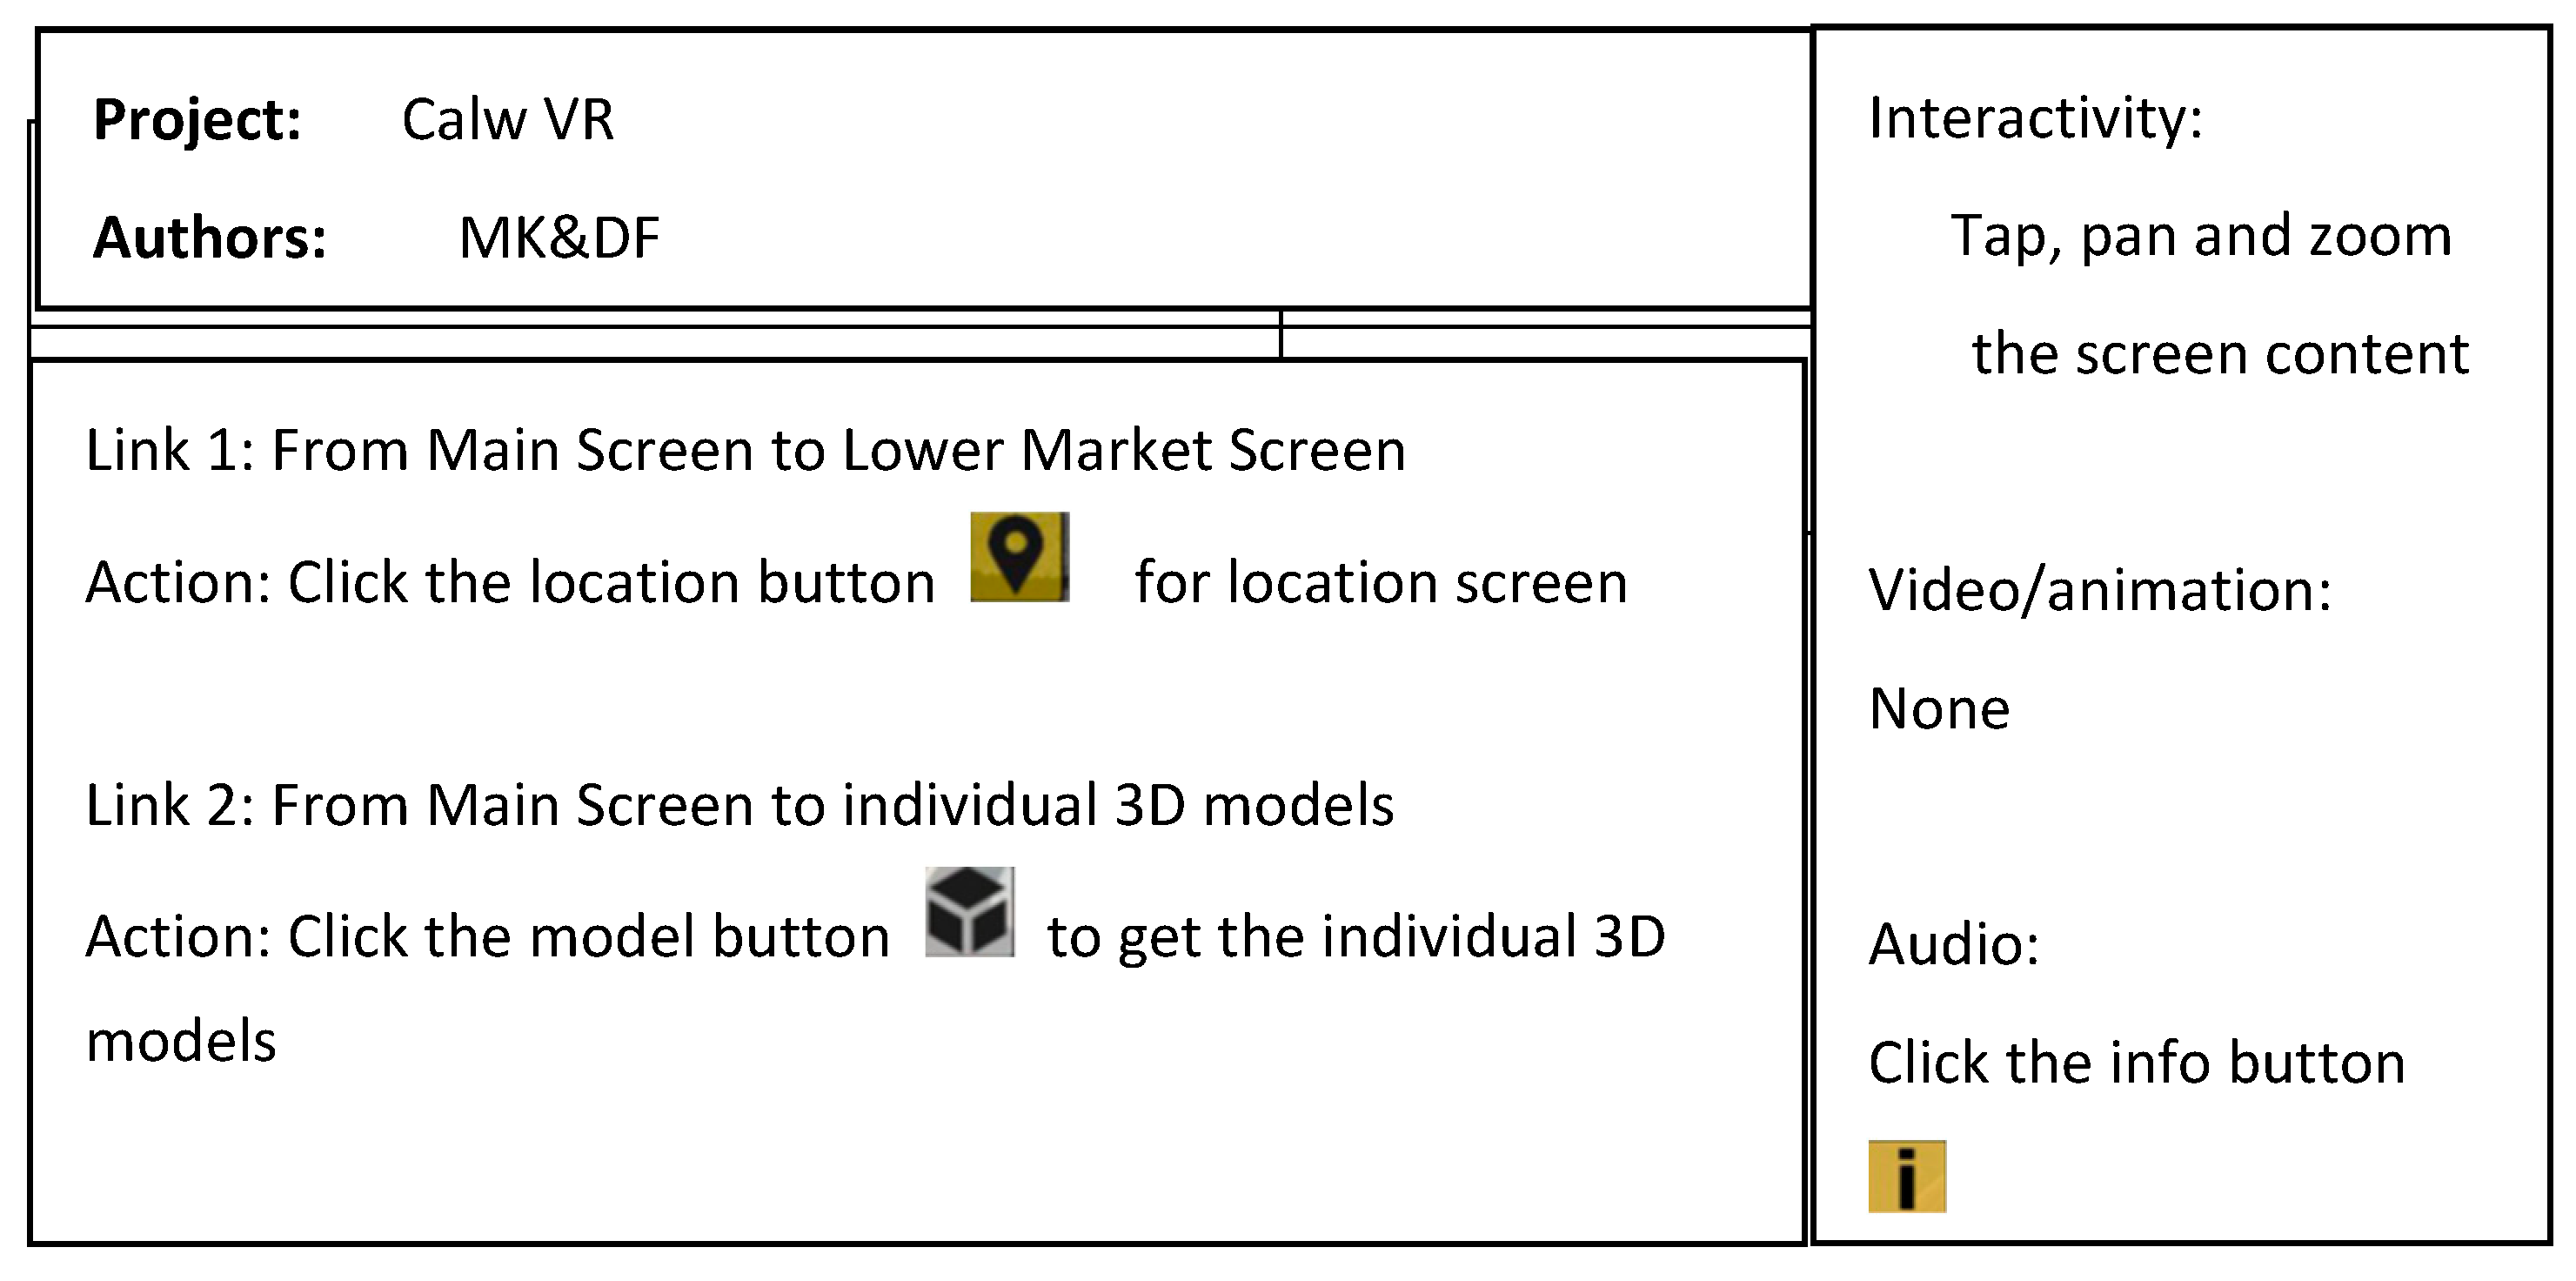
Before designing and implementing an App, a storyboard has to be defined. Storyboards are graphic organizers in the form of illustrations or images displayed in sequence for the purpose of pre-visualizing a motion picture, animation, motion graphic or interactive media sequence. The storyboarding process, in the form it is known today, was developed at the Walt Disney Studio during the early 1930s, after several years of similar processes being in use at Walt Disney and other animation studios. Figure 4 displays an excerpt of the main menu of the storyboard for the Calw VR App.
Designing a storyboard for an App is a very time-consuming process, but very important, as it creates for the programmer an outline of which features and functions must be fulfilled.
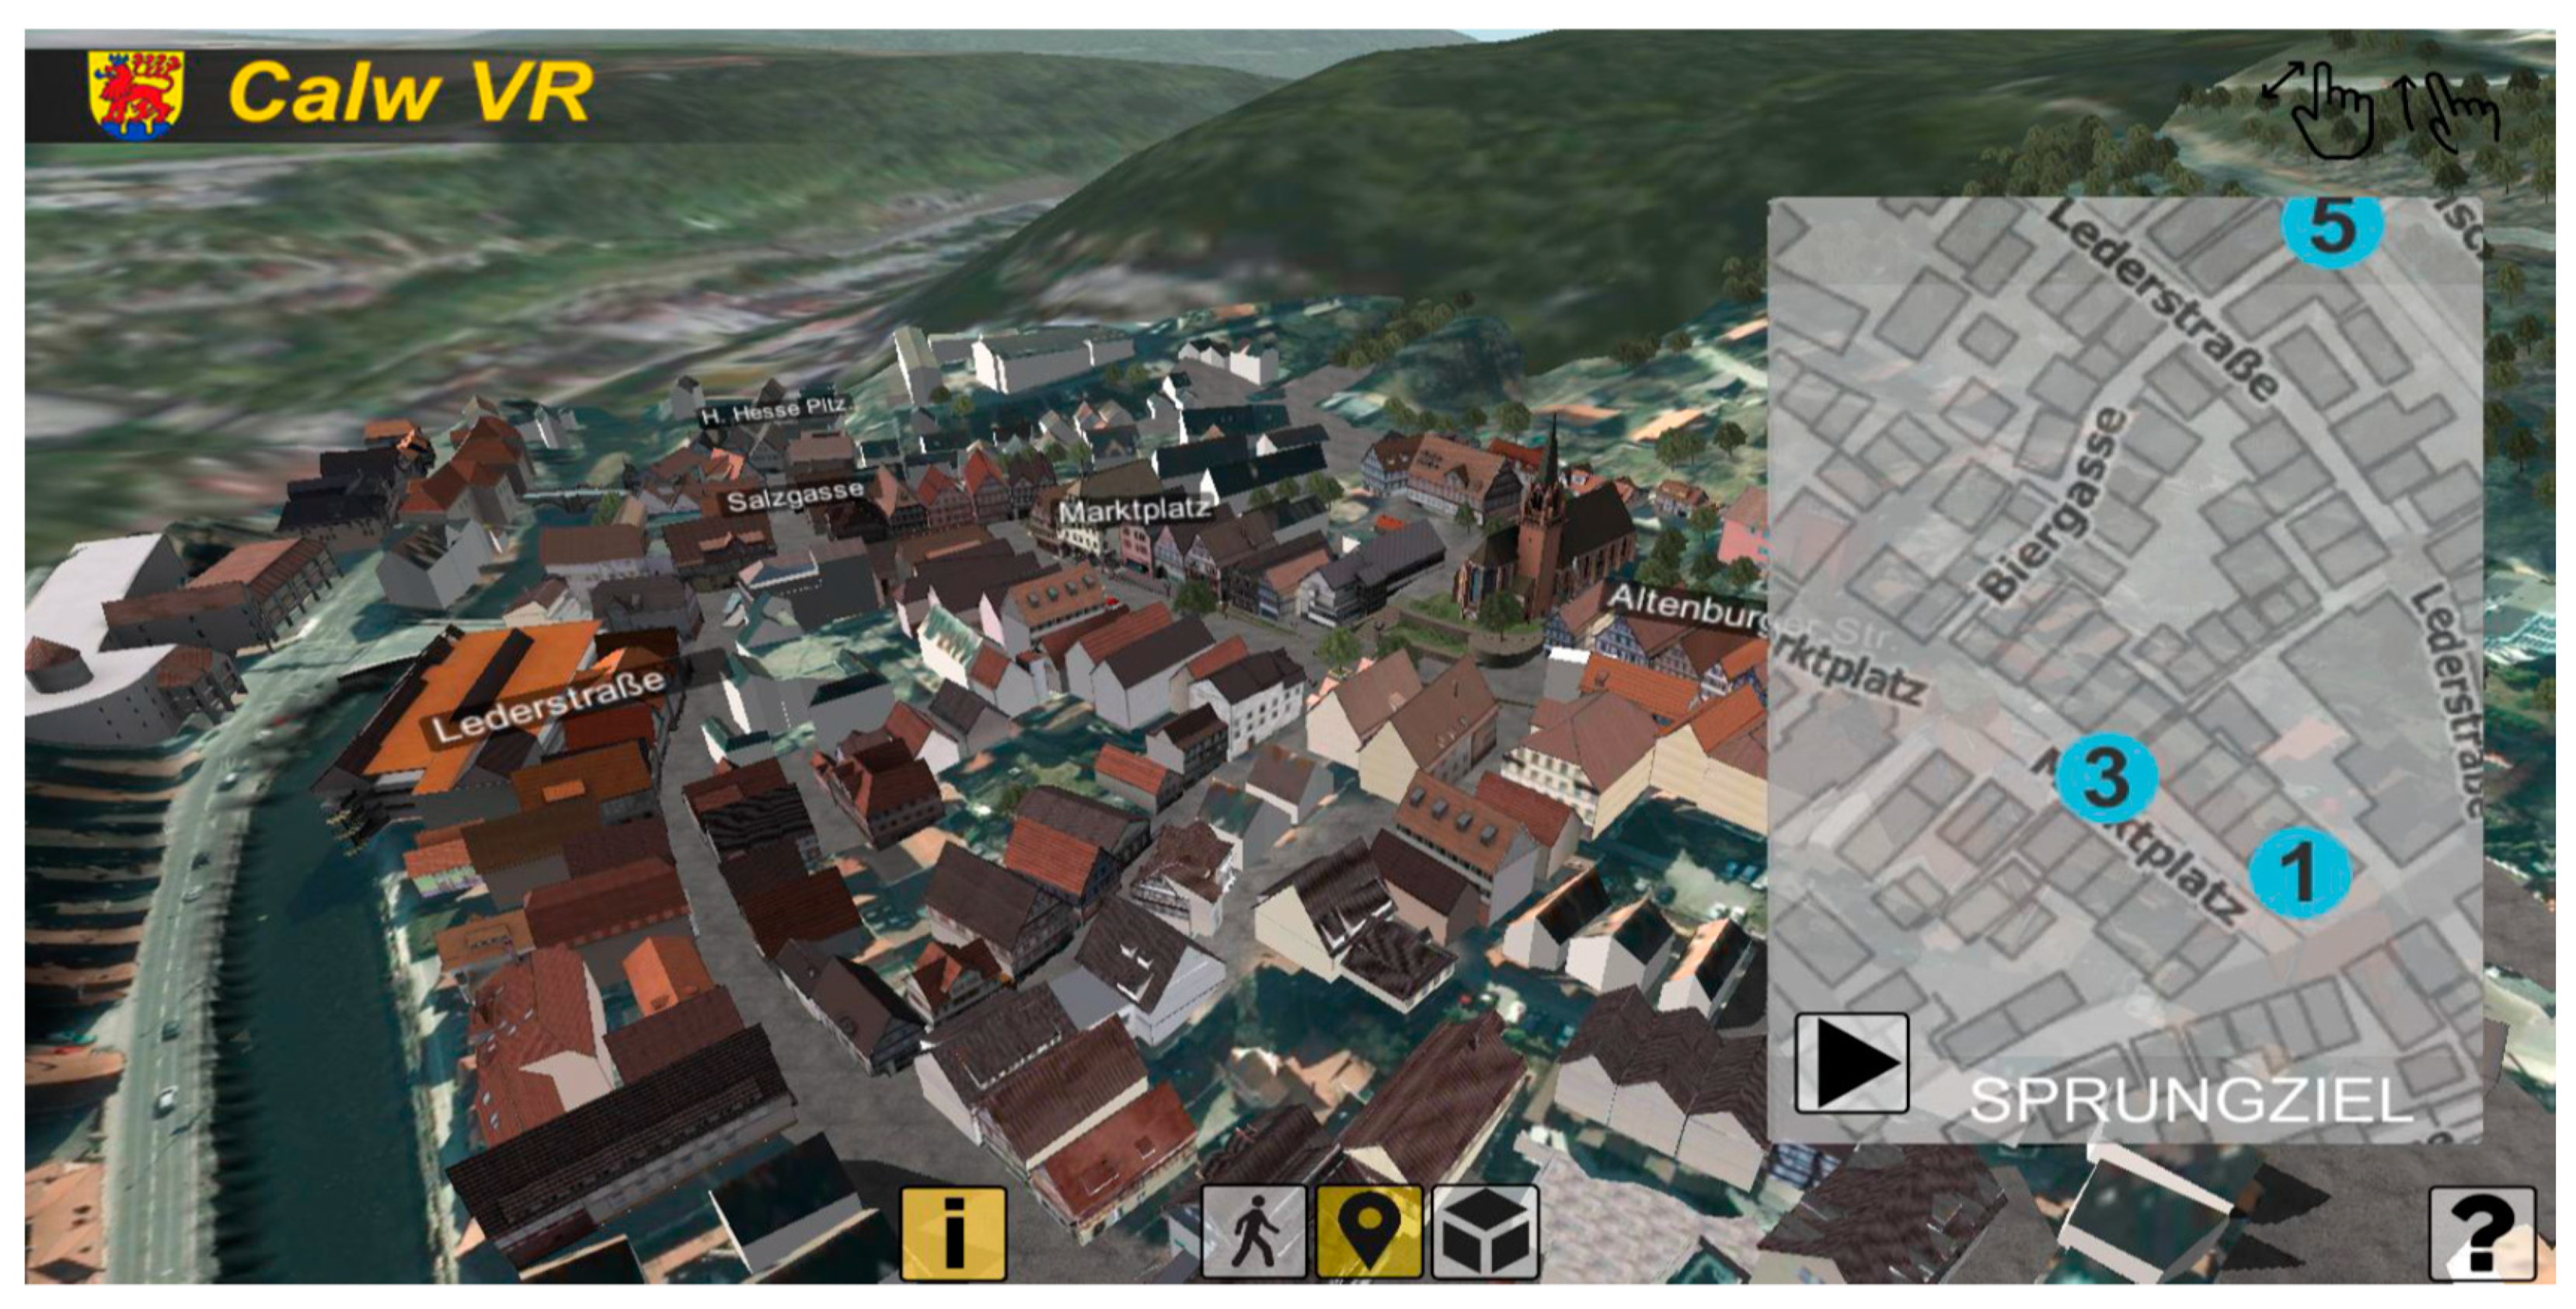
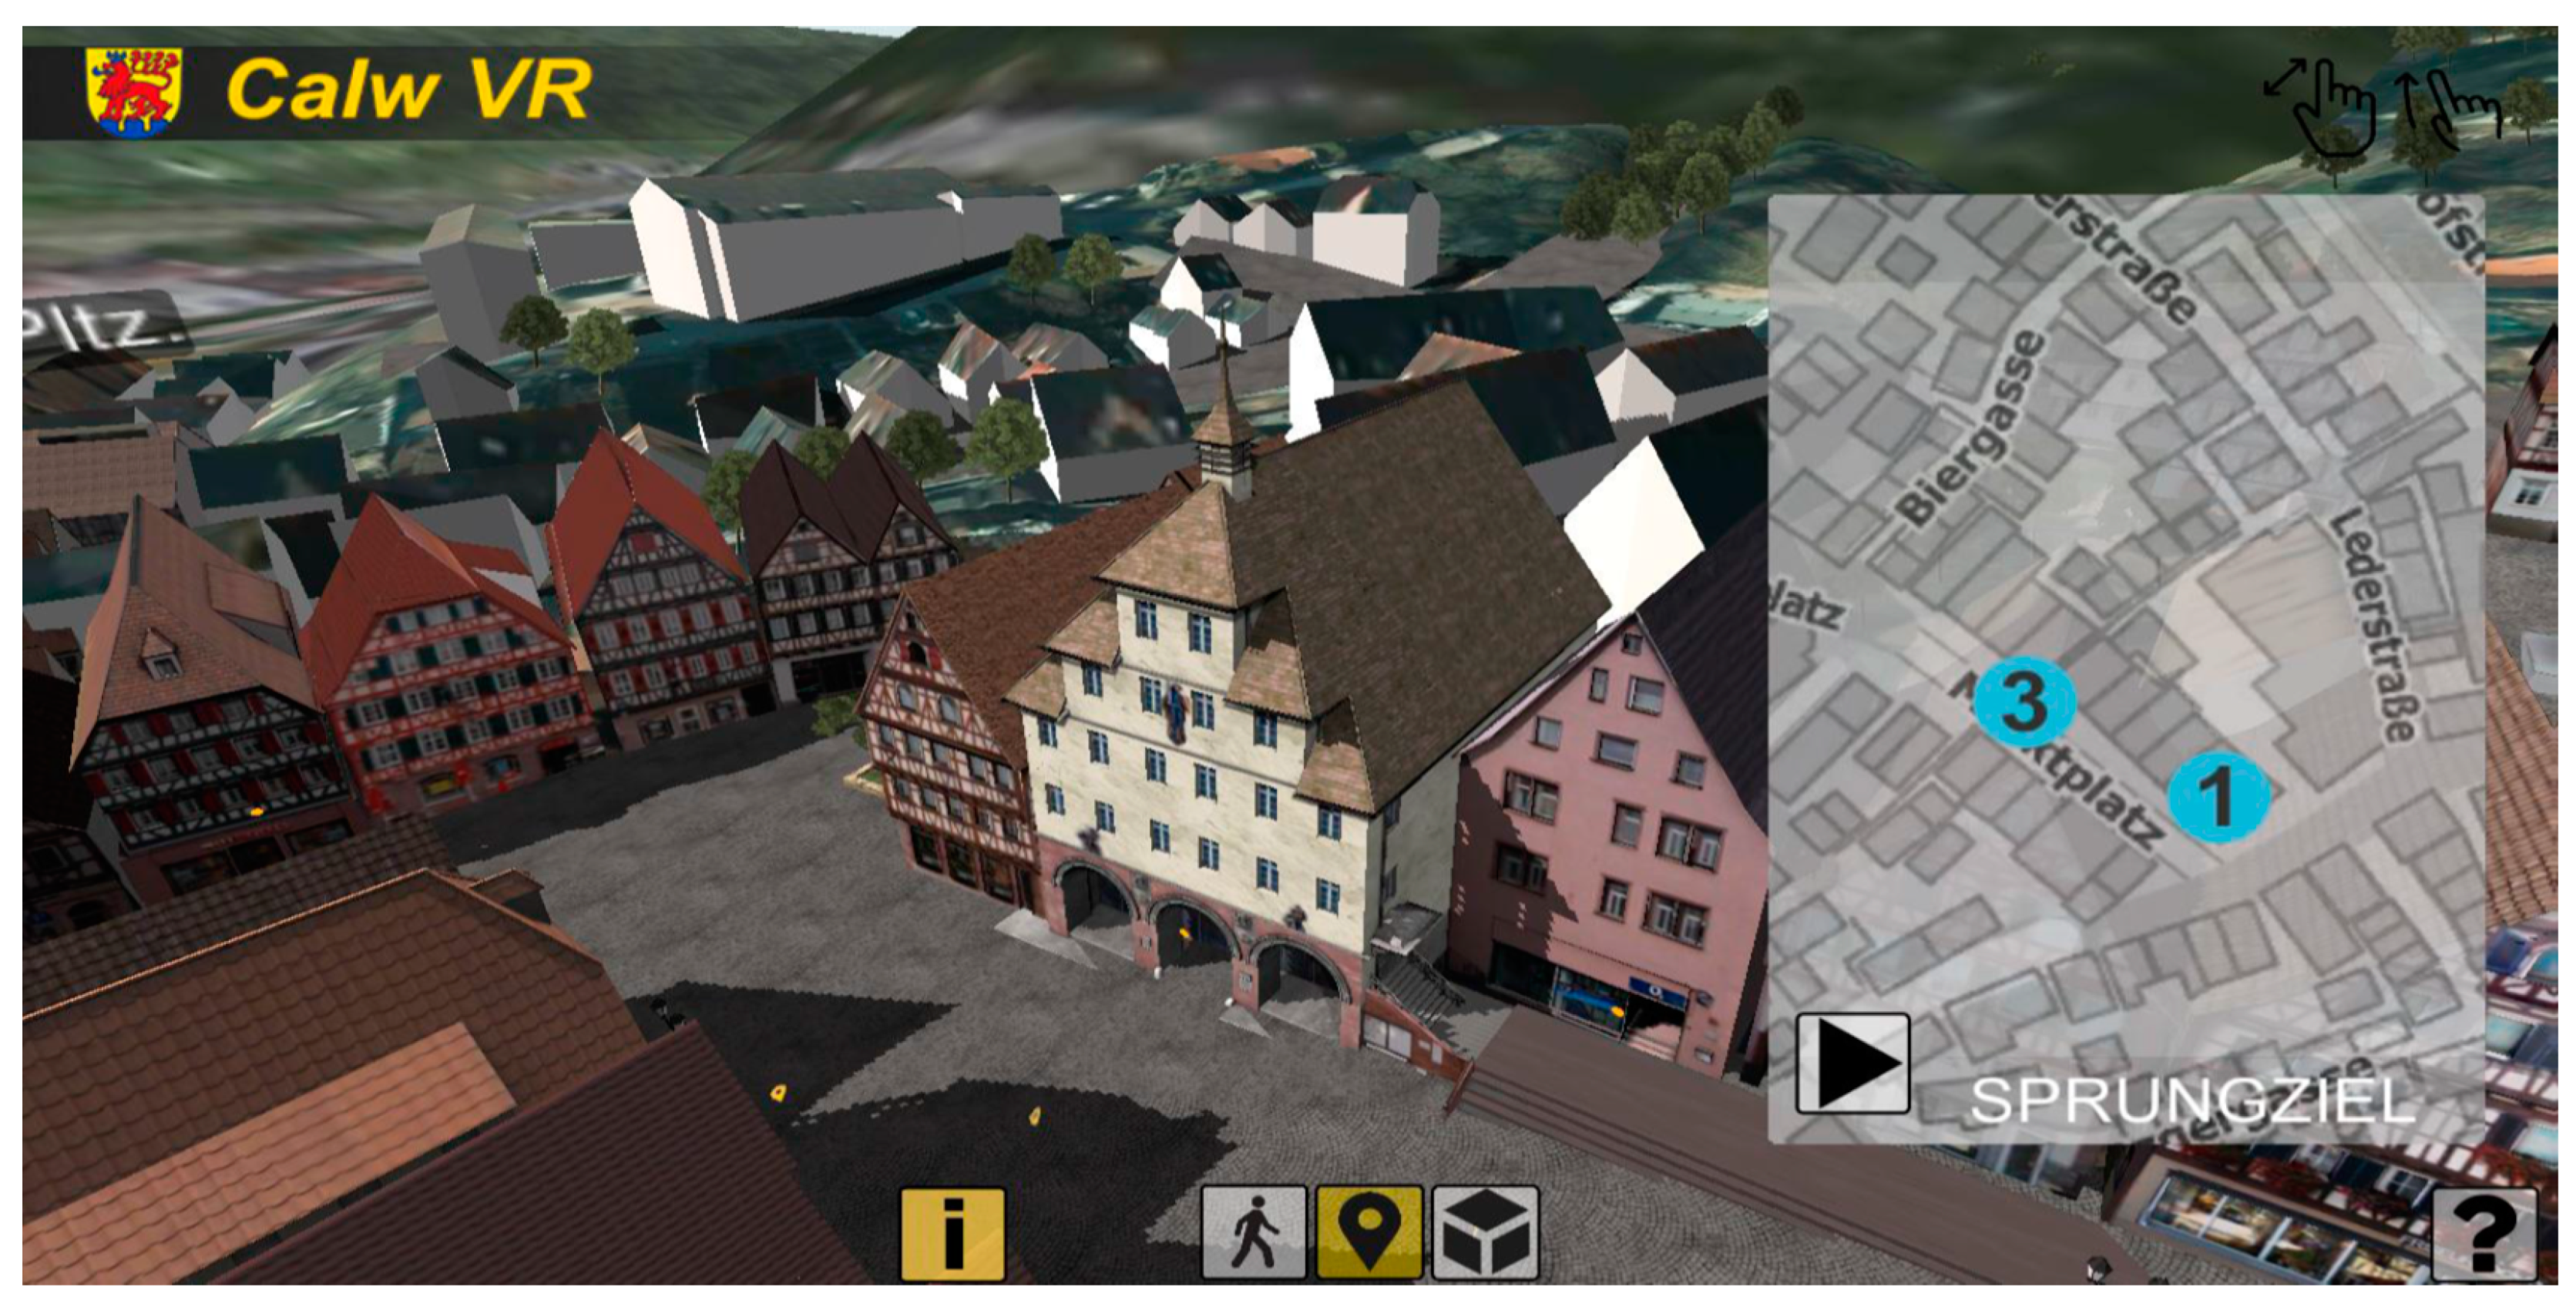
Figure 5 presents the main screen of the Calw VR App and a closer view of the Calw lower market square with the town hall.
HCI and GIS in this issue
As stated before, human-computer-interaction and geographic information science is an ongoing topic. Therefore, the authors are pleased to offer below nine articles dealing with different aspects and presenting advanced tools to access and interpret geospatial data.
The review article of K. Sun, Y. Zhu and J. Song [15] describes the “Progress and Challenges on Entity Alignment of Geographic Knowledge Bases (GKBs)”. To overcome the heterogeneity of GKBs, an entity alignment provides an effective way to find correspondencies of entities by measuring the multidimensional similarity between the entities from different GKBs. After defining basic definitions and a general framework, the state-of-the-art algorithms are reviewed and applied. Obviously, there is a lack of methods to assess the qualities of the GKBs—the aligment process is likely to be improved by determining the best composition of heterogeneous features, optimizing alignment algorithms and incorporating background knowledge.
The article of C. Sasinka et al. [16] deep-dives into “Collaborative Immersive Virtual Environments for Education in Geography”. A unique application for implementing a collaborative immersive virtual environment (CIVE) was developed by an interdisciplinary team as a software solution for educational purposes, with two scenarios for learning about hypsography, i.e., explanations of contour line principles. Both scenarios allow switching between a usual 2D contour map and a 3D model of the corresponding terrain to increase the intelligibility and clarity of the educational content. Gamification principles were also applied to both scenarios to augment user engagement during the completion of tasks.
C. Wang et al. [17] reflect “Gender and Age Differences in Using Indoor Maps for Wayfinding in Real Environments”. This study intends to explore gender and age effects on the use of indoor maps for wayfinding in real environments. Eye-tracking and retrospective verbal protocol methods are used to conduct a wayfinding experiment in a newly opened building. The statistical data was collected and three findings were obtained. Example Finding 1: Males had no significant differences to females in indoor self-location, route reading, and route following. However, males paid less visual attention to the landmark and legends than females during route reading. For the other findings, please read the article.
The article of L. Herman et al. [18] outlines the “Evaluation of User Performance in Interactive and Static 3D Maps.” The main objective is to identify differences between interactive and static 3D maps. They also explore the role of different tasks and inter-individual differences of map users. In the experimental study, effectiveness, efficiency, and subjective preferences are analyzed, when working with static and interactive 3D maps. The study includes 76 participants and uses a within-subjects design. The experimental testing is performed using an own testing tool 3DmoveR 2.0, which is based on a user logging method and open web technologies. Statistically significant differences between interactive and static 3D maps in effectiveness, efficiency, and subjective preferences are demonstrated.
A. Plowright, R. Tortini and N.C. Coops [19] communicate experiences in “Determining Optimal Video Length for the Estimation of Building Height trough Radial Displacement Measurement from Space”. They present a methodology for estimating building heights in downtown Vancouver, British Columbia, Canada, using a high definition video (HDV) recorded from the International Space Station. An iterative routine based on multiresolution image segmentation is developed to track the radial displacement of building roofs over the course of the HDV, and to predict the building heights using an ordinary least-squares regression model. The linear relationship between the length of the tracking vector and the height of the buildings is excellent (r2 ≤ 0.89, RMSE ≤ 8.85 m, p < 0.01).
The article of Y. Zhou et al. [20] refers to “4D Time Density of Trajectories: Discovering Spatiotemporal Patterns in Movement Data”. In cartography, a common way to visualize and explore trajectory data is to use the 3D cube (e.g., space-time cube), where trajectories are presented as a tilted 3D polyline. As larger movement datasets become available, this type of display can easily become confusing and illegible. In addition, movement datasets are often unprecedentedly massive, high-dimensional, and complex (e.g., implicit spatial and temporal relations and interactions), making it challenging to explore and analyze the spatiotemporal movement patterns in space. In this paper, the 4D time density as a visualization method for identifying and analyzing spatiotemporal movement patterns in large trajectory datasets is proposed.
M. Ceh et al. [21] deliver an article dealing with “Estimating the Performance of Random Forest versus Multiple Regression for Predicting Prices of the Apartments”. The goal of this study is to analyze the predictive performance of the random forest machine learning technique in comparison to commonly used hedonic models based on multiple regression for the prediction of apartment prices. A data set that includes 7407 records of apartment transactions referring to real estate sales from 2008–2013 in the city of Ljubljana, the capital of Slovenia, is used in order to test and compare the predictive performances of both models. Apparent challenges faced during modelling include (1) the non-linear nature of the prediction assignment task; (2) input data being based on transactions occurring over a period of great price changes in Ljubljana whereby a 28% decline was noted in six consecutive testing years; (3) the complex urban form of the case study area.
The article of Ahmed Elashry et al. [22] describes “2DPR-Tree: Two-dimensional Priority R-Tree Algorithm for Spatial Partitioning in SpatialHadoop”. Among spatial information applications, SpatialHadoop is one of the most important systems for researchers. Broad analyses prove that SpatialHadoop outperforms the traditional Hadoop in managing distinctive spatial information operations. This paper presents a two dimensional priority R-Tree (2DPR-Tree) as a new partitioning technique in SpatialHadoop. The 2DPR-Tree employs a top-down approach that effectively reduces the number of partitions accessed to answer the query, which in turn improves the query performance. The results are evaluated in different scenarios using synthetic and real datasets.
Finally M. Wu et al. [23] present an article about “An Efficient Visualization Method for Polygonal Data with Dynamic Simplification”. The polygonal data often require rendering with symbolization and simplification in geovisualization. A common issue in existing methods is that simplification, symbolization and rendering are addressed separately, causing computational and data redundancies that reduce efficiency, especially when handling large complex polygonal data. Here, an efficient polygonal data visualization method by organizing the simplification, tessellation and rendering operations into a single mesh generalization process is presented. First, based on the sweep line method, a topology embedded trapezoidal mesh data structure is proposed to organize the tessellated polygons. Second, a horizontal and vertical generalization operation is applied to simplify the trapezoidal meshes.
References
- Bush, V. Internet Notes 2007. Available online: http://www.kerryr.net/pioneers/bush.htm (accessed on 24 July 2019).
- Memex. Internet Notes 2007. Available online: http://en.wikipedia.org/wiki/Memex (accessed on 24 July 2019).
- Bush, V. As we may think. In The American Monthly; National Society of the Daughters of the American Revolution: Washington, DC, USA, 1945. [Google Scholar]
- Engelbart, D. Internet Notes 2007. Available online: http://www.iath.virginia.edu/elab/hfl0035.html (accessed on 24 July 2019).
- ARPANET. Internet Notes 2007. Available online: http://livinginternet.com/i//ii_arpanet.htm & http://en.wikipedia.org/wiki/ARPANET (accessed on 24 July 2019).
- Salus, P.H. Casting the Net: From ARPANET to Internet and Beyond; Addison-Wesley: New York, NY, USA, 1995. [Google Scholar]
- Licklider, J.C.R. Internet Notes 2019. Available online: https://en.wikipedia.org/wiki/J._C._R._Licklider (accessed on 24 July 2019).
- Carroll, J.M. Human-Computer-Interaction—Brief Intro. In The Encyclopedia of Human-Computer Interaction, 2nd ed.; Soegaard, M., Dam, R.F., Eds.; The Interaction Design Foundation: Aarhus, Denmark, 2013; Available online: http://www.interaction-design.org/encyclopedia/human_computer_interaction-hci.html (accessed on 24 July 2019).
- Bulling, A. Human-Computer-Interaction. In Lecture Notes. Computer Science; University of Stuttgart: Stuttgart, Germany, 2019. [Google Scholar]
- ACM SIGCHI: Curricula for Human-Computer Interaction. Available online: http://0-www-acm-org.brum.beds.ac.uk/sigchi/cdg/ (accessed on 24 July 2019).
- Fritsch, D. Podcasting Photogrammetry—A Contribution to Life-Long-Learning. In Photogrammetric Week 07; Fritsch, D., Ed.; Wichmann: Heidelberg, Germany, 2007; pp. 335–344. [Google Scholar]
- Fritsch, D.; Klein, M. 3D Preservation of Buildings—Reconstructing the Past. In Multimedia Tools and Applications (MTAP); Springer: Berlin/Heidelberg, Germany, 2018; Volume 77, pp. 9153–9170. [Google Scholar]
- Fritsch, D.; Klein, M. Design of 3D and 4D Apps for Cultural Heritage Preservation. In Digital Cultural Heritage; Ioannides, M., Ed.; Lecture Notes Computer Science (LNCS); Springer: Cham, Switzerland, 2018; Volume 10605, pp. 211–226. [Google Scholar]
- Harrison, L.T. Introduction to 3D Game Engine Design Using DirectX and C#; Apress: Berkeley, CA, USA, 2003. [Google Scholar]
- Sun, K.; Zhu, Y.; Song, J. Progress and Challenges on Entity Alignment of Geographic Knowledge Bases. ISPRS Int. J. Geo-Inf. 2019, 8, 77. [Google Scholar] [CrossRef]
- Sasinka, C.; Stachon, Z.; Sedlak, M.; Chemlik, J.; Herman, L.; Kubicek, P.; Sasinkova, A.; Dolezal, M.; Tejkl, H.; Urbanek, T.; et al. Collaborative Immersive Virtual Environments for Education in Geography. ISPRS Int. J. Geo-Inf. 2019, 8, 3. [Google Scholar] [CrossRef]
- Wang, C.; Chen, Y.; Zheng, S.; Liao, H. Gender and Age Differences in Using Indoor Maps for Wayfinding in Real Environments. ISPRS Int. J. Geo-Inf. 2019, 8, 11. [Google Scholar] [CrossRef]
- Herman, L.; Jurik, V.; Stachoni, Z.; Vrbik, D.; Russnak, J.; Reznik, T. Evaluation of User Performance in Interactive and Static 3D Maps. ISPRS Int. J. Geo-Inf. 2018, 7, 415. [Google Scholar] [CrossRef]
- Plowright, A.; Tortini, R.; Coops, N.C. Determining Optimal Video Length for the Estimation of Building Height through Radial Displacement Measurement from Space. ISPRS Int. J. Geo-Inf. 2018, 7, 380. [Google Scholar] [CrossRef]
- Zou, Y.; Chen, Y.; He, J.; Pang, G.; Zhang, K. 4D Time Density of Trajectories: Discovering Spatiotemporal Patterns in Movement Data. ISPRS Int. J. Geo-Inf. 2018, 7, 212. [Google Scholar] [CrossRef]
- Ceh, M.; Kilibarda, M.; Lisec, A.; Bajat, B. Estimating the Performance of Random Forest versus Multiple Regression for Predicting Prices of the Apartments. ISPRS Int. J. Geo-Inf. 2018, 7, 168. [Google Scholar] [CrossRef]
- Elashry, A.; Shehab, A.; Riad, A.M.; Abdoul-Fotouh, A. 2DPR-Tree: Two-dimensional Priority R-Tree Algorithm for Spatial Partitioning in SpatialHadoop. ISPRS Int. J. Geo-Inf. 2018, 7, 179. [Google Scholar] [CrossRef]
- Wu, M.; Chen, T.; Zhang, K.; Jing, Z.; Han, Y.; Chen, M.; Wang, H.; Lv, G. An Efficient Visualization Method for Polygonal Data with Dynamic Simplification. ISPRS Int. J. Geo-Inf. 2018, 7, 138. [Google Scholar] [CrossRef]
Figure 1.
(a) The memory expander (memex) of V. Bush. (b) iPhone7 Plus with San Disk USB flash drive.
Figure 1.
(a) The memory expander (memex) of V. Bush. (b) iPhone7 Plus with San Disk USB flash drive.

Figure 2.
Human-computer-interaction depends on many disciplines.

Figure 3.
Collaboration of several scientific fields in 2D, 3D and 4D modeling and visualization.

Figure 4.
Excerpt of the storyboard’s main menu of the Calw VR App.

Figure 5.
Screen (above) and closer view to the town hall (below) of the App Calw VR.


© 2019 by the author. Licensee MDPI, Basel, Switzerland. This article is an open access article distributed under the terms and conditions of the Creative Commons Attribution (CC BY) license (http://creativecommons.org/licenses/by/4.0/).
Share and Cite
MDPI and ACS Style
Fritsch, D. Guest Editor’s Editorial “Cognitive Aspects of Human-Computer Interaction for GIS”. ISPRS Int. J. Geo-Inf. 2019, 8, 337. https://0-doi-org.brum.beds.ac.uk/10.3390/ijgi8080337
AMA Style
Fritsch D. Guest Editor’s Editorial “Cognitive Aspects of Human-Computer Interaction for GIS”. ISPRS International Journal of Geo-Information. 2019; 8(8):337. https://0-doi-org.brum.beds.ac.uk/10.3390/ijgi8080337
Chicago/Turabian StyleFritsch, Dieter. 2019. "Guest Editor’s Editorial “Cognitive Aspects of Human-Computer Interaction for GIS”" ISPRS International Journal of Geo-Information 8, no. 8: 337. https://0-doi-org.brum.beds.ac.uk/10.3390/ijgi8080337
Note that from the first issue of 2016, this journal uses article numbers instead of page numbers. See further details here.