Article

An Improved Global Analysis of Population Distribution in Proximity to Active Volcanoes, 1975–2015

by
Sergio Freire
1,2,*,
Aneta J. Florczyk
1,
Martino Pesaresi
1 and
Richard Sliuzas
2
1
European Commission, Joint Research Centre (JRC), 21027 Ispra, Italy
2
University of Twente, Faculty of Geo-Information Science and Earth Observation, 7514 AE Enschede, The Netherlands
*
Author to whom correspondence should be addressed.
ISPRS Int. J. Geo-Inf. 2019, 8(8), 341; https://0-doi-org.brum.beds.ac.uk/10.3390/ijgi8080341
Submission received: 14 June 2019 / Revised: 8 July 2019 / Accepted: 24 July 2019 / Published: 31 July 2019

Abstract

:
Better and more detailed analyses of global human exposure to hazards and associated disaster risk require improved geoinformation on population distribution and densities. In particular, issues of temporal and spatial resolution are important for determining the capacity for assessing changes in these distributions. We combine the best-available global population grids with latest data on volcanoes, to assess and characterize the worldwide distribution of population from 1975–2015 in relation to recent volcanism. Both Holocene volcanoes and those where there is evidence of significant eruptions are considered. A comparative analysis is conducted for the volcanic hot spots of Southeast Asia and Central America. Results indicate that more than 8% of the world’s 2015 population lived within 100 km of a volcano with at least one significant eruption, and more than 1 billion people (14.3%) lived within 100 km of a Holocene volcano, with human concentrations in this zone increasing since 1975 above the global population growth rate. While overall spatial patterns of population density have been relatively stable in time, their variation with distance is not monotonic, with a higher concentration of people between 10 and 20 km from volcanoes. We find that in last 40 years in Southeast Asia the highest population growth rates have occurred in close proximity to volcanoes (within 10 km), whereas in Central America these are observed farther away (beyond 50 km), especially after 1990 and for Holocene volcanoes.

Graphical Abstract

1. Introduction

Volcanic eruptions are among the most powerful and destructive natural hazards on Earth, capable of causing widespread human suffering and extensive economic losses, both from direct impacts and through the disturbances to livelihoods arising from indirect or cascading effects (e.g., via disruptions of air transport, through originating tsunamis, etc.) [1]. Severe eruptions can cause rapid global changes by modifying weather patterns, disrupting climate, and, as in the past, induce mass extinctions of species [2].
Although moderate to large volcanic eruptions are infrequent, these are potentially high-consequence incidents, especially for nearby populations due to lava flows, ash deposition, pyroclastic events, and other phenomena [3]. Still, the 2010 eruption of Eyjafjallajökull volcano in Iceland demonstrated that even modest eruptions in relatively remote locations can have global impacts [2,4]. Volcanic activity can have a disproportionate effect on livelihoods and economy because of high systemic vulnerability [5].
Volcanoes located in densely populated areas, however, do not need to have powerful eruptions to produce devastating effects. In such settings, even small- to moderate-sized eruptions may constitute severe threats, by generating multiple hazards which can affect areas from the immediate vicinity up to hundreds of kilometres distance (for detailed discussion see [6,7]). In a study of past disasters, residents make up the largest number of fatalities [7].
Beyond their destructive power, volcanoes and volcanic activity can also benefit humans and their livelihoods. Among their major beneficial effects are the provision of nutrients to the surrounding soil, favoring agricultural productivity—an important aspect in agrarian societies—but also economic activities such as resource extraction (e.g., Sulfur mining), tourism, and geothermal energy [2]. Such benefits help to explain population concentrations in their vicinity. In addition, tropical volcanoes provide climatic advantages relative to surrounding regions [8], which may have promoted human settlement and the clustering of people. Such clustering in proximity to active volcanoes creates exposure levels with changes that vary in space or time [9]. This exposure combines with existing vulnerabilities to generate risk and the potential for losses. Evidence indicates that exposure of persons and assets in all countries has increased faster than vulnerability has decreased, thus generating new risks [10].
Evaluating potential or actual human exposure for global disaster risk assessment is as essential as it is challenging, being limited by the availability and quality of geophysical and socio-economic data [11,12]. As a result, previous estimations of human exposure were typically conducted for small areas and without a temporal dimension, or merely approximated with coarse population geoinformation (~1 km grids). However, the rapid increase in exposure of population and assets is currently a major driver of growing disaster risk [13], requiring adequate global geoinformation layers depicting the distribution and densities of population. Such geoinformation is valuable throughout the emergency management cycle, but for timely and efficient response it should be prepared and made available beforehand [14]. After a disaster event, the quality and granularity of population data have a direct effect on response and lives saved [15]. Although global population grids have been produced since the 1990s, they have suffered from some issues which limit their usability [16,17]. Among these are their coarse spatial resolution, incomplete discrimination of settlements (especially smaller ones), and the use of dichotomous maps of built-up in their construction. Also, for change detection and analysis, a coherent and robust spatio-temporal production model is required to allow objective comparisons.
Concerning volcanic risk, [18] highlight that risk elements are on the rise, most notably population exposure. The shifting focus of urbanization from developed to developing countries taking place in recent decades is also increasing global exposure to natural hazards, including volcanism [6]. Volcanic activity remains a constant threat globally and the number of people at risk from volcanism is rising with increased urbanization and population growth [2,6,7,19]. However, volcanic risk analysis and assessment at the global scale is not as advanced as for other hazards such as flooding, earthquakes and tropical cyclones [5], being limited by the availability and quality of data [20], especially regarding their consistency and detail. Similarly to earthquakes, volcanic eruptions are difficult to mitigate technologically [21], in that the hazard component can hardly be decreased by human action. While expected losses may be lower than those from other hazards at a global scale, in affected regions, they can be very significant. Since 1950, an average of 31 volcanoes have erupted each year [1], and at any one time at least 20 are erupting [22,23]. Given this context, major gains to disaster risk reduction are to be obtained through reductions in vulnerabilities and especially in exposure, requiring improved assessments of these components.

1.1. Potential Global Population Exposure to Volcanic Hazard—Narrowing Data Gaps

Several assessments of potential worldwide population exposure to volcanic hazard have been conducted using globally-available population grids, e.g., [3,8,24,25]. However, most such studies are now relatively outdated, or use coarse population geoinformation. Often, assessments are based on data that are neither open nor free.
Small and Naumann [8] in their landmark work quantified human proximity to both Holocene and historically active volcanoes for 1990, but underlined that the spatial resolution of population data used (GPWv2) imposes limitations on the analysis and is not adequate for detailed assessment of potential volcanic risk. Ewert and Harpel [19] have proposed a Volcano Population Index (VPI) to make objective estimates and comparisons of the number of people at risk from volcanic hazards. Within a given radius of a volcanic vent, the index quantifies one component of risk—population—from one volcano to another. The authors have noted that the 1-kilometer grid size of the population grid used (LandScan) was the principal limiting factor in making precise estimates of population at risk [19]. The Population Exposure Index (PEI) [24] is one of the prominent indices used in assessing volcano risk. It is based on the population within 10, 30, and 100 km of a volcano, which is then weighted according to evidence on historical distributions of fatalities within a given distance from volcanoes. The PEI is divided into seven levels, from sparsely to very densely populated areas. The authors have stated that the main drawback of such methods is that they rely on a number of parameters having high uncertainty or that are simply unknown for many volcanoes. This limits application of the method mainly to those with good historical records [26]. As a simpler and more direct way to compare different volcanoes or volcanic areas, [26] has proposed a volcanic risk coefficient (VRC) using the number of people that may be affected by the maximum expected eruption as a main variable. In addition to the estimation of this specific hazard information, this still requires detailed and comparable population distribution data.
Common to all these efforts is the need for up-to-date and spatially-explicit population distribution data, which are globally-consistent and have sufficient resolution to support detailed analyses and comparisons. This is especially important as databases of locations and features of potential volcano hazard (i.e., GPV) are also subject to frequent revisions and updates, thereby inviting parallel re-assessments of global and regional potential population exposure.
Improved modeling and mapping of global population distribution can be achieved with remote sensing imagery and methods, which have been evolving towards a more detailed, objective and independent data source on the human presence on the Earth surface [27]. The multiscale synoptic perspective is considered one of the core strengths of remote sensing when it comes to questions of urban and socio-economic development and in regards to the closely interlinked disaster risk domain [28]. In the specific case of population exposure to volcanic hazard, [7] point out that “moderate resolution satellite imagery, such as that provided by the Landsat series, could provide more spatially explicit quantifications of settlement patterns in the vicinity of potentially active volcanoes. More recently, [29] advocates for full exploitation of rapid, large-scale data collection based on remote sensing, while also stressing that dissemination of exposure data is key to empowering end-users and communities and for allowing and encouraging risk evaluation.

1.2. The Contribution of the Global Human Settlement Layer (GHSL) to DRM

The recent application of new cost-effective, automated and fully replicable data classification methods (e.g., symbolic machine learning) to contemporary open and free global satellite imagery collections have enabled the emergence of a new generation of geospatial data derived from remote sensing, led by the Global Human Settlement Layer (GHSL) [30]. These developments allowed the global mapping of built-up areas and settlements with unprecedented spatio-temporal detail and accuracy [30,31,32], under a set of pragmatic requirements and principles summarized in [33]. Among other uses, these new datasets are providing an effective contribution to population disaggregation and other population distribution modeling efforts, especially due to a combination of:
  • Semantic robustness and interoperability
  • Currency of data
  • Spatial detail
  • Global coverage
  • Temporal depth
  • Provision of open and free data
GHSL’s enhanced spatio-temporal mapping of buildings and density of built-up areas offers a suitable proxy for the location of people and, as such, is being used to improve the disaggregation of census data into derived population grids [34,35,36,37,38].
From its inception, development of GHSL was driven by requirements for post- disaster and post-conflict damage, needs and reconstruction assessment, including refugee camps and temporary, rapidly-changing human settlement monitoring [39]. Therefore Disaster Risk Management and Reduction is a major field of application of GHSL data, and among the uses of its population distribution grids (GHS-POP) are the baseline estimation of multi-temporal exposure to global hazards [40,41] and assessment of impacts from climate hazards [42], including the current and future projections of risk of river flood [43] (https://www.efas.eu; http://www.globalfloods.eu), and support to creation of risk indices for management for humanitarian crises and disasters (e.g., INFORM—Index for Risk Management (http://www.inform-index.org).
The GHSL layers and especially population distribution data enable conducting more updated, refined, and longitudinal assessments of population potentially affected by different types of natural hazards [41], including threats posed by volcanoes [44]. Due to their characteristics, it is expected that these new population data can further advance, update, and detail assessment of population distribution in the vicinity of active volcanoes and contribute to enhance estimations of potential exposure to this type of hazard.
In this article, we aim to characterize with unprecedented detail the changes in the distribution of human population in proximity to historically active volcanoes, focusing on the last 40 years. We do that by combining detailed geospatial grids of global population densities for the 1975–1990–2000–2015 period with the latest data on distribution of volcanoes on Earth, considering both Holocene volcanoes and those having significant eruptions. We investigate the recent evolution and current distribution of population in relation to historical volcanism and discuss how overall potential population exposure and density patterns have been varying with distance. More detailed attention is dedicated to Southeast Asia and Central America, where concentrations of people in vicinity of volcanoes are greater than in other volcanic regions. This work details and updates preliminary research done by [44] and shows the value of using the more recent datasets in future assessments of volcanic risk.

2. Materials and Methods

In Section 2.1, we present and discuss the datasets used, including a description of the production and features of the global population grids that made this study possible, and the global datasets of volcanoes. In Section 2.2, we present the methodology that was applied for assessing global population distribution in relation to historical and significant volcanism.

2.1. Data

2.1.1. Global Population Distribution Grids 1975–2015

In order to assess population distribution in relation to distance to volcanoes, we have used population grids for 1975, 1990, 2000, and 2015 produced in the frame of the Global Human Settlement Layer (GHSL) project. These grids (GHS-POP), reporting the distribution and density of total resident population per 250-m cell, are created by using maps of density of built-up areas [32] for matching epochs as proxy for disaggregating best-available population estimates [35].
GHS-POP is based on population estimates provided by CIESIN’s Gridded Population of the World (GPW) v4.10 for matching periods [45], with national figures adjusted to UN World Population Prospects [46]. CIESIN collects and integrates the most recent and finest resolution census data available, and the CIESIN-GPWv4.10 input dataset includes the latest round of censuses (2010–2011) and comprises more than 12 million census or administrative units, with average spatial resolution varying widely by country.
The GHS-POP population grids effectively harmonize and increase the resolution of this variable in space and time by using consistent ancillary data and methods. Among the specific methodological features of these grids are:
(i)
the use of a single spatially and temporally-explicit proxy (built-up areas from GHSL);
(ii)
this proxy is mostly of higher spatial resolution than census data and is derived with a consistent approach;
(iii)
the employment of a simple, transparent and consistent methodology for population disaggregation.
GHS-POP is also unique among current global population grids in that cell values represent both counts and densities of population, by using as native projection the World Mollweide equal-area projection. The latest release of GHS-POP used in this study (made publicly available in 2019), mitigates important shortcomings of previous population grids by improving representation of distributions along coastlines and critically revising areas declared as ‘unpopulated’ but where significant evidence of human habitation existed [27]. Therefore GHS-POP is especially suited for supporting Disaster Risk Management (DRM) tasks by refining distribution of resident population to known places of human shelter and activities (i.e., buildings), where most people spend the majority of their time.
Due to these characteristics and given that GHS-POP is currently the only global dataset that spans the last 40 years with comparable, detailed, open, and free data on distribution of population in settlements, it allows investigating population distribution in proximity to volcanoes in this period.

2.1.2. Global Geographical Distribution of Volcanoes

The proximal analysis of population was conducted considering two widely used global datasets of volcanoes, available online: the Holocene Volcano List v. 4.7.6 (Volcanoes of the World 4.7.6.) of the Smithsonian Institution’s Global Volcanism Program (GVP) [47] and the NOAA Significant Volcanic Eruption Database [48], this one also based on GVP.
The Holocene Volcano List (HV in this article) is a global listing of volcanoes believed to have been active during the Holocene period (the last ~10,000 years). This database includes information on the latitude, longitude, elevation, type of volcano, and last known eruption. The HV database is frequently updated and v. 4.7.6 used in this work includes 1432 volcanoes, of which 118 are submarine volcanoes and 83 correspond to volcanic fields.
The Significant Volcanic Eruption Database (SV in this article) is a global listing of over 500 significant eruptions. The current version used here lists 826 eruptions for 265 volcanoes. This database includes information on volcanoes (i.e., latitude, longitude, geographic location, elevation, type of volcano), their eruptions (date of eruption, the assigned Volcanic Explosivity Index (VEI) and associated events, such as tsunami and/or earthquake), and impact (fatalities, estimated economical damage, etc.). A significant eruption is defined as one that meets at least one of the following criteria: caused fatalities, produced moderate damage (approximately 1 million USD or more), had a Volcanic Explosivity Index (VEI) of 6 or larger, caused a tsunami, or was associated with a major earthquake [48]. Figure 1 shows the global distribution of volcanoes from the above databases that were considered in this study.

2.2. Assessing Global Population Distribution and Volcanism

We analyzed global population distribution as a function of distance to volcanoes in 1975, 1990, 2000, and 2015, using the 250 m population grids (GHS-POP) for the respective epochs. Using GIS software, population distribution was analyzed up to a radial distance of 100 km from volcanoes, by buffering each volcano in 1 km steps and conducting zonal analysis of population grids. Given the global scope of this analysis and the challenges involved with measuring accurately both distances and areas (impossible in same cartographic projection), and the fact that population grids are produced in equal-area projection (thus representing both counts and densities), we devised the following procedure:
(1)
Calculation of distance buffers from volcanoes in World Equidistant Cylindrical projection;
(2)
Merging the resulting buffers by distance (i.e., dissolve by distance function);
(3)
Re-projection of the distance buffers to World Mollweide projection;
(4)
Rasterization to the working grid (i.e., 250 m World Mollweide aligned with the GHS global grid), and calculation of landmass surface and population counts per each buffer in World Mollweide.
This approach tries to minimize distortions in distances, areas, and population counts. The considerable effort expended to maintain the accuracy of underlying databases is an aspect that is absent (or omitted) from previous global analyses [3,8,24,25], therefore constituting a relevant new feature of the current analysis.
For discussing the results, four distances from volcanoes were selected as being especially relevant: 10, 30, 50, and 100 km. Aspinall et al. [24] adopted 10 and 30 km in their PEI proposal. Moreover, 10 km is a frequently used distance for evacuation after moderate to large eruptions. Regarding the 50 km mark, [7] have identified that close to 100% of volcanic fatalities registered have occurred within this distance from volcanoes. 100 km is considered relevant as a maximum distance from volcanoes for assessing the direct effects of volcanic eruptions, since lethal pyroclastic flows and surges [49], and lahars [50] may occasionally extend to these distances. Among twelve destructive phenomena associated with volcanic eruptions, it is estimated that seven can potentially reach such a distance [6]. Given the observation by [8] that higher population densities in Southeast Asia and Central America lie in closer proximity to volcanoes than in other volcanic regions, we conduct a more detailed analysis of results for these regions. As in that work, volcanic regions are considered to be those with a significant number of persistently active volcanoes.

3. Results and Discussion

3.1. Global Population Distribution from 1975 to 2015 in Relation to Volcanism

This section presents and discusses the global distribution of population from 1975 to 2015 in relation to volcanism, considering both overall population in each period and annual growth rates by distance to both HV and SV. While the first part focuses on significant distance ranges up to 100 km of volcanoes, a second part analyses the specific spatio-temporal patterns of population density within 50 km of volcanoes in more detail.
Table 1 shows total accumulated population within selected distance ranges (radial distances) from Holocene volcanoes (HV), for each period considered. Results show that the total population living in proximity of Holocene volcanoes (HV) is very significant and that this amount has been increasing steadily in last 40 years. In 2015, more than 1 billion people, 14.3% of the global population, are estimated to live within a range of potential direct impact of volcanic eruptions (i.e., within 100 km). Close to 60 million people are estimated to live within potential evacuation range worldwide (i.e., within 10 km).
Concerning population growth rates in vicinity of Holocene volcanoes (HV) (Table 2), these are generally decreasing with time, accompanying global population trends. These rates were especially high from 1975 to 2000, and were increasing with proximity to HV. However, despite slowing down with time, rates in vicinity of HV were largely above the global average in all periods.
Table 3 and Table 4 refer to variation of population within selected distances of volcanoes with significant eruptions (SV). Results show that this population has also been increasing steadily and amounts to 616 million in 2015, or 8.4% of global population. Also very significant are the 21 million people living within 10 km of these volcanoes.
Regarding population change with distance bands, growth rates are lower than in proximity to HV. Also differently from HV, population growth has been generally decreasing with time but also with proximity to SV volcanoes, except for the closest distance band (10 km). Only in the period 1975–1990 did population in these areas increase above the overall growth rate, having dipped below the global rate in the most recent period. In the period 2000–2015, population growth in these areas dipped below global growth, especially closer than 30 km from volcanoes. This may be related to: (i) the specific demographic trends of the countries and areas where SV volcanoes are located and/or (ii) with an increased awareness of the threat posed by these volcanoes and limitations to settlement in their vicinity.
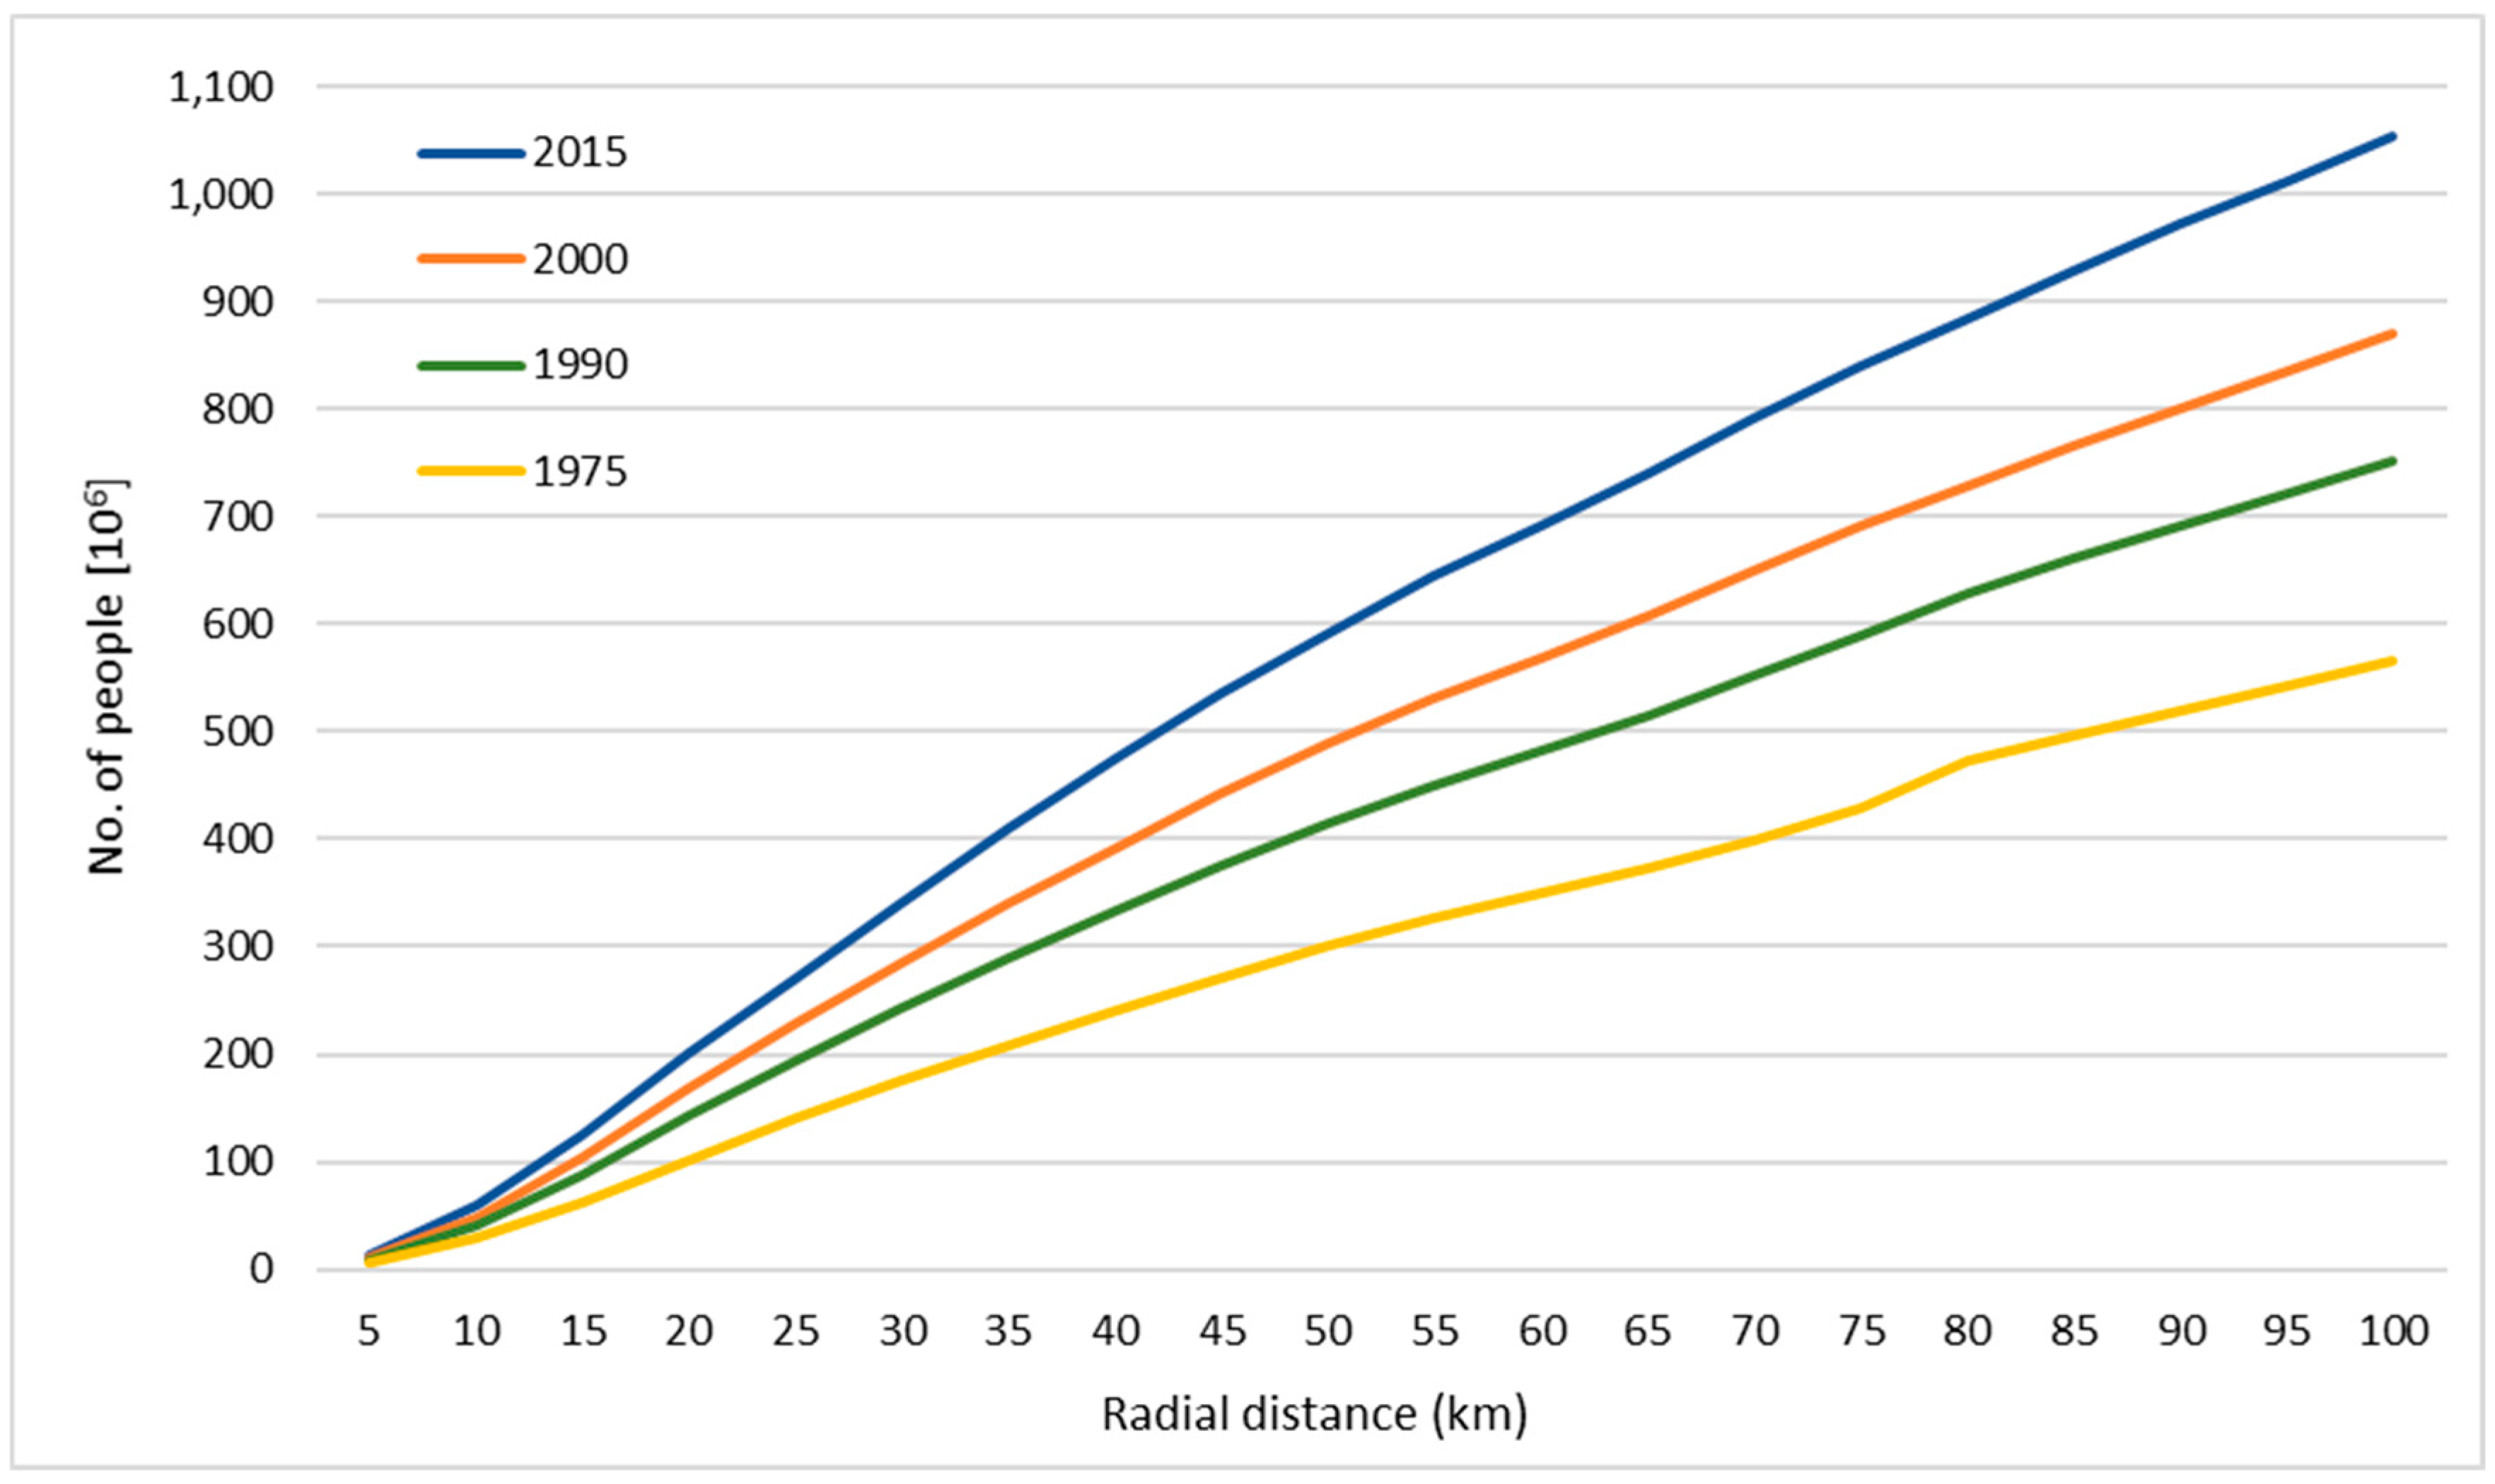
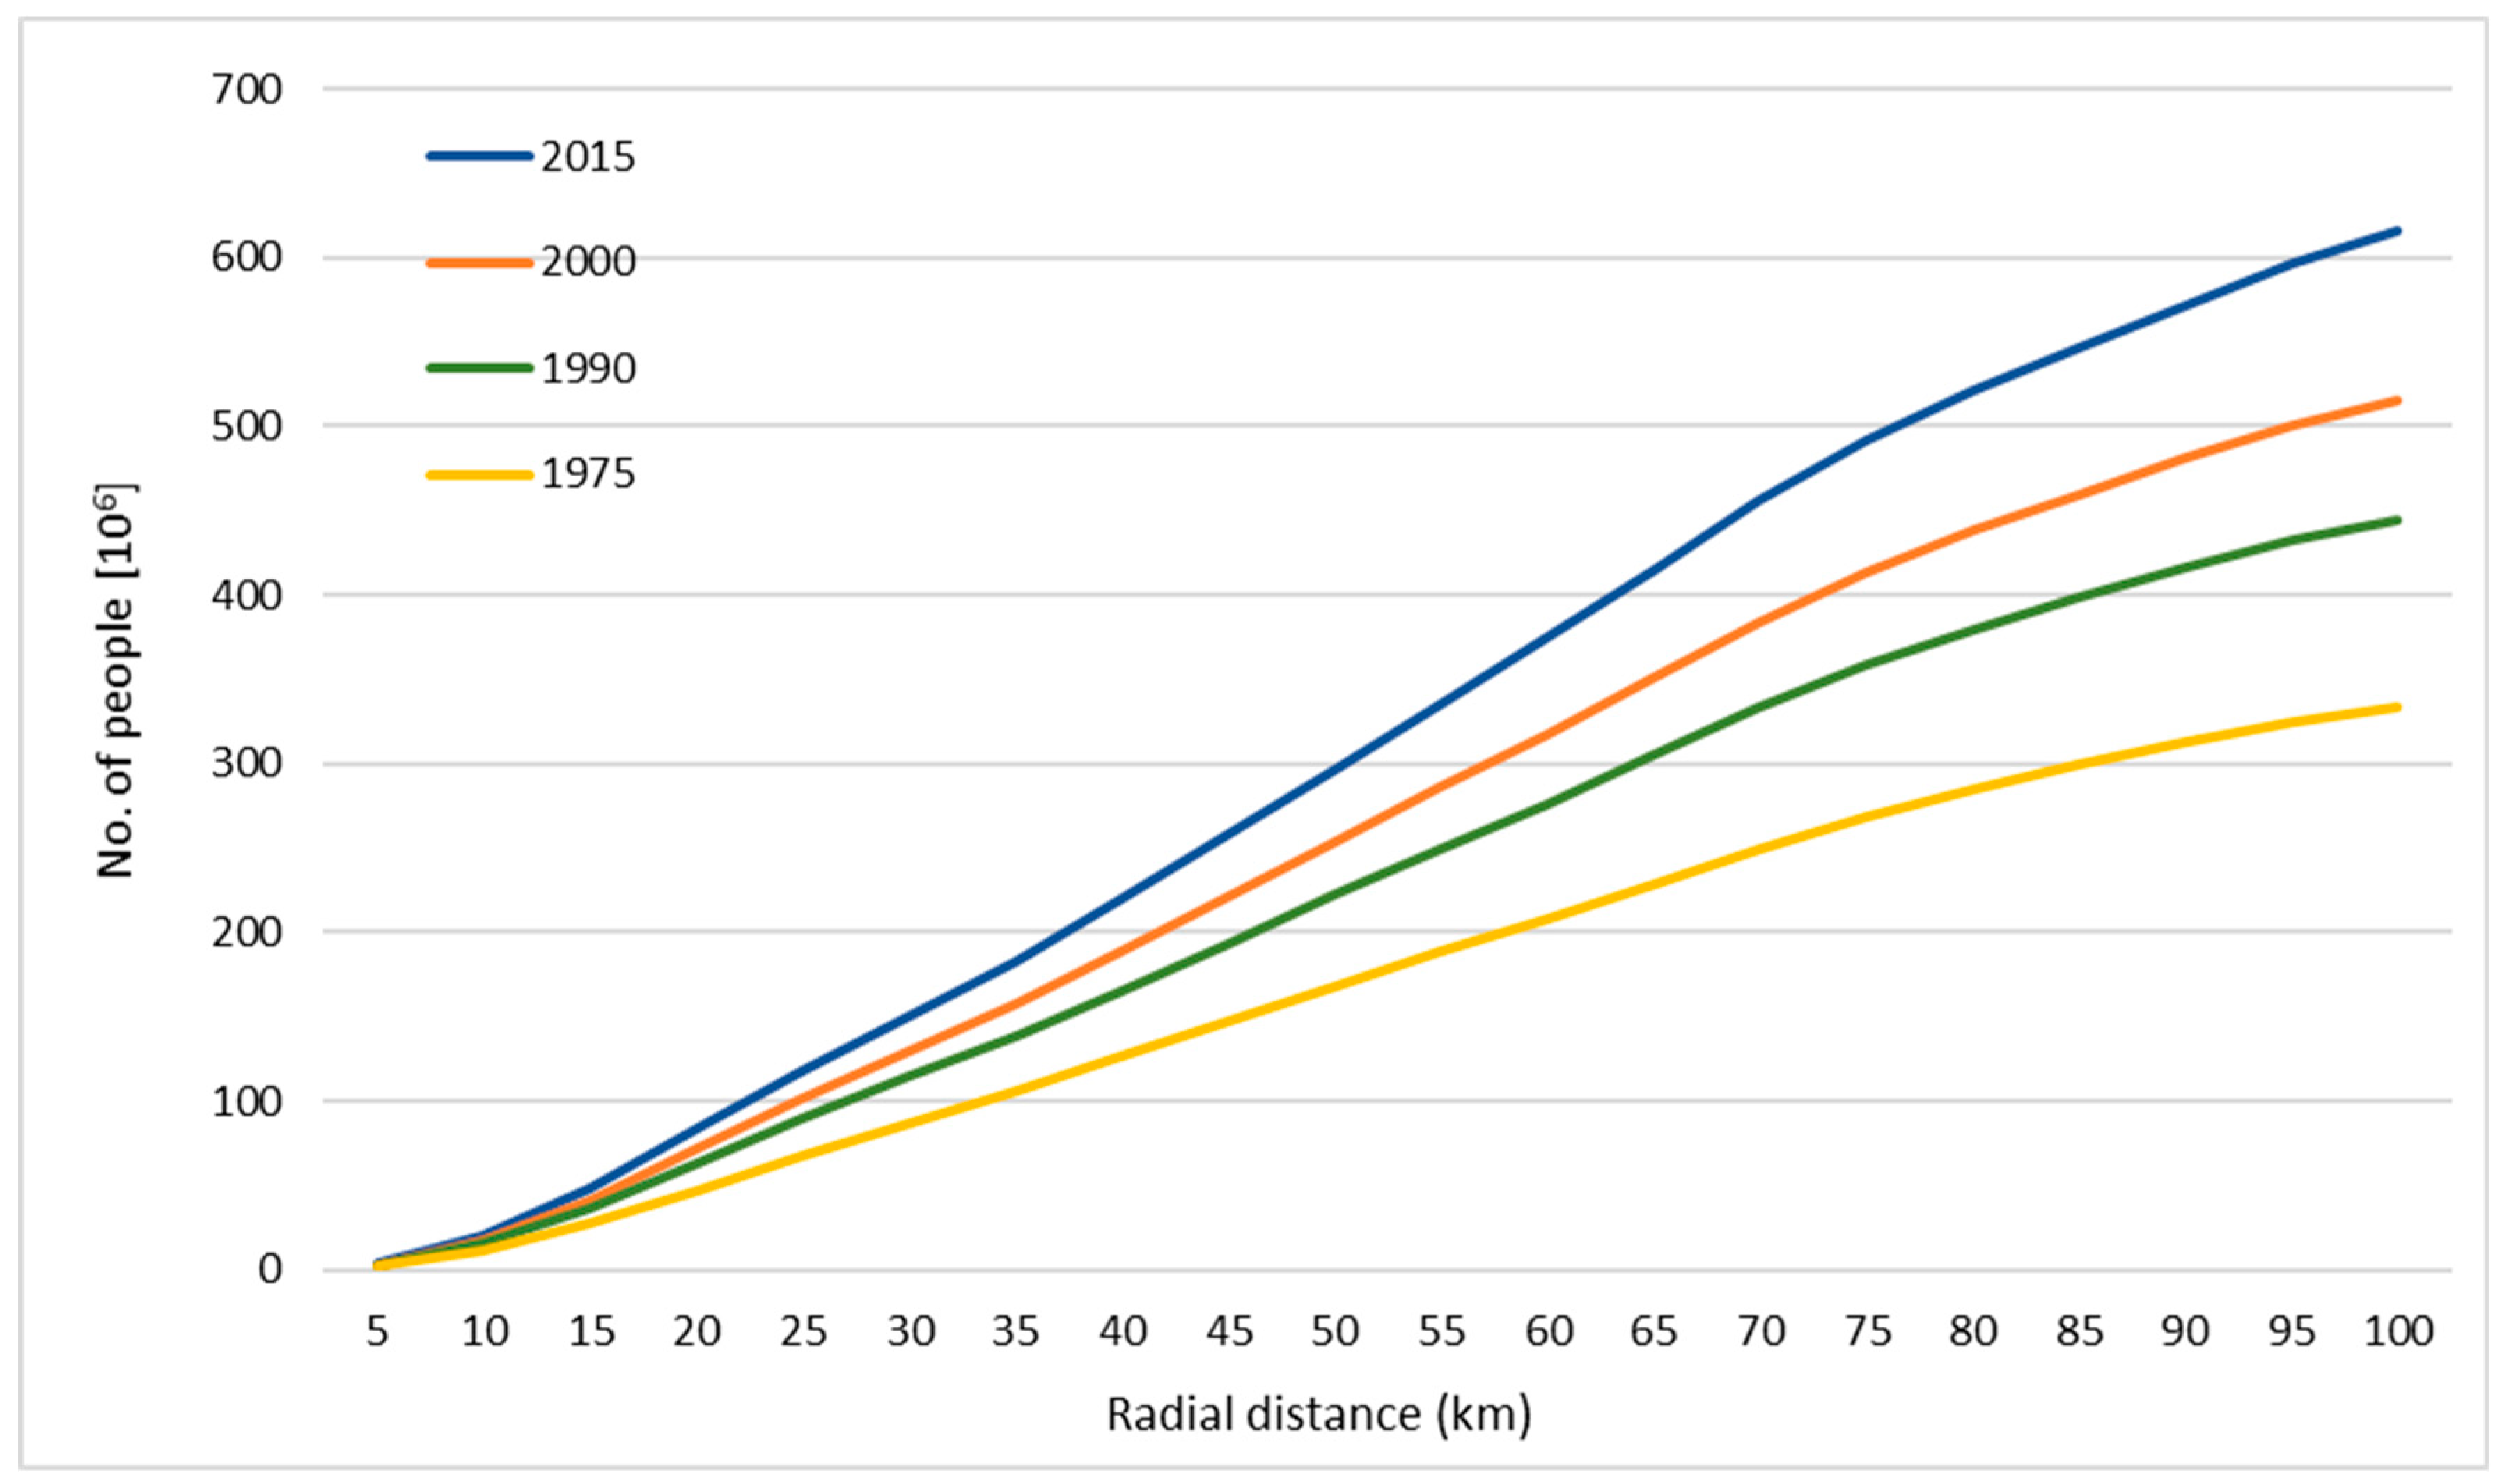
Figure 2 and Figure 3 show overall global cumulative population as a function of radial distance to Holocene volcanoes (HV) and volcanoes in Significant Volcanic Eruption Database (SV), respectively, for each period under analysis. The plots show that very large numbers of people live in proximity to volcanoes, and that this presence has increased from 1975 to 2015. Concerning HV, while 100 million people would be spread over a radial distance of 20 km in 1975, the same amount were concentrated in a radius of only 13 km in 2015.
This has noteworthy consequences for the variation of population densities in space and time, as shown in Figure 4 and Figure 5.
Differently from some previous analyses (e.g., [8]), we have considered all volcanoes listed in the databases regardless of their type or location, as e.g., submarine volcanoes may still affect populations on land upon erupting, as many are located in proximity to inhabited areas. This is especially relevant for remote archipelagos (such as Tonga, French Polynesia, Solomon Islands Guam, Hawaii, Mariana Islands), where potential exposure and risk is typically overlooked in global analyses and where DRM poses specific challenges. In fact, we think this may be a ‘hidden’ source of potential exposure and risk that should deserve more attention in future research. Of 118 submarine volcanoes in the HV list, 76 have documented eruptions.
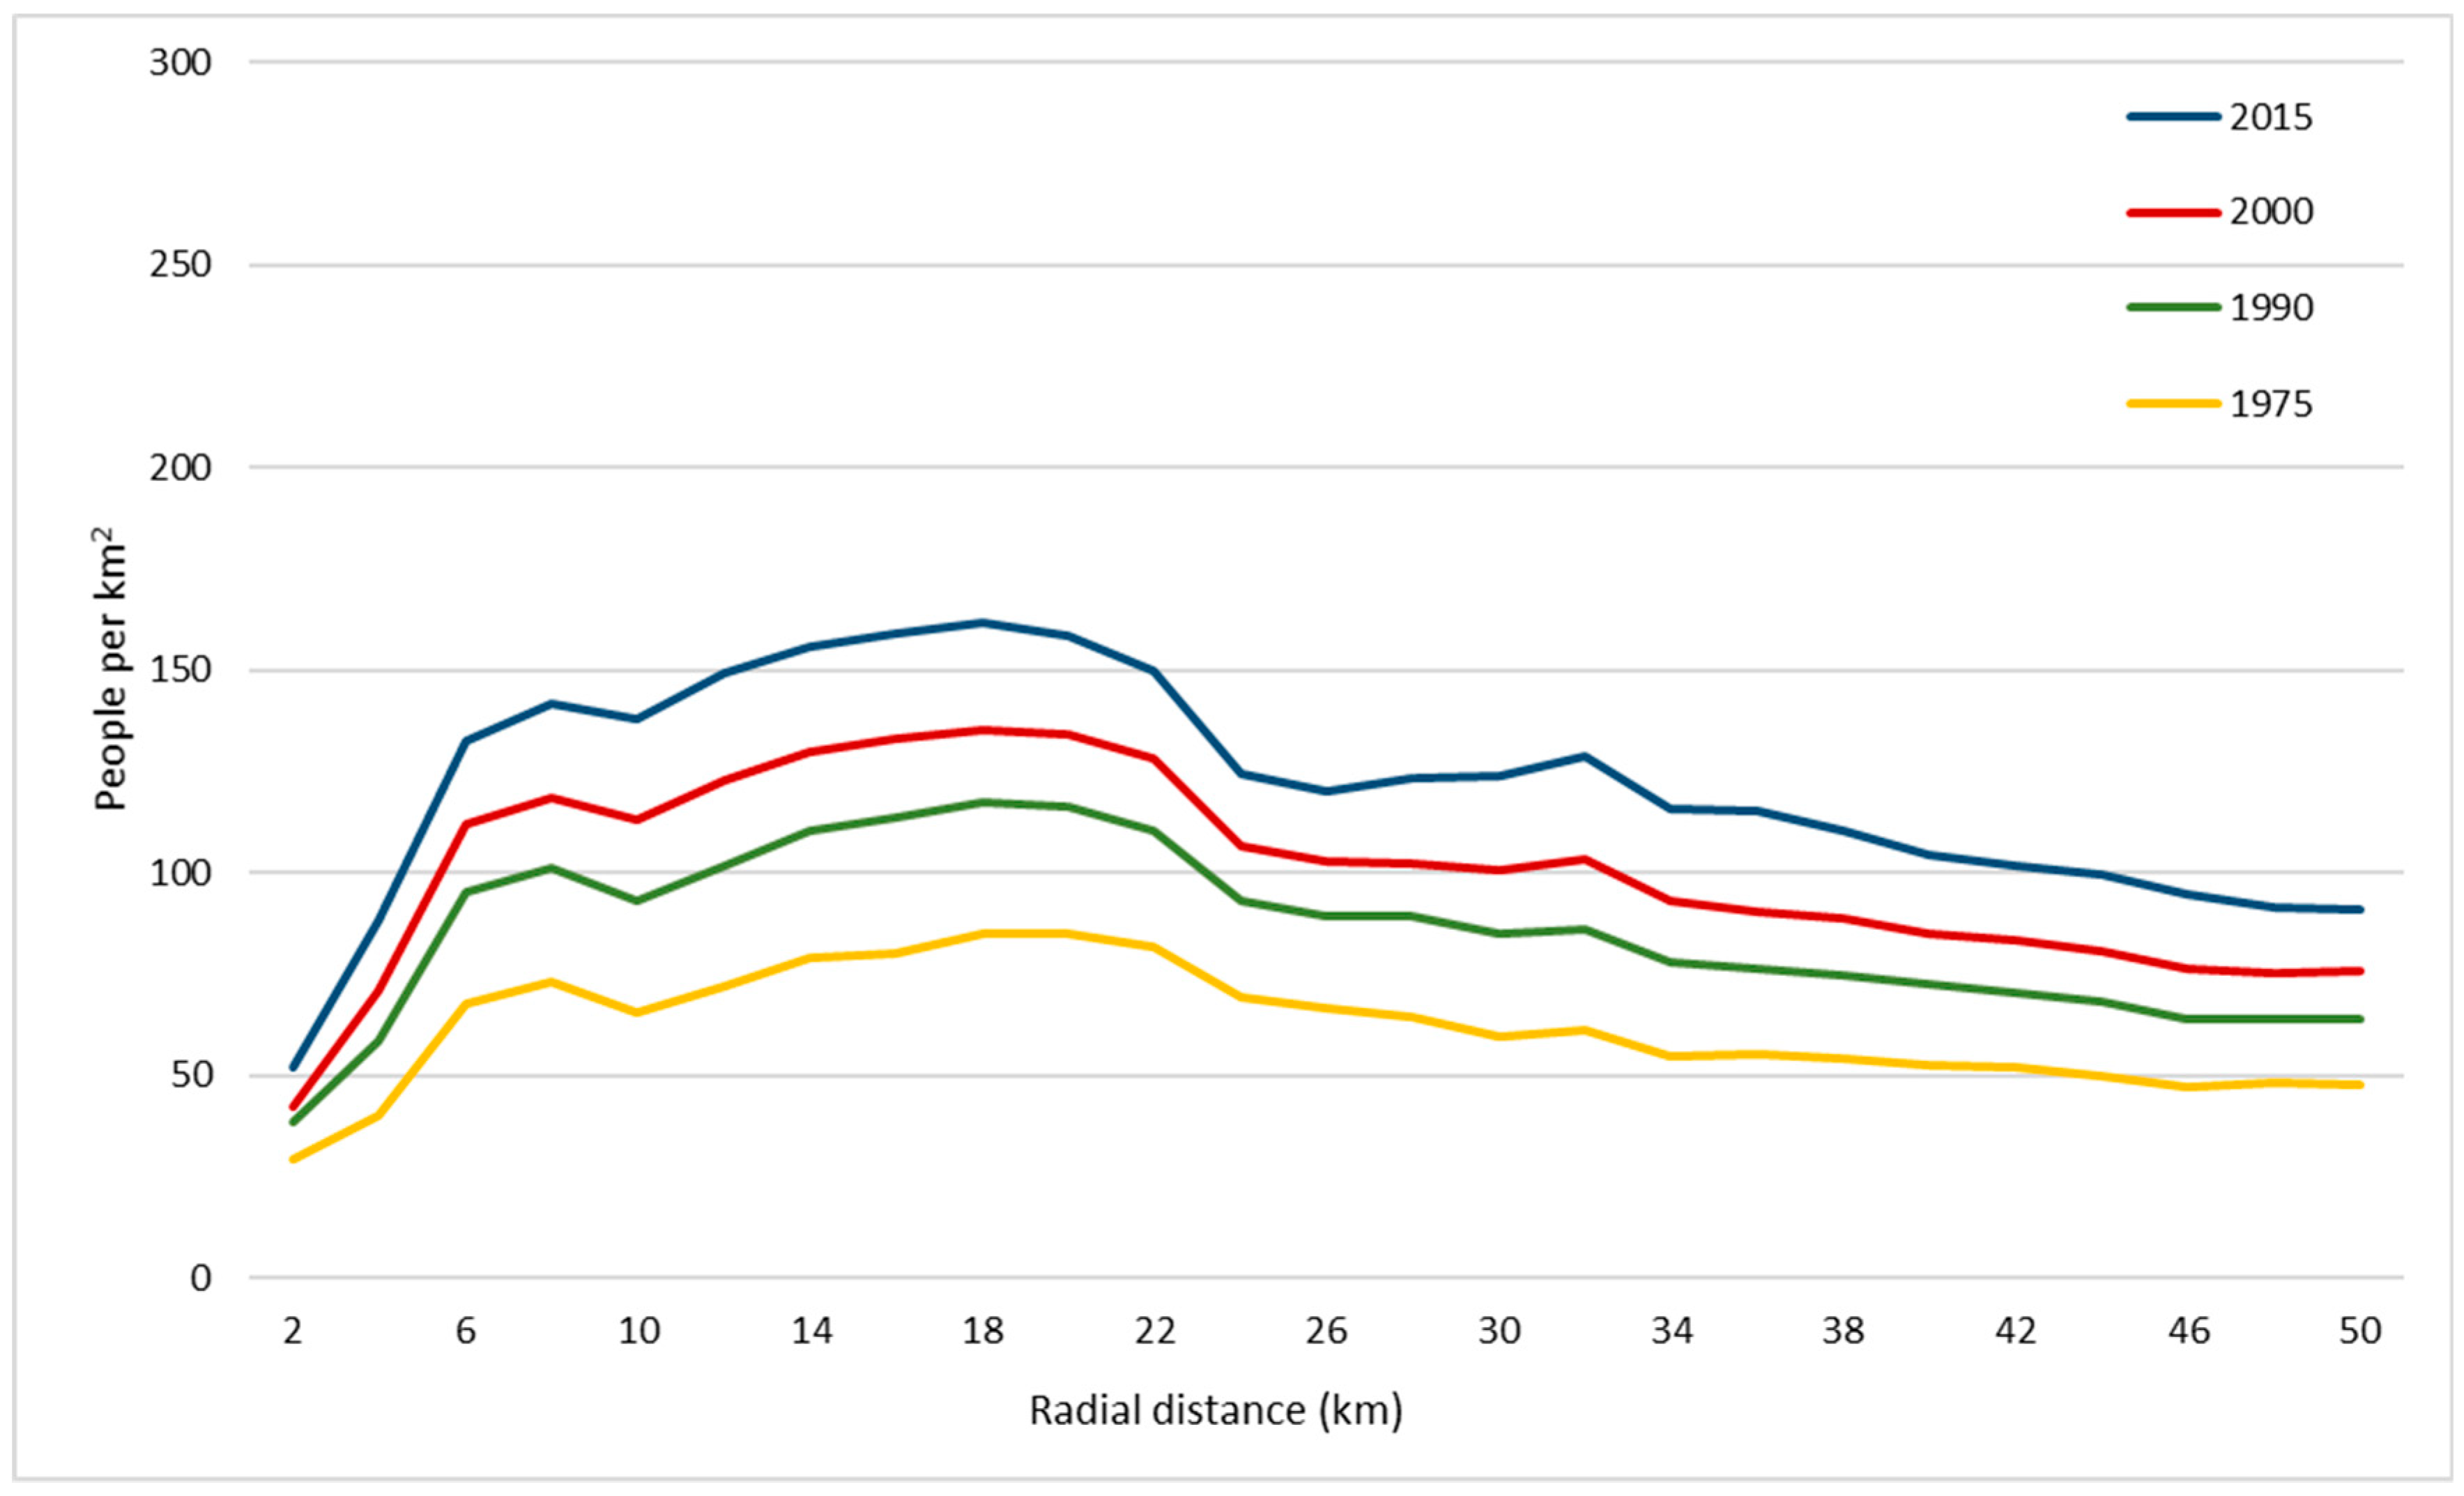
Figure 4 and Figure 5 show the average population densities (over land) by radial distance to volcanoes. These charts show that relatively high population densities occur in the vicinity of all volcanoes, especially of those with significant eruptions (above the overall global densities over land, which are 27 and 49 people/km2 in 1975 and 2015, respectively); and these densities increase sharply away from volcanoes but in very close proximity, especially from SV, in whose vicinity densities are significantly higher. Moreover, while maintaining the overall pattern, those densities have been increasing considerably since 1975, particularly in the period 1975–1990. However, it is at a distance of 10 to 20 km from Holocene volcanoes that the absolute increase in population density has been greatest (additional 75 persons/km2), from 1975 to 2015.
In all periods, population density generally increases with close proximity to volcanoes, peaking at around 15–20 km away, and then decreases sharply in their immediate vicinity, but still maintaining relatively high densities. This sharp decrease may be due to presence of steep slopes, volcanic activity, or enforcing of exclusion zones for settlement. This pattern is even more striking for volcanoes with significant eruptions (SV), where overall population densities are higher (up to 270 people/km2), with obvious implications for exposure, risk analyses, and potential impacts. This pattern is dissimilar from the monotonically decreasing densities reported by [8]. This difference may be the outcome of sharper analyses enabled by the characteristics of the new population grids, i.e., effective disaggregation to built-up areas and higher spatial detail.
These results further detail, revise and update previous estimates, such as that of reference [1] that states “…at present, more than 800 million people in 86 countries live within 100 km of a volcano that could potentially erupt (GVM, 2014a)”, and that “…over 29 million people worldwide live within just 10 km of active volcanoes, and around 800 million people live within 100 km” [25]. Likely reasons for such disagreement include their reliance on conceptually different population grids (e.g., LandScan versus GHS-POP), and their reliance on older census data. Also, LandScan does not depart from or aim to model distribution of residential population, from which population living in proximity can be estimated with more confidence, but instead maps ambient population.

Sources of Uncertainty

As with all global data, both the volcano datasets and the population grids are affected by error and uncertainty. This analysis is performed using a 250 m population grid, which also makes it sensitive to uncertainty in spatial precision. The uncertainties in GHS-POP mostly result from the quality and reliability of censuses and the capacity to fully detect built-up in diverse landscapes using heterogeneous Landsat image archives [32]. Such issues typically worsen with temporal distance from the current period (for a more detailed discussion, see reference [27]. Despite the mitigation procedures implemented in the production of the current population grids, some issues remain unsolved in global population data, which should not be used for pixel level assessments.
Issues of spatial accuracy and precision also affect the GVP datasets in which volcanoes are represented through points (coordinate pairs), and a single point frequently refers to a group of volcanoes or craters (e.g., volcanic fields) or giant calderas (e.g., Yellowstone, USA); for some of these, due to their size and extent, an areal feature (polygon) would be a better representation for the potential hazard source. Also, the geographical coordinates (decimal degrees) are often coarse with precision sometimes limited to the first decimal, which corresponds to a real world precision of about 5.5 km. This is clearly insufficient for detailed analyses in close proximity to volcanoes. This vagueness and low spatial precision reduce accuracy and discourage more detailed analyses. These and other uncertainties introduce limitations for studies: while these are usually mitigated when aggregated assessments such as this one are conducted, they can become apparent when analyses are carried out for individual volcanoes or at very fine scale (e.g., very close proximity).

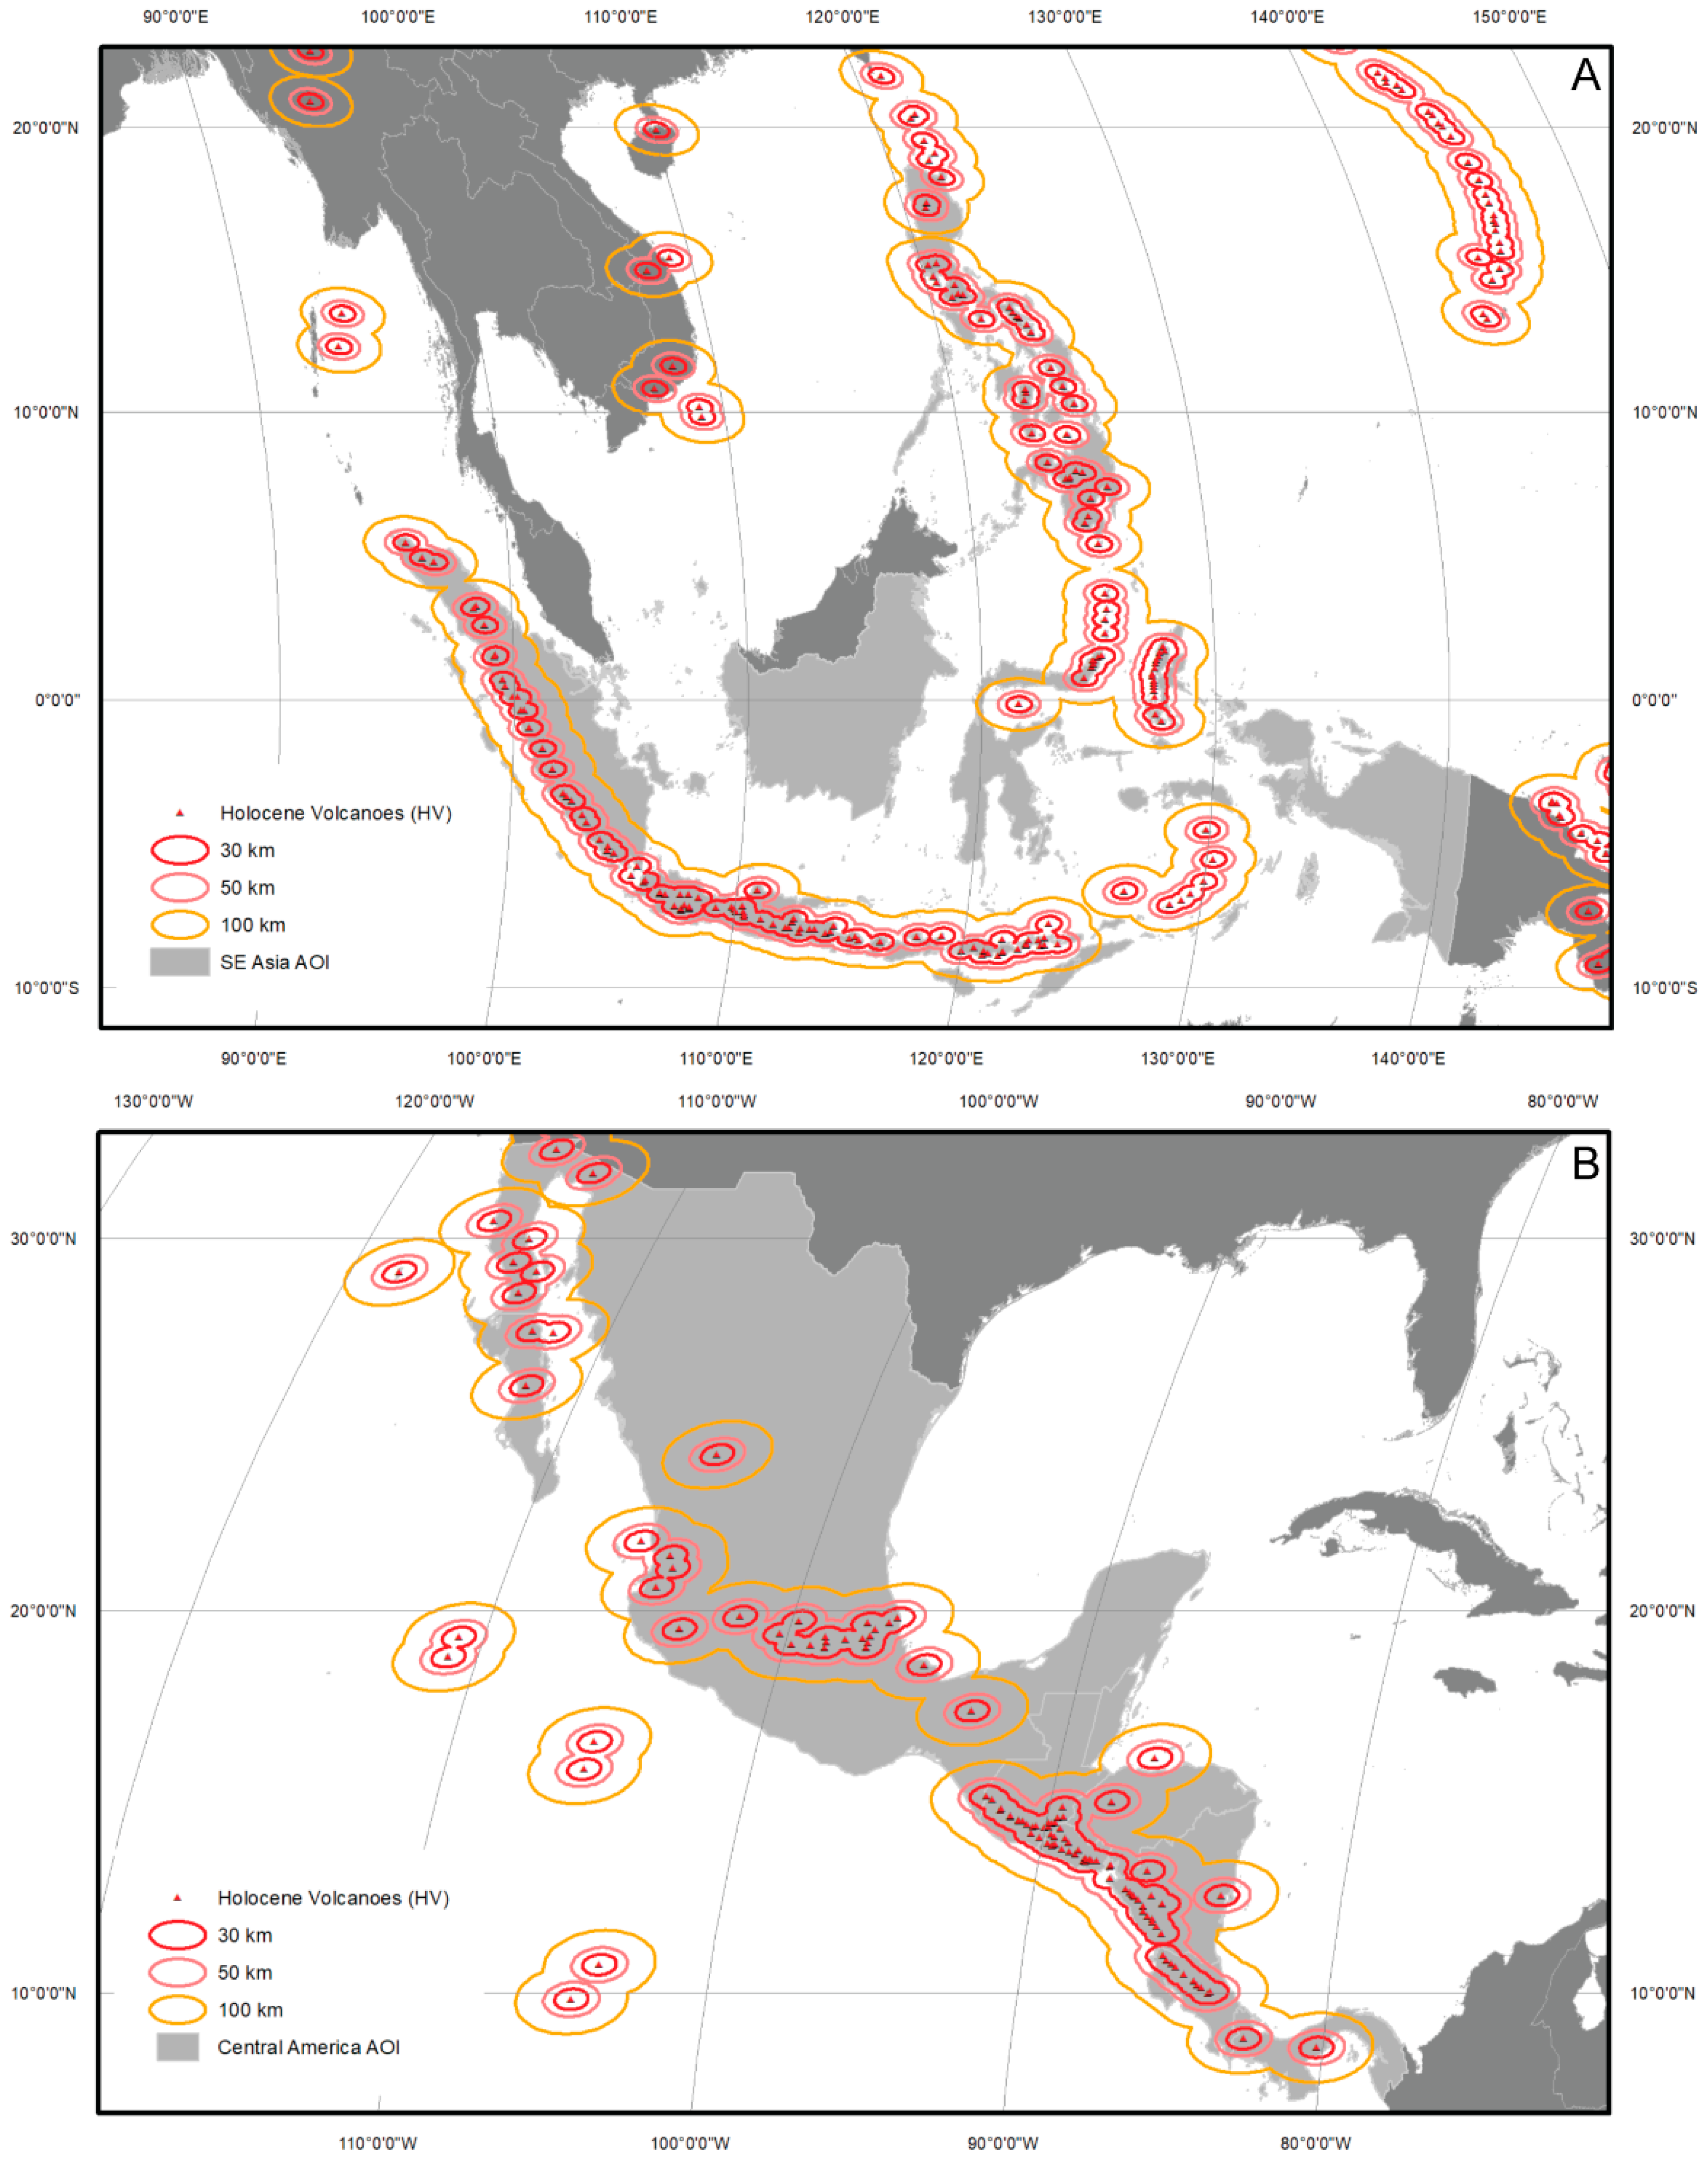
3.2. Population Distribution from 1975 to 2015 in Relation to Volcanism, in Southeast Asia and Central America

This section analyzes in more detail results for two important volcanic regions, Southeast Asia and Central America. The first region comprises the countries of Indonesia, Philippines, and East Timor, while the second includes Mexico, Guatemala, Belize, Honduras, El Salvador, Nicaragua, Costa Rica, and Panama. Figure 6 shows location of Holocene volcanoes in these regions and the selected distances under analysis. SE Asia and Central America together represent 40% of the total global population living within 100 km of volcanoes, but with different contributions and patterns of population by radial distances (Table 5).
In SE Asia the population within 100 km of HV has increased from 143 million in 1975 to 301 million in 2015, representing 84% of the region’s inhabitants. In Central America the population within this distance increased from 57 million in 1975 to 120 million in 2015, comprising 69% of the region’s inhabitants. Especially striking in SE Asia are the 10 and the 27 million people currently living within 10 km of SV and HV, respectively, accounting for almost half of the global population within this range of recently active volcanoes. This short distance is especially problematic in small inhabited islands which are completely contained within this range, where fast evacuation can be particularly challenging.
However, while in SE Asia the share of total population within 100 km of HV has increased (albeit slightly) between 1975 and 2000, in Central America this value has been decreasing, and even more so when SVs are considered.
Concerning the annual growth rates of population by radial distance of HV and SV, Table 6 shows important differences between and within these regions.
While in SE Asia the highest growth rates have occurred in close proximity to HV and SV volcanoes (within 10 km), in Central America the strongest rates are observed farther away (beyond 50 km), especially after 1990 and for HV. Also, whereas in SE Asia much of this growth has occurred at rates well above the regional ones between 1975 and 2000 (especially for HV), in Central America increases stayed below regional rates for all distances and periods, suggesting that areas more distant from volcanoes were favored for settlement.
While explaining the observed variations is beyond the scope of this paper, we can offer some hypotheses for the underlying causes:
(a)
Pressure for space in a context of relatively weak planning, causing settlement to encroach on volcanoes (overall average population densities are much higher in SE Asia than in Central America);
(b)
More recent dates of eruptions and variations in risk perception.
Additional research is needed to test these and other hypotheses that may explain settlement patterns.
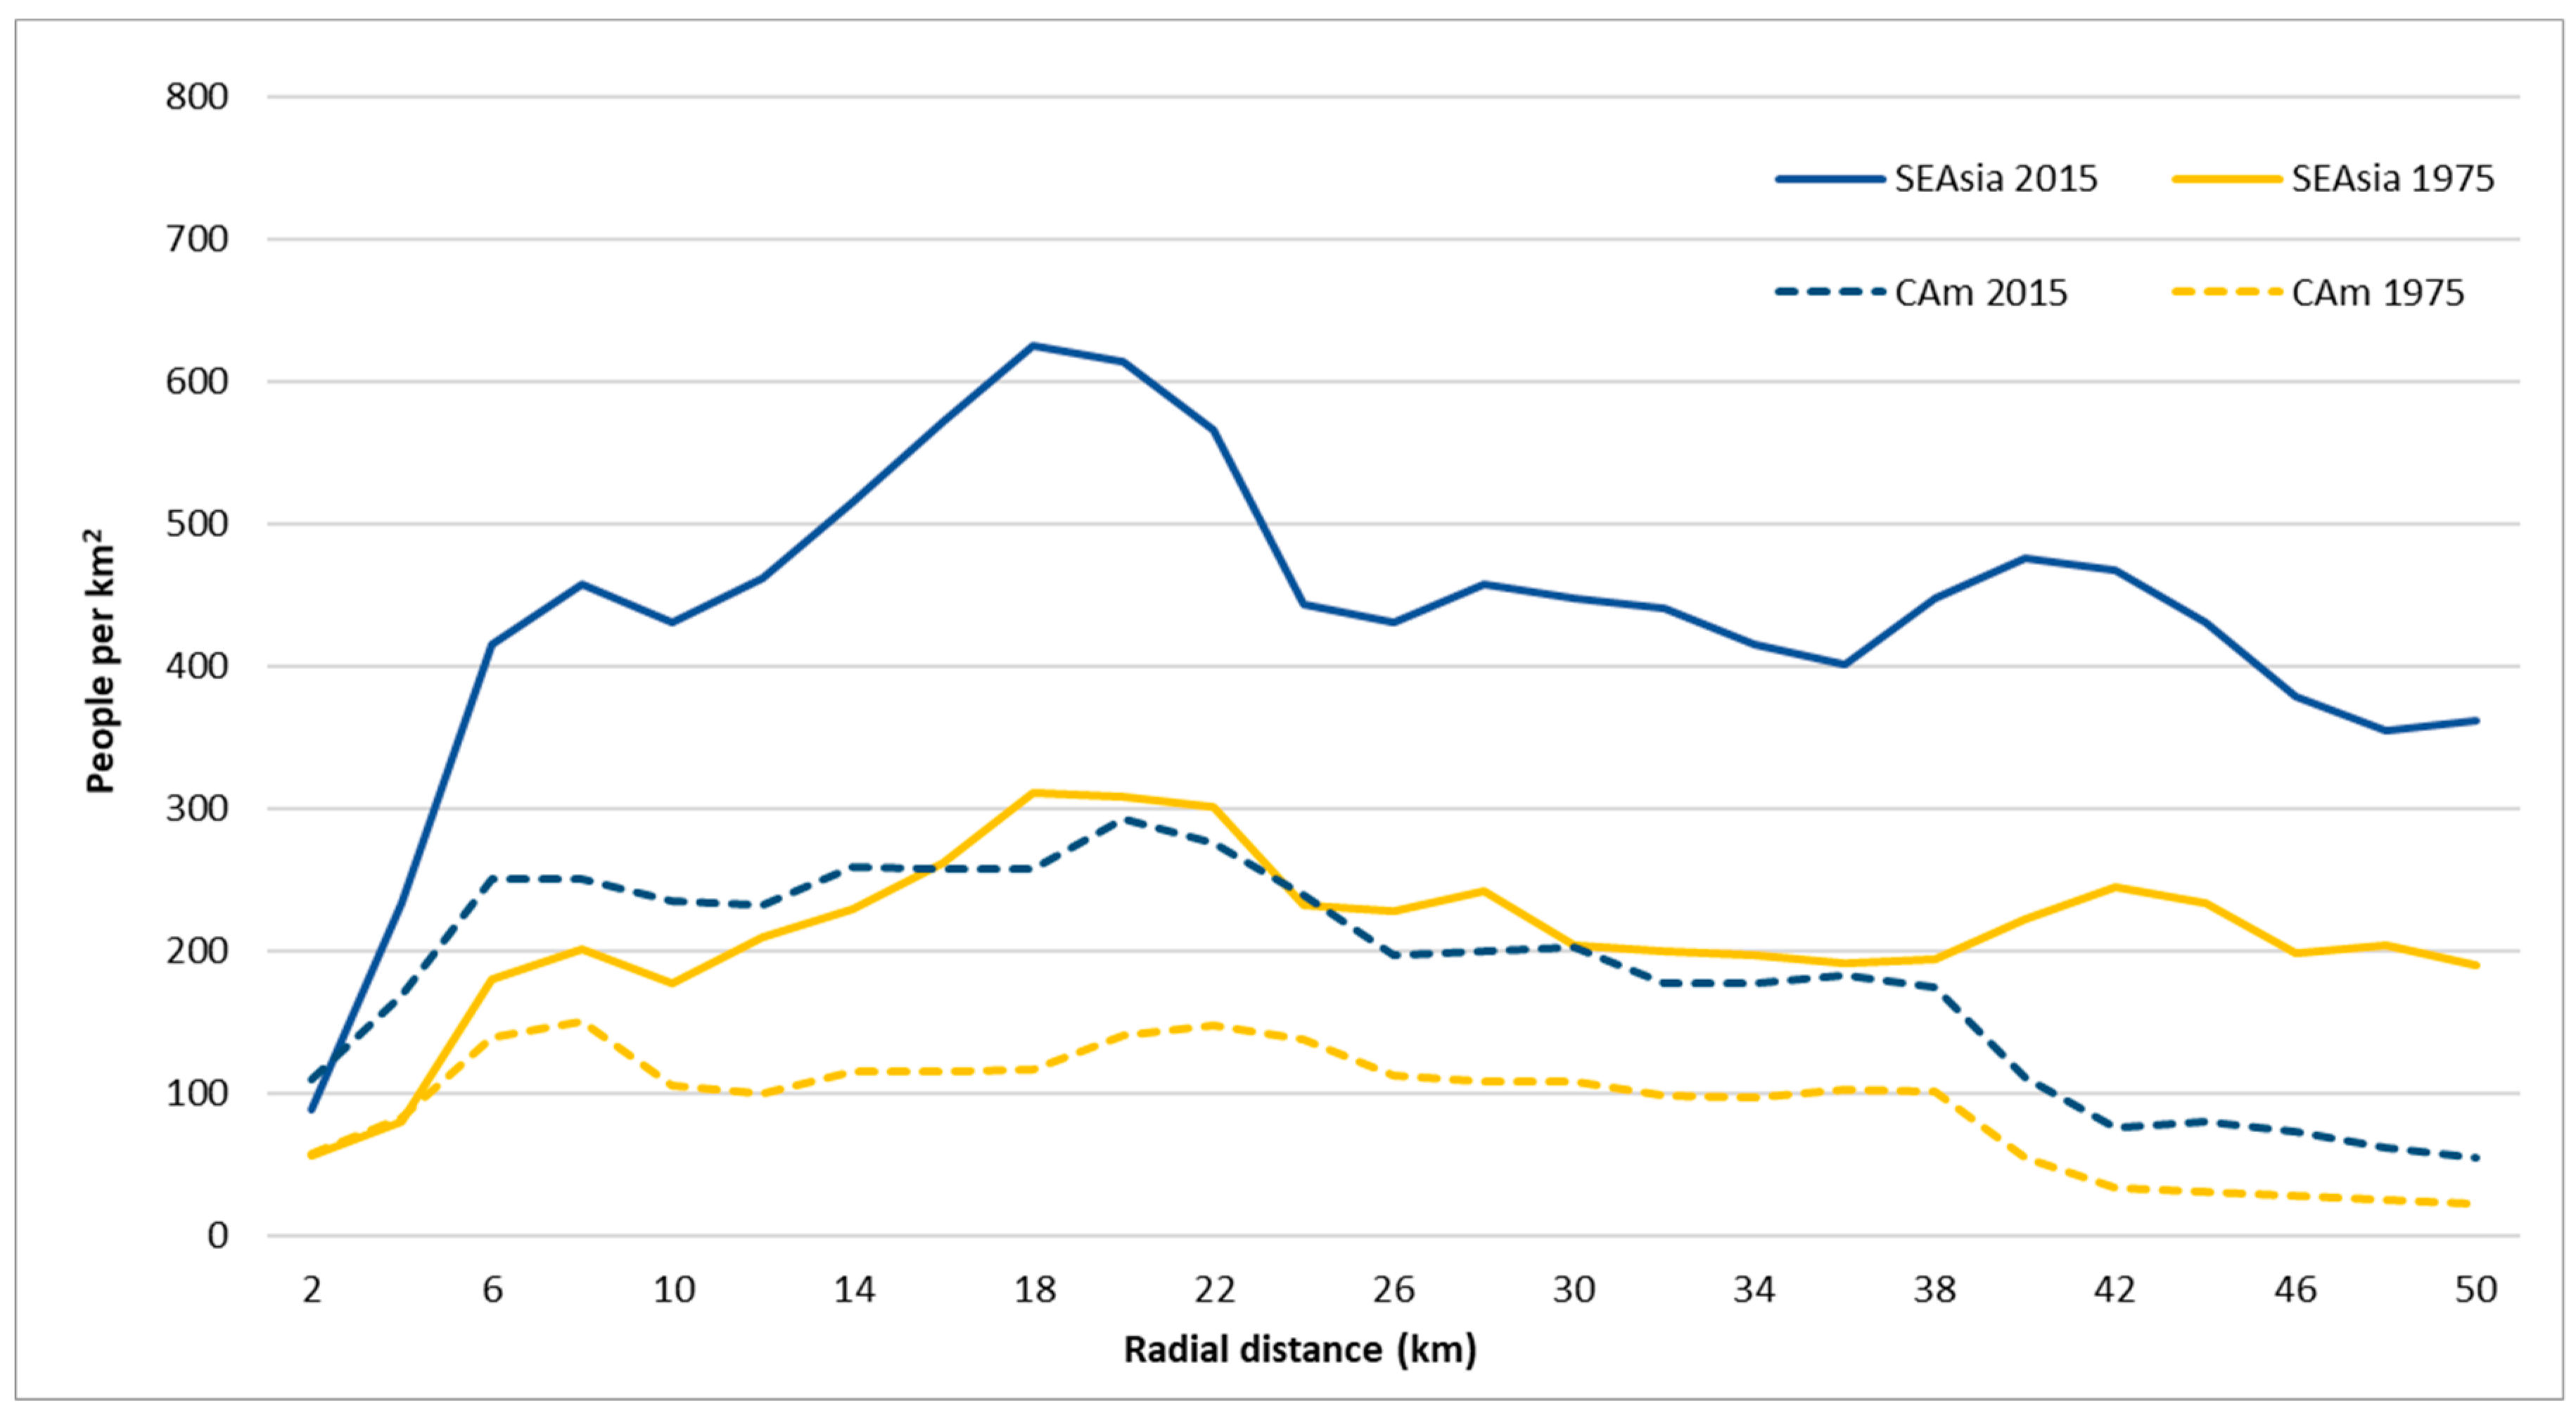
Regarding variation of population densities in these regions in proximity of HV and SV, Figure 7 and Figure 8 show some differences. For both volcano sets, population densities are generally higher in SE Asia, especially in 2015 where these can be more than twice those in Central America (HV). In SE Asia, population densities increase faster with distance from HV and remain relatively high (>400 persons/km2) up to 44 km away. Beyond 4 km, density surpasses the overall mean for the region (78 and 163 persons/km2 in 1975 and 2015, respectively). There is a pronounced peak in densities around a distance of 18–22 km that has intensified since 1975. Because this is essentially a mountainous landscape, this may also reflect the average distance of valley floors (or the mid-distance between consecutive mountains), where conditions for settlement are more favorable. 
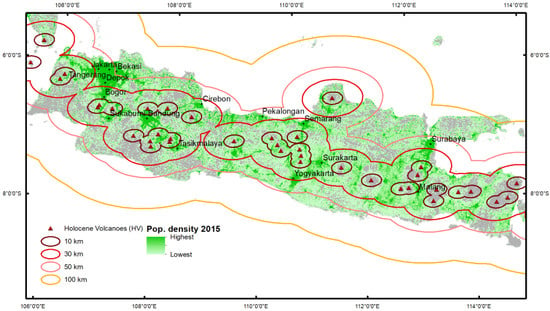
Figure 9 illustrates the situation in 2015 in the Island of Java (Indonesia), showing the locations of Holocene volcanoes, main cities, and the population distribution.
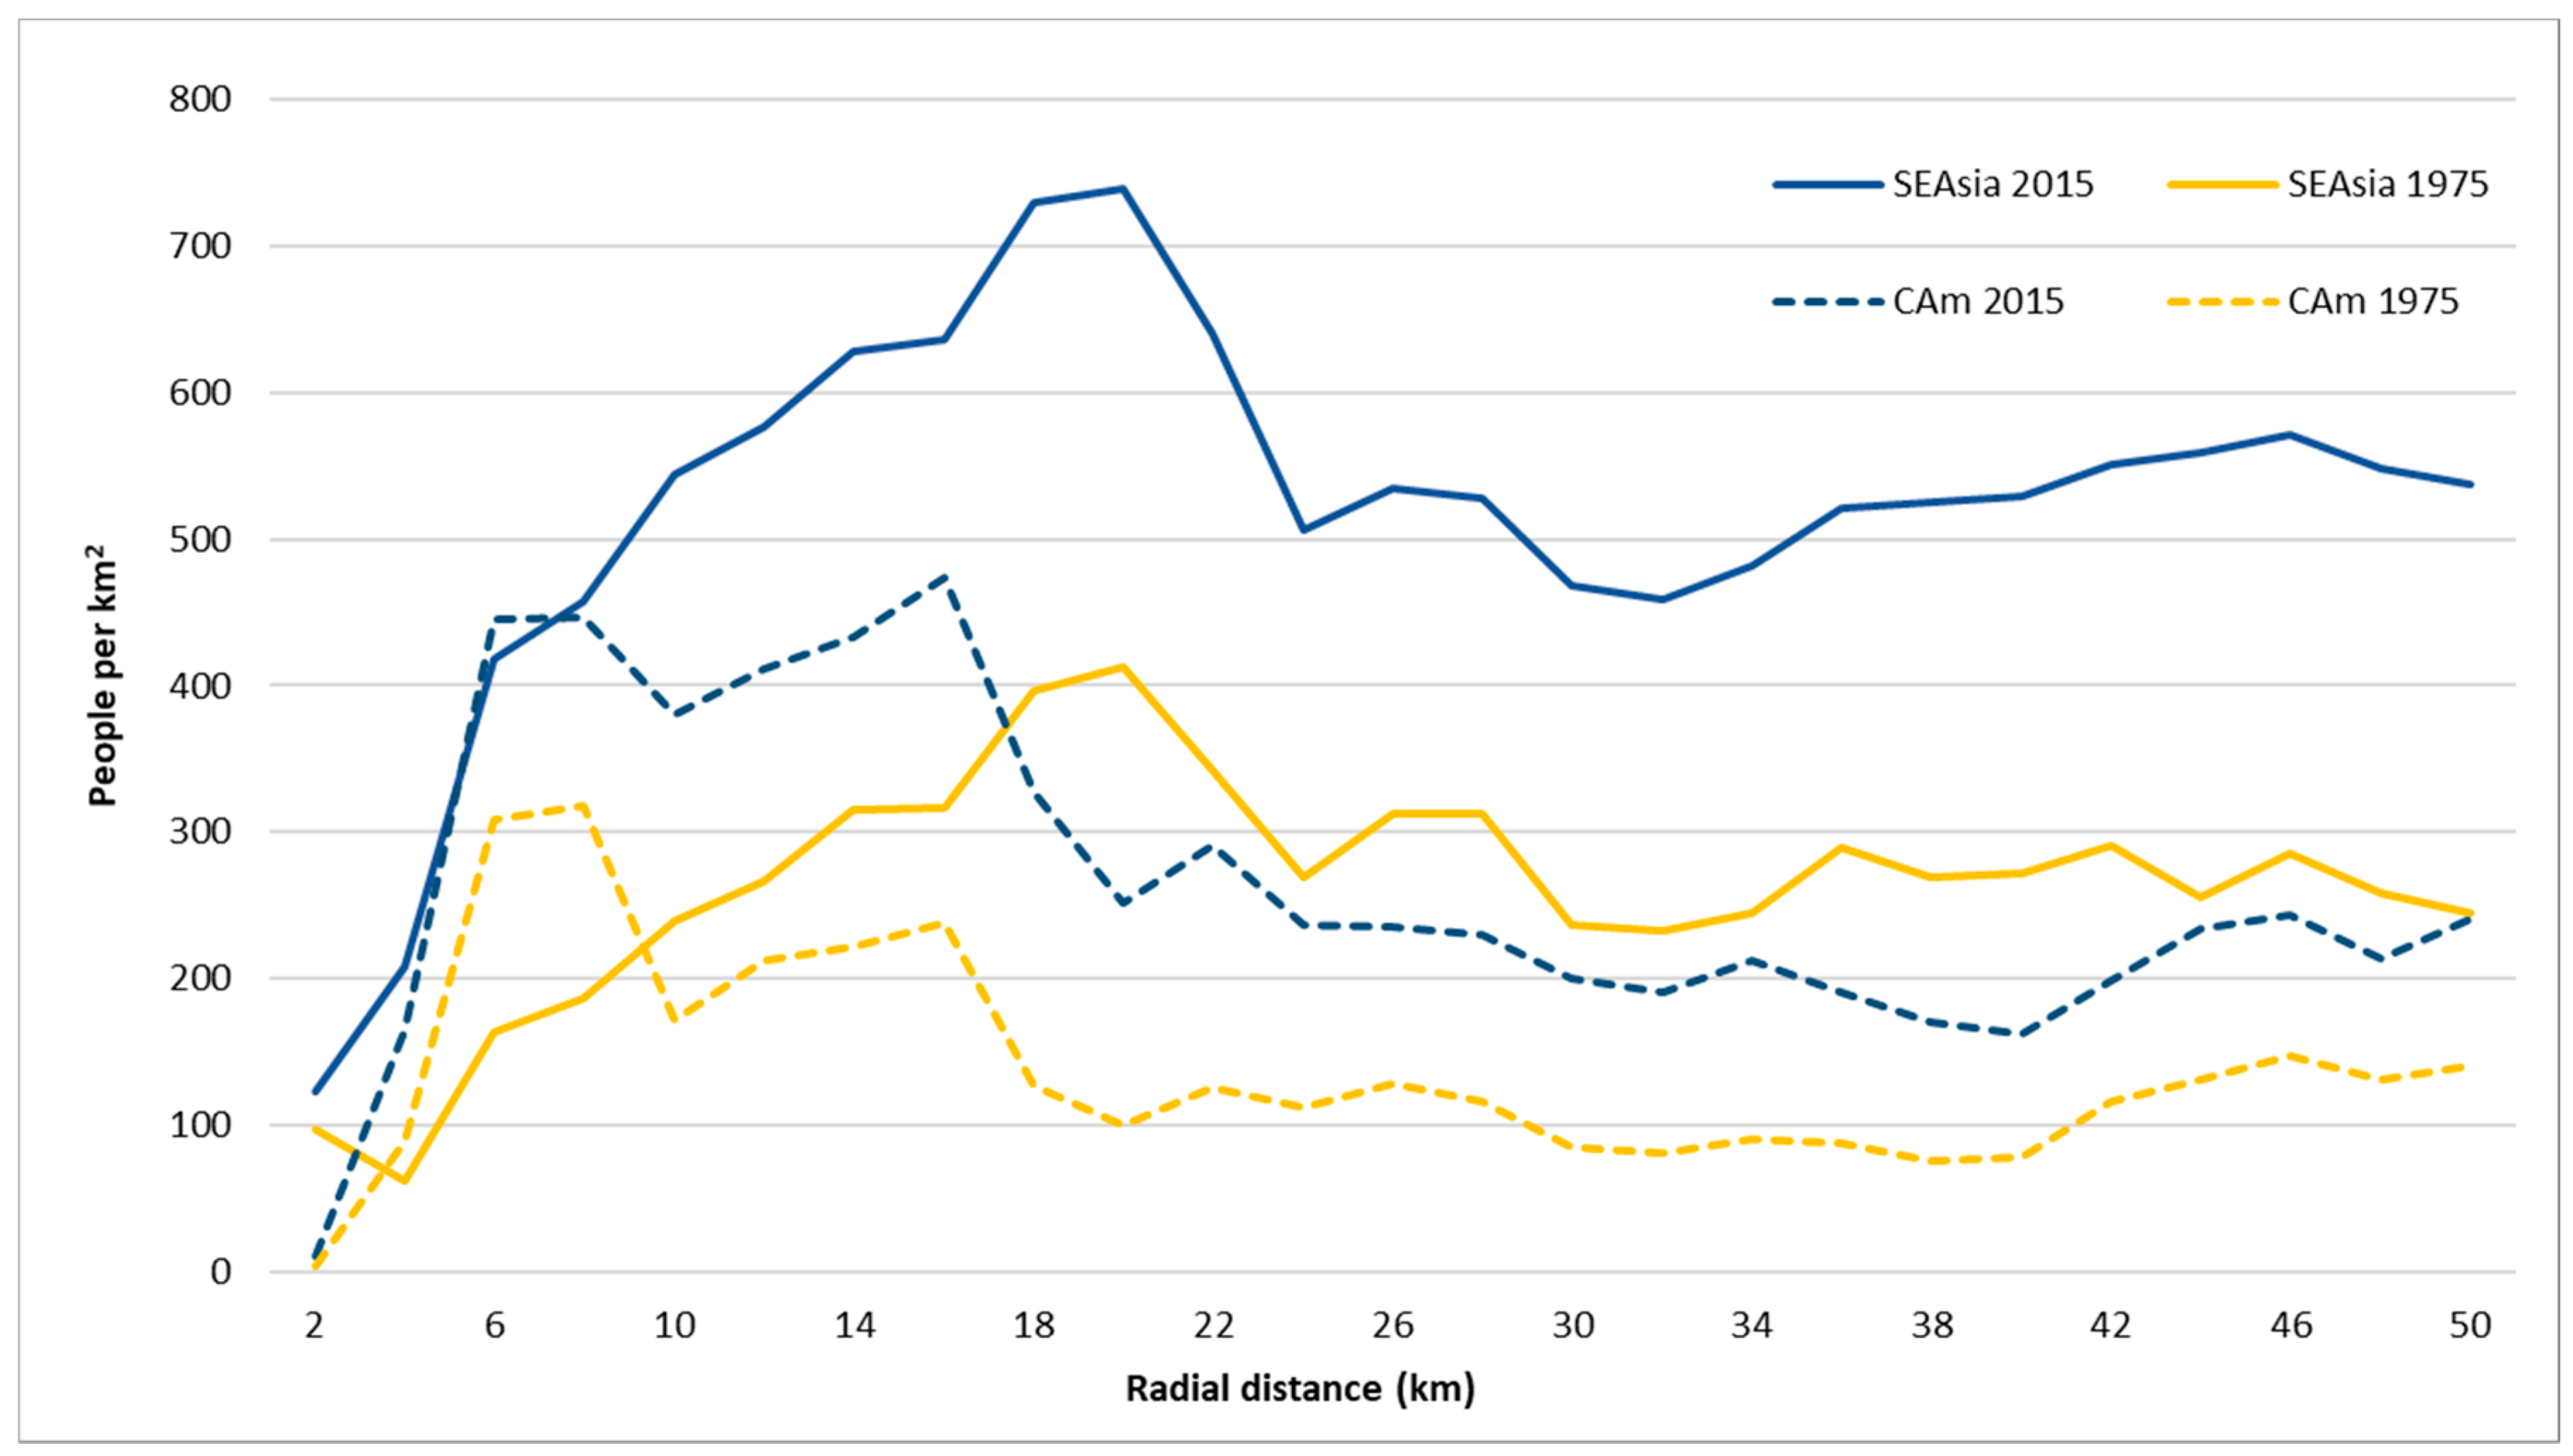
Regarding SV volcanoes (Figure 8), in Central America densities increase dramatically up to 6–8 km and remain high up to 16 km, decreasing markedly after that distance. SE Asia displays a similar proximal pattern for both HV and SV, with very high densities observed around 20 km from SV (700 people/km2) and remaining high until 50 km away.
These results suggest that the overall settlement patterns observed, although specific for each region, were mostly defined prior to 1975, especially in Central America. These spatio-temporal patterns of settlement have consequences for DRM. This analysis confirms and characterizes increases in the exposure of population. Due to the large size, densities, and trends of population potentially exposed to volcanic activity, coupled with structural vulnerabilities, SE Asia and Central America constitute hot spots of exposure and risk. In both regions, the high densities of inhabitants in the immediate vicinity of volcanoes poses widespread challenges for DRM, in particular for evacuation though also the sheer scale of response and recovery operations can become quite daunting in case of large eruptions. In this context, effective monitoring of volcanic activity, emergency preparation and early warning can significantly reduce local risk and potential impacts from eruptions.
Furthermore, these new population data and results have implications for exposure indices, such as the VPI [19] and PEI [24]. Due to their reliance on and sensitivity to population distribution data, such indices should use the latest population grids available and be regularly updated to accurately reflect the current exposure and risk situation.

4. Conclusions

Where human population grows there is an increasing pressure to settle on more hazardous areas, including in areas subject to volcanic activity. Active volcanoes generate diverse hazardous phenomena which can affect populations in their immediate vicinity but also farther away. Volcanic eruptions are not yet influenced by human activity nor can their time, location, or magnitude be mitigated by human capacity and ingenuity. Therefore, the available approaches for effective DRR are risk estimation, monitoring, awareness raising, implementation of impact mitigation measures, and preparation for events. These require detailed knowledge of potential human exposure through improved geoinformation on population distribution and densities, in space and time.
As a contribution to this effort, we have characterized globally the geographical distribution of human population with proximity to historically active volcanoes, and its recent evolution from 1975 to 2015. We have combined recently produced detailed and multi-temporal geospatial grids of global population densities with the latest data on distribution of Holocene volcanoes and those with evidence of significant eruptions. This analysis updates and refines earlier estimates and introduces a previously unavailable spatio-temporal dimension to analysis of human settlement in proximity of volcanoes.
We find that population is not evenly distributed across geographical space around volcanoes and that concentrations have been increasing since 1975. Results concerning the overall global situation indicate that in 2015 more than 600 million people (8.4% of total) lived within 100 km of a volcano with at least one significant eruption, and more than 1 billion people (14.3% of the total) within that distance of a Holocene volcano. This last amount has increased by 1.57% per year since 1975, above the global population growth rate for the period. Especially significant have been the growth rates and total population living within 10 km, which in 2015 totals 59 million for Holocene volcanoes and 21 million for those with significant eruptions. Almost half of this population lives in Southeast Asia. Population densities in vicinity of volcanoes are also higher than global average densities, and those have been increasing with time in last 40 years. We find that overall spatial patterns have been relatively stable in time but that their variation with distance is not monotonic, with density generally increasing with proximity to volcanoes, peaking at around 15–20 km away, and then decreasing sharply in their immediate vicinity.
Despite both regions having high potential exposure to volcanoes, we find differences between Southeast Asia and Central America: in SE Asia the share of total population within 100 km of HV has increased (albeit slightly) between 1975 and 2000, and the highest growth rates occur in close proximity to HV and SV volcanoes (within 10 km); in Central America the share of population within 100 km of HV and SV has been decreasing, and the strongest rates are observed farther away from volcanoes. In inhabitable land, especially in fertile tropical climates, volcanoes seem to have exerted a noticeable ‘pull-and-push’ effect on humans that contributed to determining the specific settlement patterns we currently observe.
Not only do these more detailed and comprehensive analyses update and revise earlier estimates and findings, but they also enable monitoring of patterns and detection of changes with time. This work also illustrates how emerging open and free geospatial datasets can narrow gaps in population distribution data and knowledge for supporting Disaster Risk Management and Reduction activities. In this domain, these new population grids could benefit a global volcano warning system, by improving estimation of potential human impacts [18]. In case of volcanic eruption preparedness, such geo-information could be used for baseline evacuation planning and estimation of resources needed for adequate response. While this work has focused on volcanism, these population grids can also be combined with any type of hazard, enabling improved modeling and analyses throughout the emergency management cycle.

Author Contributions

Conceptualization, Sergio Freire, Aneta J. Florczyk, and Martino Pesaresi; Data curation, Aneta J. Florczyk; Formal analysis, Sergio Freire and Aneta J. Florczyk; Methodology, Sergio Freire and Aneta J. Florczyk; Writing—original draft, Sergio Freire and Aneta J. Florczyk; Writing—review & editing, Sergio Freire, Richard Sliuzas.

Funding

This work was carried out in the frame of the institutional work program of the Joint Research Centre (JRC, European Commission) and supported by the administrative arrangement No. 33994 between the JRC and the Directorate General for Regional and Urban Policies (DG REGIO, European Commission).

Acknowledgments

The authors would like to thank Michele Melchiorri and Marcello Schiavina for their technical and moral support. We thank the three anonymous reviewers for their comments and suggestions.

Conflicts of Interest

The authors declare no conflict of interest.

References

  1. United Nations Office for Disaster Risk Reduction. Making Development Sustainable: The Future of Disaster Risk Management. Global Assessment Report on Disaster Risk Reduction; United Nations Office for Disaster Risk Reduction: Geneva, Switzerland, 2015. [Google Scholar]
  2. National Academies of Sciences, Engineering, and Medicine. Volcanic Eruptions and Their Repose, Unrest, Precursors, and Timing; The National Academies Press: Washington, DC, USA, 2017. [Google Scholar] [CrossRef]
  3. Dilley, M.; Chen, R.S.; Deichmann, U.; Lerner-Lam, A.L.; Arnold, M. Natural Disaster Hotspots: A Global Risk Analysis; The World Bank: Washington, DC, USA, 2005. [Google Scholar]
  4. Ragona, M.; Hannstein, F.; Mazzocchi, M. The impact of volcanic ash crisis on the European Airline industry. In Governing Disasters: The Challenges of Emergency Risk regulations; Alemanno, A., Ed.; Edward Elgar Publishing: Cheltenham, UK, 2011. [Google Scholar]
  5. Poljanšek, K.; Marin Ferrer, M.; De Groeve, T.; Clark, I. Science for Disaster Risk Management 2017: Knowing Better and Losing Less; Publications Office of the European Union: Brussels, Belgium, 2017; JRC102482. [Google Scholar] [CrossRef]
  6. Chester, D.; Degg, M.; Duncan, A.; Guest, J. The increasing exposure of cities to the effects of volcanic eruptions: A global survey. Glob. Environ. Chang. Part B Environ. Hazards 2000, 2, 89–103. [Google Scholar] [CrossRef]
  7. Brown, S.K.; Jenkins, S.F.; Sparks, R.S.J.; Odbert, H.; Auker, M.R. Volcanic fatalities database: Analysis of volcanic threat with distance and victim classification. J. Appl. Volcanol. 2017, 6, 15. [Google Scholar] [CrossRef]
  8. Small, C.; Naumann, T. The global distribution of human population and recent volcanism. Environ. Hazards 2001, 3, 93–109. [Google Scholar]
  9. Strader, S.M.; Ashley, W.; Walker, J. Changes in volcanic hazard exposure in the Northwest USA from 1940 to 2100. Nat. Hazards 2015, 77, 1365–1392. [Google Scholar] [CrossRef]
  10. UNISDR. Sendai Framework for Disaster Risk Reduction 2015–2030; UNISDR: Geneva, Switzerland, 2015. [Google Scholar]
  11. Lerner-Lam, A. Assessing global exposure to natural hazards: Progress and future trends. Environ. Hazards 2007, 7, 10–19. [Google Scholar] [CrossRef]
  12. Peduzzi, P.; Dao, H.; Herold, C.; Mouton, F. Assessing global exposure and vulnerability towards natural hazards: The Disaster Risk Index. Nat. Hazards Earth Syst. Sci. 2009, 9, 1149–1159. [Google Scholar] [CrossRef]
  13. UNISDR. Global Assessment Report on Disaster Risk Reduction 2013—From Shared Risk to Shared Value: The Business Case for Disaster Risk Reduction; United Nations Office for Disaster Risk Reduction: Geneva, Switzerland, 2013. [Google Scholar]
  14. Freire, S. Modeling of spatiotemporal distribution of urban population at high resolution—Value for risk assessment and emergency management. In Geographic Information and Cartography for Risk and Crisis Management; Springer: Berlin, Germany, 2013; pp. 53–67. [Google Scholar]
  15. National Research Council. Tools and Methods for Estimating Populations at Risk from Natural Disasters and Complex Humanitarian Crises, Report by the National Academy of Sciences; National Academy Press: Washington, DC, USA, 2007; p. 264. [Google Scholar]
  16. Linard, C.; Tatem, A.J. Large-scale spatial population databases in infectious disease research. Int. J. Health Geogr. 2012, 11, 7. [Google Scholar] [CrossRef]
  17. Mondal, P.; Tatem, A.J. Uncertainties in Measuring Populations Potentially Impacted by Sea Level Rise and Coastal Flooding. PLoS ONE 2012, 7, e48191. [Google Scholar] [CrossRef]
  18. Andredakis, I.; De Groeve, T. Towards a global humanitarian volcano impact alert model integrated into a multi-hazard system. In Detecting, Modelling and Responding to Effusive Eruptions; Harris, A.J.L., De Groeve, T., Garel, F., Carn, S.A., Eds.; Geological Society Special Publications: London, UK, 2015. [Google Scholar]
  19. Ewert, J.W.; Harpel, G.J. In harm’s way: Population and volcanic risk. Geotimes 2004, 49, 14–17. [Google Scholar]
  20. Pan, H.; Shi, P.; Ye, T.; Xu, W.; Wang, J. Mapping the expected annual fatality risk of volcano on a global scale. Int. J. Disaster Risk Reduct. 2015, 13, 52–60. [Google Scholar] [CrossRef]
  21. Riede, F. Volcanic activity and human society. Quat. Int. 2016, 394, 1–5. [Google Scholar] [CrossRef] [Green Version]
  22. Siebert, L.; Simkin, T.; Kimberley, P. Volcanoes of the World, 3rd ed.; University of California Press: Berkeley, CA, USA, 2010. [Google Scholar]
  23. Siebert, L.; Cottrell, E.; Venzke, E.; Andrews, B. Earth’s volcanoes and Their Eruptions: An Overview. In Encyclopedia of Volcanoes; Sigurdsson, H., Houghton, B., Rymer, H., Stix, J., Eds.; Academic Press: Cambridge, MA, USA, 2015. [Google Scholar]
  24. Aspinall, W.; Auker, M.; Hincks, T.; Mahony, S.; Nadim, F.; Pooley, J.; Sparks, R.S.J.; Syre, E. Volcano Hazard and Exposure in GFDRR Priority Countries and Risk Mitigation Measures—GFDRR Volcano Risk Study; Bristol University Cabot Institute and NGI Norway for the World Bank: Bristol, UK, 2011. [Google Scholar]
  25. Brown, S.K.; Auker, M.; Sparks, R. Populations around Holocene volcanoes and development of a Population Exposure Index. In Global Volcanic Hazards and Risk; Cambridge University Press: Cambridge, MA, USA, 2015; pp. 223–232. [Google Scholar]
  26. Scandone, R.; Bartolini, S.; Martí, J. A scale for ranking volcanoes by risk. Bull. Volcanol. 2016, 78, 2. [Google Scholar] [CrossRef]
  27. Freire, S.; Schiavina, M.; Florczyk, A.J.; MacManus, K.; Pesaresi, M.; Corbane, C.; Borkovska, O.; Mills, J.; Pistolesi, L.; Squires, J.; et al. Enhanced data and methods for improving open and free global population grids: Putting leaving no one behind into practice. Int. J. Digit. Earth 2018, 1–17. [Google Scholar] [CrossRef]
  28. Aubrecht, C.; Meier, P.; Taubenböck, H. Speeding up the clock in remote sensing: Identifying the black spots in exposure dynamics by capitalizing on the full spectrum of joint high spatial and temporal resolution. Nat. Hazards 2017, 86, 177. [Google Scholar] [CrossRef]
  29. Pittore, M.; Wieland, M.; Fleming, K. Perspectives on global dynamic exposure modelling for geo-risk assessment. Nat. Hazards 2017, 86, 7–30. [Google Scholar] [CrossRef]
  30. Pesaresi, M.; Ehrlich, D. A methodology to quantify built-up structures from optical VHR imagery. In Global Mapping of Human Settlement Experiences, Datasets, and Prospects; Gamba, P., Herold, M., Eds.; CRC Press: Boca Raton, FL, USA, 2009; pp. 27–58. [Google Scholar]
  31. Pesaresi, M.; Huadong, G.; Blaes, X.; Ehrlich, D.; Ferri, S.; Gueguen, L.; Halkia, M.; Kauffmann, M.; Kemper, T.; Lu, L.; et al. A Global Human Settlement Layer from Optical HR/VHR RS Data: Concept and First Results. IEEE J. Sel. Top. Appl. Earth Obs. Remote Sens. 2013, 6, 2102–2131. [Google Scholar] [CrossRef]
  32. Pesaresi, M.; Ehrlich, D.; Ferri, S.; Florczyk, A.; Freire, S.; Halkia, M.; Julea, A.; Kemper, T.; Soille, P.; Syrris, V. Operating Procedure for the Production of the Global Human Settlement Layer from Landsat Data of the Epochs 1975, 1990, 2000, and 2014; JRC Technical Report EUR 27741 EN; Publications Office of the European Union: Ispra, Italy, 2016. [Google Scholar]
  33. Melchiorri, M.; Pesaresi, M.; Florczyk, A.J.; Corbane, C.; Kemper, T. Principles and Applications of the Global Human Settlement Layer as Baseline for the Land Use Efficiency Indicator—SDG 11.3.1. ISPRS Int. J. Geo Inf. 2019, 8, 96. [Google Scholar] [CrossRef]
  34. Freire, S.; Kemper, T.; Pesaresi, M.; Florczyk, F.; Syrris, V. Combining GHSL and GPW to Improve Global Population Mapping. In Proceedings of the 2015 IEEE International Geoscience & Remote Sensing Symposium Proceedings, Milan, Italy, 26–31 July 2015; pp. 2541–2543. [Google Scholar]
  35. Freire, S.; MacManus, K.; Pesaresi, M.; Doxsey-Whitfield, E.; Mills, J. Development of new open and free multi-temporal global population grids at 250 m resolution. In Proceedings of the 19th AGILE Conference on Geographic Information Science, Helsinki, Finland, 14–17 June 2016. [Google Scholar]
  36. Linard, C.; Kabaria, C.W.; Gilbert, M.; Tatem, A.J.; Gaughan, A.E.; Stevens, F.R.; Sorichetta, A.; Noor, A.M.; Snow, R.W. Modelling changing population distributions: An example of the Kenyan Coast, 1979–2009. Int. J. Digit. Earth 2017, 10, 1017–1029. [Google Scholar] [CrossRef]
  37. Nieves, J.J.; Stevens, F.R.; Gaughan, A.E.; Linard, C.; Sorichetta, A.; Hornby, G.; Patel, N.N.; Tatem, A.J. Examining the correlates and drivers of human population distributions across low- and middle-income countries. J. R. Soc. Interface 2017, 14, 20170401. [Google Scholar] [CrossRef] [Green Version]
  38. Balk, D.; Montgomery, M.R.; Engin, H.; Lin, N.; Major, E.; Jones, B. Urbanization in India: Population and Urban Classification Grids for 2011. Data 2019, 4, 35. [Google Scholar] [CrossRef]
  39. Pesaresi, M.; Ehrlich, D.; Ferri, S.; Florczyk, A.; Freire, S.; Haag, F.; Halkia, M.; Julea, A.M.; Kemper, T.; Soille, P. Global Human Settlement Analysis for Disaster Risk Reduction. ISPRS Int. Arch. Photogramm. Remote Sens. Spat. Inf. Sci. 2015, 40, 837–843. [Google Scholar] [CrossRef]
  40. Pesaresi, M.; Ehrlich, D.; Kemper, T.; Siragusa, A.; Florczyk, A.; Freire, S.; Corbane, C. Atlas of the Human Planet 2017: Global Exposure to Natural Hazards; Publications Office of the European Union: Brussels, Belgium, 2017. [Google Scholar]
  41. Ehrlich, D.; Melchiorri, M.; Florczyk, A.J.; Pesaresi, M.; Kemper, T.; Corbane, C.; Freire, S.; Schiavina, M.; Siragusa, A. Remote Sensing Derived Built-Up Area and Population Density to Quantify Global Exposure to Five Natural Hazards over Time. Remote Sens. 2018, 10, 1378. [Google Scholar] [CrossRef]
  42. Ehrlich, D.; Kemper, T.; Pesaresi, M.; Corbane, C. Built-up area and population density: Two Essential Societal Variables to address climate hazard impact. Environ. Sci. Policy 2018, 90, 73–82. [Google Scholar] [CrossRef]
  43. Alfieri, L.; Bisselink, B.; Dottori, F.; Naumann, G.; De Roo, A.; Salamon, P.; Wyser, K.; Feyen, L.; Roo, A. Global projections of river flood risk in a warmer world. Earth’s Future 2017, 5, 171–182. [Google Scholar] [CrossRef]
  44. Freire, S.; Florczyk, A.; Pesaresi, M. New Multi-temporal Global Population Grids—Application to Volcanism. In Proceedings of the 13th International ISCRAM Conference, Rio de Janeiro, Brazil, 22–25 May 2016. [Google Scholar]
  45. Center for International Earth Science Information Network. Columbia University Gridded Population of the World; Version 4; Center for International Earth Science Information Network: Palisades, NY, USA, 2016. [Google Scholar]
  46. Doxsey-Whitfield, E.; MacManus, K.; Adamo, S.B.; Pistolesi, L.; Squires, J.; Borkovska, O.; Baptista, S.R. Taking Advantage of the Improved Availability of Census Data: A First Look at the Gridded Population of the World, Version 4. Pap. Appl. Geogr. 2015, 1, 1–9. [Google Scholar] [CrossRef]
  47. Global Volcanism Program. Volcanoes of the World; Venzke, E., Ed.; Smithsonian Institution: Washington, DC, USA, 2013. [Google Scholar]
  48. National Oceanic and Atmospheric Administration. National Geophysical Data Center World Data Service (NGDC/WDS): Significant Volcanic Eruptions Database; National Geophysical Data Center: Silver Spring, MD, USA, 2019. [CrossRef]
  49. Nakada, S. Hazards from pyroclastic flows and surges. In Encyclopedia of Volcanoes; Sigurdsson, H., Ed.; Academic Press: San Diego, CA, USA, 2000; pp. 945–956. [Google Scholar]
  50. Rodolfo, K.S. The hazard from lahars and Jokulhlaups. In Encyclopedia of Volcanoes; Sigurdsson, H., Ed.; Academic Press: San Diego, CA, USA, 2000; pp. 973–996. [Google Scholar]
Figure 1. Distribution of the two global datasets of volcanoes used in this study: Holocene Volcano List v4.7.6 (HV) and Significant Volcanic Eruption Database (SV) (World Mollweide projection).
Ijgi 08 00341 g001
Figure 2. Cumulative population as a function of radial distance to Holocene volcanoes (HV), in 1975, 1990, 2000, and 2015.
Ijgi 08 00341 g002
Figure 3. Cumulative population as a function of radial distance to volcanoes in Significant Volcanic Eruption Database (SV), in 1975, 1990, 2000, and 2015.
Ijgi 08 00341 g003
Figure 4. Average population density as a function of radial distance to Holocene volcanoes (HV), in 1975, 1990, 2000, and 2015.
Ijgi 08 00341 g004
Figure 5. Average population density as a function of radial distance to volcanoes in Significant Volcanic Eruption Database (SV), in 1975, 1990, 2000, and 2015.
Ijgi 08 00341 g005
Figure 6. Selected distances from Holocene volcanoes in (A) Southeast Asia and (B) Central America.
Ijgi 08 00341 g006
Figure 7. Average population density in Southeast Asia (SEAsia) and Central America (CAm) as a function of radial distance of Holocene Volcanoes (HV), in 1975 and 2015.
Ijgi 08 00341 g007
Figure 8. Average population density in Southeast Asia (SEAsia) and Central America (CAm) as a function of radial distance of volcanoes in Significant Volcanic Eruption Database (SV), in 1975 and 2015.
Ijgi 08 00341 g008
Figure 9. Island of Java (Indonesia), showing selected distances from Holocene volcanoes, main cities, and population distribution in 2015 from GHS-POP (World Mollweide projection).
Ijgi 08 00341 g009
Table 1. Population (in millions and as percentage of World total) by radial distance from Holocene volcanoes (HV) in 1975, 1990, 2000, and 2015.
1975199020002015
Distance (km)Pop. [106]%Pop. [106]%Pop. [106]%Pop. [106]%
10290.7410.8490.8590.8
301764.32434.62844.63404.6
503017.44157.848985928.1
10056613.975114.187014.2105414.3
Global4061100531010061271007349100
Table 2. Compound annual growth rate of population by radial distance from Holocene volcanoes (HV) for each time interval.
Distance (km)1975–19901990–20002000–20151975–2015
102.291.761.271.78
302.191.581.191.66
502.171.641.291.71
1001.901.481.291.57
Global1.801.441.221.49
Table 3. Population (in millions and percentage of World total) by radial distance from volcanoes with significant eruptions (SV) in 1975, 1990, 2000, and 2015.
1975199020002015
Distance (km)Pop. [106]%Pop. [106]%Pop. [106]%Pop. [106]%
10120.3160.3180.3210.3
30872.21152.21302.11502
501694.12224.22544.12974
1003338.24448.45158.46168.4
Global4061100531010061271007349100
Table 4. Compound annual growth rate of population by radial distance of volcanoes with significant eruptions (SV) for each time interval.
Distance (km)1975–19901990–20002000–20151975–2015
101.901.431.031.45
301.821.280.961.36
501.861.361.051.43
1001.941.481.201.55
Global1.801.441.221.49
Table 5. Population (in millions and percentage of region total) by radial distance of Holocene volcanoes (HV) and volcanoes in Significant Volcanic Eruption Database (SV) in 1975, 1990, 2000, 2015, in Southeast Asia and Central America.
1975199020002015
Dist. (km)HVSVHVSVHVSVHVSV
Southeast Asia
1011 (6.6%)[4 (2.5%)]18 (7.3%)[7 (2.8%)]22 (7.5%)[8 (2.9%)]27 (7.4%)[10 (2.9%)]
3073 (42.5%)[42 (24.2%)]109 (44.6%)[59 (24.3%)]129 (44.3%)[69 (23.7%)]153 (42.5%)[81 (22.4%)]
50118 (68.4%)[80 (46.2%)]171 (69.9%)[113 (46.1%)]202 (69.6%)[132 (45.4%)]243 (67.7%)[157 (43.6%)]
100143 (82.8%)[132 (76.2%)]207 (84.9%)[189 (77.4%)]247 (85.1%)[225 (77.4%)]301 (83.7%)[272 (75.8%)]
Region173 (100%)244 (100%)290 (100%)359 (100%)
Central America
106 (7.1%)[2 (3%)]8 (6.9%)[3 (2.7%)]9 (6.8%)[3 (2.5%)]11 (6.4%)[4 (2.3%)]
3029 (35.3%)[11 (14.1%)]40 (34.6%)[16 (13.9%)]47 (34.1%)[19 (13.8%)]57 (32.8%)[23 (13.4%)]
5041 (50.3%)[22 (27%)]56 (49.1%)[30 (26.4%)]67 (48.3%)[36 (25.9%)]81 (46.7%)[43 (24.9%)]
10057 (70.6%)[44 (53.9%)]81 (70.3%)[60 (52.2%)]97 (70%)[71 (51.2%)]120 (69.4%)[86 (49.7%)]
Region81 (100%)115 (100%)139 (100%)173 (100%)
Table 6. Compound annual growth rate of population by radial distance of Holocene volcanoes (HV) and volcanoes in the Significant Volcanic Eruption Database (SV), for each time interval, in Southeast Asia and Central America.
1975–19901990–20002000–20151975–2015
Dist. (km)HVSVHVSVHVSVHVSV
Southeast Asia
103.05[3.15]2.10[2.16]1.36[1.34]2.17[2.22]
302.66[2.37]1.69[1.49]1.15[1.05]1.85[1.65]
502.48[2.32]1.71[1.59]1.25[1.15]1.82[1.7]
1002.51[2.44]1.77[1.74]1.32[1.29]1.88[1.83]
Region2.341.751.431.85
Central America
102.14[1.67]1.67[1.31]1.07[0.84]1.62[1.27]
302.21[2.25]1.75[1.84]1.21[1.28]1.72[1.78]
502.19[2.19]1.74[1.74]1.24[1.19]1.72[1.7]
1002.31[2.13]1.88[1.71]1.41[1.27]1.86[1.7]
Region2.341.911.471.91

