An Examination of the Distribution of White-Collar Worker Residences in Tokyo and Osaka during the Modernizing Period


Department of Communication, Faculty of Letters, Kogakkan University, Ise 5168555, Japan
ISPRS Int. J. Geo-Inf. 2019, 8(9), 375; https://0-doi-org.brum.beds.ac.uk/10.3390/ijgi8090375
Submission received: 4 July 2019
/
Revised: 19 August 2019
/
Accepted: 26 August 2019
/
Published: 28 August 2019
(This article belongs to the Special Issue Historical GIS and Digital Humanities)
Abstract
:This paper sheds light on the residences of white-collar workers in Tokyo and Osaka, Japan in the modernizing period using historical statistical data and telephone directories from a historical geographic information system (GIS) analysis. We examined the differences between the distribution of white-collar workers and the progress of suburbanization by comparing the respective unemployment censuses and telephone directories of Tokyo and Osaka. The analysis shows that in 1925, there was a tendency for many white-collar workers to live in certain city sectors, as well as in the city center. However, this trend had changed by the mid-1930s, when data show that private-sector white-collar workers tended to live more in areas with a relatively low population density. Compared to Osaka, Tokyo was relatively suburbanized with white-collar workers in private companies.
1. Introduction
Since the late 1990s, the construction and public accessibility of historical GIS databases have progressed [1], and research on historical geography and spatial humanities has been conducted using historical GIS data [2]. Historical GIS databases store many types of spatial data resources in various periods. The typical data included in the historical GIS database are statistical data and map data [3,4], and historical GIS research on cities after the modernizing period where these materials are often accumulated has been conducted.
Urbanization had rapidly progressed in the modernizing period, and urban segregation had begun to attract research attention by urban sociologists of the Chicago School [5]. The research on the segregation of modern and large cities has also been conducted using historical GIS data. For example, Beveridge (2002) used the historical census data for New York obtained from the National Historical GIS [6], and Gilliland and Olson (2010) used non-aggregated data based on historical atlases in Montreal [7]. In addition, by using the historical GIS database at the country level, it is possible to analyze comparisons between metropolitan areas in the United States from a long-term perspective. Furthermore, if there are historical GIS databases based on statistical materials such as census and detailed atlases, more research can be conducted. Focusing on Japan, the construction of historical GIS databases is not sufficient, and research examples using them are limited to specific cities. Only the case of Kyoto [8] is known as a historical GIS database containing statistical data about cities. It is only after the 1960s that census statistics for rural areas became available in Japan [9]. Therefore, the historical GIS database on statistics is inevitably created from materials published by local governments rather than the national statistics office. However, data for analyzing segregation, such as population by occupation or ethnicity, are only available in a few cities [10]. Fortunately, directory materials such as social registers and telephone directories are available to some extent. The people listed in these materials are often from more affluent social classes, but there are still materials for analyzing segregation by occupation, as well as social classes that cannot be grasped from statistical data.
The upper class in modern Japan was a pioneer in suburbanization. As a result of population concentration in large cities in Japan, relatively wealthy capitalist classes and white-collar workers such as managers, professionals, office workers, and technical workers moved to new suburban residential areas [11]. The construction and development of railways mainly for intercity transport promoted the suburbanization of such white-collar workers [12]. On the other hand, detailed geographical studies in Tokyo [13] and Osaka [14] show a difference in the result regarding this suburbanization by white-collar workers. In Tokyo in 1920, military personnel, civil servants, and professional workers were living in the newly expanded western and southern areas, rather than the traditional city center [13]. Meanwhile, in Osaka in the 1920s, white-collar workers lived in the traditional city center and inner suburbs [14]. Is such a difference caused by differences in the progress of suburbanization by each city? Comparing these two cities in more detail will allow us to answer this question. It should be noted that the statistical materials used in these two studies are not the same, and are created independently by each city government. Therefore, we cannot analyze in spatial units of the same scale, and it is difficult to make a direct comparison of the two cities.
In addition to the size and progress of suburbanization, it is possible that there are other contributing factors that cannot be gleaned using data from previous studies. Therefore, we examine this question using quantitative, historical GIS data that show the distribution status of urban white-collar workers in the pre-war period. Clarifying the differences or similarities in the distribution of white-collar workers as an aspect of segregation will help elucidate the spatial structure of modern Japanese metropolises.
2. Data and Methods
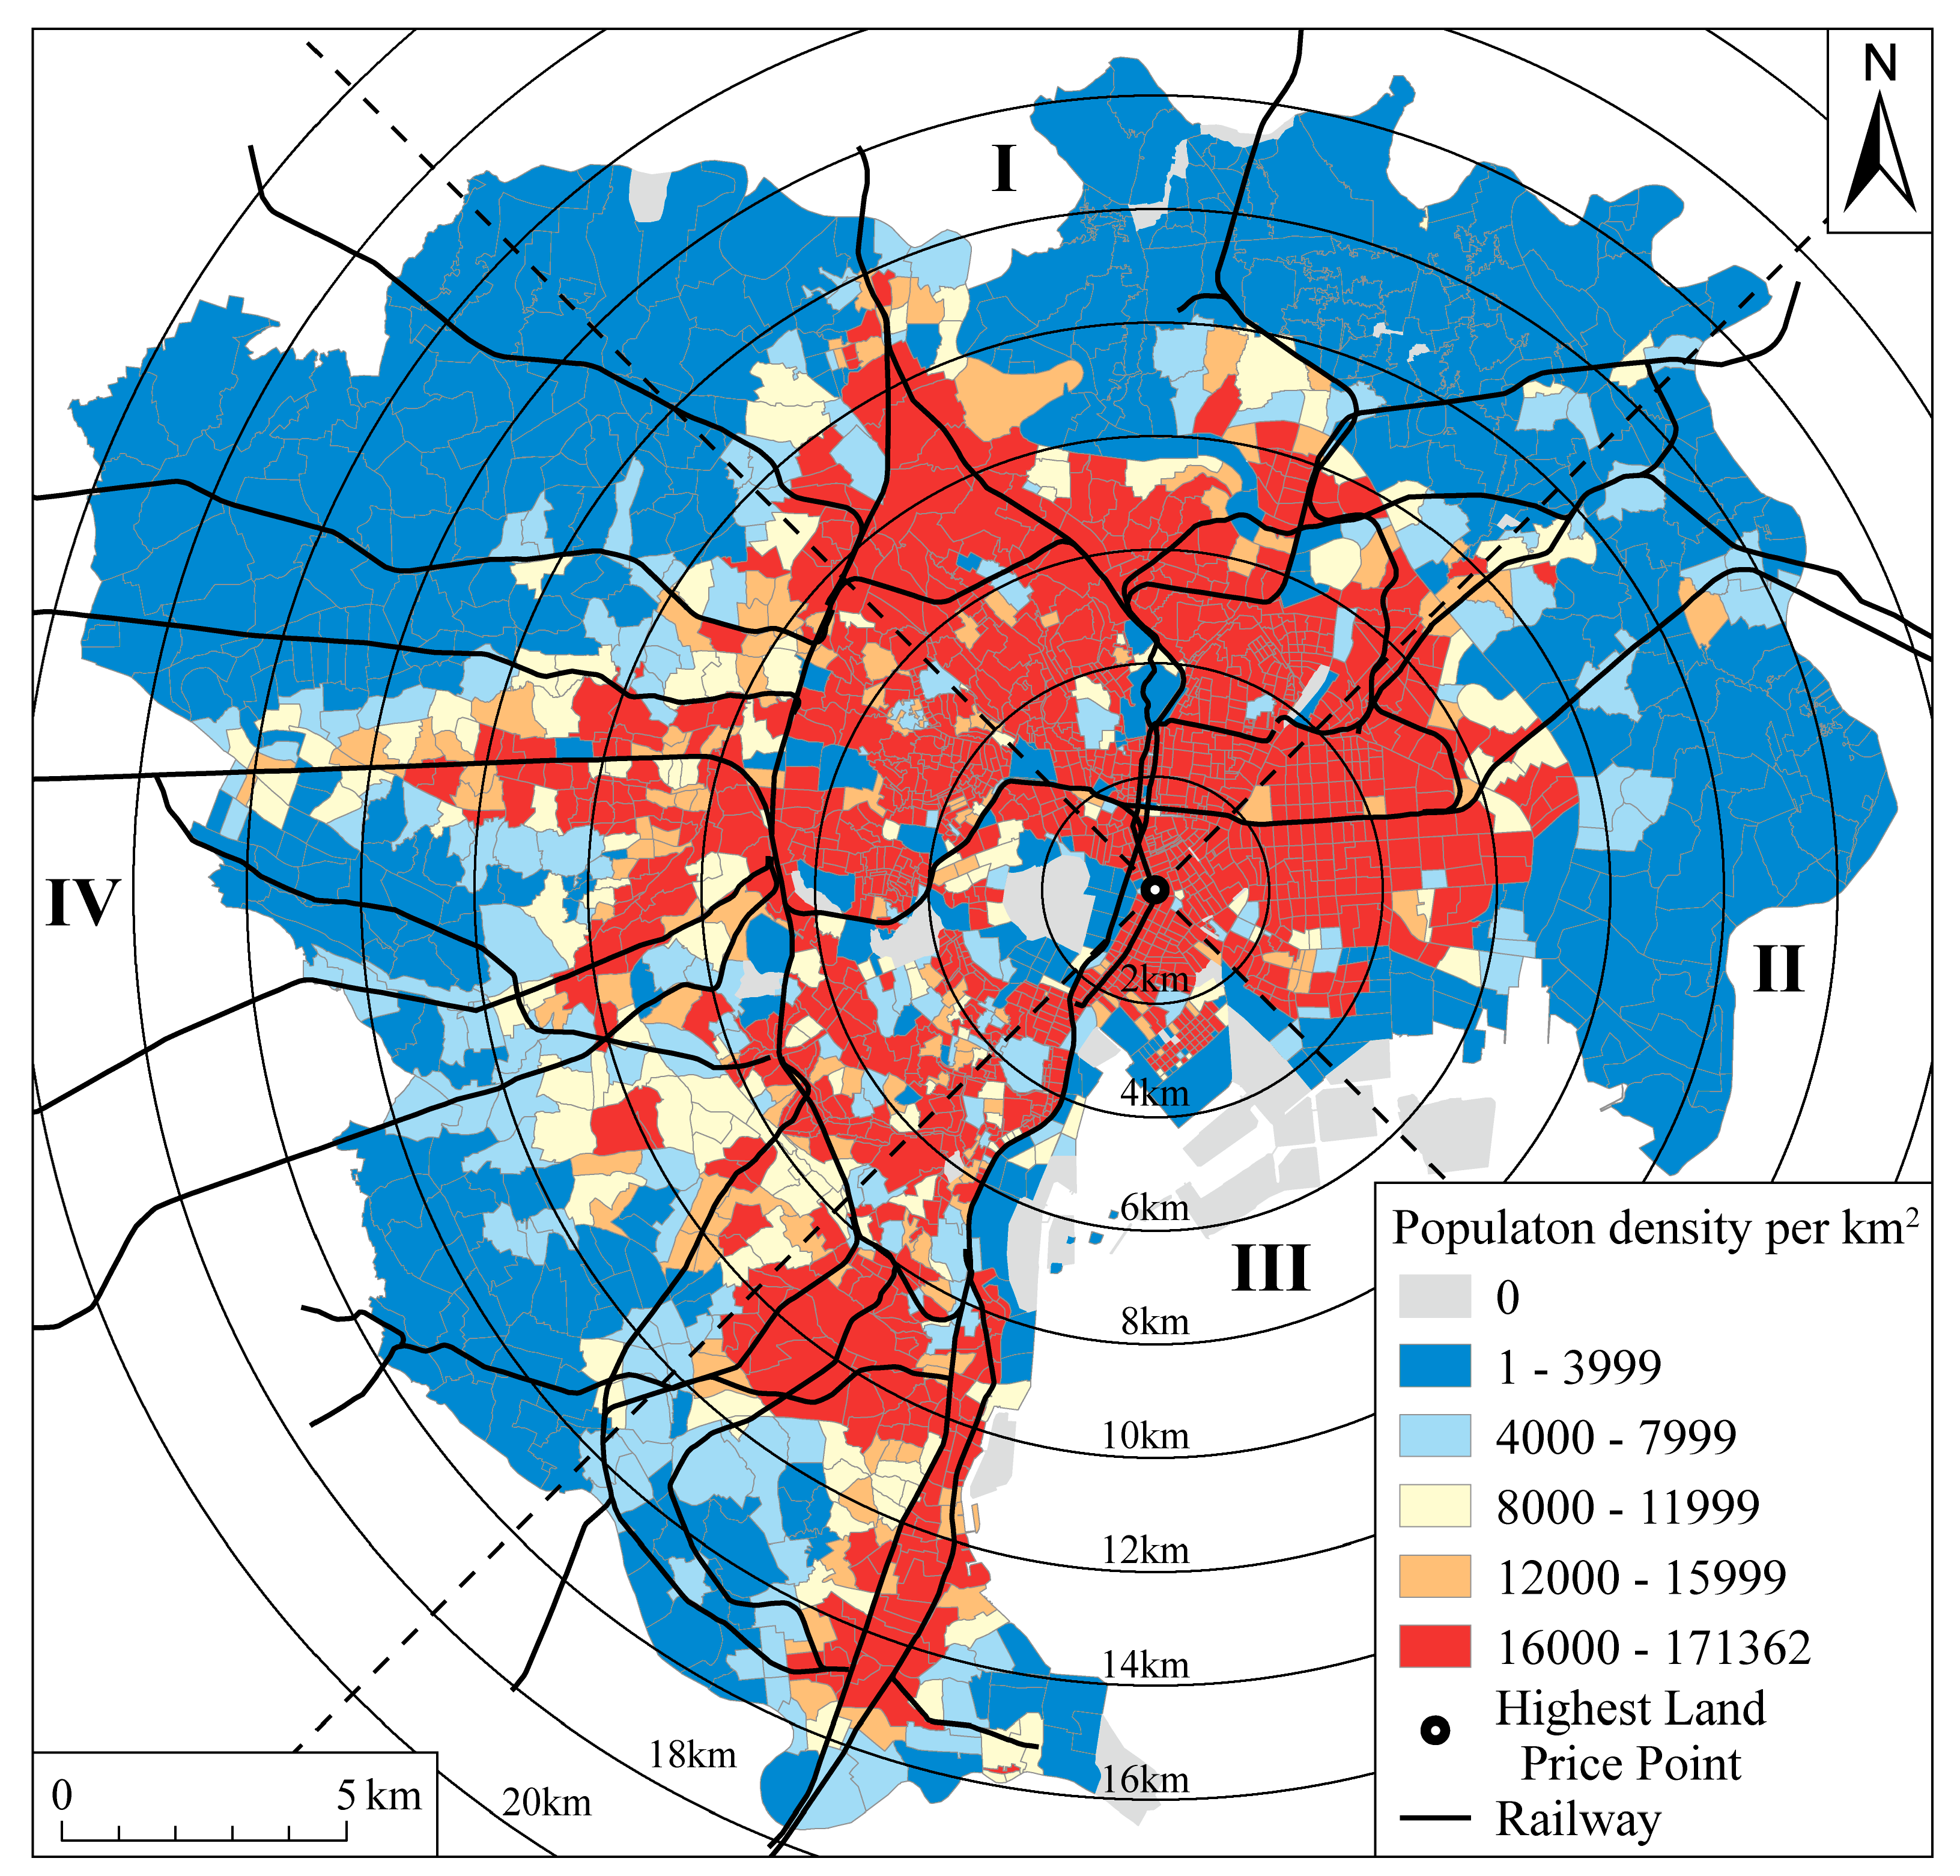
Before showing the distribution of white-collar workers, it is necessary to grasp the characteristics of urbanized areas in Tokyo and Osaka during the modernizing period. GIS data on land use in both the cities at that time were not available. Instead, using the population data based on the census [10], we see that urbanized areas are based on population density. In Japan, districts with a population density of 4000 or more per square kilometer in small area units [15] have been regarded as urban areas, and those with a population density less than this are considered suburbs. In addition, the location of the city center is identified using the highest land price indicated in the statistical data of 1935. The highest land price point in Tokyo is Muromachi 1-chome, Nihonbashi-ku [16], and in Osaka is Kitahama 2-chome, Higashi-ku [17]. Figure 1 and Figure 2 show the urban and suburb areas in 1935, and the city center. The concentric circles are measured in two-kilometer intervals and the sectors from I to IV from the highest land price point. The population density was divided into five levels based on a density of 4000 per square kilometer. In both the cities, most of the city area at that time was thought to be urbanized, but areas with low population density still remained in areas close to the city boundaries.
In this study, we mainly analyze two materials: The unemployment census of 1925, and modernizing-era telephone directories. The unemployment census was conducted because of the need for measures against unemployment in the recession during the 1920s, but the census was conducted for all workers, and the number of factory workers, salaried workers, and day laborers could be grasped [18]. The salaried workers in the unemployment census are those who earn salaries and engage in administrative and technical positions, and workers who are employed by local governments or private companies having representative occupations [18]. In other words, the salaried workers in the unemployment census are public or private white-collar workers, excluding managers and professionals. The results of the unemployment census are summarized only in units of municipalities published by the national statistics bureau of Japan, but the small area statistics on the unemployment census are only published by some cities. In order to make it consistent with the analysis of the telephone directories, we will use the results of the unemployment census within the city boundary as of 1935 and 1937.
Next, using the telephone directories of 1935 and 1937, we confirm the distribution of company employees and executives at that time. Telephone directories were created in many cities in Japan before World War II, so it is possible to grasp the occupations of telephone subscribers (Figure 3).
Depending on the region, there are also telephone directories classified by occupations. The telephone directories used in this study were “Syokugyou-betsu Denwa Meibo Dai 25 Han (Classified Telephone Directory of Tokyo, 25th Edition)” [19] published in 1935 and “Osaka-shi Oyobi Kinko Denwa Bango-bo (Telephone Directory of Osaka City and Suburbs)” [20] published in 1937. We extracted registrations corresponding to company employees and executives from the telephone directories: the number of telephone subscribers of company employees and executives (TSCEE) in Tokyo in 1937 was 9702, and in Osaka in 1935 was 1904. However, the telephone subscription rate at that time was still low, and not all individuals owned a telephone, as the telephone system in Japan had just begun in 1890. In 1935, the telephone subscriber rate in Tokyo was only 10.4% [16], considering the number of households. The number of all telephone subscribers per 100 households was 9.6 in 1935 in Tokyo [16] and 13.3 in 1937 in Osaka [21]. For this reason, an exhaustive analysis is not possible, as telephone subscribers mainly belonged to higher social classes. However, this material does allow for comparisons between cities.
The georeferencing of records in the telephone directories is possible from the address information. However, georeferencing by lot number is difficult because the map at that time cannot be obtained for a wide area. The address matching system has been created for Tokyo [22], but its coverage is limited to the former Tokyo city until 1932 and cannot be used for this analysis. Although it is necessary to consider the issue of the modifiable areal unit problem (MAUP) [23], here we will count up on a town block basis in consideration of consistency with demographic data. The larger the population size of the town block, the greater the number of telephone subscribers. Therefore, we calculate the number of the TSCEE per 100 households based on the 1935 Population Census [10]. Since there is no population data for 1937 for Osaka, the results of the 1935 census are used. Local Moran’s I statistics [24] was used to analyze the spatial distribution of the number of the TSCEE per 100 households. The bandwidth in the calculation of the spatial weight matrix is the distance between the centroids of the polygon that guarantees at least one neighbor: the distance in Tokyo is 1583.32 m and in Osaka is 1211.49 m. When calculating the weight, we use the inverse distance. The number of permutations is 999, and GeoDa [25] calculates the high-high (HH), high-low (HL), low-high (LH), low-low (LL) clusters which are significant at the 5% level, except for areas with zero households. Then, based on the distance between the city center and the centroids of the town blocks and the direction, the distribution is quantitatively grasped.
3. Results
3.1. Distributions of the Salaried Workers in 1925
The proportion of salaried workers in Tokyo in 1925, shown in Figure 4, is higher than the average mainly in sectors III and IV. In sector I, except for the area adjacent to sector IV, there are not many areas higher than the average. In sector II, there are areas with a high proportion of salaried workers. Nihonbashi-ku, which includes the highest land price point, is the city center, and the proportion of salaried workers is the third-highest among the municipalities within the targeted area, 50.4% [26]. In Tokyo in 1925, sectors III and IV and the city center were comprised predominantly of white-collar workers.
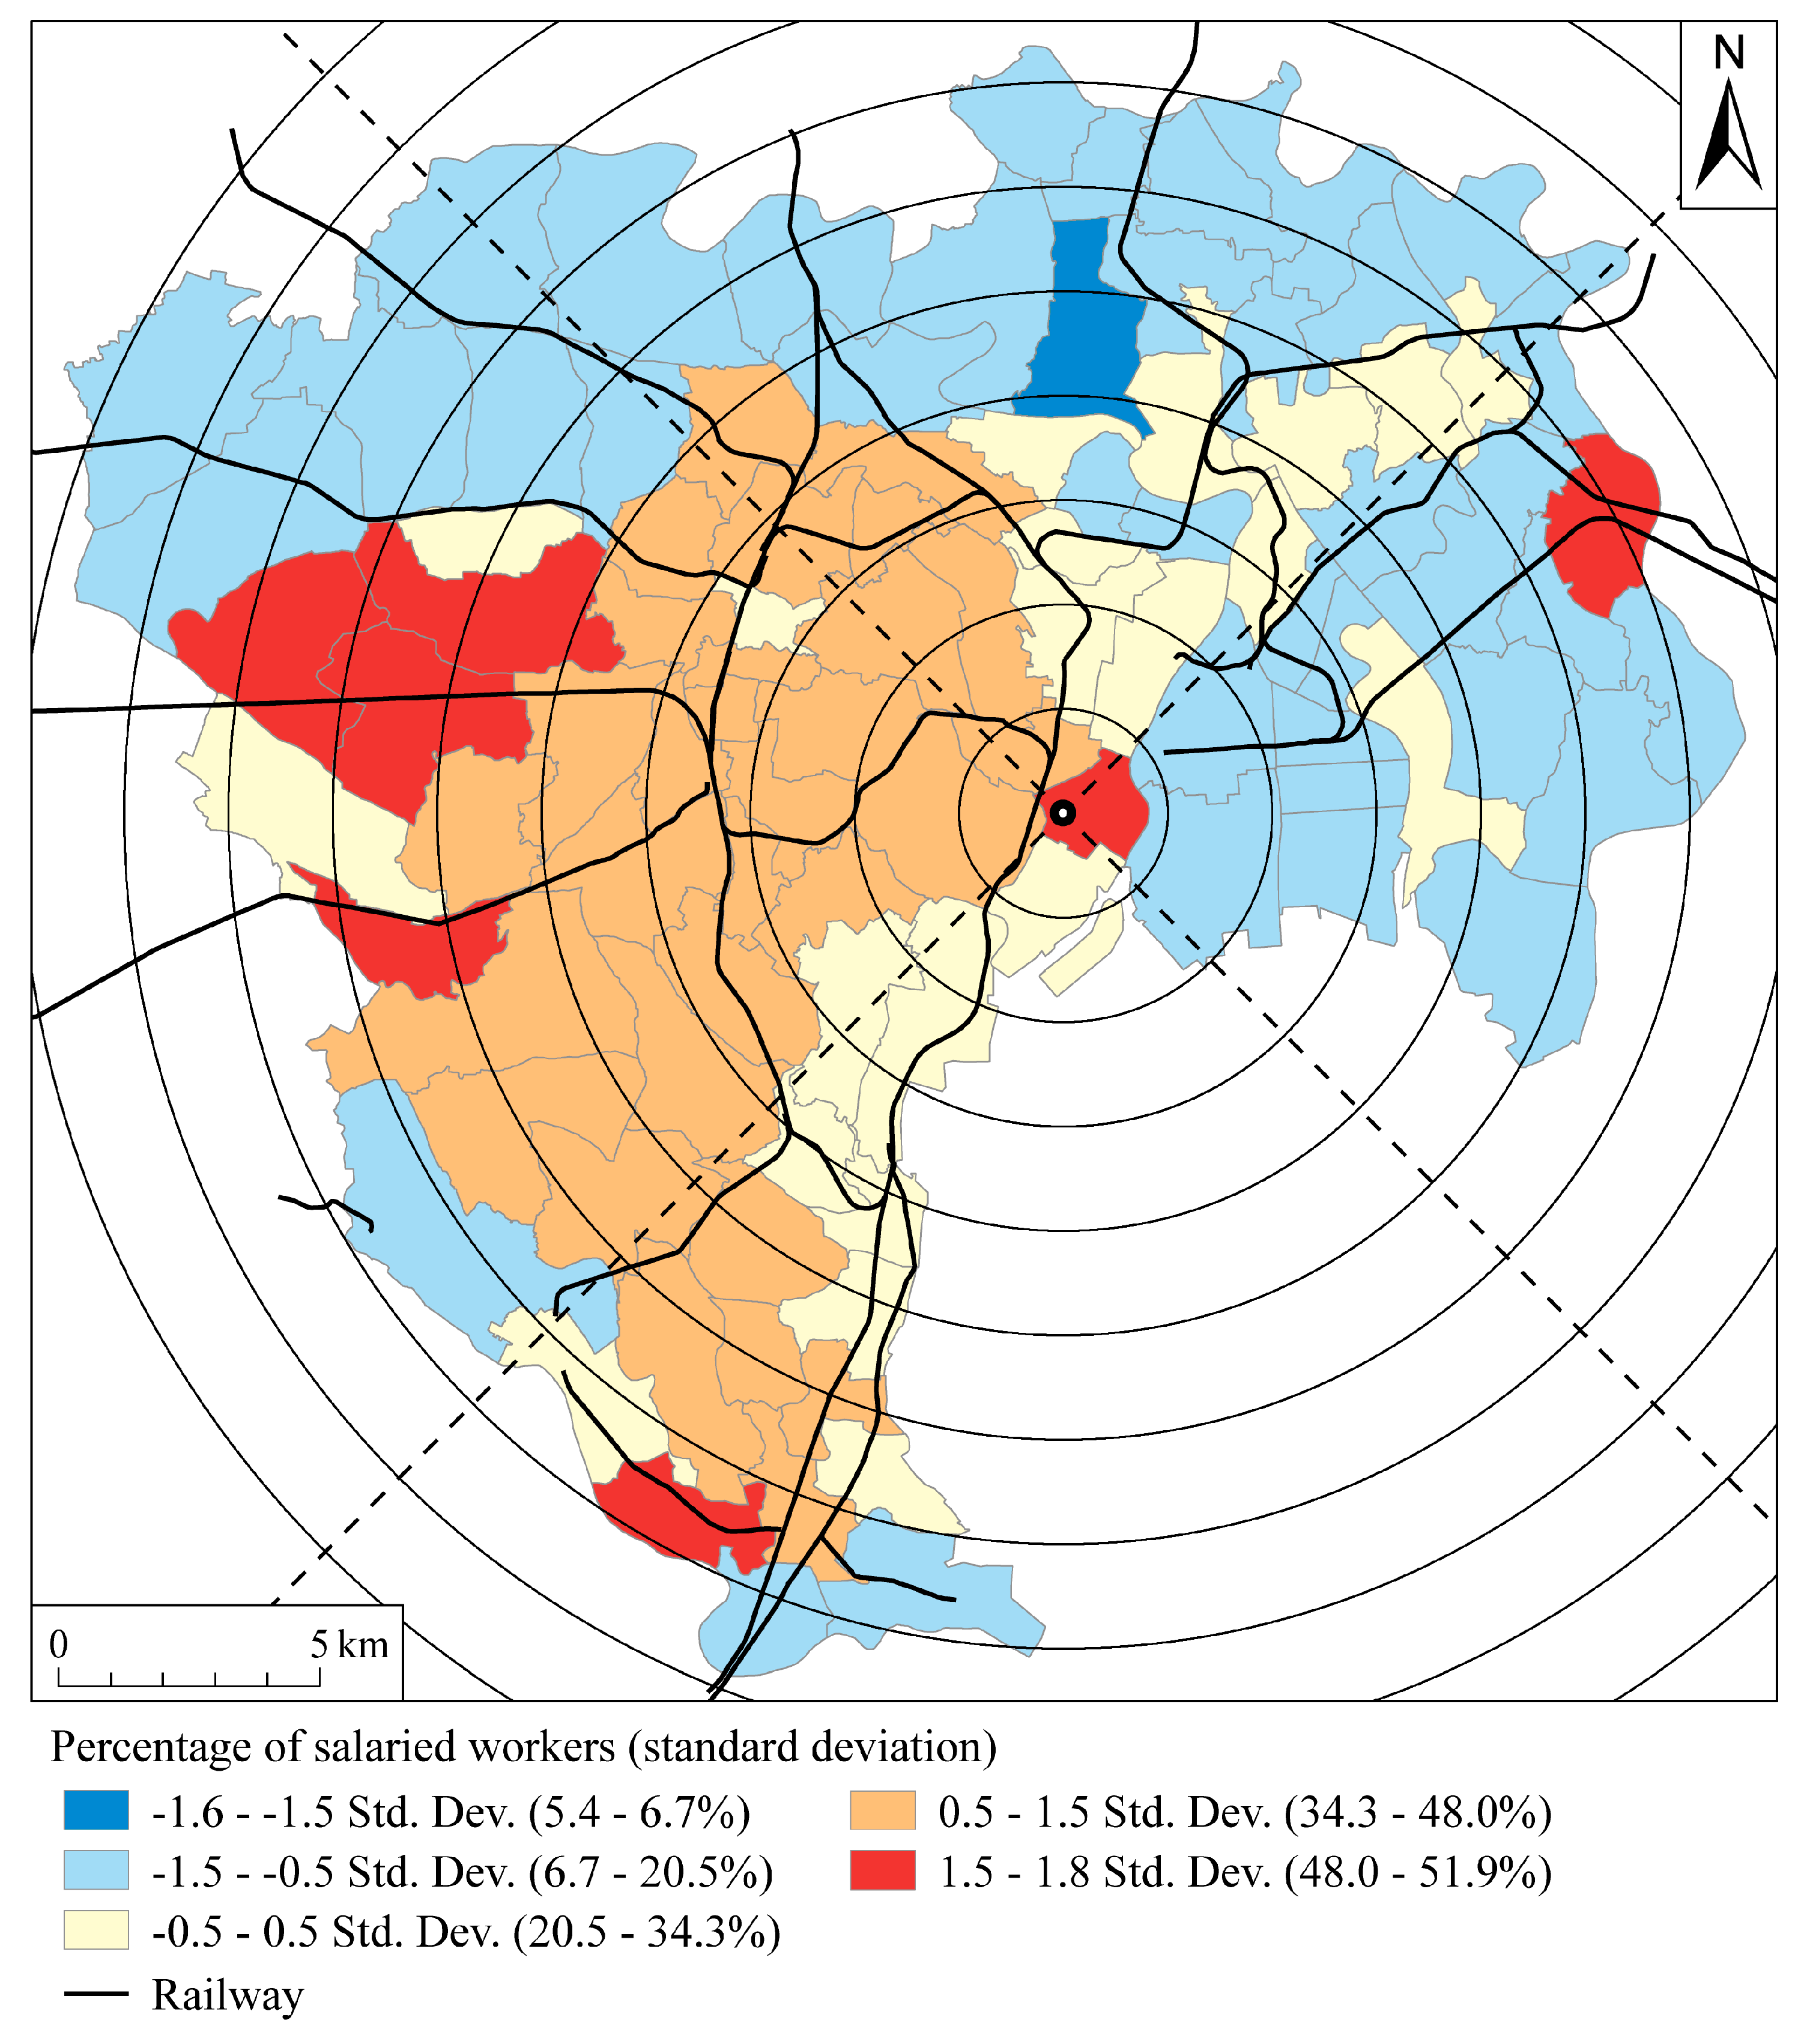
Figure 5 shows the proportion of salaried workers in 1925 in Osaka. Since the district is generally larger than Tokyo, it cannot always be judged by the sector based on the highest land prices, but in sector III, the proportion of salaried workers is generally higher than the average. However, as in Tokyo, it does not spread continuously to specific sectors from the city center, but there are areas with low values in the 3 to 5 km zone, so it is consistently low in sector III. In the case of Osaka, in the urban area at that time, the city center and part of sector III were areas where white-collar workers were prominent.
3.2. Distributions of Company Employees and Executives based on Telephone Directories in the mid-1930s
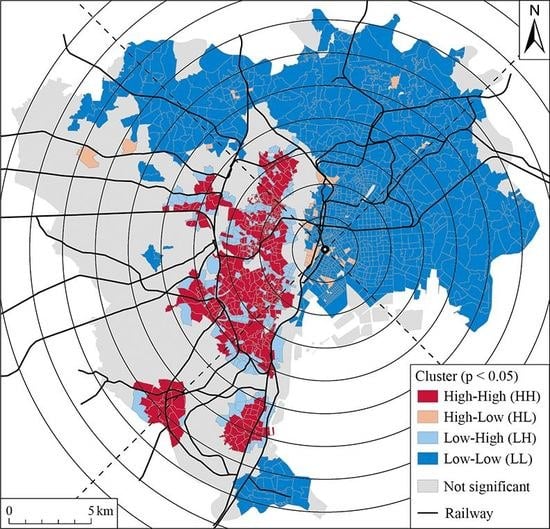
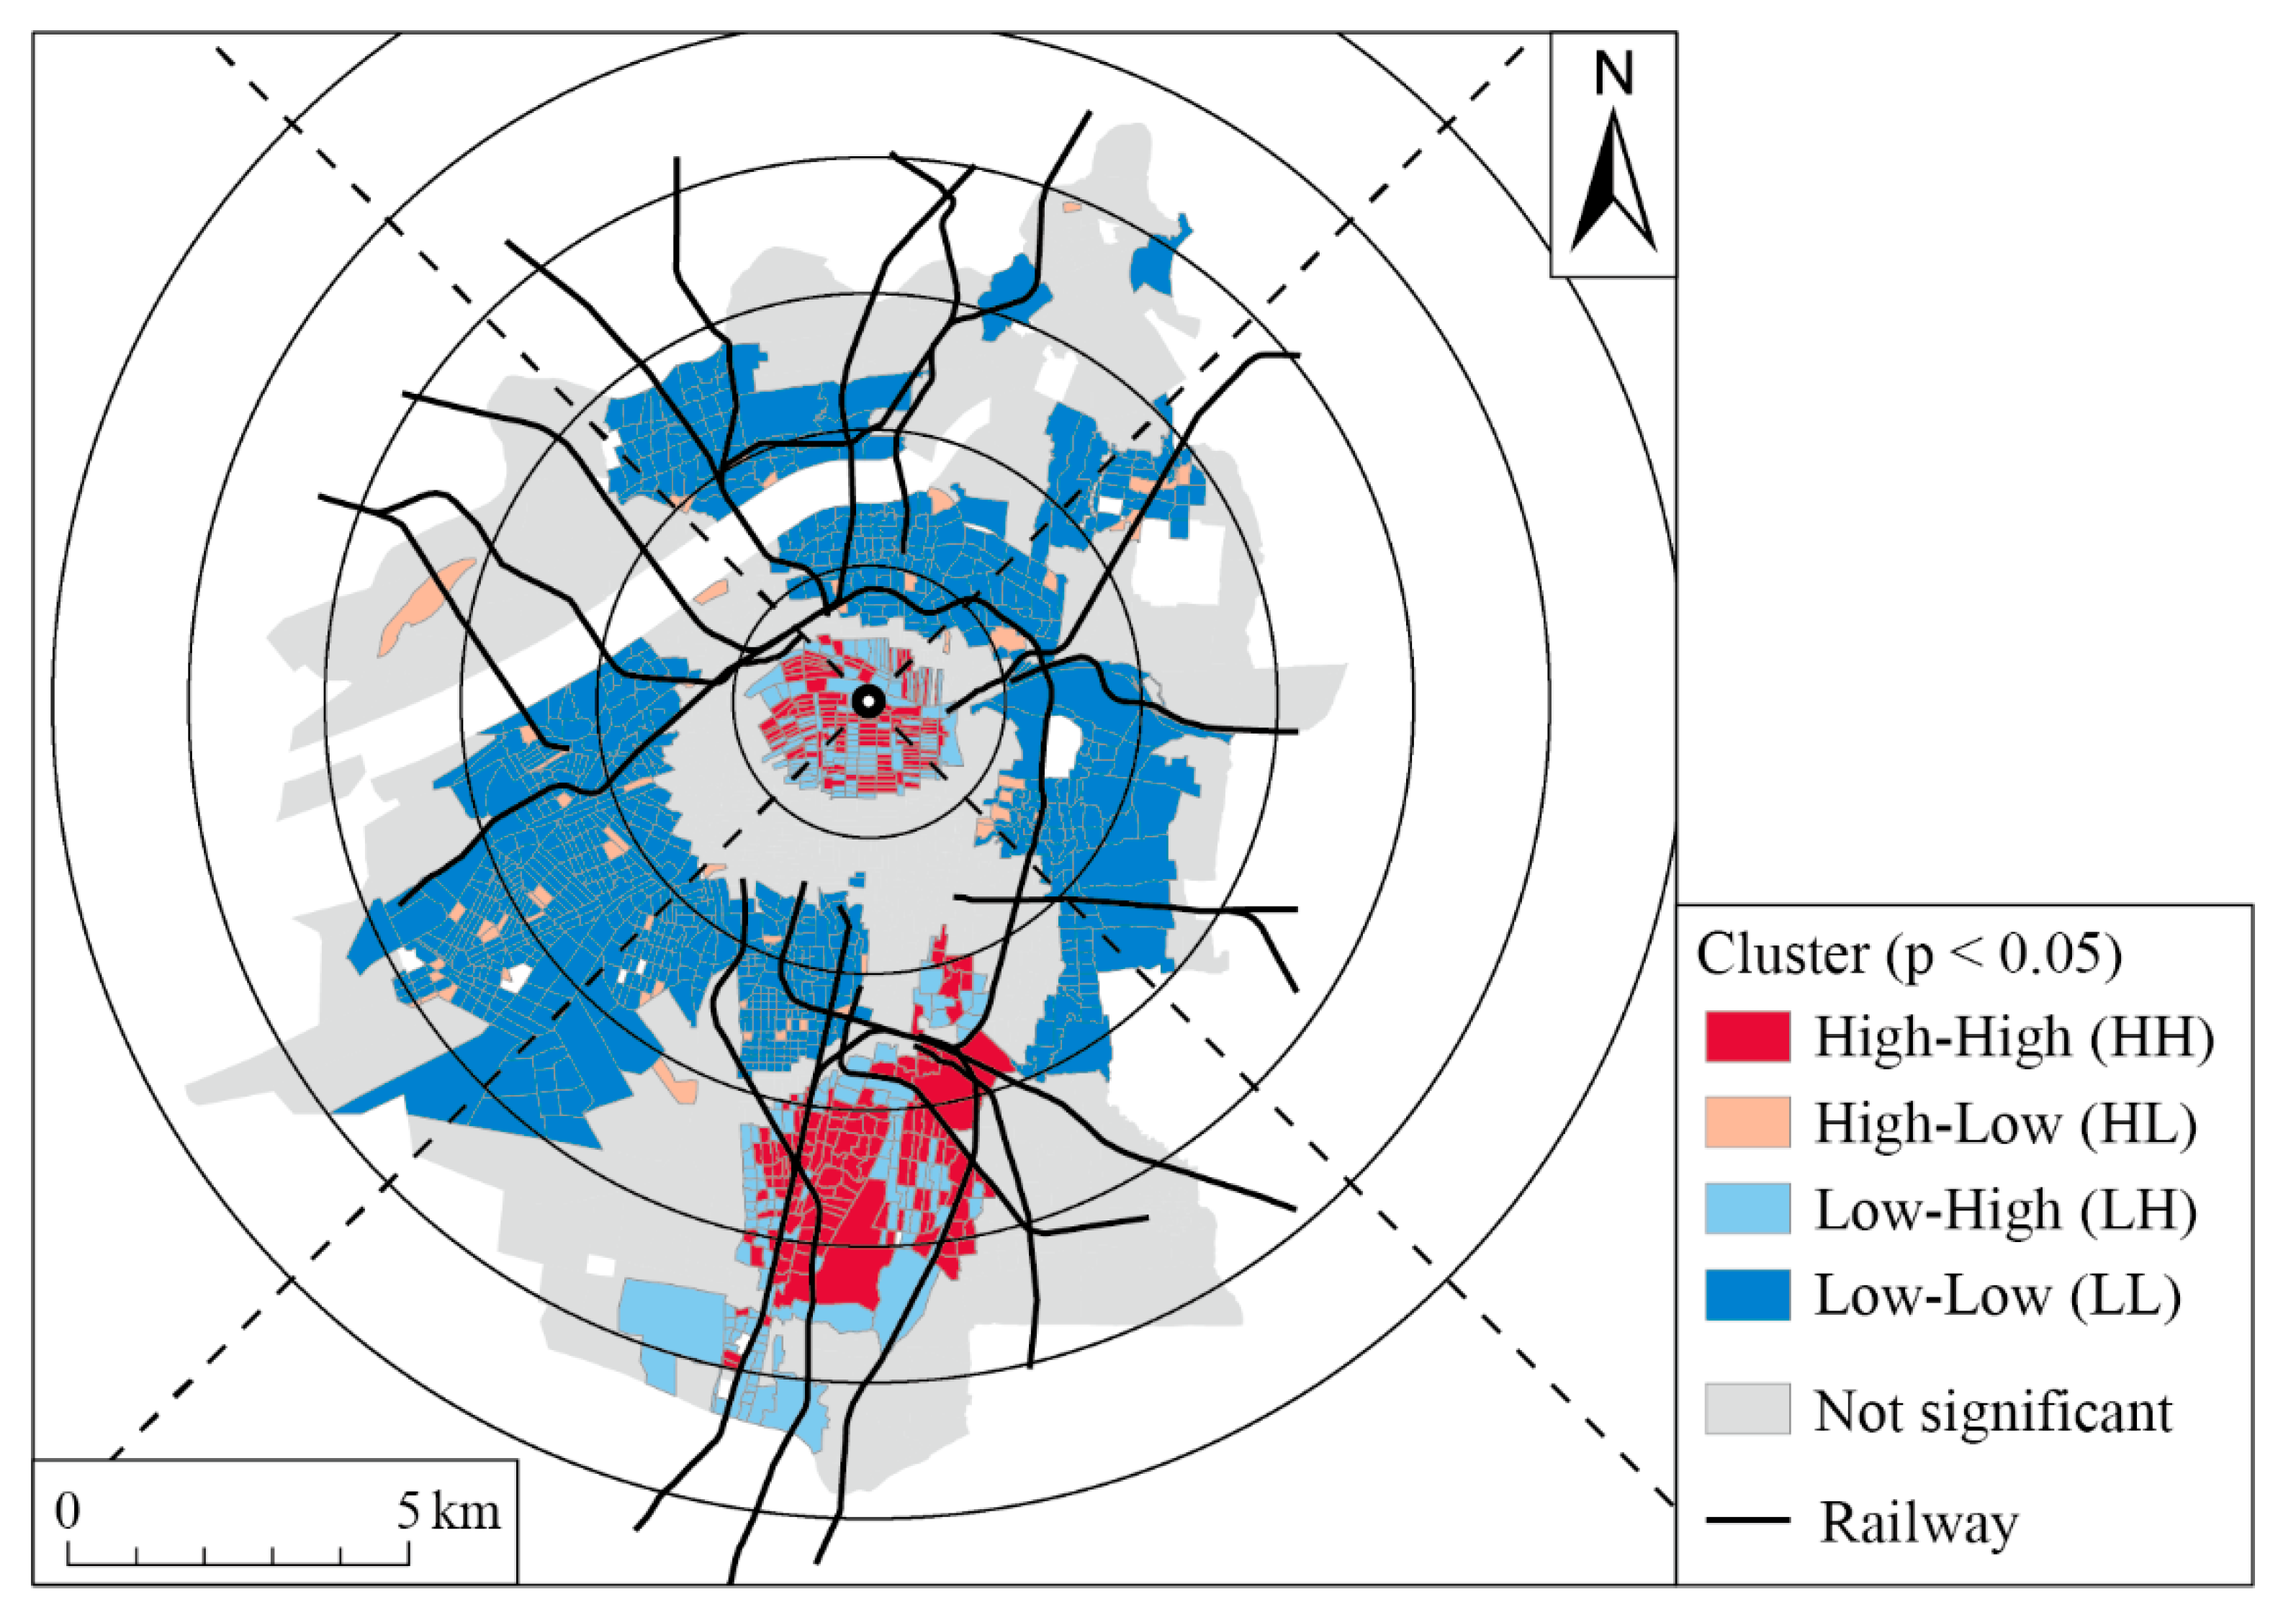
Figure 6 shows the areas with significant spatial autocorrelation for the number of the TSCEE per 100 households in Tokyo in 1935. The HH clusters are distributed in and around sector IV within 2 to 10 km of the highest land price point. In addition, as an enclave, it is distributed in the range of about 10 to 16 km in sector IV and the southwest area. The latter HH cluster may be located outside the urban area in the western half and may be a suburban residential area that was just recently developed. On the other hand, the area around the highest point of land prices belongs to the LL cluster, and the HH clusters are not seen within two kilometers even in sector IV. There are no significant HH clusters in sector II, whether in the urban area or the suburb. The HH clusters can be seen in sector I, but they are integrated with clusters that spread out in sector IV. In this way, the area where there are many company employees and executives in Tokyo is the area centered on sector IV, not including the core area of the traditional city center of about two kilometers around the highest land price point. The residences of company employees and executives were also found outside the suburban area.
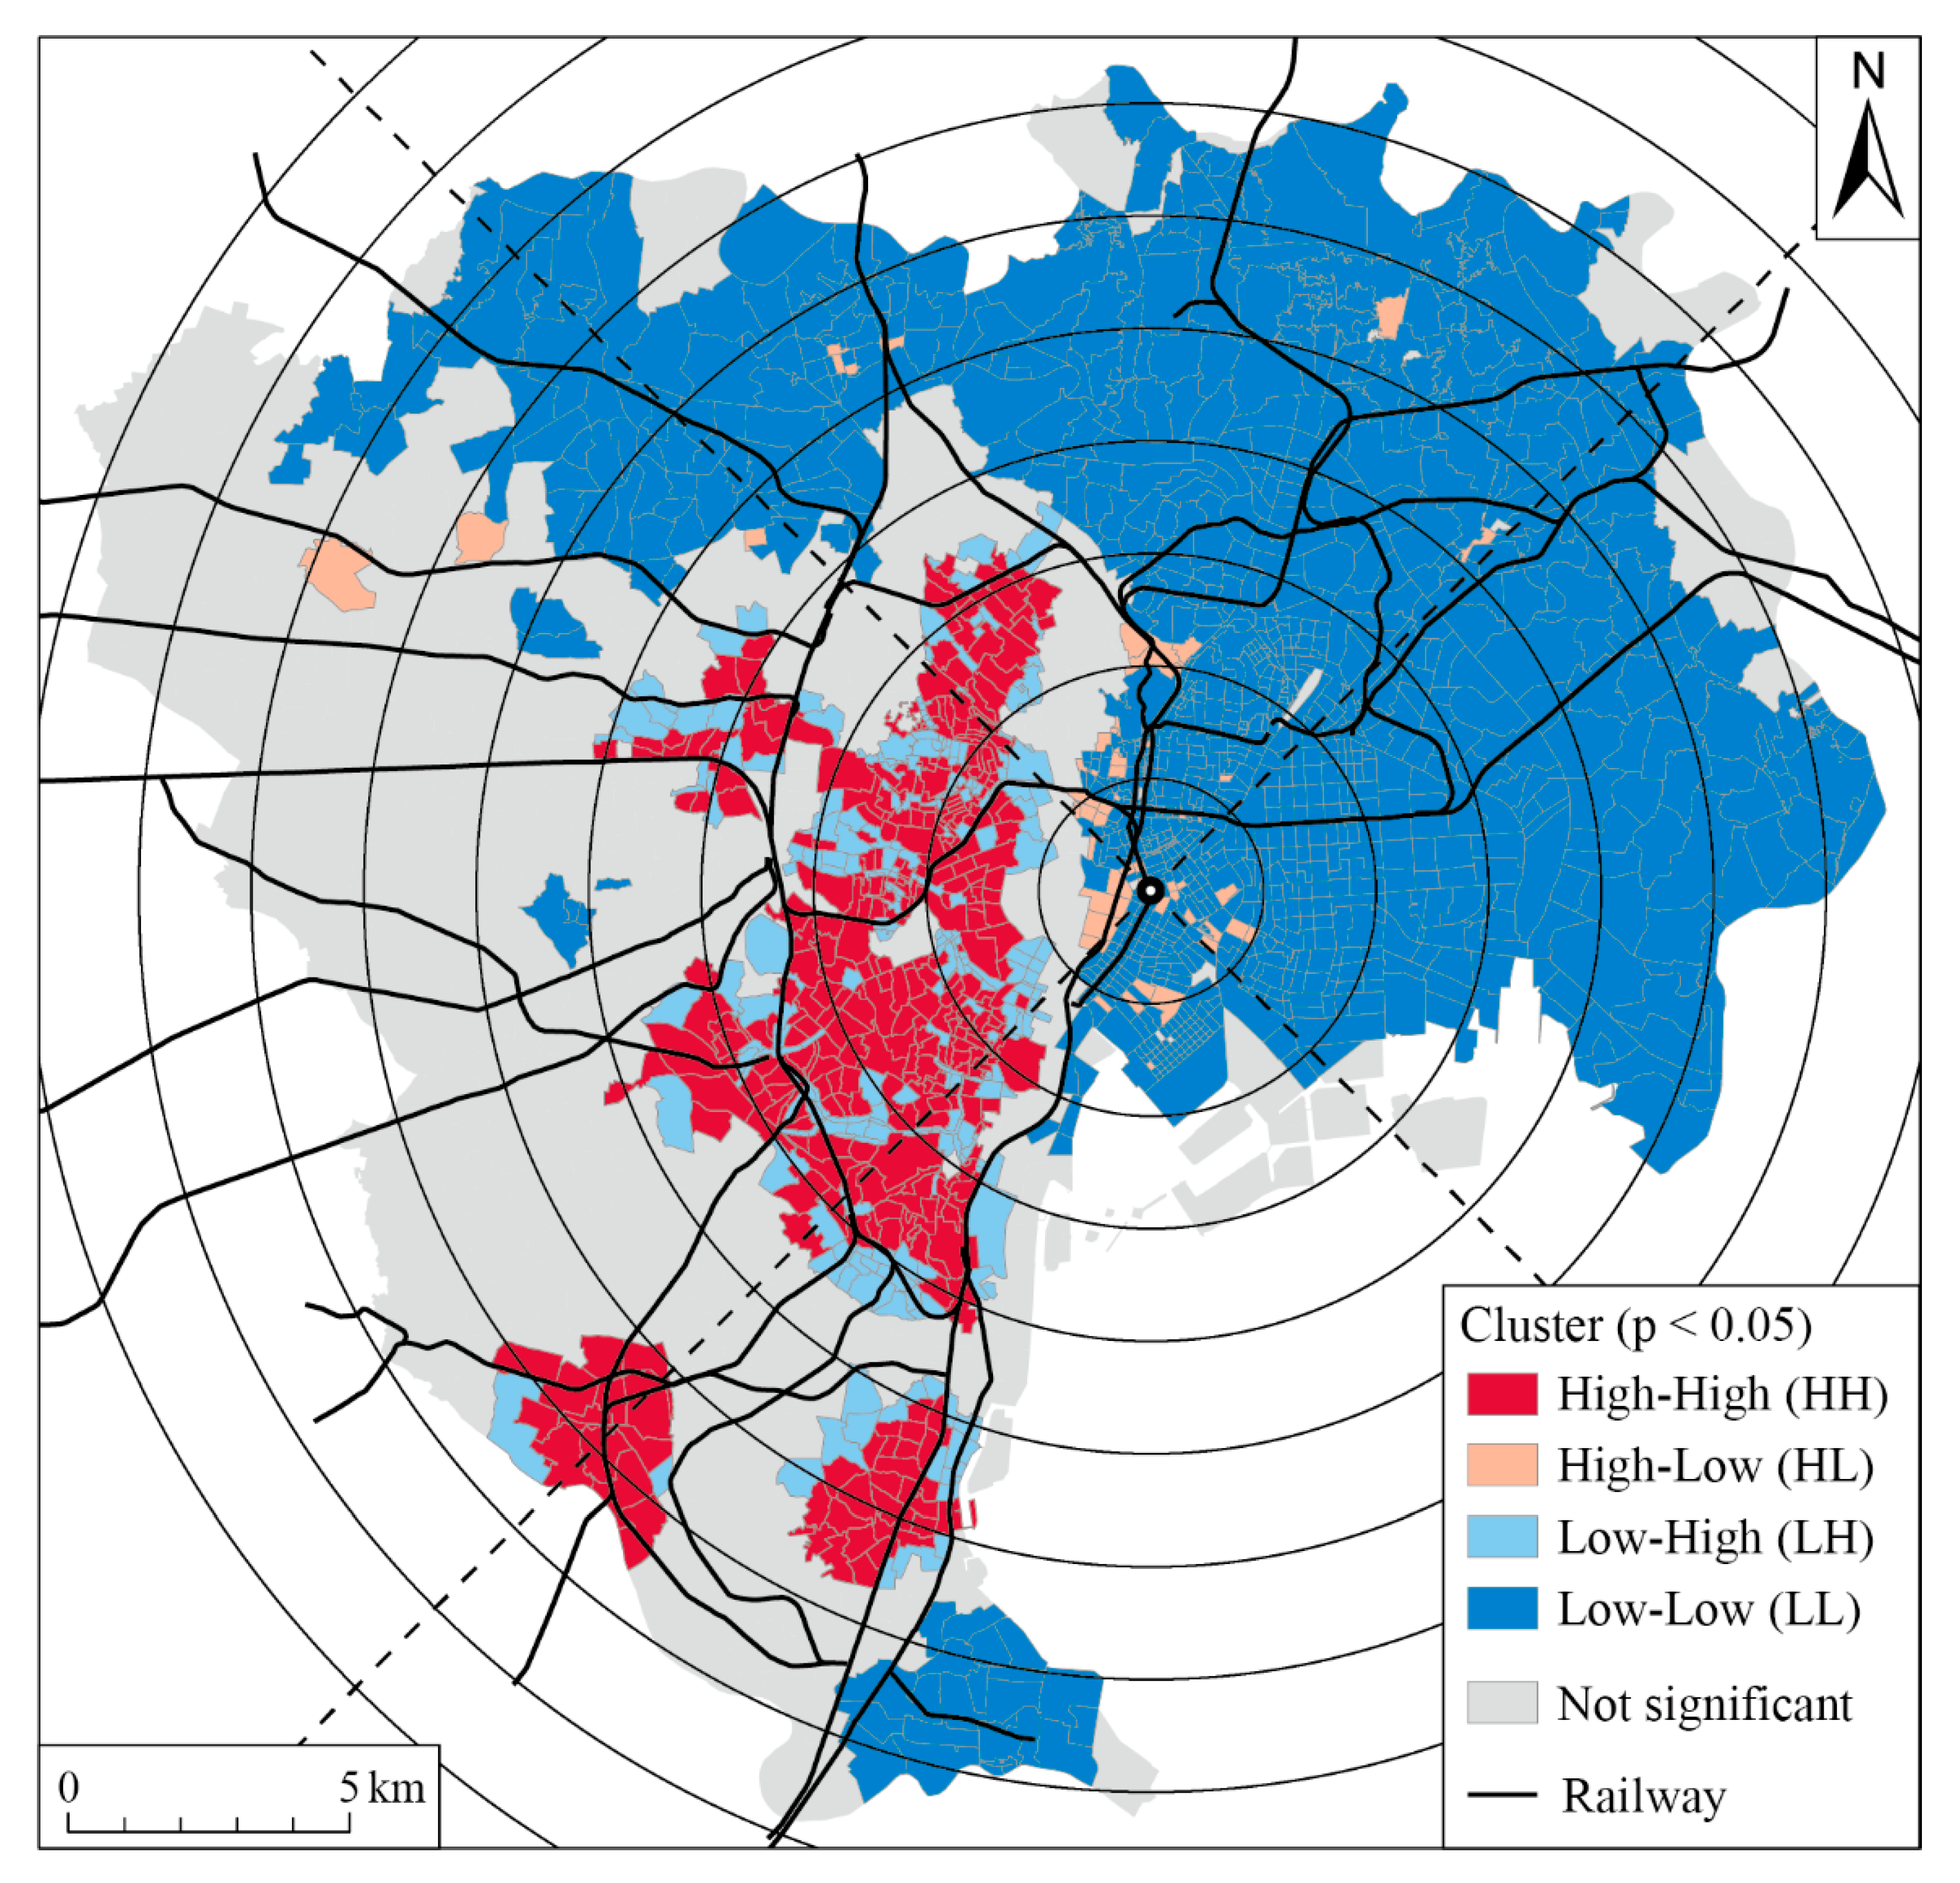
Figure 7 shows the areas with significant spatial autocorrelation for the number of TSCEE per 100 households in Osaka in 1937. In Osaka, the HH clusters are found in areas within two kilometers from the highest land price point, and in areas more than four kilometers away from the point in sector III. The HH cluster in the city center including the highest land price point is elliptical, but it is approximately centered on the highest land price point. The HH cluster in sector III is not spatially linked to the city center. The LL cluster area is also found in the western half of the two- to five-kilometer range. Although the HH cluster in sector III is mostly included in the urban area, it is at the edge of the urban area and adjacent to the suburb. Unlike Tokyo, the HH cluster in Osaka clearly exists in the city center including the highest land price point, and is extracted as an elliptical area centered on the highest land price point. However, a large group of HH clusters was also found in sector III adjacent to the suburb, and as in Tokyo, company employees and executives tended to concentrate in certain sectors.
3.3. Relationship Between Residences of the Company Employees and Executives and Distance from the City Center
Here, we examine the relationship between the distance from the highest land price point, the number of the TSCEE per 100 households, and the population density for each sector based on the highest land price point.
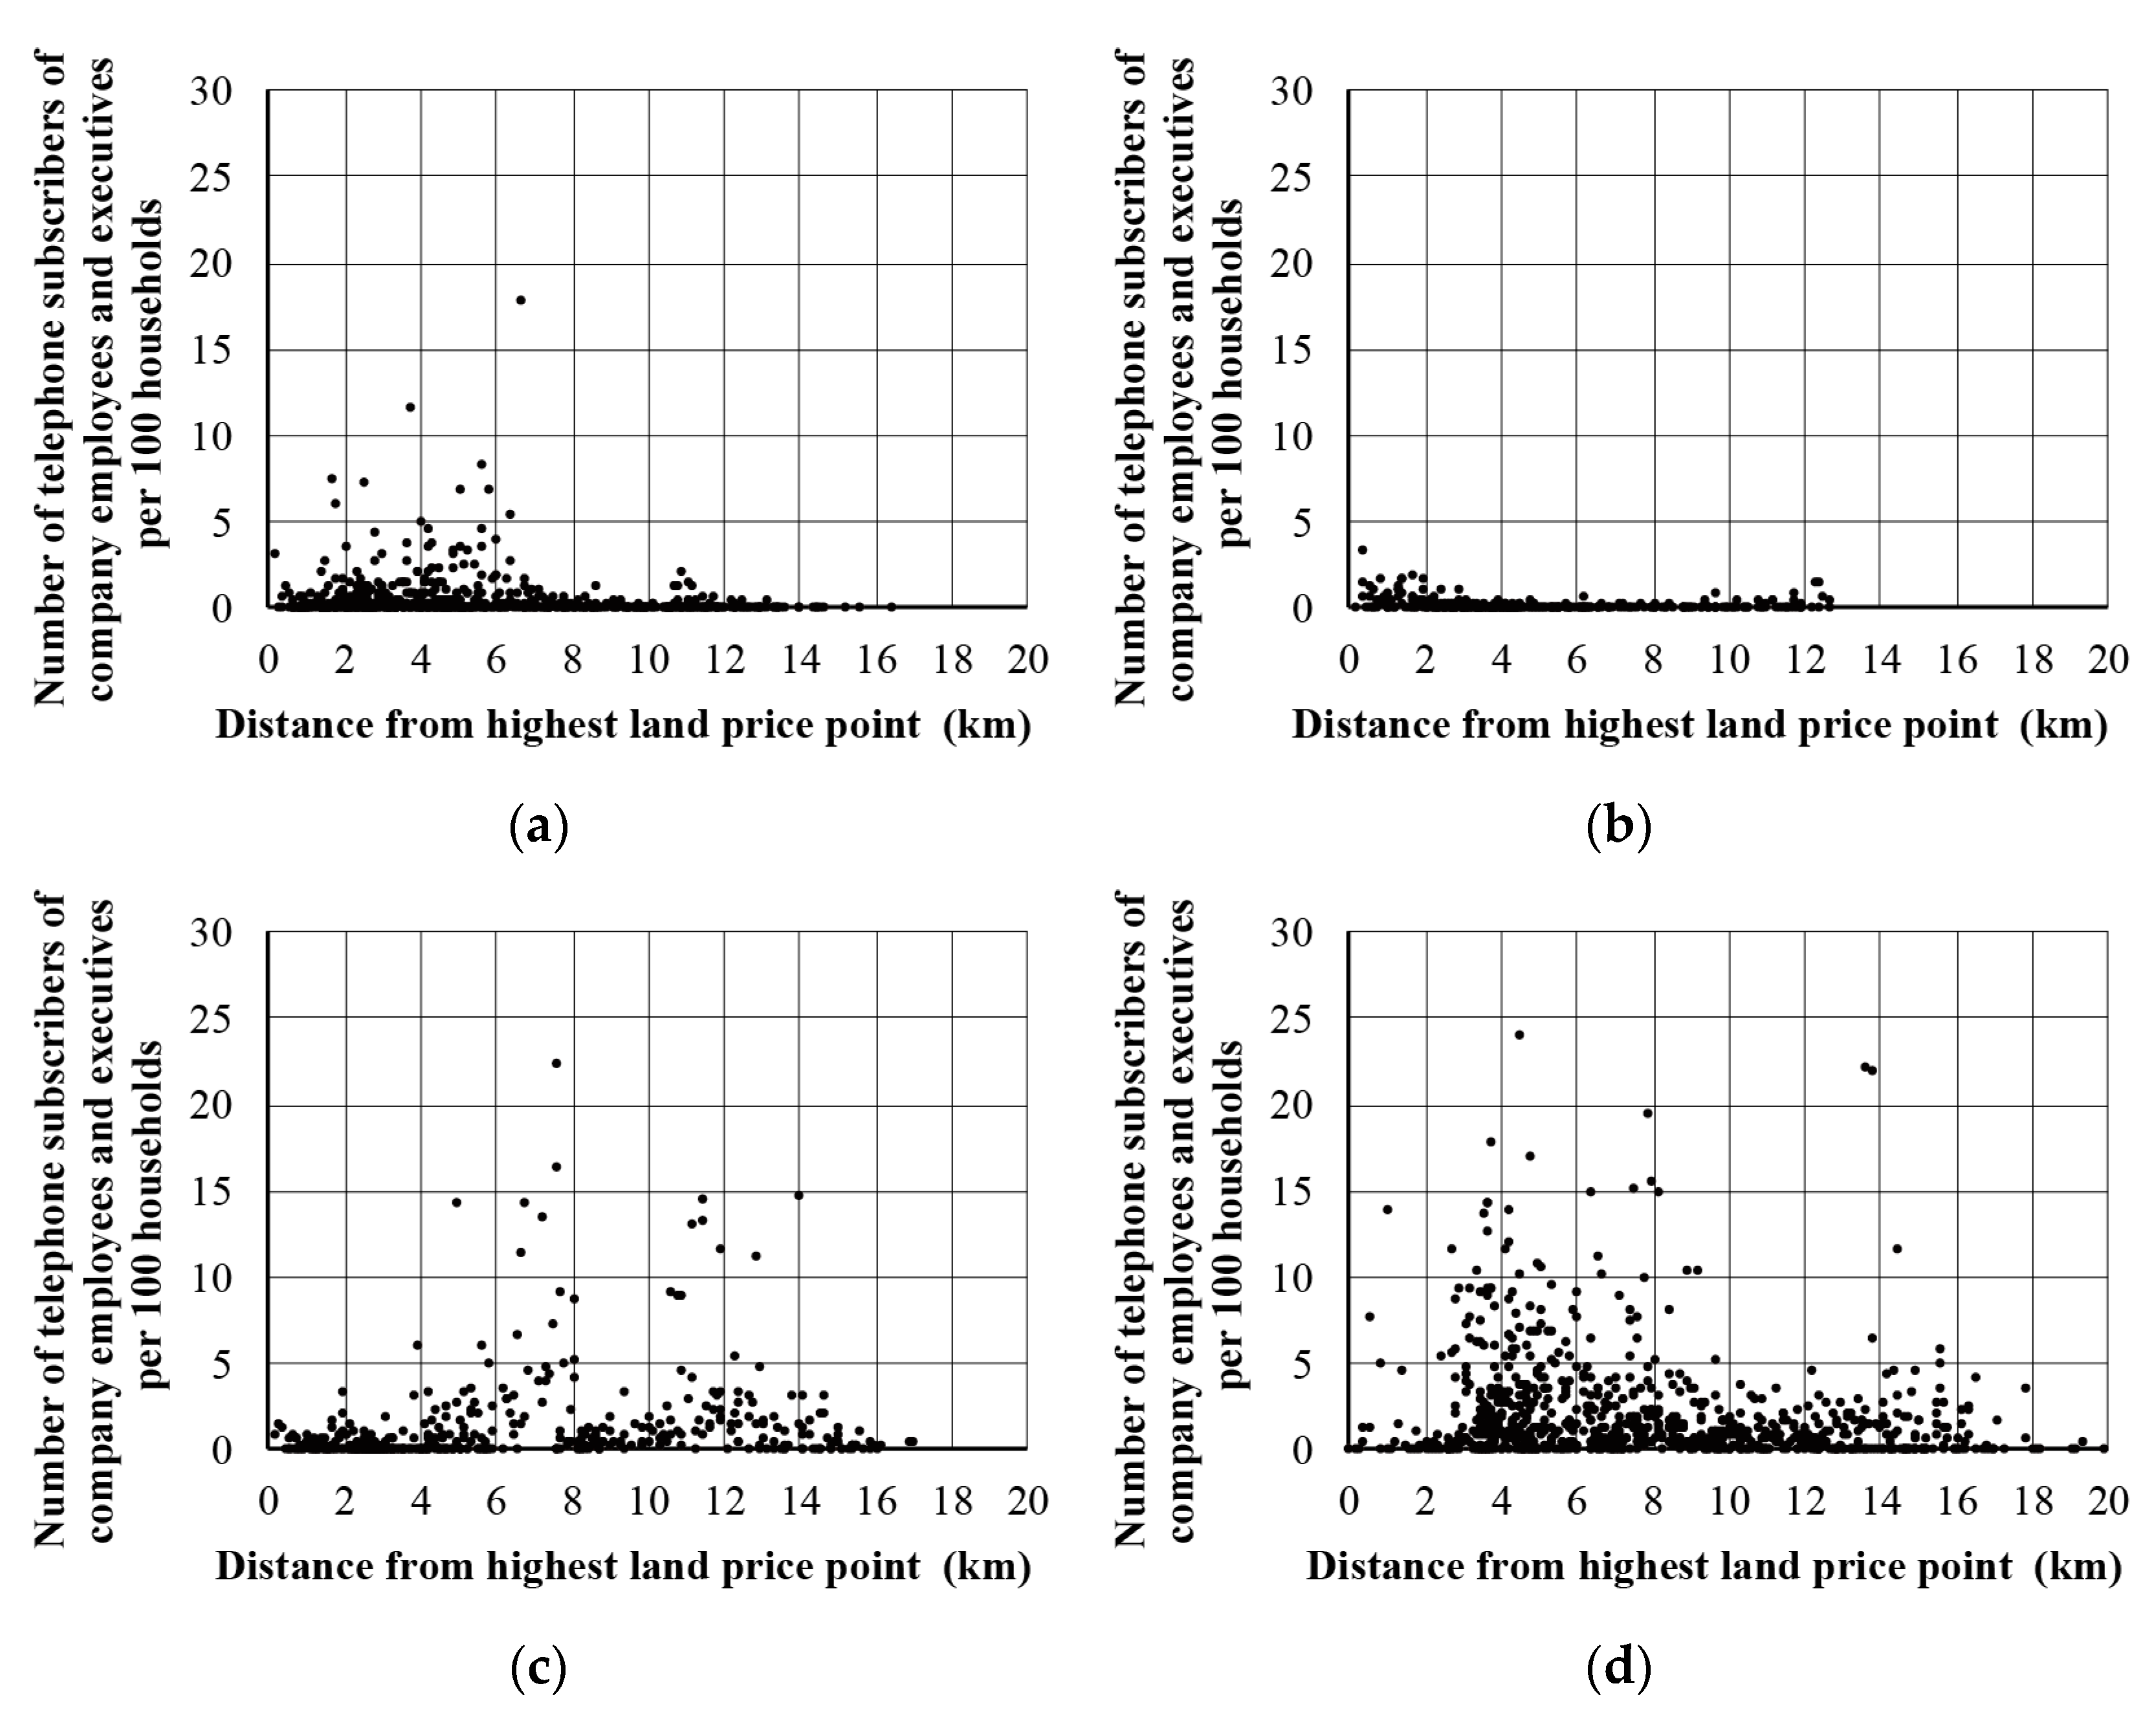
Figure 8 is a scatter plot of the distance in each sector in Tokyo in 1935 and the number of TSCEE per 100 households. In sector I, there are areas with a large number of TSCEE per 100 households within a range of about seven kilometers. In sector II, there are no areas where TSCEE per 100 households is more than five, and there are generally few. In sector III, there are areas with a large number of TSCEE per 100 households in the range of five to eight kilometers and 10 to 14 km. In sector IV, areas with a relatively large number of TSCEE per 100 households can be confirmed within 10 km. In addition, there are some districts with a large number of TSCEE per 100 households in the region of 13 to 15 km.
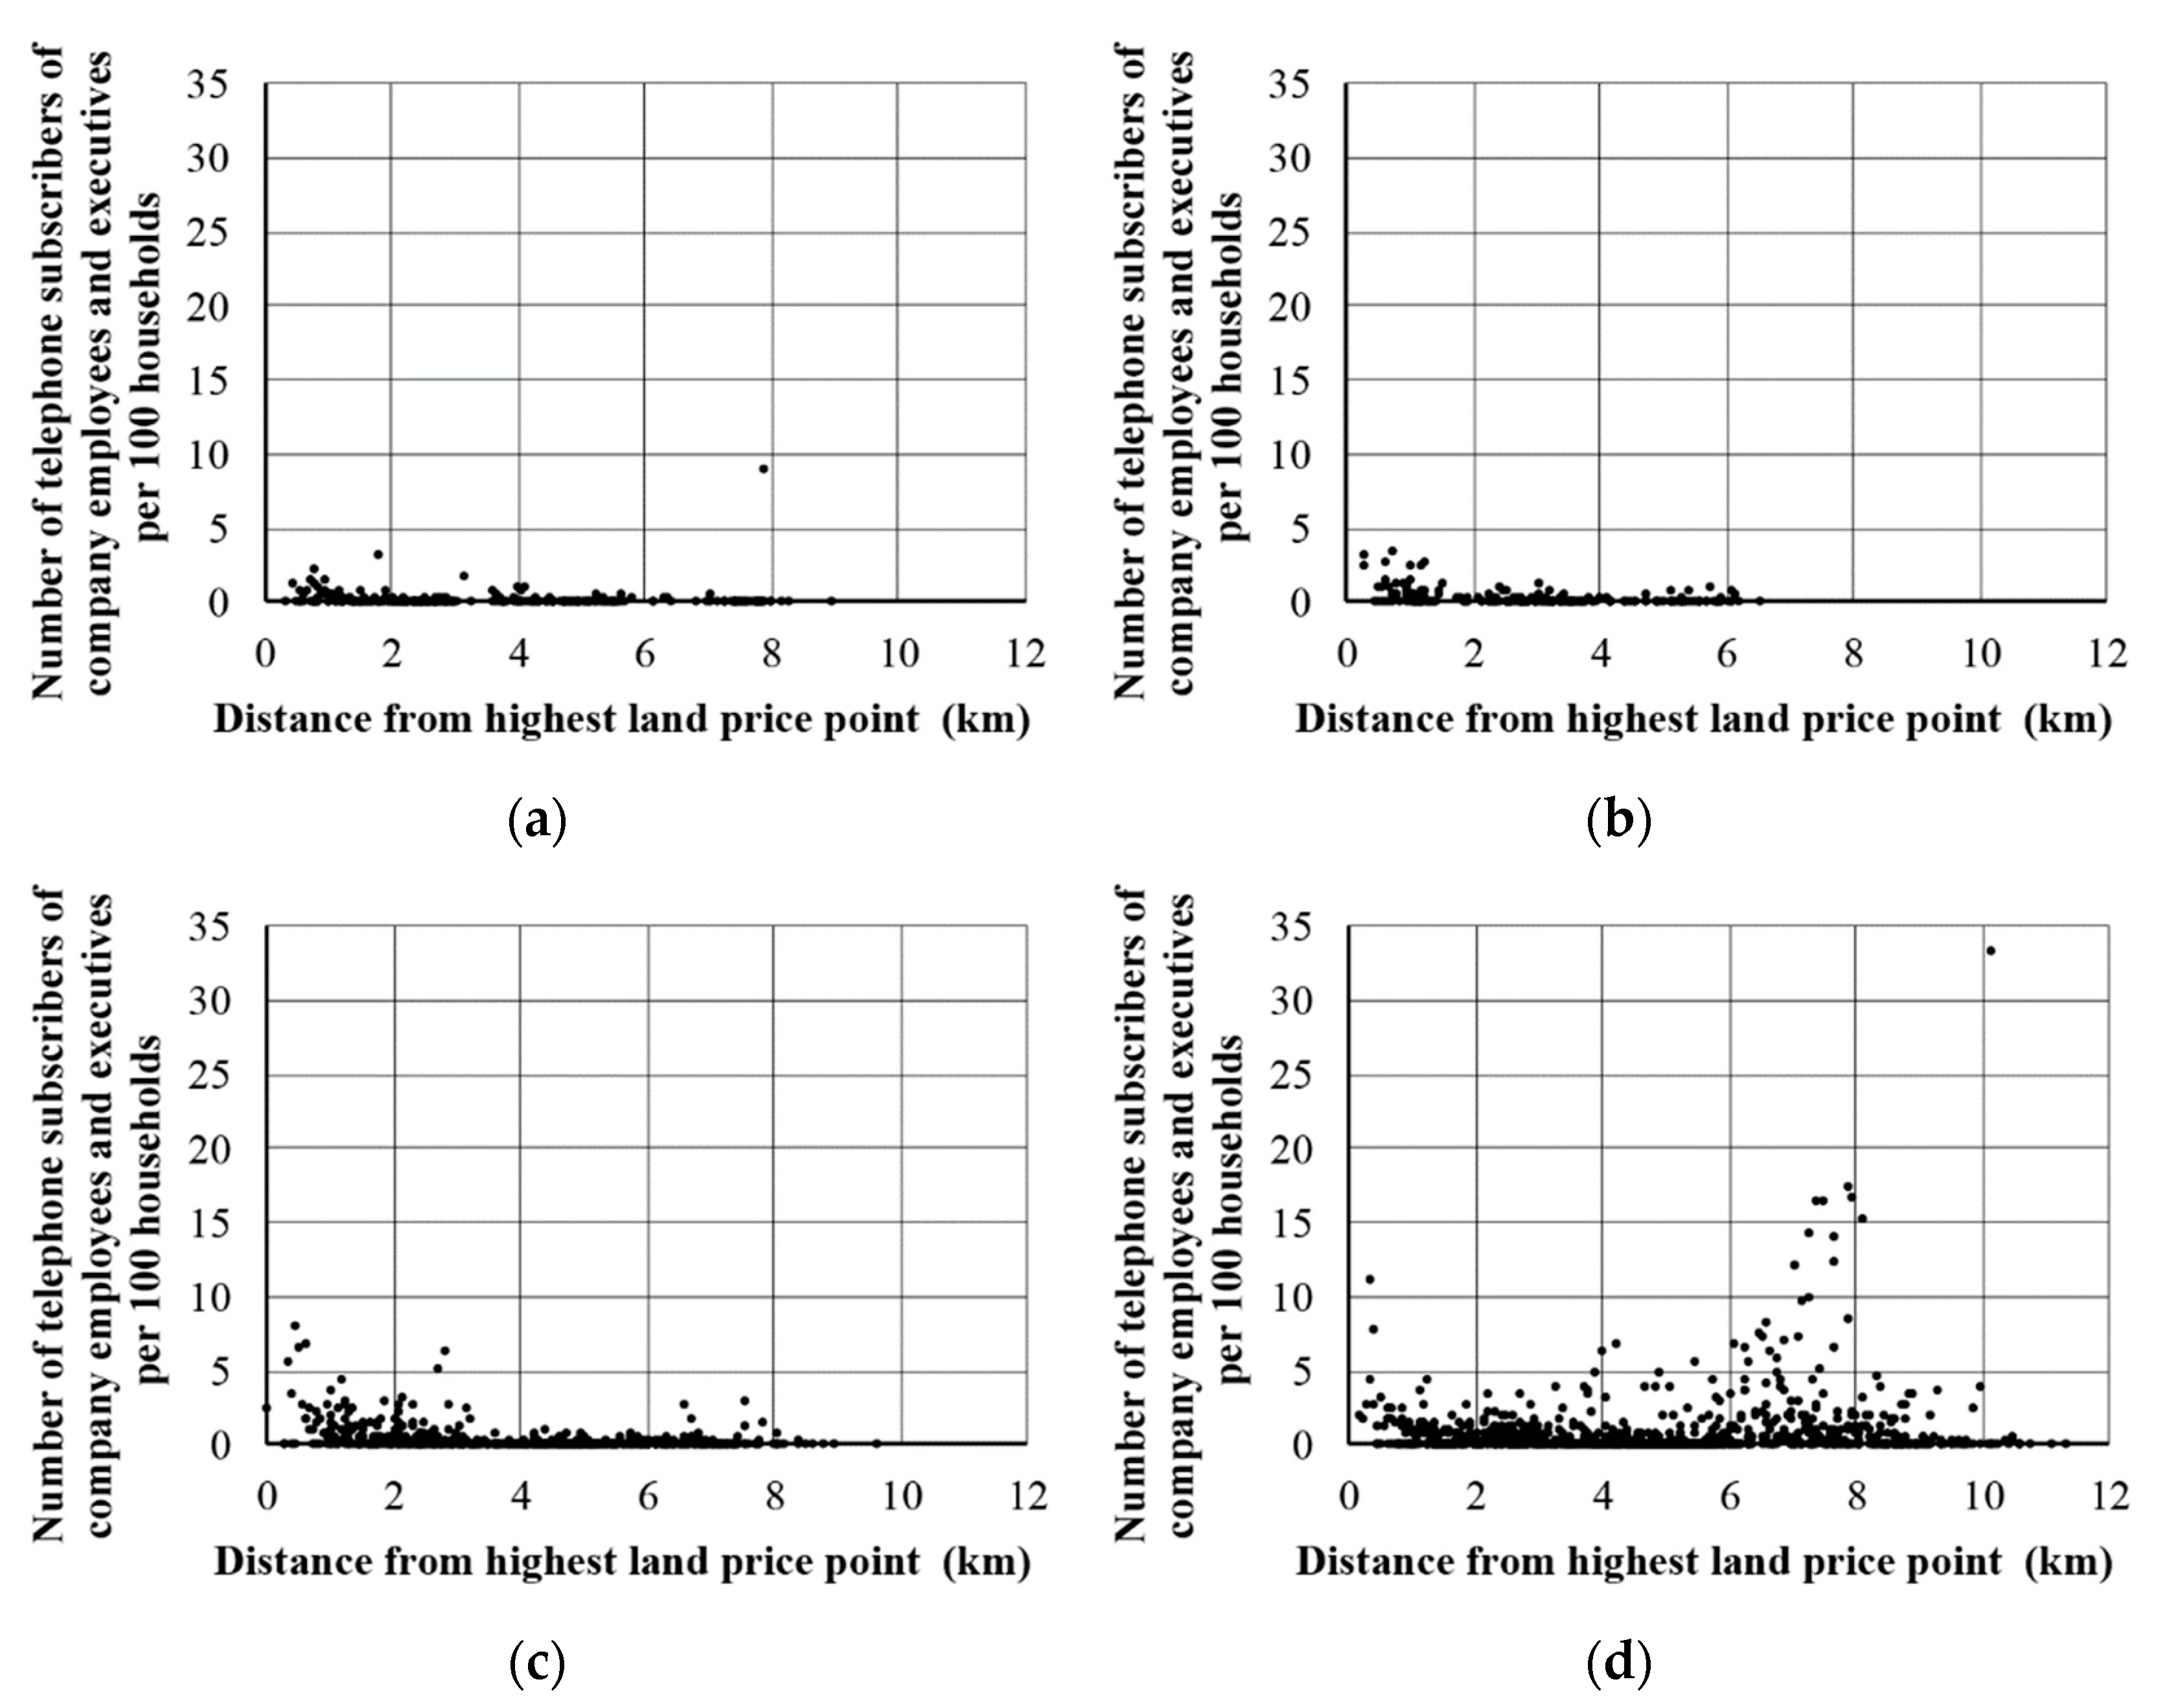
Figure 9 is a scatter plot of the distance from the highest land price point in each sector in Osaka in 1935 and the number of the TSCEE per 100 households in 1937. In sectors I and II, there are some districts with slightly more company employees and executives than sector I, but most are less than five company employees and executives per 100 households. In sectors I and II of the HH cluster around the highest land price point, the absolute number of TSCEE per 100 households is not so large. In sectors III and IV, in the range of about 500 m from the highest land price point, there are areas where TSCEE per 100 households is more than five, and there are many company employees and executives in sectors III and IV in the city center. In addition, it can be seen that the area with a large number of TSCEE per 100 households spreads between 6 to 8 km, especially in sector III. Many of these are included in the HH cluster, which had spread to sector III.
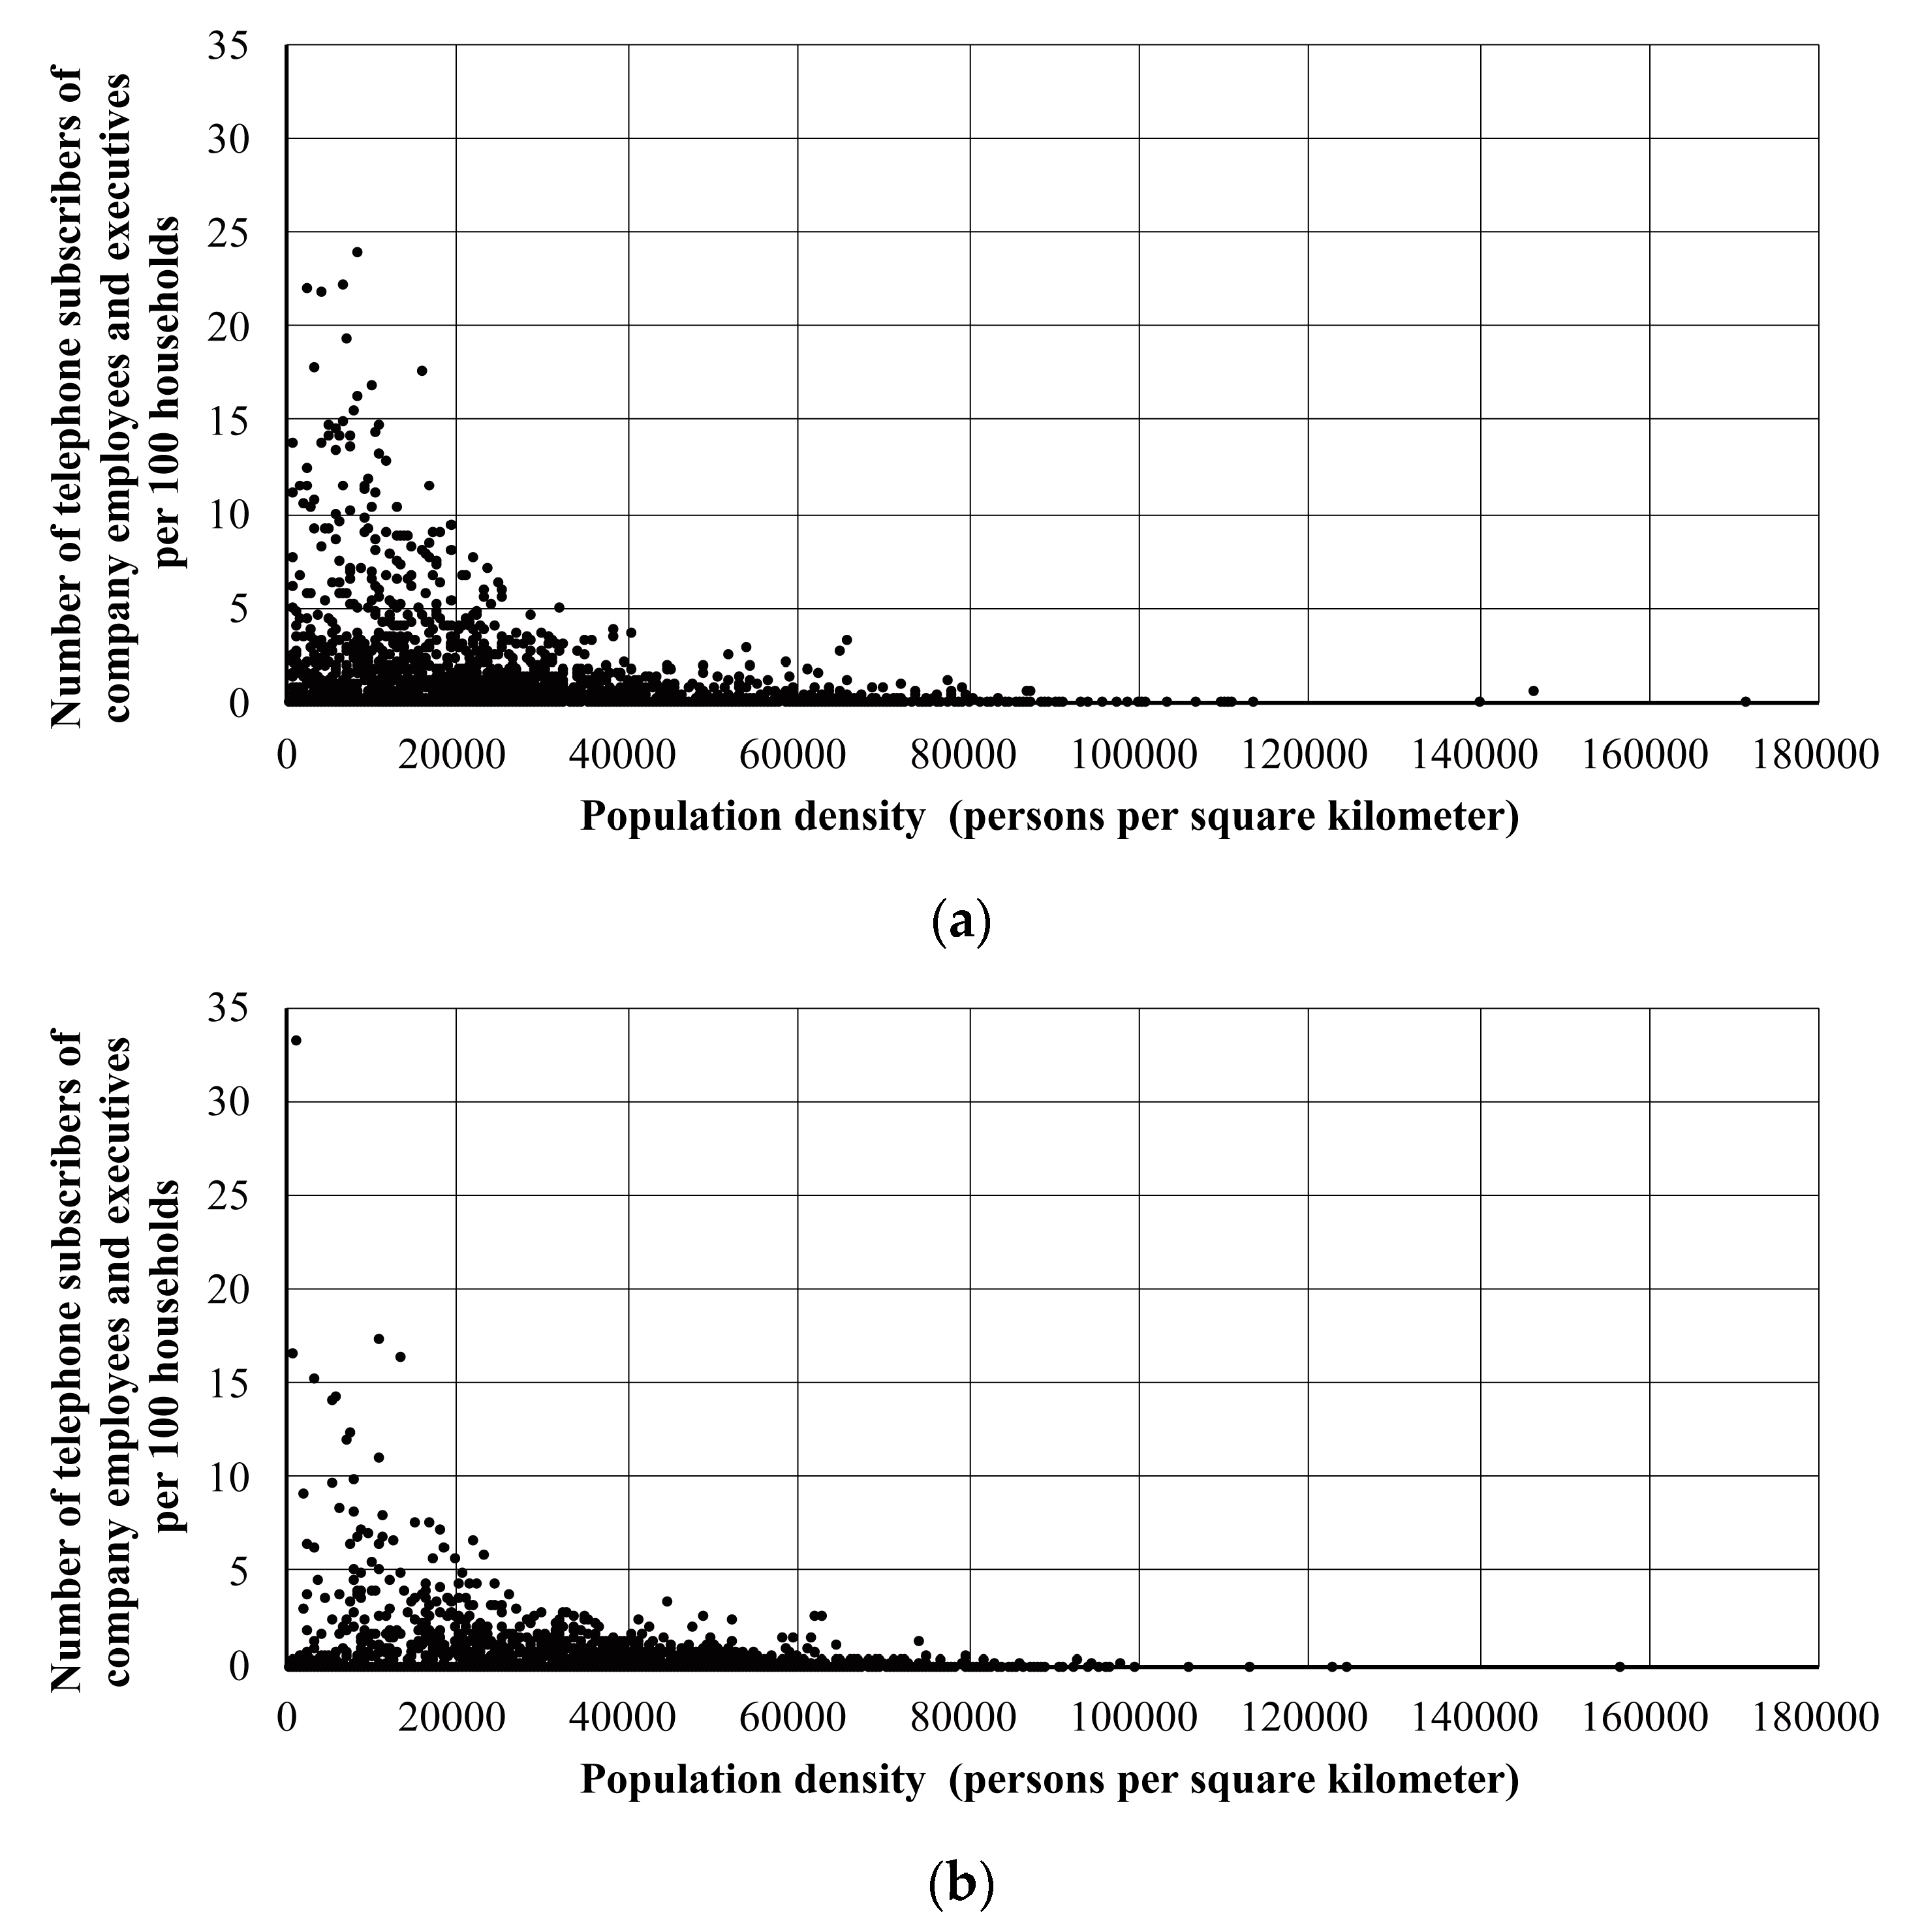
Based on the results of the analysis, areas with a large number of TSCEE per 100 households and areas where the HH clusters are spread are mainly urban areas with low population density, and suburban areas. Therefore, we created a scatter plot of the number of TSCEE per 100 households and population density (Figure 10). In both Tokyo and Osaka, it can be seen that the area with low population density has the largest number of TSCEE per 100 households. Furthermore, the districts where company employees and executives lived were mainly residential areas with low population density.
4. Discussion
Based on the results of the unemployment census, the distribution of the proportion of salaried workers in 1925 is different from Ueno’s analysis in Tokyo [13]. This is thought to be due to the difference between the definitions of public servants, professional workers, and salaried workers which were used in the different statistics. The public servants and professional workers in the population census include professionals such as lawyers but do not include clerical or technical workers employed by retail, wholesale, or manufacturing companies [27]. Thus, the salaried workers in the unemployment census in 1925 are likely to contain a greater number of white-collar workers than public servants and professional workers. From this, it can be said that while white-collar workers had advanced into the suburbs in Osaka by 1937, the same class of workers in 1925 Tokyo had not yet left the city center.
In the mid-1930s, company employees and executives who were white-collar workers of private companies in Tokyo and Osaka tended to live in areas with relatively low population density. Their distribution pattern suggests that many lived in the suburbs or urban fringe areas at that time. Also, considering the comparable data in the mid-1930s, there was a difference in the progress of suburbanization of company employees and executives between Tokyo and Osaka, in that Tokyo was more suburbanized. In Osaka, there were fewer company employees and executives in areas close to the city center than in the suburbs. However, it cannot be denied that a certain number of low-salaried company employees who did not have a telephone number lived in the city center. Although it is difficult to comprehensively analyze private company employee lists, by conducting the historical GIS analysis of local government employees, a more detailed comparative analysis about the progress of suburbanization is possible.
In this analysis, since there is no location information data for each street address available in both the cities, the analysis was performed based on the results of aggregation in small area units. However, even when tabulating by small area, there is a problem with MAUP. For example, small-area units tend to be spatially larger in the suburbs, and there will be some impact on this kind of analysis. In the development of the urban historical GIS database in the future, it will be important to maintain data on lot numbers that allow georeferencing address information. Such data development is progressing for Tokyo [22], but future development is desired for Osaka and other large cities in Japan.
5. Conclusions
In this study, we analyzed the distribution of white-collar workers in Tokyo and Osaka in the modernizing period from a historical GIS perspective using comparable data. The results obtained are summarized in the following two points.
- As long as comparative statistical data were used, there was a tendency for many white-collar workers in clerical and technical positions to reside in certain sectors in both Tokyo and Osaka in 1925.
- In Tokyo and Osaka in the mid-1930s, the white-collar workers in private companies tended to live more in the urban fringes and suburbs with relatively low population density. Compared to Osaka, Tokyo was relatively suburbanized with white-collar workers in private companies.
The company employees and executives who have telephones mainly targeted in this study are relatively upper-class people, and did not include company employees in non-managerial positions. The possibility of many more company employees still living in the city center cannot be denied, so an analysis based on more comparable directory materials would be necessary. In addition, in order to resolve MAUP, it is desirable to develop the historical GIS database for georeferencing at the lot number level.
Funding
This research was funded by JSPS KAKENHI Grant Number 16H01965.
Acknowledgments
We would like to thank Keiji Yano and the anonymous reviewers for comments on earlier version of this paper.
Conflicts of Interest
The authors declare no conflicts of interest.
References
- Gregory, I.N.; Healey, R.G. Historical GIS: Structuring, mapping and analysing geographies of the past. Prog. Hum Geog. 2007, 31, 638–653. [Google Scholar] [CrossRef]
- Gregory, I.N.; Geddes, A. (Eds.) Toward Spatial Humanities: Historical GIS and Spatial History; Indiana University Press: Bloomington, Indiana, 2014. [Google Scholar]
- McMaster, R.B.; Lindberg, M. The National Historical Geographic Information System (NHGIS). In Proceedings of the 21st International Cartographic Conference, Durban, South Africa, 10–16 August 2003; Volume 2003, pp. 821–828. [Google Scholar]
- Southall, H.; Přidal, P. Old Maps Online: Enabling global access to historical mapping. E-Perimetron 2012, 7, 73–81. [Google Scholar]
- Burgess, E.W. Residential Segregation in American Cities. Ann. Am. Acad. Pol. Soc. Sci. 1928, 140, 105–115. [Google Scholar] [CrossRef]
- Beveridge, A.A. Immigration, Ethnicity, and Race in Metropolitan New York, 1900–2000. In Past Time, Past Place: GIS for History; Knowles, A.K., Ed.; ESRI Press: Redlands, CA, USA, 2002; pp. 65–77. [Google Scholar]
- Gilliland, J.; Olson, S. Residential segregation in the industorializing city: A closer look. Urban Geogr. 2010, 31, 29–58. [Google Scholar] [CrossRef]
- Yano, K.; Nakaya, T.; Kawasumi, T.; Tanaka, S. (Eds.) Historical GIS of Kyoto; Nakanishiya: Kyoto, Japan, 2011. [Google Scholar]
- Statistics Bureau of Japan: Outline of the Grid Square Statistics, Compiled from the 2015 Population Census Results. Available online: https://www.stat.go.jp/english/data/mesh/pdf/h27outline.pdf (accessed on 9 August 2019).
- Kirimura, T. Building a database of the small area statistics about population of the six major cities in Japan: A first step to build a historical GIS database of modern Japanese cities. IPSJ Symp. Ser. 2011, 2011, 169–176. (In Japanese) [Google Scholar]
- Fujioka, H.; Okazaki, A. The emigration of the upper and middle classes of Tokyo to the suburban area between 1921 and 1931. Trans. AIJ. J. Archit. Plan. Environ. Eng. 1989, 405, 149–155. (In Japanese) [Google Scholar]
- Nozawa, S.; Lintonbon, J. Suburban taste. Home Cult. 2016, 13, 283–311. [Google Scholar] [CrossRef]
- Ueno, K. The residential structure of Tokyo in the 1910s (the Taisho Era). Geogr. Rev. Jpn. 1985, 58B, 24–48. [Google Scholar] [CrossRef]
- Mizuuchi, T. Formation and development of the inner city in Osaka during the Japanese industrialisation. Jpn. J. Hum. Geogr. 1982, 34, 385–409. [Google Scholar] [CrossRef]
- Statistics Bureau of Japan: What is a Densely Inhabited District? Available online: https://www.stat.go.jp/english/data/chiri/did/1-1.html (accessed on 9 August 2019).
- Tokyo City Office (Ed.) Tokyo Shi Toukei Nenpyo Dai 33 Kai (Statistical Yearbook of Tokyo City in 1935); Tokyo City Office: Tokyo, Japan, 1937; pp. 1–956. Available online: http://dl.ndl.go.jp/info:ndljp/pid/1710790 (accessed on 9 August 2019).
- Osaka City Office (Ed.) Osaka Shi Toukeisyo Dai 33 Kai (Statistical Yearbook of Osaka City in 1934); Osaka City Office: Osaka, Japan, 1936. Available online: http://dl.ndl.go.jp/info:ndljp/pid/1451466 (accessed on 9 August 2019).
- Cabinet Statistics Bureau (Ed.) Shitsugyou Toukei Chousa Houkoku Dai 1 Kan Kijutsu (Unemployment Census in 1925 Vol. 1); Cabinet Statistics Bureau: Tokyo, Japan, 1927; pp. 1–92. Available online: http://dl.ndl.go.jp/info:ndljp/pid/976223 (accessed on 28 June 2019).
- Nihon Syoko Tsushinsya (Ed.) Syokugyou-betsu Denwa Meibo Dai 25 Han (Classified Telephone Directory of 25th Edition in Tokyo); Nihon Syoko Tsushinsya: Tokyo, Japan, 1935; pp. 1–1144. Available online: http://dl.ndl.go.jp/info:ndljp/pid/1112313 (accessed on 28 June 2019).
- Osaka Central Telephone Office (Ed.) Osaka-Shi Oyobi Kinko Denwa Bango-Bo (Telephone Directory of Osaka City and Suburbs); Osaka Central Telephone Office: Osaka, Japan, 1937; pp. 1–874. [Google Scholar]
- Osaka City Office (Ed.) Osaka Shi Toukeisyo Dai 36 Kai (Statistical Yearbook of Osaka City in 1937); Osaka City Office: Osaka, Japan, 1939. Available online: http://dl.ndl.go.jp/info:ndljp/pid/1451614 (accessed on 9 August 2019).
- Laboratory of Geographical Information Sciences, Department of Geography, Tokyo Metropolitan University, Modern Tokyo Geocoding System. Available online: http://www.bokutachi.org/geocoding/index.php (accessed on 9 August 2019).
- Openshaw, S. The Modifiable Areal Unit Problem; CATMOG 38; Geo Books: Norwich, UK, 1984; pp. 1–41. [Google Scholar]
- Anselin, L. Local Indicators of Spatial Association—LISA. Geogr. Anal. 1995, 27, 93–115. [Google Scholar] [CrossRef]
- GeoDa. Available online: https://geodacenter.github.io/ (accessed on 9 August 2019).
- Cabinet Statistics Bureau (Ed.) Shitsugyou Toukei Chousa Sokuhou Taisho 14 Nen (Quick Bulletin of Result of 1925 Unemployment Census); Cabinet Statistics Bureau: Tokyo, Japan, 1925; pp. 1–11. Available online: http://dl.ndl.go.jp/info:ndljp/pid/976195 (accessed on 9 August 2019).
- Cabinet Statistics Bureau (Ed.) Kokusei Chosa Syokugyo Meikan Taisho 9 Nen (List of Occupation in 1920 Population Census); Cabinet Statistics Bureau: Tokyo, Japan, 1931; pp. 1–969. Available online: http://dl.ndl.go.jp/info:ndljp/pid/1464800 (accessed on 9 August 2019).
Figure 1.
Population density based on the 1935 Population Census, the highest land price point and concentric circles in two-kilometer intervals from the highest land price point in Tokyo in 1935.
Figure 1.
Population density based on the 1935 Population Census, the highest land price point and concentric circles in two-kilometer intervals from the highest land price point in Tokyo in 1935.

Figure 2.
Population density based on the 1935 Population Census, the highest land price point and concentric circles in two-kilometer intervals from the highest land price point in Osaka in 1935.
Figure 2.
Population density based on the 1935 Population Census, the highest land price point and concentric circles in two-kilometer intervals from the highest land price point in Osaka in 1935.

Figure 3.
A part of the telephone directory, “Osaka-shi Oyobi Kinko Denwa Bango-bo (Telephone Directory of Osaka City and Suburbs)”.
Figure 3.
A part of the telephone directory, “Osaka-shi Oyobi Kinko Denwa Bango-bo (Telephone Directory of Osaka City and Suburbs)”.

Figure 4.
The distribution of the ratio of the number of salaried workers to the total number of workers in Tokyo in 1925 based on the 1925 Unemployment Census.
Figure 4.
The distribution of the ratio of the number of salaried workers to the total number of workers in Tokyo in 1925 based on the 1925 Unemployment Census.

Figure 5.
The distribution of the ratio of the number of salaried workers to the total number of workers in Osaka in 1925 based on the 1925 Unemployment Census.
Figure 5.
The distribution of the ratio of the number of salaried workers to the total number of workers in Osaka in 1925 based on the 1925 Unemployment Census.

Figure 6.
The distribution of significant HH/HL/LH/LL clusters of the number of telephone subscribers of company employees and executives (TSCEE) per 100 households in 1935 in Tokyo based on Local Moran’s I statistics.
Figure 6.
The distribution of significant HH/HL/LH/LL clusters of the number of telephone subscribers of company employees and executives (TSCEE) per 100 households in 1935 in Tokyo based on Local Moran’s I statistics.

Figure 7.
The distribution of significant HH/HL/LH/LL clusters of the number of the telephone subscribers of company employees and executives (TSCEE) per 100 households in 1937 in Osaka, based on Local Moran’s I statistics.
Figure 7.
The distribution of significant HH/HL/LH/LL clusters of the number of the telephone subscribers of company employees and executives (TSCEE) per 100 households in 1937 in Osaka, based on Local Moran’s I statistics.

Figure 8.
Scatter plots of the distance from the highest land price point and the number of the telephone subscribers of company employees and executives (TSCEE) per 100 households in 1935 in Tokyo. (a) Sector I; (b) Sector II; (c) Sector III; (d) Sector IV.
Figure 8.
Scatter plots of the distance from the highest land price point and the number of the telephone subscribers of company employees and executives (TSCEE) per 100 households in 1935 in Tokyo. (a) Sector I; (b) Sector II; (c) Sector III; (d) Sector IV.

Figure 9.
Scatter plots of the distance from the highest land price point and the number of TSCEE per 100 households in 1937 in Osaka. (a) Sector I; (b) Sector II; (c) Sector III; (d) Sector IV.
Figure 9.
Scatter plots of the distance from the highest land price point and the number of TSCEE per 100 households in 1937 in Osaka. (a) Sector I; (b) Sector II; (c) Sector III; (d) Sector IV.

Figure 10.
Scatter plot of the number of TSCEE per 100 households and population density per kilometer. (a) Tokyo in 1935; (b) Osaka in 1937 (population density in 1935).
Figure 10.
Scatter plot of the number of TSCEE per 100 households and population density per kilometer. (a) Tokyo in 1935; (b) Osaka in 1937 (population density in 1935).

© 2019 by the author. Licensee MDPI, Basel, Switzerland. This article is an open access article distributed under the terms and conditions of the Creative Commons Attribution (CC BY) license (http://creativecommons.org/licenses/by/4.0/).
Share and Cite
MDPI and ACS Style
Kirimura, T. An Examination of the Distribution of White-Collar Worker Residences in Tokyo and Osaka during the Modernizing Period. ISPRS Int. J. Geo-Inf. 2019, 8, 375. https://0-doi-org.brum.beds.ac.uk/10.3390/ijgi8090375
AMA Style
Kirimura T. An Examination of the Distribution of White-Collar Worker Residences in Tokyo and Osaka during the Modernizing Period. ISPRS International Journal of Geo-Information. 2019; 8(9):375. https://0-doi-org.brum.beds.ac.uk/10.3390/ijgi8090375
Chicago/Turabian StyleKirimura, Takashi. 2019. "An Examination of the Distribution of White-Collar Worker Residences in Tokyo and Osaka during the Modernizing Period" ISPRS International Journal of Geo-Information 8, no. 9: 375. https://0-doi-org.brum.beds.ac.uk/10.3390/ijgi8090375
Note that from the first issue of 2016, this journal uses article numbers instead of page numbers. See further details here.