1. Introduction
1.1. Historical Geography of Early-Modern Rural Landscape
Human–ecosystem relationships in the discipline of historical geography can be better understood through research on human modifications of the natural environment [
1]. In the early-modern era in Japan, which ranged from the early 17th to the late 19th century, the gross area of arable land increased by 36% [
2]. This explosive development era is called “shinden” (new field) and “kaihotsu” (development). The term “shinden” refers both to newly cultivated land and new settlements, including residential areas and planted woodland areas. Modern historical geographers were interested in the internal structure of shinden villages, such as zoning and land use, before scholars from other disciplines were. In a typical shinden village layout, the houses were lined up with roads and waterways. There were vast fields behind these houses, and woodlands spread behind the fields. Prior studies have shown that the shinden landscape has several similarities with the Reihendorf (German linear settlements) [
3] and the seigneurial landscapes in New France in North America [
4]. As a result of the dramatic changes in the landscape caused by the spread of shinden villages, shinden is considered one of the most important features of Japan’s early-modern historical geography [
5].
One of the essential characteristics of the shinden layout is that, in many cases, woodlands formed around the farmers’ residences and on the outer edge of the village. Yazawa [
6] noted that there is a close link between the direction in which the trees are densely distributed and the direction of the prevailing wind in the villages on the Musashino upland. Ito [
7,
8] suggested that older woodlands have a mixture of deciduous and evergreen trees that can control wind speed and temperatures in summer and winter.
Historical evidence indicates the need for protection from the wind. In a chorography from 1794, Furukawa [
9] mentioned that the strong wind in the Musashino upland caused farmers to struggle with the daily activities of cultivation. An 18th century map of Ogawa village in the Musashino upland [
10] shows that pine trees were planted around the village, obstructing the flow of wind. In 1875, the farmers’ union in the Musashino upland petitioned for permission to cut down approximately 96,793 m
2 of chestnut woodland and its windbreak trees for agricultural land development [
11]. In the Kichijoji village, one of the oldest shinden villages in the Musashino upland, a group from the Shinto sect that was dedicated to the worship of Mount Haruna, which is located about 100 km north-westward. Until World War II, four villagers from this group, known as the “harunakou,” were dispatched to Mt. Haruna every year to pick up an amulet believed to be capable of breaking storms [
11]. Harunakou is a widely spread religious Shinto sect in the Kanto region.
Several quantitative studies have also been conducted on the wind-reducing effect of woodland in traditional villages. Kikuchi [
12], for example, took measurements during the day and night to quantitatively estimate the differences in wind speed and temperature controlled by the woodland on the Sendai plain in the Tohoku region. Hashida [
13] conducted experiments in the Hoya neighborhood in the Musashino upland and identified an apparent wind-reducing effect during the summer.
However, because these studies are based on observation data, it is not possible to analyze the precise wind conditions that existed in early-modern times. Therefore, in this study, an analysis using computational fluid dynamics (CFD) was applied to measure the windbreak effect caused by the woodlands distributed throughout historic shinden villages.
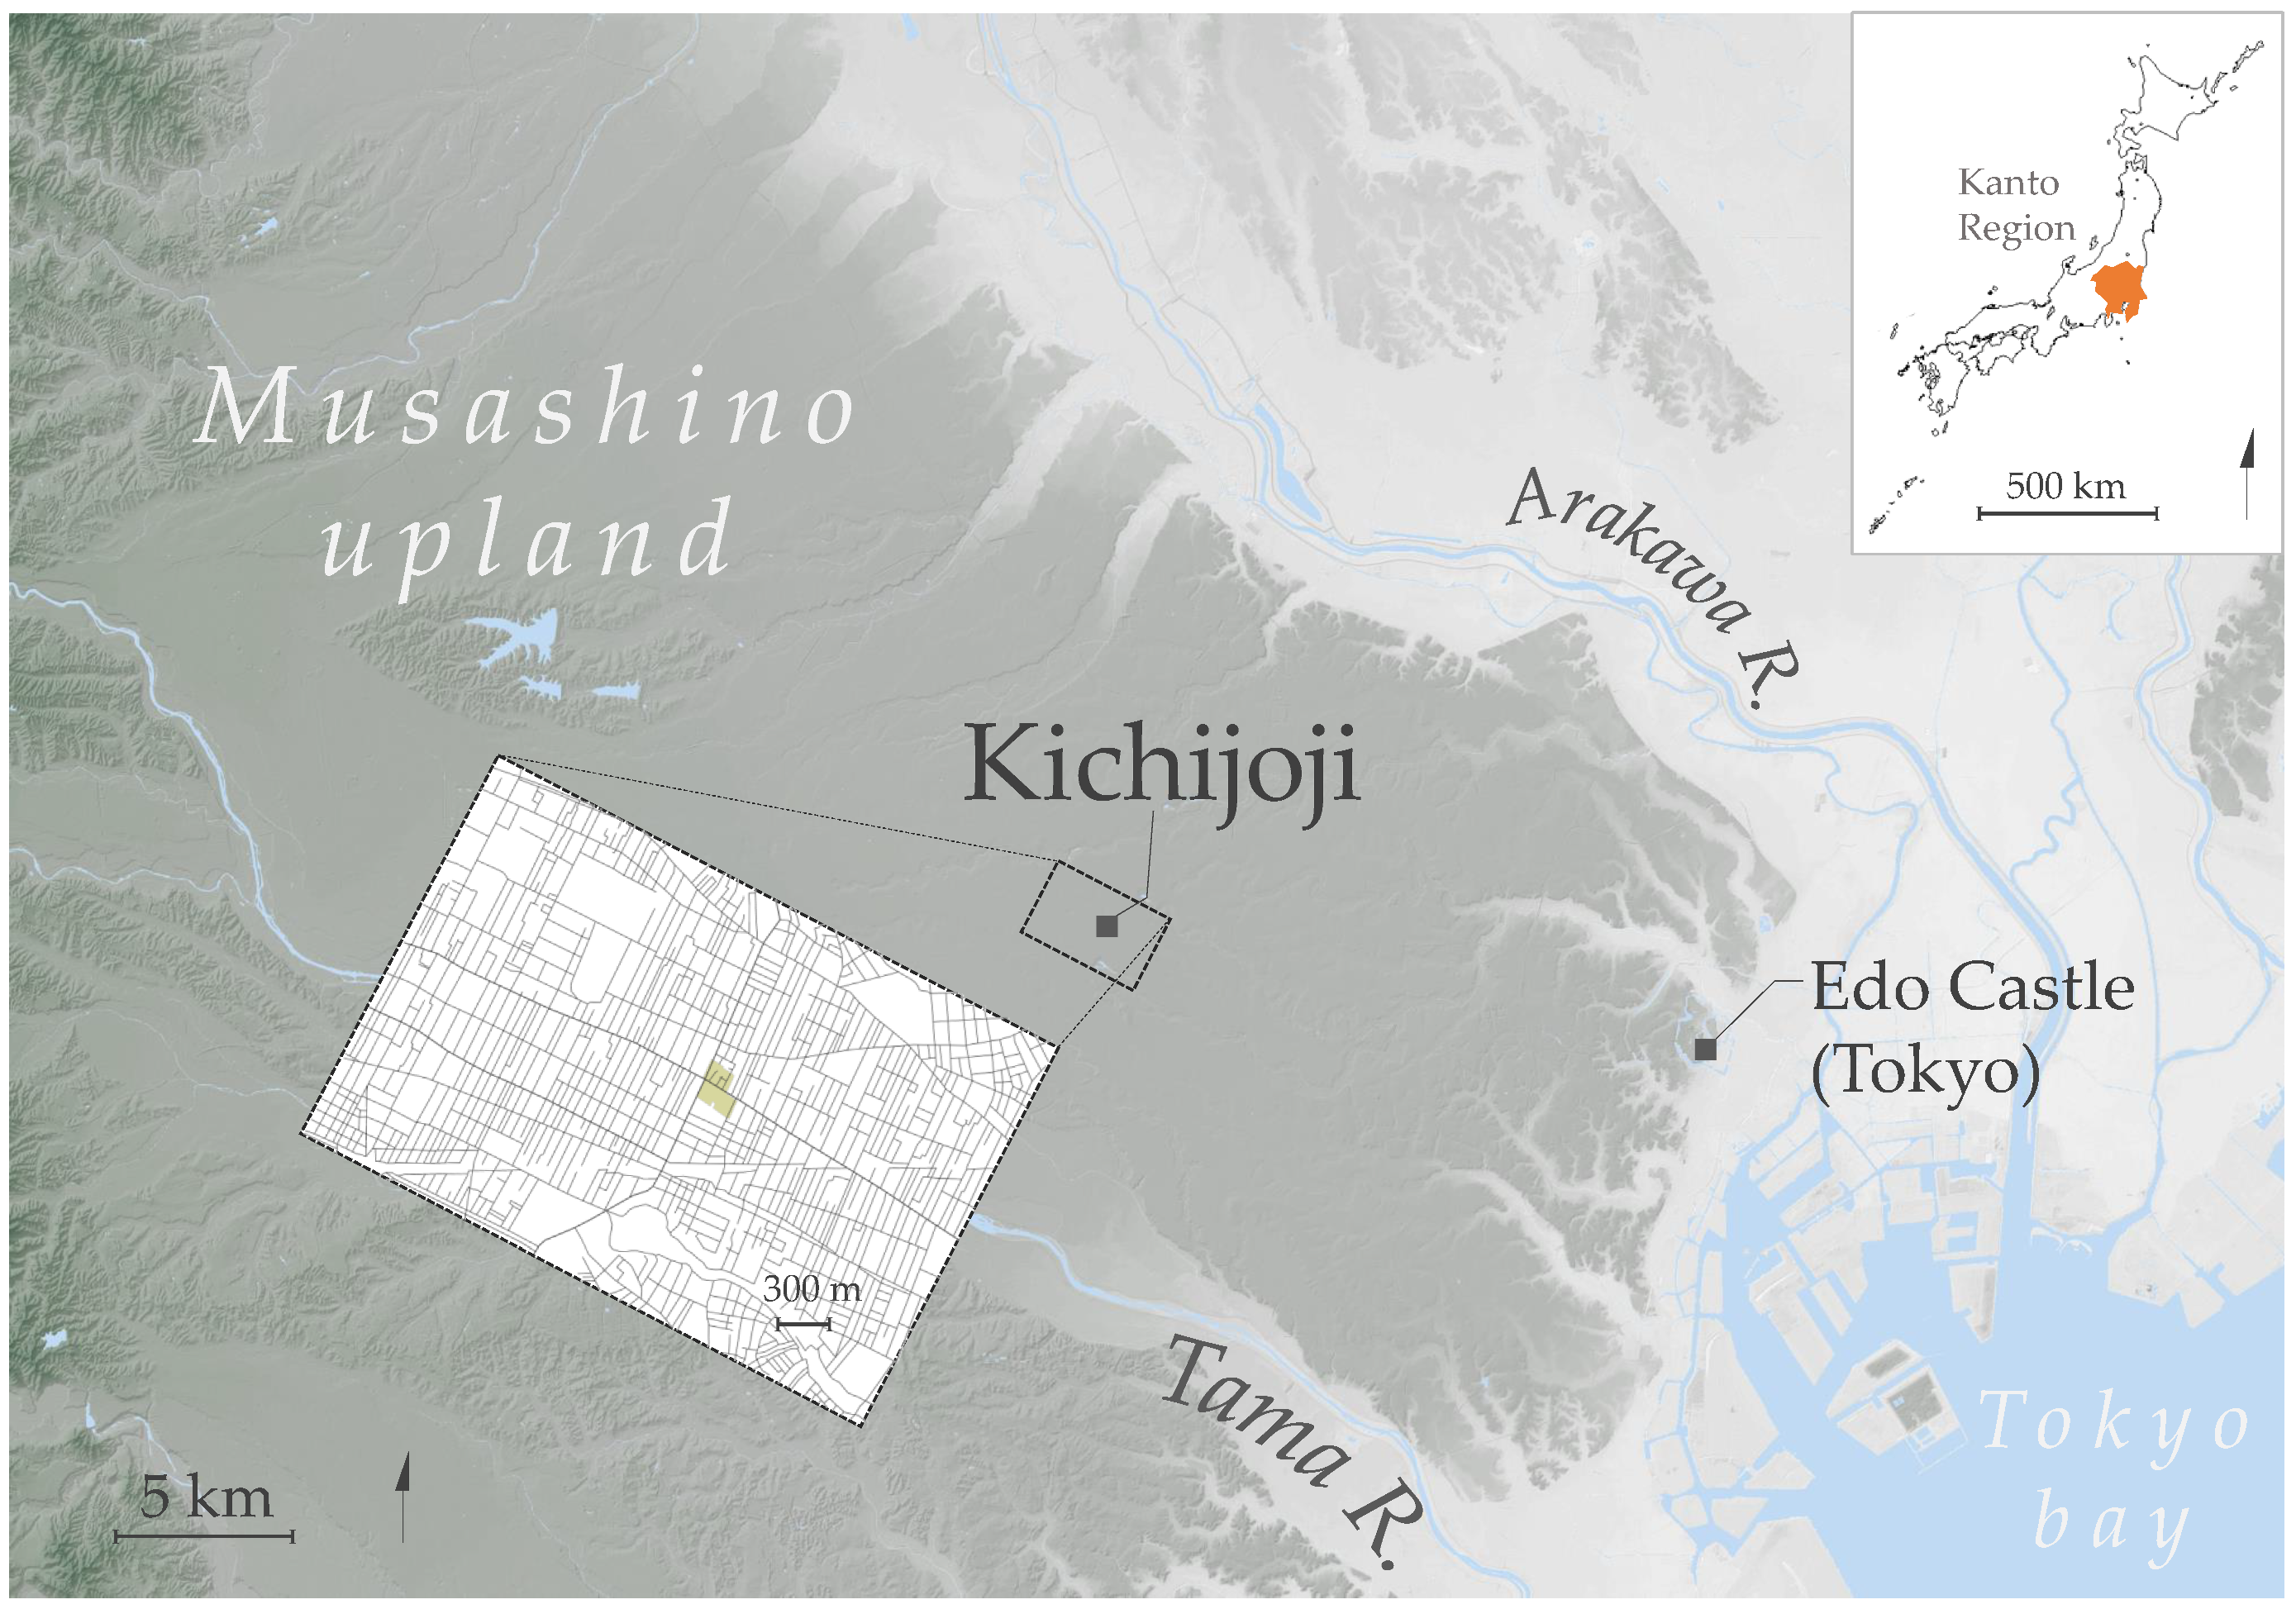
1.2. Study Area
Typical shinden villages are located in the Musashino upland in the Kanto region (
Figure 1). The area of the Musashino upland is approximately 846 km
2, stretching approximately 43 km from east to west and 20 km from north to south, with average altitude of about 50–60 m at its center. It is also the broadest fluvial terrace in Japan [
14]. Until the new field development boom, the entire area was uncultivated except for a few villages along with streams [
15]. From 1645 to 1841, 231 shinden villages were established as a new municipality in the Musashino upland [
16]. Highways and aqueducts played roles in their development [
3,
17].
This study focuses on Kichijoji village in Musashi Province (which today comprises Tokyo Metropolis, most of Saitama Prefecture, and part of Kanagawa Prefecture). Kichijoji village was surveyed for the first time in July 1664 by the Tokugawa shogunate and was officially established as an administrative village. According to the first land survey, there were 64 households, including three temples and one shrine, in Kichijoji village [
18]. The village was named Kichijoji after the temple of Kichijoji in Edo (the current Tokyo) after the great fire of Meireki in 1657, which burned down the temple and its town. The temple itself was rebuilt near its original location soon after. However, the Tokugawa shogunate decided to leave some of the area, including part of the town, in ruins as an open space to avoid the spread of fire in the future. Moreover, the shogunate gave away an open field to the people who had initially lived in the Kichijoji temple town. Consequently, unlike most villages in Japan, the layout of Kichijoji village was well-planned.
The area of the former Kichijoji village is now a commercial area and a commuters’ town in Musashino City in Tokyo. According to the latest statistical data on registered residents, there were 39,581 households with 73,037 residents in September 2018 [
19].
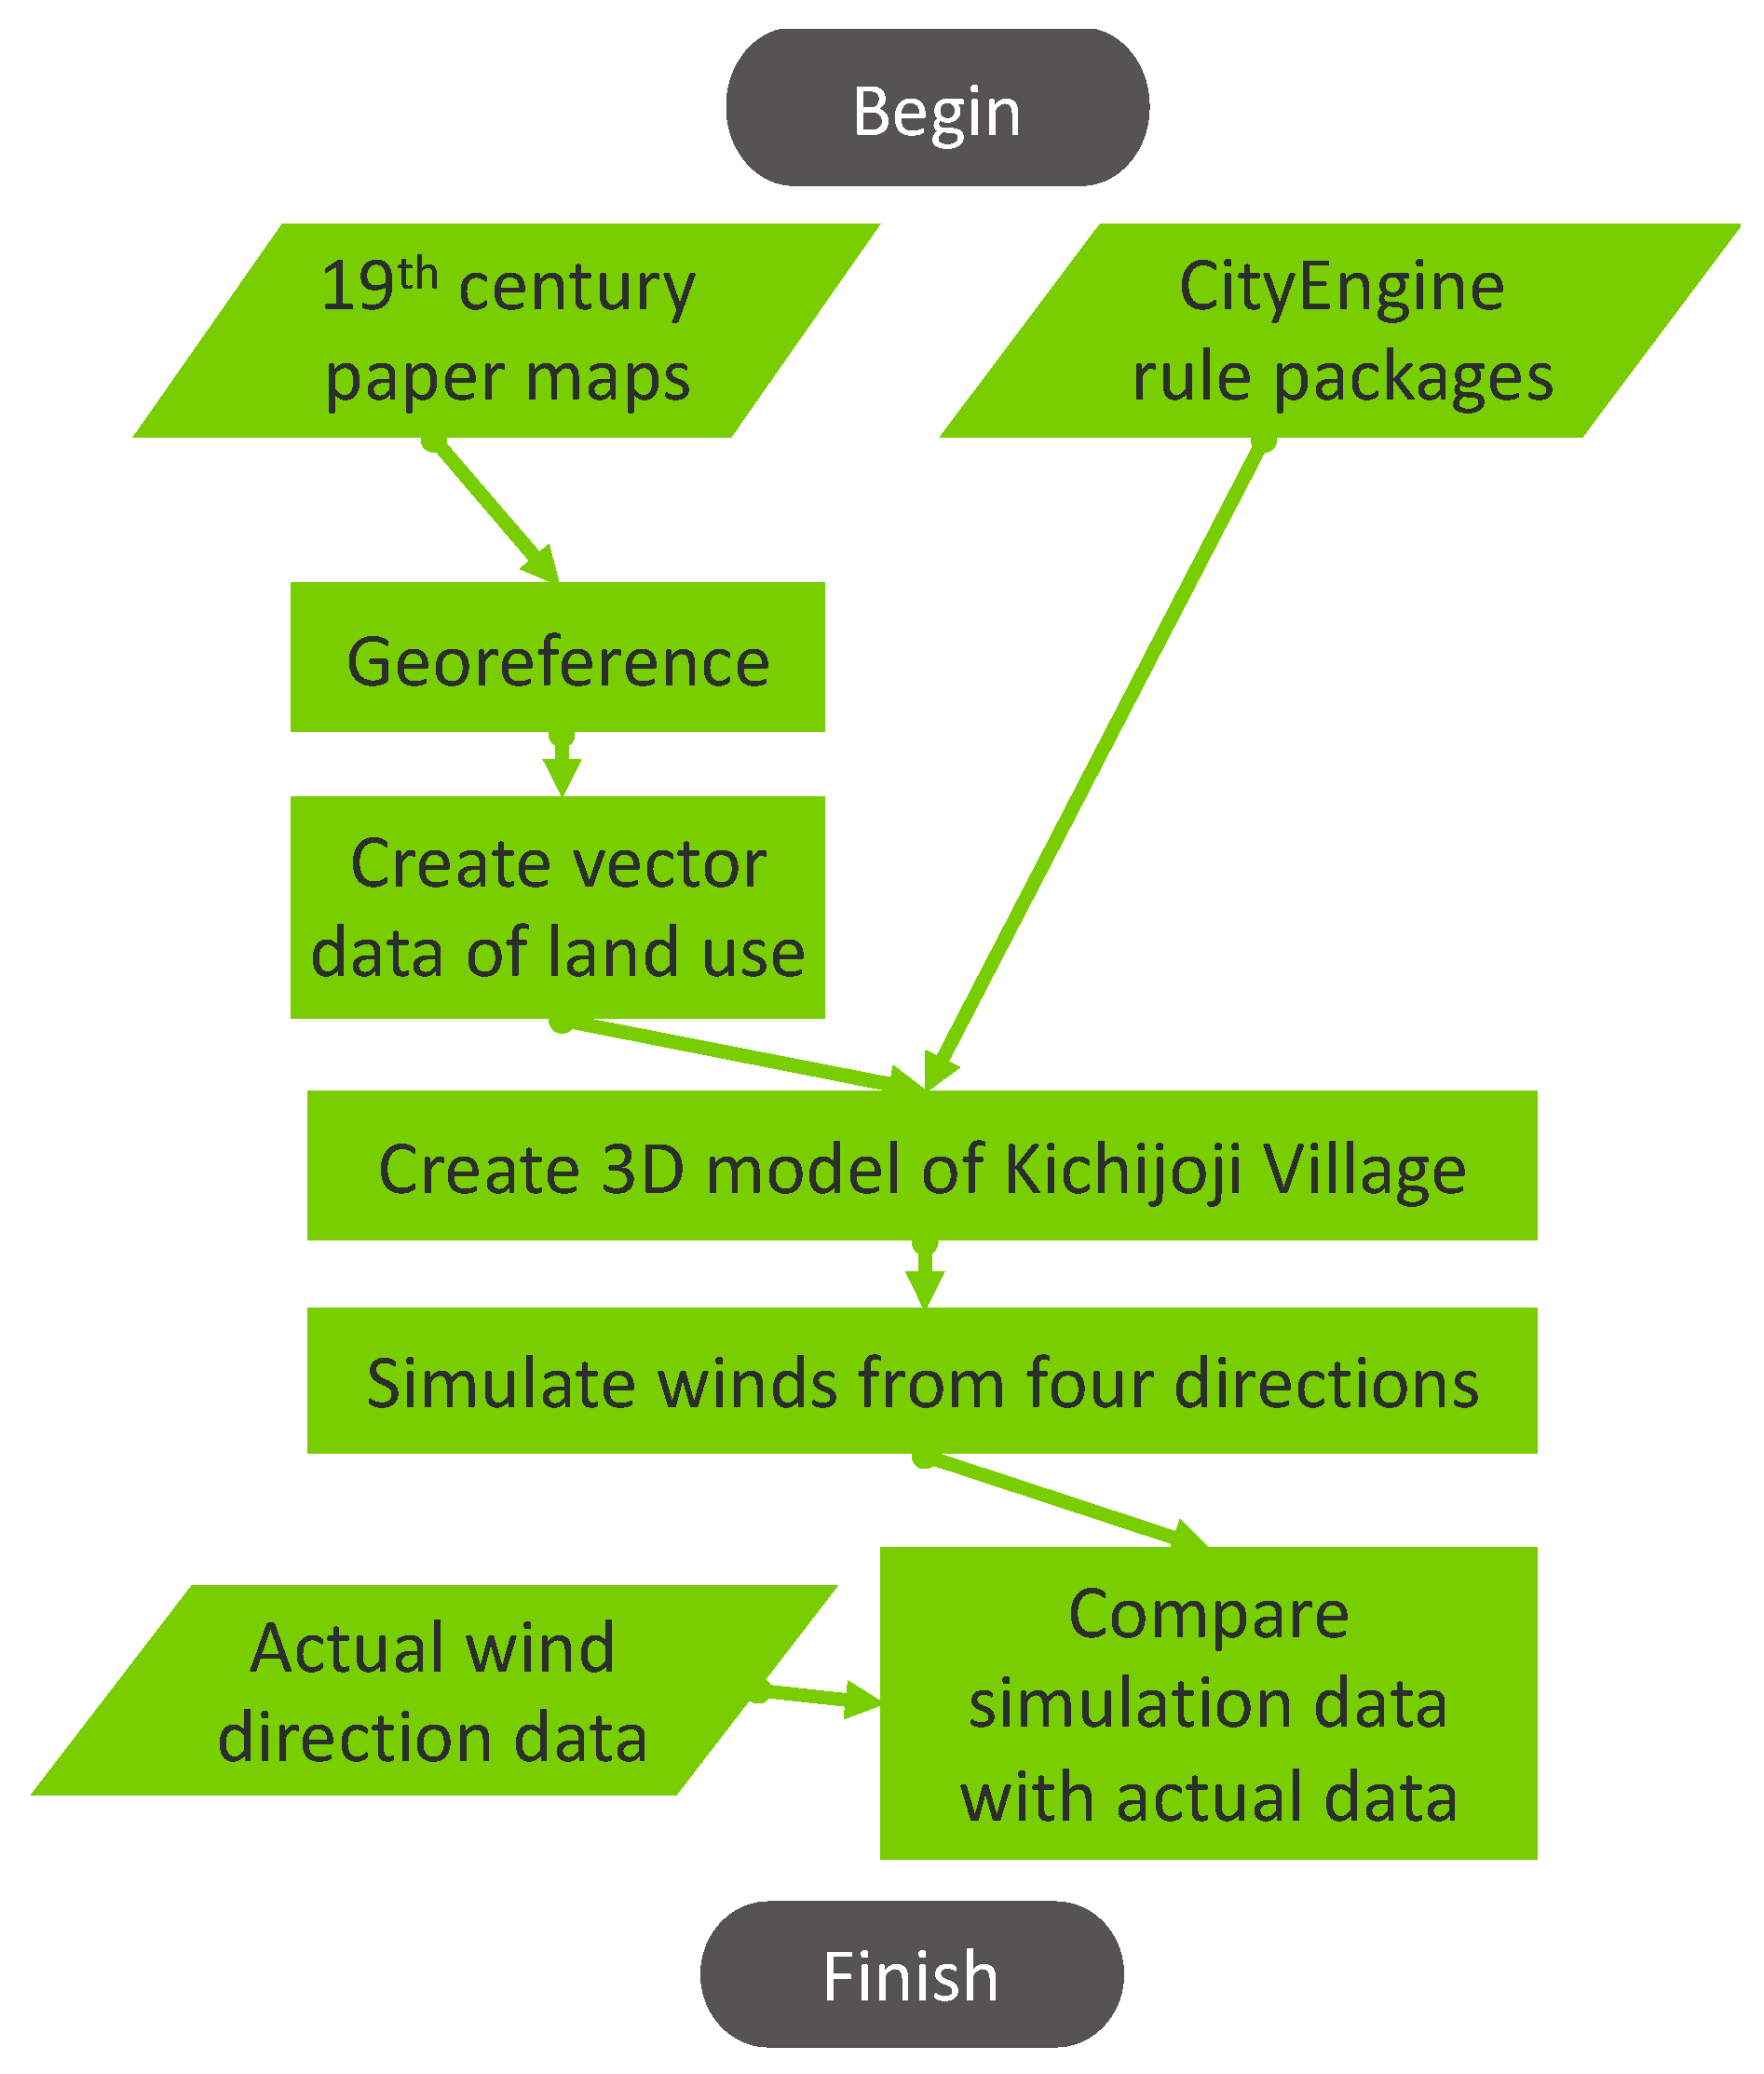
2. Materials and Methods
The methodology used in this study is described in
Figure 2. First, a georeference was developed on a map of the area from the 19th century and was used to generate vector data. These vector data were then subjected to different 3D model rule packages for different land uses to create a complete 3D model of the village. Simulations of wind conditions were performed using this model. Finally, the results of the simulation were compared with actual wind direction data. Details on these steps are described in subsequent sections.
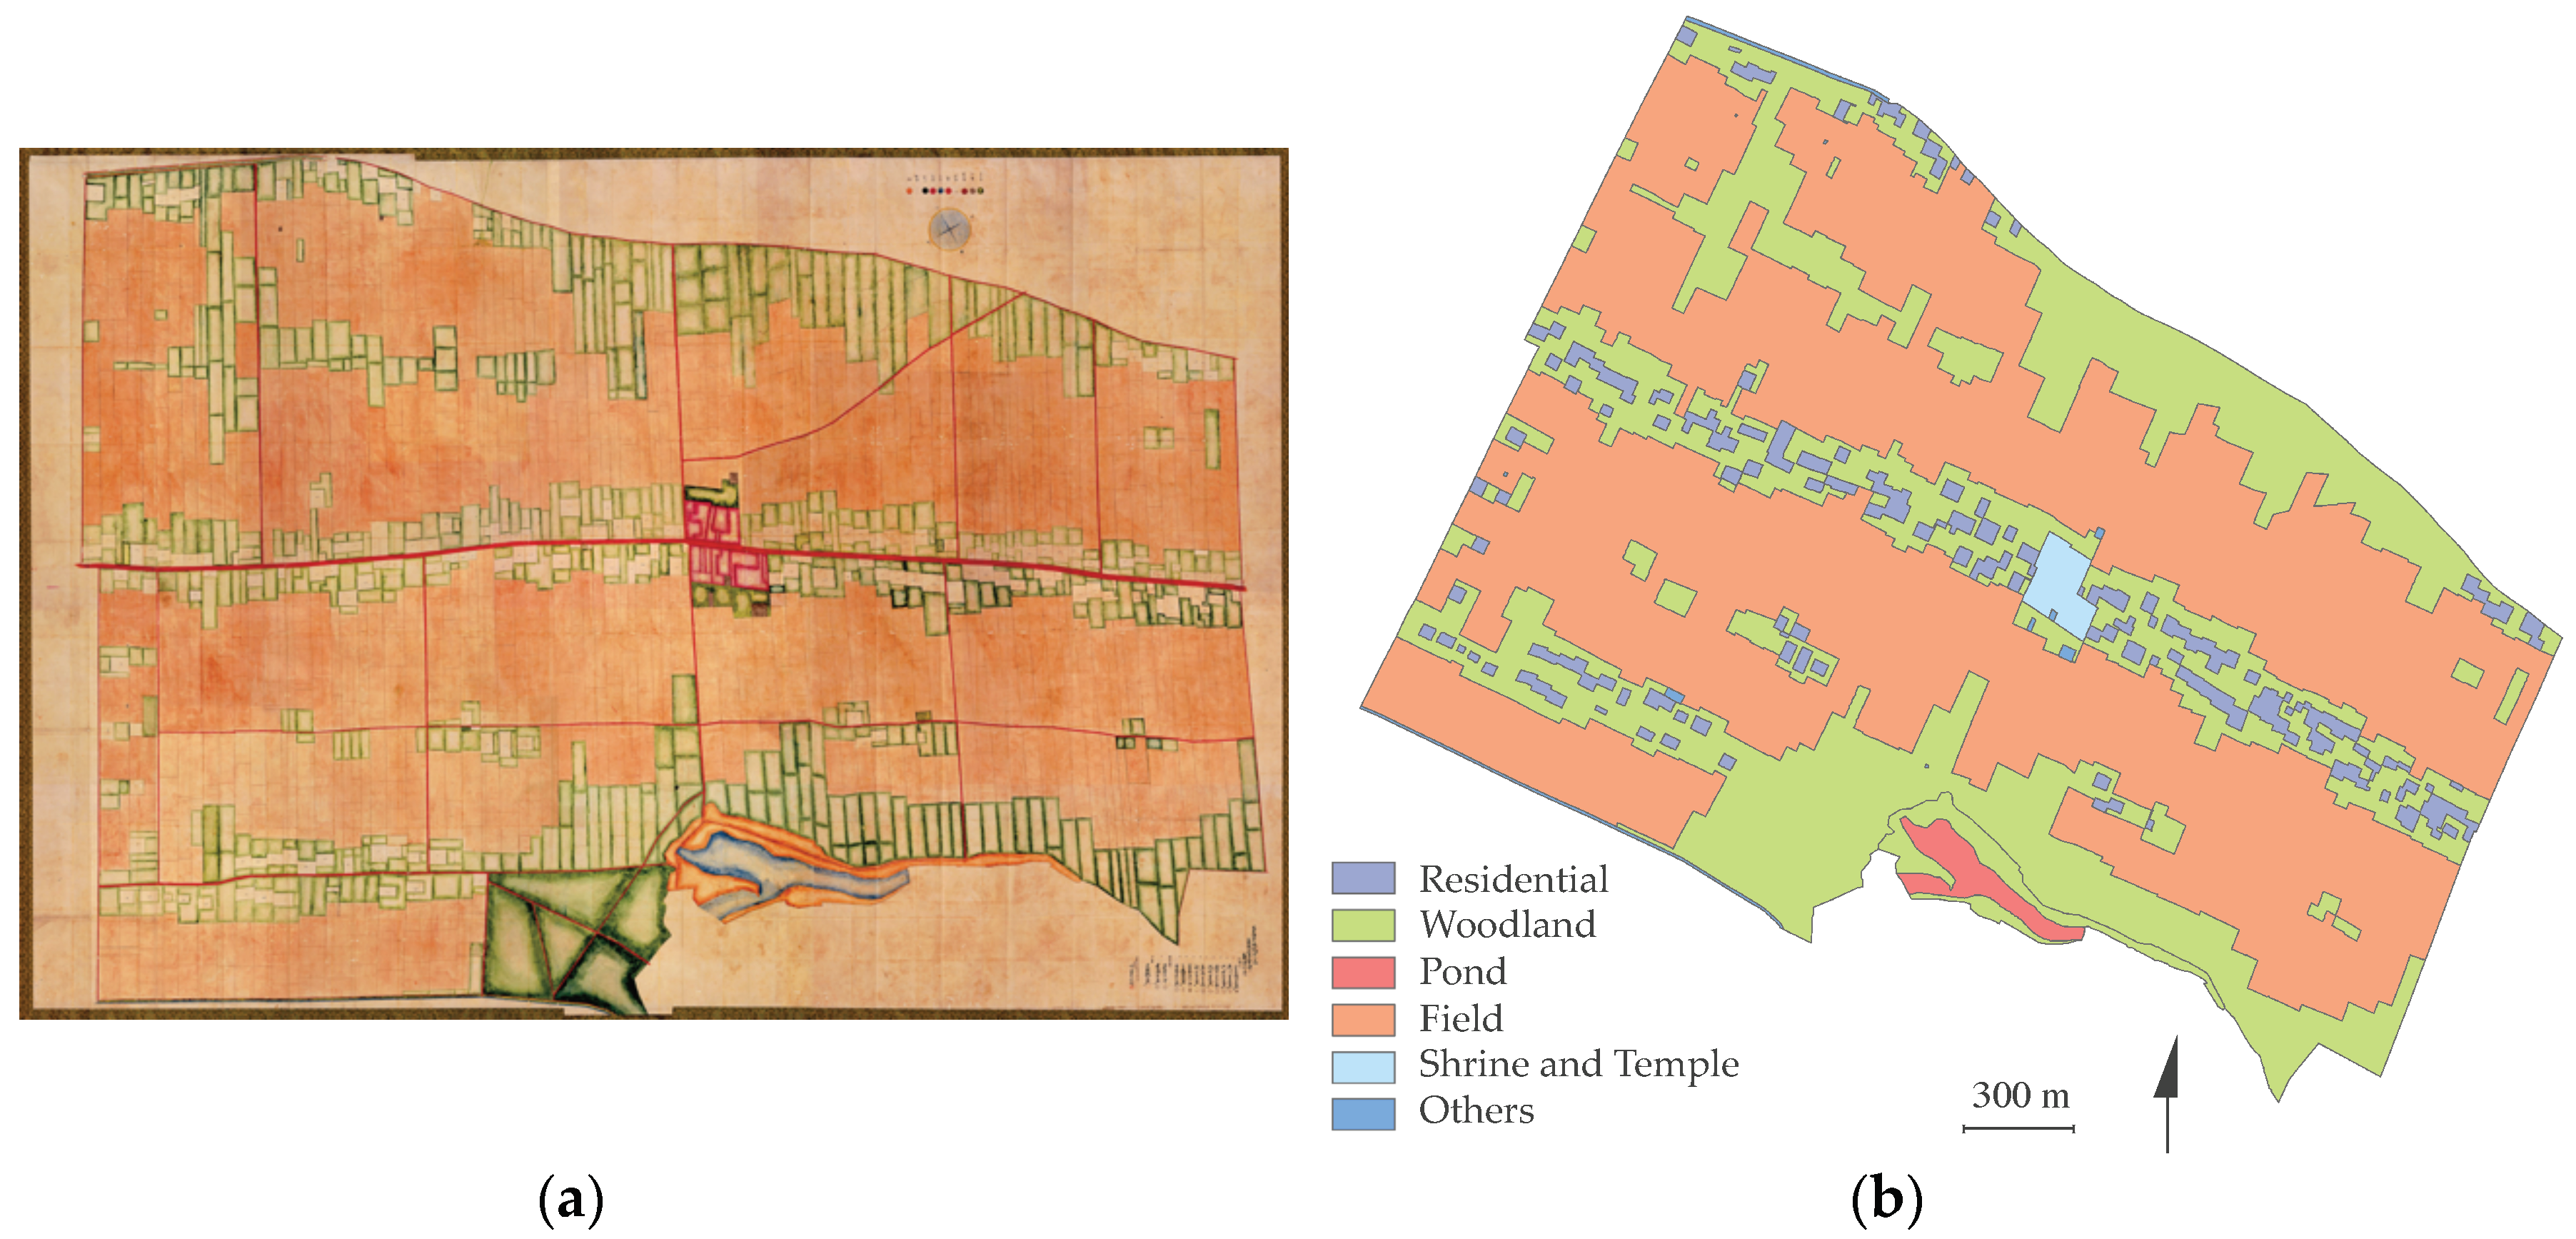
2.1. Digitizing the Map of Kichijoji Village
In this study, the “Dai-juich-daiku Yon-syouku Kichijoji-mura zenzu” (whole Kichijoji village map in the 4th small ward, 11th large ward) was the source of the land-use data used in the 3D reconstruction. Hereafter, this map is referred to as the Kichijoji village map.
Figure 3a shows an image of the Kichijoji village map, which was produced in 1875 by the municipal office of the village to adopt a tax system from 1873 [
20]. The Kichijoji village map was digitized by Environmental Systems Research Institute (Esri) ArcGIS Desktop.
The original map shown in
Figure 3a was georeferenced in JGD 2000 Zone 54 of the projection coordinate system. As the map and the results of the modern survey show a narrow area, the necessity for geometric correction was almost minimal; only four control points were used. It is not known what coordinate reference system was used for the original map. However, the border of the village did not change because it is still used in the present city; therefore, the four corners of the village became the control points.
The legends used to prepare the land-use diagrams in
Figure 3b were numerous and partly inconsistent. For example, despite the fact that forests and communal areas are woodland, they were drawn with separate legends because of differences in ownership. Therefore, by using other historical documents, the inconsistent legends were reinterpreted to explain the actual land use. As a result, the land use was reclassified into six categories: residential, woodland, pond, field, shrine and temple, and other.
2.2. 3D Reconstruction of Kichijoji Village
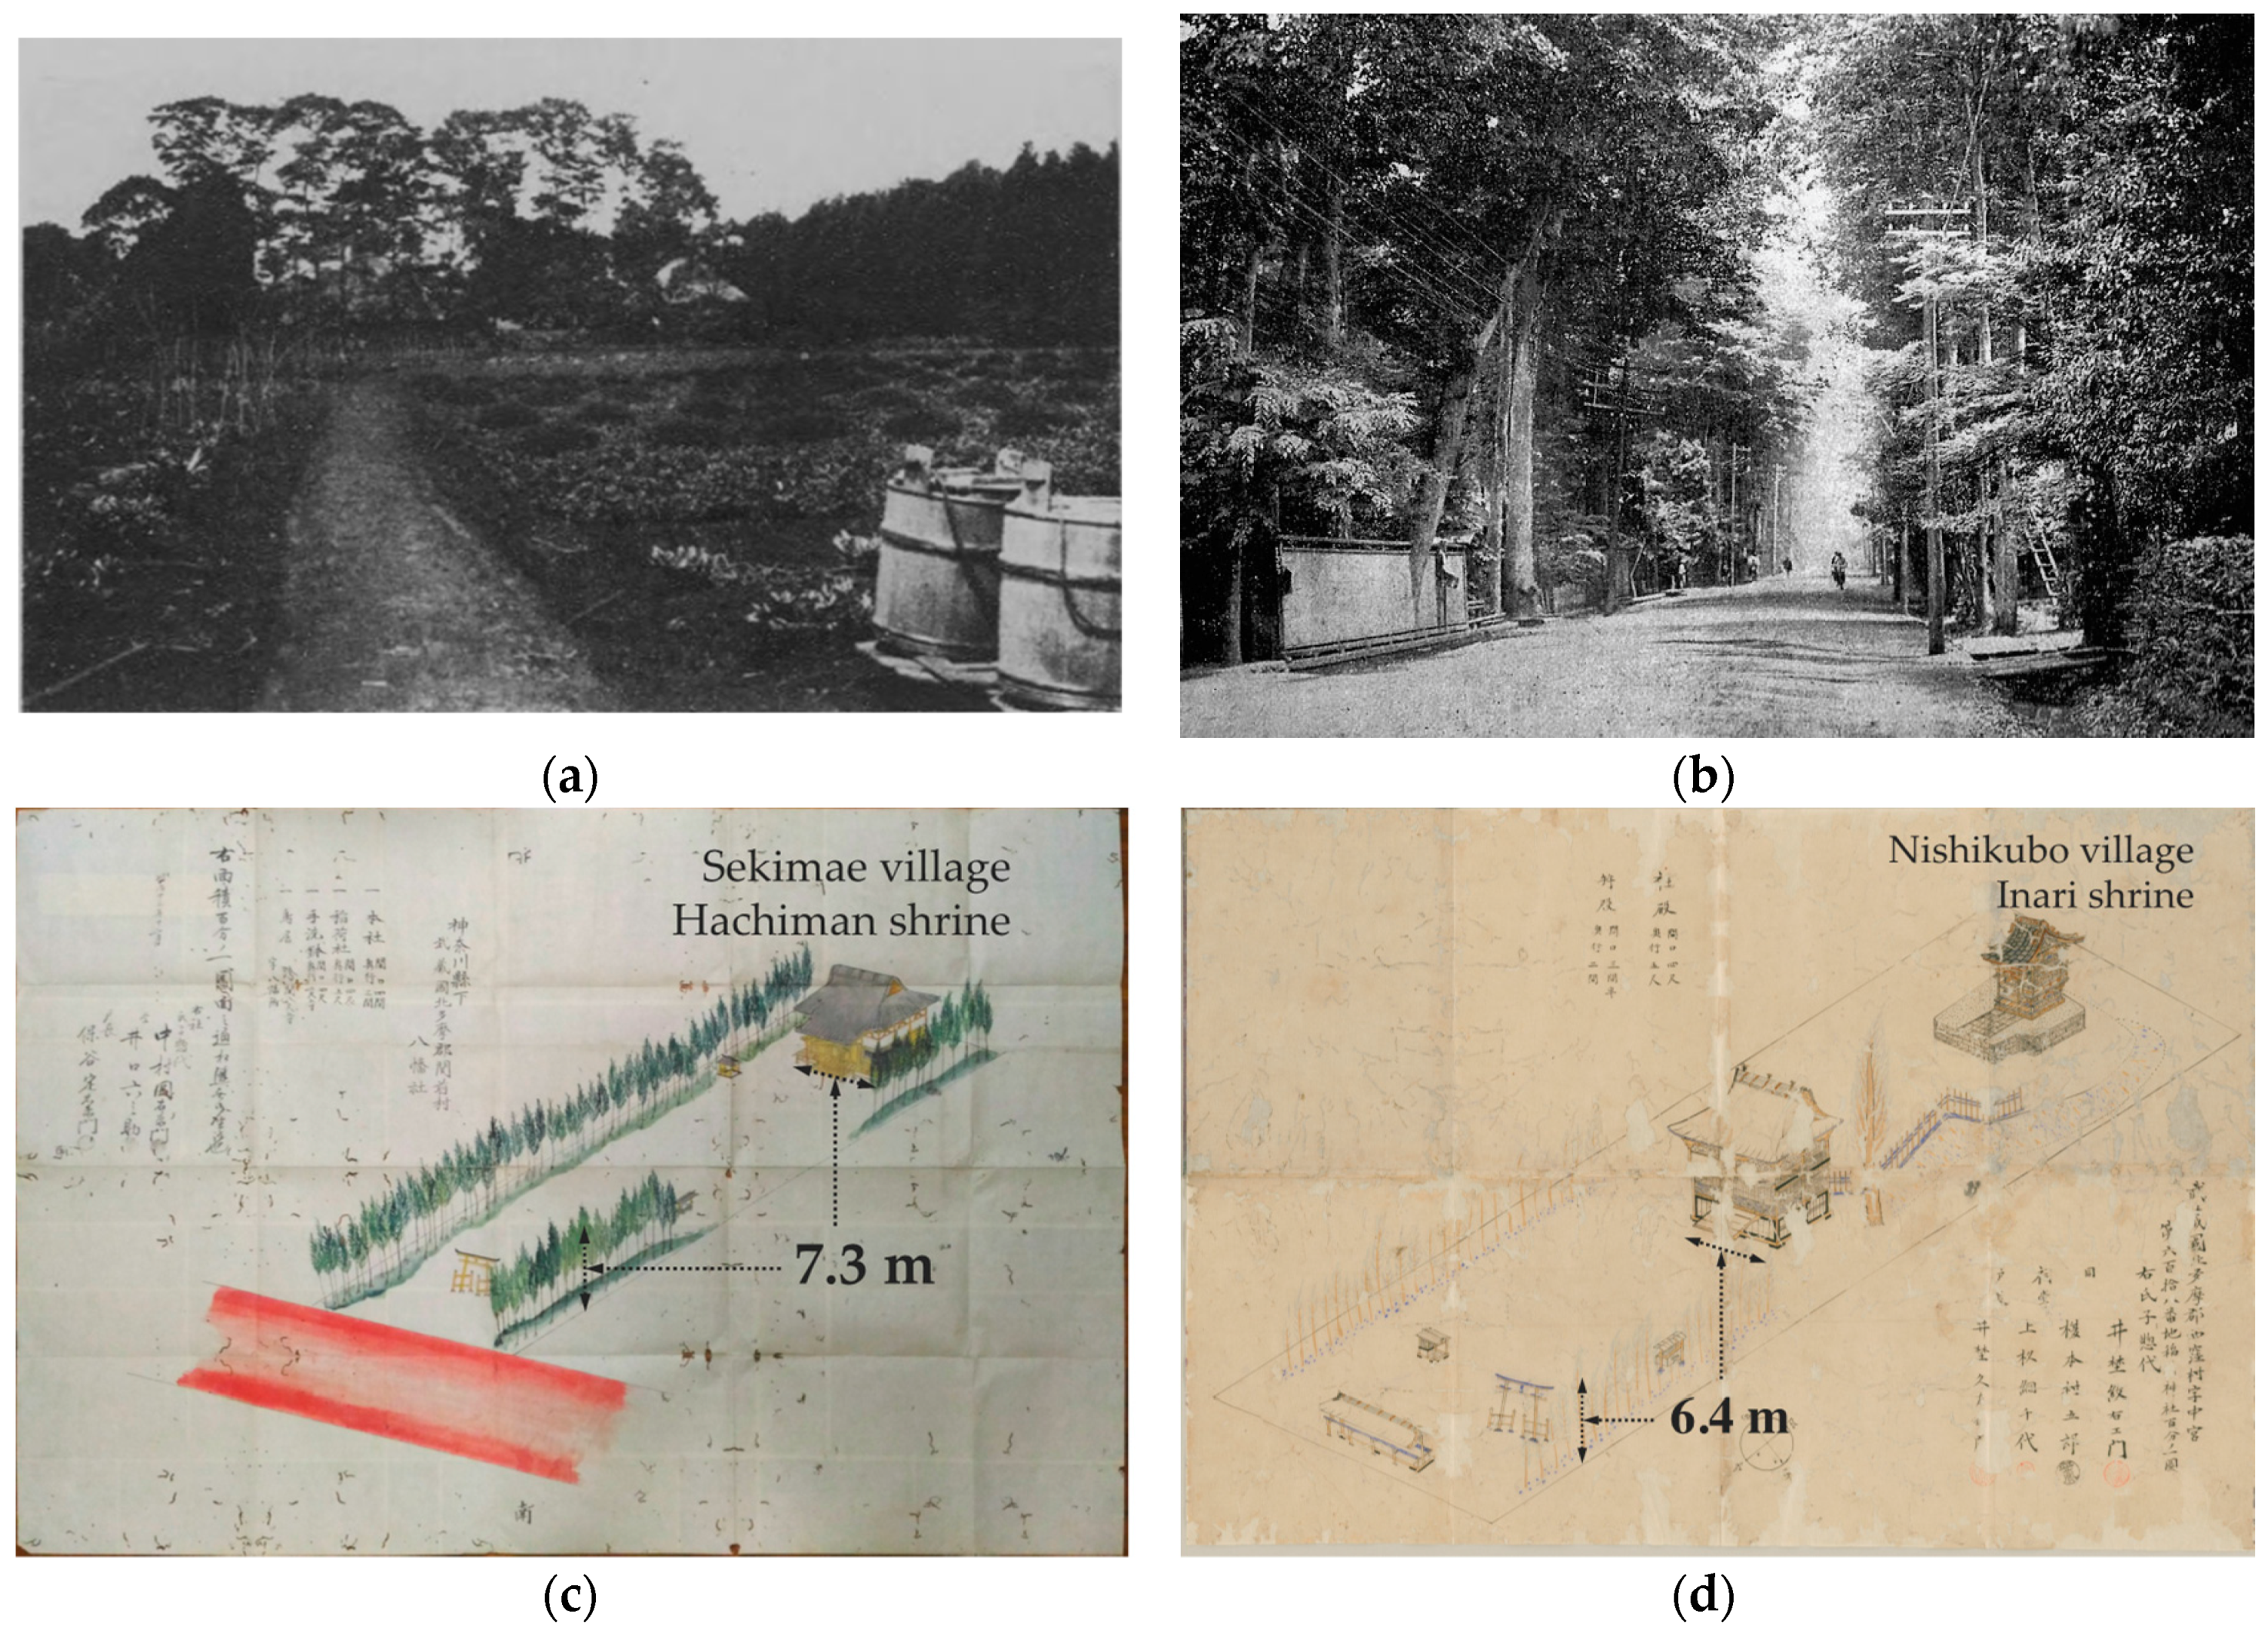
Historical photographs and other pictures were used as the basis for preparing the data used in the reconstruction of the landscape as 3D models. The images in
Figure 4a [
21] and
Figure 4b [
22] are both landscape photographs taken around Kichijoji village in the early 1900s. As these show, there were low hedges to large trees over 20 m in height, although the exact height is unknown. The drawings in
Figure 4c,d are maps of shrines drawn at a 1/100 scale in the 1870s. The description shows that the frontage of the building in
Figure 4c was about 7.3 m and that of the building in
Figure 4d was about 6.4 m. This number is unusually precise because it is a conversion of the textual information on the frontage length of the building in the unit Ken into meters. The length was not measured on the scale. The surrounding trees were more than 6.0 m high.
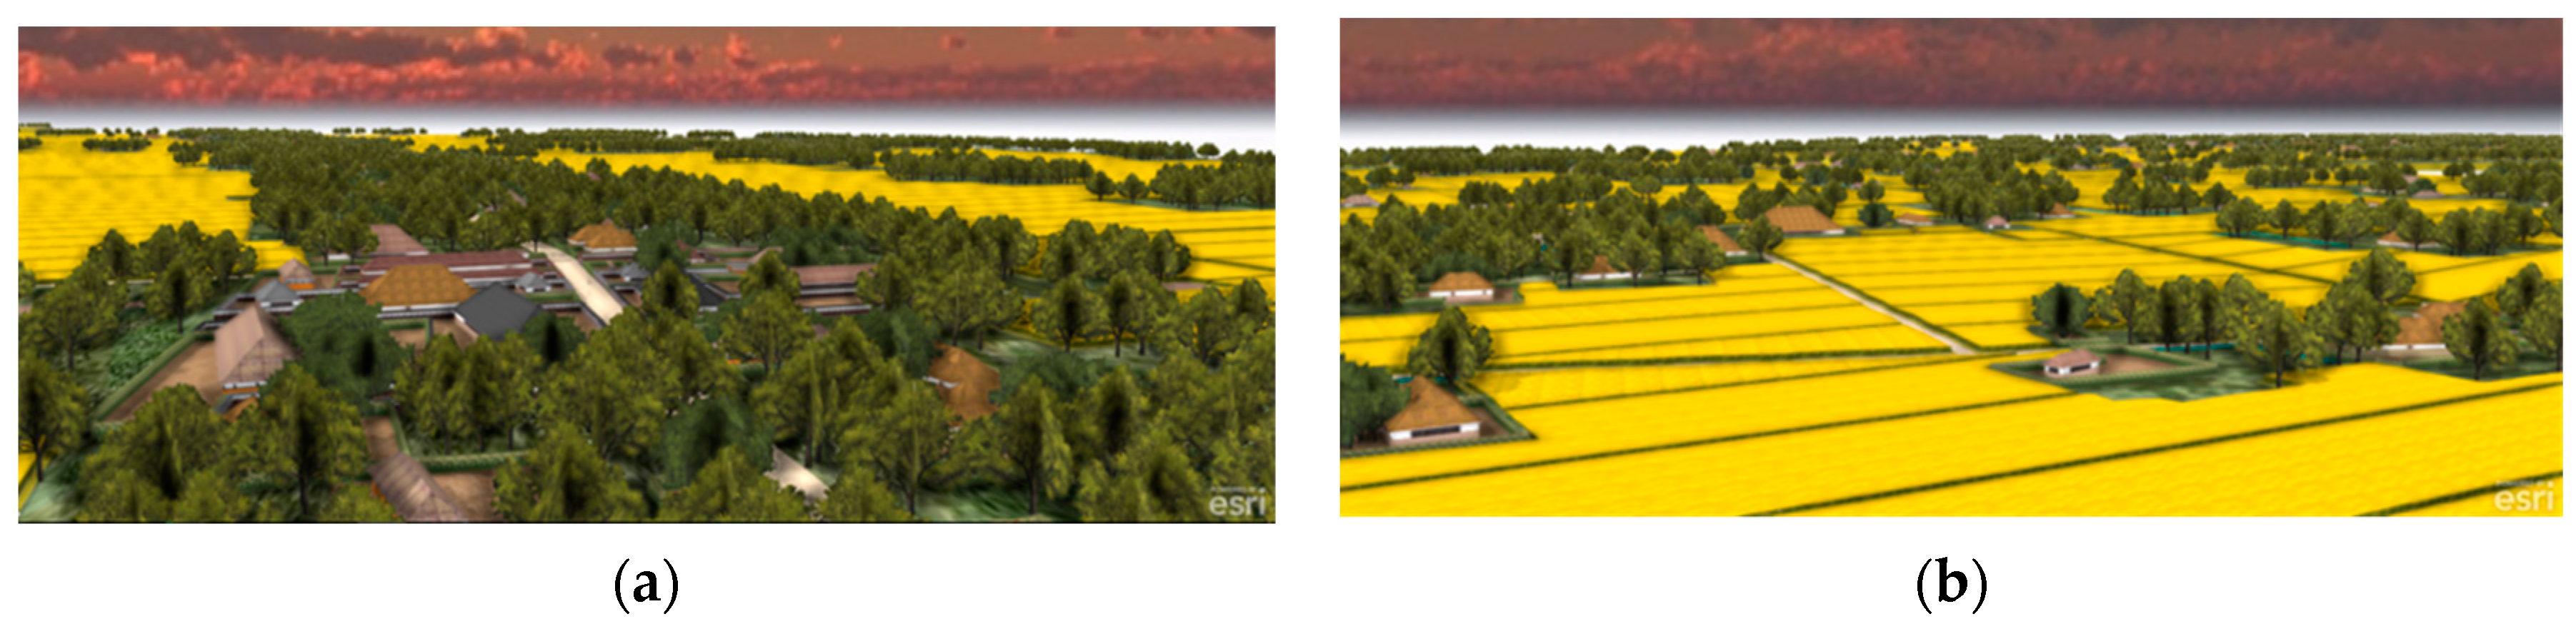
In the 3D reconstruction of the Kichijoji village based on the land-use map of Kichijoji in
Figure 3 and the historical sources in
Figure 4, automatic generator programs were used to reconstruct the entire village as 3D models (
Figure 5a,b). The automatic generator programs of the 3D models (rule package) were written in the CGA language, which can be used in the Esri CityEngine and ArcGIS Pro software workspace. This reconstruction used rule packages for rural village buildings in Japan (independently programmed), a rule package from the Vegetation Library with LumentRT 3D Plants provided by Esri, and rule packages for town buildings and agricultural land provided by the Esri Japan Corporation. Woodland trees were arranged randomly to cover a height of 22 m or less, but tree crown transparency was not considered.
2.3. Computational Fluid Dynamics (CFD) Analysis
In this study, a CFD analysis was performed on the 3D models described in
Section 2.2 to simulate the relative wind reduction effect in Kichijoji village. The simulation process used Airflow Analyst, an ArcGIS extension product provided by the Environmental GIS Laboratory (ENGIS). Airflow Analyst uses the same program as the RIAM-COMPACT, developed by Uchida [
23], and its accuracy as a simulation program has been sufficiently verified [
23].
Previously, a CFD analysis could not be performed without a high level of expertise in fluid dynamics. It is important to note that the commercial software developed by ENGIS has made it possible to analyze GIS data without such expertise. However, because a quick analysis has become possible, there is a risk that the analysis is carried out without sufficient knowledge of wind conditions. The validity of the simulation results depends heavily on the results of software calculations, as historians and geographers are not experts in fluid dynamics.
Since the analysis procedure has been simplified greatly, some prerequisites need to be considered. Among several conditions, the most important prerequisite is that the wind flows from a specified direction at a fixed and stable speed. Furthermore, when weather conditions are not known, a hypothetical wind speed is used, and the inlet section sets the wind speed on a curve (wind speed profile) according to a power index. In general, the index should be approximately 3 for landscapes with high undulations, such as urban areas, and approximately 7 for places without undulations, such as flat land and the sea. Since the subjects of the present study are flat rural plateaus, the power index was set to 7. According to Uchida, RIAM-COMPACT does not consider surface roughness, but instead focuses on a smooth surface as part of its calculation algorithm [
24]. In addition, although the software can change the transmittance of a tree object by setting parameters, here the transmittance was set to 0% to simplify the calculation.
The wind conditions were analyzed in a rectangular parallelepiped 8 km from east to west, 8 km from north to south, and 125 m in height; this covered the entirety of the Kichijoji village area.
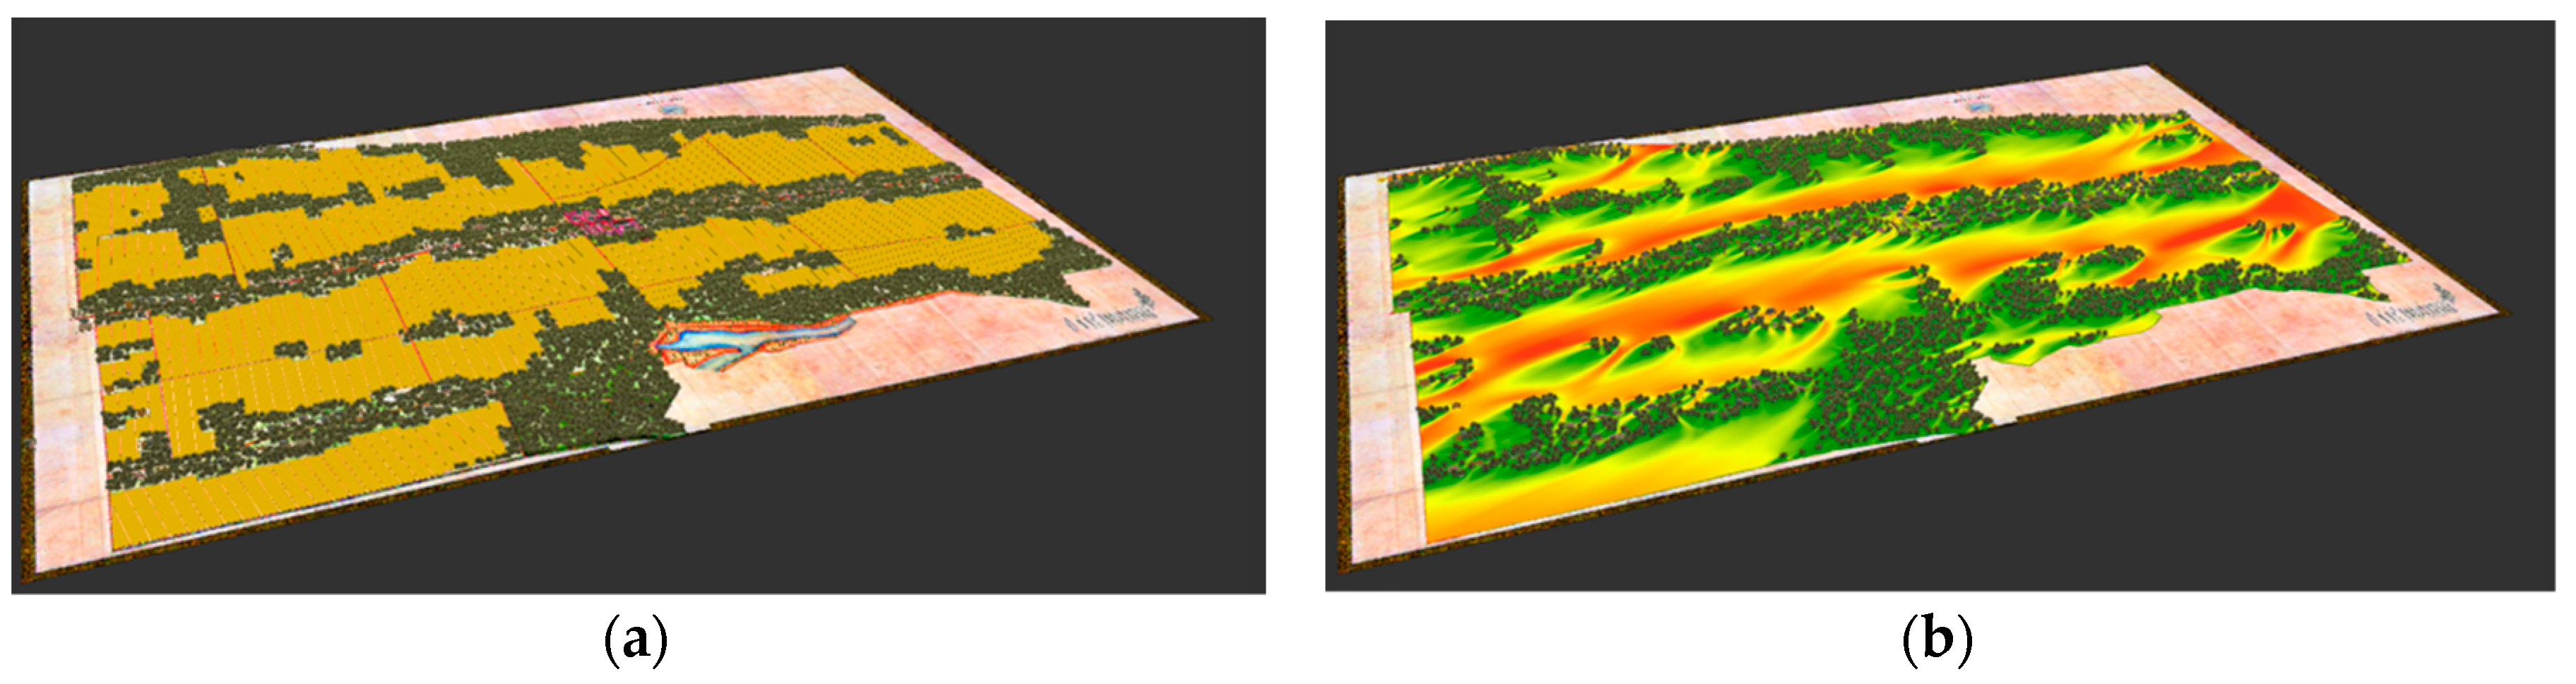
Figure 6 shows the reconstructed 3D models of the entire Kichijoji village (a), in which the wind condition results at a height of 7.78 m are displayed using raster data composed of 5-m square cells among the results of the wind condition analysis (b). The height was set to 7.78 m because the vertical grid spacing uses a function of the hyperbolic tangent to divide the vertical grid spacing into 5 divisions. The wind condition data obtained as a result of the analysis included those from 125.0 m, 110.0 m, 7.78 m 0.08 m, and 0.0 m, respectively, but the first two datapoints cannot be used for the analysis because the elevation is too high. Data for 0.08 m and 0.0 m are too close to the ground plane and cause some data errors. Thus, to make the height setting more flexible, it was necessary to increase the number of divisions in the vertical grid spacing. However, since the analysis is performed over a wide area, if the number of divisions is increased further, it will exceed the amount of data allowed by the NetCDF data format; therefore, a minimum of five divisions was adopted.
3. Results
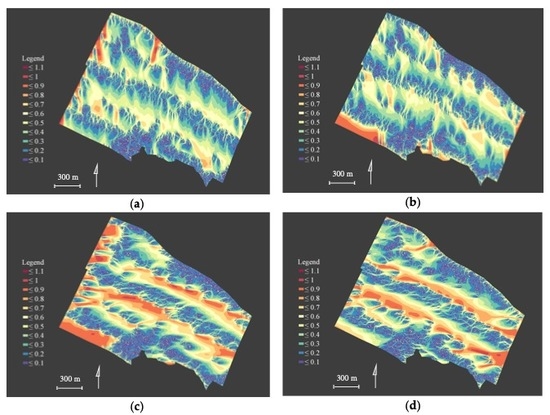
3.1. Distribution of Wind Reduction Effects
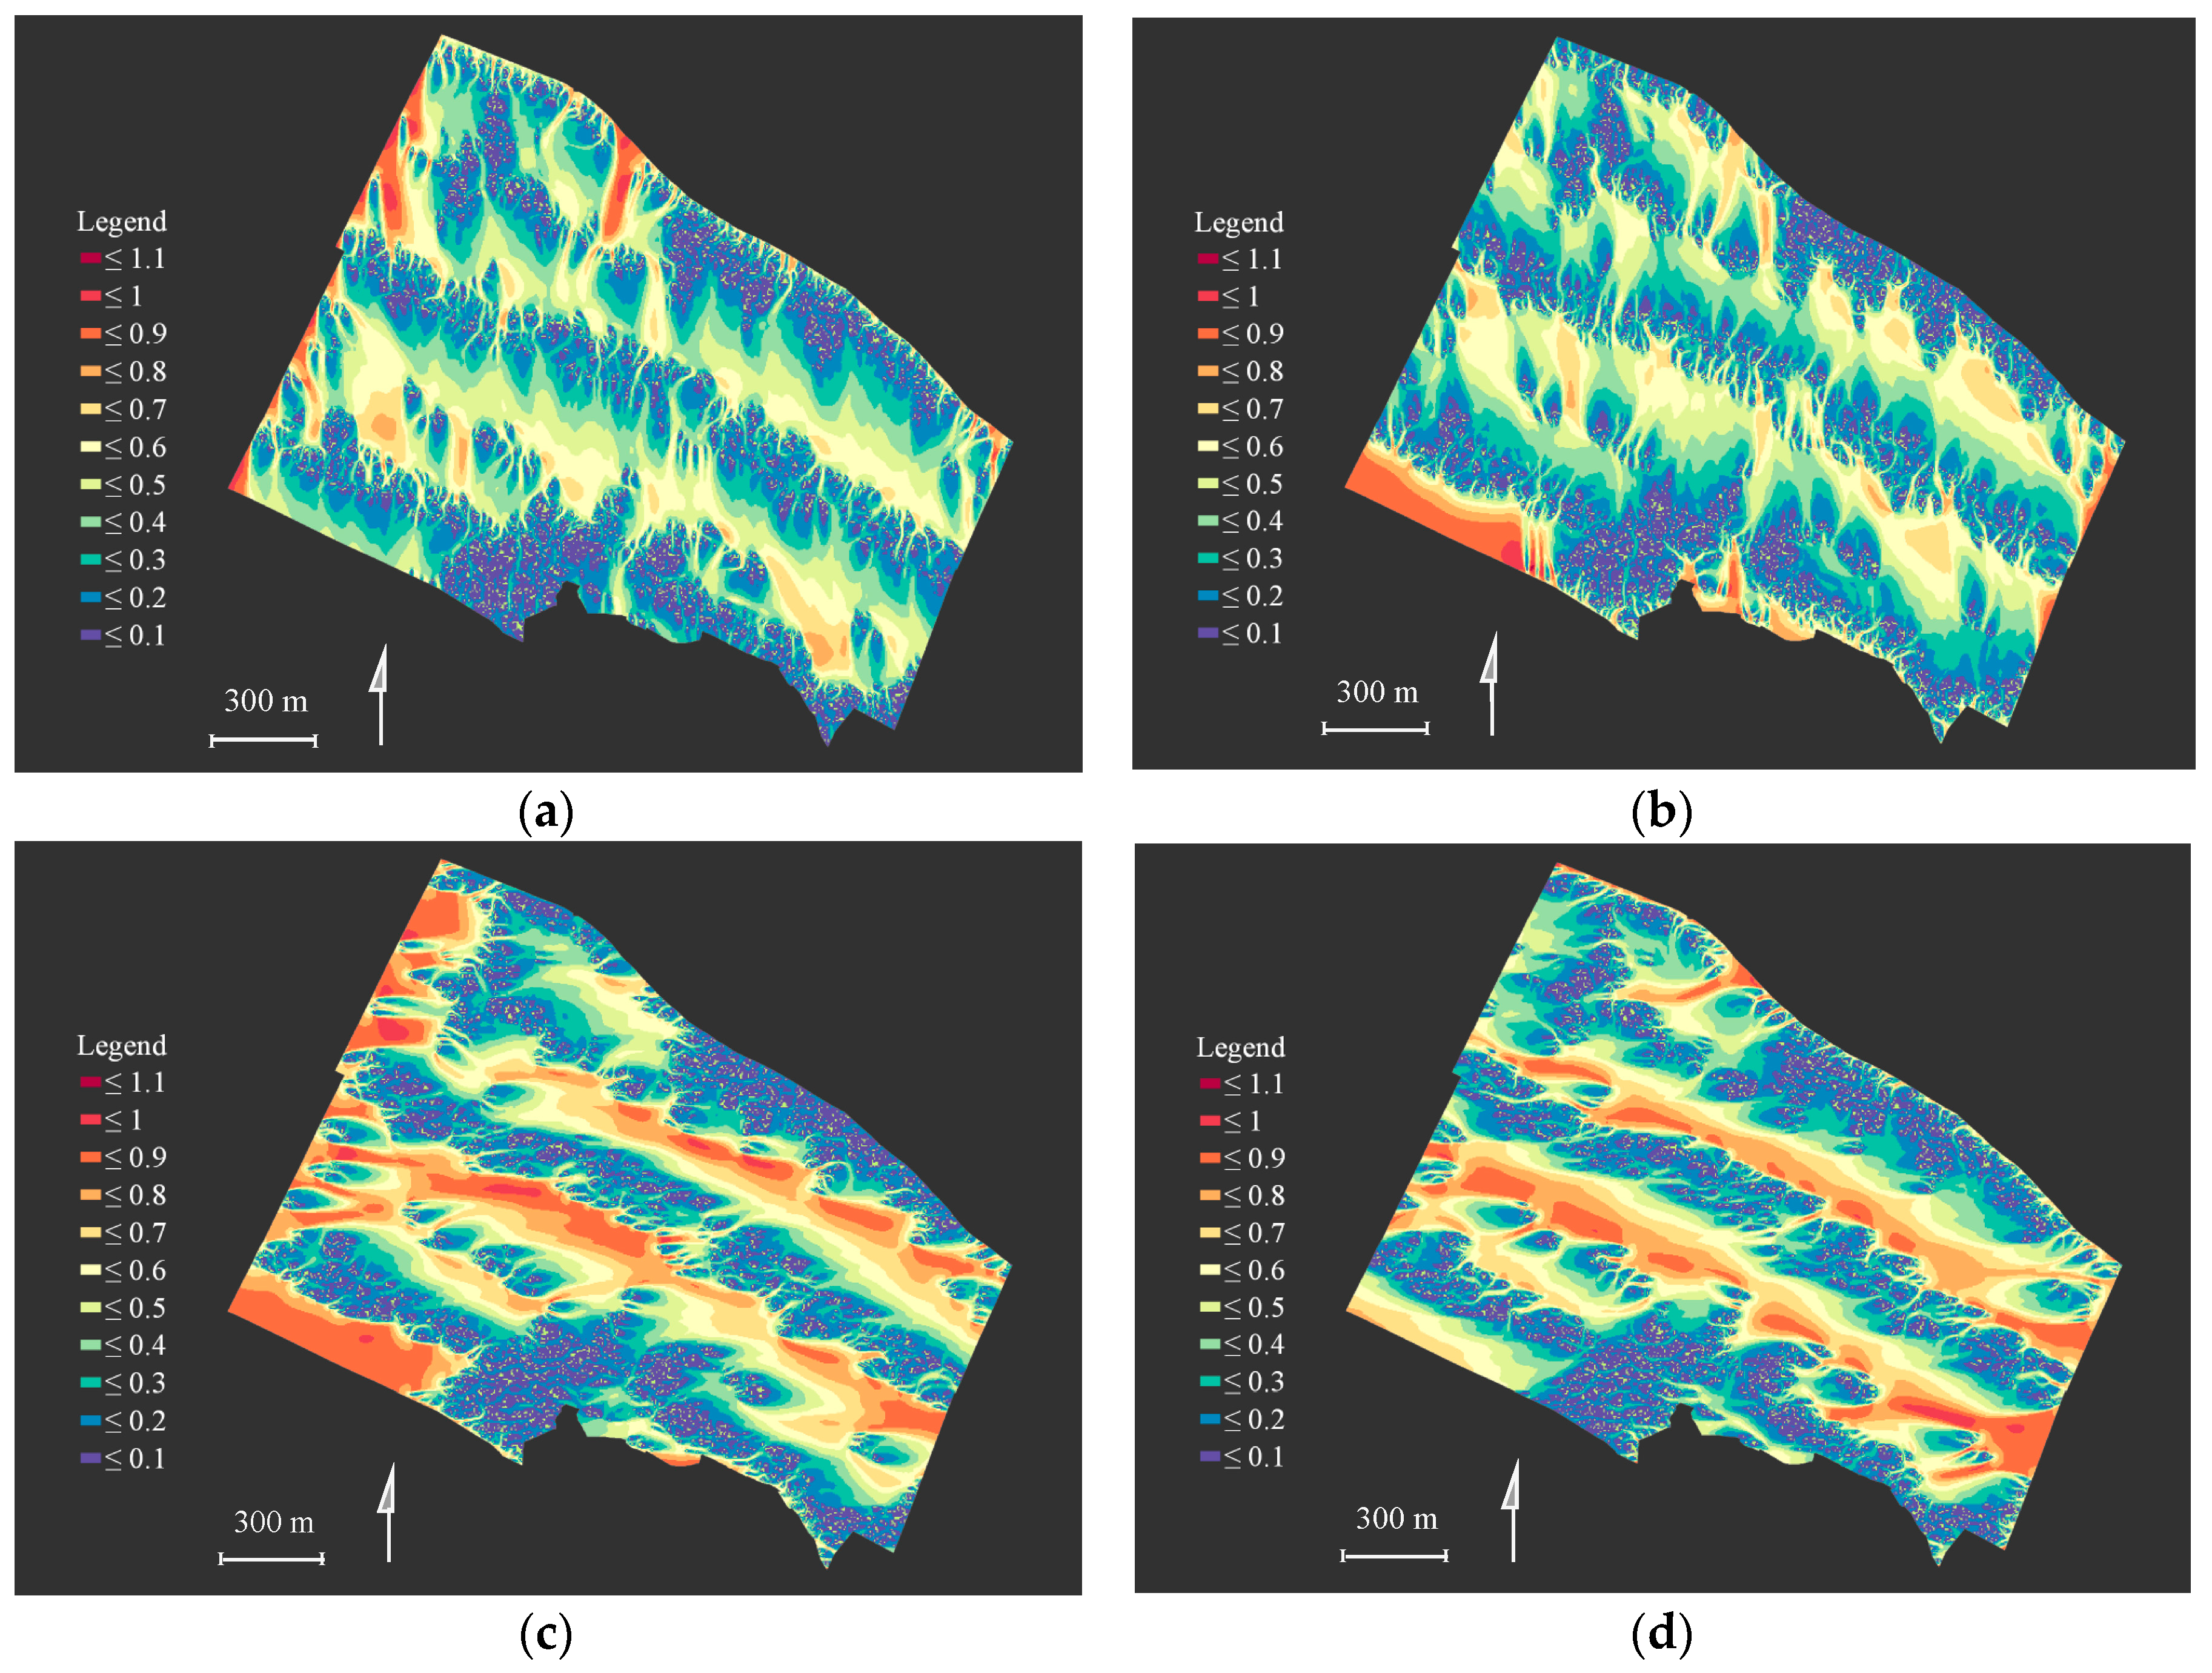
Figure 7 shows the relative reduction in the wind blowing from all directions at a height of 7.78 m. The rate of reduction in wind velocity is shown when a hypothetical wind with velocity “1” blows from each direction (north, south, west, and east). The closer the shades are to red, the lower the wind reduction effect is; the closer they are to blue, the higher the wind reduction effect is. This figure shows that the wind reduction effects of the north wind in
Figure 7a and the south wind in
Figure 7b are larger than those of the west wind in
Figure 7c and the east wind in
Figure 7d.
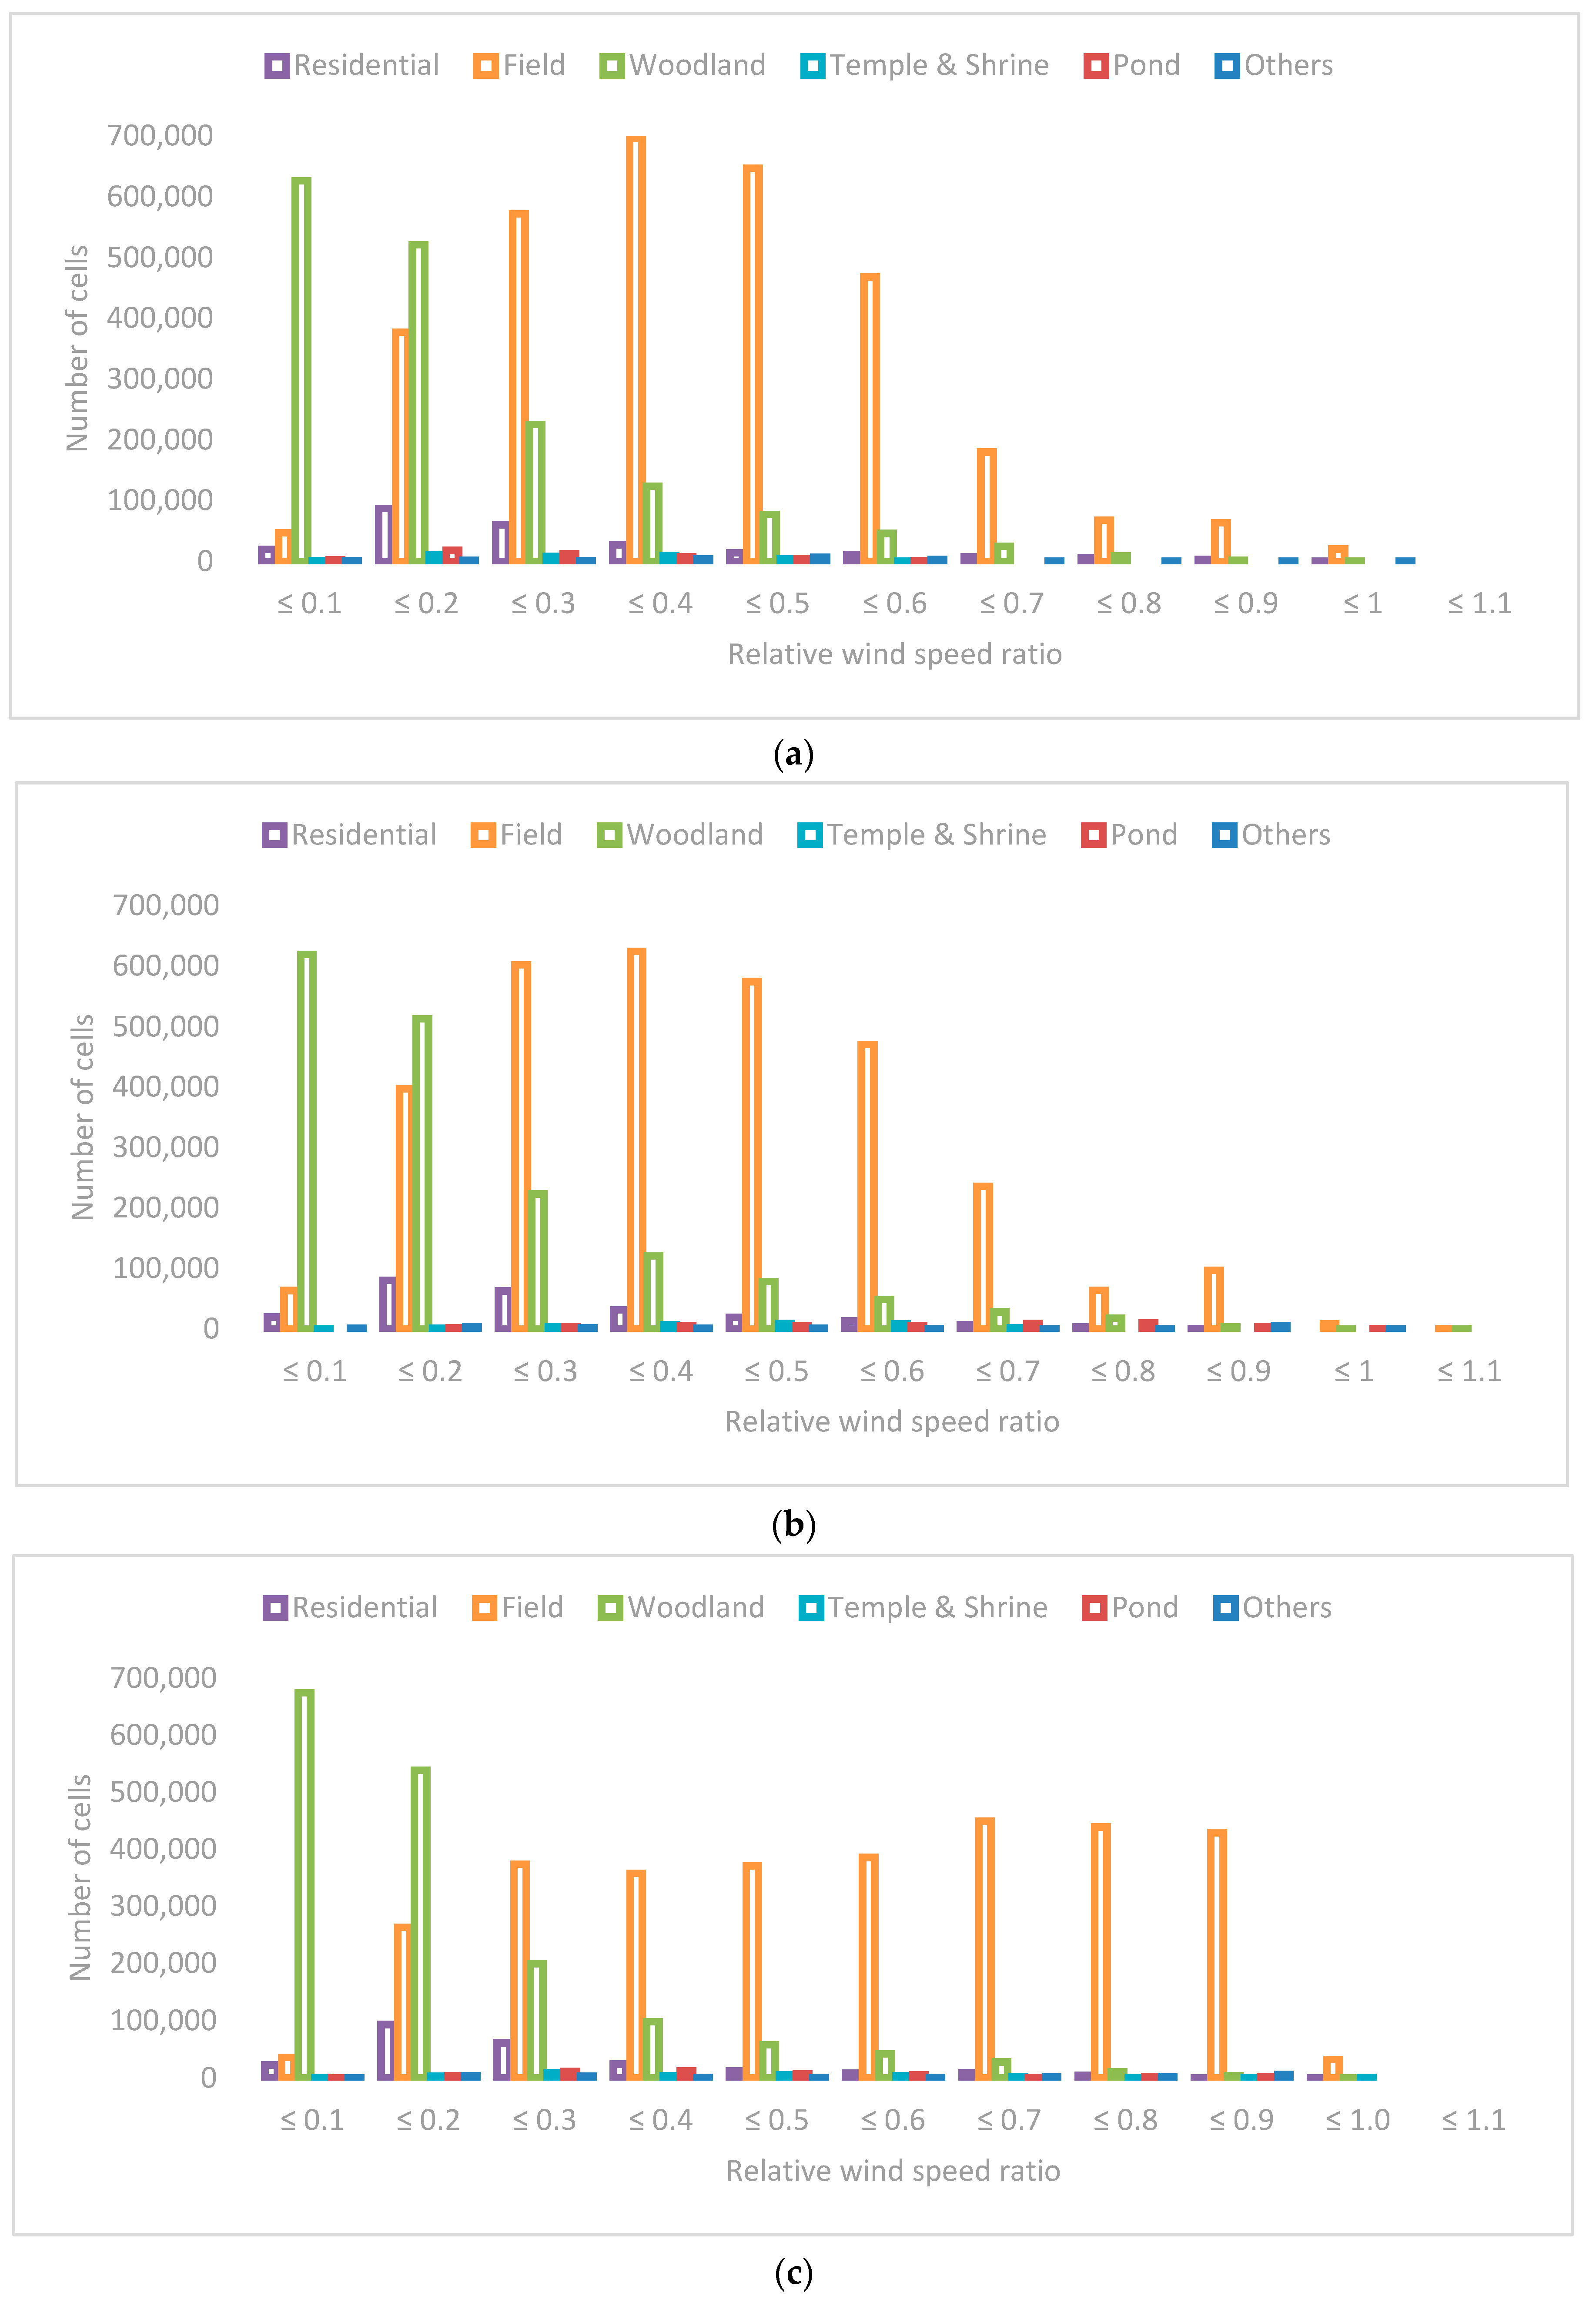
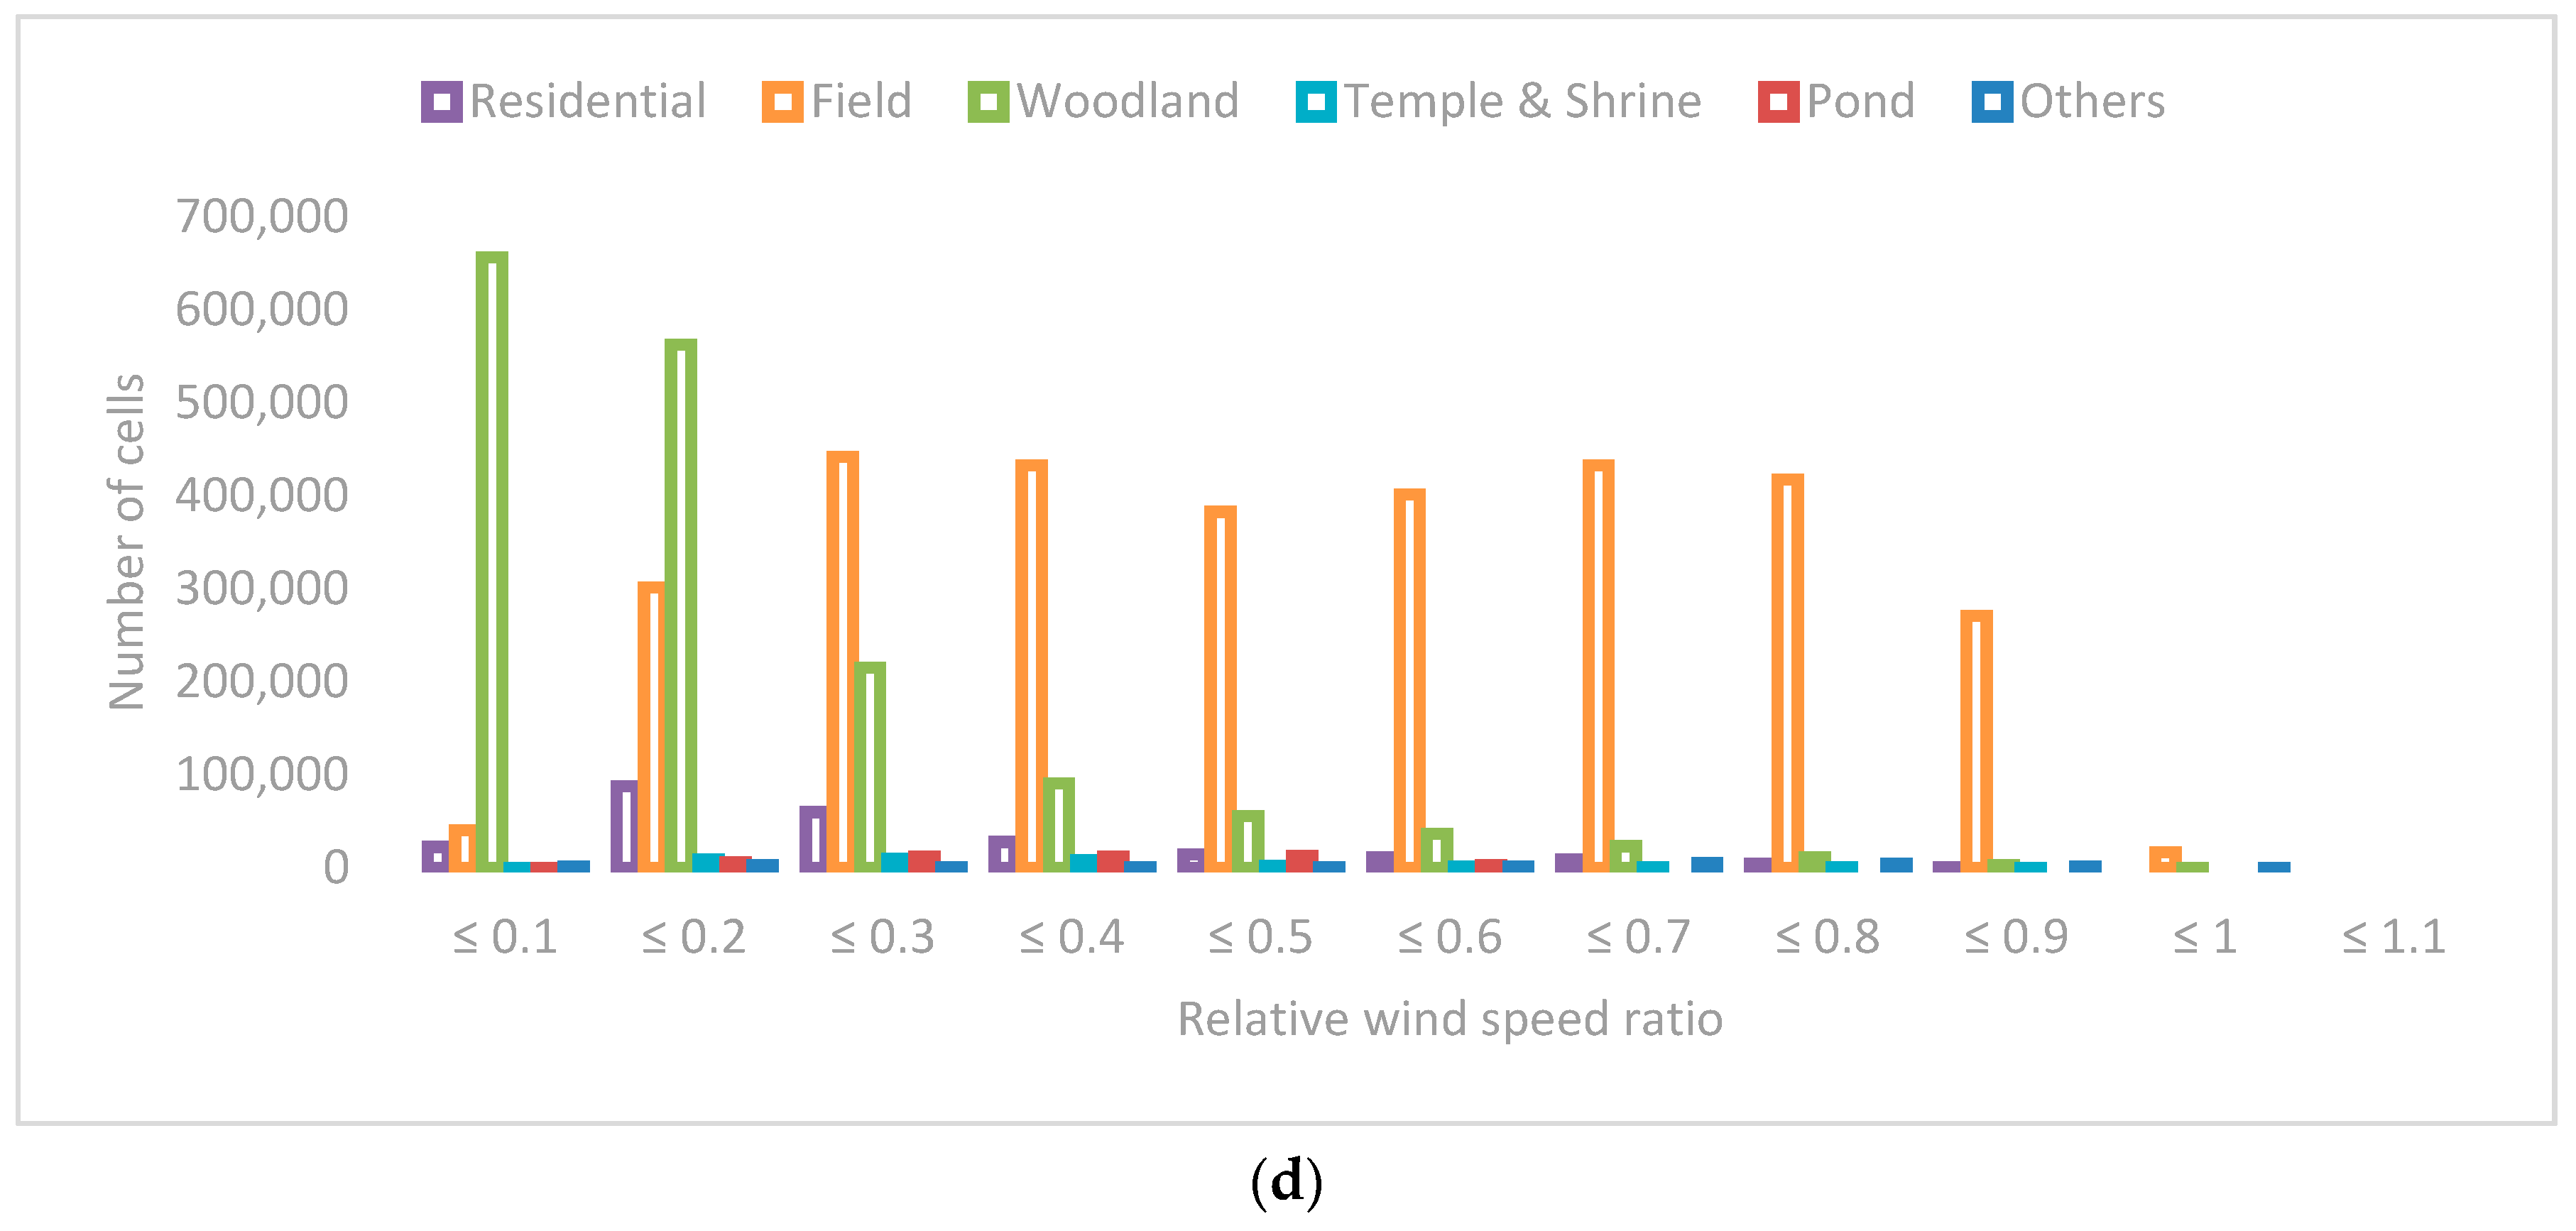
3.2. The Effects of Wind Reduction on Land Use
Figure 8 shows the relative wind reduction effect for wind blowing from all directions (
Figure 7) by land-use classification. The vertical axis indicates the number of 5-m
2 square cells. The horizontal axis shows the rate of decrease when a hypothetical wind with velocity “1” blows from all directions outside the observation range. While preparing
Figure 3b and
Figure 7, the results of wind condition analyses were overlaid, and the results were tabulated for each land-use type. The larger the number of cells on the vertical axis, the larger the area. The larger the value of the relative wind speed ratio on the horizontal axis, the faster the wind speed for each land use.
In these graphs, the wind speeds in the field of the north wind (a) and south wind (b) are concentrically distributed around 0.2–0.7 with respect to the wind speed “1,” whereas the speeds of the west wind (c) and east wind (d) are distributed around 0.2–0.9 for the same. This indicates that the wind reduction effect was statistically more significant for the north and south winds than for the west and east winds in the field of Kichijoji village.
4. Discussion
The woodland in Kichijoji village was placed for its wind reduction effect for the north and south winds in the field. Therefore, it is desirable to examine the actual wind conditions in Kichijoji village using current observation data. Naturally, there may be some differences between early-modern and modern climate conditions.
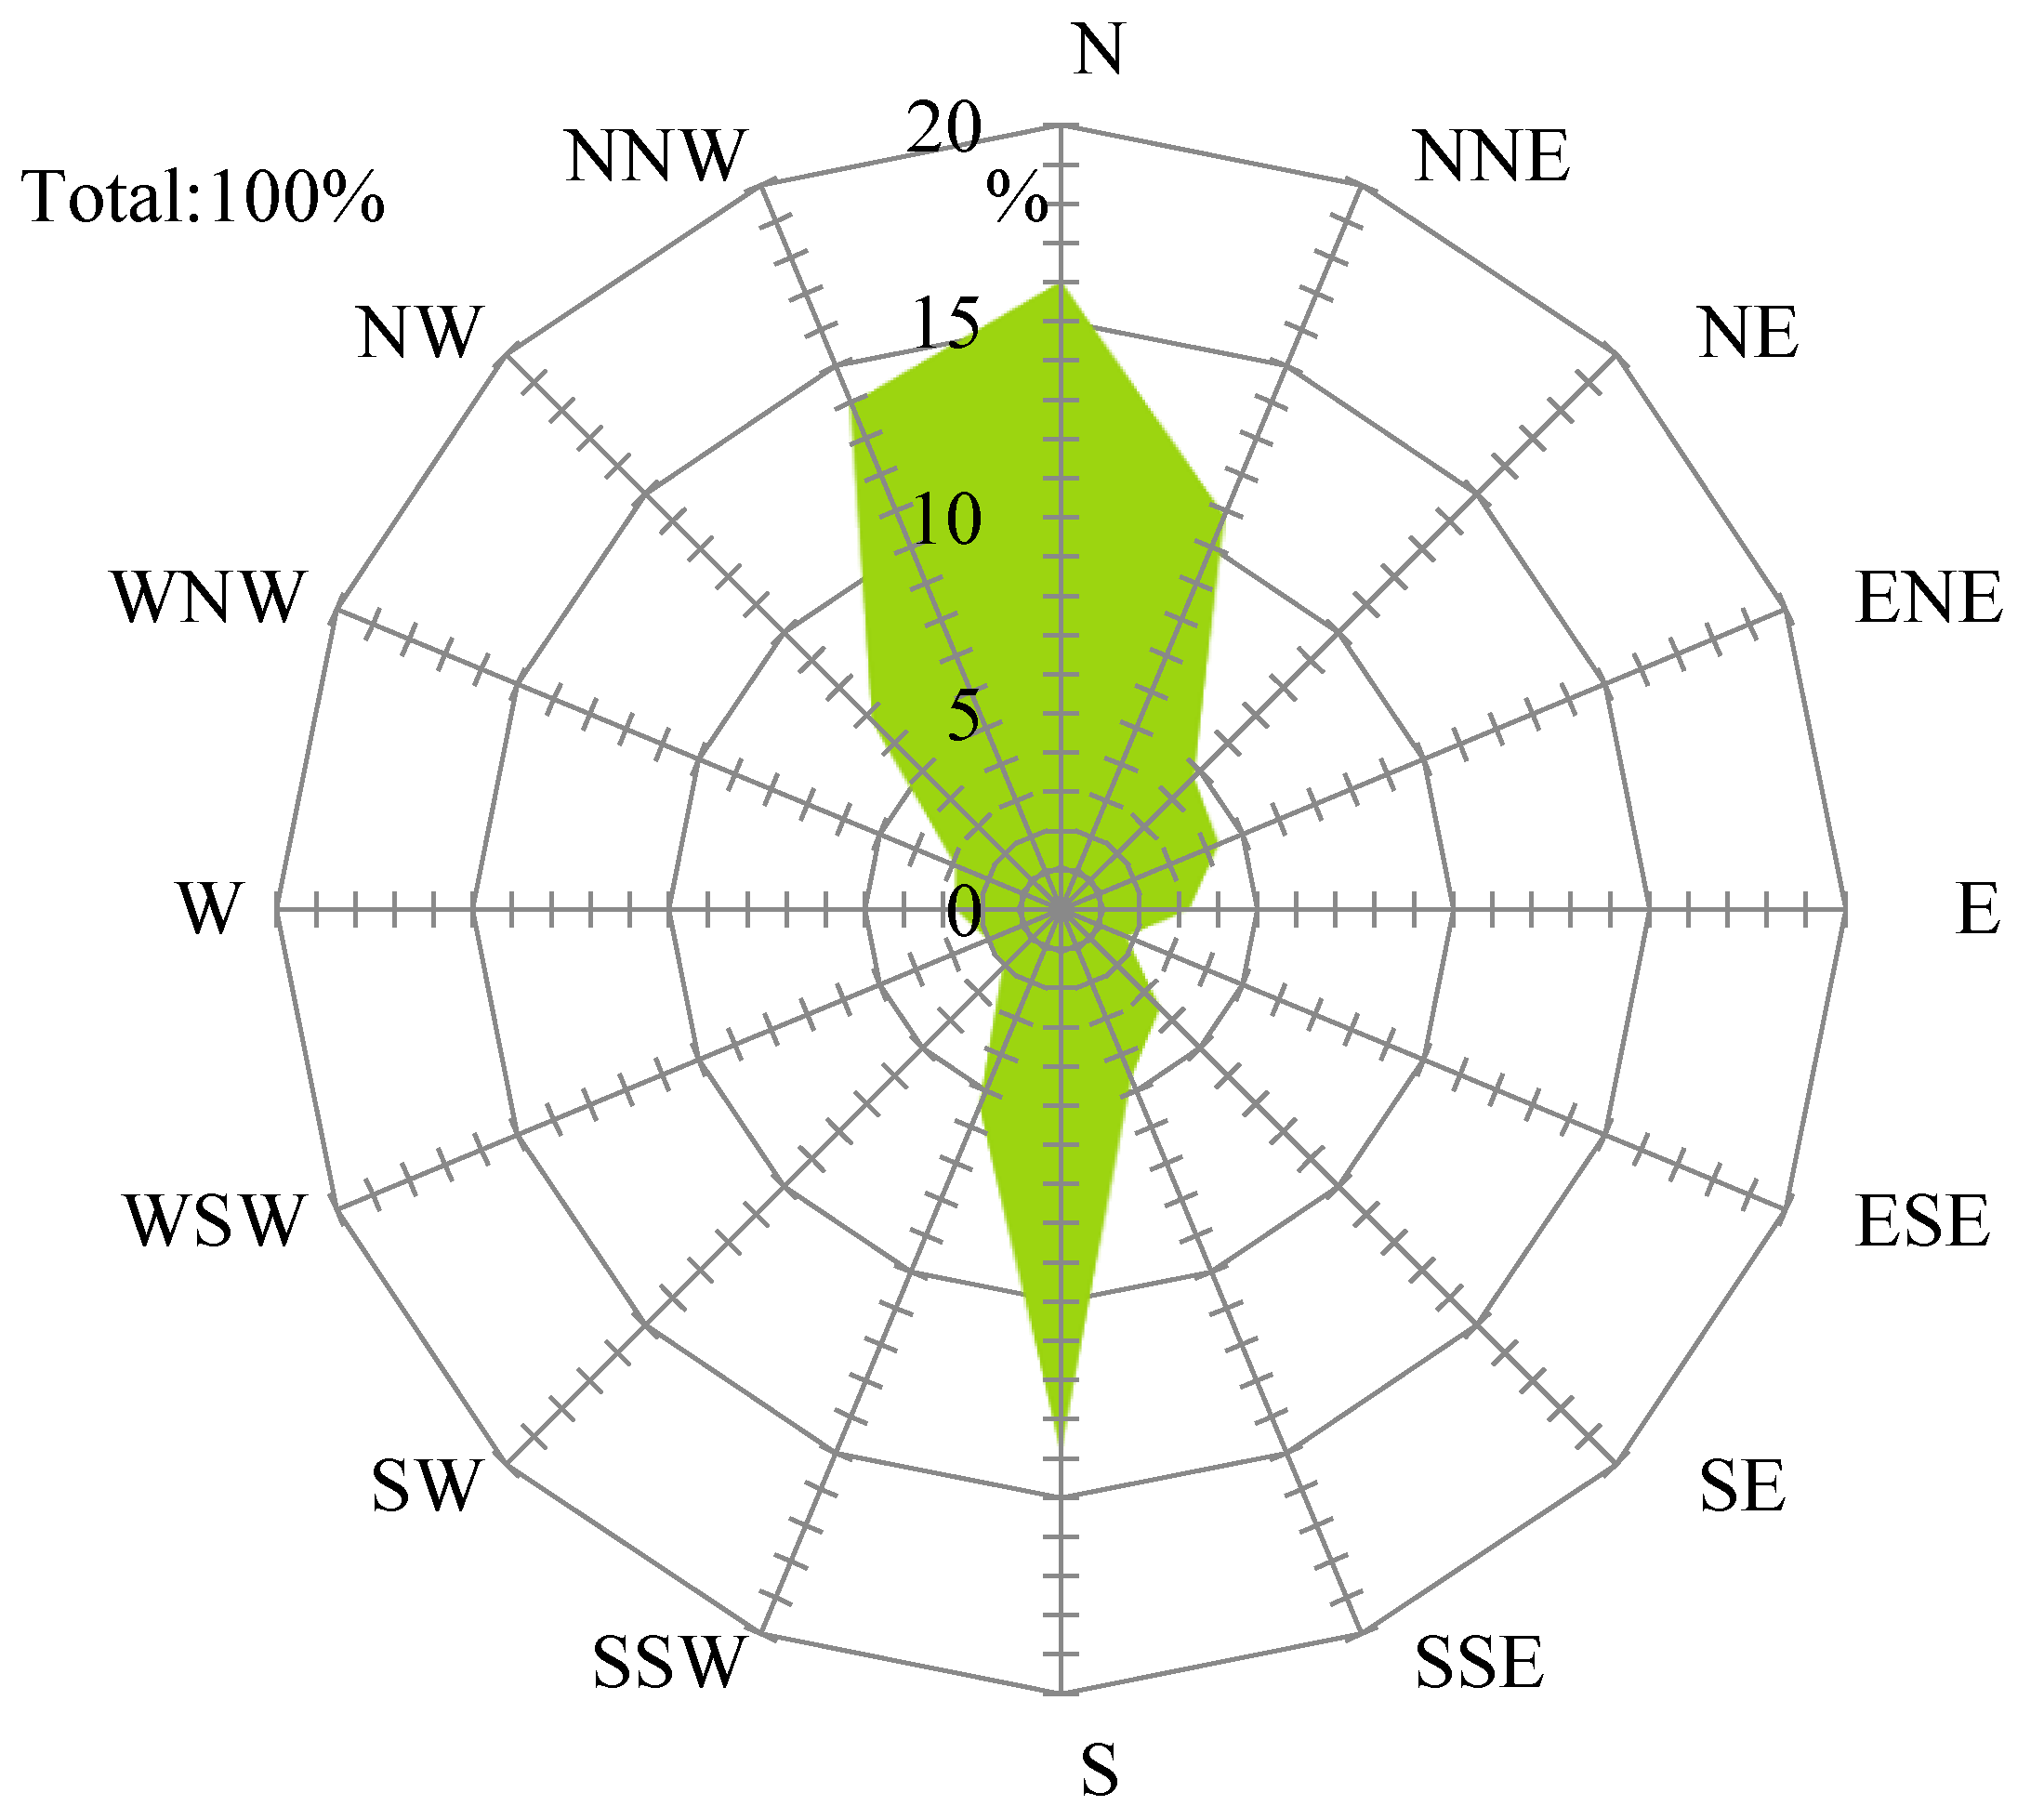
Table 1 and
Figure 9 show the results of wind direction observations conducted every day for 1 h at Musashino City 5th elementary school, approximately 670 m away from the area of Kichijoji village, and observations are given in terms of frequency [
25]. To obtain a stable and average wind direction frequency over a long period, the data were extracted from the average of observations made over 120 months from 2006 to 2015. The results show that during those 120 months, the wind blew most frequently from the north, followed by north-northwest, and then south. The results showed that 40.8% of the wind in the vicinity of Kichijoji village comes from a northerly direction, which is a mixture of north, north-northwest, and north-northeast winds. Furthermore, 23.8% of the wind comes from the southerly direction, which is a mixture of south, south-southeast, and south-southwest winds. Thus, 64.6% of the wind blew from the northerly or southerly direction throughout each year.
As mentioned above, the CFD analysis showed that the layout of the woodland in Kichijoji village had a great windbreak effect against the north and south winds in the field of Kichijoji village. In other words, the simulation results and the actual observation results agreed, providing numerical proof that the woodland in Kichijoji village was arranged to be useful for protection from the wind.
5. Conclusions
This study quantitatively demonstrated the wind reduction effect of woodland in Kichijoji village, a typical shinden village in Japan. The results showed that woodland was highly effective for reducing the speed of wind from the south and north, which are traditionally feared.
In addition, observations of wind direction in recent years seem to indicate that winds from the north and south are the most frequent throughout the year; thus, people in early-modern times consciously or unconsciously planted woodlands considering the path of the wind.
The permeability of trees to wind was not considered in this study. The species of trees planted in the field were not identified; therefore, permeability was not taken into account. However, it is thought that tree permeability to wind varies depending on the species of tree planted. This will be considered in the future.
Furthermore, because the analysis used a large rectangular parallelepiped 8 km from east to west, 8 km from north to south, and 125 m in height, it was not possible to obtain simulation results with sufficient consideration of topographical conditions. This is due to limitations in the size of the data and the performance of computers carrying out massive amounts of computation. In Kichijoji village, this was considered a small problem because the difference in elevation within the area is less than 10 m. However, for the simulation of rough terrain, it would be essential to include topographical conditions. In the future, when such simulations are carried out in other regions, a change in the data format and improved performance of the computer used will be necessary.
Author Contributions
The author took part in the entire research process.
Funding
The Japan Society for the Promotion of Science partially funded this research (19J10769).
Acknowledgments
The author would like to thank Asano Satoshi from Lake Biwa Environmental Research Institute, Kiyomi Yonesaki from Musashino Historical Museum, and Ogata Noboru from Kyoto University for constructive discussions. The author would also like to thank Ryo Araya CEO of Environmental GIS Laboratory Co., Ltd. for technical support.
Conflicts of Interest
The author declares no conflicts of interest.
References
- Butlin, R.A. Historical Geography: Through the Gates of Space and Time; Arnold, E., Ed.; Routledge: New York, NY, USA, 1993. [Google Scholar]
- Kikuchi, T. Shindenkaihatsu; Kokon Shoin: Chiyoda, Tokyo, Japan, 1977. [Google Scholar]
- Yajima, N. Shurakuchirigaku; Kokon Shoin: Chiyoda, Tokyo, Japan, 1956. [Google Scholar]
- Suizu, I. Die Gewannflur im Vergleich mit anderen Flurformen. Mem. Fac. Lett. Kyoto Univ. 1966, 1–154. [Google Scholar]
- Komeie, T. The Early Modern Rural Landscape; Kinda, A., Ed.; Kyoto University Press: Sakyo, Kyoto, Japan, 2010; pp. 137–161. [Google Scholar]
- Yazawa, T. On the Distribution of Wind-Mantles in the Vicinity of Tôkyô. Geogr. Rev. Jpn. 1936, 12, 248–268. [Google Scholar] [CrossRef]
- Ito, R. Types and Functions of “Yasiki-mori” (forest in farmyard) on the Musasino Upland, Western Suburb of Tokyo (2). Geogr. Rev. Jpn. 1939, 15, 672–685. [Google Scholar] [CrossRef]
- Ito, R. Types and Function of “yasiki-mori” (Forest in the Farmyard) in the western Suburbs of Tokyo. Geogr. Rev. Jpn. 1939, 15, 624–642. [Google Scholar] [CrossRef]
- Furukawa, K.; Ikeda, K. Shishin Chimeiroku Shijinja Kakuki; Arimine Shoten: Nerima, Tokyo, Japan, 1976. [Google Scholar]
- House of Ogawa. Ogawa Village Map; House of Ogawa: Kodaira, Tokyo, Japan, 1705. [Google Scholar]
- Musashino City History Editorial Committee. Musashino Shishi. Zoku(Shiryō)(1); Musashino City: Musashino, Tokyo, Japan, 1968. [Google Scholar]
- Kikuchi, R. Diurnal Change of Air Temperature and Wind Velocity in and around a Windbreak Forest of Farmhouse in Winter. Q. J. Geogr. 1999, 51, 306–315. [Google Scholar] [CrossRef]
- Hashida, S.; Shimazaki, Y.; Yoshida, A. Field Investigation on Thermal Environment and Human Thermal Sensation in Premises Woods in Urban Area. J. Heat Isl. Inst. Int. 2014, 9, 2. [Google Scholar]
- Tsunoda, K. Rivers and Hydrological-Environment of Musashino-Upland in Tokyo Metro. Komazawa J. Geogr. 2015, 51, 35–58. [Google Scholar]
- Nakamura, K.; Koike, K.; Takeuchi, K.; Ikeguchi, H. Kanto; Iwanami Shoten: Tokyo, Japan, 1994. [Google Scholar]
- Kikuchi, T. Zoku Shindenkaihatsu: Jireihen; Kokon Shoin: Chiyoda, Tokyo, Japan, 1986. [Google Scholar]
- Kikuchi, T. Upward tendency of the land productivity in Shinden of a dry field farming, at Musashino, and its connected matters. Jpn. J. Hum. Geogr. 1956, 8, 91–103. [Google Scholar] [CrossRef]
- Musashino City History Editorial Committee. Musashino Shishi; Musashino City: Musashino, Tokyo, Japan, 1970. [Google Scholar]
- Musashino City. The Demographic, Social and Economic Conditions in a City Statistics. Available online: http://www.city.musashino.lg.jp/shisei_joho/musashino_profile/jinkotokei/index.html (accessed on 1 September 2018).
- Musashino Historical Museum. Heisei Nijunananendo Daisankai Kikakuten Musashinoshi to Rekishi to Bunkazai Warabito Kara Gaisenmom Made; Musashino City: Musashino, Tokyo, Japan, 2015. [Google Scholar]
- Odauchi, M. Teito to Kinkou; Ookura Kenkyujo: Koishikawa, Tokyo, Japan, 1918. [Google Scholar]
- Souma, N.; Inoue, T. Medemiru Mitaka Musashino no Hyakunenn; Kyoudo Shyppanshya: Matsumoto, Nagano, Japan, 2004; 146p. [Google Scholar]
- Uchida, T. Validation Testing of the Prediction Accuracy of the Numerical Wind Synopsis Prediction Technique RIAM-COMPACT for the Case of the Bolund Experiment: Comparison against a Wind-Tunnel Experiment. Rep. Res. Inst. Appl. Mech. Kyushu Univ. 2014, 7–14. [Google Scholar] [CrossRef]
- Uchida, T.; Li, G. Comparison of RANS and LES in the Prediction of Airflow Field over Steep Complex Terrain. Open J. Fluid Dyn. 2018, 8, 286–307. [Google Scholar] [CrossRef] [Green Version]
- Tokyo Metropolitan Government Bureau of Environment. Air Pollution Measurement Results. Available online: http://www.kankyo.metro.tokyo.jp/air/index.html (accessed on 23 September 2018).
© 2019 by the author. Licensee MDPI, Basel, Switzerland. This article is an open access article distributed under the terms and conditions of the Creative Commons Attribution (CC BY) license (http://creativecommons.org/licenses/by/4.0/).


