Satellite-Based Bathymetric Modeling Using a Wavelet Network Model


1
Department of Hydrographic Surveying, Faculty of Maritime Studies, King Abdulaziz University, Jeddah 21589, Saudi Arabia
2
Engineering Department of Public Works, Faculty of Engineering, Mansoura University, Mansoura 35516, Egypt
ISPRS Int. J. Geo-Inf. 2019, 8(9), 405; https://0-doi-org.brum.beds.ac.uk/10.3390/ijgi8090405
Submission received: 7 August 2019
/
Revised: 8 September 2019
/
Accepted: 9 September 2019
/
Published: 12 September 2019
(This article belongs to the Special Issue Artificial Intelligence Solutions for Geospatial Analysis: An Integrated Approach)
Abstract
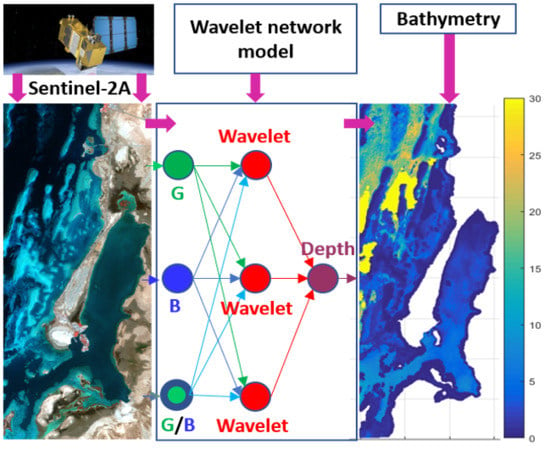
:Accurate bathymetric modeling is required for safe maritime navigation in shallow waters as well as for other marine operations. Traditionally, bathymetric modeling is commonly carried out using linear models, such as the Stumpf method. Linear methods are developed to derive bathymetry using the strong linear correlation between the grey values of satellite imagery visible bands and the water depth where the energy of these visible bands, received at the satellite sensor, is inversely proportional to the depth of water. However, without satisfying homogeneity of the seafloor topography, this linear method fails. The current state-of-the-art is represented by artificial neural network (ANN) models, which were developed using a non-linear, static modeling function. However, more accurate modeling can be achieved using a highly non-linear, dynamic modeling function. This paper investigates a highly non-linear wavelet network model for accurate satellite-based bathymetric modeling with dynamic non-linear wavelet activation function that has been proven to be a valuable modeling method for many applications. Freely available Level-1C satellite imagery from the Sentinel-2A satellite was employed to develop and justify the proposed wavelet network model. The top-of-atmosphere spectral reflectance values for the multispectral bands were employed to establish the wavelet network model. It is shown that the root-mean-squared (RMS) error of the developed wavelet network model was about 1.82 m, and the correlation between the wavelet network model depth estimate and “truth” nautical chart depths was about 95%, on average. To further justify the proposed model, a comparison was made among the developed, highly non-linear wavelet network method, the Stumpf log-ratio method, and the ANN method. It is concluded that the developed, highly non-linear wavelet network model is superior to the Stumpf log-ratio method by about 37% and outperforms the ANN model by about 21%, on average, on the basis of the RMS errors. Also, the accuracy of the bathymetry-derived wavelet network model was evaluated on the basis of the International Hydrographic Organization (IHO)’s standards for all survey orders. It is shown that the accuracy of the bathymetry derived from the wavelet network model does not meet the IHO’s standards for all survey orders; however, the wavelet network model can still be employed as an accurate and powerful tool for survey planning when conducting hydrographic surveys for new, shallow water areas.
1. Introduction
Accurate bathymetric modeling is required for safe marine navigation in shallow waters as well as for other marine operations. Satellite-based bathymetric modeling has been investigated by many researchers [1,2,3,4,5,6,7,8,9]. For shallow water, inexpensive bathymetric modeling can be developed from satellite multispectral imagery, such as Landsat-8 and Sentinel-2 imagery, which is available free-of-charge. The importance of multispectral imagery is that it can be employed to create a continuous bathymetric map from a few sparse sounding depths collected in the area under consideration and can be considered as a low-cost bathymetric modeling technique. Traditionally, bathymetric modeling is commonly carried out using the Lyzenga [10,11] or the Stumpf method [1].
The Lyzenga method is considered as a linear bands model function of main visible bands (red, green, and blue) that was developed on the basis of the assumption that the imagery properties do not change in the spatial domain [10,11]. However, in reality, the imagery properties vary to some extent in the spatial domain. It should be noted that these changes in imagery properties can be classified as linear and non-linear changes. On the other hand, the Stumpf method is considered as a linear ratio model for satellite-based bathymetric modeling that was developed to improve bathymetric modeling by using the strong correlation between the ratio of two bands and the water depth [1]. However, the Stumpf method does not consider the contribution of the other spectral bands and hence provides insufficient accuracy. It is worth noting that for most water areas, the red and near-infrared spectral bands are not useful; however, the near-infrared band is only employed to mask out the non-water areas.
In practice, the Lyzenga and Stumpf methods can be considered as linear models and hence can only account for the imagery properties associated with linear changes in a spatial domain. Therefore, a more accurate model is required to consider the non-linear properties of the satellite imagery employed in satellite-based bathymetric modeling. However, without satisfying homogeneity of the seafloor topography, this linear method fails. The current state-of-the-art, non-linear, artificial neural network (ANN) was developed and investigated by many researchers for accurate, satellite-based, bathymetric modeling [2]. The developed, non-linear, ANN model outperformed the traditional linear model. However, all ANN models are mainly developed using a static activation function such as a hypertangent function or a log-sigmoid function, and more accurate modeling can be achieved using a highly non-linear, dynamic activation function. The main objective of this paper was to develop a highly non-linear wavelet network model for accurate satellite-based bathymetric modeling. The wavelet network model is a highly non-linear model with a dynamic wavelet activation function that is successfully applied in many applications for accurate modeling (see Zhang [12], Adeli and Samant [13], and El-Diasty and Al-Harbi [14] for more details). Freely available Level-1C satellite multispectral imagery from Sentinel-2A multispectral instrument (MSI) was employed to develop and justify the proposed wavelet network model. The top-of-atmosphere (TOA) spectral reflectance values for the multispectral bands were employed to establish the wavelet network model. To further justify the proposed model, a comparison was made among the proposed highly non-linear wavelet network method for accurate bathymetric modeling, the most common traditional Stumpf log-ratio method, and the current state-of-the-art ANN model. This research is significant as it provides important information about the performance accuracy of the highly non-linear wavelet network model for satellite-derived bathymetric modeling and investigates whether it can meet the International Hydrographic Organization (IHO)’s standards for hydrographic surveying application.
2. Traditional Satellite-Derived Bathymetric Linear Modeling
Traditionally, satellite-derived bathymetric modeling is commonly carried out using linear models such as the Lyzenga and the Stumpf methods. The linear methods are developed to derive the bathymetry using the strong linear correlation between the satellite imagery visible bands and the water depth. The practical Stumpf log-ratio method is commonly employed and can be derived using the following log-ratio model of the linear equation [1]:
where m0 and m1 are the unknown parameters, RG_band is the bottom-of-atmosphere (BOA) reflectance value of the green band, and RB_band is the reflectance value of the blue band.
3. Wavelet Network Model
The wavelet network is an efficient method for data modeling; Zhang and Benveniste [15] developed the algorithms of the wavelet network methodology. Afterward, several researchers extended their studies to improve the wavelet network procedure for parameter estimation and learning algorithms [12,16]. Also, the application of the wavelet network in modeling and prediction has been implemented in several studies [13,14,17]. It is worth noting that no studies have implemented wavelet networks in satellite-derived bathymetric modeling. The wavelet network model is a highly non-linear model that proved to be an accurate prediction model for many applications. The satellite-derived bathymetric model is developed using the wavelet network model, with an output (depth) computed as [14]:
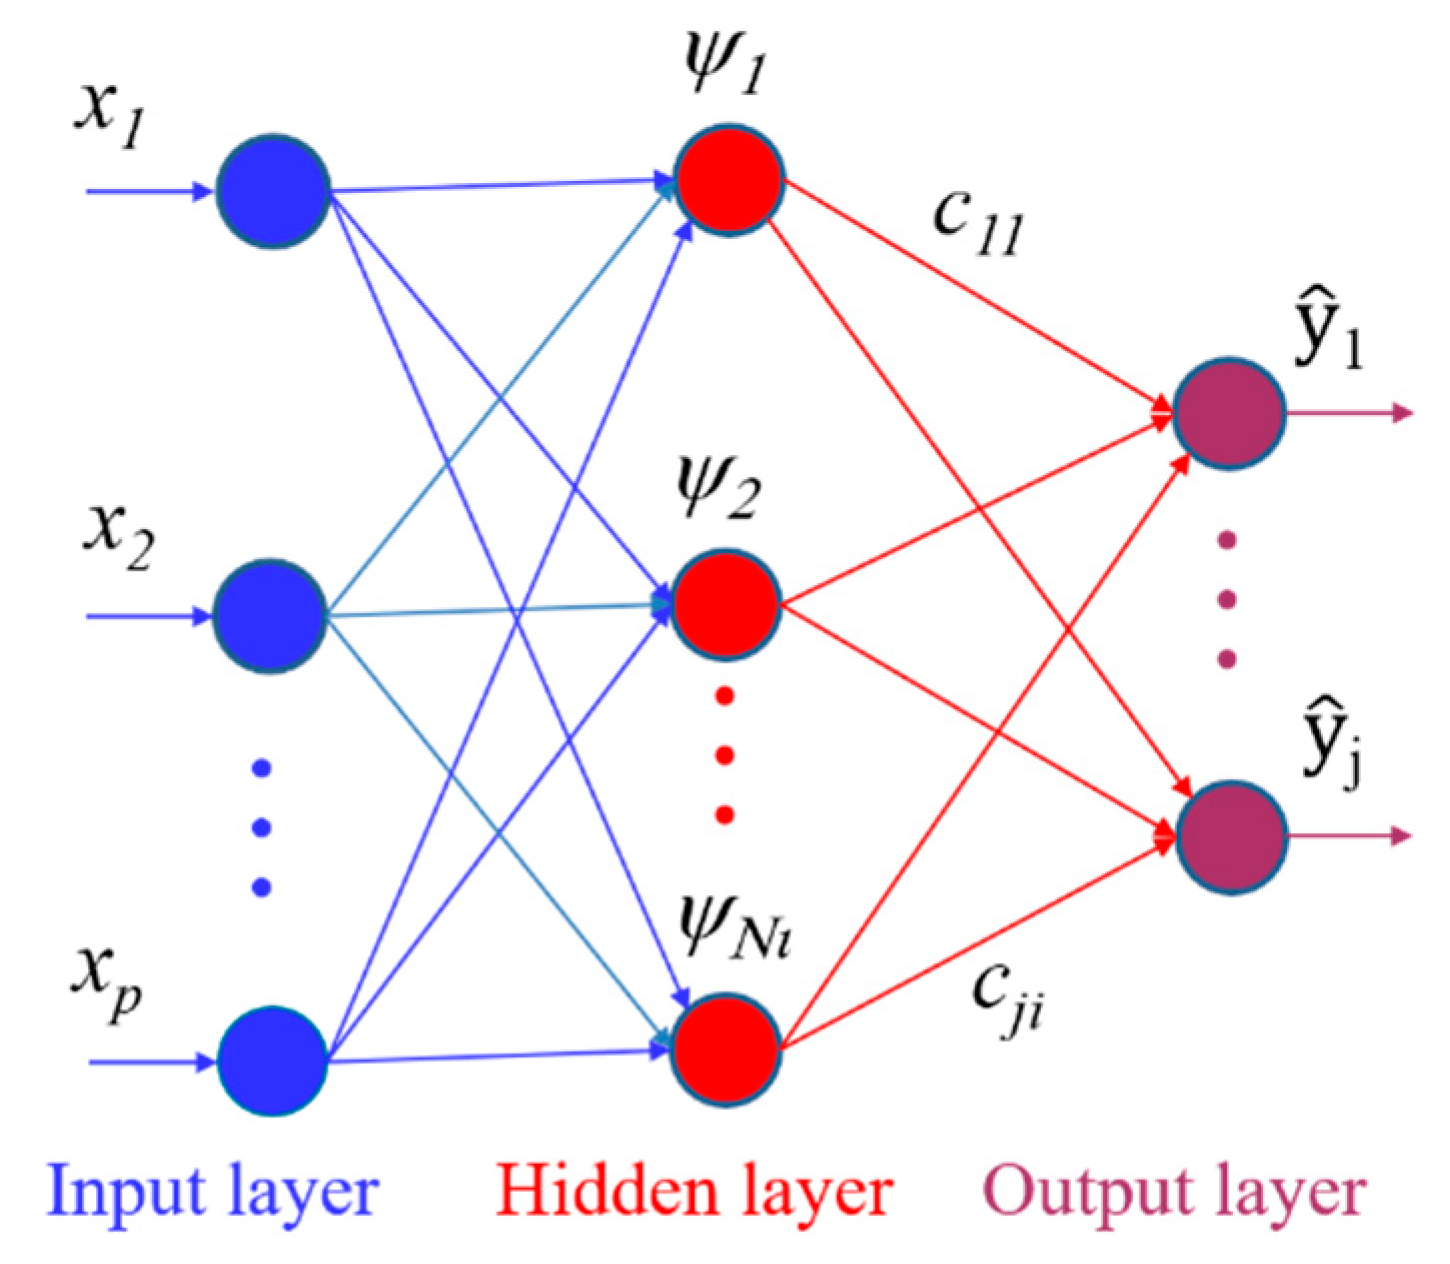
where is the input neuron, are coefficient variables, are dilation variables, are translation variables, and is a wavelet function. Figure 1 shows the wavelet network structure. The wavelet network consists of an input vector of Np values, a layer of Ni weighted wavelets, and an output vector of Nj output neurons. The wavelet network parameters (, , and ) can be estimated by a backpropagation learning method. If Nj is the number of outputs, is the desired output value, and is the network output estimated from Equation (2), then the wavelet network training objective is to minimize the error function E [18]:
The selection of the wavelet function depends on the application. There are several wavelet functions, such as Morlet, Shannon, and Mexican hat, which can be used to develop the wavelet network model. We used the Mexican hat in this paper to implement the proposed non-linear tide model. The Mexican hat wavelet function for any variable x is:
where , and is the order of the model. The Mexican hat wavelet function is known as the Laplacian operator and represents the second derivative of the Gaussian function [19]. The root-mean-squared (RMS) error is commonly used to evaluate the model performance. The RMS error can be computed as:
The structure of the wavelet network model is determined by empirical methods. The number of wavelet neurons can be determined by trying different architectures with different numbers of wavelet neurons to select the optimal number, on the basis of the lowest model error [14]. It should be noted that the dilation and transition properties of the wavelet function make the wavelet network a much more dynamic, flexible, robust, and promising methodology for highly non-linear satellite-based bathymetric modeling than the artificial neural network method.
The artificial neural network modeling algorithm is not presented in this paper. It contains a similar architecture to the wavelet network architecture but employs a static activation function, such as a hyper-tangent or log-sigmoid function, that does not contain any dynamic parameters and hence leads to a simple, “static”, non-linear model when compared with the wavelet network model. For more details about the artificial neural network, see Haykin [18].
4. Data Description and Methodology
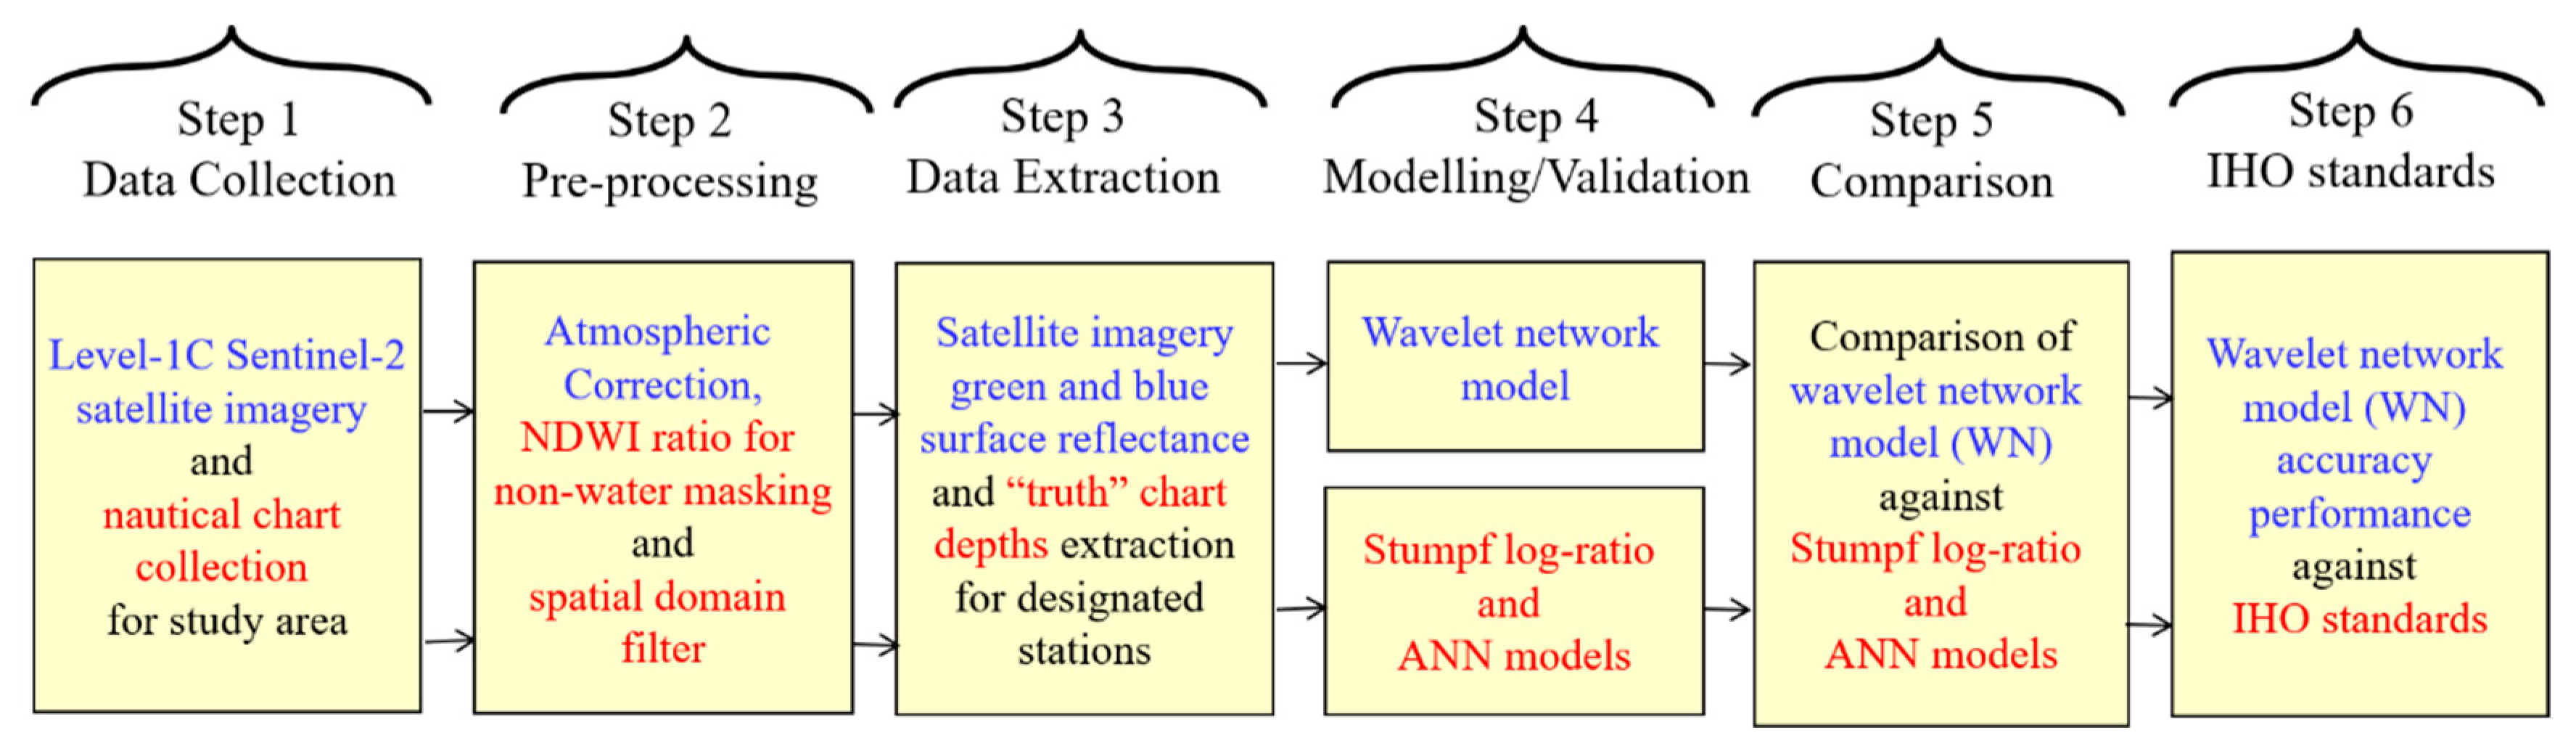
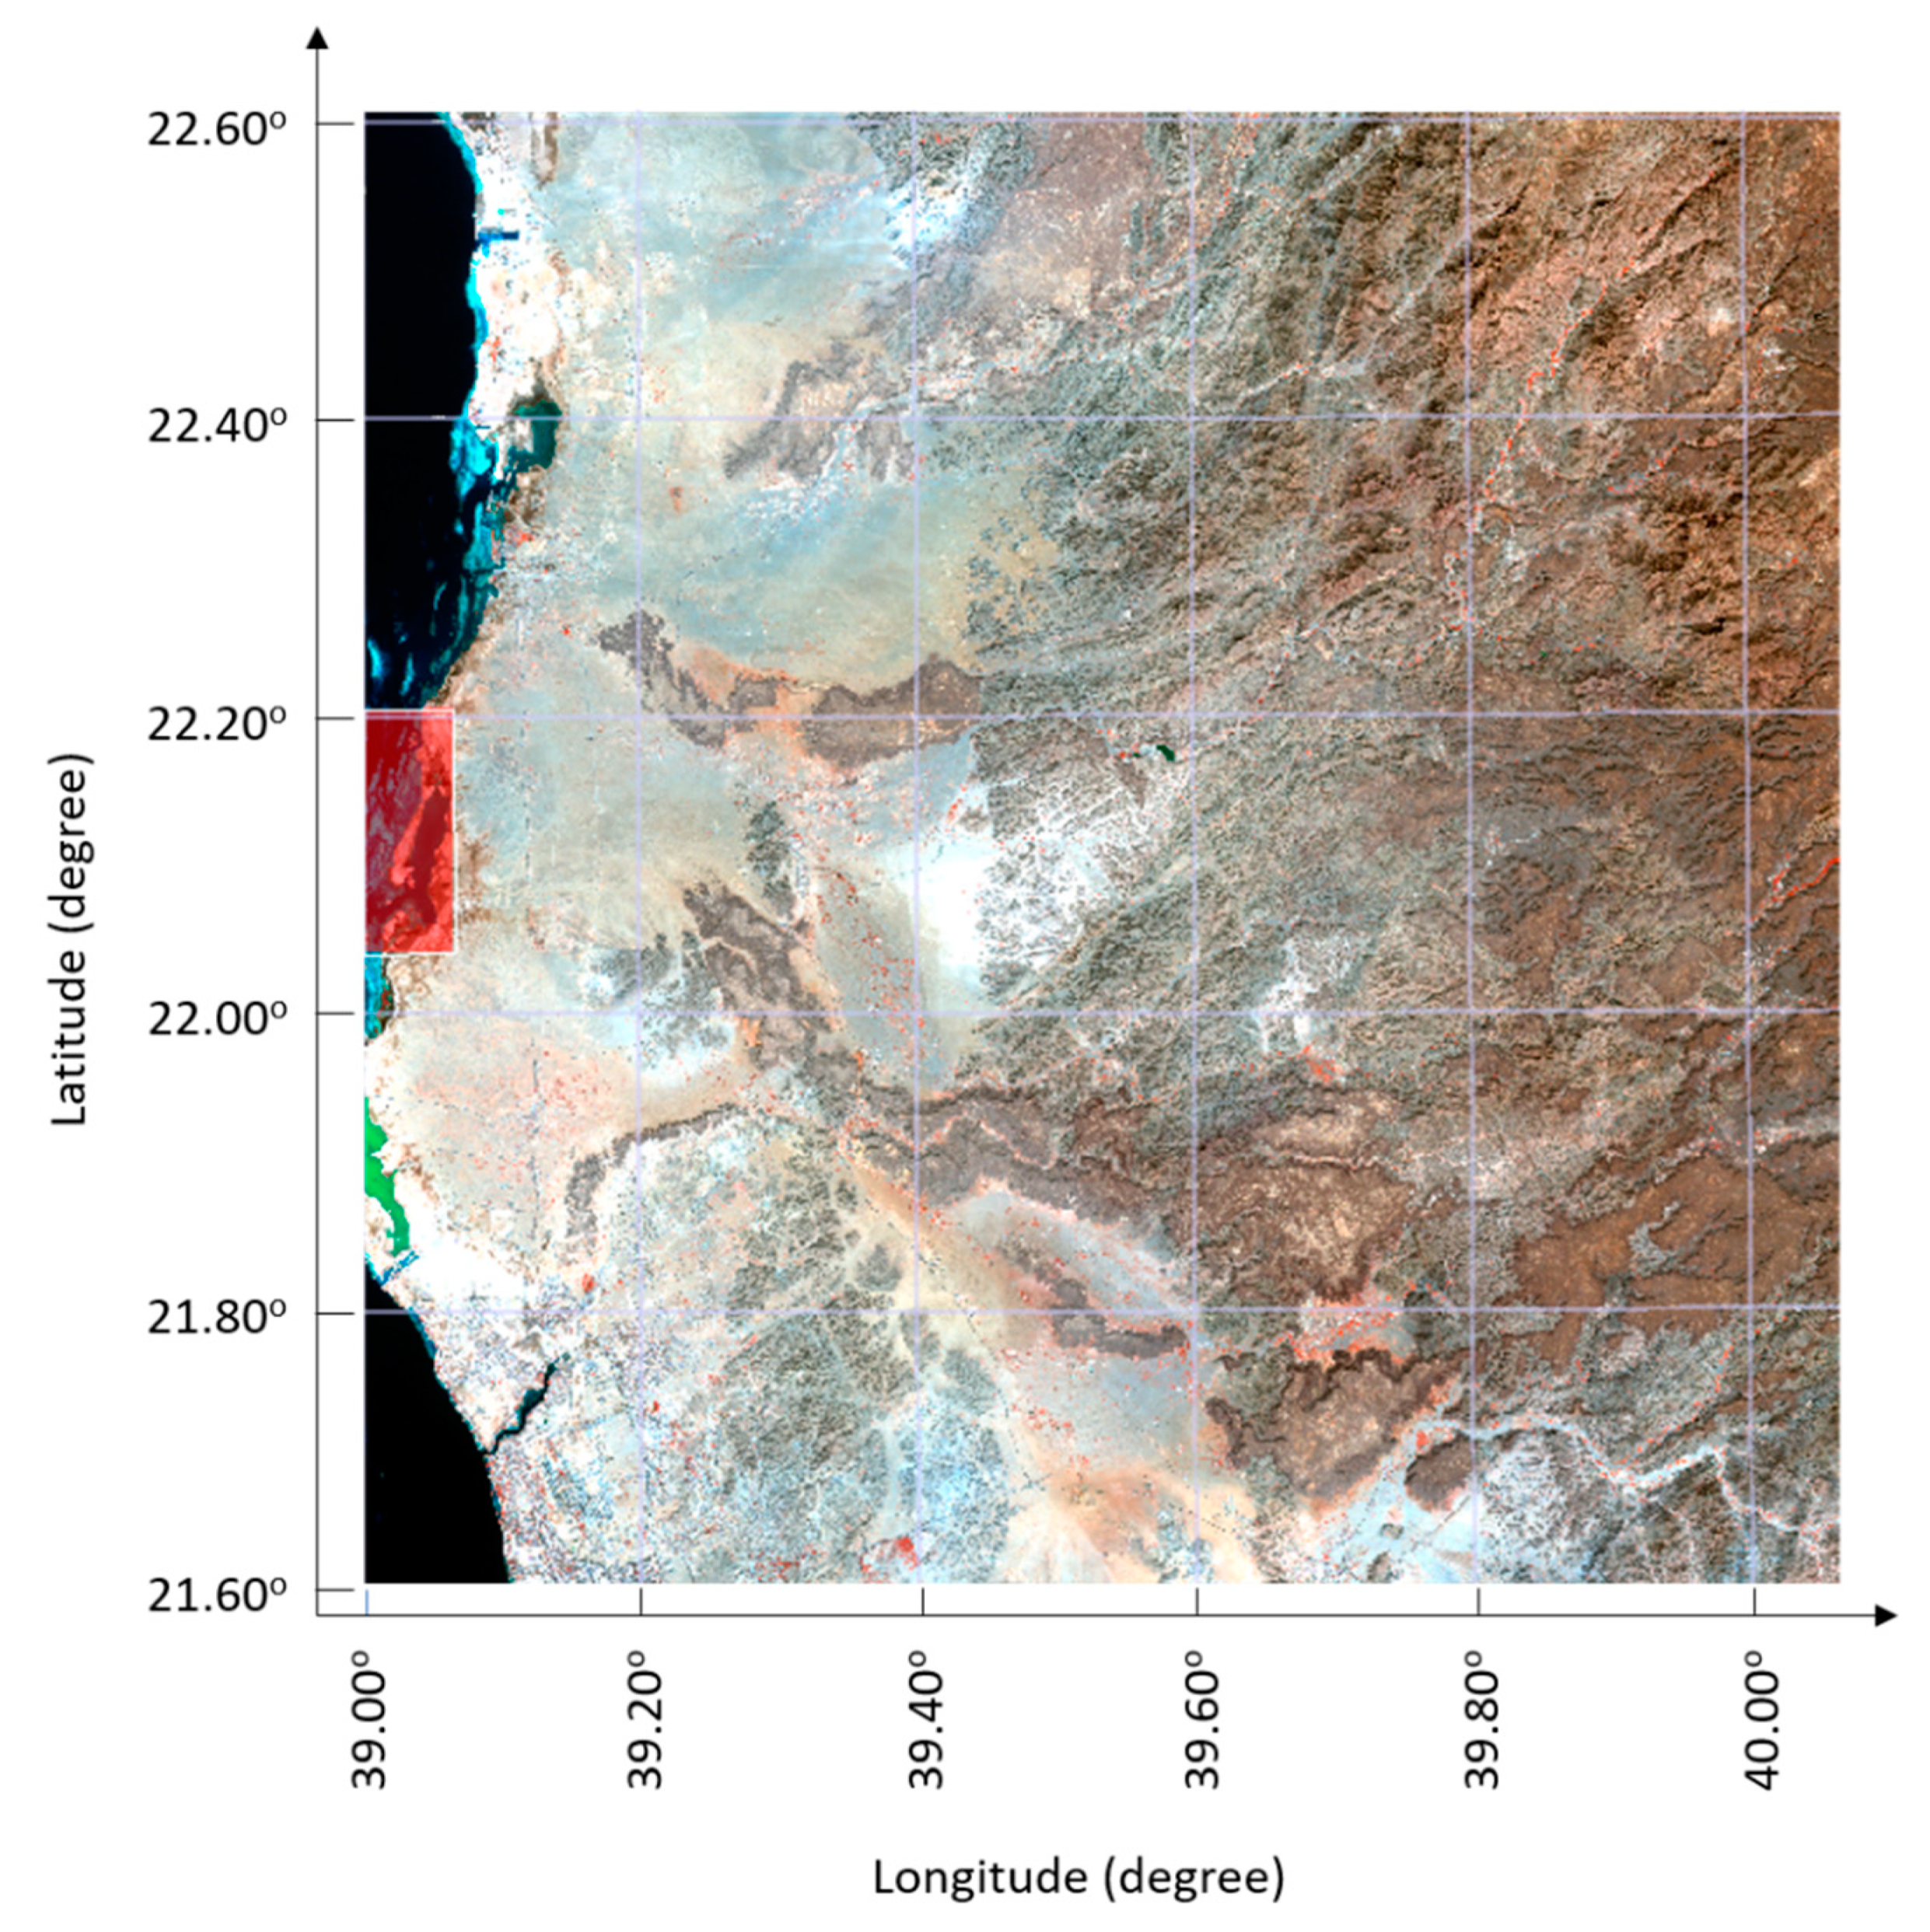
The study area was “Alqumriyah island”, located on the west side of Saudi Arabia along the Red Sea, whose depth ranges from 0 to 30 m and which consists of many onshore and offshore intertidal areas. The wavelet network model was developed using six major steps, as shown in Figure 2. The implementation of the six steps was performed through; (1) data collection, (2) pre-processing, (3) designated data extraction, (4) modeling and validation, (5) comparison with the traditional method and the current state-of-the-art ANN models, and (6) comparison with IHO standards. In the data collection step, freely available Level-1C satellite multispectral imagery from Sentinel-2 satellite, along with the “truth” nautical chart depths were collected for “Alqumriyah island”. The Sentinel-2A satellite is operated by the European Space Agency (ESA) and acquires 13 spectral bands ranging from visible and near-infrared (NIR) to shortwave infrared wavelengths [20]. In this paper, the spectral reflectance values for green, blue, and near-infrared bands were employed. It is worth noting that for most water areas, the red and NIR bands are not useful; however, the NIR band is only employed to mask out the non-water areas.
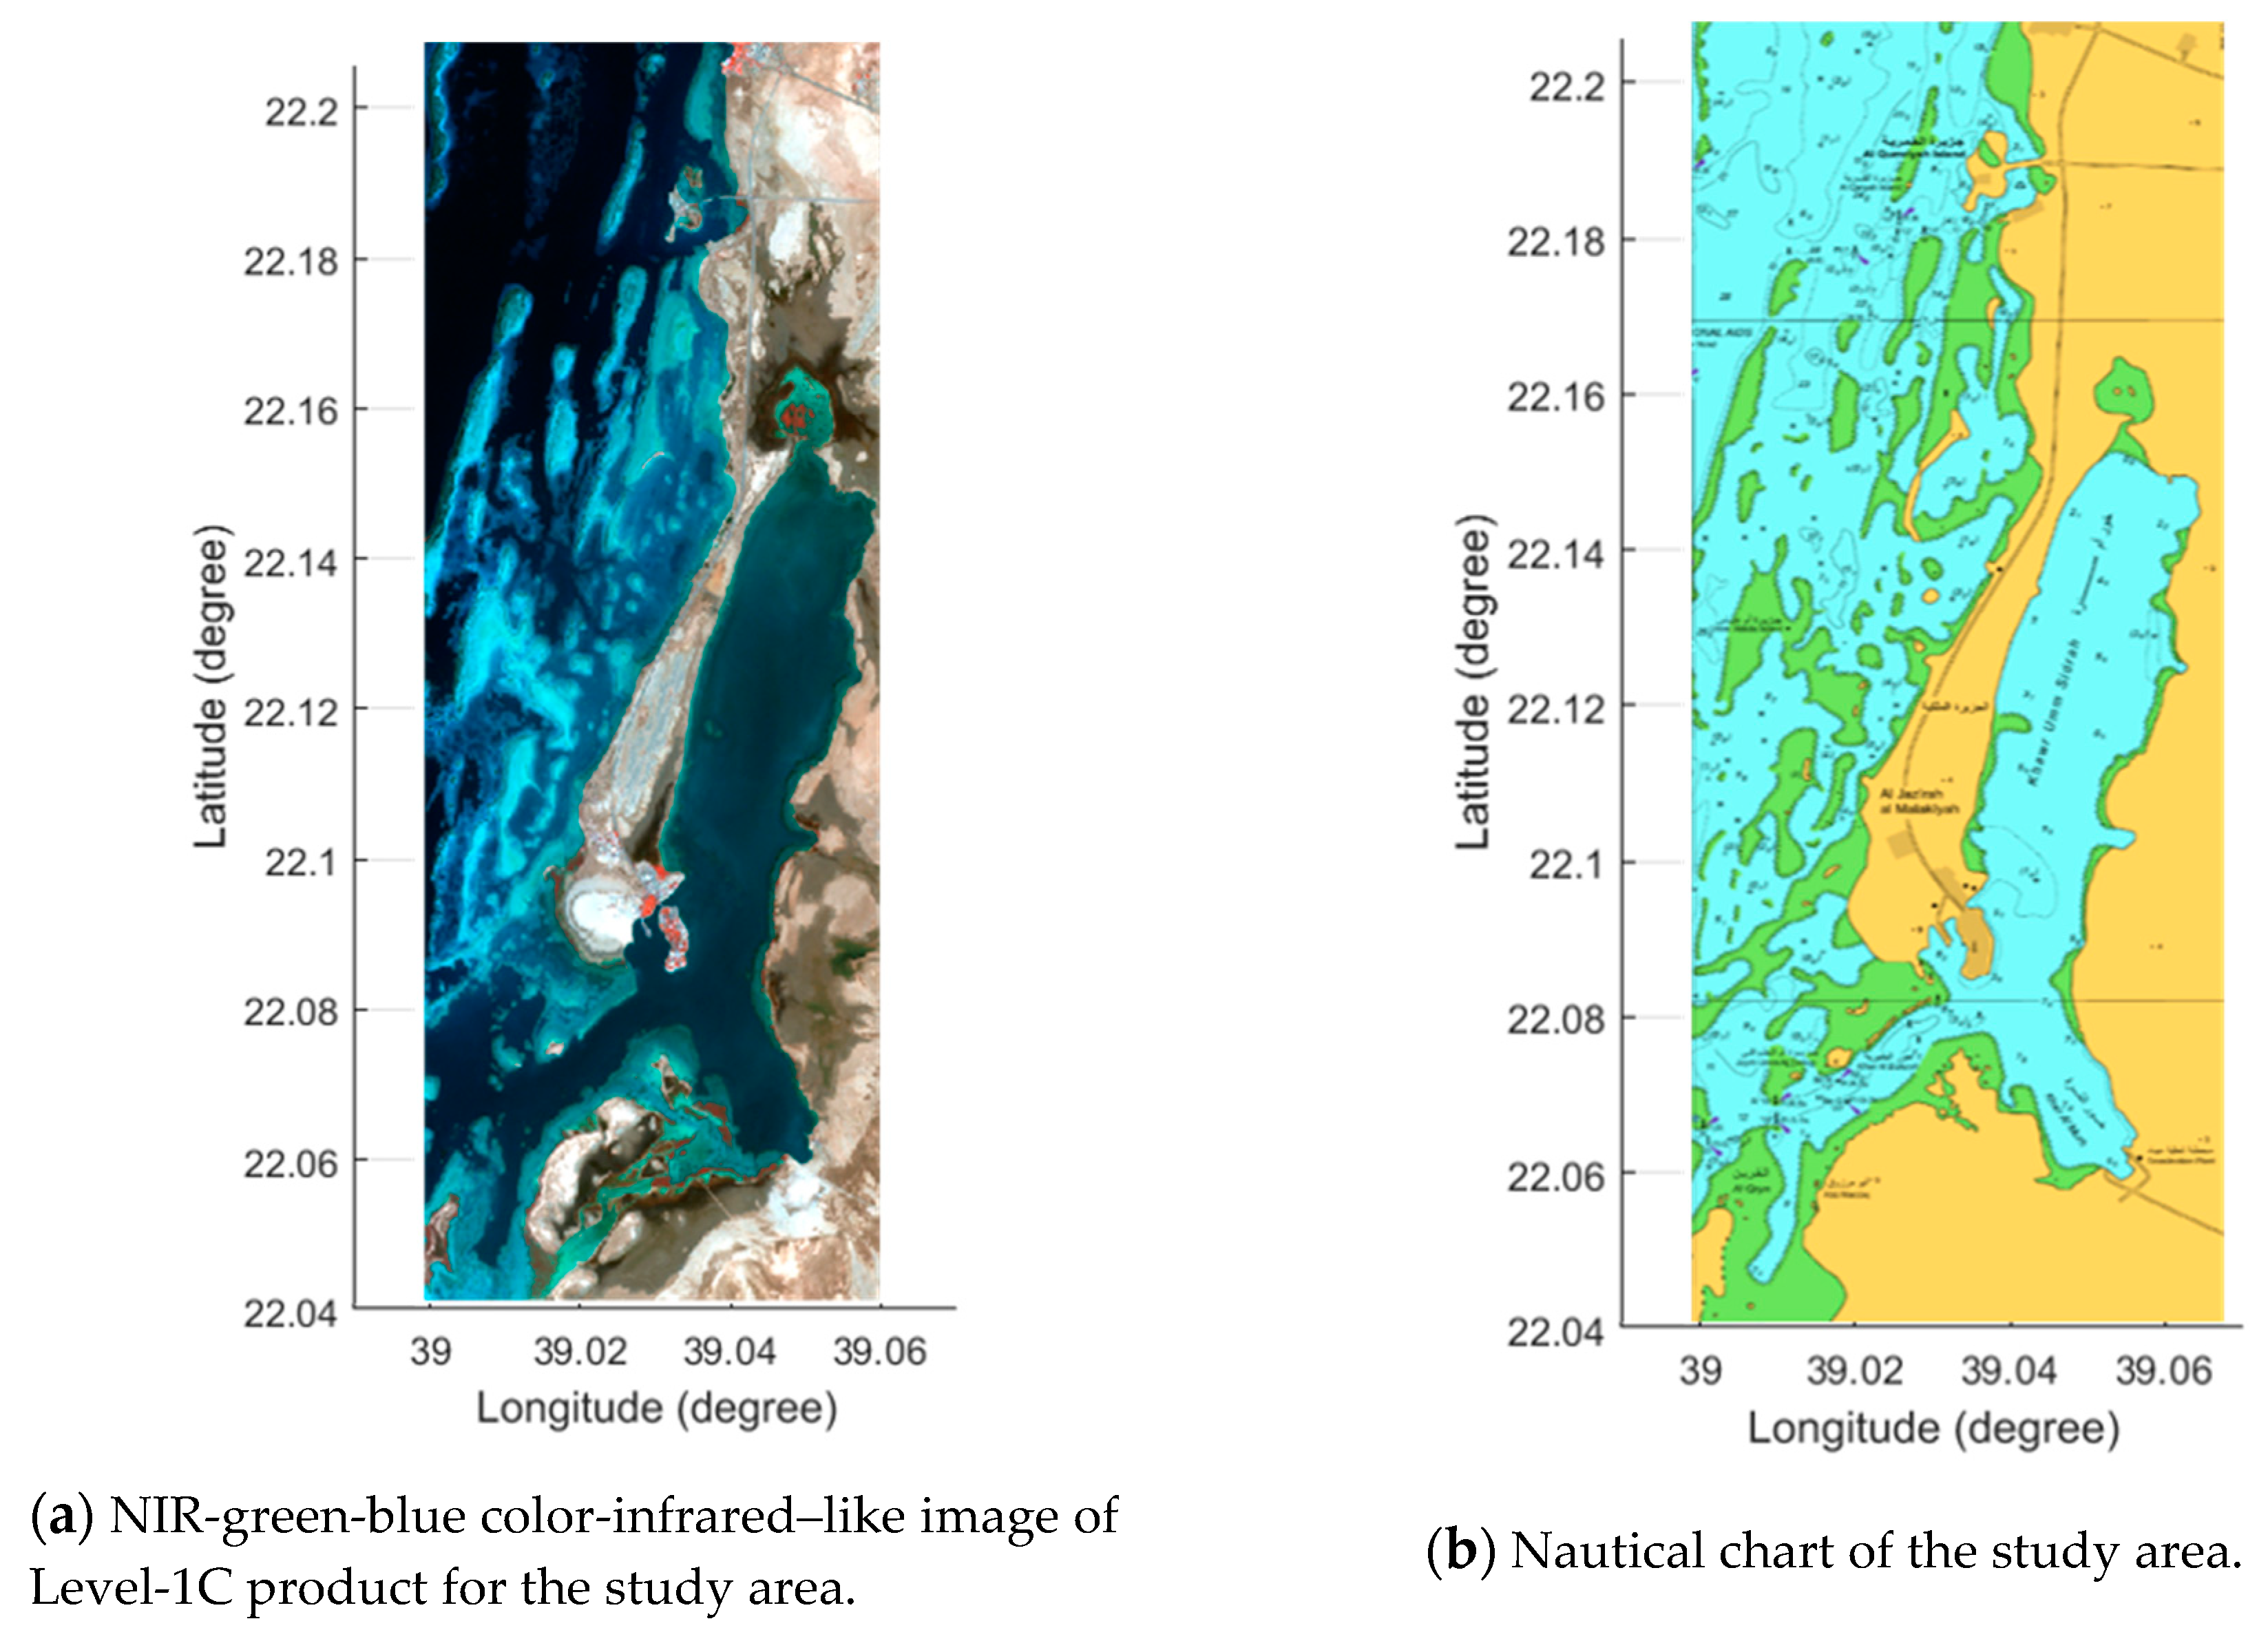
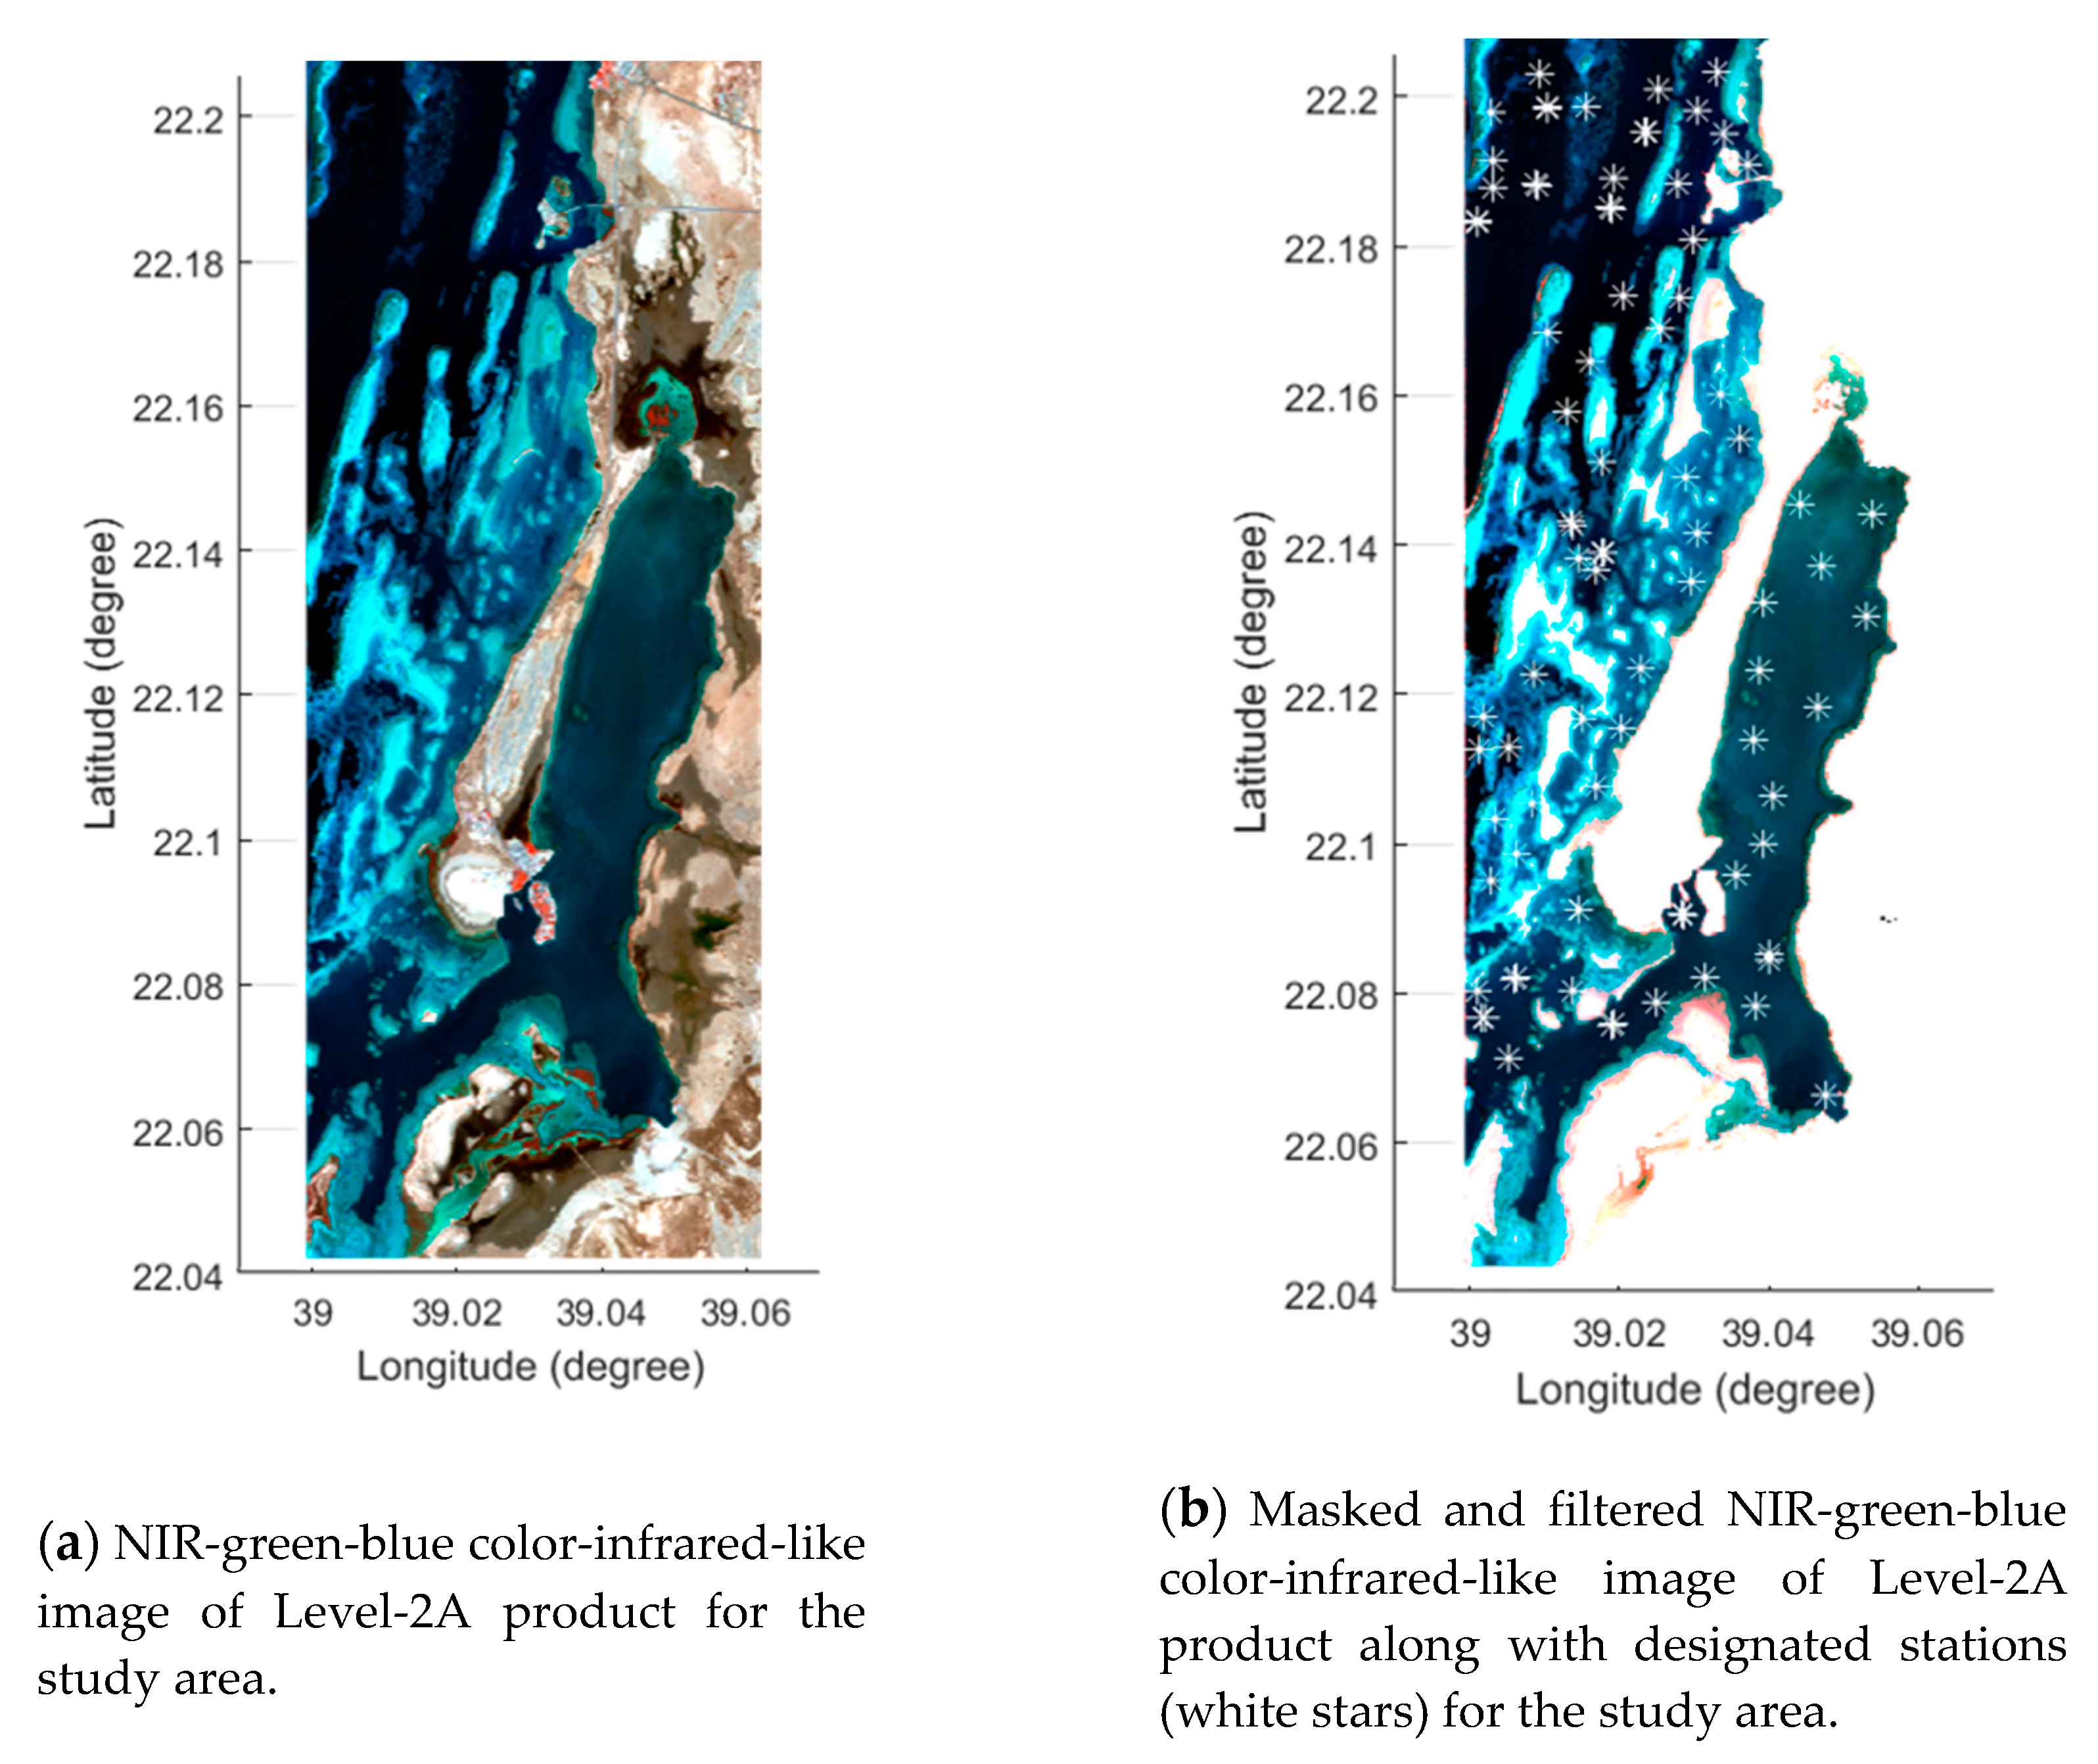
Figure 3 shows the NIR-green-blue color-infrared-like image of Level-1C product from Sentinel-2A satellite, with a size of 100 km × 100 km [20], along with the study area under investigation. Figure 4a,b show the NIR-green-blue color-infrared-like image of the collected TOA spectral reflectance values for the Level-1C product of Sentinel-2A multispectral bands [20] and the corresponding nautical chart of “Alqumriyah island” created by Saudi General Commission for Survey (GCS), respectively. In the pre-processing step, the TOA spectral reflectance values for the Level-1C product of Sentinel-2 multispectral bands are corrected for the atmospheric, terrain, and cirrus effects using Sentinel Application Platform (SNAP) software [21] with sen2cor toolbox [22] to provide BOA spectral reflectance values for the Level-2A product of Sentinel-2 multispectral bands. The sen2cor toolbox is a semi-empirical algorithm that integrates image-based retrievals with lookup tables (LUTs) from the LibRadtran model to remove atmospheric effects from MSI images [22]. Figure 5a shows the BOA spectral reflectance values for the Level-2A product derived from sen2cor toolbox. Consequently, in the pre-processing step, the non-water (dry-land) areas were masked out using the well-known normalized difference water index (NDWI) ratio technique, which has the ability to eliminate non-water classes from the scene [23] in the pre-processing step, using the NIR band and the green (G) band (NIR-G/NIR+G). Moreover, in order to enhance the image quality, the spatial domain median filter with 3 × 3 kernel size was applied to remove noise (speckle noise) in the pre-processing step. Figure 5b shows the masked and filtered NIR-green-blue color-infrared-like image of the Level-2A product. Then, in order to develop the wavelet network model and traditional Stumpf log-ratio model, a number of 90 collocated stations with known BOA spectral reflectance values for the Level-2A product of Sentinel-2 multispectral bands and corresponding “truth” nautical chart depths were extracted and are shown in Figure 5b (overlayed on the masked and filtered NIR-green-blue color-infrared-like image of Level-2A product in the data extraction step). Afterward, the proposed wavelet network model, the traditional Stumpf log-ratio model, and the current state-of-the-art ANN model were developed in the modeling and validation steps using the BOA spectral reflectance values of the green and blue bands. Then, a comparison of the developed wavelet network model with the traditional Stumpf log-ratio model and the current state-of-the-art ANN model was conducted. Finally, the accuracy performance of the developed wavelet network model was investigated to determine whether it can fulfill the IHO standards for hydrographic surveying.
5. Results and Discussion
In this section, the results of the developed, highly non-linear wavelet network model for satellite-derived bathymetry are investigated, and a comparison of the developed wavelet network model with the traditional Stumpf linear log-ratio method and the current state-of-the-art ANN method is conducted. The 90 collocated stations with the known BOA spectral reflectance values for the Level-2A product of Sentinel-2 multispectral bands and corresponding known “truth” nautical chart depths were used to implement the developed wavelet network model and compare the results with those of the traditional Stumpf log-ratio model. The structure of the wavelet network model was built using the MATLAB software [24]. The input parameters for the wavelet network model were three inputs that represented the BOA reflectance log-values of the green band, blue band, and the ratio of green/blue bands for the 90 collocated stations (three inputs for each model training epoch). However, the known “truth” nautical chart depths from the 90 collocated stations were considered as the desired output values (one output for each model training epoch). Many wavelet network models were carried out to optimize the structure of the model. It was found that the wavelet network model with the structure (3 inputs–3 wavelet neurons–1 output) provided the best solution with the lowest RMS error.
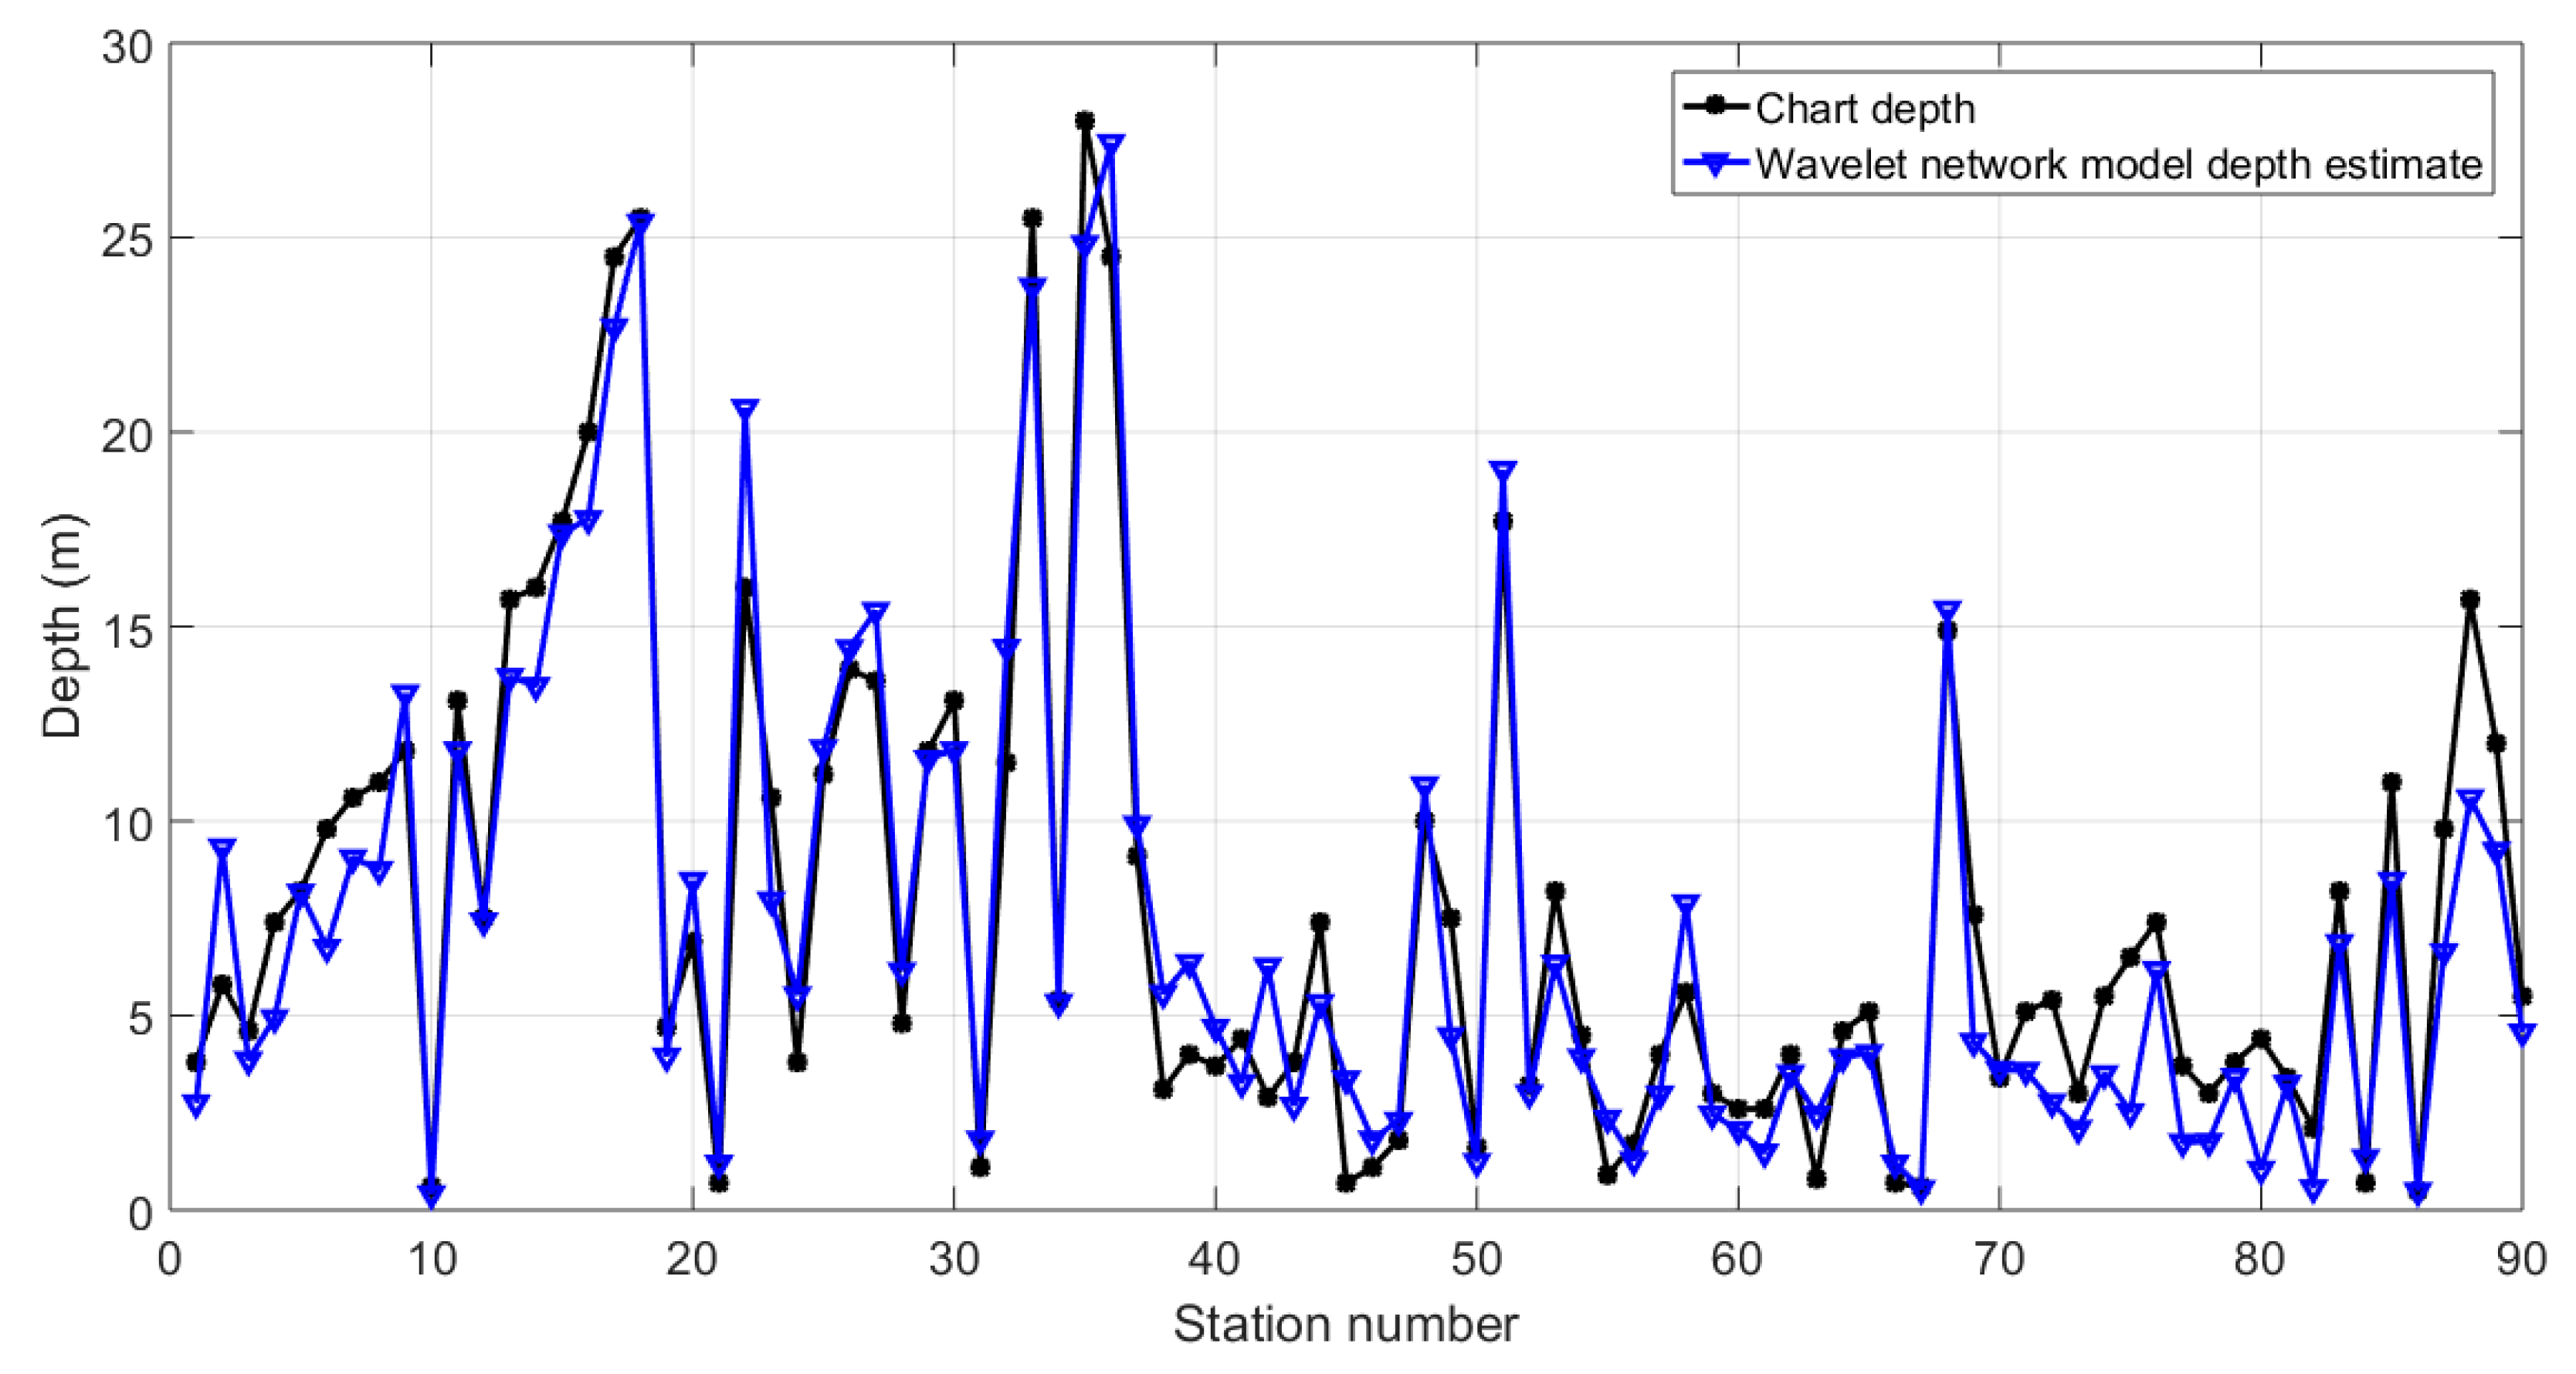
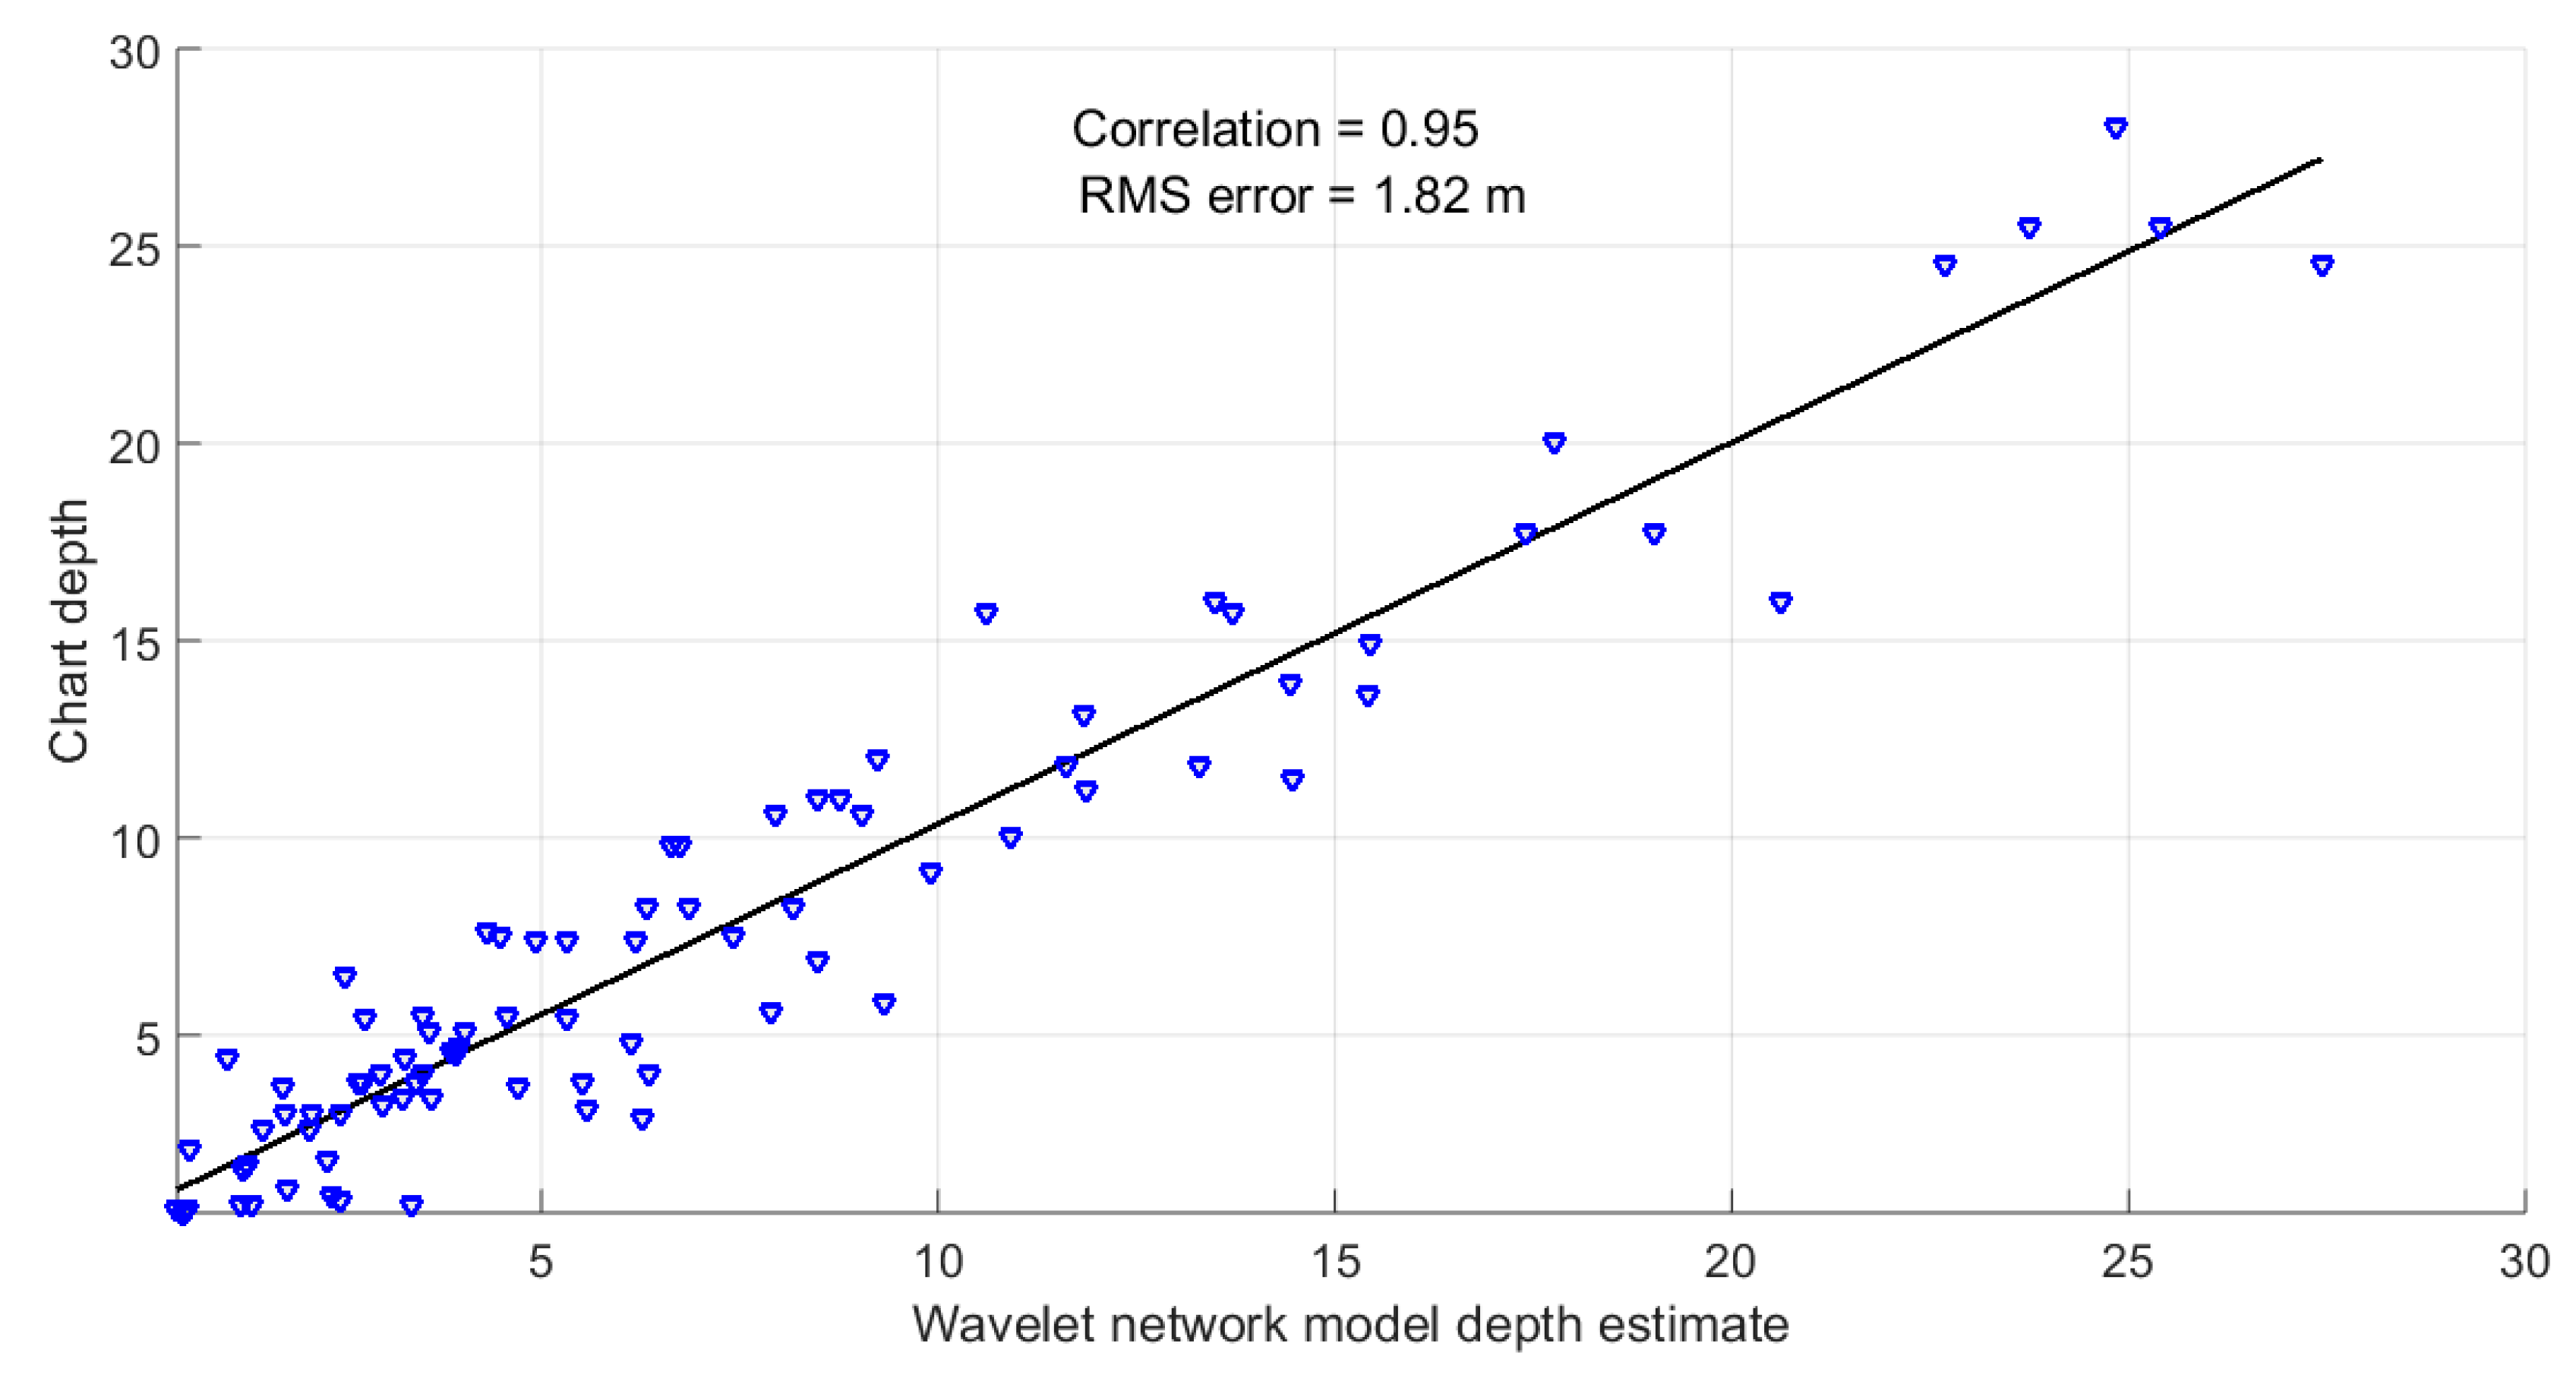
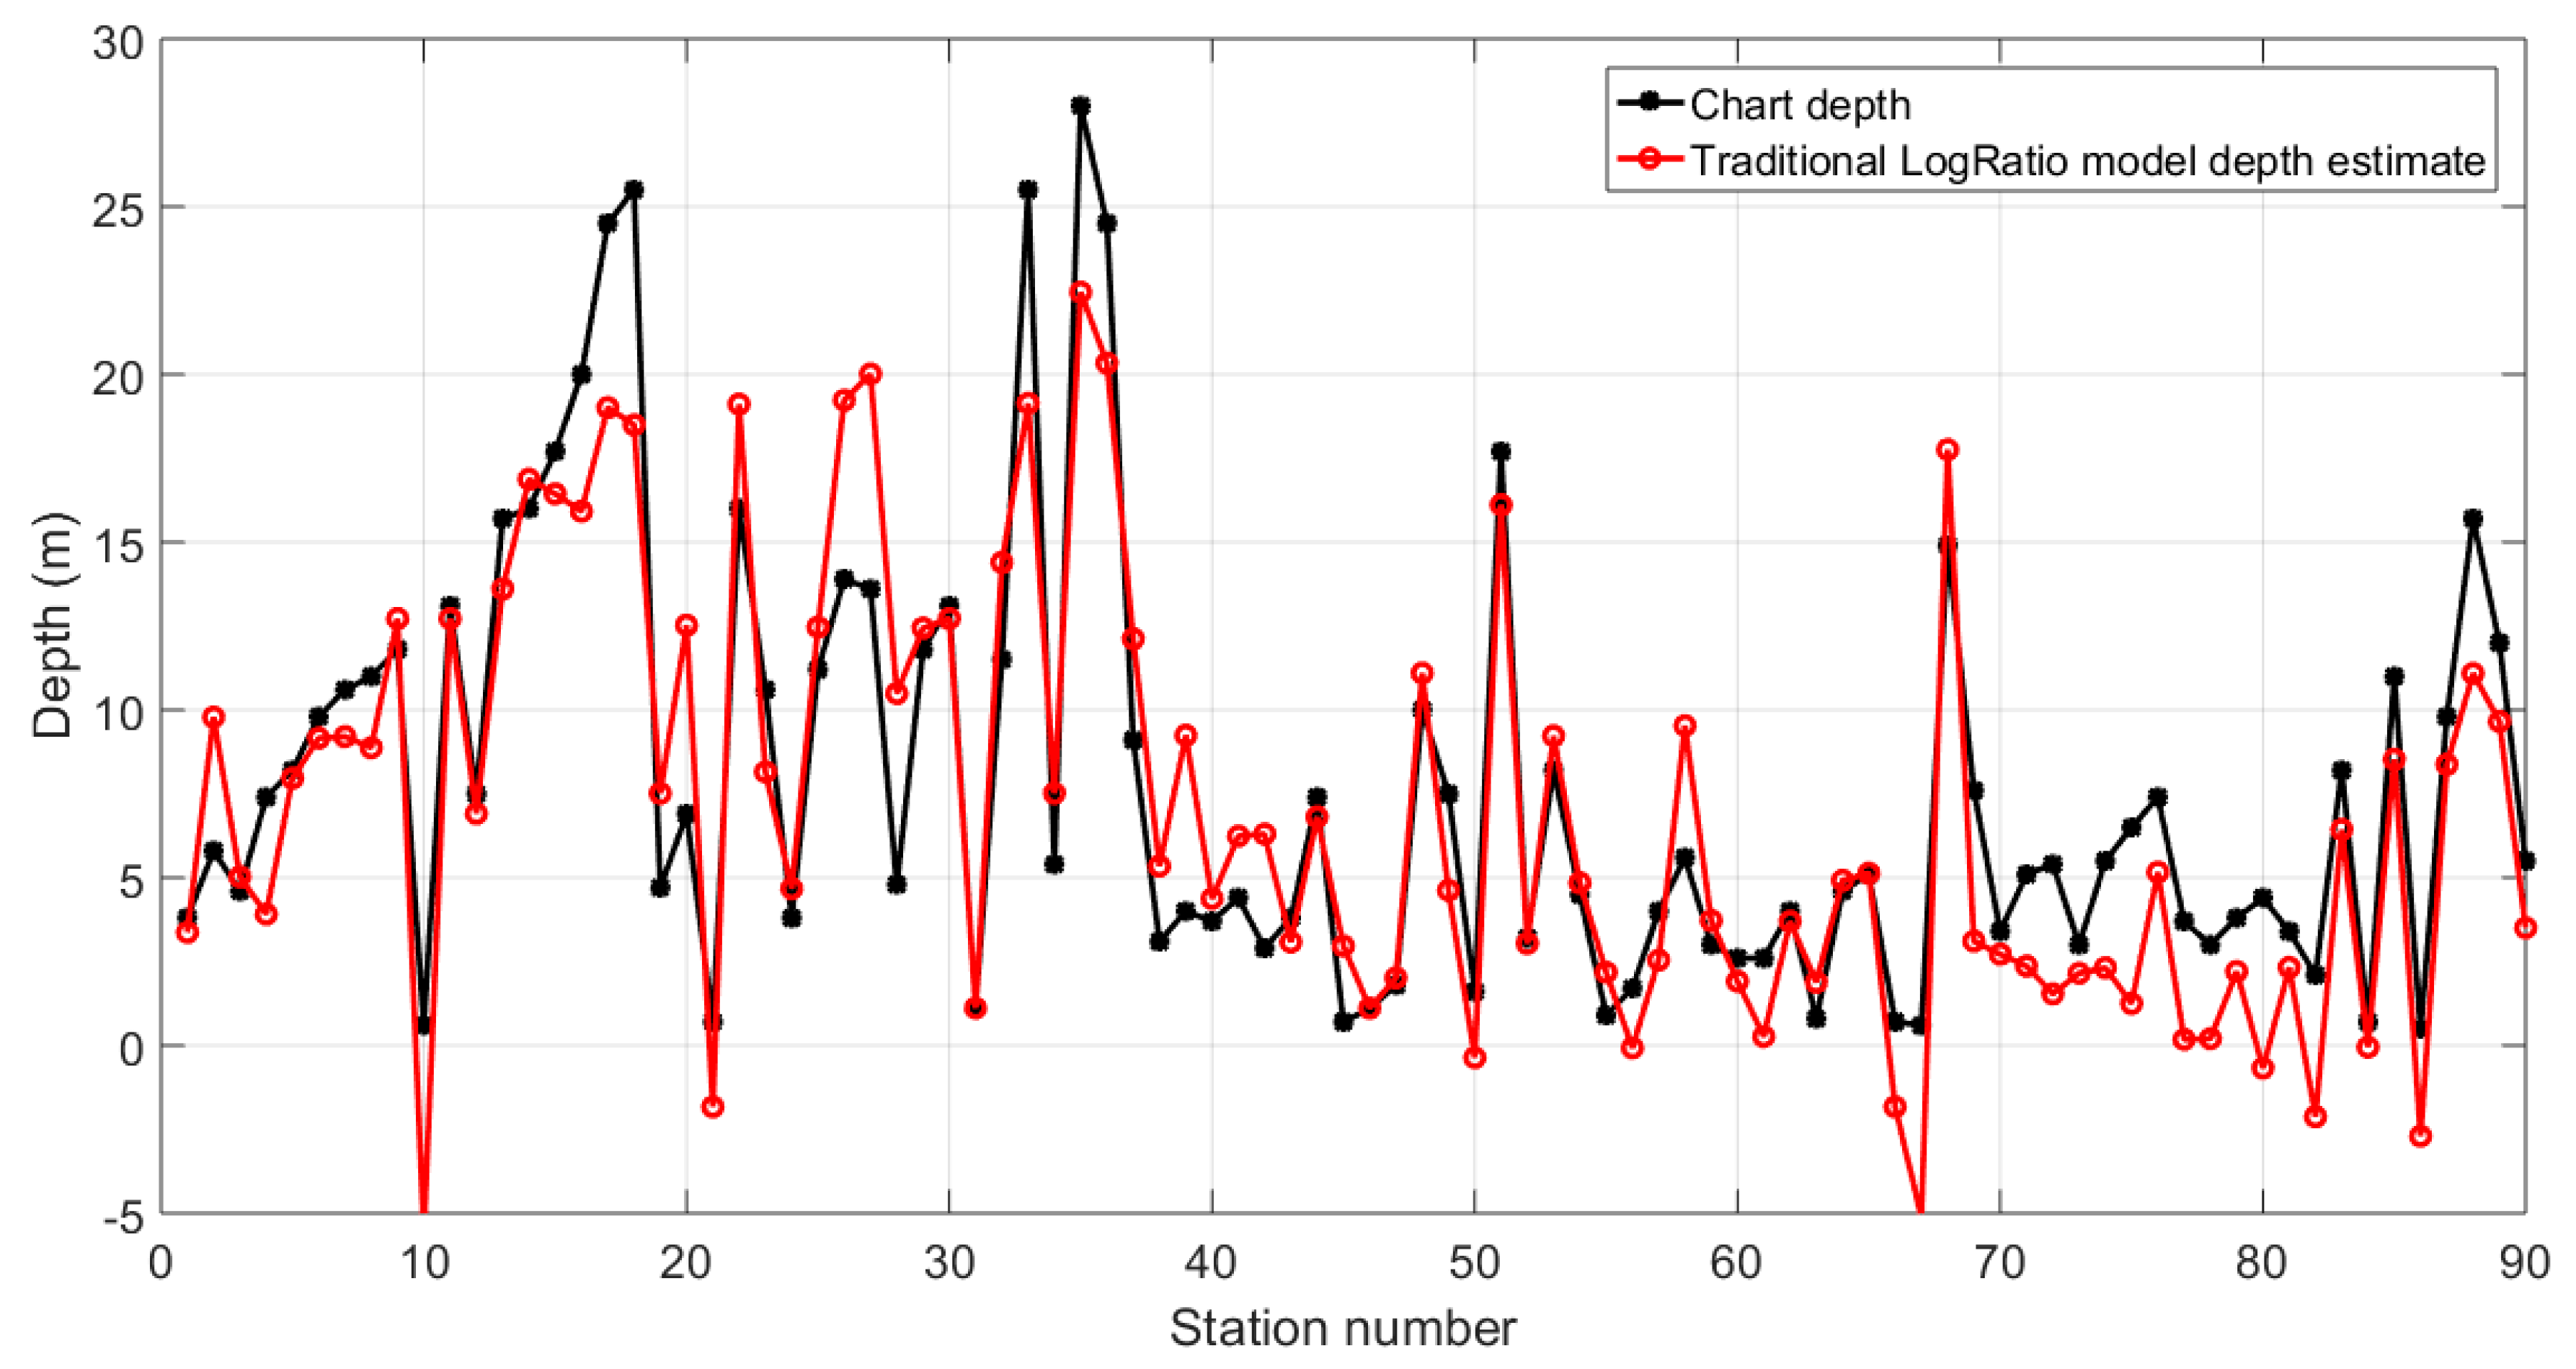
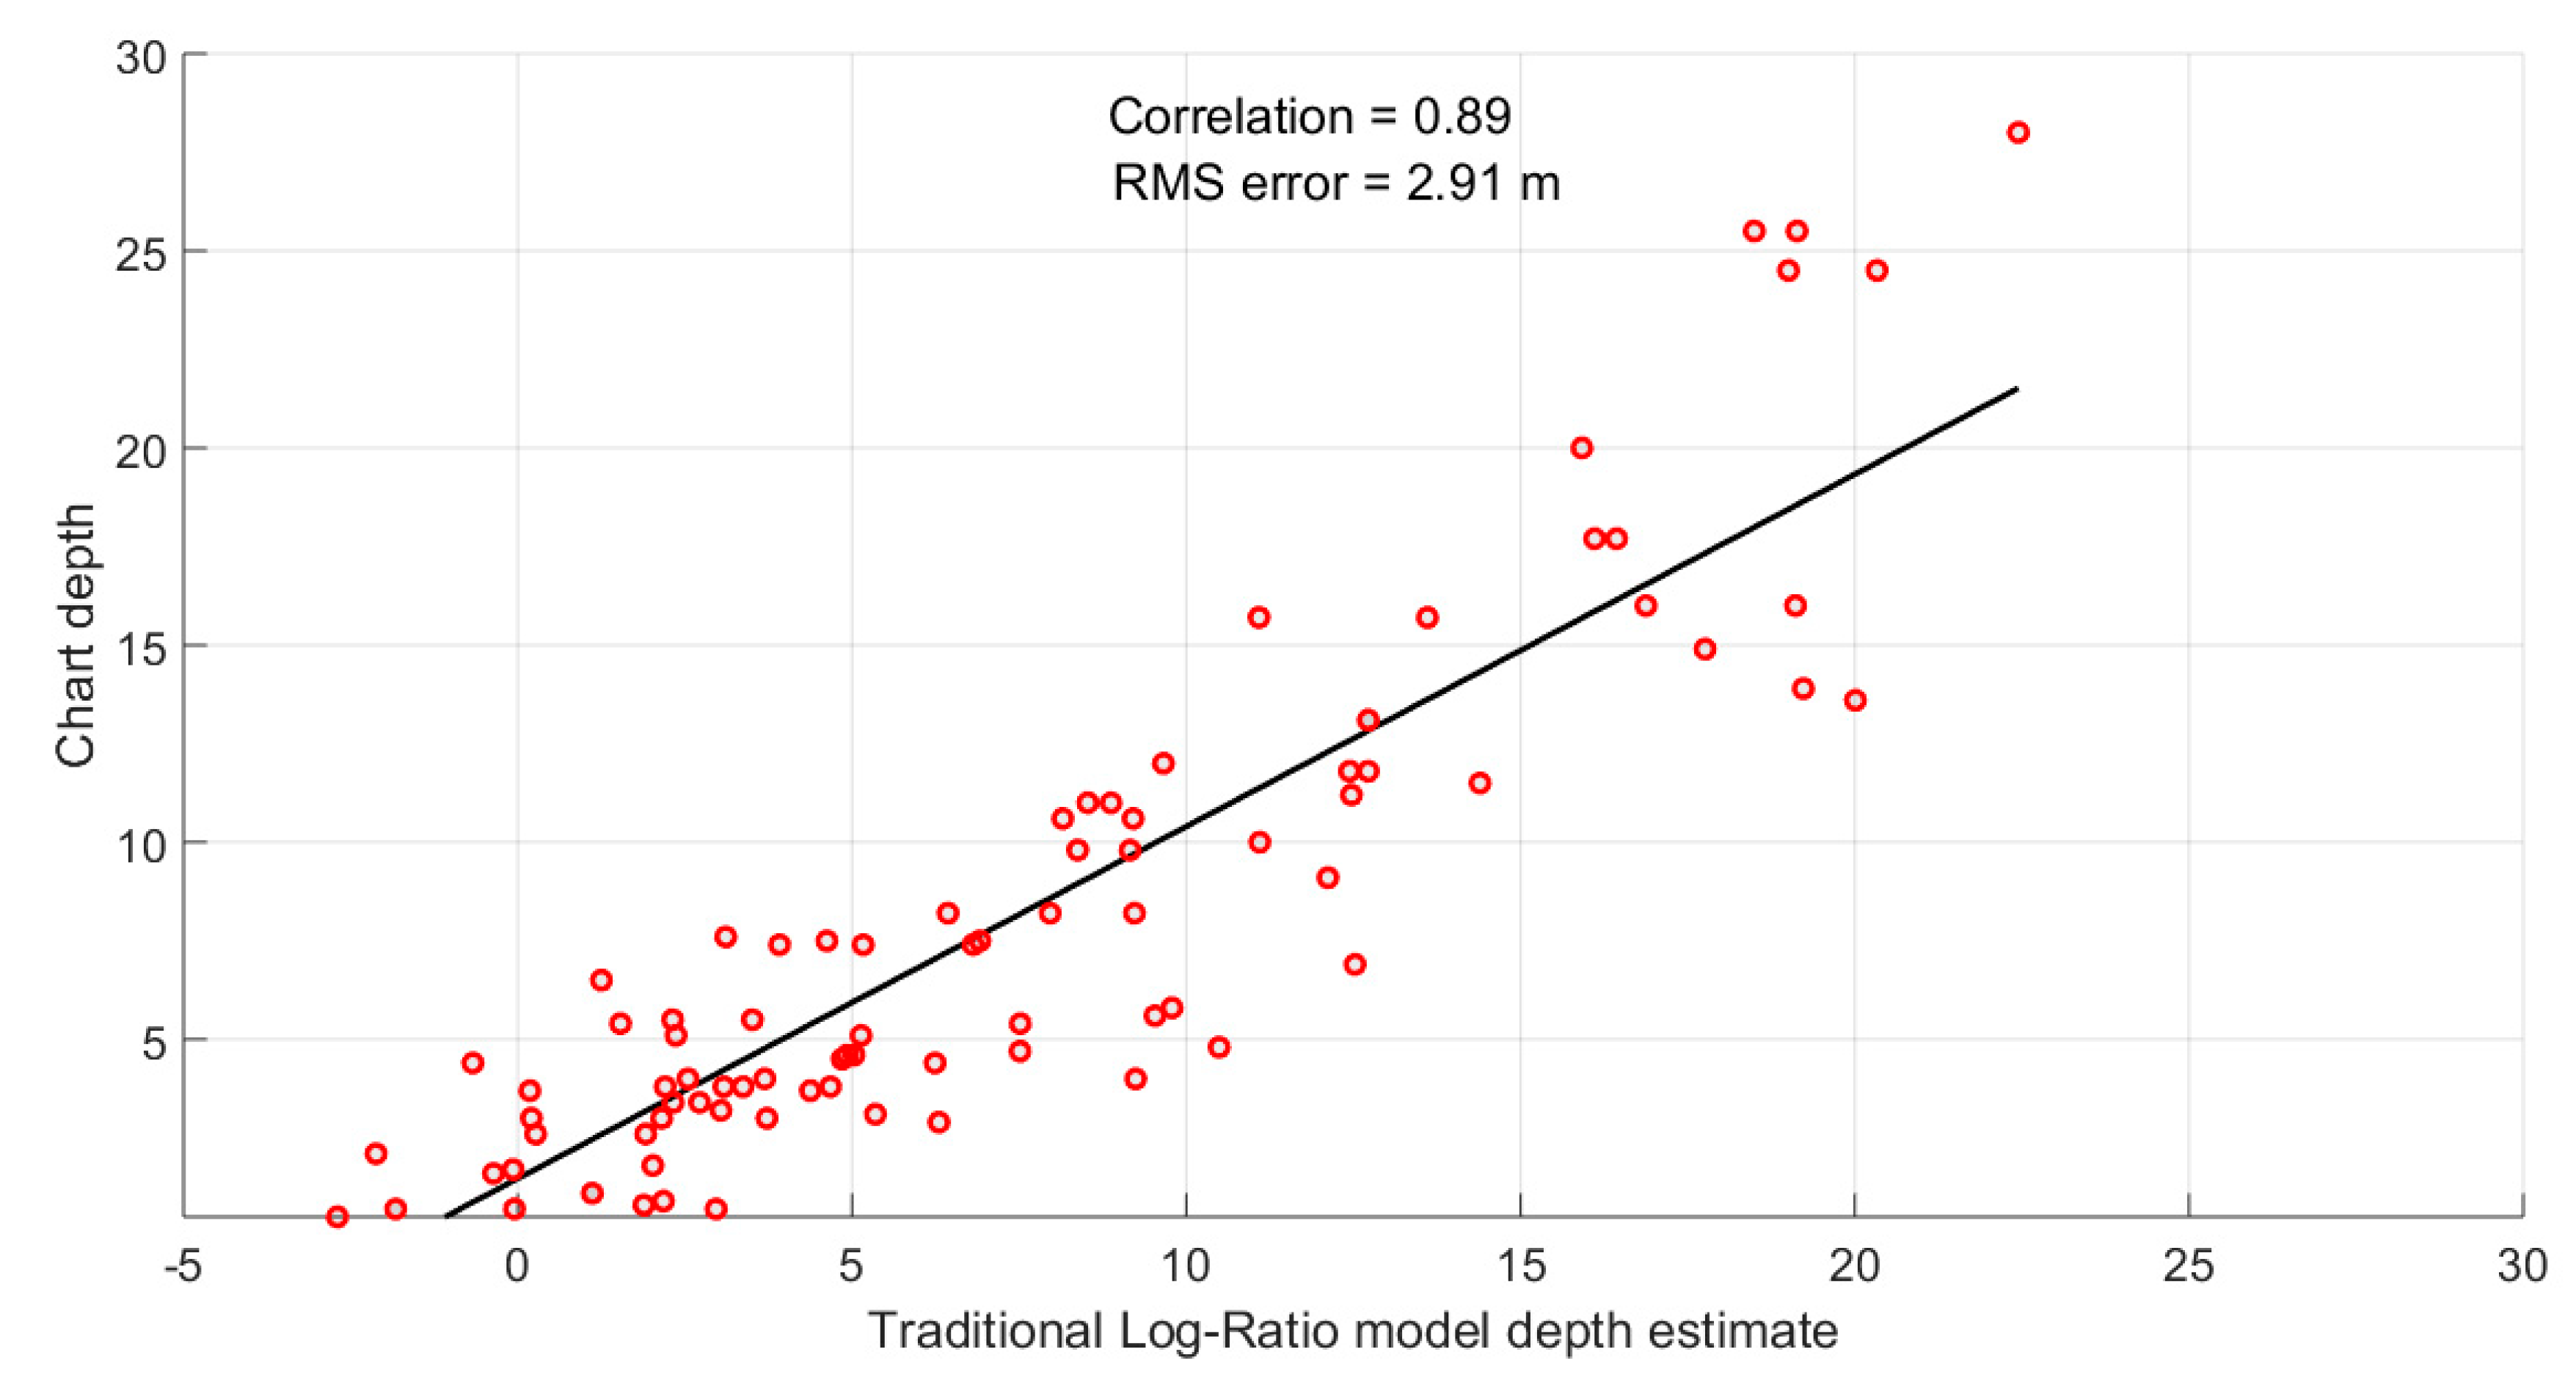
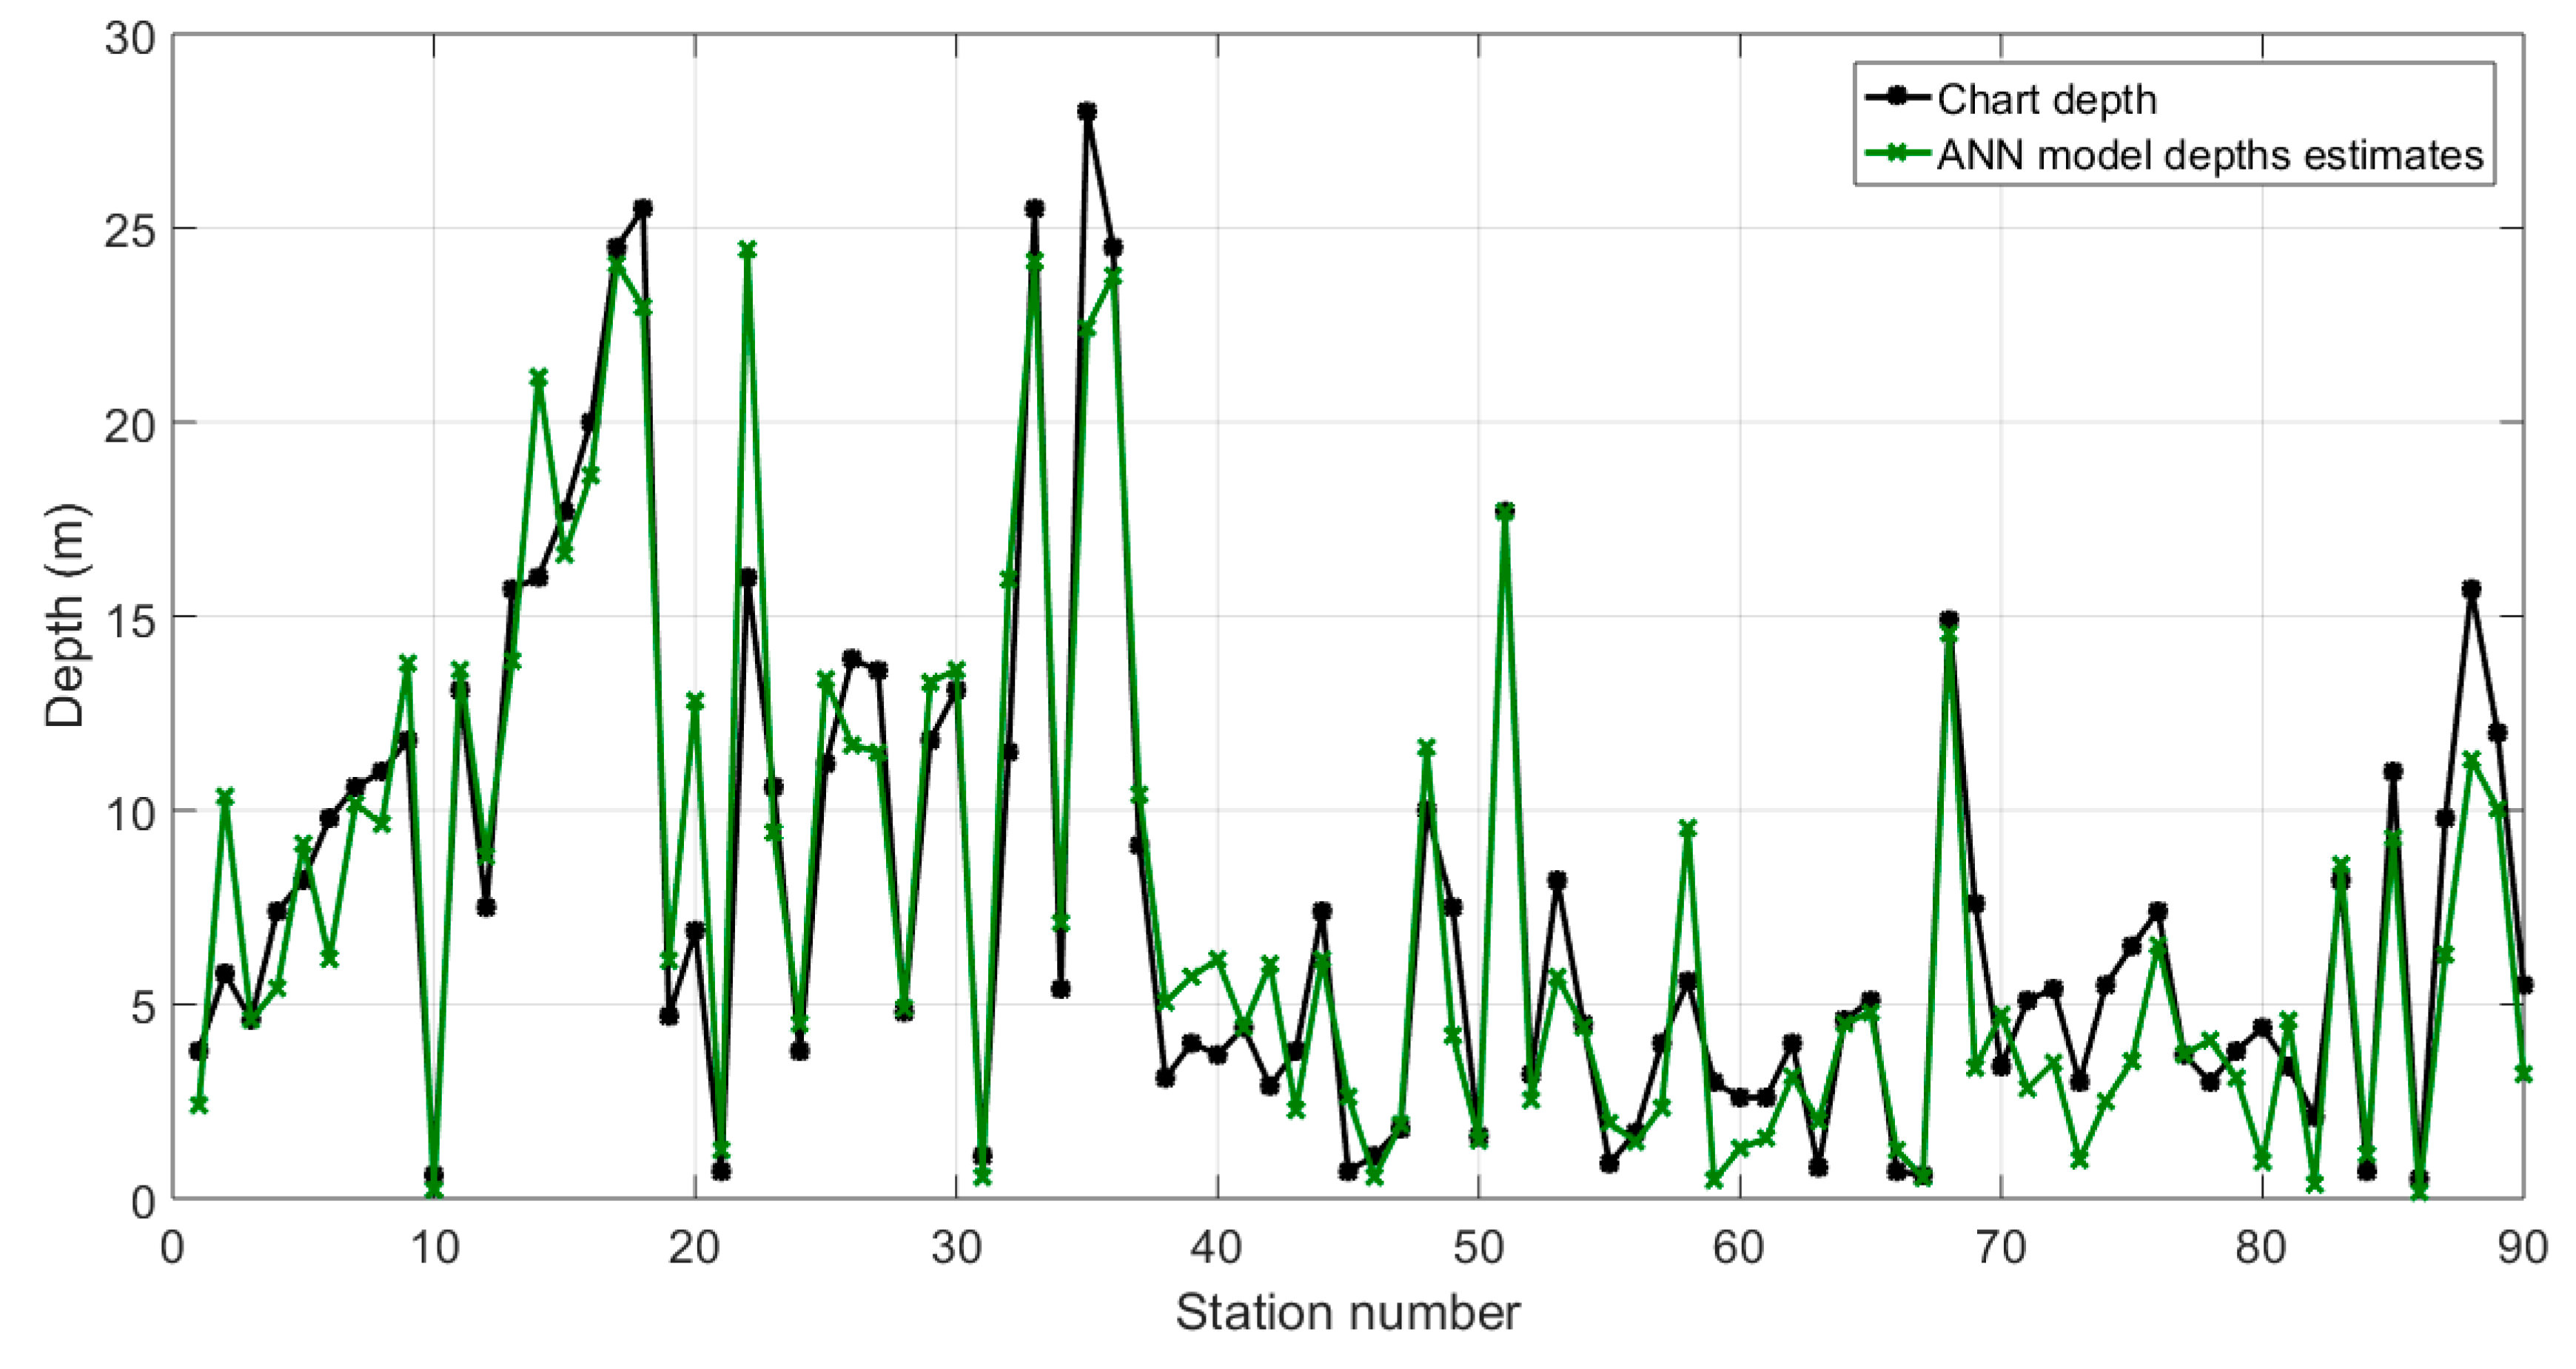
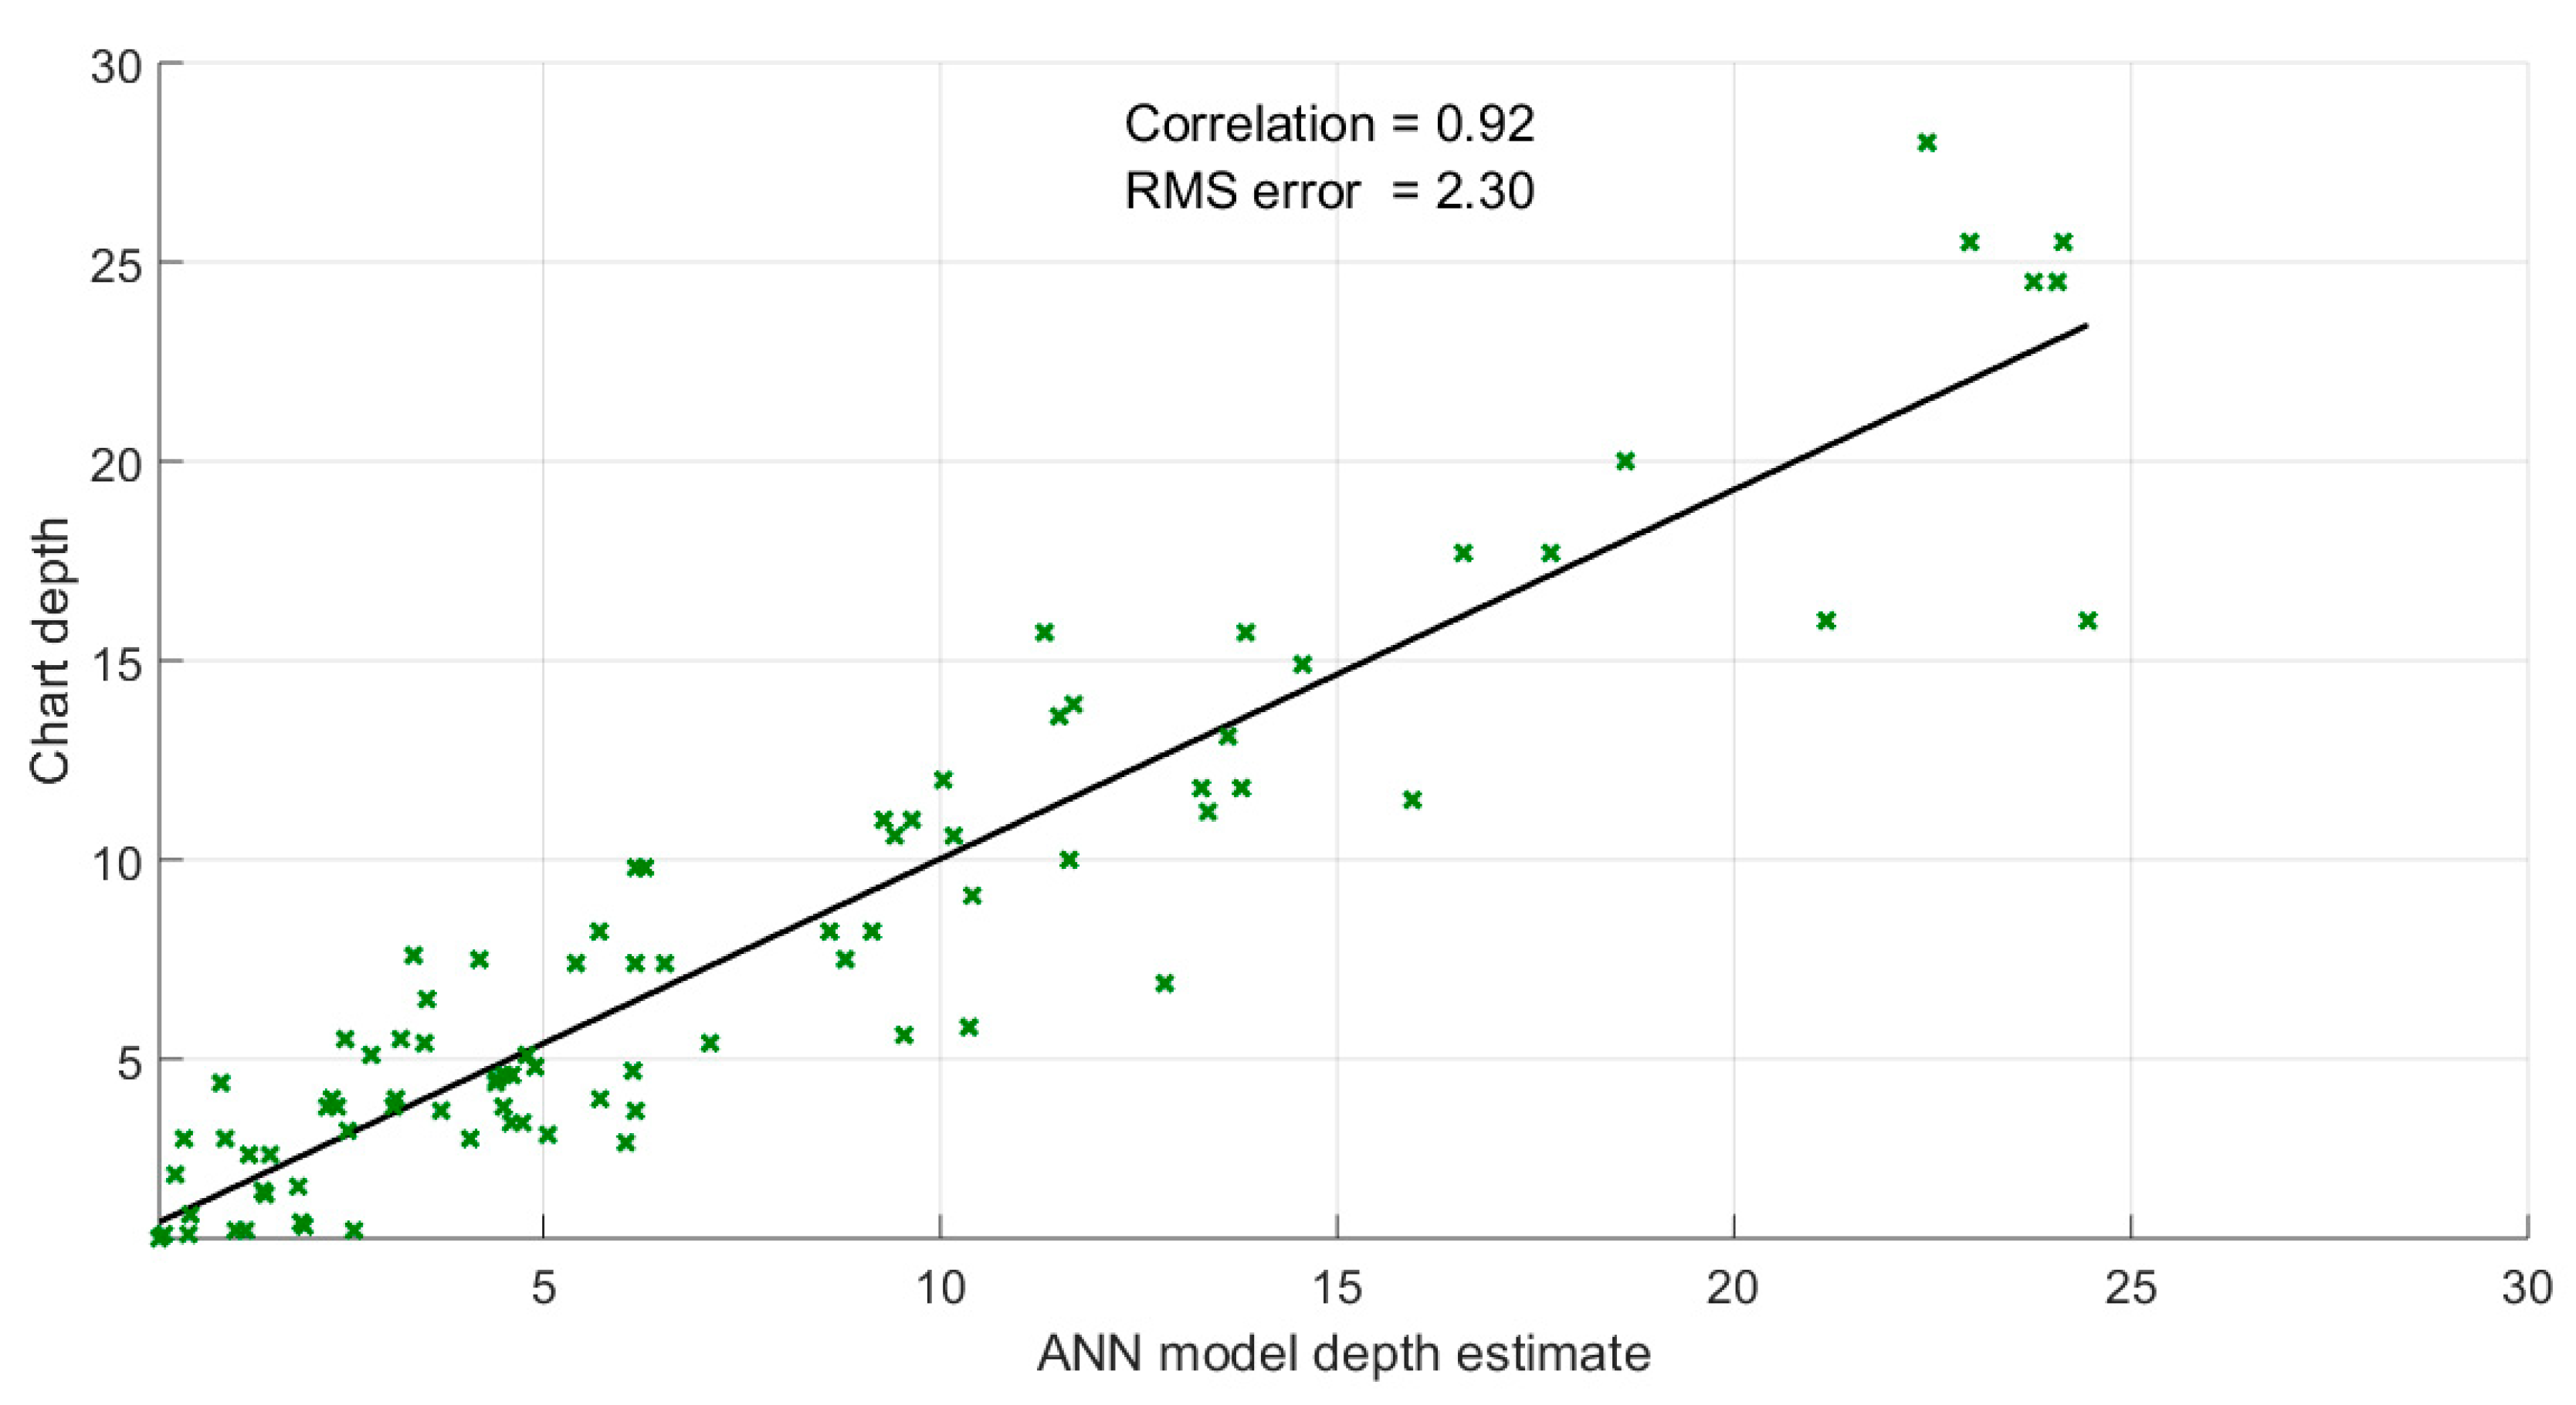
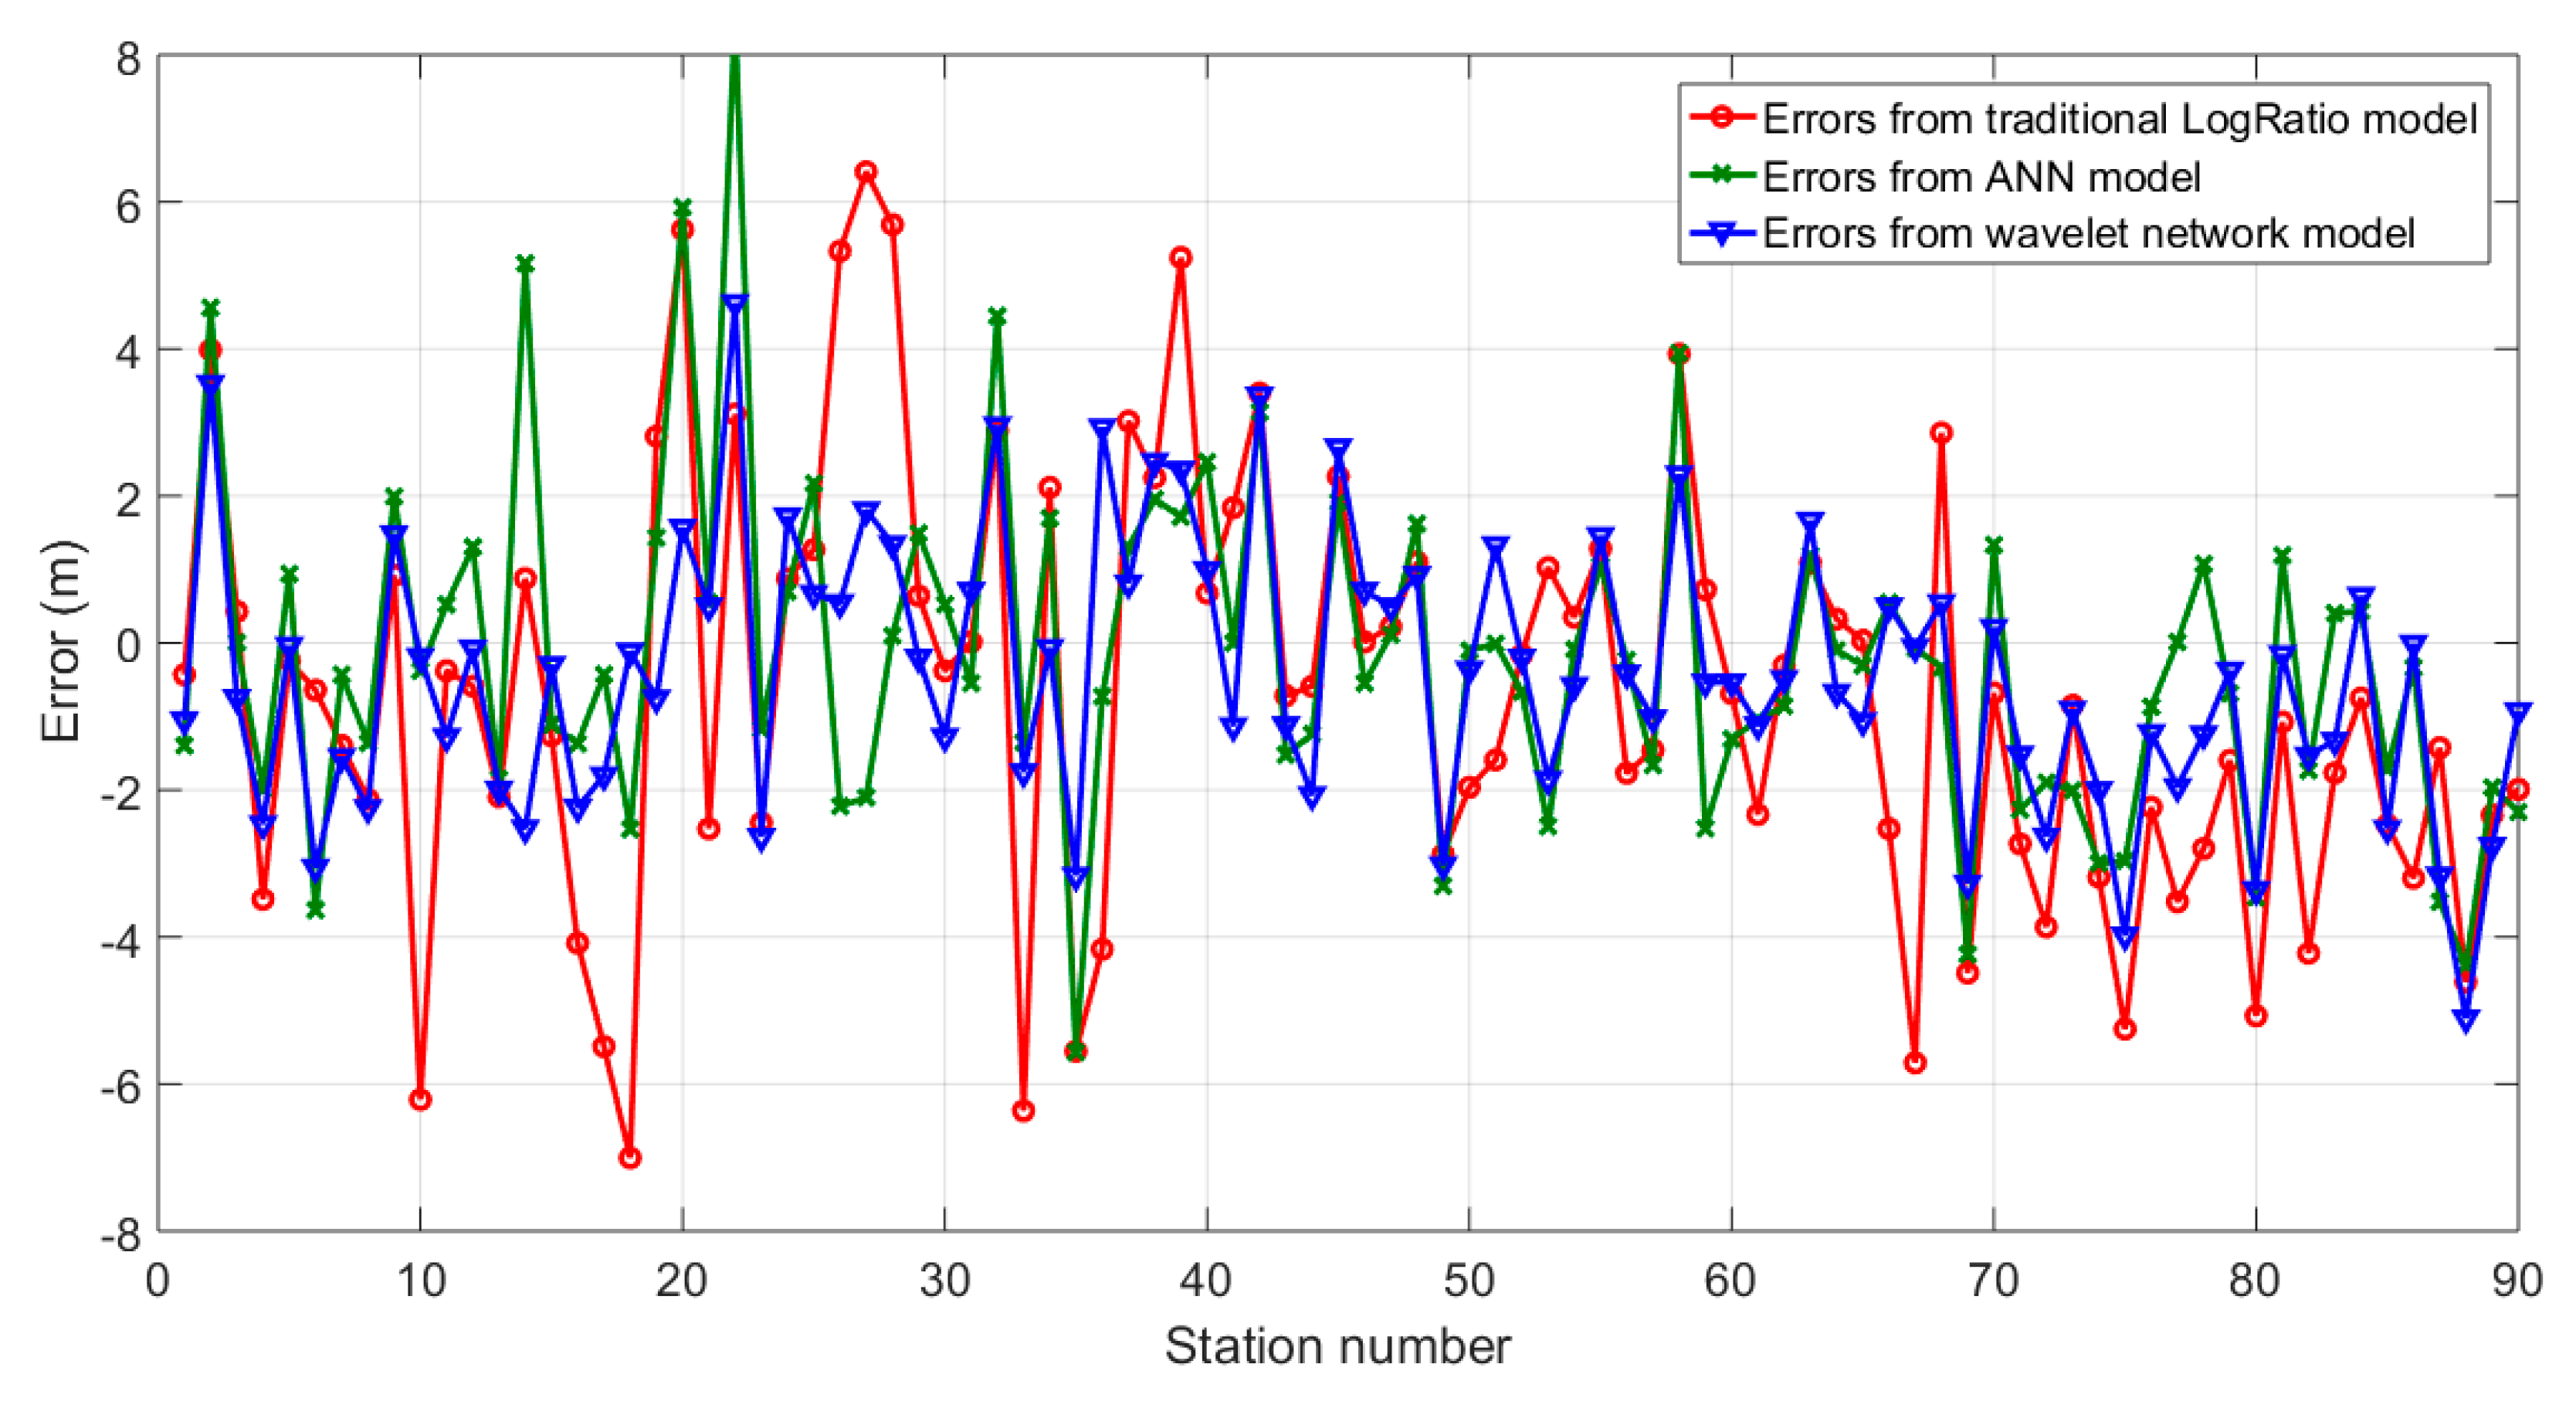
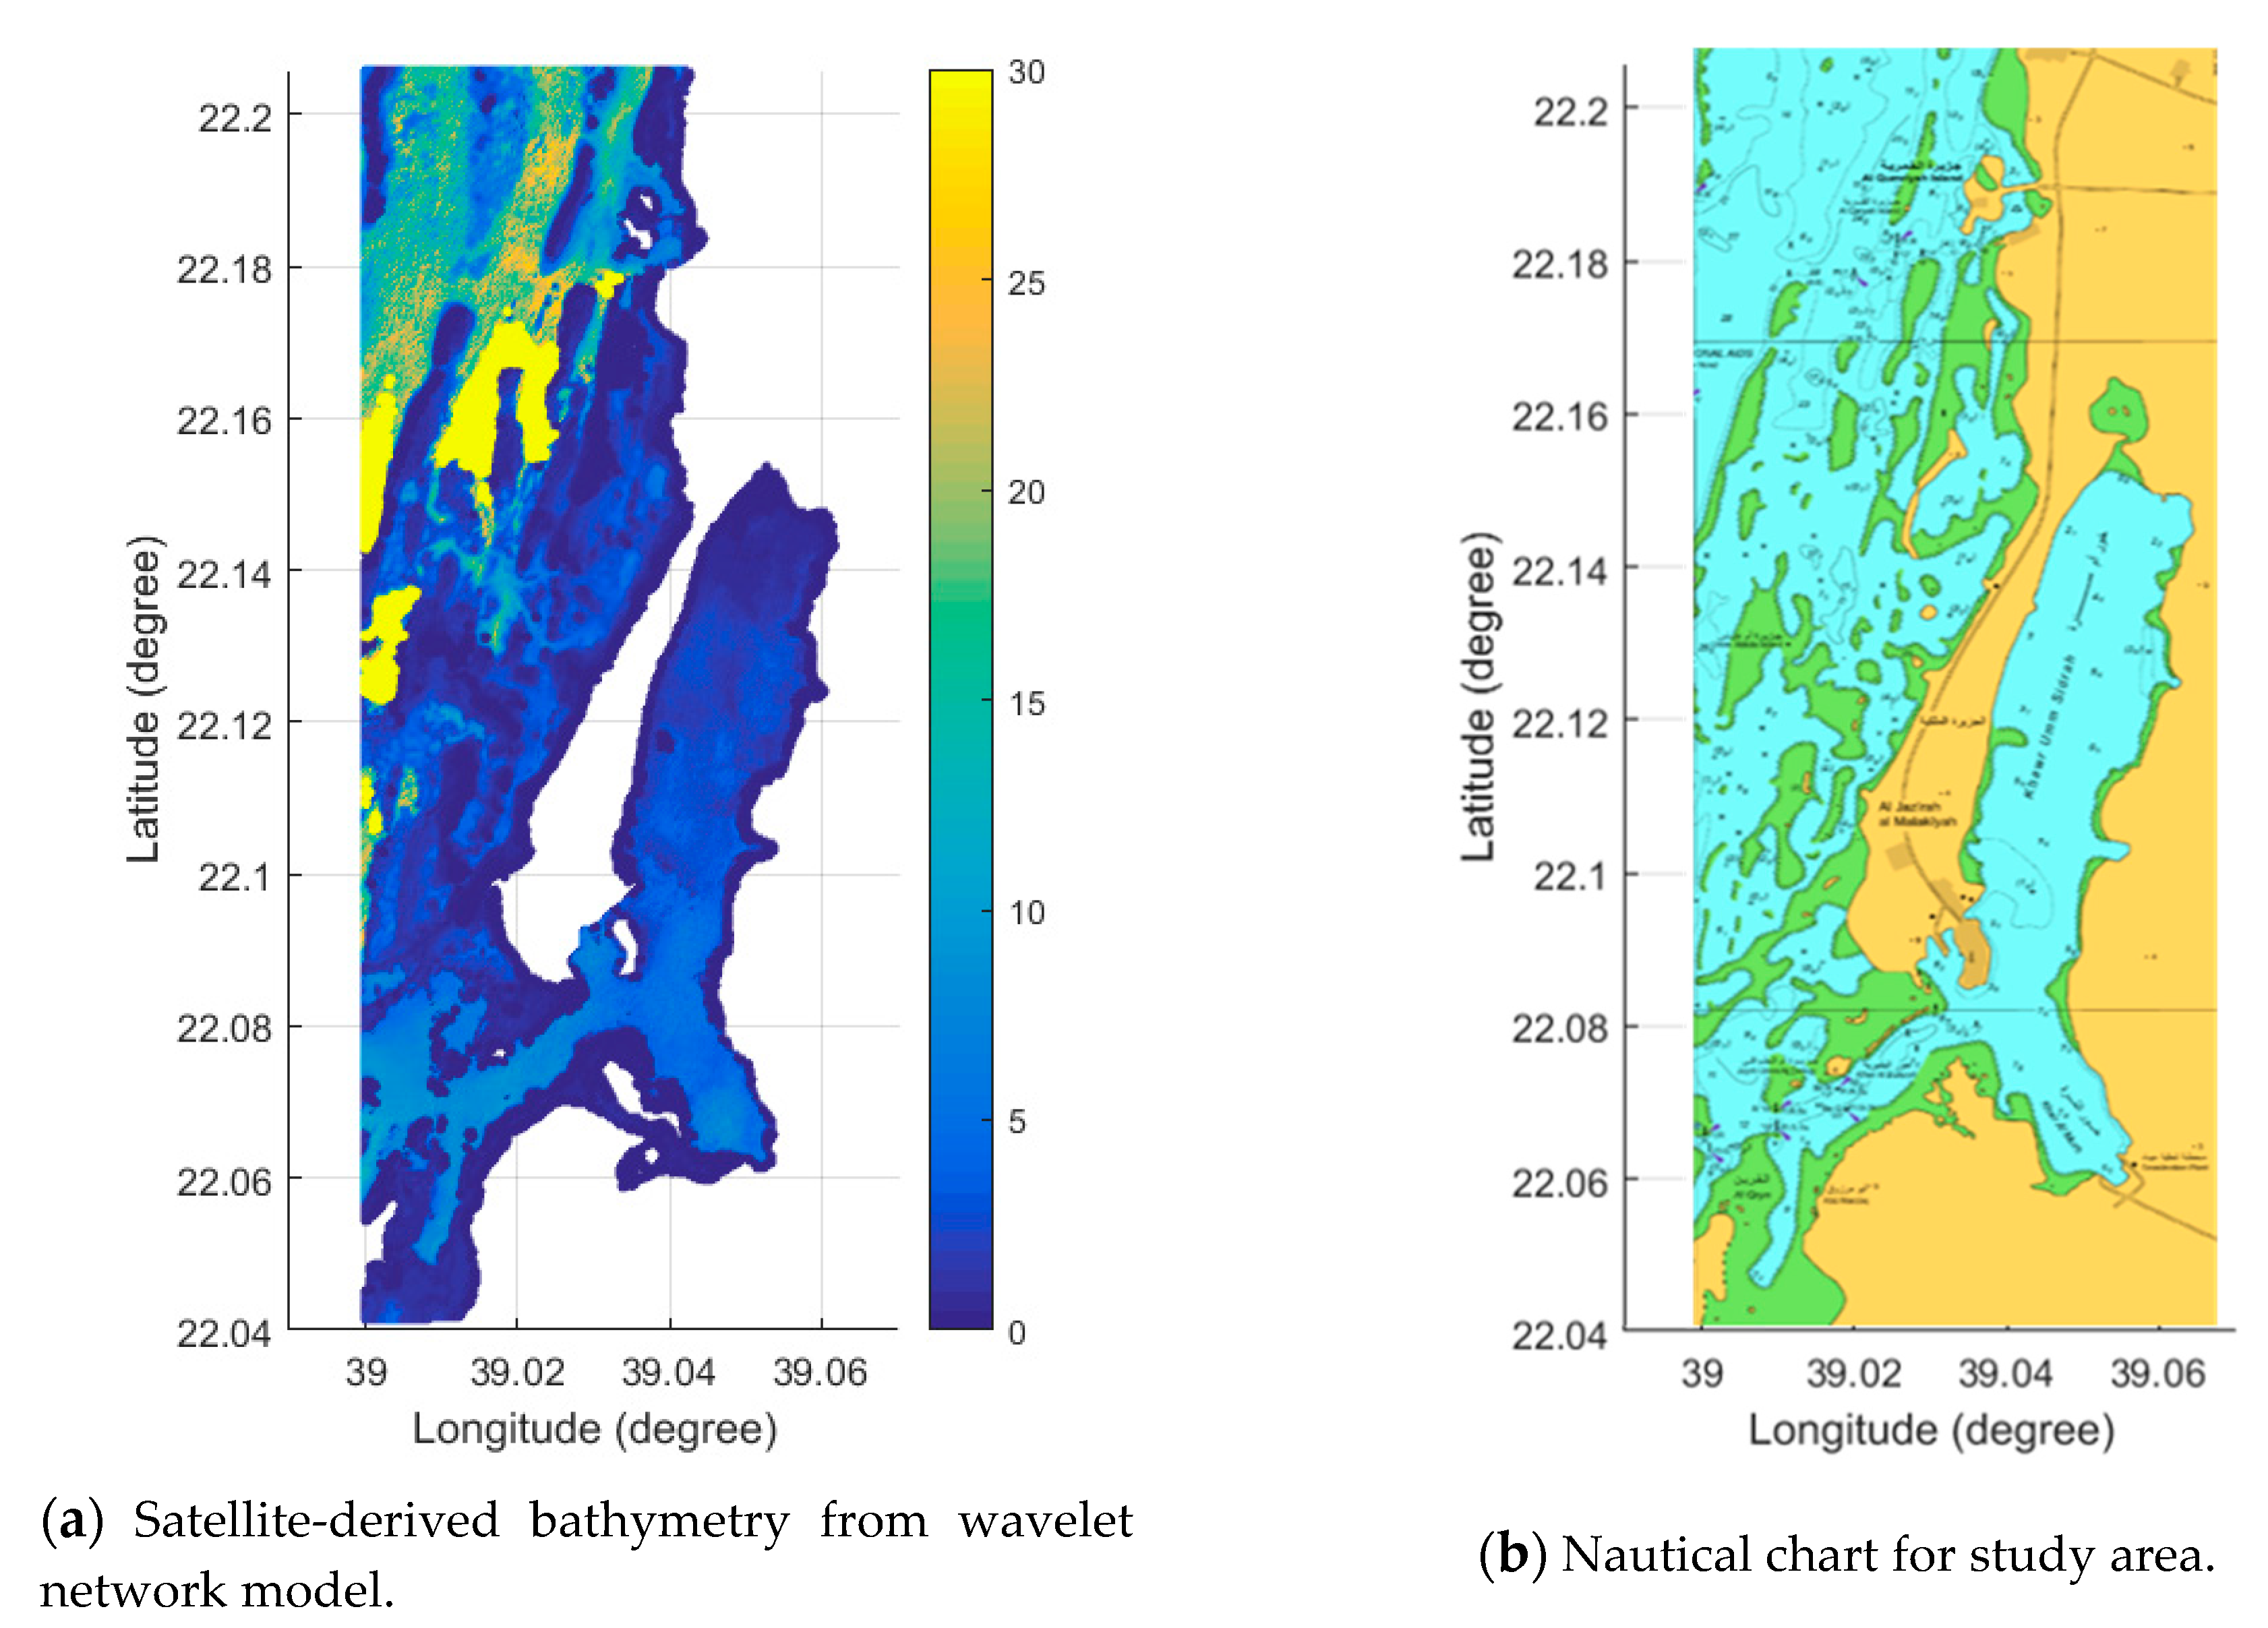
The 90 collocated stations’ datasets were divided into two datasets: a training/modeling dataset (50 stations) and a validation dataset (40 stations). The BOA reflectance log values of the green band, blue band, and green/blue bands ratio, along with the corresponding desired “truth” nautical chart depths of 50 stations, were selected to train the model. Then, the BOA reflectance log values of the green band, blue band, and green/blue bands ratio, along with the corresponding desired “truth” nautical chart depths of 40 stations were selected to validate the model. Figure 6 and Figure 7 show the modeled and validated model depth estimates versus the “truth” nautical chart depths values, as well as the correlation between modeled/validated depth estimates and “truth” nautical chart depths for the 90 collocated stations using the wavelet network model. It can be seen from Figure 7 that the overall RMS error was about 1.82 m, and the overall correlation was about 95%. To further validate the model, a comparison of the developed wavelet network model with the traditional Stumpf log-ratio model and the current state-of-the-art ANN model was conducted, based on the same 90 stations’ collocated dataset. Figure 8 and Figure 9 show the modeled and validated depth estimates versus the “truth” nautical chart depths and the correlation between modeled/validated depth estimates and “truth” nautical chart depths values for the 90 collocated stations using the traditional Stumpf log-ratio model. It can be seen from Figure 9 that the overall RMS error was about 2.91 m, and the overall correlation was about 89%. Figure 10 and Figure 11 show the modeled and validated depth estimates versus the “truth” nautical chart depths, as well as the correlation between modeled/validated depth estimates and “truth” nautical chart depths values for the 90 collocated stations using the current state-of-the-art ANN model. It was found that the ANN model with the structure (3 inputs–12 neurons–1 output) and hyper-tangent activation function provided the best solution with the lowest RMS error. It can be seen from Figure 11 that the overall RMS error was about 2.30 m, and the overall correlation was about 92%. Figure 12 shows the difference between the Stumpf log-ratio model estimates, the ANN model estimates, and the wavelet network model estimates when compared with “truth” nautical chart depths for the 90 collocated stations. Table 1 illustrates the summary of the results obtained from the developed wavelet network model and the traditional Stumpf log-ratio method for the 90 collocated stations. It can be seen from Figure 12 and Table 1 that the developed wavelet network model is superior to the traditional Stumpf log-ratio method by about 37%, on average, and outperforms the current state-of-the-art ANN method by about 21%, on average, on the basis of the overall RMS errors estimated from the three methods. It should be noted that the achieved accuracy is independent of the water depth and depends on the water’s clarity/turbidity in the study area. Figure 13 shows a comparison between the bathymetric map derived from the highly non-linear wavelet network model and the nautical chart for the study area that renders similar patterns between the two maps for the deep zones (with depths ranging from 25 m to 30 m) and the inter-tidal zones (with zero depth).
Table 2 shows the total vertical uncertainty (TVU) allowed by the IHO for all survey orders estimated at 15 m average depth (d) using the following equation and IHO parameters (a and b) listed in IHO standards S-44 [25]:
The actual RMS error from the satellite-derived bathymetry created in this paper according to Table 1 was 1.82 m, and this error exceeds IHO TVU for all survey orders. Therefore, the satellite-derived bathymetry using the developed accurate wavelet network model still does not meet IHO standards. However, this satellite-derived bathymetry using the developed accurate wavelet network model can be used as an accurate and powerful tool in survey planning for shallow water areas that require a new hydrographic survey.
6. Conclusions and Recommendations
This paper developed a highly non-linear wavelet network model for accurate satellite-derived bathymetric modeling. To validate the developed wavelet network model, the dataset from Sentinel-2 satellite imagery and corresponding “truth” nautical chart depths were employed. It was shown that the RMS error of the developed wavelet network model was about 1.82 m, and the correlation was about 95%, on average. To further validate the model, a comparison of the developed, highly non-linear wavelet network model with the traditional Stumpf log-ratio and the ANN models was conducted. It is concluded from the comparison that the developed highly non-linear wavelet network model is superior to the traditional linear Stumpf log-ratio method by about 37%, on average, and outperforms the current state-of-the-art ANN method by about 21%, on average, on the basis of the RMS errors.
Also, the accuracy of the satellite-derived bathymetry using the developed wavelet network model was compared with IHO standards for all survey orders that range from special order to second order. It is concluded from the comparison that the accuracy of satellite-derived bathymetry using the developed wavelet network model cannot meet IHO standards for all survey orders. However, the satellite-derived bathymetry using the wavelet network model can be considered an accurate and powerful tool in the survey planning phase of a hydrographic surveying operation for shallow water areas that require a new hydrographic survey.
Employing the satellite-derived bathymetry using the developed wavelet network model as a tool for survey planning in conducting hydrographic surveying for new, shallow water areas, is strongly recommended. Also, in order to meet IHO survey order standards, investigating commercial satellite imageries with high spatial resolution, along with new non-linear methodologies to improve the satellite-derived bathymetric mapping accuracy, is recommended.
Funding
This research was funded by the DSR, King Abdulaziz University, Jeddah, grant number G-526-980-38 and the APC was funded by DSR, King Abdulaziz University, Jeddah.
Acknowledgments
This project was funded by the Deanship of Scientific Research (DSR), King Abdulaziz University, Jeddah, under grant no. G-526-980-38. The author, therefore, acknowledge with thanks DSR technical and financial support.
Conflicts of Interest
The author declares no conflict of interest.
References
- Stumpf, R.; Holdried, K.; Sinclair, M. Determination of Water Depth with High-Resolution Satellite Imagery Over Variable Bottom Types. Limnol. Oceanogr. 2003, 48, 547–556. [Google Scholar] [CrossRef]
- Liu, S.; Wang, L.; Liu, H.; Su, H.; Li, X.; Zheng, W. Deriving Bathymetry from Optical Images with a Localized Neural Network Algorithm. IEEE Trans. Geosci. Remote Sens. 2018, 56, 5334–5342. [Google Scholar] [CrossRef]
- McIntyre, M.; Naar, D.; Carder, K.; Donahue, B.; Mallinson, D. Coastal bathymetry from hyperspectral remote sensing data: Comparisons with high resolution multibeam bathymetry. Mar. Geophys. Res. 2006, 27, 129–136. [Google Scholar] [CrossRef]
- Giardino, C.; Candiani, G.; Bresciani, M.; Lee, Z.; Gagliano, S.; Pepe, M.; Bomber, A. A tool for estimating water quality and bottom properties from remote sensing images. Comput. Geosci. 2012, 45, 313–318. [Google Scholar] [CrossRef]
- Hamylton, S.M.; Hedley, J.D.; Beaman, R.J. Derivation of high-resolution bathymetry from multispectral satellite imagery: A comparison of empirical and optimisation methods through geographical error analysis. Remote Sens. 2015, 7, 16257–16273. [Google Scholar] [CrossRef]
- Setiawan, K.T.; Adawiah, S.W.; Marini, Y.; Winarso, G. Bathymetry Data Extraction Analysis Using Landsat 8 Data. Int. J. Remote Sens. Earth Sci. 2016, 13, 79–86. [Google Scholar] [CrossRef]
- Eugenio, F.; Marcello, J.; Martin, J.; Rodríguez-Esparragón, J.G. Benthic Habitat Mapping Using Multispectral High-Resolution Imagery: Evaluation of Shallow Water Atmospheric Correction Techniques. Sensors 2017, 17, 2639. [Google Scholar] [CrossRef] [PubMed]
- Traganos, D.; Poursanidis, D.; Aggarwal, B.; Chrysoulakis, N.; Reinartz, P. Estimating Satellite-Derived Bathymetry (SDB) with the Google Earth Engine and Sentinel-2. Remote Sens. 2018, 10, 859. [Google Scholar] [CrossRef]
- Casal, G.; Monteys, X.; Hedley, J.; Harris, P.; Cahalane, C.; McCarthy, T. Assessment of empirical algorithms for bathymetry extraction using Sentinel-2 data. Int. J. Remote Sens. 2019, 40, 2855–2879. [Google Scholar] [CrossRef]
- Lyzenga, D.R. Shallow-water bathymetry using combined LIDAR and passive multispectral scanner data. Int. J. Remote Sens. 1985, 6, 115–125. [Google Scholar] [CrossRef]
- Lyzenga, D.; Malinas, N.; Tanis, F. Multispectral bathymetry using a simple physically based algorithm. IEEE Trans. Geosci. Remote Sens. 2006, 44, 2251–2259. [Google Scholar] [CrossRef]
- Zhang, Q. Using Wavelet Network in Nonparametric Estimation. IEEE Trans. Neural Netw. 1997, 8, 227–236. [Google Scholar] [CrossRef] [PubMed]
- Adeli, H.; Samant, A. An adaptive conjugate gradient neural network-wavelet model for traffic incident detection. Comput. Aided Civ. Infrastruct. Eng. 2000, 15, 251–260. [Google Scholar] [CrossRef]
- El-Diasty, M.; Al-Harbi, S. Development of wavelet network model for accurate water levels prediction with meteorological effects. Appl. Ocean Res. 2015, 53, 228–235. [Google Scholar] [CrossRef]
- Zhang, Q.; Benveniste, A. Wavelet networks. IEEE Trans. Neural Netw. 1992, 3, 889–898. [Google Scholar] [CrossRef] [PubMed]
- Oussar, Y.; Rivals, I.; Personnaz, L.; Dereyfus, G. Training wavelet networks for nonlinear dynamic input-output modeling. Neurocomputing 1998, 20, 173–188. [Google Scholar] [CrossRef]
- El-Diasty, M.; El-Rabbany, A.; Pagiatakis, S. An Accurate Nonlinear Stochastic Model for MEMS-Based Inertial Sensor Error with Wavelet Networks. J. Appl. Geod. 2007, 1, 201–212. [Google Scholar] [CrossRef]
- Haykin, S. Neural Networks and Learning Machines, 3rd ed.; Pearson Prentice Hall: Upper Saddle River, NJ, USA, 2009. [Google Scholar]
- Andrew, W.; Donald, P. Wavelet Methods for Times Series Analysis; Cambridge University Press: Cambridge, UK, 2000. [Google Scholar]
- Copernicus Open Access Hub (COAH). Available online: https://scihub.copernicus.eu/dhus/#/home (accessed on 1 January 2019).
- Sentinel Application Platform (SNAP). Available online: http://step.esa.int/main/toolboxes/snap/ (accessed on 1 January 2019).
- Louis, J.; Debaecker, V.; Pflug, B.; Main-Knorn, M.; Bieniarz, J.; Mueller-Wilm, U.; Cadau, E.; Gascon, F. SENTINEL-2 SEN2COR: L2A Processor for Users. In Proceedings of the Living Planet Symposium, Prague, Czech Republic, 9–13 May 2016; Volume SP-740, pp. 1–8. [Google Scholar]
- McFeeters, S.K. The use of the Normalized Difference Water Index (NDWI) in the delineation of open water features. Int. J. Remote Sens. 1996, 17, 1425–1432. [Google Scholar] [CrossRef]
- MATLAB 2016; The Math Works, Inc.: Natick, MA, USA, 2016.
- International Hydrographic Bureau (IHO). IHO Standards for Hydrographic Surveys, 5th ed.; International Hydrographic Bureau (IHO): Monaco, the Principality of Monaco, 2008. [Google Scholar]
Figure 1.
General wavelet network (WN) model structure (Np-input, Ni-wavelons, and Nj-outputs).

Figure 2.
Research process flowchart (normalized difference water index, NDWI; artificial neural network, ANN; International Hydrographic Organization, IHO).
Figure 2.
Research process flowchart (normalized difference water index, NDWI; artificial neural network, ANN; International Hydrographic Organization, IHO).

Figure 3.
Near-infrared (NIR)-green-blue color-infrared-like image of Level-1C product from Sentinel-2A satellite (size = 100 km × 100 km) and study area (red box).
Figure 3.
Near-infrared (NIR)-green-blue color-infrared-like image of Level-1C product from Sentinel-2A satellite (size = 100 km × 100 km) and study area (red box).

Figure 4.
NIR-green-blue color-infrared–like images of Level-1C product and nautical chart of the study area.
Figure 4.
NIR-green-blue color-infrared–like images of Level-1C product and nautical chart of the study area.

Figure 5.
NIR-green-blue color-infrared-like images of original, masked, and filtered Level-2A product along with designated stations (white stars) for the study area.
Figure 5.
NIR-green-blue color-infrared-like images of original, masked, and filtered Level-2A product along with designated stations (white stars) for the study area.

Figure 6.
The modelled and validated model depth estimates versus the “truth” nautical chart depths values for the 90 collocated stations using the wavelet network model.
Figure 6.
The modelled and validated model depth estimates versus the “truth” nautical chart depths values for the 90 collocated stations using the wavelet network model.

Figure 7.
The correlation between modelled/validated depth estimates and “truth” nautical chart depths for the 90 collocated stations using the wavelet network model.
Figure 7.
The correlation between modelled/validated depth estimates and “truth” nautical chart depths for the 90 collocated stations using the wavelet network model.

Figure 8.
The modelled and validated model’s depth estimates versus the “truth” nautical chart depths values for the 90 collocated stations using the Stumpf log-ratio model.
Figure 8.
The modelled and validated model’s depth estimates versus the “truth” nautical chart depths values for the 90 collocated stations using the Stumpf log-ratio model.

Figure 9.
The correlation between modelled/validated depth estimates and the “truth” nautical chart depths for the 90 collocated stations using the Stumpf log-ratio model.
Figure 9.
The correlation between modelled/validated depth estimates and the “truth” nautical chart depths for the 90 collocated stations using the Stumpf log-ratio model.

Figure 10.
The modelled and validated model depth estimates versus the “truth” nautical chart depths values for the 90 collocated stations using the ANN model.
Figure 10.
The modelled and validated model depth estimates versus the “truth” nautical chart depths values for the 90 collocated stations using the ANN model.

Figure 11.
The correlation between modelled/validated depth estimates and “truth” nautical chart depths for the 90 collocated stations using the ANN model.
Figure 11.
The correlation between modelled/validated depth estimates and “truth” nautical chart depths for the 90 collocated stations using the ANN model.

Figure 12.
The difference between the Stumpf log-ratio model estimates, the ANN model estimates, and the wavelet network model estimates, when compared with “truth” nautical chart depths for the 90 collocated stations.
Figure 12.
The difference between the Stumpf log-ratio model estimates, the ANN model estimates, and the wavelet network model estimates, when compared with “truth” nautical chart depths for the 90 collocated stations.

Figure 13.
The comparison between the bathymetric map derived from the wavelet network model and the nautical chart for the study area.
Figure 13.
The comparison between the bathymetric map derived from the wavelet network model and the nautical chart for the study area.


Table 1.
The correlation and RMS error for traditional Stumpf log-ratio, ANN, and wavelet network models.
Table 1.
The correlation and RMS error for traditional Stumpf log-ratio, ANN, and wavelet network models.
| Model | Stumpf Log-Ratio Model | ANN Model | Wavelet Network Model |
|---|---|---|---|
| Correlation Coefficient for the Models | |||
| Modeling correlation (50 stations) | 89% | 93% | 97% |
| Validation correlation (40 stations) | 89% | 91% | 93% |
| Overall correlation (90 stations) | 89% | 92% | 95% |
| RMS Error for the Models | |||
| Modeling RMS error (50 stations) | 3.26 m | 2.53 | 1.93 |
| Validation RMS error (40 stations) | 2.13 m | 1.76 | 1.55 |
| Overall RMS error (90 stations) | 2.91 m | 2.30 | 1.82 |
Table 2.
The total vertical uncertainty (TVU) allowed by the IHO for all survey orders estimated at 15 m average depth.
Table 2.
The total vertical uncertainty (TVU) allowed by the IHO for all survey orders estimated at 15 m average depth.
| Survey Order | a | b | Maximum Allowable TVU with 15 m Average Depth. |
|---|---|---|---|
| Special | 0.25 | 0.0075 | 0.27 |
| 1a | 0.5 | 0.013 | 0.54 |
| 1b | 0.5 | 0.013 | 0.54 |
| 2 | 1 | 0.023 | 1.06 |
© 2019 by the author. Licensee MDPI, Basel, Switzerland. This article is an open access article distributed under the terms and conditions of the Creative Commons Attribution (CC BY) license (http://creativecommons.org/licenses/by/4.0/).
Share and Cite
MDPI and ACS Style
El-Diasty, M. Satellite-Based Bathymetric Modeling Using a Wavelet Network Model. ISPRS Int. J. Geo-Inf. 2019, 8, 405. https://0-doi-org.brum.beds.ac.uk/10.3390/ijgi8090405
AMA Style
El-Diasty M. Satellite-Based Bathymetric Modeling Using a Wavelet Network Model. ISPRS International Journal of Geo-Information. 2019; 8(9):405. https://0-doi-org.brum.beds.ac.uk/10.3390/ijgi8090405
Chicago/Turabian StyleEl-Diasty, Mohammed. 2019. "Satellite-Based Bathymetric Modeling Using a Wavelet Network Model" ISPRS International Journal of Geo-Information 8, no. 9: 405. https://0-doi-org.brum.beds.ac.uk/10.3390/ijgi8090405
Note that from the first issue of 2016, this journal uses article numbers instead of page numbers. See further details here.