Article

A Comparative Study of Spatial and Temporal Preferences for Waterfronts in Wuhan based on Gender Differences in Check-In Behavior

School of Urban Design, Wuhan University, Wuhan 430072, China
*
Author to whom correspondence should be addressed.
ISPRS Int. J. Geo-Inf. 2019, 8(9), 413; https://0-doi-org.brum.beds.ac.uk/10.3390/ijgi8090413
Submission received: 26 July 2019 / Revised: 27 August 2019 / Accepted: 7 September 2019 / Published: 14 September 2019

Abstract

:
The geographical location and check-in frequency of social platform users indicate their personal preferences and intentions for space. On the basis of social media data and gender differences, this study analyzes Weibo users’ preferences and the reasons behind these preferences for the waterfronts of the 21 major lakes within Wuhan’s Third Ring Road, in accordance with users’ check-in behaviors. According to the distribution characteristics of the waterfronts’ points of interest, this study explores the preferences of male and female users for waterfronts and reveals, through the check-in behaviors of Weibo users, the gender differences in the preference and willingness of these users to choose urban waterfronts. Results show that men and women check in significantly more frequently on weekends than on weekdays. Women are more likely than men to check in at waterfronts. Significant differences in time and space exist between male and female users’ preferences for different lakes.

Graphical Abstract

1. Introduction

A waterfront is a specific spatial section of a city, which refers to the land or buildings adjacent to rivers, lakes, and oceans; it also refers to the parts of water bodies adjacent to a town [1]. A waterfront is defined as an area of interaction between urban development and the needs of the city and its residents [2]. Urban waterfronts have undergone a large-scale transition over the past few centuries [3]. With economic development and people’s higher requirements for their quality of life, an increasing number of people have found more ways to enjoy waterfronts. Urban waterfronts have become unique areas of the urban landscape, as well as a window into urban charm, and are increasingly used for public use [4,5]. The rapid development of early cities destroyed many waterfront areas [6,7]. However, waterfront development often causes social, economic, and environmental problems [8,9,10,11,12]. Therefore, since the 1980s, the seaside has become the focus of strengthening planned interventions and urban renewal [3]. Nowadays, the urban waterfront is one of the most sensitive areas in the urban ecological environment and urban ecological life. With the recognition of the importance of environmental protection and sustainable development, urban waterfronts, as the focus of urban exploration and development within and outside of China, have attracted increasing attention [13]. The development of urban waterfronts is a way to improve the urban landscape, especially its image and economic status [13]. The reconstruction of waterfronts in port cities and other water cities remains mainly confined to developed countries but is beginning to be seen in developing countries [14]. A large number of previous studies analyzed the current situation of urban waterfronts in developed countries and made planning suggestions [8,15,16,17], but relatively few studies have been conducted on waterfronts in developing countries, such as China. At present, the development of urban waterfronts has become a popular topic in China [18]. Almost all Chinese cities have important water bodies that are closely related to urban growth and development, and the revitalization of urban waterfronts has become a necessary catalyst for urban sustainable development [19].
Previous literature mostly focused on the development or regeneration of waterfront areas [16] or related them to relatively objective factors, such as community [15,20], control and management [13,21], landscape planning [4], political ecology [22], and social influence [6,20]. However, these studies have certain limitations, as they did not consider the use of population. Data mining is generally used to determine users’ intended actions and can provide a scientific basis and reference for evaluation based on spatial location [23]. New technologies have been applied to make the interpretation and practice of urban planning highly scientific, and such attempts are still being carried out [24,25,26,27]. The development of mobile technology in recent years has enabled social media networks to couple users’ location information in real time [28]. Research on GPS-based mobile tags, blogs, or social networks is increasing [29,30,31]. Geo-tagged social media data have been used to study language and religious differences [32,33,34,35] and the differences in the places frequented by tourists and locals in cities [36]. The use of big data to analyze the spatial behavior of urban residents and the mechanisms behind urban functions has recently become possible [37,38]. This possibility provides the opportunity to explore the interactions between people and the urban public space with the big data of social media.
Weibo is a popular social platform in China. By the fourth quarter of 2018, Weibo had 462 million monthly active users, 200 million daily active users, and 130 million daily text publications [39]. On the basis of the mobility of people, Weibo users generate a large amount of data, also known as “big data” [40]. Although check-in behaviors displayed in geographical coordinates have limitations (such as a low sampling frequency and location category deviation), these data can reveal the check-in behaviors of Weibo users in a city [41]. The motivations to use Weibo may vary between male and female users. According to statistics, 57% of Weibo users are male, and 43% are female [39]. Many scholars have conducted research on social networks based on gender and found that women are more likely than men to regularly change their personal data [42], use other people’s photographs as their social portraits [43,44], and provide less personal information [42,45], whereas men are more likely to post comments or photographs involving sex or alcohol [44]. However, gender differences in social platforms are rarely used to explore the preferences of men and women for urban spaces, especially waterfronts.
This study aims to analyze the preferences and intentions of Weibo users for 21 major lakes and waterfronts within Wuhan’s Third Ring Road on the basis of gender differences through social media big data. In this study, the target group is waterfront visitors, who may be locals living in Wuhan or outsiders coming to Wuhan from other areas. People are attracted by the lake and come to the waterfront to check in on Weibo. The check-in frequency of Sina Weibo users indicates their geographical preference for waterfronts. This study obtained the spatial and temporal change trends of different genders’ check-in quantities in Wuhan waterfront areas during weekdays and weekends, the whole week, and the whole day through data processing and analysis. The density differences of different genders’ check-in points in the buffer zone of each lake were also analyzed, and the temporal and spatial distributions of different genders’ check-in points in each lake’s buffer zone within a day were obtained. The proportion method was used for data standardization, and the k-means clustering analysis algorithm was further used to classify lakes according to the difference in the density and spatial and temporal distributions of check-in points between male and female users. The former was divided into lakes preferred by male users, lakes preferred by female users, and lakes with the same preferences and intentions expressed by both men and women. The latter was divided into stable lakes, morning peak lakes, evening peak lakes, morning and evening peak lakes, and noon peak lakes. Starting from the points of interest (POI) distribution of waterfront facilities, the POI characteristics of different types of waterfronts were analyzed by the nuclear density estimation method to explore male and female users’ preferences for water bodies, as well as the reasons behind those preferences. The second section describes the basic social and natural background of the research area, the data content used in this study, and the preprocessing process. In the third section, four methods used in this study, relative deviation calculation, proportional method standardization, the k-means clustering algorithm, and kernel density estimation, are proposed. Results, discussions, and conclusions are presented in the following three sections.

2. Materials

2.1. Study Area

Wuhan (29°58′–31°22′ N, 113°41′–115°05′ E) is the capital city of Hubei Province, located in the middle of the Yangtze River Delta [45] (Figure 1). This city includes an urban area and a suburban area, with a total area of 8495 km2. As one of the nine central cities in China, Wuhan has the largest population in central China [46]. The Yangtze River and Han River flow through Wuhan, which is geographically divided into three towns: Wuchang, Hankou, and Hanyang [47]. Wuhan has many rivers, lakes, and ports, and the water area accounts for one quarter of the total urban area [48]. Given its rich water resources, Wuhan is called the city of 100 lakes [49,50]. A total of 166 lakes exist in Wuhan, according to the city’s water resources bureau. Among them, Tangxun Lake is currently the largest urban lake in China, with an area of 47.6 km2 [51]. Many large lakes are located on either side of two major rivers, forming a network of lakes [51].
Wuhan has three ring roads, and the research area is concentrated in the Third Ring Road. The Third Ring Road is basically the dividing line between the city and the suburbs. The city within the third ring road has a high maturity of development, and its economy, culture, industry, and commerce have developed rapidly [1]. The geographical location and POI data of Weibo users’ check-in points are mainly distributed within the Third Ring Road (Figure 2). The two major rivers also bear the three towns and the traffic-carrying function between Wuhan and its surrounding cities. Check points, however, cannot fully reflect the preferences of users. Therefore, the study area encompasses 21 major lakes in the Third Ring Road (Figure 3). These lakes are Tazi Lake, Longyang Lake, Moshui Lake, Moon Lake, Chestnut Lake, Huanzi Lake, West Lake, North Lake, Machine Pond, Small South Lake, Simei Pond, Houxiang River, Ziyang Lake, Lotus Lake, Yezhi Lake, South Lake, Shai Lake, Yangchun Lake, Sand Lake, Shuiguo Lake, and East Lake.

2.2. Data Sources and Preprocessing

The social media data set used in this study is from Sina Weibo. Sina Weibo is a microblogging service launched by sina.com. Users can publish information through web pages, WAP pages (WAP is wireless Application Protocol, as well as an application protocol standard for the combination between mobile phone and Internet.), external programs, and mobile phone SMS or MMS and can upload pictures and links to videos to engage in instant sharing [1]. The Weibo data set used in this study includes the geographical location (longitude and latitude), check-in time, and gender of the users. The data set covers the Wuhan area on 1 January 2018 (solstice) and 31 December 2018, including 997,832 check-in times, among which the male users’ check-in times number 343,973, and the female users’ check-in times number 653,859. POI data were acquired from the China POI data network (http://www.poi86.com/). The POI data of Wuhan city in 2018 were obtained according to administrative regions and time.
According to the selection of Weibo data within the Third Ring Road on the basis of the geographical location, the remaining check in times number 652,870, including 219,880 males and 432,990 females. On the basis of previous targeted research results on Wuhan waterfront buffer zones [52], this study took the area within the Third Ring Road, where the shoreline of 21 major lakes extends 1000 m outward, as the waterfront area of the study. The “buffer” mentioned in this article refers to this range. A total of 411,1358 tweets are available in the buffer zone, including 139,725 male tweets and 271,633 female tweets. These data were visualized by ArcGIS10.5 (Figure 3) (due to the large amount of data, only the check-in points of all Sundays in 2018 are shown here). The POI data in the buffer were captured and visualized using the same method (Figure 4). After cleaning and sorting out the POI data, these data were divided into eight categories: leisure, public service, catering, transportation, education, medical, living service, and accommodation.

3. Methods

3.1. Calculation of Relative Difference

Relative difference refers to the percentage of the absolute deviation of a certain measurement (the difference between individual measured value and the mean value of multiple measurements) in the mean value, which is used to measure the deviation degree of a single measurement result to the mean value. This percentage is usually used as a quantitative indicator for the quality assurance and quality control of the data proportion [41]. In this study, relative difference is expressed as follows:
d a = | P m P f | 2 ,
d r = 2 | P m P f | | P m | + | P f | ,
where d a represents the absolute deviation; d r represents the relative deviation; and P m and P f represent the check-in frequency of male and female users in the study area during 1 January 2018 and 31 December 2018, respectively. This study analyzed the gender difference in preference and willingness to choose waterfronts by comparing the check-in frequency of male and female users within the research scope. We used relative difference rather than absolute deviation to measure the gender differences in the data [53].

3.2. Data Standardization by Ratio Scale

In the multi-index evaluation system, each evaluation index has different dimensions and orders of magnitude due to its different properties. When the level of each index varies greatly, if the original index value is directly used for analysis, then the role of the index with the higher value in a comprehensive analysis will be highlighted, and the role of the index with a lower value will be relatively weakened. Therefore, it is necessary to standardize the original index data to ensure the reliability of the results. In this study, the proportional method was adopted for data standardization when analyzing the change in the trend of the number of check-in in each lake buffer zone for 24 h a day, to reduce the order of magnitude difference of the total number of check-ins in each lake buffer zone. This method is expressed as follows:
x i = 1000 × x i i = 1 n x i ,
where x i is the number of check-in points for male or female users in a certain hour of a certain lake. Here, the change trend of the number of check-in points in a day was analyzed. Therefore, n is 24, and x i is the standardized result of the data in that hour.

3.3. Cluster Analysis

A clustering algorithm can be used to aggregate objects of a set into groups (classes) according to their similarities [54]. In this data analysis, SPSS25.0 was used to perform a cluster analysis on the check-in points of 21 lakes divided by gender in different time segments. Systematic clustering, second-order clustering, k-means clustering, and other operations were performed, and k-means clustering had the best effect.
The k-means clustering algorithm is a classic data analysis method. Under the guidance of input parameter k, the data in a d-dimensional space is automatically divided into k classes, making objects within classes similar and objects among classes different. The basic idea is to randomly select k number from the original data set as the initial center and then calculate the distance of other data to each cluster’s center. Each of the data will be assigned to the nearest cluster center represented by a class according to the most similar principle. The average classes of data objects that are included are used to update the clustering center. The difference between a new clustering center and the previous clustering center is determined according to the convergence function. If the convergence condition is satisfied, then the algorithm will end, and the clustering result will be provided. Otherwise, the iterative allocation will continue until the convergence condition is satisfied [55]. The mathematical expression of the traditional k-means clustering algorithm is as follows:
V = i = 1 k x j S i n ( x j μ i ) 2 .
We used the k-means clustering algorithm in this study to identify the check-in time distribution patterns of various types of waterfront areas, since we needed to identify the clustering of 24-dimensional objects (using the time-changing trend of the check-in quantity based on every hour within a day).

3.4. Kernel Density Estimation

Kernel density estimation is a nonparametric statistical method for estimating unknown probability distributions [56]. This method was popularized by Rosenblatt [57] and Parzen [58] to estimate the density of histograms. The smooth estimation of a density function can be achieved. This smooth estimation makes up for the shortcoming that, in statistics, one cannot show a continuous step function in a histogram. Many different mathematical forms of kernel density estimation exist in practical applications. The common quartic polynomial kernel function was adopted in this study [57]:
λ h ^ ( S ) = i = 1 n 3 π h 2 [ 1 ( S S i ) 2 h 2 ] 2 ,
where S is the position of the point to be estimated, the position of the POI of the ith facility is in a circular range, with S as the center and h as the radius, S S i is the distance from point S i to S , and h is the step length. ArcGIS10.5 was used to analyze the nuclear density of the POI of waterfront facilities within Wuhan’s Third Ring Road and make relevant maps.

4. Results

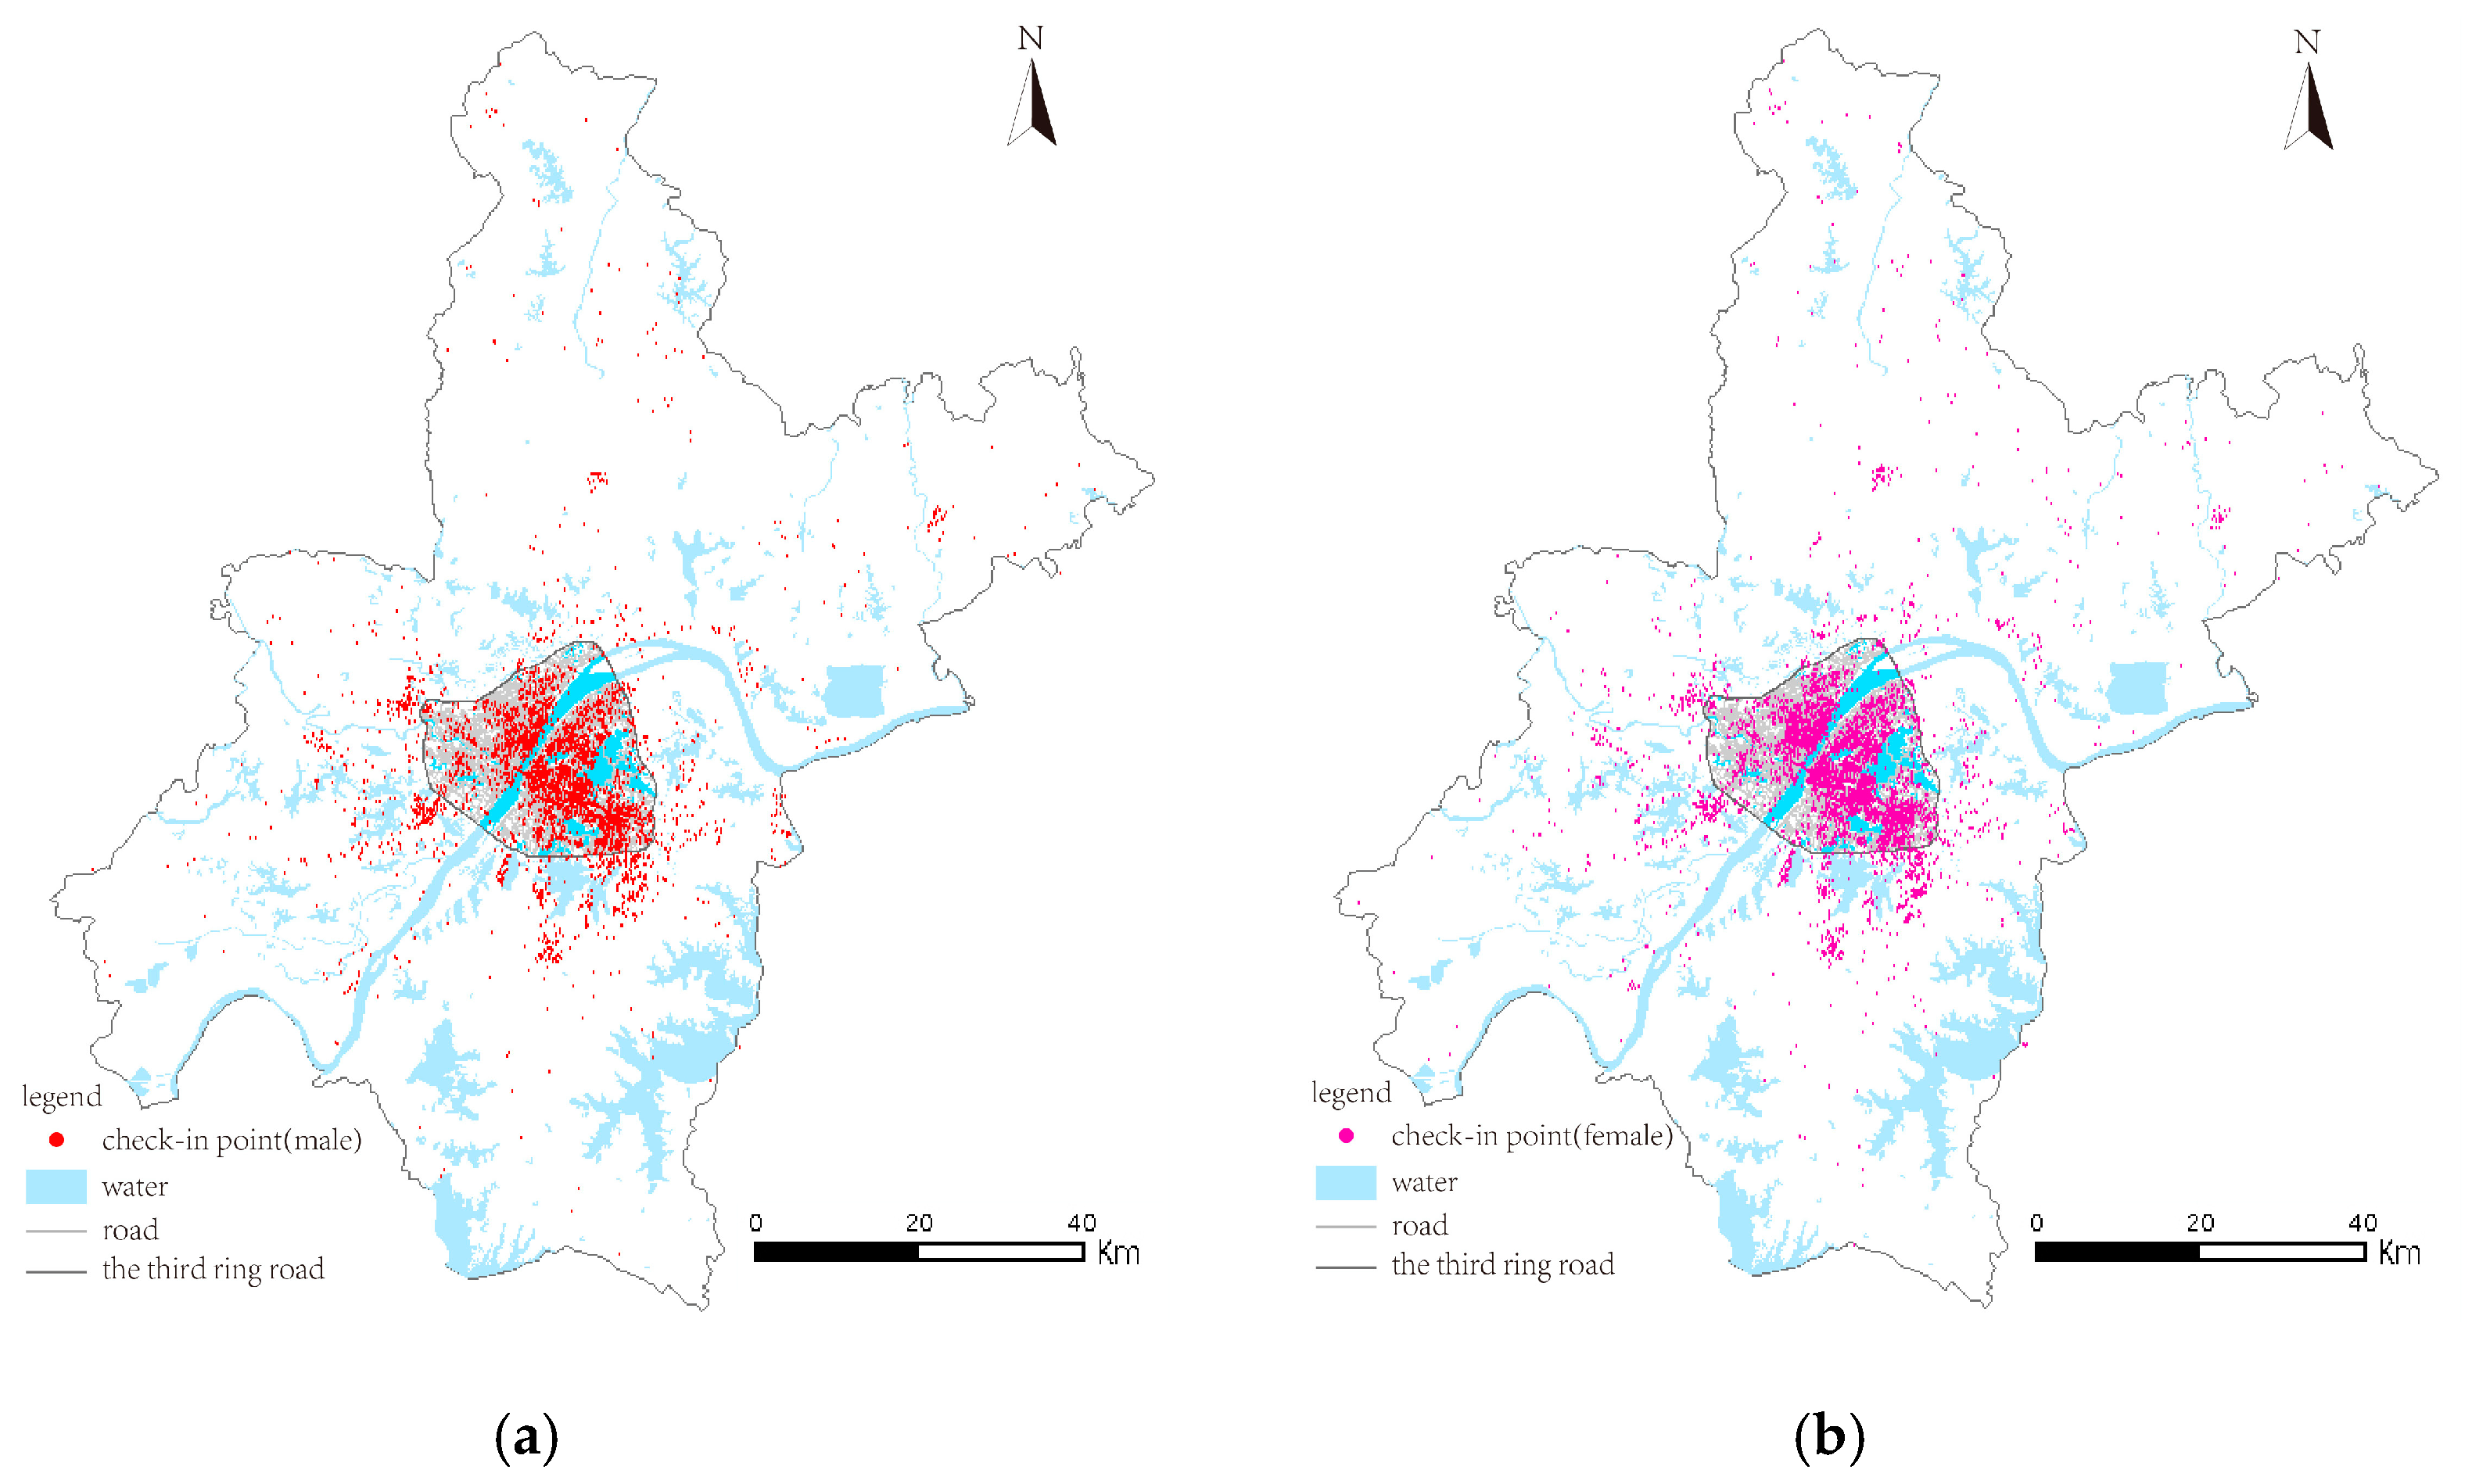
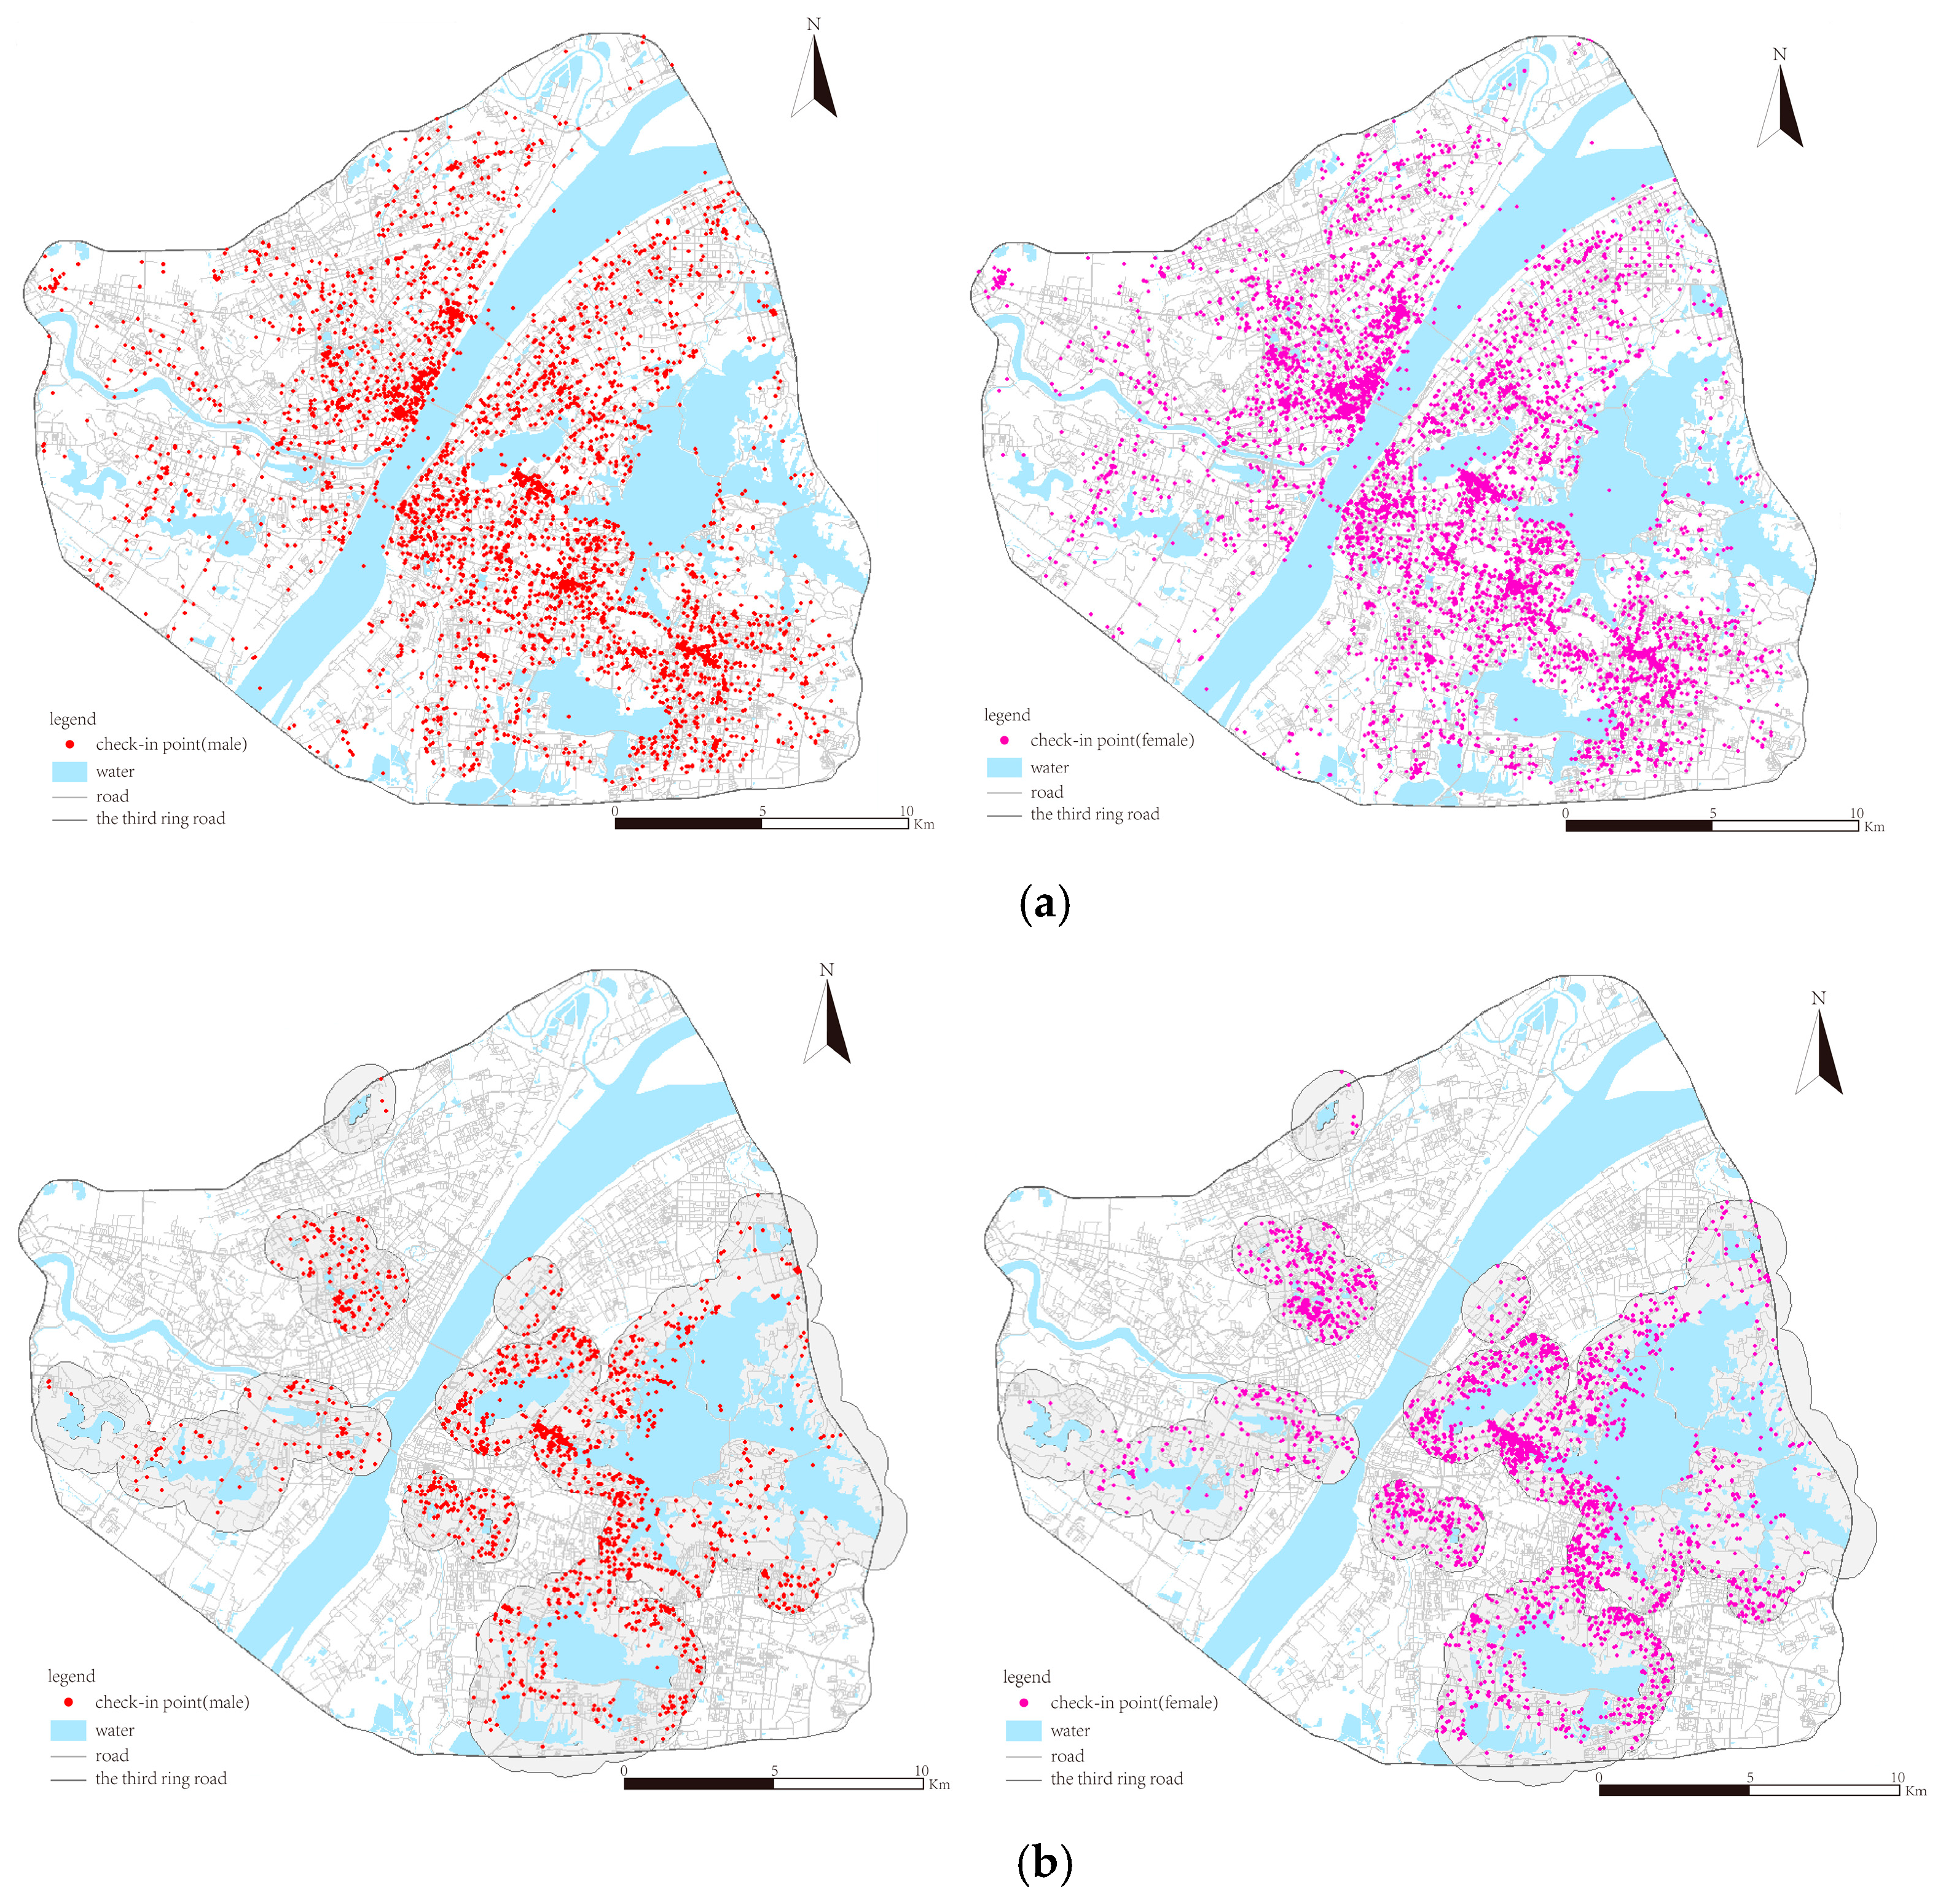
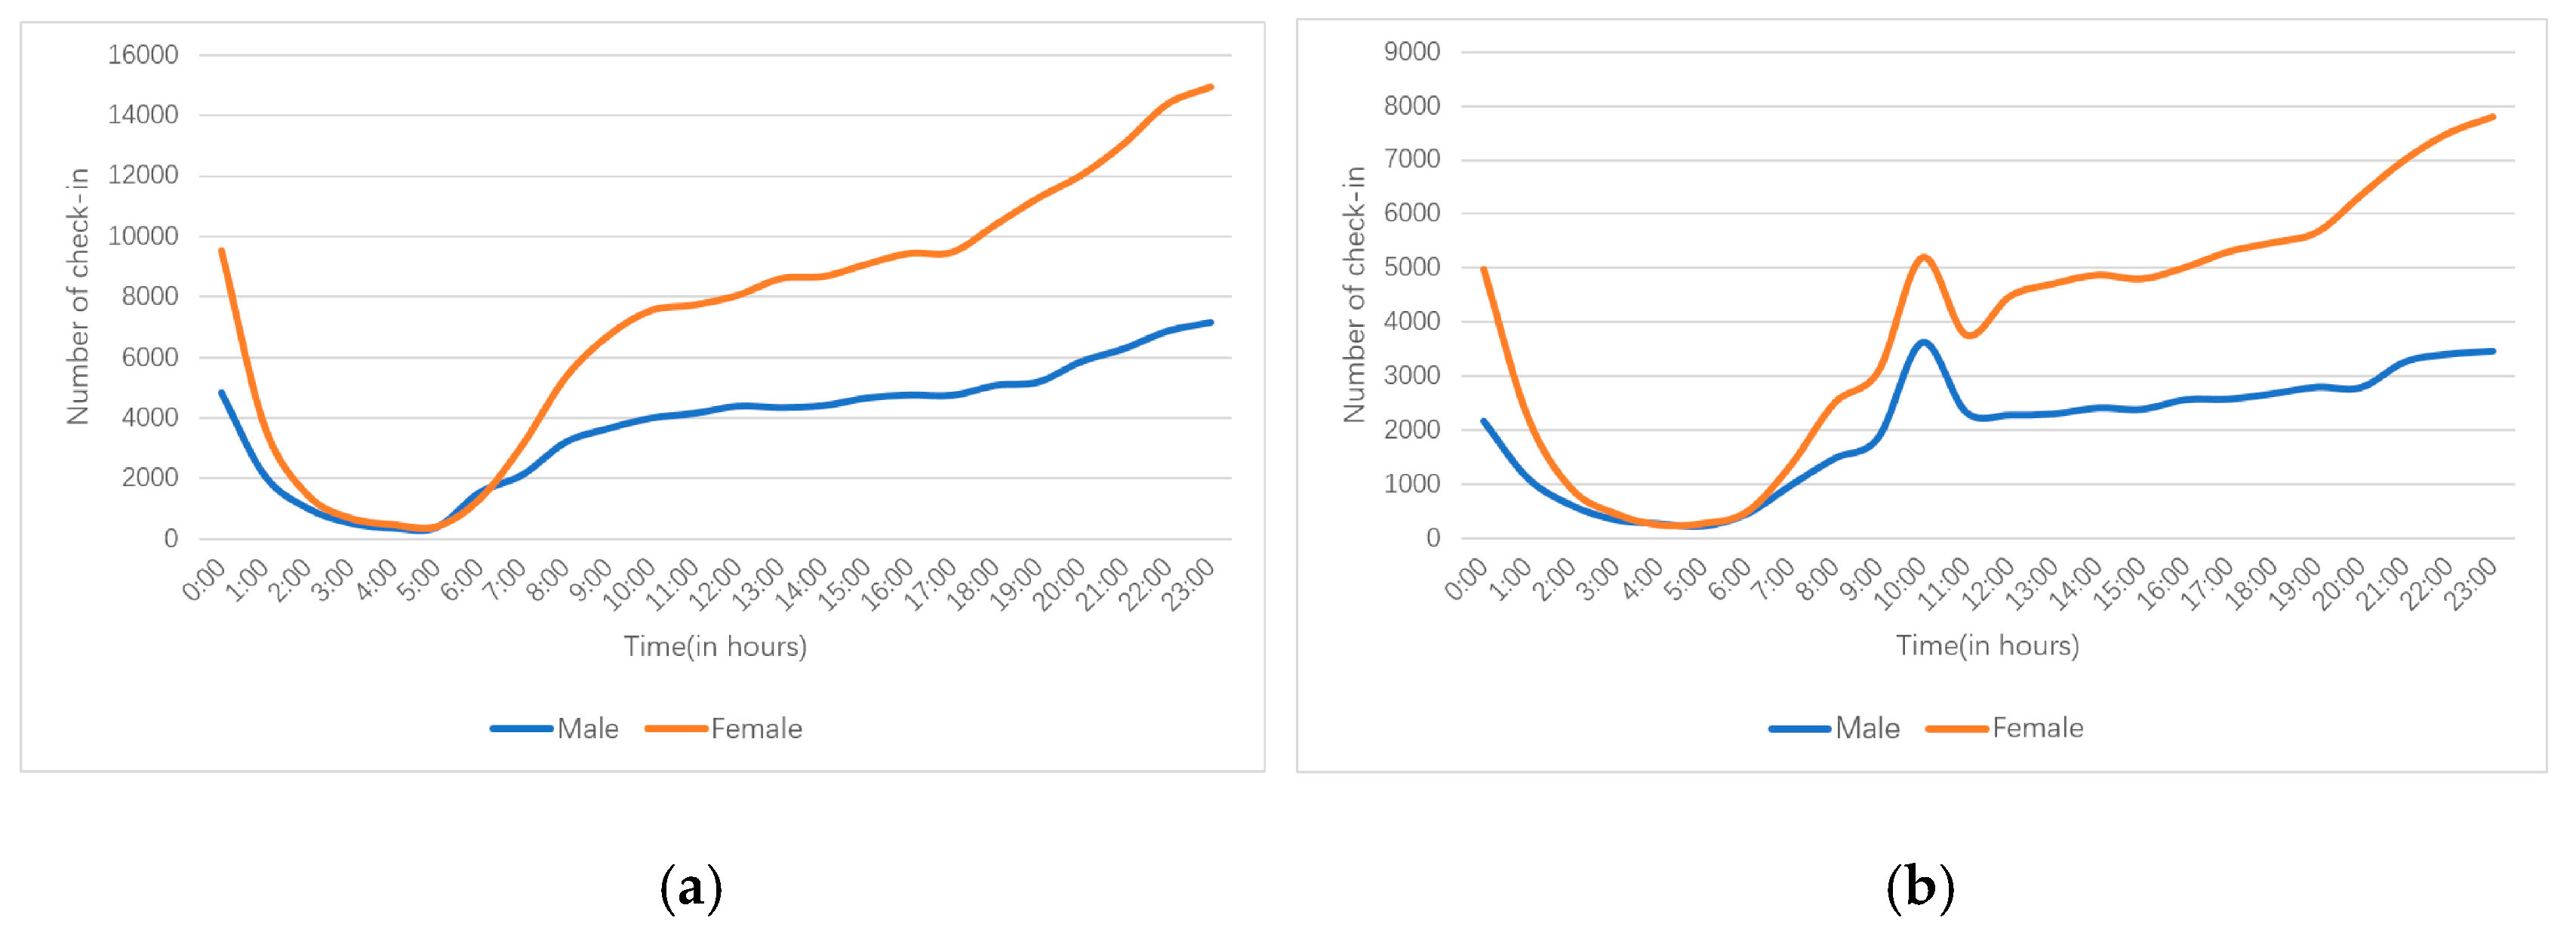
4.1. Spatial and Temporal Changes in the Check-in Quantity of Different Genders within the Waterfront

This study analyzed the preprocessed Weibo check-in data on the basis of gender differences to investigate the preferences and intentions of different genders in choosing waterfront areas. First, statistics were made based on the number of check-in points in the waterfront within Wuhan’s Third Ring Road, according to gender at different times of the week (Figure 5). The results showed that both male and female users checked in significantly more frequently on weekends than on weekdays. Hence, people prefer to go to the waterfront on weekends. The change in the trend of male and female users’ check-in numbers throughout the week was as follows: male and female users’ check-in numbers significantly increased on Saturday and Sunday, and check-in numbers were relatively low and stable from Monday to Friday. This finding is related to China’s working hour system. For the majority of employees, Saturday and Sunday are their weekly rest days. Without work schedules, and with more free time at their disposal, these users are more likely to go to the waterfront. On weekdays and weekends, the number of female users is higher than that of male users. This is also in line with the statistical results of the 2018 data for the whole of Wuhan city in this study. In the total data for the check-in number of users in Wuhan in 2018, there are about twice as many female users as male users (343,973 times for male users and 653,859 times for female users). Official data show that men account for 54.8 percent of Weibo users in Hubei province, while women account for 45.2 percent [40]. However, In the waterfront area of Wuhan, men check in less than women. This difference may be because female Weibo users in Wuhan are more likely to use the check-in function with geographical coordinates than male users.
Second, we used relative deviation to calculate the gender difference in the number of check-in points in the waterfront within Wuhan’s Third Ring Road. The differences between the number of check-in points for different genders on weekdays and weekends (Table 1), and the differences throughout the week (Table 2), were obtained. In Table 1, the relative difference value of weekends was significantly greater than that of weekdays. The calculation results in Table 2 showed that the relative difference value of male and female users’ check-in quantity was greater than 0.6 every day within a week, and the largest difference value was 0.66 on weekdays. These findings suggest that women are more likely than men to check in at the waterfront throughout the week. The gender gap was larger on weekends than weekdays, with peaks on Sundays.
We analyzed the changing trend of the number of check-in points within 24 h on weekdays and weekends to further refine the temporal and spatial changes in the number of check-in points, for different genders, at the waterfront (Figure 6). On weekdays, check-in numbers for male and female users increased rapidly between 05:00 am and 10:00 am. From 10:00 am to 18:00 pm, the check-in numbers for male and female users increased slowly and remained relatively stable. After 18:00, the check-in numbers of male and female users increased again at a fast rate, reaching the peak for male and female users at 23:00 in the evening. The peak of the number of check-in points at 23:00 may be because people experience leisure time after work from 18:00 to 23:00, and most people start to sleep and rest after 23:00; because the number of Weibo check-in points starts to decline, the number of check-ins peaks at this point. On the other hand, this result could also be due to the presence of some residential areas on the waterfront. Users employ Weibo to check in at home before going to bed, which makes the peak appear later than expected. From 00:00, the number of check-in points begins to decline significantly; from 03:00 to 05:00, the number of check-in points for male and female users falls to the lowest value within a day (close to 0). This result indicates that, on weekdays, users are more willing to sign in at the waterfront in the afternoon than in the morning. During the day, male and female users are most likely to check in at the waterfront after dinner. The obvious difference between the changing trend of check-ins on weekends and weekdays is that the check-ins of male and female users show a small peak at approximately 10:00 am. According to the analysis results, both men and women have a willingness to check in at the waterfront during mid-morning on weekends, when they have no work schedule and their whole day is free for personal enjoyment.

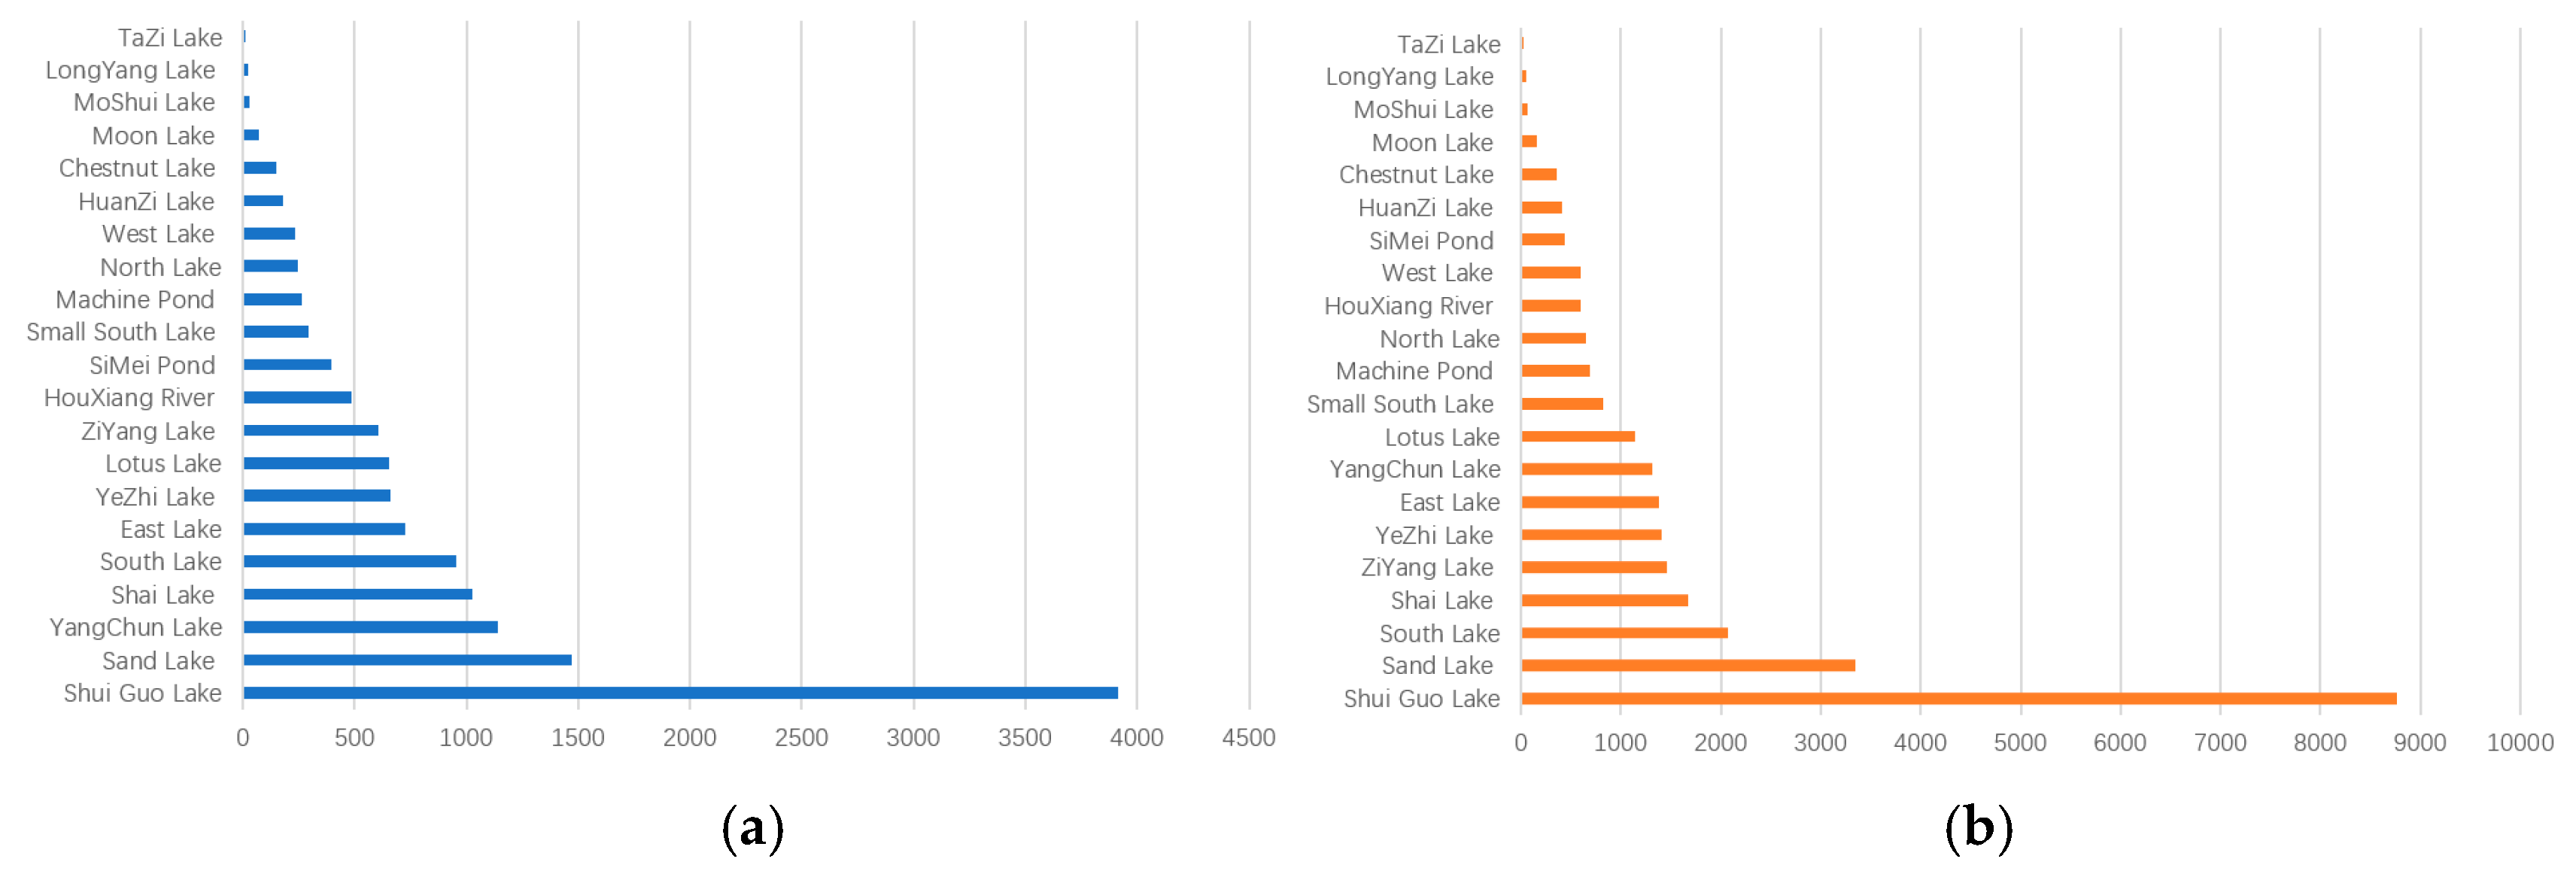
4.2. Each Lake Buffer Zone Has Different Gender Sign-in Point Densities

A large gap exists in the sizes of 21 lakes within Wuhan’s Third Ring Road. These lakes consist of east lakes (with a water area of 88 km); a large city lake, which is well-known in China; the Small South Lake (with a water area of 0.0243 m); and west lakes (with a water area of 0.0487 m), which are relatively small. Differences in lake size lead to differences in lake shoreline lengths, making the area of the buffer zone of each lake relatively different. Therefore, Weibo users can check in to different geographical ranges for each lake. We calculated the density of the check-in points in each lake buffer zone on the basis of gender differences to reduce this effect (Table 2). The number of male or female users’ check-in points per unit area was obtained using the ratio of the number of male or female users’ check-in points to the buffer area of a lake.
The density calculation results were divided according to gender and counted according to the numerical value to reflect the density of male and female users’ check-ins in each lake’s buffer zone. A large gap was observed among the different lakes (Figure 7). The density of male and female users checking in at the buffer zone of the fruit lake was much higher than that in other lakes, and the value was more than two times higher, with a density of 3911.81 males and 8767.95 females. In Tazi Lake, which has the lowest density, the check-in density of male users was 13.35, and that of female users was 23.21.
We compared, for each lake, the ranking of the check-in point density of male users with that of female users to analyze the gender differences in the check-in point density for each lake buffer zone (Table 3). We found that the first and second most popular among male and female users were the fruit and sand lakes, respectively. South Lake ranked third among women and fifth among men. Thus, South Lake was more popular with female users. Ziyang Lake, Small South Lake, Machine Pond, North Lake, and West Lake were also in the same situation. By contrast, Yangchun Lake, Houxiang River, and Simei Pond were more popular with men. The largest gap was found for Yangchun Lake, which ranked third among men and eighth among women. Shuiguo Lake, Sand Lake, Shai Lake, Yezhi Lake, East Lake, Lotus Lake, West Lake, Huanzi Lake, Chestnut Lake, Moon Lake, Moshui Lake, Longyang Lake, and Tazi Lake were basically the same for their ranking of male and female users, indicating that, based on their check-in behaviors, both men and women had the same preferences and intentions for waterfronts at these lakes.

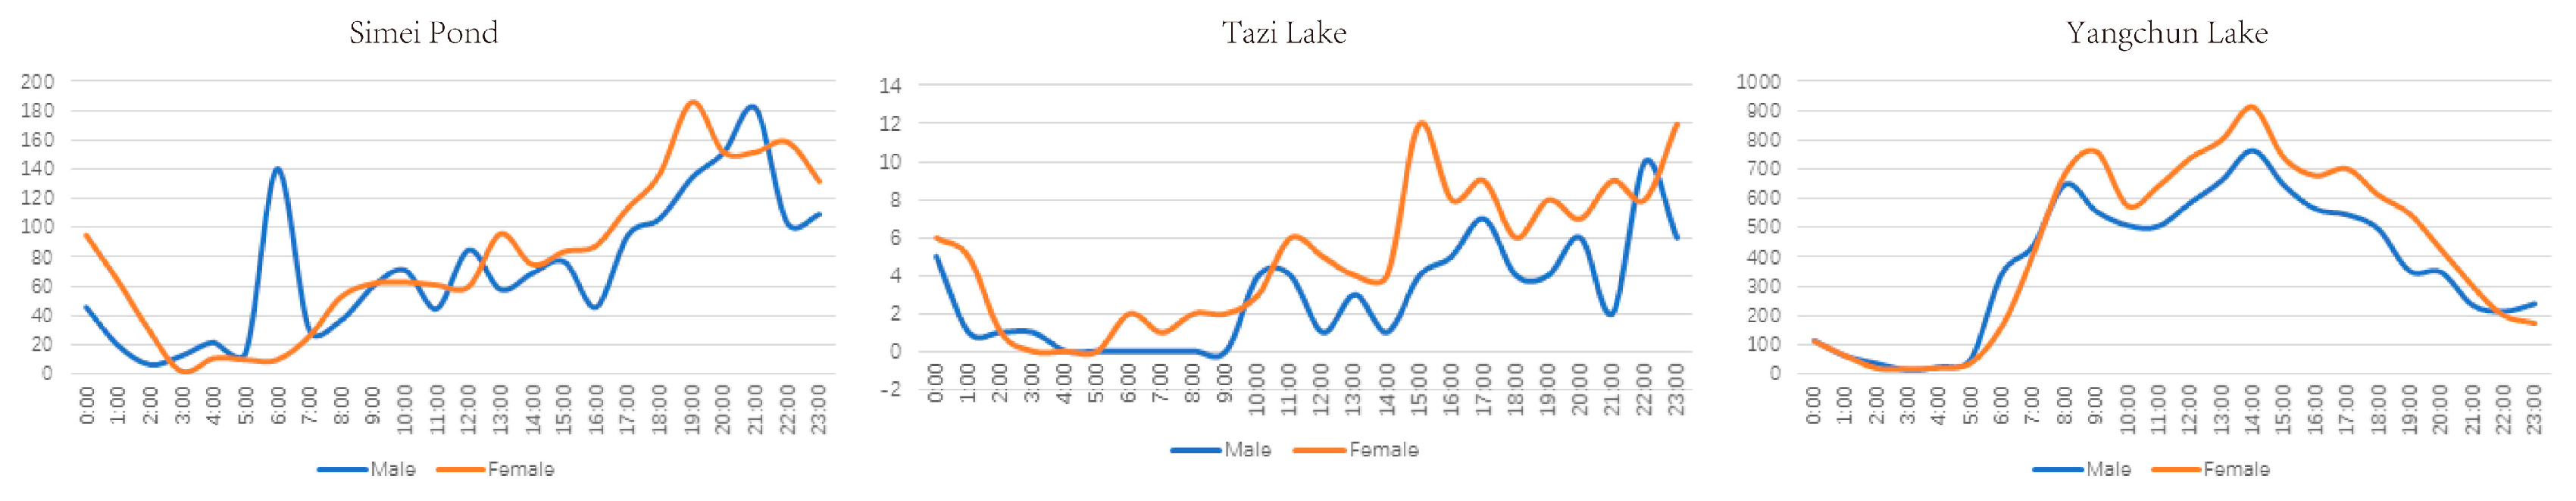
4.3. Temporal and Spatial Distribution of Different Genders’ Check-In Points in Each Lake Buffer Zone

By further deepening of the scale of the study, we analyzed the changing trend for the number of check-in points for different genders in the buffer zone of each lake within 24 h to study the temporal and spatial changes in the number of check-in points of different genders on the waterfront (Figure 8). Figure 8 shows that the distribution trends of different lake check-in points were different. Several male and female lake users had similar temporal distribution trends for their number of check-in points. Shuiguo Lake, east Lake, Yezhi Lake, South Lake, North Lake, West Lake, and Tazi Lake all participate in the gradual increase in the number of sign-ins from morning to night, reaching the peak in the evening and hitting the lowest point in the early morning. In Huanzi Lake and Houxiang River, the number of men and women signing in peaked in the morning. Attendance at Yangchun Lake peaked at noon. At other lakes, male and female users had obvious differences in the temporal distribution trends of the number of check-in points. Shai Lake and Sand Lake show a short peak in the morning for men, but not for women. The number of female visitors to Chestnut Lake increased at noon, while the number of male visitors remained stable. Simei Pond’s check-in numbers for men peak in the early morning, but did not peak for women. It is worth noting that the number of females that checked-in in Ziyang Lake, Lotus lake, Machine Pond, Moon Lake, Small South Lake, Moshui Lake, and Longyang Lake showed a very obvious peak in the morning, while the number of male check-ins remained stable. None of these lakes are located in very prosperous parts of the city, and the total number of check-in points is much lower than that of Shuiguo Lake, East Lake, and other lakes located in prosperous areas. Green squares and other facilities have been built around these lakes, so the apparent peak in the number of check-in points for women in the morning may be related to the popular square for dancing among middle-aged and elderly women in China that is located nearby. In the morning, women come to the square or open space of the waterfront to do square dancing for exercise and check in on Weibo, which underpins the peak number of check-in points for women in the waterfronts of these lakes in the morning.
The k-means clustering algorithm was used to classify the temporal distribution trend of the number of check-in points for male and female users in the 21 lakes, and four clustering centers were calculated (Table 4). These four clustering centers are the result of the k-mean clustering algorithm. Their properties were divided into five categories according to the frequency and sequence of the four clustering centers at each lake. After clustering the number of check-in points of different genders for 24 hours at each lake, five kinds of situations appeared, and the lakes were divided into five types. The four cluster centers, which appear in order of 1234 and have similar frequencies, are lakes of a stable type (class A). The lake with the highest frequency in cluster center 2 in the evening is the evening peak lake (class B). The lake with the highest frequency in cluster center 2 in the morning is the morning peak lake (class C). Cluster center 1, at a relatively high frequency, appeared in the morning, and evening lakes became morning and evening double peak types (class D). The lake with cluster center 2 or 4 at noon became the noon peak type (class E). Statistics showed that each lake has its own attributes among male and female users (Table 5).
The results showed that North Lake, East Lake, Chestnut Lake, South Lake, Sand Lake, Shai Lake, Shuiguo Lake, West Lake, and Yezhi Lake are stable waterfronts among male users and the evening peak waterfronts among female users. This difference indicates that the willingness of men to check in at the buffer zone of nine lakes in a day was relatively balanced, whereas women preferred to check in at night at the buffer zone of these lakes. Longyang Lake, Moshui Lake, Small South Lake, and Moon Lake represent the stable waterfronts among male users and the morning peak waterfronts among female users, indicating that female users preferred to go near these lakes in the morning. Machine Pond and Ziyang Lake are categorized as stable waterfronts among male users and the double-peak waterfronts in the morning and evening among female users. Compared with men’s preferences for the balanced distribution of these lakes, female users showed a stronger preference for these lakes in the morning and evening. Houxiang River and Huanzi Lake were early-morning rush water fronts among male and female users. Users of different genders liked to check in at these lake buffer zones in the morning. Among male users, Lotus Lake was an evening peak waterfront area; among female users, it was a morning and evening double-peak waterfront area. In the morning, men and women showed their willingness to sign in near Lotus Lake, and women preferred to sign in near the lake in the evening. Simei Pond, on the other hand, was an evening peak waterfront among male users and an evening peak waterfront among female users. Men and women showed their willingness to sign in near Lotus Lake in the morning, whereas men preferred to sign in near Lotus Lake in the evening. Tazi Lake was an evening peak waterfront area among male and female users, indicating that users of different genders showed a stronger preference for Tazi Lake at night. Among male and female users, Yangchun Lake belonged to the noon peak waterfront area, indicating that men and women preferred to check in near Yangchun Lake at noon.

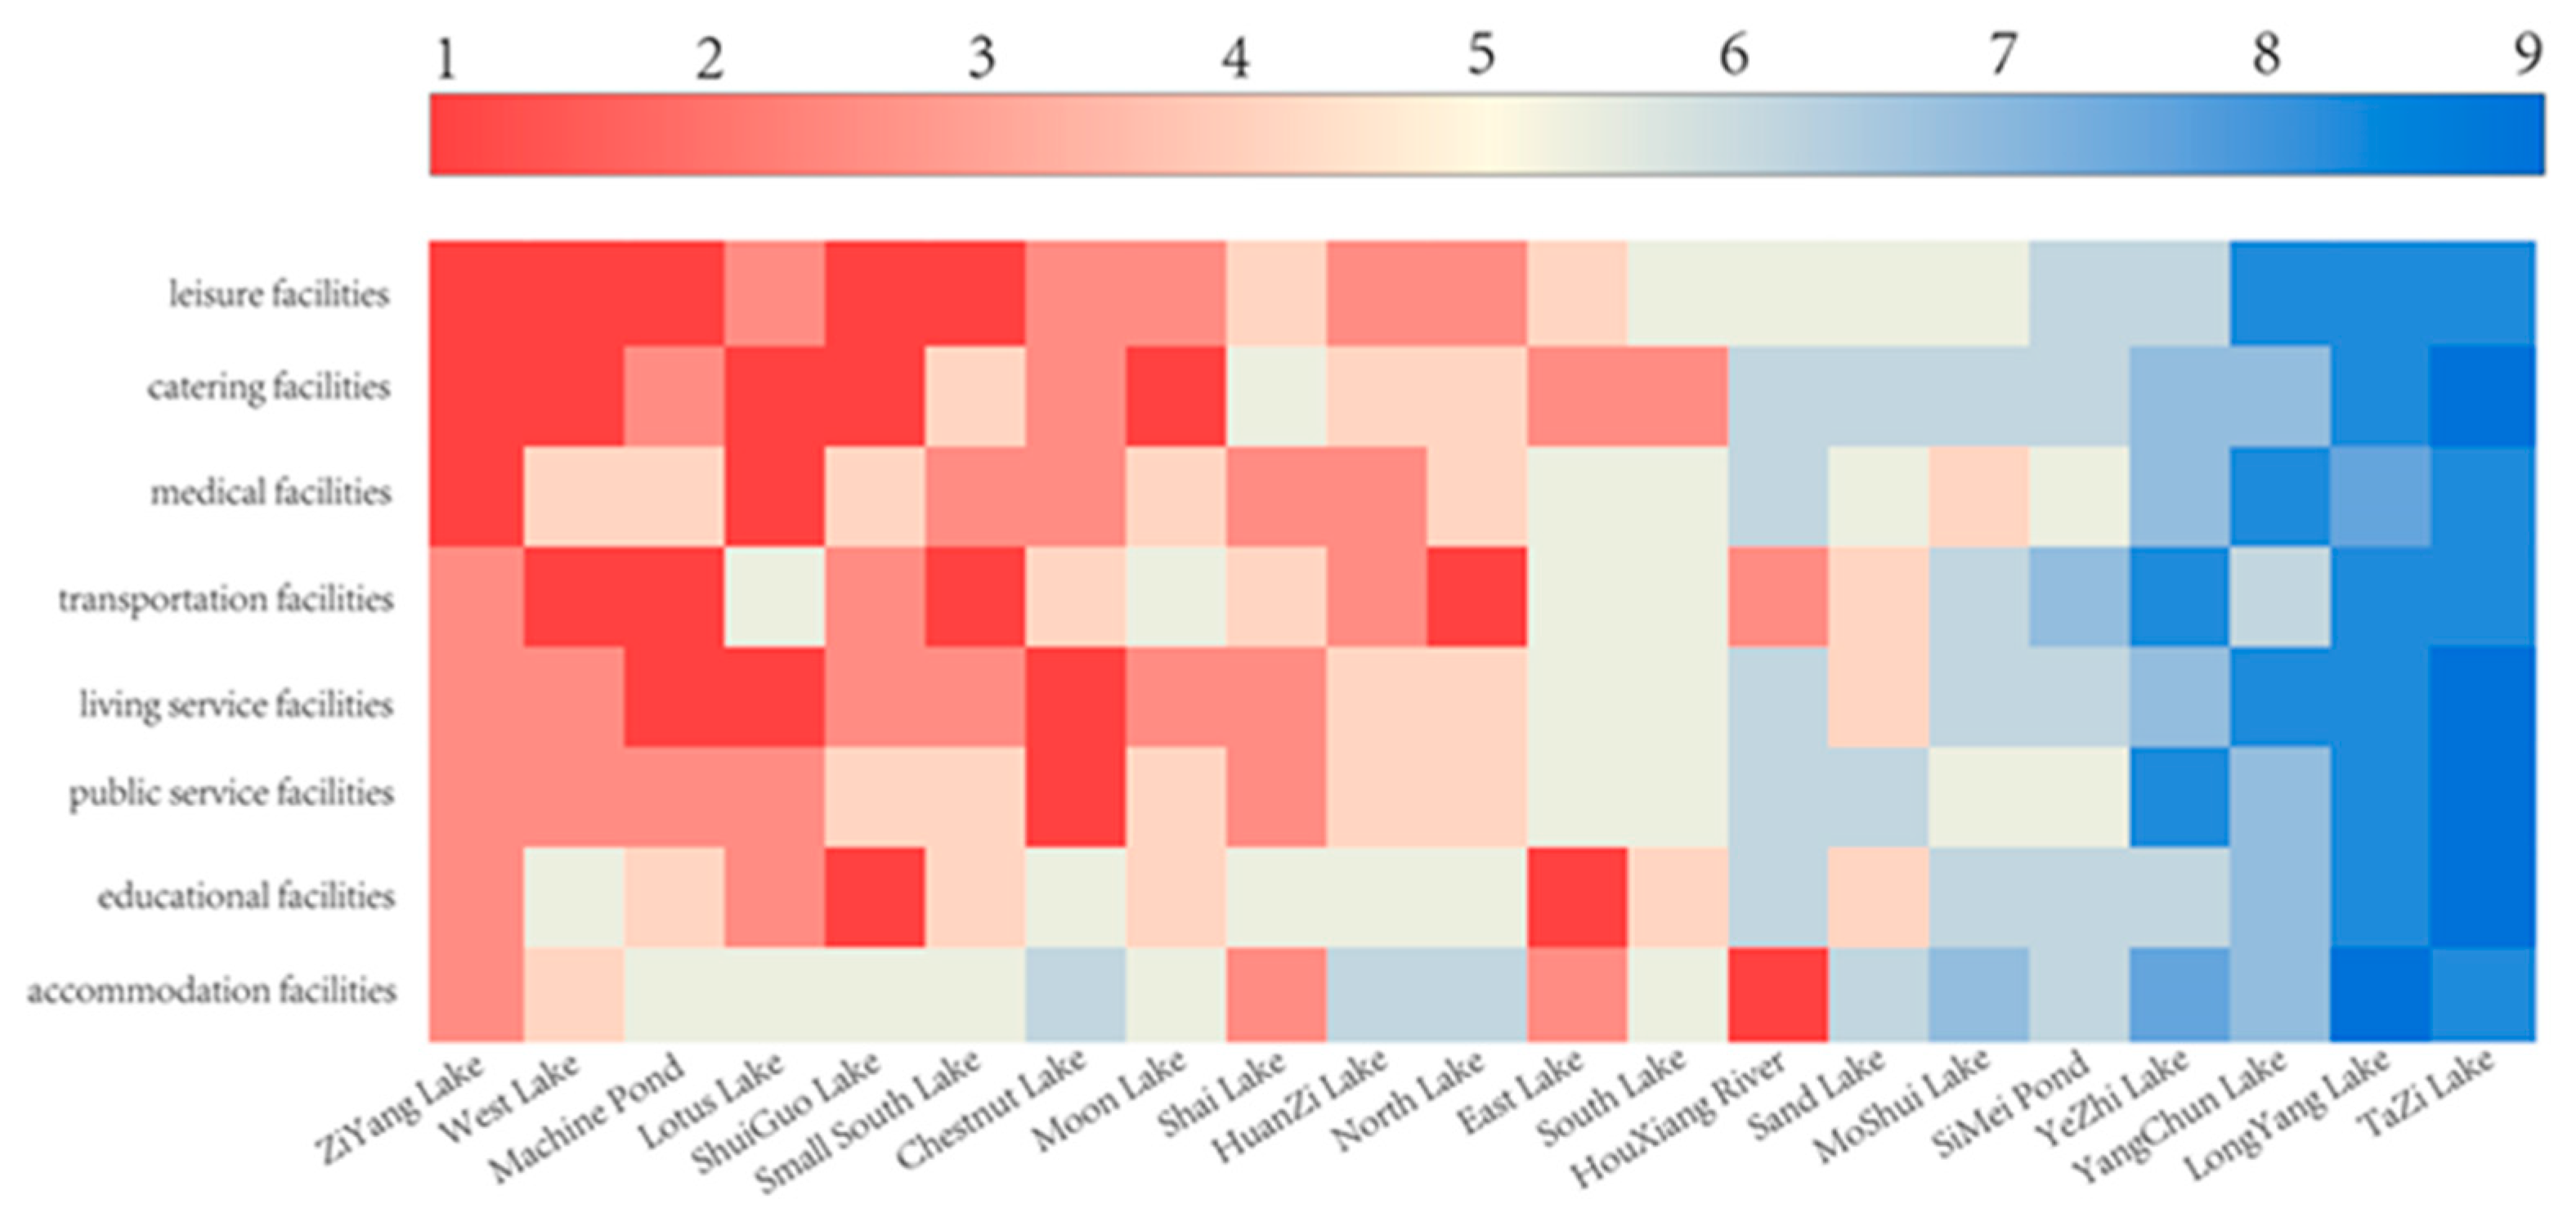
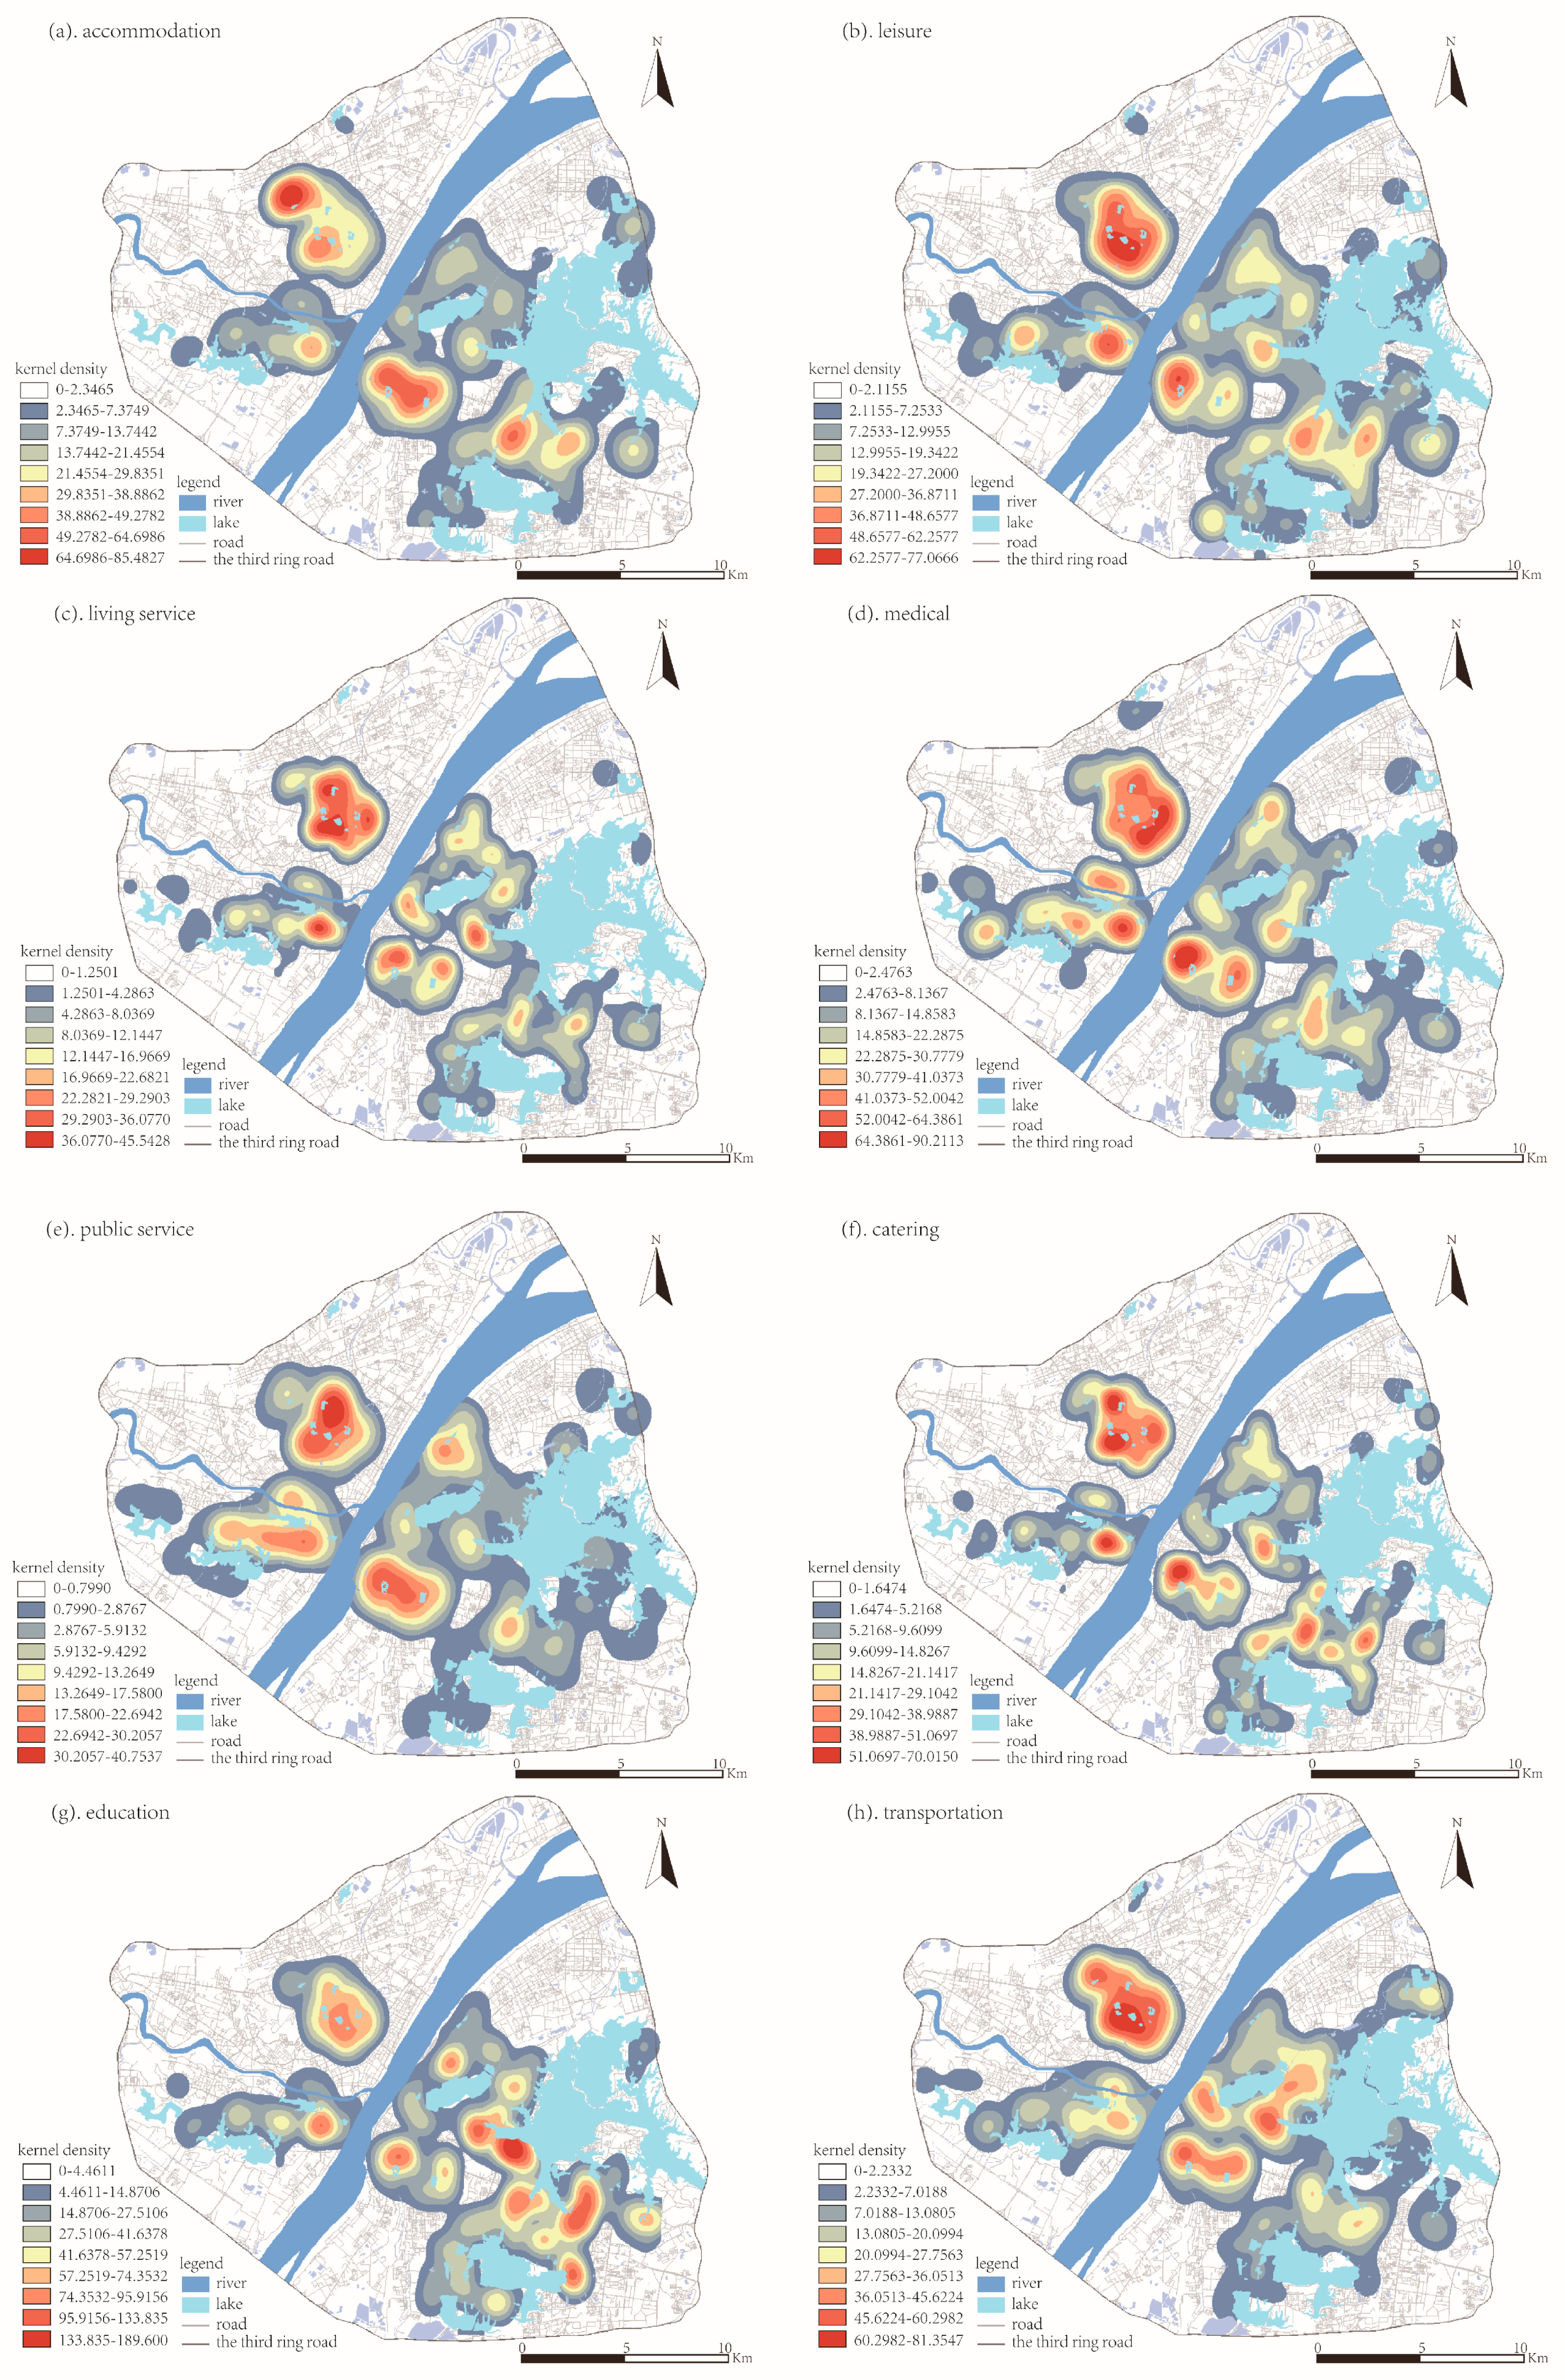
4.4. Distribution Characteristics of POI around Lakes with Gender Difference

4.4.1. Nuclear Density and Cluster Thermodynamic Analysis

The male and female users’ preferences and intentions for water bodies can be obtained by analyzing the POI characteristics of the waterfront areas with different check-in conditions for different genders. We analyzed the nuclear density of eight POI types in the 1000 meter buffer zone of 21 lakes within the study area and divided the aggregation degree of the points from high to low into grades 1 to 9, according to the unit area value, and the aggregation degree gradually increased from blue to red (Figure 9).
The cluster with the highest level for each facility point in each lake buffer zone was counted, and a thermal map was drawn for analysis (Figure 10), where values 1–9 represent the cluster level from high to low.

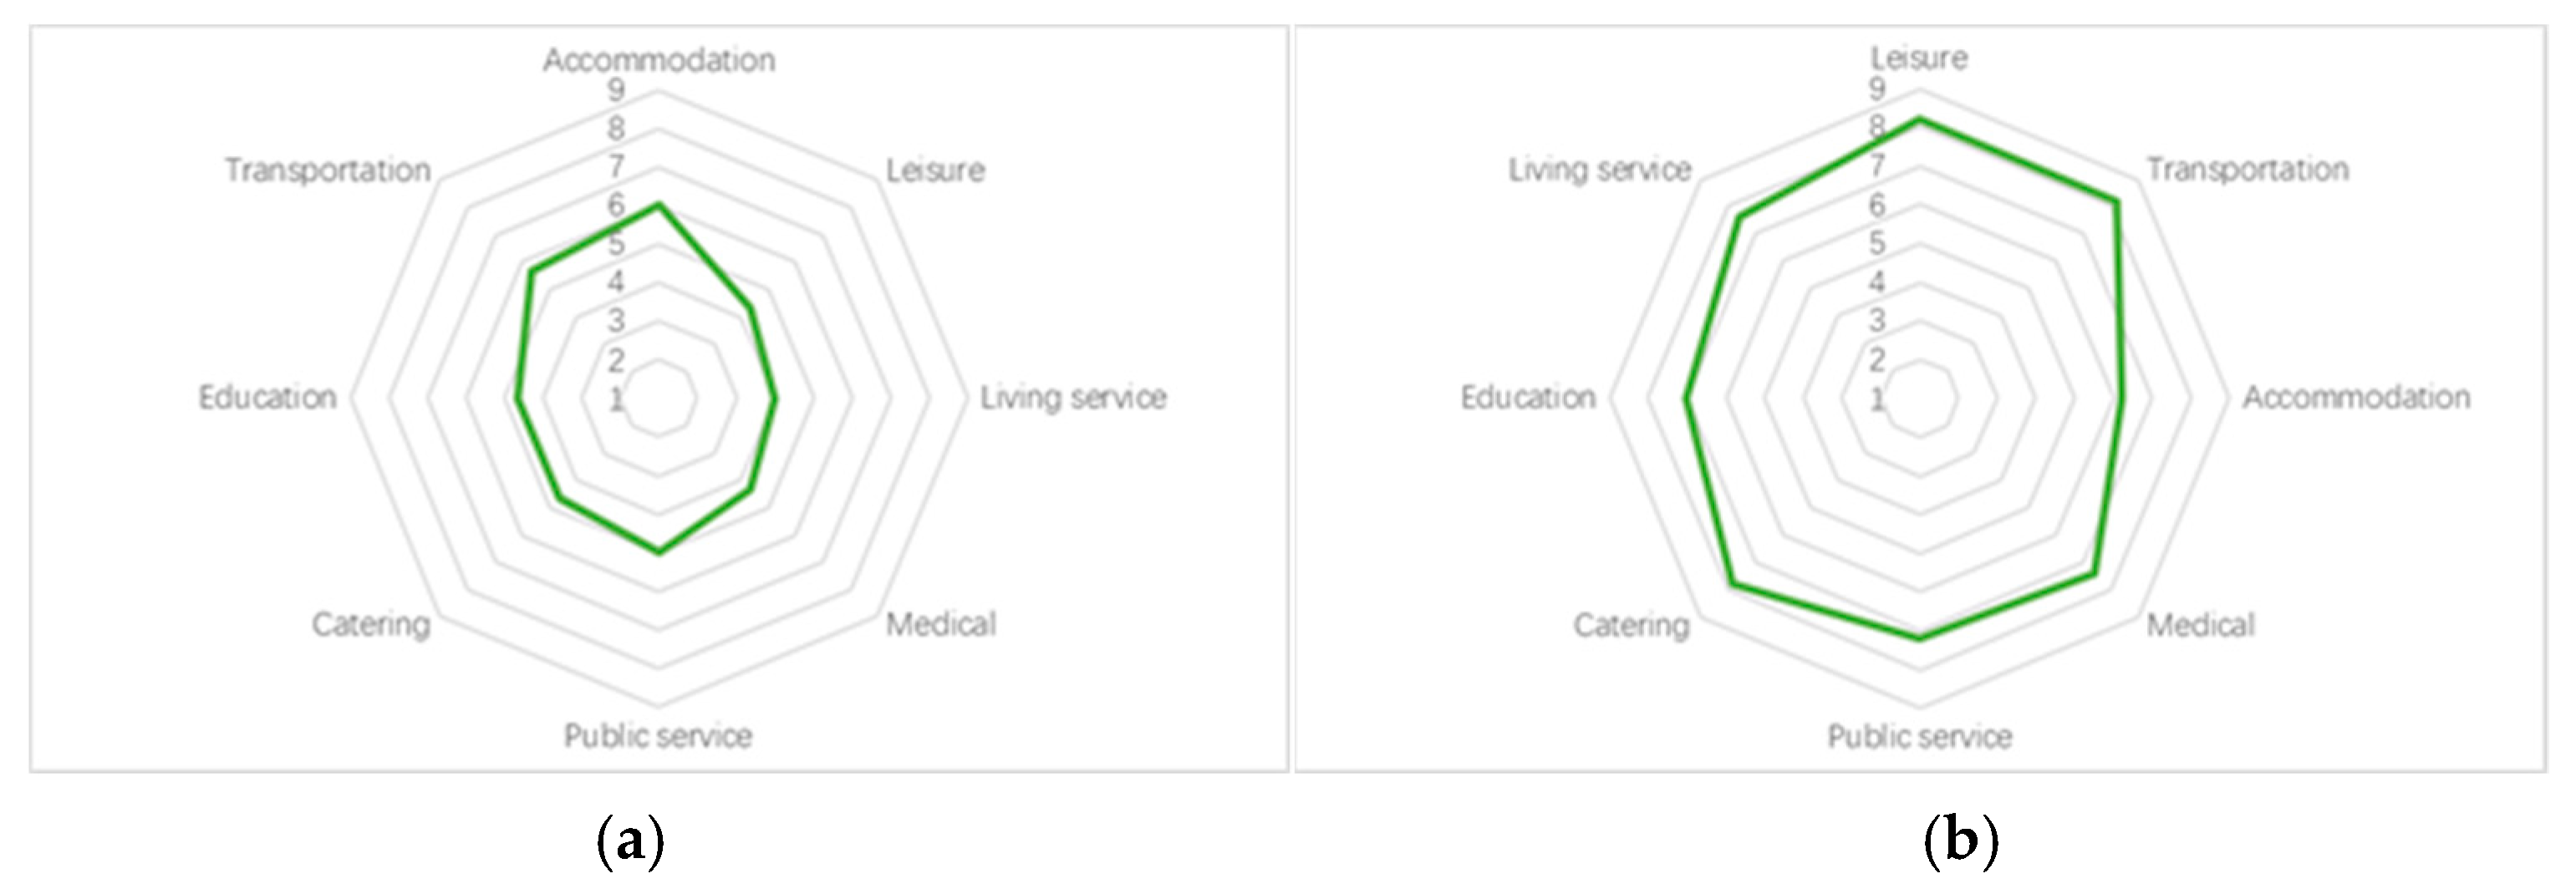
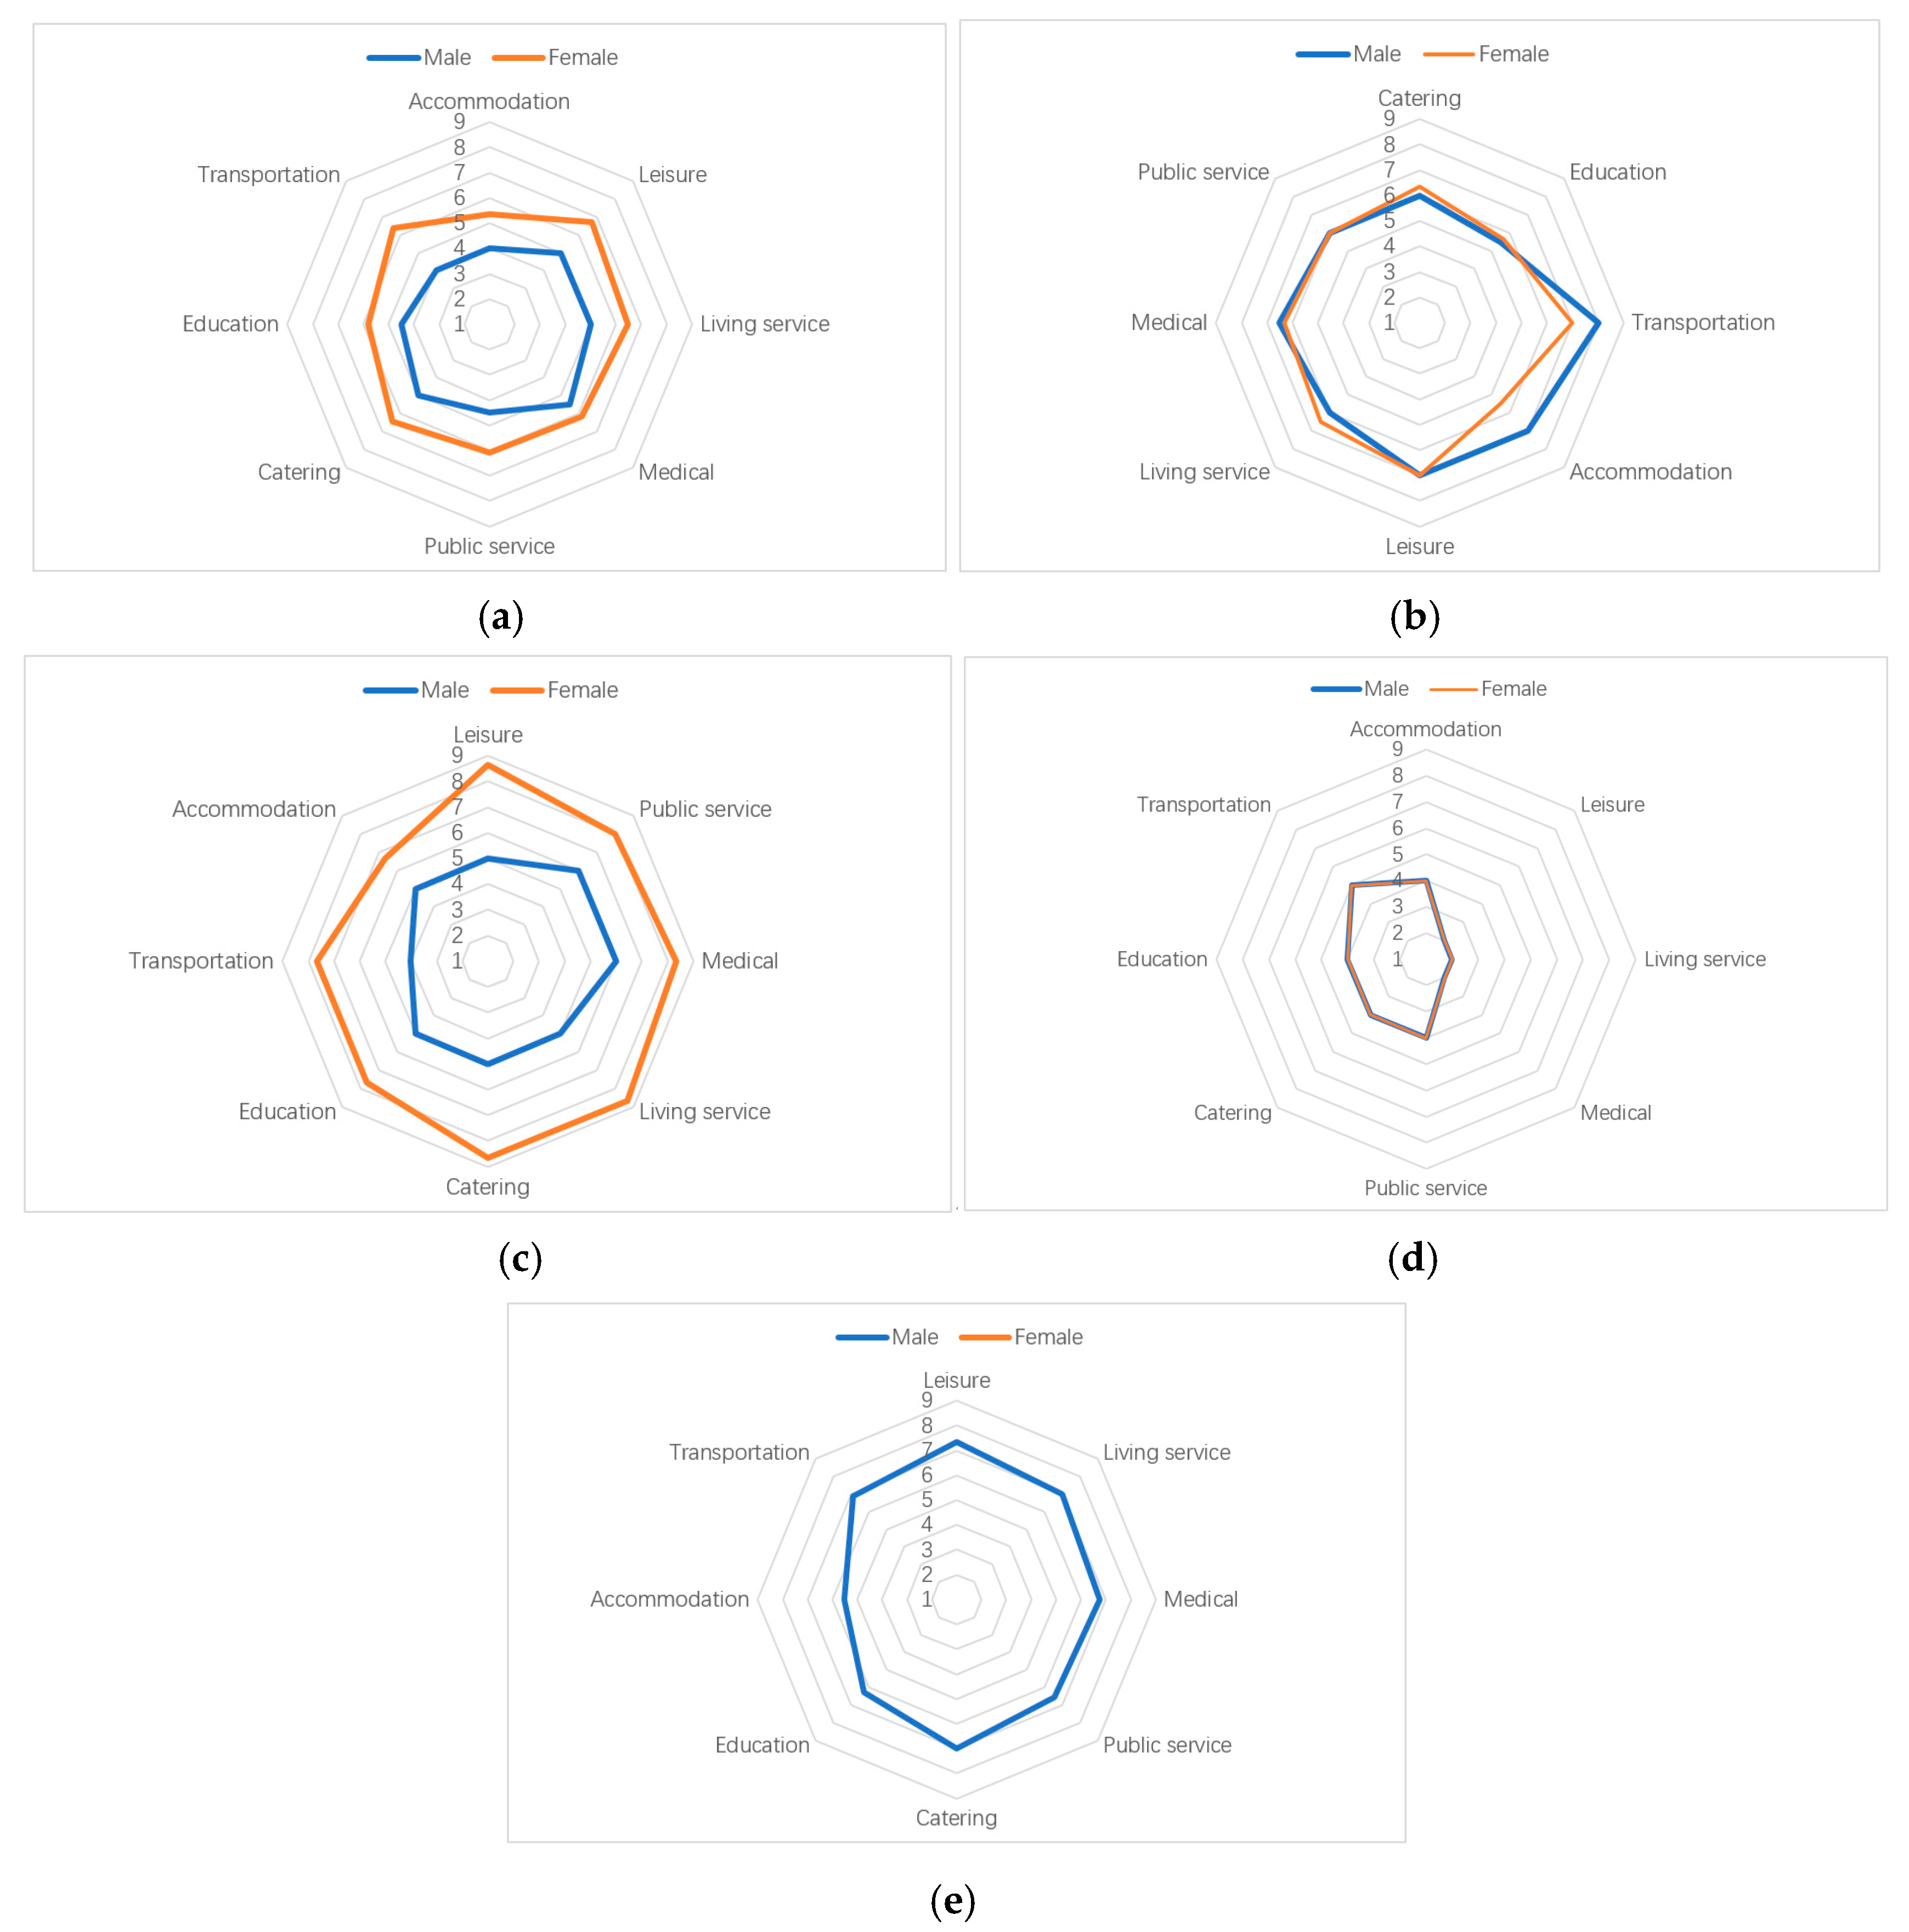
4.4.2. Characteristics of Waterfront Preference and Willingness Based on Gender Difference

The POI cluster level was used to combine the results of comparing the rankings of various lakes based on the density of male and female users’ check-in points (Figure 11). We found that the lakes that women preferred had higher levels of POI for all types, with dining and entertainment facilities being the most important POI. Female users’ preference for waterfronts was affected by the POI distribution, and female users showed a stronger preference for waterfronts with a dense distribution of catering and entertainment facilities. Lakes that were more popular with male users tended to have lower clustering levels for all types of POI. The check-in performance of male users in the waterfront was less affected by the distribution of the POI, and male users were more likely to generate preferences and intentions involving the water itself.
With a POI cluster level combination according to the lake classification results of the clustering algorithm (Figure 12), we found that most of the lakes preferred by male users were stable; the lotus lake and the lake tower type for male users belonged to the late peak lakes, and the lakes with the same types of POI levels were relatively low.
These results verified that male users were fond of waterfronts with a relatively balanced distribution in a single day and showed a strong inclination toward the water body itself. Male and female users showed a relatively high level for preference for mid-morning rush hour lake transportation facilities. Male and female users preferred to check in during the morning in the waterfronts with dense traffic facilities. This result is consistent with the morning rush hour of men and women going to work. In the morning working hours, the elderly and children who have time to travel are less likely to drive their private cars to the waterfront, so convenient transportation is an important factor influencing people’s preference and willingness to go to the waterfront at this time. Most of the lakes belonged to the evening peak type among female users, and the POI grades for these lakes were relatively high. Among female users, Machine Pond, Ziyang Lake, and Lotus Lake, which belonged to the morning and evening double-peak types, had very high cluster levels of entertainment, catering, and public service facilities in their POI characteristics. Female users’ fondness for the waterfront was affected by the distribution of POI, and these users were more likely to show a preference for and willingness to go to waterfronts with a dense distribution of catering, leisure, and public service facilities.

5. Discussion

Since ancient times, the construction and development of cities have been inseparable from the existence of rivers or lakes, and areas containing water bodies have always been the economic and cultural centers of many cities and an indispensable element in the urban landscape [58,59,60,61]. As the most dynamic public open space in the city, urban waterfronts provide a water-friendly environment and green corridors, which can help meet people’s spiritual needs in the city [13]. Our study was based on gender-clustering and nuclear density analyses to conduct a spatial–temporal study of the check-in behaviors of tourists at lakeshore waterfronts, explore the check-in situations on weekdays and weekends (and the changing trend of hourly and daily check-in quantities), and reflect the preferences of different genders to visit the waterfront. Our research framework has five key steps. First, a buffer zone of 1000 m was established to demarcate the research scope of the waterfront. Second, we showed the overall distribution of check-in points for users of different genders in all lake buffer zones. Third, we showed the check-in point distribution users of different genders in 21 lake buffer zones at different time periods. Fourth, we used cluster analysis to classify 21 lakes according to their spatial and temporal distribution characteristics. Fifth, we used the nuclear density analysis method to determine the POI aggregation degree in the buffer zone of each lake combined with the POI aggregation degree to analyze the preferences of different genders for the water bodies at the waterfront of each lake.
A comparison of the distribution of check-in points of users of different genders in each lake buffer zone illustrated the gender difference in users’ preferences for and intentions to use the waterfront. The male and female check-in points were the densest in the Shuiguo Lake buffer zone. Shuiguo Lake is located in the center of Wuchang District, surrounded by Shuiguo Lake Primary School, Wuhan University Medical School, and other schools, as well as Chuhe Han Street, Wanda Soho, and other business districts. This location may be what makes this buffer zone considerably popular. The check-in point in the buffer zone of Tazi Lake was the lowest, because Tazi Lake is close to the boundary of the Third Ring Road. Many urban villages around Tazi Lake are to be transformed, and various facilities are scarce. Consequently, the density of check-in points was very low for men and women. Ziyang Lake and West lake ranked higher in the check-in point ranking of female users than that of male users. Entertainment and catering facilities around Ziyang Lake and West Lake are densely distributed. Thus, we can infer that entertainment- and leisure-related facilities can attract women to the waterfront. Lotus Lake and Houxiang River ranked higher in the ranking of male users’ check-in points than that of female users. The residential and medical facilities around Lotus Lake and the Houxiang River are densely distributed. We assume that the facilities related to life services attract men to the waterfront. Facilities around Yangchun Lake are sparsely distributed, but check-in points in the buffer zone remained densely distributed.
False information in the ordinary data will affect the overall sample. This study used a large amount of data from the network to reduce this effect to some extent. This technique can accurately reflect the check-in situations for different users of different genders at the waterfront within Wuhan’s Third Ring Road to observe the gender differences of Weibo users’ preferences and intentions to visit the waterfront over space and time. Considering the rapid development in the era of big data, increasing numbers of network platforms have begun to provide numerous, wide-ranging, and easily accessible data [1]. The calculation method of relative deviation is used to ensure the quality of data in this study. Because the amount of data in different categories varies greatly, the scale method is used for standardization. The k-means clustering algorithm was used to classify lake properties. This approach is efficient and scalable for large data sets; it also has strong operability and requires no supervision. The nuclear density method was used to study the aggregation of POI distribution. This method calculates the point strength at any point in the study area without assuming the distribution of the data. The methods used in this study can also be applied to urban space and other types of gender-based analyses to utilize the value of big data in urban planning and design and urban problem research. Compared with other data sources, such as questionnaire surveys, censuses, and GPS-tracking records, social media check-in data has the advantage of a higher spatial accuracy and lower cost. However, such data have limits. Many users of Weibo are young. According to official data, 75% of Weibo users are between 18 and 30 years old [39]. As a result, the data samples used in this study are not fully covered, and the sample coverage of middle-aged and elderly groups is insufficient. In addition, ordinary Weibo users’ personal data (gender, age, etc.) can be modified at will without requiring authenticity verification. These data may not, therefore, match the real situation of the user, and errors could exist in the data. At the same time, through data processing, we obtained the waterfront points within Wuhan’s third ring road. However, this is not necessarily only the check-in data of the waterfront visitors, as some check-ins may come from users living on the waterfront. This could also introduce some errors into our research results. The above problems need to be addressed in future research.

6. Conclusions

This study used big data from social media to analyze the preferences and intentions of Weibo users for 21 major lakes and waterfront areas within Wuhan’s Third Ring Road on the basis of gender differences. As a major source of crowdsourced data, social media big data have multiple uses and can be linked and aggregated into multiple map layers and GIS data sets [59]. The spatial and temporal characteristics of these data can be used to explore the latest urban activity space patterns [60]. The research showed a gender difference between Weibo users’ preference and willingness to visit Wuhan waterfronts through check-in behavior that cannot be ignored. In almost all waterfront areas within the study area, women were more likely to sign in than men. Over the course of a week, men and women presented almost the same change in check-in points, with weekend check-in numbers significantly higher than those during weekdays. When exploring the density of the check-in points in different lakes and the distribution of the number of check-in points in one day, we found that the spatial and temporal distribution trends of the check-in points of male and female users were significantly different. The nuclear density results of the POI distribution were used to explore the possibility of causing check-in behavior to favor the lake itself at the scales of time (i.e., per day) and space (i.e., per city). Our research has important implications for those involved in urban planning and design and those who specialize in gender issues. Our approach can be used for future urban development and other types of gender-based applications. In this way, urban waterfronts, and even urban planners, can learn how to put people first and pay attention to individual differences, such as gender, age, and the physical condition of users. Gender-based research can also be extended to urban development and renewal, as well as the planning and use of public spaces.

Author Contributions

Conceptualization, Jing Wu; methodology, Jing Wu, Jingwen Li and Yue Ma; software, Jingwen Li; validation, Jing Wu, Jingwen Li and Yue Ma; formal analysis, Yue Ma; investigation, Jingwen Li; resources, Yue Ma; data curation, Jingwen Li; writing—original draft preparation, Yue Ma; writing—review and editing, Jing Wu and Jingwen Li; visualization, Jingwen Li; supervision, Jing Wu; project administration, Jing Wu; funding acquisition, Jing Wu.

Funding

This research was funded by the National Natural Science Foundation of China (NSFC) Youth Program, grant number 51808409, and the Fundamental Research Funds for the Central Universities (Interdisciplinary Project), grant number 2042019kf0211.

Conflicts of Interest

The authors declare no conflict of interest.

References

  1. Wu, J.; Li, J.; Ma, Y. Exploring the Relationship between Potential and Actual of Urban Waterfront Spaces in Wuhan Based on Social Networks. Sustainability 2019, 11, 3298. [Google Scholar] [CrossRef]
  2. Breen, A.; Rigby, D. The New Waterfront: A Worldwide Urban Success Story; Thames and Hudson: London, UK, 1996. [Google Scholar]
  3. Breen, A.; Rigby, D. Waterfronts: Cities Reclaim Their Edge; McGraw-Hill Companies: New York, NY, USA, 1994. [Google Scholar]
  4. Chen, Q.; Ye, Y.B.; Ma, L.J. Excavation and Shaping of Distinctive Elements in Landscape Planning of Modern Urban Waterfront. In Applied Mechanics and Materials; Trans Tech Publications: Stafa-Zurich, Switzerland, 2011; Volume 71, pp. 12–17. [Google Scholar]
  5. Boland, P.; Bronte, J.; Muir, J. On the waterfront: Neoliberal urbanism and the politics of public benefit. Cities 2017, 61, 117–127. [Google Scholar] [CrossRef] [Green Version]
  6. Sairinen, R.; Kumpulainen, S. Assessing social impacts in urban waterfront regeneration. Environ. Impact Assess. Rev. 2006, 26, 120–135. [Google Scholar] [CrossRef]
  7. Da, T.; Xu, Y. Evaluation on connectivity of urban waterfront redevelopment under hesitant fuzzy linguistic environment. Ocean Coast. Manag. 2016, 132, 101–110. [Google Scholar] [CrossRef]
  8. Wong, T.C. Revitalising Singapore’s central city through gentrification: The role of waterfront housing. Urban Policy Res. 2006, 24, 181–199. [Google Scholar] [CrossRef]
  9. Ali, S.M.; Nawawi, A.H. The Social Impact of Urban Waterfront Landscapes: Malaysian Perspectives. In Proceedings of the REAL CORP 2009, Sitges, Spain, 22–25 April 2009. [Google Scholar]
  10. Romero, V.P.; Maffei, L.; Brambilla, G.; Ciaburro, G. Modelling the soundscape quality of urban waterfronts by artificial neural networks. Appl. Acoust. 2016, 111, 121–128. [Google Scholar] [CrossRef]
  11. Shafaghat, A.; Manteghi, G.; Keyvanfar, A.; Lamit, H.B.; Saito, K.; Ossen, D.R. Street geometry factors influence urban microclimate in tropical coastal cities: A review. Environ. Clim. Technol. 2016, 17, 61–75. [Google Scholar] [CrossRef]
  12. Shafaghat, A.; Keyvanfar, A.; Manteghi, G.; Lamit, H.B. Environmental-conscious factors affecting street microclimate and individuals’ respiratory health in tropical coastal cities. Sustain. Cities Soc. 2016, 21, 35–50. [Google Scholar] [CrossRef]
  13. Wang, Y.; Wang, G. The Researches on Sustainable Development of Urban Waterfront. In Proceedings of the 2008 International Conference on Management Science and Engineering, Long Beach, CA, USA, 10–12 September 2008. [Google Scholar]
  14. Hoyle, B. Urban waterfront revitalization in developing countries: The example of Zanzibar’s Stone Town. Geogr. J. 2002, 168, 141–162. [Google Scholar] [CrossRef]
  15. Thorning, D.; Christopher, B.; Stephen, E. The delivery of mixed communities in the regeneration of urban waterfronts: An investigation of the comparative experience of Plymouth and Bristol. Land Use Policy 2019, 84, 238–251. [Google Scholar] [CrossRef]
  16. Gravagnuolo, A.; Mariarosaria, A. Assessment of urban attractiveness of port cities in southern Italy—A case study of Torre Annunziata. Sustainability 2013, 5, 3906–3925. [Google Scholar] [CrossRef]
  17. Yocom, K.P.; Andrews, L.; Faghin, N.; Dyson, K.; Leschine, T.; Nam, J. Revitalizing urban waterfronts: Identifying indicators for human well-being. Aims Environ. Sci. 2016, 3, 456–473. [Google Scholar] [CrossRef]
  18. Hao, X.; Wu, W. The Application of GIS to Study Urban Waterfront District Planning—A Case Study of Landscape Planning in Guyang Lake. In Proceedings of the 2013 Fifth International Conference on Measuring Technology and Mechatronics Automation, Hong Kong, China, 16–17 January 2013. [Google Scholar]
  19. Vollmer, D. Urban waterfront rehabilitation: Can it contribute to environmental improvements in the developing world? Environ. Res. Lett. 2009, 4, 024003. [Google Scholar] [CrossRef]
  20. Mostafa, L.A. Urban and social impacts of Waterfronts Development, case study: Jeddah Corniche. Procedia Environ. Sci. 2017, 37, 205–221. [Google Scholar] [CrossRef]
  21. Yang, C.X. The Integrative Organization among Urban Waterfront Elements. Advanced Materials Research; Trans Tech Publications: Stafa-Zurich, Switzerland, 2014; Volume 869. [Google Scholar]
  22. Bunce, S.; Gene, D. Introduction to Political ecologies of urban waterfront transformations. Cities 2007, 24, 251–258. [Google Scholar] [CrossRef]
  23. Cai, L.; Jiang, F.; Zhou, W.; Li, K. Design and Application of an Attractiveness Index for Urban Hotspots Based on GPS Trajectory Data. IEEE Access 2018, 6, 55976–55985. [Google Scholar] [CrossRef]
  24. Light, J.S. From Warfare to Welfare: Defense Intellectuals and Urban Problems in Cold War America; JHU Press: Baltimore, MD, USA, 2003. [Google Scholar]
  25. LeGates, R.; Tate, N.J.; Kingston, R. Spatial thinking and scientific urban planning. Environ. Plan. B Plan. Des. 2009, 36, 763–768. [Google Scholar] [CrossRef]
  26. Ford, G.B. The city scientific. Eng. Rec. 1913, 67, 551–552. [Google Scholar]
  27. Fairfield, J.D. The scientific management of urban space: Professional city planning and the legacy of progressive reform. J. Urban Hist. 1994, 20, 179–204. [Google Scholar] [CrossRef]
  28. Humphreys, L.; Tony, L. Mobile geotagging: Reexamining our interactions with urban space. J. Comput.-Mediat. Commun. 2011, 16, 407–423. [Google Scholar] [CrossRef]
  29. Gentes, A.; Guyot-Mbodji, A.; Demeure, I. Gaming on the move: Urban experience as a new paradigm for mobile pervasive game design. Multimed. Syst. 2010, 16, 43–55. [Google Scholar] [CrossRef]
  30. Paulos, E.; Goodman, E. The familiar stranger: Anxiety, comfort, and play in public places. In Proceedings of the SIGCHI Conference on Human Factors in Computing Systems, Vienna, Austria, 24–29 April 2004; pp. 223–230. [Google Scholar]
  31. Wang, J.; Canny, J. End-user place annotation on mobile devices: A comparative study. In Proceedings of the CHI’06 Extended Abstracts on Human Factors in Computing Systems, Montréal, QC, Canada, 22–27 April 2006; pp. 1493–1498. [Google Scholar]
  32. Watkins, D. Digital Facets of Place: Flickr’s Mappings of the US-Mexico Borderlands. 2012. Available online: https://0-search-proquest-com.brum.beds.ac.uk/docview/1038364267 (accessed on 13 September 2019).
  33. Wall, M.; Kirdnark, T. Online maps and minorities: Geotagging Thailand’s Muslims. New Media Soc. 2012, 14, 701–716. [Google Scholar] [CrossRef]
  34. Shelton, T.; Zook, M.; Graham, M. The technology of religion: Mapping religious cyberscapes. Prof. Geogr. 2012, 64, 602–617. [Google Scholar] [CrossRef]
  35. Graham, M.; Zook, M. Augmented realities and uneven geographies: Exploring the geolinguistic contours of the web. Environ. Plan. A 2013, 45, 77–99. [Google Scholar] [CrossRef]
  36. Pechlaner, H.; Raich, F.; Fischer, E. The role of tourism organizations in location management: the case of beer tourism in Bavaria. Tour. Rev. 2009, 62, 28–40. [Google Scholar] [CrossRef]
  37. Liu, L.; Yu, Y.; Peng, Z. Evaluation and planning of urban green space distribution based on mobile phone data and two-step floating catchment area method. Sustainability 2018, 10, 214. [Google Scholar]
  38. Eagle, N.; Pentland, A. Social serendipity: Mobilizing social software. IEEE Pervasive Comput. 2005, 4, 28–34. [Google Scholar] [CrossRef]
  39. Sina Weibo Data Center. 2018 Weibo User Development Report. Available online: http://data.weibo.com/datacenter/recommendapp/ (accessed on 15 March 2019).
  40. De Mauro, A.; Greco, M.; Grimaldi, M. A formal definition of Big Data based on its essential features. Libr. Rev. 2016, 65, 122–135. [Google Scholar] [CrossRef]
  41. Rizwan, M.; Wan, W.; Cervantes, O.; Gwiazdzinski, L. Using location-based social media data to observe check-in behavior and gender difference: Bringing weibo data into play. ISPRS Int. J. Geo-Inf. 2018, 7, 196. [Google Scholar] [CrossRef]
  42. Raacke, J.; Bonds-Raacke, J. MySpace and Facebook: Applying the uses and gratifications theory to exploring friend-networking sites. Cyberpsychol. Behav. 2008, 11, 169–174. [Google Scholar] [CrossRef]
  43. Magnuson, M.J.; Dundes, L. Gender differences in social portraits reflected in MySpace profiles. Cyberpsychol. Behav. 2008, 11, 239–241. [Google Scholar] [CrossRef] [PubMed]
  44. Peluchette, J.; Karl, K. Social networking profiles: An examination of student attitudes regarding use and appropriateness of content. Cyberpsychol. Behav. 2008, 11, 95–97. [Google Scholar] [CrossRef] [PubMed]
  45. Fogel, J.; Nehmad, E. Internet social network communities: Risk taking, trust, and privacy concerns. Comput. Hum. Behav. 2009, 25, 153–160. [Google Scholar] [CrossRef]
  46. Liu, L.; Peng, Z.; Wu, H.; Jiao, H.; Yu, Y.; Zhao, J. Fast identification of urban sprawl based on K-means clustering with population density and local spatial entropy. Sustainability 2018, 10, 2683. [Google Scholar] [CrossRef]
  47. Hu, Q.; Wu, W.; Xia, T.; Yu, Q.; Yang, P.; Li, Z.; Song, Q. Exploring the use of Google Earth imagery and object-based methods in land use/cover mapping. Remote Sens. 2013, 5, 6026–6042. [Google Scholar] [CrossRef]
  48. Wu, J.; Luo, J.; Tang, L. Coupling Relationship between Urban Expansion and Lake Change—A Case Study of Wuhan. Water 2019, 11, 1215. [Google Scholar] [CrossRef]
  49. Lv, J.; Wu, H.; Chen, M. Effects of nitrogen and phosphorus on phytoplankton composition and biomass in 15 subtropical, urban shallow lakes in Wuhan, China. Limnologica 2011, 41, 48–56. [Google Scholar] [CrossRef] [Green Version]
  50. Li, Y.; Zhao, K.; Fang, J.; Xie, P. Land use change in urban lake watershed—A case study at Donghu Lake, Wuhan. Resour. Environ. Yangtze Val. 2004, 13, 229–233. [Google Scholar]
  51. Duan, G.; Niu, R. Lake Area Analysis Using Exponential Smoothing Model and Long Time-Series Landsat Images in Wuhan, China. Sustainability 2018, 10, 149. [Google Scholar] [CrossRef]
  52. Liu, W. Research on the Recognition and Spatial Regulation Strategy of Urban Waterfront Buffer Zone-With the Case of Wuhan; Huazhong University of Science and Technology: Wuhan, China, 2016. [Google Scholar]
  53. Sun, Y.; Li, M. Investigation of travel and activity patterns using location-based social network data: A case study of active mobile social media users. ISPRS Int. J. Geo-Inf. 2015, 4, 1512–1529. [Google Scholar] [CrossRef]
  54. Mak, K.F.; McGill, K.L.; Park, J.; McEuen, P.L. The valley Hall effect in MoS2 transistors. Science 2014, 344, 1489–1492. [Google Scholar] [CrossRef] [PubMed]
  55. Hartigan, J.A.; Wong, M.A. Algorithm AS 136: A k-means clustering algorithm. J. R. Stat. Soc. Ser. C Appl. Stat. 1979, 28, 100–108. [Google Scholar] [CrossRef]
  56. Wang, C.C.; Chang, C.D.; Jiang, B.C. Developing a Health Risk Evaluation Method for Triple, H. Int. J. Environ. Res. Public Health 2019, 16, 1168. [Google Scholar] [CrossRef] [PubMed]
  57. Rosenblatt, M. Remarks on some nonparametric estimates of a density function. Ann. Math. Stat. 1956, 27, 832–837. [Google Scholar] [CrossRef]
  58. Pueyo, Á.; Climent, E.; Ollero, A.; Pellicer, F.; Peña-Monné, J.L.; Sebastián, M. L’interaction entre Saragosse et ses cours d’eau: Évolution, conflits et perspectives. Sud-Ouest Européen 2018, 44, 7–23. [Google Scholar] [CrossRef]
  59. Everard, M.; Moggridge, H.L. Rediscovering the value of urban rivers. Urban Ecosyst. 2012, 15, 293–314. [Google Scholar] [CrossRef]
  60. Wantzen, K.M.; Ballouche, A.; Longuet, I.; Bao, I.; Bocoum, H.; Cisse, L.; Chauhan, M.; Girard, P.; Gopal, B.; Kane, A.; et al. River Culture: An eco-social approach to mitigate the biological and cultural diversity crisis in riverscapes. Ecohydrol. Hydrobiol. 2016, 16, 7–18. [Google Scholar] [CrossRef]
  61. Rivers in History: Perspectives on Waterways in Europe and North America; University of Pittsburgh Press: Pittsburgh, PA, USA, 2008.
Figure 1. Location of the study area.
Ijgi 08 00413 g001
Figure 2. Distribution of the data points: (a) Distribution of male Weibo users’ check-in points in Wuhan; (b) distribution of female Weibo users’ check-in points in Wuhan.
Ijgi 08 00413 g002
Figure 3. Visualization results of the Weibo data: (a) Distribution of check-in points of Weibo users with different genders within the Third Ring Road; (b) distribution of check-in points of Weibo users with different genders in the buffer.
Ijgi 08 00413 g003
Figure 4. Visualization results of point of interest (POI) data in the Third Ring Road and buffer.
Ijgi 08 00413 g004
Figure 5. Number of check-in points for users of different genders within a week.
Ijgi 08 00413 g005
Figure 6. Changing trend of check-in the quantity of users of different genders within a day: (a) Number of check-ins in one working day; (b) number of check-ins in one day on weekends.
Ijgi 08 00413 g006
Figure 7. Ranking of the check-in point density of users of different genders: (a) Male; (b) female.
Ijgi 08 00413 g007
Figure 8. Changing trend of the check-in numbers of different genders in 21 major lakes in Wuhan in one day.
Ijgi 08 00413 g008aIjgi 08 00413 g008b
Figure 9. Density analysis of various points of interest (POI) cores in the buffer.
Ijgi 08 00413 g009
Figure 10. POI cluster level thermal map.
Ijgi 08 00413 g010
Figure 11. POI characteristics of lakes favored by users of different genders: (a) Various POI levels for the lakes that men prefer; (b) various POI levels for the lakes that women prefer.
Ijgi 08 00413 g011
Figure 12. POI characteristics for different types of lakes among male users: (a) The POI grades of the evening peak lakes; (b) the POI grades of the morning peak lakes; (c) the POI grades of the morning and evening double-peak lakes; (d) the POI grades of the noon peak lakes; (e) the POI grades of the stable lakes.
Ijgi 08 00413 g012
Table 1. Gender differences in weekday and weekend check-in numbers.
WeekMaleFemale d r
Weekday22.30%43.10%0.63
Weekend11.70%22.90%0.65
Mon4.69%8.96%0.62
Tue4.29%8.28%0.63
Wed4.19%8.15%0.64
Thu4.47%8.51%0.62
Fri4.66%9.19%0.65
Sat5.87%11.28%0.63
Sun5.83%11.63%0.66
Table 2. Density of male users’ check-in points in the buffer zone of each lake.
LakeMaleFemale
Number of Check-insArea (km²)DensityNumber of Check-insArea (km²)Density
Shuiguo Lake162344.153911.81363874.158767.95
Sand Lake2189014.911468.144986314.913344.27
Yangchun Lake89517.841141.71103467.841319.64
Shai Lake40973.991026.8266543.991667.67
South Lake3040731.93952.306597831.932066.33
East Lake6412788.32726.0812148988.321375.55
Yezhi Lake841012.75659.611802312.751413.57
Lotus Lake26344.03653.6045954.031140.20
Ziyang Lake25694.23607.3361554.231455.08
Houxiang River17863.69484.0122253.69602.98
Simei Pond17204.37393.5919214.37439.59
Small South Lake9613.25295.6926743.25822.77
Machine Pond10203.85264.9426453.85687.01
North Lake9323.78246.5624503.78648.15
West Lake8273.54233.6221023.54593.79
Huanzi Lake7043.97177.3316353.97411.84
Chestnut Lake5763.89148.0713893.89357.07
Moon Lake5077.2470.0311767.24162.43
Moshui Lake48518.126.80109318.160.39
Longyang Lake1999.3721.244879.375.17
Tazi Lake695.1713.351205.1723.21
Table 3. Lake density ranking by gender.
LakeMaleFemale
Shuiguo Lake11
Sand Lake22
South Lake33
Shai Lake44
Ziyang Lake95
Yezhi Lake76
East Lake67
Yangchun Lake38
Lotus Lake89
Small South Lake r1210
Machine Pond1311
North Lake1412
Houxiang River1013
West Lake1514
Simei Pond1115
Huanzi Lake1616
Chestnut Lake1717
Moon Lake1818
Moshui Lake1919
Longyang Lake2020
Tazi Lake2121
Table 4. Cluster center of check-in points for users of different genders.
GenderCluster
1234
Time10:0013:2419:045:01
Number2311.56477.93791.33122.46
MaleNumber of cases224386173
Valid
Invalid
504
0
Time19:5013:5910:005:40
Number840.75497.602331.23136.88
FemaleNumber of cases702304200
Valid
Invalid
504
0
Table 5. Attributes of each lake among users of different genders.
LakeMaleFemale
North LakeAB
East LakeAB
Chestnut LakeAB
South LakeAB
Sand LakeAB
Shai LakeAB
Shuiguo LakAB
West LakeAB
Yezhi LakeAB
Longyang LakeAC
Moshui LakeAC
Small South LakeAC
Moon LakeAC
Machine PondAD
Ziyang LakeAD
Lotus LakeBD
Simei PondDB
Tazi LakeBB
Houxiang RiverCC
Huanzi LakeCC
Yangchun LakeEE

