Social Media Use in American Counties: Geography and Determinants


1
School of Business, University of Redlands, Redlands, CA 92373, USA
2
Esri Inc., 380 New York Street, Redlands, CA 92373-8100, USA
*
Author to whom correspondence should be addressed.
ISPRS Int. J. Geo-Inf. 2019, 8(9), 424; https://0-doi-org.brum.beds.ac.uk/10.3390/ijgi8090424
Submission received: 19 August 2019
/
Revised: 10 September 2019
/
Accepted: 16 September 2019
/
Published: 19 September 2019
(This article belongs to the Special Issue Convergence of GIS and Social Media)
Abstract
:This paper analyzes the spatial distribution and socioeconomic determinants of social media utilization in 3109 counties of the United States. A theory of determinants was modified from the spatially aware technology utilization model (SATUM). Socioeconomic factors including demography, economy, education, innovation, and social capital were posited to influence social media utilization dependent variables. Spatial analysis was conducted including exploratory analysis of geographic distribution and confirmatory screening for spatial randomness. The determinants were identified through ordinary least squares (OLS) regression analysis. Findings for the nation indicate that the major determinants are demographic factors, service occupations, ethnicities, and urban location. Furthermore, analysis was conducted for the U.S. metropolitan, micropolitan, and rural subsamples. We found that Twitter users were more heavily concentrated in southern California and had a strong presence in the Mississippi region, while Facebook users were highly concentrated in Colorado, Utah, and adjacent Rocky Mountain States. Social media usage was lowest in the Great Plains, lower Midwest, and South with the exceptions of Florida and major southern cities such as Atlanta. Measurements of the overall extent of spatial agglomeration were very high. The paper concludes by discussing the policy implications of the study at the county as well as national levels.
1. Introduction
Accessibility and use of ubiquitous and high-speed internet are fundamentally impacting modern societies worldwide and changing ways in which individuals, households, and businesses utilize the Internet. In the United States, the digital divide is evolving. The digital divide has been defined as “the gap between individuals, households, businesses, and geographic areas at different socioeconomic levels with regard both to their opportunities to access information and communication technologies and to their use of the Internet for a wide variety of activities.” [1]. The U.S. Department of Commerce National Telecommunications and Information Administration now publishes data not only on internet access, but also on internet usage. In the U.S., internet adopters use the Internet for myriad purposes including for e-communication (emailing, text messaging, social networking), e-commerce (making purchases online, paying bills online, and others), e-education and e-entertainment (watching podcasts, videos, listening to music), accessing health information online (retrieving health insurance records, interacting with physicians online), to more sophisticated forms of usage such as teleworking and interacting with household devices. Accordingly, attention in the digital divide literature is gradually shifting from understanding and examining aspects of adoption of information and communications technologies (ICTs) to analyzing disparities in use [2], and referred to in the literature as the third-level (usage-, practices-, and application-oriented) digital divide [3]. A preliminary, reduced version of this study appeared in a conference proceedings [4].
In the present paper, we examine the antecedents of social media utilization in the counties of the United States. Among persons aged 15 years or older, 74.4% of Americans (153.7 million) used the Internet for online social networking in November 2017 when compared to 70.6% (137.3 million) in July 2015 [5]. This growth in the use of online social networking spanned demographic attributes such as age, gender, race and ethnicity, and educational attainment as well as economic variables such as employment status and family income. The growth in online social networking in the U.S. also applied to urban and rural areas. While the rate of growth varied (for example, a 3.4% increase in online social networking in urban metropolitan areas versus 6.5% in rural areas between July 2015 and November 2017), it is clear that social networking among Americans using popular social media platforms is on the rise.
Given this increasing popularity in the utilization of the Internet for social networking in the U.S, this research examined demographic, socioeconomic, governmental, and societal openness influences on social media adoption and utilization in the 3109 counties of the lower-48 states of the U.S. in 2012. Among the social media platforms, we focused on Facebook, Twitter, and LinkedIn. The geographic unit of analysis in this study was the U.S. county. Apart from being the oldest form of government in the United States dating back to the 1600s, county governments administer their own economy, education, justice and public safety, health care, social services, transportation, and other services that directly impact the residents. In addition, counties are often responsible for implementing a broad array of federal, state, and local programs including digital literacy initiatives. In the digital divide literature focusing on technology adoption and diffusion in the United States, the county level has rarely been studied before. Although disparities in the adoption and diffusion of e-entertainment services in U.S. counties have been systematically addressed [6], the geography and antecedents of social media usage in the nation’s counties have not been studied in prior literature.
This gap in the literature needs to be filled because of the transformation that is taking place in the younger generations of America to intensive and essential social media use and of older generations in its expanded use. The impact of broadband internet is been increasingly driven by social media, which has changed diverse areas such as advertising, election campaigns, public safety, interpersonal communications, electronic government, and journalism. Gaining knowledge of social media’s influence in finer-grained geographies for the nation is useful to business professionals, government operations and policies, and to individual citizens. Furthermore, from a research standpoint, the fine-grained geographic knowledge provides answers to questions that could not be answered with the larger units of states and regions. For instance, social media patterns and correlates differ significantly in rural areas when compared to metropolitan Texas, a detail missed by studying the state unit. Some of the geographic patterns for social media use also do not conform to state boundaries and can be identified and explanations sought.
Overall, our research questions were as follows:
- (1)
- What factors impact social media use in U.S. counties?
- (2)
- How does social media use vary along the metropolitan to rural continuum and geographically across U.S. counties?
- (3)
- What county-level policies regarding social media use stem from the findings of this research?
As internet use for social networking increases as part of a broader tapestry of the growing use of the Internet in the U.S., the potential of social media to bridge demographic, social, economic, and locational disparities in some cases and to exacerbate differences in others remains a topic of keen interest to researchers, practitioners, and policymakers in many fields. Situated in this context, the development and subsequent validation of a conceptual framework of social media utilization in U.S. counties, that takes into account agglomeration tendencies through spatial autocorrelation, is one of the central contributions of this paper. No prior study of counties in the U.S. could be found that has systematically examined the associations of demographic, socioeconomic, governmental influence, social capital, and societal openness variables with on per capita utilization of multiple types of social media. Derivation from the research findings of county-level policies to bridge gaps in internet usage for social networking is another related contribution. A novelty of this investigation is spatial analysis, which demonstrates that there are locational disparities between users in metropolitan, micropolitan, and rural counties. Another novelty is the focus on the utilization divide, rather than the adoption and diffusion divide, for social media usage in the U.S.
The remainder of this paper is organized into sections on the literature review of broader country-level studies focused on the digital divide in the U.S., a conceptual model of social media use, findings on multivariate determinants and spatial patterns of social media use, policy implications, limitations, and conclusions.
2. Literature Review of Social Media Adoption and Utilization
Research on examining various aspects of social media adoption, diffusion, utilization, and impacts is advancing rapidly. Given the proliferation of social media platforms such as Facebook, YouTube, WhatsApp, Instagram, Twitter, LinkedIn, Weibo, and Snapchat to name a few, this is hardly surprising. In the digital divide context, however, spatial analysis of the utilization of social media for smaller geographic units is largely missing.
Participation in social networking has been examined thorough a variety of lenses. Over the past several years, surveys and studies conducted by the Pew Research Center have shed considerable light on social media adoption and utilization patterns among Americans. A Pew Research Center study [7] revealed that Facebook continues to be the dominant social networking platform in the U.S., followed by YouTube, which is often not identified as social media. At the national level, frequency of use, reciprocity of use, issues related to content-trust, and disparities stemming from demographic and socioeconomic differences have been cataloged. Furthermore, the influences on the internet usage of gender, age, race/ethnicity, educational attainment, and related demographic attributes and socioeconomic variables such as income and employment, participation in the service sector workforce have been the subject of numerous digital divide studies at the national or state/provincial levels [2,8,9]. At the state level in the U.S., a study [10] found that social capital, education, societal openness, urbanization, and ethnicities were significantly associated with ICT utilization. However, Facebook and Twitter users per capita were not found to be associated with urbanization, but positively associated with per capita immigrant population, pointing to contagion spurred by social contact within respective immigrant communities.
Diffusion of user-generated content in social media [11] and peer influences on participation in social networking have also been the subject of recent studies [12,13]. Such studies shed light on the important role that social capital has been argued to play in providing both material and skills access to those slow starters who either do not have access to ICTs such as the Internet or do not possess the skills to participate in online activities [14]. In terms of examining peer influence and network formation, the study by Lee et al. [12] is notable; utilizing a statistical model of social networking growth that included the similarity of location and data from the former Gowalla website, it found evidence of a sender–receiver homophily based on four similarity measures in the strategic network formation for a location-based social networking context. The relevance to the present research is that the characteristics of the people engaged in social media matters, even for single messages, which implies that the socioeconomic factors of people are likely to be important for social media intensities in a geographic unit. Pearce and Rice [13] considered the tension between the digital divide nature and the capital-enhancing nature of social networking sites. Using a nationally representative sample of Armenian adults and a non-spatial model, the study found evidence of a digital divide between users and non-users of social networking, a modest divide between users of two primary social networking sites used by Armenians (Facebook and an indigenous Armenian social networking platform), and a slight divide between engagement in capital-enhancing activities on the two primary social networking sites. Both studies [12,13], a recent Pew report [15], as well as prior digital divide study (discussed in [9]) are relevant and instructive to the inclusion of the correlates of social media usage in the conceptual model of social media usage posited in the next section.
County or municipal level studies of the digital divide in the United States are relatively rare, often due to the lack of reliable ICT adoption, diffusion, and usage data at such geographic units of analysis. In an analysis of socioeconomic influences on technological levels for 164 counties in the U.S., results revealed that important correlates of technology sectors were professional/scientific/technical services workforce, other services workforce, household income, federal grant funds, college education, and ethnicity. Social media adoption or use was not included among the ICT dependent variables in this study [16]. A handful of prior studies have examined citizen engagement via e-government portals of U.S. counties [17,18]. In a study on the prevalence of presence and features of e-Government portals in U.S. counties, a form of digital divide, the presence of portals, was related the most to median household income, higher education, and the median value of housing, while a number of portal features was strongly related to population change, median value of housing, and median household income, and federal grants. The study, however, did not incorporate spatial factors [17]. Internet diffusion in U.S. counties has been examined through a socioeconomic and geographic lens by Khatiwada and Pigg [19] based on a large sample of 3099 U.S. counties, which was disaggregated into metropolitan and non-metropolitan subsamples. The study included mapping and spatial agglomeration measures for the dependent variable of the number of Internet service providers (ISPs) and for the regression error terms, however, this study did not include social media adoption or use variables. The strongest regression factors were median house value, manufacturing, and college education, plus median household income and rural percent as an inverse factor [19], while spatially, the dependent variable and error terms revealed significant spatial autocorrelation. The broadband and high-speed internet digital divides in U.S. counties have been the subject of reports of the Obama Administration in the U.S. [20], which emphasized the need to expand rural broadband.
Despite these and other studies of U.S. counties, the digital divide of nationwide Internet use for social media at the county or municipal levels is largely absent in the prior literature. This is the first systematic attempt to examine the influences of demographic, socioeconomic, social capital, employment, and innovation on the per capita utilization of multiple forms of social media in U.S. counties in the lower 48 states. A prior study [21] analyzed the relationship of demographic and socioeconomic variables on the number of geotagged Twitter users. However, that study used a quite different dependent variable that did not reflect the per-capita social media utilization, and focused only on Twitter data for a more limited set of independent factors.
The present study is further enriched by the geographic analysis of spatial patterns of social media usage. The results provide vital insights about the discrepancies in social media usage between demographically and socioeconomically diverse metropolitan, micropolitan, and rural U.S. counties. A pioneering study [22] analyzed the spatial patterns of individual Twitter users in the U.S., but did not study per-capital Twitter use at the county level. Since social media has grown rapidly nationwide as a means of communicating and networking [15], gaining greater knowledge of its determinants and geography can deepen our understanding of how and where people and organizations increasingly communicate with this channel throughout the U.S., which can benefit county and regional government operations, outreach, and decision-making; business marketing, media organizations; and political discourse.
In studying the digital divide, there is recognition that any type of technology has benefits and costs. Examples are mobile devices and drones, which have remarkable benefits, but can be mis-used by criminals or have environmental externalities. The digital divide is reversed if negative impacts dominate (i.e., having less of the technology provides benefit). Social media has been assessed for its costs and benefits from a variety of disciplinary perspectives including psychology, health, education, workplace, and scholarly communication [13,14,23,24,25,26,27], with the literature examined leaning toward net positive benefits. It was outside the scope of this study to analyze a large volume of literature. Instead, the positives and negatives are briefly discussed. An overview summary [25] points to the benefits for social media users of connections/communications, entertainment, knowledge, and information. Firms benefit through using social media for promotions, marketing, customer service, branding, and product enhancements [23,25]. Some negatives include a waste of work time, unprofessional behavior, stalking, inappropriate content, and government propaganda in authoritarian nations [23,25]. Another study [26] examined the long-term benefits that social media provides for professionals. Social-media professional users “consistently reported higher informational benefits than non-users.” Often the benefits took many months to become strong [26]. In higher education, the benefits such as student learning and active engagement, timely feedback from faculty, and enhanced scholarly communications outweighed the negatives such as loss of fact-to-face interactions, poor student attendance, gender disparities, diminishment of scholarship from emerging economies, and tensions in faculty-student interaction [24,27]. Although the literature on these issues is vast and growing, our limited survey has revealed a net benefit from social media use, so the digital divide considerations in the paper will regard social media use as beneficial, while those with limited social media use will be regarded as disadvantaged for the digital divide. We acknowledge as a study limitation that more detailed research is needed on the social media costs–benefits as they relate to the digital divide.
The study has the unique feature of comparing the determinants of the digital divide for counties that are: (a) metropolitan, (b) micropolitan, and (c) rural. This distinction, for social media, is a novel aspect of this study. Social media usage is expected to vary among these county categories by the users’ technological knowledge and skills, the underlying ICT infrastructure, and the practical usefulness, among other things. For readers unfamiliar with U.S. census concepts, a metropolitan county has at least one metropolitan statistical area, defined as an urban area with an urbanized area, a 50,000 population or larger, combined with the adjacent territory that ties strongly with the metropolitan core through commuting ties [28]. A micropolitan county has no metropolitan area and at least one urban cluster of at least 10,000 and less than 50,000 population [28]. A rural county contains neither a metropolitan nor micropolitan area.
3. Conceptual Model of Social Media Use
The paper’s conceptual model was drawn from the spatially aware technology utilization model (SATUM), which is appropriate for research on the composite influences of social, economic, and political determinants on the use of ICTs, which can include social media. SATUM is based on a large literature of studies, mostly of nations, but also of states, provinces, prefectures, and EU economic units [9,10,29,30]. SATUM also has spatial relationships as components, so a research study can assess the extent of spatial bias in multivariate statistical analysis and can perform spatial cluster analysis and other spatial techniques [31]. The present study’s SATUM-based model is depicted in Figure 1.
Demographic influences: Prior studies have documented an urban–rural differential for ICT utilization [9,19]. The National Telecommunications and Information Administration (NTIA) of the U.S. Department of Commerce provided evidence of such a differential for households using broadband in the home; rural households were found to trail their urban counterparts by 10 percent in 2010 [32]. At the U.S. state level in 2015, the Asian population per capita was associated with the purposeful use of ICT, while the Black population per capita was an inverse correlate [10]. It has been reasoned that more populous, wealthy urban regions in metropolitan areas with higher levels of educational attainment and higher median home values are more likely to have greater demand for broadband services. We posit that the percent of urban population is associated with social media utilization in U.S. counties. A study of geo-tagged Twitter, Flickr, and Foursquare messages indicated that, per capita, these forms of voluntary social media have greater use, enhanced information, and better information quality in metropolitan versus non-metropolitan areas [33]. Evidence of significant disparities in broadband usage at home by different racial/ethnic groups has also been documented; in 2010, Asian households led Black, and Hispanic households in Internet use by 16–19 percent in 2014 [34].
Due to the disparity in internet access due to race and ethnicity, we propose that race and ethnicity are associated with technology utilization in U.S. counties; for Asians, the association is posited as positive, and for Blacks and Hispanics, the association is posited as negative.
Economic influences: Economic factors such as income, integration in the global economy, international trade openness, R&D, degree of economic openness, and GDP have been largely cited to influence ICT diffusion and utilization [17]. Unemployed Americans, aged 16 years or older, lagged behind their employed counterparts in broadband usage by more than 10 percent in 2010 [32] and the unemployment rate reduced ICT usage in Europe [30]. Income-based adoption disparity among individuals in the U.S. for broadband has been documented: in households with annual incomes of $75,000 or more, 97 percent of individuals used the Internet, compared to 72 percent in households with $30,000 or less income [35]. Household income was the leading predictor of Twitter use for Americans in a survey study [36]. Hence, we posit that personal income per capita is associated with social media use in U.S. counties. Infrastructure construction, maintenance, and service costs are essential for broadband, which is the communications platform for social media. In a study of sub-Saharan Africa, construction costs, specifically installation and maintenance costs were found to be associated with the probability of cell tower location for a spatial econometric study of cell phone coverage. We argue that in the U.S., the construction sector will impact the physical and infrastructural aspects of ICT development. Therefore, we posit that construction sector employment is associated with technology utilization in U.S. counties.
The services sector has substantial marketing and communication interactions with customers, which is even more intense with e-commerce. Accordingly, we reasoned that a larger services sector would be associated with greater social media use. A study of a large sample of U.S. counties found that the per capita employment in the services sector was a significant determinant of per-capita receipts and payrolls for the broadcasting/telecommunications industries and for the motion pictures/sound industries [16]. This study, combined with inductive reasoning, led us to posit that the services sector is associated with social media use.
Education influences: There is widespread evidence of the association of education with ICT access and use. In 2013, 93 percent of college graduates used the Internet, versus 50 percent for those with less than high school education [35]. By 2019, these percentages were 98 and 71 percent, respectively [16]. College education often stands out in digital divide multivariate models such as for ICT factors [19]; Twitter use in the UK [28]; and Internet-connected personal computers (PCs), and broadband in the U.S. [10]. Accordingly, we posit that college graduation is associated with social media use.
Government spending on education has been found to be associated with PCs, ICT expenditure, and ICT infrastructure quality [10]. Therefore, we also posit that local government education expense is associated with social media use.
Innovation influences: Innovation has impacted ICT utilization, based on prior research. It can lead to more productive and user-friendly technology devices, software, and services that increase usage. For instance, as social media capabilities and ease of use have undergone innovative improvements, more users have tended to adopt and use it. In one study of the uses of several types of technologies for nations worldwide, innovation measured by scientific articles per capita was the most important independent variable [37]. Innovation’s influence on ICT use has also been critical in Asian nations [38] and the professional, scientific, and technical services workforce has been found to be significantly associated with receipts and payroll in three technology sectors [16]. The rationale is that the professional services sector is comprised of scientists, engineers, medical and health professionals who are naturally inclined toward innovative technology and are likely to be consumers of ICTs for R&D purposes. Accordingly, we propose that professional, technical, and scientific services employees per capita, as a proxy for innovation, is associated with social media use.
Social capital influences: Social capital is the scope of ties and linkages in a population through physical and communication means as well as by organizations that foster human collaboration or by bonding people who possess resources [4,39,40,41]. It was a key factor in a study of the digital divide for a survey sample of individuals in the U.S. [14] as well as in a two-stage nationwide study of the decisions by people to go online, subject to peer influences [42]. At the state level in the U.S., social capital was also a positive influence on e-commerce, e-entertainment, and e-health variables [6]. Thus, we posit that social capital is related to the usage of social media.
The dependent variables are three social media usage attributes of the number of Facebook, Twitter, and LinkedIn website visits, per capita, over a 30-day period. In 2012, they dominated social media use in the U.S., with the stated percentage of adult use at 54%, 16%, and 13%, respectively [13]. In subsequent years, usage of all three has grown, so by 2018, Facebook was used by 68% of American adults, with Twitter and LinkedIn at 25% and 24%, respectively [7]. By measuring the website visits, the dependent variables are in fact indicators of actual social media utilization by active users. A focus on actual purposeful utilization of ICT rather than measuring access is increasingly becoming important in advanced, digital societies where Internet penetration approaches saturation. Attention in the digital divide literature is also gradually shifting from measuring and analyzing the first-level (access) divide to the second-level (utilization) divide (Scheerder, van Deursen, and van Dijk, 2017). By examining social media utilization, this paper focuses on the second, rather than the first level digital divide.
Some prior studies have examined how the socio-demographic features of geographies relate to social media, especially for Facebook and Twitter. A heavily geographic study compared the geographic distribution of poverty in major cities worldwide with the spatial pattern of social media, indicating a strong overlap of poor areas with digitally deprived social media use [43].
Twitter subscriptions have been included as dependent variables in previous digital divide studies in Japan and the U.S. [10,44]. In Japan, innovation and educational enrolments were the leading determinants, while for the U.S., the social capital proxy of immigrant population dominated. Based on surveys of Twitter users in the UK and USA, a study analyzed and compared the demographic and socioeconomic attributes of Twitter, social networking, and offline users, and developed a logistic model to estimate Twitter use. The findings showed that for both nations, Twitter users were younger and wealthier than the rest of the population, while British users were more highly educated [36]. The study had some similarity with the present study, but did not include mapping and spatial analysis.
4. Data
Data on the dependent and independent variables were collected from multiple sources. Data on independent variables such as population, ethnicity, employment, income, governmental support for education, and sales revenue by publishers were obtained from the U.S. Decennial Census 2010, surveys conducted by the U.S. Census Bureau such as the American Community Survey (ACS) of 2012, Local Education Agency (School District) Finance Survey of the National Center for Education Statistics of 2009, and the U.S. Economic Census of 2007. Data on U.S. county-level social capital came from Pennsylvania State University’s Northeast Regional Center for Rural Development [40]. While data for several independent variables were obtained for the period 2010–12, social capital data were from the year 2009, which is the latest year prior to 2012 for which such data were available.
For the dependent variables, data on the three social media dependent variables, usage of Facebook, Twitter, and LinkedIn, were extracted from Esri’s Business Analyst software [45]. Esri computes estimates of these dependent variables by combining 2013 geodemographic segmentation data with Doublebase® 2012 data from GfK MRI. Doublebase® 2012 data consist of an integration of information from four consumer surveys. The relevant data collection and estimation methodology statement for dependent variable data extracted from Esri’s Business Analyst can be found in [46].
Usage of such a combination of data sources for U.S. digital divide studies is unprecedented in the literature. Since independent variables were largely from the three-year period 2010–12, time simultaneity has been assured for them. The fact that the data for three of the independent variables had further lags of 3–5 years is justified as follows. Professional, scientific, and technical services employees were from the Economic Census of 2007, which was the latest date, prior to 2012, at which the variables were available. The 2009 variables of local government educational expenditures and social capital were derived from specialized sources that do not have recent release dates. We feel that 2009 is acceptable for these two variables, since they are not known to change rapidly year-to-year. All variables were converted to per capita whenever possible; variable definitions, sources, and descriptive statistics (N = 3109 counties) of the dependent and independent variables are shown in Table 1.
5. Methodology
The methodology comprised of techniques of descriptive statistics, correlation analysis, mapping of variables using a geographic information system (GIS), spatial autocorrelation tests for the social media dependent variables [47], and ordinary least squares regression (OLS). For descriptive statistics, the means and standard deviations were computed for the dependent and independent variables to gauge the averages and extent of variation for all U.S. counties [48]. Correlation analysis was applied to screen the independent variables for multi-collinearity [4]. Geographic information system (GIS) mapping can be utilized as an exploratory method to spatially describe and understand the geographic patterns of the distribution of variables [31]. In this investigation, GIS mapping was undertaken to observe the outlying values for the variables, with a focus on the social media dependent variables. Given our sample of 3109 counties, the map displays and reveals key patterns.
An important question in this research was whether social media usage in U.S. counties showed statistically significant patterns of agglomeration of high and low values or was spatially randomly distributed. We diagnosed spatial autocorrelation, a common problem plaguing many technology diffusion datasets, by applying the Moran’s I test statistic. The Moran’s I test is inferential; the null hypothesis is that the values of a variable are randomly distributed spatially. If the variable is randomly distributed spatially, the p value is not significant. Furthermore, if the variable’s Z score is positive, the values of a variable are more geographically agglomerated (high values located near high ones and low values near low ones). If it is negative, the spatial pattern resembles a “checkerboard” pattern, where high values are surrounded by low ones and vice versa [47,49].
Following the mapping analysis, ordinary least squares (OLS) regression was performed for each social media usage dependent variable, in stepwise order, allowing only the independent variables with significance levels of equal or less than 0.05. As an additional test of multi-collinearity, the variance inflation factor (VIF) was computed for each independent variable. We utilized the common cut-off of five or greater for the VIF to be of concern and no multicollinearity problems were detected. Three diagnostic tests were administered to ensure that regression assumptions were met. The joint Wald statistic is a test of the joint significance of several coefficients of individual independent variables [50]. The Koenker (BP) statistic test is a test for heteroscedasticity (i.e., the variance of the residuals is not constant) [51]. The Jarque-Bera statistic is a goodness-of-fit test of whether the sample data, in this case regression residuals, have skewness and kurtosis that correspond to a normal distribution [52]. Additionally, regression residuals were tested for the presence of spatial bias using Moran’s I test statistic. Model relationships that result in spatially random errors are regarded as valid. If errors in the model fit are spatially autocorrelated, it implies that the geographic forces are exogenous to the conceptual model. In case the Moran’s I testing indicates that regression residuals are not spatially randomly distributed, the regressions results have to be treated with caution.
Geographically weighted regression (GWR)-based modeling of associations of independent variables with the three dependent indicators of social media use in U.S. counties was not employed due to the critiques of the method ([53], Chapter 8). The authors were concerned that the number of observations (counties) to be included in each local model could vary significantly, depending on the size of counties in urban versus rural areas. Therefore, to account for differences between urban versus rural areas, the overall sample (n = 3109 counties) was split in this study into three sub-samples comprised of metropolitan, micropolitan, and rural counties, for which separate sets of OLS regressions were deployed. Additionally, GWR may produce unstable regression coefficients. Depending on context, the variation in the regression coefficients in GWR may be extreme enough to shift from positive to negative values in a study area, which in this case would complicate policy formulation for social media utilization, a non-trivial problem to begin with. Overall, the choice of OLS modeling over GWR-based modeling was guided by the confirmatory nature of OLS versus the exploratory nature of GWR ([53], Chapter 8).
6. Regression Findings
The regression findings for the entire country indicate that key determinants for the three social-media dependent variables are college graduation, youth dependency ratio, proportion of working age population, and percent urban. As seen in Table 2, the most important determinant is college education. This is in concert with other studies of U.S. counties [16], household surveys of the U.S. [14], samples of U.S. states [10], and international samples of nations [8,54]. The mechanism may be that college educated people tend to be more conversant with social media through greater exposure to ICT and the web during the years they are enrolled in education. That LinkedIn has the strongest education effect may be due to the greater enhanced presence of college educated users of LinkedIn when compared to Facebook and Twitter [15].
Demographic influences on ICT and social media have been reported in studies of Japan [44] and the U.S. [10]. In the present study, both youth dependency ratio and percent urban were positive; while for Japan, farm population was associated with reduced ICT, Facebook, and Twitter use. On the other hand, the youth dependency ratio was inversely associated with some ICT variables and Twitter. This surprising finding can be explained by young families being located in Japan in mostly in rural areas, which would tend to have lower ICT and social media use.
Working age population is strongly related to the three social media indicators. This finding differs from the lack of importance of the proportion of employed civilian workforce as an ICT determinant in a regression study of U.S. states [10]. Service occupation is associated with Facebook and Twitter use, although less strongly than the working age population. This finding corresponds to the importance of professional and service occupations for payroll and receipts in most technology sectors for U.S. counties from 1997 to 2000 [16] and to the significant relationship of employment in services to technology level for 164 European Union sub-national regions in 27 European nations [30].
For the complete U.S. county sample, urban location was related to usage for all three social media variables, although its strength of association was highest for Facebook, followed by Twitter and LinkedIn. This may be the result of Facebook, versus Twitter and LinkedIn, having greater areal extent of low use in rural regions including the Appalachia, lower South, and the southeast border area of Texas. The finding contrasts with a lack of urban association for Facebook and Twitter for U.S. states [10]. It also differs from a recent survey study that indicated that the urban–rural difference in the use of LinkedIn was 23% for LinkedIn, compared to 7% for Facebook [15]. However, it is similar to findings for Japanese prefectures, which showed an inverse relationship of the proportion of farm population with Facebook and Twitter users per capita [44]. The lack of effect for U.S. states might be due to the larger unit of analysis (i.e., state versus county) not being fine-grained enough to register the differences in and around the numerous American metropolitan areas. However, the finding corresponded to a survey study for the U.S. in 2019, where 73 percent of urban adults used Facebook versus 66 percent for rural dwellers. For LinkedIn, the difference was even wider, with 33 percent of use by urban residents versus 10 percent for those in rural areas [15].
The findings for the influences of ethnicities varied among the three social media variables. For Facebook, there was an inverse association with Blacks and Hispanics, while for Twitter, there was an association with Asian and Blacks, and LinkedIn was associated with Asians. We reasoned that Asians generally had the opposite effect of Blacks and Hispanics, with Twitter being an exception for Blacks. This was based on other studies with similar findings [10,35]. For American adults in 2010, the percentage that used the Internet varied from 90 percent for Asians to 71 percent for Hispanics and 68 percent for Blacks ([10,27], p. 7). For U.S. states from 2009 to 2010, the results indicated a positive association of Asians to a variety of ICT variables, while the Hispanic associations were inverse. This included a positive Asian association and inverse Hispanic association with Facebook users, although no effects were evident for Twitter users [10]. A recent survey of the U.S. indicates that the use of Facebook has converged at about 70 percent for Blacks, Hispanics, and Whites, while LinkedIn use for Whites remains significantly higher than for Blacks and Hispanics [15].
The results for the metropolitan, micropolitan, and rural subsamples largely corresponded to those for the nation as a whole (Table 2 and Table 3). Accordingly, only major differences from the country-wide findings are noted here for the subsamples.
Metropolitan subsample: The main difference from the national results was an inverse relationship of construction occupations with Twitter use. This finding was not noted at the state level in 2009–2010 for Twitter or Facebook [10]. A possible indirect explanation is that geographic areas with a high proportion of construction workers tend to have lower educational and income levels, which are known to decrease social media use.
Micropolitan subsample: For the micropolitan (Table 3), there was a stronger association for the service occupations across all three social media variables than for the country or metropolitan subsample, although the micropolitan and rural results were similar. It may be that for the smaller cities and towns in micropolitan or rural America, there is a relatively larger presence of service workers, whose influence on social media is greater. Another explanation is that social media may be a more important form of communication between service workers and their spread-out or even isolated customers.
Social capital was unexpectedly associated with reduced Twitter and LinkedIn use. This is contrary to prior reported positive effects at the U.S. state level of social capital on desktop, Internet, and broadband use, and of the social-capital proxy variable of immigrant population on Facebook and Twitter [10]. We reasoned that the influences for LinkedIn and Twitter could be attributed to a substitution effect, where counties with strong social capital have a lower average need for citizens to access LinkedIn, since those with a strong physical social network, mostly local, have less need for the worldwide professional networking of LinkedIn or the social networking of Twitter. The positive effect of professional/scientific/technical workforce, limited to only LinkedIn, is due to LinkedIn’s market emphasis on business and professional people. The inverse effect on Facebook of local government education expenditures remains unexplained.
Rural subsample: The rural subsample’s inverse association of social capital with LinkedIn use corresponded to the explanation just provided for the micropolitan subsample (Table 3). Likewise, there was a positive effect of professional/scientific/technical workforce on social media that corresponded to the explanation given earlier for the nation. The inverse effect on LinkedIn of local government education expenditures also remains unexplained.
In summary, it is important to observe that all coefficients in the regressions (results in Table 2 and Table 3) were statistically significant at the 0.001 level. This is due to the large overall sample (n = 3109 counties) as well as the large subsample sizes of metropolitan (n = 1161), micropolitan (n = 637), and rural (n = 1311) counties. It is therefore essential to examine the magnitude of the standardized coefficients to determine which independent correlates have higher associations with social media usage. Furthermore, given the large sample size fallacy, it is important to focus on effect size [55,56]. According to Sullivan and Feinn [56], the adjusted r-squared is an acceptable effect size index for studies that examine the associations between variables. Adjusted r-squared values ranged between approximately 0.50 and 0.90 in this study, with a couple of exceptions for Twitter and LinkedIn in the rural subsample. For these r-squared values, the effect size was characterized as large [56], indicating that the large sample size fallacy [55] had been addressed.
7. Spatial Patterns of Social Media Use
In this section, the descriptive maps for the three social media variables are examined and interpreted, and the spatial autocorrelation findings are explained. Since the maps represented 3109 counties, it was beyond the scope of this paper to examine their hundreds of descriptive features, relationships, and differences. Accordingly, this paper pointed only to the most prominent features nationally.
For Facebook (Figure 2), the findings showed a considerable range of percentage Facebook use. Low use levels were most evident in the southwest Texas border area, rural parts of the Great Plains stretching north–south from the Dakotas to Texas, the mid to lower-central South and the Appalachia, and rural, inland parts of the Carolinas and Georgia. High areas of use were seen in the Boston to Washington megalopolis (see inset in Figure 2), Atlanta, Chicago–Milwaukee, Minneapolis, Denver and Salt Lake City metropolitan areas, Seattle and Portland metro areas, San Francisco–San Jose, and parts of Southern California (i.e., San Luis Obispo, Santa Barbara, Orange, and San Diego Counties), but excluding Los Angeles County. This finer geographic detail is missing in a map by state of Facebook users ([10], Figure 2), which does not show the prominent features evident at the county level for the Boston–Washington megalopolis, southwest Texas, Appalachia, or other areas. Overall, the county findings reflect the positive influence on social media of location in large and creative metropolitan areas and the reduced effect in poor and remote rural counties. The high Facebook levels in Denver, southern Wyoming, Salt Lake City, and surrounding Rocky Mountain areas have not been previously reported.
The concept of megalopolis originated with Jean Gottman’s study of the massive combined metropolitan areas of the Northeast coastal region stretching from Boston to Washington [57]. In 2000, the Northeast megalopolis was estimated to have a population of 49.6 million or a sixth of the U.S. population [58]. The high Facebook adoption in this vast, dense megalopolitan region magnifies the impact of social media, since the tens of millions of users are physically within several hours drive time of each other. This region also reflects the key positive correlates of Facebook use that were already discussed such as college education, urban, working age population, and the presence of an Asian population.
The spatial distribution of Twitter users (Figure 3) generally corresponded to the Facebook pattern Facebook, but with the following differences: (1) the levels of Twitter use on the southwest border of Texas were very reduced when compared to Facebook use; (2) usage in Southern California was substantially higher and included all counties in metropolitan Los Angeles and San Diego; (3) Denver and the surrounding Rocky Mountain region were high in usage, but not as extremely high as Facebook; and (4) the Appalachia and the mid-central South were moderate rather than very low like for Facebook. These results are consistent with a recent non-spatial study that characterizes Twitter users as wealthier, more educated, and more urban than the population as a whole [36].
The high Twitter use in the entertainment industry cluster of southern California might stem from Twitter’s greater entertainment aspect than for Facebook or LinkedIn, while Twitter’s relatively higher use along the U.S. border counties with Mexico and the lower-central South might be due to Twitter’s simplicity and character limitation, which are more suitable to the low income and less educated population in those areas. LinkedIn’s spatial distribution (Figure 4) resembles Twitter’s, but had lower levels of use across the South that cannot be explained.
Spatial autocorrelation analysis of the dependent variables (see Table 2 and Table 3) revealed that the results for Moran’s I were highly significant for the country and metropolitan samples; inconsistent for the rural samples; and not significant for the micropolitan sample. This reflects that social media use is highly agglomerated in its metropolitan portion, which also influences the agglomeration level of the country as a whole, while micropolitan counties, which commonly contain a single urban area of 10,000–50,000 population, are less influential on their neighbors, resulting in a lack of agglomeration of counties. For rural areas, agglomeration was significant for Facebook for unknown reasons, while Twitter had a significant inverse Moran’s I value, implying that there is a trend toward an uneven, checkerboard-board pattern of spatial autocorrelation, while there is a random spatial distribution for LinkedIn.
In accordance with the spatial methodology described in Section 5, the extent of the spatial randomness of the OLS regression residuals was estimated by Moran’s I. The results indicated a low extent of spatial autocorrelation, compared to the high spatial autocorrelations values of the dependent variables, for the country and metropolitan samples. In contrast, the spatial autocorrelations of the residuals for the micropolitan and rural samples were random, except for an inverse Moran’s I value for Twitter. Hence, in general, the OLS regressions were either substantially reduced or eliminated the spatial autocorrelation present in the original dependent variable, which meant that the regression model and its independent variables were able to account fully for the very high autocorrelation for the observed dependent variables. Nevertheless, some spatial agglomeration remained in the residuals, in particular for the Facebook agglomeration areas in the country-sample residuals, and for all three social media variables in the metropolitan subsample, so those findings must be viewed cautiously. Figure 5 shows a map of the standardized residuals for Facebook in the country sample, and it is evident that the spatial distribution pattern of Facebook residuals was agglomerated, resembling that of the Facebook dependent variable (i.e., comparing Figure 5 to Figure 2).
8. Discussion of Results
This study has confirmed, for U.S. counties, several well-known determinants from the digital divide literature. In particular, the independent variables that have the most prominent influence on social media are the following, along with supportive literature: age structure [10], college graduation [8,14,15,19,30,36,38,54], urban location [14,19,59,60], and race/ethnicity [27,28,30,51].
Among these are a pair of variables, urban location, and college graduation, that have commonly been closely correlated [10]. Although per capita income was removed from the research model due to multi-collinearity, it is often also correlated with this pair, so it should be considered for inclusion in future research, perhaps to replace one or two in the triad.
Although professional, scientific, technical service occupation had a strong influence on ICT in a prior U.S. county study [16], it was unimportant in the findings, except for LinkedIn in the micropolitan and rural subsamples. The difference can be ascribed to a shift in the dependent variables, which, for the earlier study, were revenues and business receipts and payroll for the IS-data processing industry, broadcasting-telecommunication industry, and motion picture-sound industry. While for those complex sectors, the scientific/professional workforce would clearly have an impact, that impact is much less likely for the present countywide consumers of social media, who tend to be younger, more educated individuals, millennials, but not concentrated in scientific and technical fields. Accordingly, for social media use, county policymakers should concentrate on workforce development, and encourage companies, nonprofits, and government units to incorporate social media for organizational purposes and, in doing so, hire local, talented workers.
Social capital is an unexpectedly weak determinant country wide. For the subsamples, it was largely insignificant, except for its inverse influence in the micropolitan and rural samples for Twitter and LinkedIn. We ascribed the inverse findings to the substitution effect of social networking for the physical social capital that was discussed earlier. Construction workforce in micropolitan counties had a slight inverse effect. This is unexplained and points to further research. Its positive influence on LinkedIn for rural areas can be ascribed to enhanced capacity in a county to install and maintain ICT-related infrastructure.
The findings for social media variables for U.S. counties in the lower 48 states can be compared to a similar study for U.S. counties that examined the impacts of socioeconomic factors on eight ICT variables, which emphasized aspects of ICT in the household such as household ownership of a computer, use of the Internet in the past 30 days, high-speed Internet access, broadband access, mobile wireless access in the household, cellphone only use, and landline only use [4]. There were similarities and differences. The youth dependency ratio had no correlation for more traditional technologies of owning a computer and using the Internet, and was inverse for landline only use. This connotes that the association of youth, who heavily use social media, lessens or even reverses the use of older technologies. College education, which consistently had very high correlations with social media was absent for broadband access, mobile wireless access, and cellphone only use. This finding suggests that young people may be less dependent on broadband or mobile broadband access at home, which might relate to their greater access to these services outside the home. The strong association of social media use for the working age population weakened or disappeared, or was inverse for household technologies, demonstrating that working age adults also heavily use social media relative to home-based ICT. The association of urban location is consistently strong with social media and household ICT. As households gain much higher broadband access with lowered costs, and as millennials increasingly become working age adults, the social media/ICT differences noted may moderate.
The spatially aware technology utilization model (SATUM) is applicable to this investigation. All the independent variables had at least some empirical association with social media. The only exception was personal income, which was eliminated due to multi-collinearity. The present SATUM model has the potential to be applied to small geographic samples of counties, with sample sizes as small as 50. For example, two areas descriptively identified as having a high usage of social media—western coastal counties stretching from Washington State to southern California and the Northeast megalopolis—might be studied as subsamples to determine their local determinants for social media. Likewise, the social media effects in the Great Plains and middle South counties could be analyzed by regression to identify their correlates for low social media-usage areas.
For large samples with varied environments, geographically weighted regression offers an alternative methodology that aggregates results over distinctive geographies. However, for the full set of U.S. counties, it is problematic due to the irregularity of the shape and size of county polygons across the nation, although it could be applied in sub-national regions such as the Midwest that have more consistency in county boundary geometries. Another potential problem is unstable regression coefficients ([53], Chapter 8). Spatial autocorrelation in the present investigation was useful in assessing the extent of agglomeration for dependent variables and for regression residuals. For this study’s large county samples, it has the advantage of systematically summarizing the extent of agglomeration, which is difficult to diagnose using descriptive mapping.
Given the large sample sizes, more complex models could be constructed with structural equation modeling (SEM), path analysis, or econometrics. For SEM, the set of independent variables could be enlarged by selecting additional ones from the U.S. Population and Economic Censuses, American Community Survey using a 5-year range of data, or other robust county samples. Although a theoretical model has already been tested by SEM for a worldwide sample of nations [61], a more complex factor model could be formulated for U.S. counties, and relevant theory could be applied from that study. However, in formulating the SEM, it is likely that the new relationships between an enlarged variable set would need to be induced. A challenge would be how to take geography into account when applying SEM.
9. Policy Implications and Limitations
9.1. Policy Implications
County governments can set ICT policies as can metropolitan governments, which encompass areas based on population levels in one or more counties [21]. Based on this research, these governments can influence ICT policy through the following steps.
- Foster or support college education for citizenry;
- As a complement to college education, further encourage citizens to go beyond just completing courses or certificates, and to leverage the education and training for the “next step,” which might be further education or hiring or transfer into a job that includes social media [62];
- Attract service sector employees for businesses and government and encourage existing service-oriented organizations;
- Encourage jobs for a younger population and families and stemming the outflow of the young population from impacted counties;
- Encourage attracting more professional, scientific, and technical workers, which is a challenging task given paucity of enterprises that would attract such workers; and
- The governments might also seek to broaden the purview of existing social capital by encouraging rural community organizations and human social networks to emphasize social media knowledge and use.
County governmental policy in geographical regions of low social media use such as the Appalachia or the middle-lower South should consider the encouragement of state government initiatives to stimulate social media use or the formation of consortia of county governments to readdress the larger regional gap in the use of social media.
It is more difficult to develop polices based on the demographic determinants of social media, since the demographic processes are not under the control of the county governments. Nonetheless, the counties could focus their social media training options on demographic categories heretofore deprived of knowledge and skills in social media personal and business uses such as old and rural segments of the population. Social equity would favor training for these technologically less skilled groups.
As a footnote, the policy development efforts should strive to emphasize the positive aspects of social media while reducing the negative aspects, a topic mentioned in the literature review, but which was beyond the scope of this research.
9.2. Limitations
One limitation is that the dependent variables were collected in large-scale industry surveys, which are subject to a survey sampling error. This also points to the limitation that the study is cross-sectional, so cannot recognize the magnitude of changes of the variables and varying influences over time. However, this limitation can be overcome by a future study that longitudinally compares cross-sectional findings at two time points, or employs fixed effects models, if suitable data are available. A limitation already noted is that the regression analysis does not model complex and/or bi-directional relationships. This can be addressed by using SEM, path analysis, or other techniques for analyzing complex models. A challenge for such studies will be to formulate a more complex theoretical model than SATUM. More recent data on the dependent variables are available; however, some of the dependent variables have not been updated. Additionally, the SATUM theory could be modified to incorporate both the costs and benefits of social media variables. Presently, the valence of social media is regarded as a net positive.
The research is limited by the exclusion of income due to multi-collinearity, stemming from its well-known close associations with education and urban location. In a future study, income effects could be studied by subsampling different income groups or by constructing structural equation models that include income as an underlying variable to a factor. Another limitation is that the SATUM model for social media does not include psychological characteristics or psychometric measures, even though some literature on social media emphasizes the importance of psychology. This was not possible because there are no relevant psychological variables available for the U.S. counties in the lower 48 states. It suggests, however, that such data could prospectively be collected by a nationwide survey. Finally, one other limitation was that case studies of counties were not available that could illustrate the SATUM theory and support or contradict the present empirical findings. In designing case studies, interview questions would need to emphasize the geographical aspects of county technology use.
10. Conclusions
This research developed a conceptual model where socioeconomic variables influence social media use in U.S. counties, with an accompanying spatial analysis. The model was tested empirically by OLS regression, revealing, in correspondence to the first research question, that the key correlates were the young dependency ratio, college education, service occupations, working age population, and urban population per capita.
The youth dependency ratio finding corresponded to the relationship of age structure to Twitter geotagged users in U.S. counties [21] as well as to ICT factor scores for Eurostat regions across Europe [30]. The association of college education with Twitter use as well as with Facebook and LinkedIn use, was in accordance with prior findings for U.S. states [10]. The present results for the youth dependency ratio, service occupations, and somewhat for working age population corresponded to findings for ICT in U.S. counties [4], and service employment was similarly associated with ICT factor scores in Eurostat regions [30]. Our finding on the importance of urban location corresponded to the urban location’s strong association with ICT for a variety of variables [4], while not in accordance with weak urban correlation with the number of geotagged Twitter users in U.S. counties 21]. In accordance was the high tweet density of individuals mapped for the U.S., revealing a concentration in metropolitan areas [22]. Generally, our findings on the correlates concurred with the digital divide literature, taking into account the differences in the variables studied and modeling approaches. The distinguishing correlates consisted of education, skills, youth, and urban location, which are known in the literature to correlate with technology use in the U.S. and worldwide [9,63].
In our study, the sample of U.S. counties for the lower 48 states was divided into subsamples of metropolitan, micropolitan, and rural counties, and accordingly, we could compare the regression results between the subsamples. The findings for three levels of geographies differed from the nationwide results in several distinctive ways: for metropolitan areas, construction workforce had a reducing influence on Twitter use; for micropolitan and rural areas, the proportion of service workers was a more important determinant of social media, while social capital had an inverse effect on LinkedIn and Twitter use.
Other studies have applied various techniques to examine social media use along the metropolitan to rural continuum. A study of Twitter, Flickr, and Foursquare used an exploratory geostatistics and correlation methodology to compare metropolitan and non-metropolitan areas in social media user density, and social media information and its quality, confirming greater use and higher quality information for metropolitan areas [33]. That study is in agreement with a portion of our study that showed that there are substantial differences in social media usage patterns across America’s metropolitan to rural continuum. Another approach [43] considered the association of the urban poor as determined by remote sensing morphology with Twitter low-intensity zones in eight cities. The study identified metropolitan areas for detailed analysis, but did not compare the metropolitan poor zones with poor zones in rural or micropolitan areas. Although the literature has recognized the importance of metropolitan areas for special study, studies that we were aware of heretofore have not systematically compared the associations of social media with socioeconomic factors across the metropolitan, micropolitan, and rural range.
For the second research question, based on spatial analysis consisting of descriptive mapping and spatial autocorrelation of the dependent variables and regression residuals, the results showed that geographically, the U.S. was highly agglomerated in social media at the county level. Likewise, agglomeration was demonstrated, using several approaches to spatial analysis, for the distribution of individual tweets in the US [22], but the agglomeration tendencies of social media variables were not tested for counties. Agglomerations of regression residuals of tweets by U.S. counties were mapped [21], but the geotagged twitter per capita variable and regression residuals were not analyzed by spatial autocorrelation techniques.
Our findings indicate a geographical digital divide, with standout agglomerations for social media occurring the Northeast megalopolis and coastal southern California, stretching up through San Francisco to Seattle. Another agglomerated region of high social media use centered in the Rocky Mountain area stretching from Denver to Salt Lake City. Agglomerations of low social media use were present for the Great Plains, Appalachia, and the mid lower South. These findings reinforce the geographical divide at the state level for Twitter and somewhat for Facebook [10]. Some regional patterns of high density tweets were noted by Jiang et al. [21], after calculating a “reduction rate.” Overall, the broad national patterns for Twitter use, measured differently in prior studies [21,22] are similar to the present patterns.
In answer to the third research question, the findings and implications of the research were applied to the formulation of county policies. Counties should formulate policies to encourage college education, attract service sector employees, encourage jobs for younger people, attract more professional and scientific workers, broaden the scope of existing social capital, encourage social media knowledge and skills in technology less-skilled segments, and seek broader state initiatives or county consortia to solve problems in large national regions of low social media use.
The contributions of this research are to systematically analyze, for U.S. counties in the lower 48 states, the multivariate correlates of three types social media use to evaluate the agglomeration tendencies of the dependent variables and the regression residuals through the spatial autocorrelation technique, to examine the differences in social media determinants among and between metropolitan, micropolitan, and rural subsamples, and to describe the geographical patterns of social media use for U.S. counties. Another contribution is the development and subsequent validation of a conceptual framework of social media use in U.S. counties. In addition, the policy implications based on the findings can contribute to county policy setting and decisions.
This study points to future research projects that could further illuminate the nation’s countywide social media patterns, the essential forces that are associated with social media use at the county level, and the geographic texture and groupings of its usage in America.
Author Contributions
Conceptualization, Formal Analysis, Data Analysis, Writing, James Pick and Avijit Sarkar; Data Analysis, Applications, Mapping Support, Jessica Rosales.
Funding
This research received no external funding.
Acknowledgments
Appreciation is expressed to Esri Inc. for the support of data and software and to the Center for Spatial Studies, University of Redlands, for their mapping advice.
Conflicts of Interest
The authors declare no conflicts of interest.
References
- OECD. Understanding the Digital Divide; Organization for Economic Co-operation and Development: Paris, France, 2011. [Google Scholar]
- Skaletsky, J.; Pick, J.B.; Sarkar, A.; Yates, D.J. Digital divides: Past, present, and future. In The Routledge Companion to Management Information Systems; Galliers, R.D., Stein, M.K., Eds.; Routledge: Abingdon, UK, 2018; pp. 416–443. [Google Scholar]
- Scheerder, A.; van Deursen, A.; van Dijk, J. Determinants of Internet skills, uses and outcomes. A systematic review of the second-and third-level digital divide. Telemat. Inform. 2017, 34, 1607–1624. [Google Scholar] [CrossRef]
- Pick, J.B.; Sarkar, A.; Rosales, J. A Spatial and Regression Analysis of Social Media in the United States Counties. ICIS 2015 Pre-Conference Workshop Proceedings 3; Association for Information Systems: Atlanta, GA, USA.
- NTIA. Digital Nation Data Explorer; National Telecommunications and Information Administration, U.S. Department of Commerce: Washington, DC, USA, 2018. [Google Scholar]
- Sarkar, A.; Pick, J.B.; Rosales, J. ICT-enabled E-Entertainment Services in United States Counties: Socio-economic Determinants and Geographic Patterns. In Innovative ICT-Enabled Services and Social Inclusion; Choudrie, J., Kurnia, S., Tsatsou, P., Eds.; Routledge: London, UK, 2017; pp. 115–146. [Google Scholar]
- Smith, A.; Anderson, M. Social Media Use in 1 March 2018; Pew Research Center: Washington, DC, USA, 2018. [Google Scholar]
- Baliamoune-Lutz, M. An analysis of the determinants and effects of ICT diffusion in developing countries. Inf. Technol. Dev. 2003, 10, 151–169. [Google Scholar] [CrossRef]
- Pick, J.B.; Sarkar, A. The Global Digital Divides: Explaining Change; Springer: Heidelberg, Germany, 2015. [Google Scholar]
- Pick, J.B.; Sarkar, A.; Johnson, J. United States Digital Divide: State Level Analysis of Spatial Clustering and Multivariate Determinants of ICT Utilization. Socio-Econ. Plan. Sci. 2015, 49, 16–32. [Google Scholar] [CrossRef]
- Qiu, L.; Tang, Q.; Whinston, A.B. Two formulas for success in social media: Learning and network effects. J. Manag. Inf. Syst. 2015, 32, 78–108. [Google Scholar] [CrossRef]
- Lee, G.M.; Qiu, L.; Whinston, A.B. A friend like me: Modeling network formation in a location-based social network. J. Manag. Inf. Syst. 2016, 33, 1008–1033. [Google Scholar] [CrossRef]
- Pearce, K.E.; Rice, R.E. Somewhat separate and unequal: Digital divides, social networking sites, and capital-enhancing activities. Soc. Media Soc. 2017, 3, 1–16. [Google Scholar] [CrossRef]
- Chen, W. The implications of social capital for the digital divides in America. Inf. Soc. 2013, 29, 13–25. [Google Scholar] [CrossRef]
- Pew Research Center. Social Media Fact Sheet; Pew Research Center: Washington, DC, USA, 2019. [Google Scholar]
- Azari, R.; Pick, J.B. Socioeconomic influences on technological sectors for United States counties. Int. J. Inf. Manag. 2005, 25, 25–37. [Google Scholar] [CrossRef]
- Huang, Z. A comprehensive analysis of U.S. counties’ e-Government portals: Development status and functionalities. Eur. J. Inf. Syst. 2007, 16, 149–164. [Google Scholar] [CrossRef]
- Manoharan, A. A Study of the determinants of county e-government in the United States. Am. Rev. Public Adm. 2013, 43, 159–178. [Google Scholar] [CrossRef]
- Khatiwada, L.K.; Pigg, K.E. Internet service provision in the U.S. Counties: Is spatial pattern a function of demand? Am. Behav. Sci. 2010, 53, 1326–1343. [Google Scholar] [CrossRef]
- The White House. Mapping the Digital Divide; The White House: Washington, DC, USA, 2015. [Google Scholar]
- Jiang, Y.; Li, Z.; Ye, X. Understanding demographic and socioeconomic biases of geotagged Twitter users at the county level. Cartogr. Geogr. Inf. Sci. 2019, 46, 228–242. [Google Scholar] [CrossRef]
- Li, L.; Goodchild, M.F.; Xu, B. Spatial, temporal, and socioeconomic patterns in the user of Twitter and Flickr. Cartogr. Geogr. Inf. Sci. 2013, 40, 61–77. [Google Scholar] [CrossRef]
- CPA Practice Management Forum. Benefits and risks of social media use in the workplace. Pract. Manag. Forum 2011, 7, 15–16. [Google Scholar]
- Okoro, E. Integrating social media technologies in higher education: Costs-benefits analysis. J. Int. Educ. Res. 2012, 8, 255–261. [Google Scholar] [CrossRef]
- Dollinger, M.J. Social media: Cui bono? Who benefits from all this socialness? Bus. Horiz. 2015, 58, 235–236. [Google Scholar] [CrossRef]
- Utz, S.; Breuer, J. Informational benefits from social media use for professional purposes: Results from a longitudinal study. Cyberpsychol. J. Psychosoc. Res. Cyberspace 2016, 10, 3. [Google Scholar] [CrossRef]
- Sugimoto, C.R.; Work, S.; Lariviere, V.; Haustein, S. Scholarly use of social media and altmetrics: A review of the literature. Adv. Inf. Sci. 2017, 68, 2037–2062. [Google Scholar] [CrossRef] [Green Version]
- US Census. Core-Based Statistical Areas; US Census Bureau: Washington, DC, USA, 2019. [Google Scholar]
- Pick, J.; Sarkar, A.; Nishida, T. Broadband utilization in the Indian states: Socio-economic correlates and geographic aspects. In Management of Broadband Technology Innovation; Choudrie, J., Middleton, C., Eds.; Routledge: Oxford, UK, 2014; pp. 269–296. [Google Scholar]
- Vicente, M.R.; Lopez, A.J. Assessing the regional divide across the European Union-27. Telecommun. Policy 2011, 13, 220–237. [Google Scholar] [CrossRef]
- Longley, P.A.; Goodchild, M.F.; Maguire, D.J.; Rhind, D.W. Geographic Information Systems & Science, 4th ed.; John Wiley and Sons: New York, NY, USA, 2015. [Google Scholar]
- NTIA. Exploring the Digital Nation: Computer and Internet Usage at Home; National Telecommunications and Information Administration, U.S. Department of Commerce: Washington, DC, USA, 2011. [Google Scholar]
- Hecht, B.; Stephens, M. A tale of cities: Urban biases in volunteered geographic information. In Proceedings of the Eighth International AAAI Conference on Weblogs and Social Media, Ann Arbor, MI, USA, 1–4 June 2014; pp. 197–205. [Google Scholar]
- Pew Research Center. Internet/Broadband Fact Sheet; Pew Research Center: Washington, DC, USA, 2019. [Google Scholar]
- Perrin, A.; Duggan, M. Americans’ Internet access: 2000–2015. In Report in Series on Numbers, Facts and Trends Shaping the World; Pew Research Center: Washington, DC, USA, 2015. [Google Scholar]
- Blank, G. The digital divide among twitter users and its implications for social research. Soc. Sci. Comput. Rev. 2017, 35, 679–697. [Google Scholar] [CrossRef]
- Pick, J.B.; Azari, R. Global digital divide: Influence of socioeconomic, governmental, and accessibility factors on information technology. Inf. Technol. Dev. 2008, 14, 91–115. [Google Scholar] [CrossRef]
- Quibria, M.G.; Ahmed, S.N.; Tschang, T.; Reyes-Macasaquit, M.-L. Digital divide: Determinants and policies with special reference to Asia. J. Asian Econ. 2003, 13, 188–825. [Google Scholar] [CrossRef]
- Putnam, R.D. Social capital. Measurement and consequences. Can. J. Policy Res. 2001, 2, 41–51. [Google Scholar]
- Rupasingha, A.; Goetz, S.J.; Freshwater, D. The production of social capital in U.S. counties. J. Socio-Econ. 2006, 35, 83–101. [Google Scholar] [CrossRef]
- Liu, B.; Wei, Y.D.; Simon, C.A. Social capital, race, and income inequality in the United States. Sustainability 2017, 9, 248. [Google Scholar] [CrossRef]
- Agarwal, R.; Animesh, A.; Prasad, K. Social interactions and the digital divide: Explaining variations in Internet use. Inf. Syst. Res. 2009, 20, 277–294. [Google Scholar] [CrossRef]
- Taubenbock, H.; Staab, J.; Zhu, X.X.; Geib, C.; Dech, S.; Wurm, M. Are the poor digitally left behind? Indications of urban divides based on remote sensing and twitter data. Int. J. Geo Inf. 2018, 7, 304. [Google Scholar] [CrossRef]
- Nishida, T.; Pick, J.B.; Sarkar, A. Japan’s prefectural digital divide: Multivariate and spatial analysis. Telecommun. Policy 2014, 38, 992–1010. [Google Scholar] [CrossRef]
- Esri. Business Analyst; Esri Inc.: Redlands, CA, USA, 2016. [Google Scholar]
- Esri. U.S. Market Potential Data Methodology Statement; Esri Inc.: Redlands, CA, USA, 2015. [Google Scholar]
- Griffith, D.A. Spatial Autocorrelation: A Primer; Association of American Geographers: Washington, DC, USA, 1987. [Google Scholar]
- Field, A. Discovering Statistics Using SPSS, 3rd ed.; SAGE Publications Ltd.: Thousand Oaks, CA, USA, 2009. [Google Scholar]
- Moran, P.A.P. Notes on continuous stochastic phenomena. Biometrika 1950, 37, 17–23. [Google Scholar] [CrossRef] [PubMed]
- Wald, A. Test of statistical hypotheses concerning several parameters when the number of observations is large. Trans. Am. Math. Soc. 1943, 54, 426–482. [Google Scholar] [CrossRef]
- Lyon, J.D.; Tsai, C.-L. A comparison of tests for heteroscedasticity. Statistician 1996, 45, 337–349. [Google Scholar] [CrossRef]
- Jarque, C.M.; Bera, A.K. Efficient tests for normality, homoscedasticity, and serial independence of regression residuals. Econ. Lett. 1980, 6, 255–259. [Google Scholar] [CrossRef]
- O’Sullivan, D.; Unwin, D. Geographic Information Analysis; John Wiley & Sons: Hoboken, NJ, USA, 2010. [Google Scholar]
- Yates, D.; Gulati, G.J.; Weiss, J.W. Different paths to broadband access: The impact of governance and polity on broadband diffusion in the developed and developing worlds. In Proceedings of the 44th Hawaiian International Conference on System Sciences, Los Alamitos, CA, USA, 4–7 January 2011. [Google Scholar]
- Lantz, B. The large sample size fallacy. Scand. J. Caring Sci. 2013, 27, 487–492. [Google Scholar] [CrossRef] [PubMed]
- Sullivan, G.M.; Feinn, R. Using effect size—Or why the P value is not enough. J. Grad. Med Educ. 2012, 4, 279–282. [Google Scholar] [CrossRef] [PubMed]
- Gottman, J. Megalopolis: The Urbanized Northeastern Seaboard of the United States; The Twentieth Century Fund: New York, NY, USA, 1961. [Google Scholar]
- Short, J.R. Liquid City: Megalopolis and the Contemporary Northeast; Resources for the Future: Washington, DC, USA, 2007. [Google Scholar]
- Arai, Y.; Naganuma, S. The geographical digital divide in broadband access and governmental policies in Japan: Three case studies. Netw. Commun. Stud. 2010, 24, 7–26. [Google Scholar] [CrossRef]
- Fong, M.W.I. Digital divide between urban and rural areas in China. Electron. J. Inf. Syst. Dev. Ctries. 2009, 36, 1–12. [Google Scholar]
- Pick, J.B.; Azari, R. Global model of utilization of technology based on governmental, social, economic, and business investment factors. J. Manag. Inf. Syst. 2011, 28, 51–85. [Google Scholar] [CrossRef]
- Kvasny, L.; Keil, M. The challenges of redressing the digital divide: A tale of two U.S. Cities. Inf. Syst. J. 2006, 16, 22–53. [Google Scholar]
- Van Dijk, J.A. The Deepening Divide: Inequality in the Information Society; SAGE Publications: Thousand Oaks, CA, USA, 2005. [Google Scholar]
Figure 1.
Conceptual model of social media usage in U.S. counties.

Figure 2.
Spatial distribution of Facebook users (% Pop), U.S. counties, 2012.

Figure 3.
Spatial distribution of Twitter users (% Pop), U.S. counties, 2012.

Figure 4.
Spatial distribution of LinkedIn users (% Pop), U.S. counties, 2012.

Figure 5.
Distribution of OLS regression residuals (standard deviations) for Facebook users (% Pop), U.S. counties, 2012.
Figure 5.
Distribution of OLS regression residuals (standard deviations) for Facebook users (% Pop), U.S. counties, 2012.


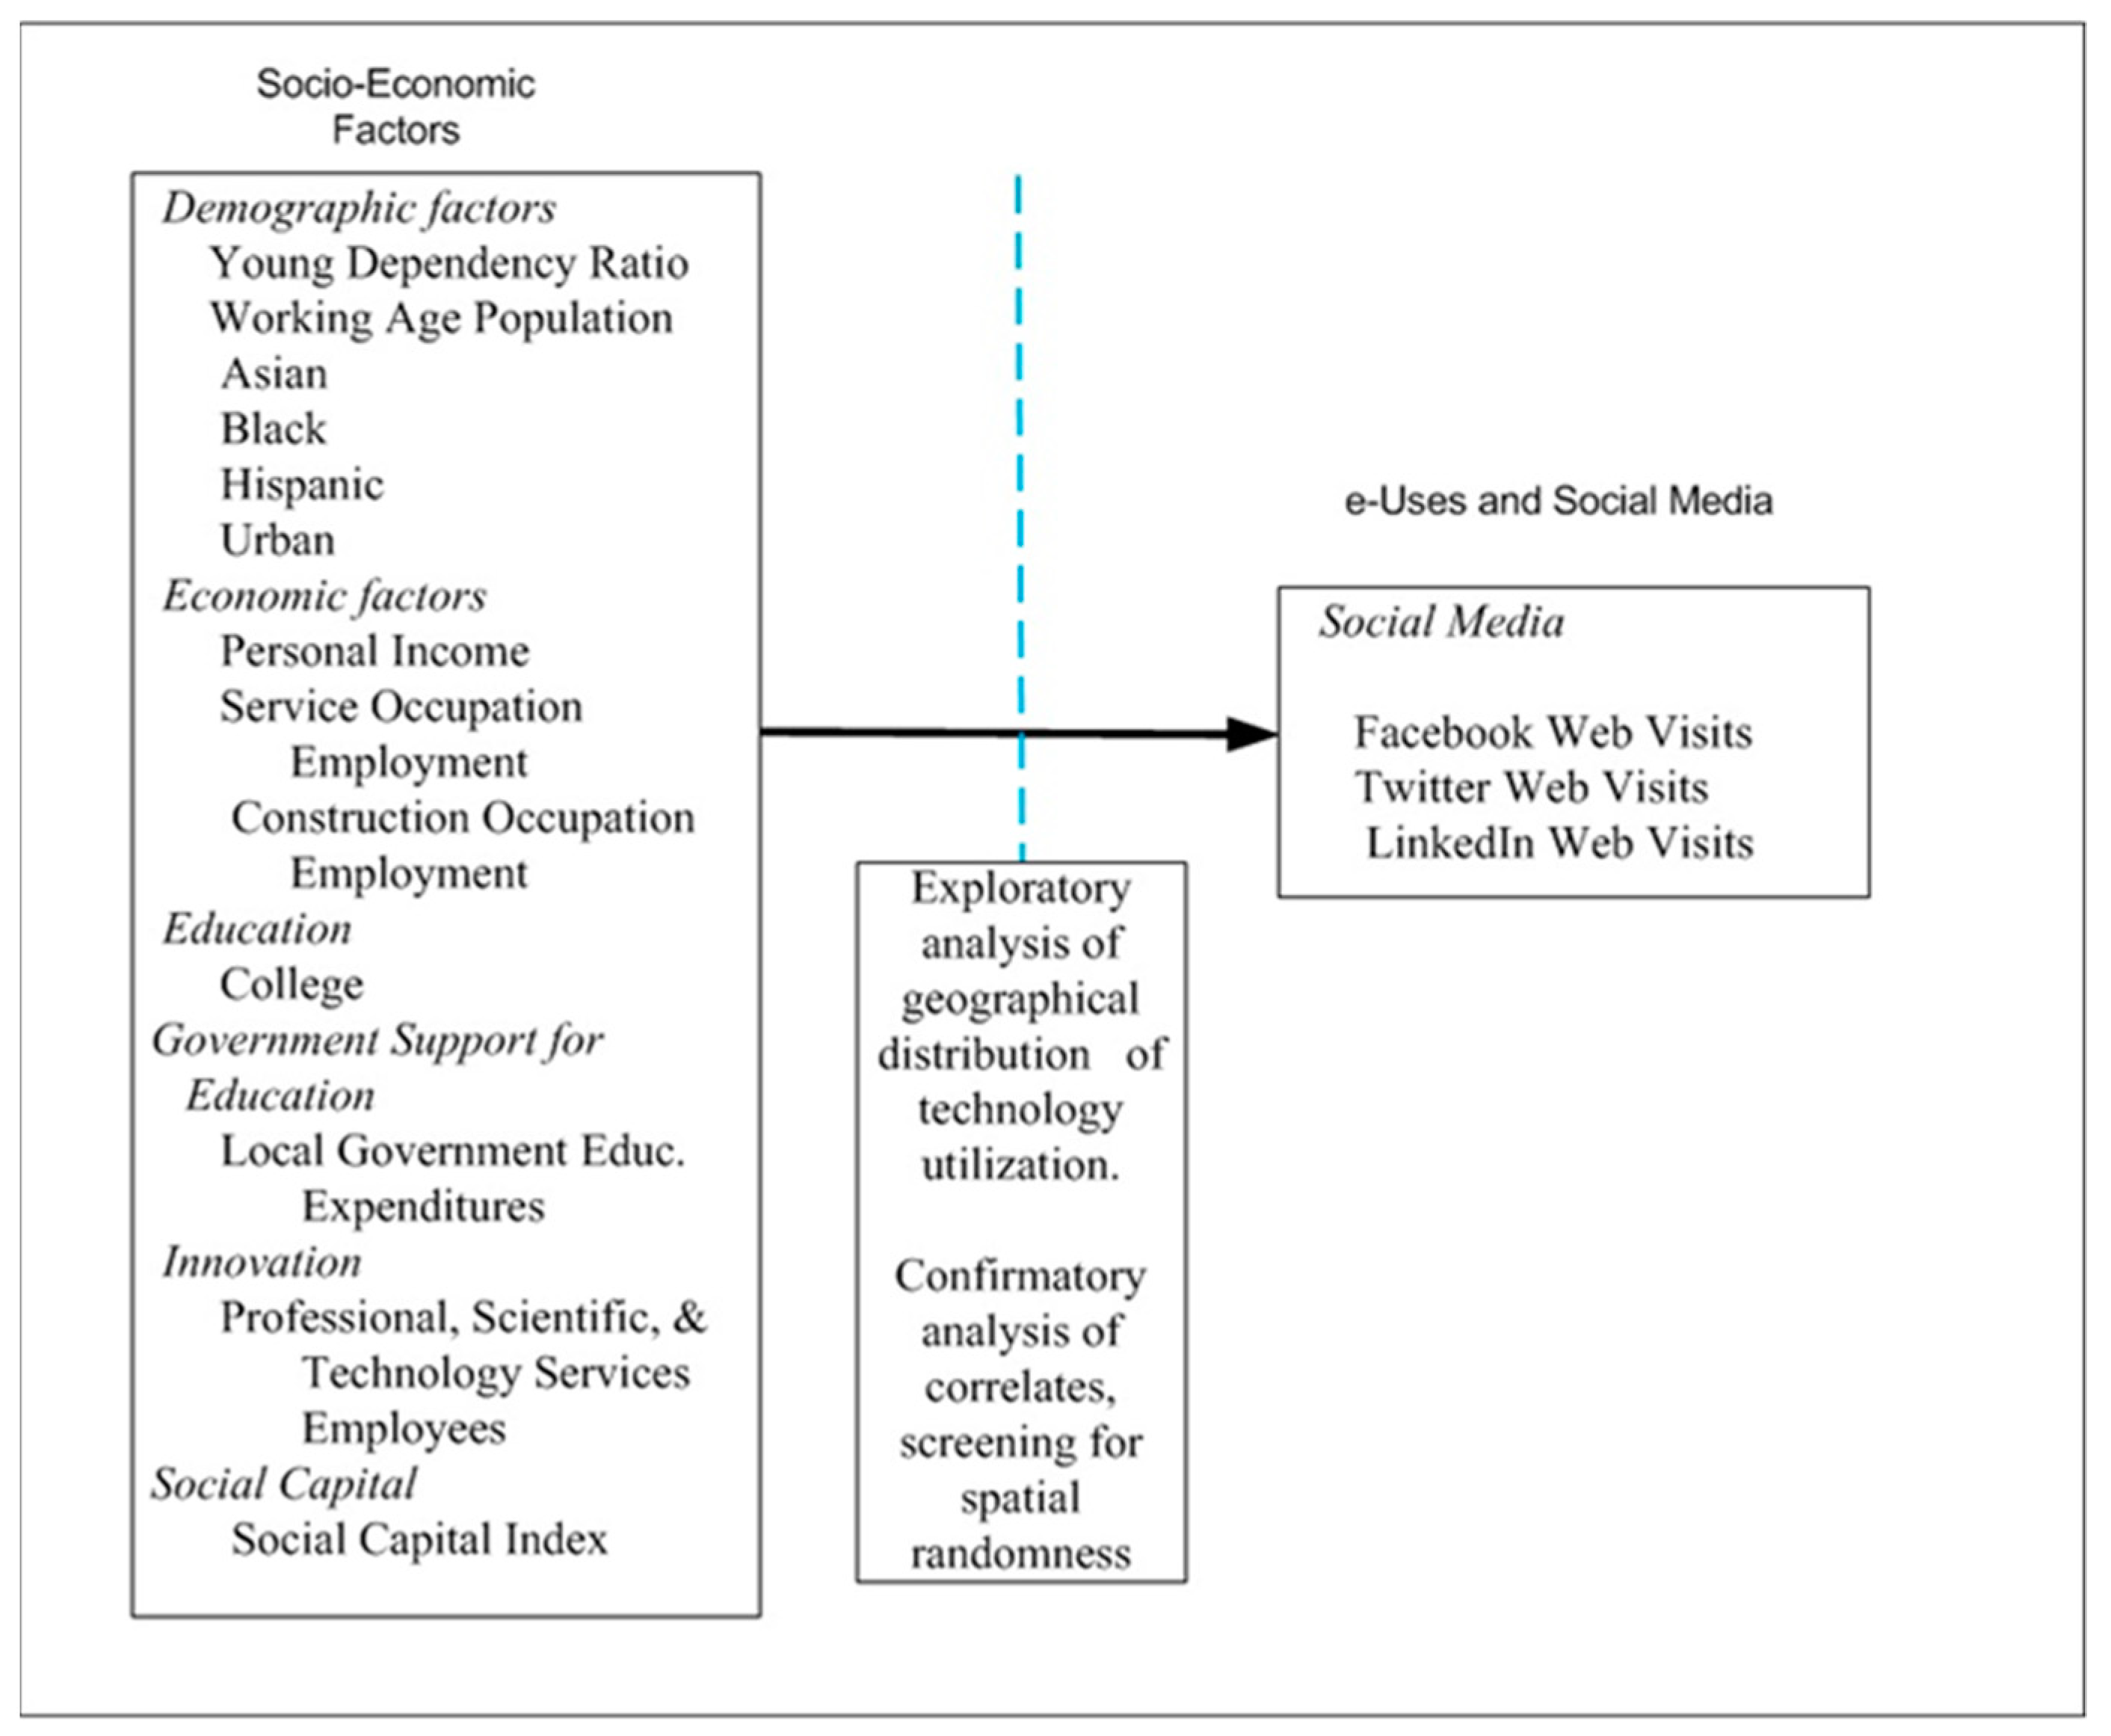
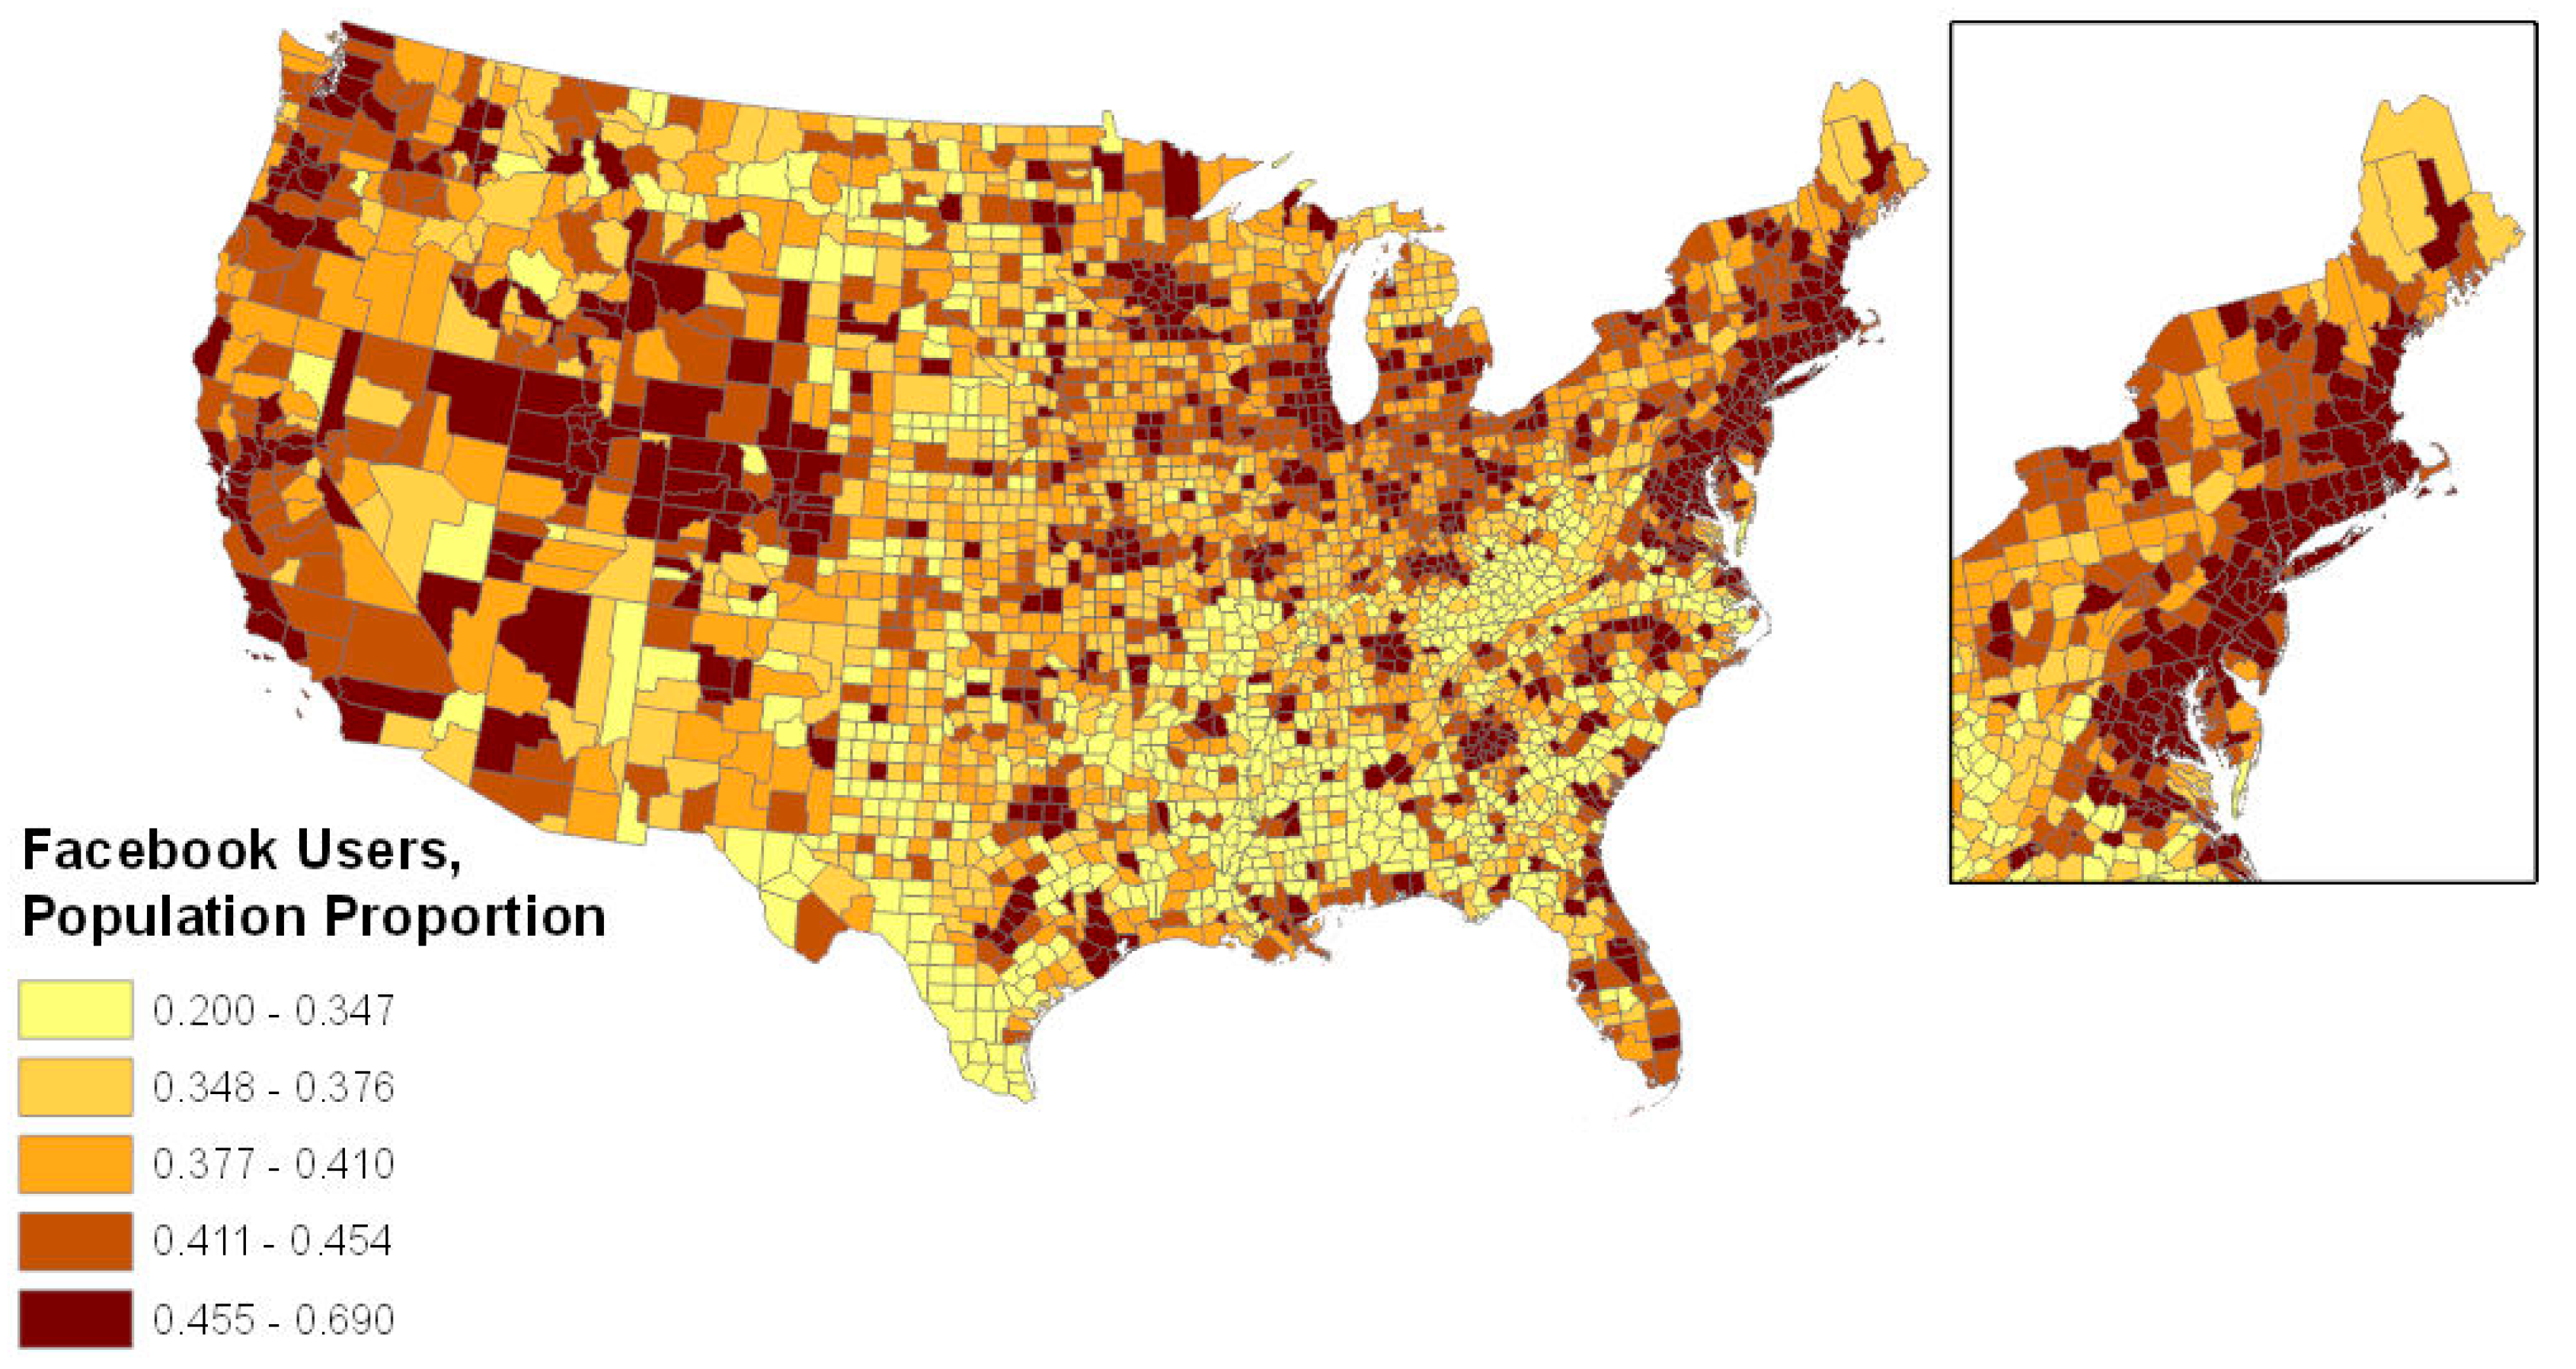
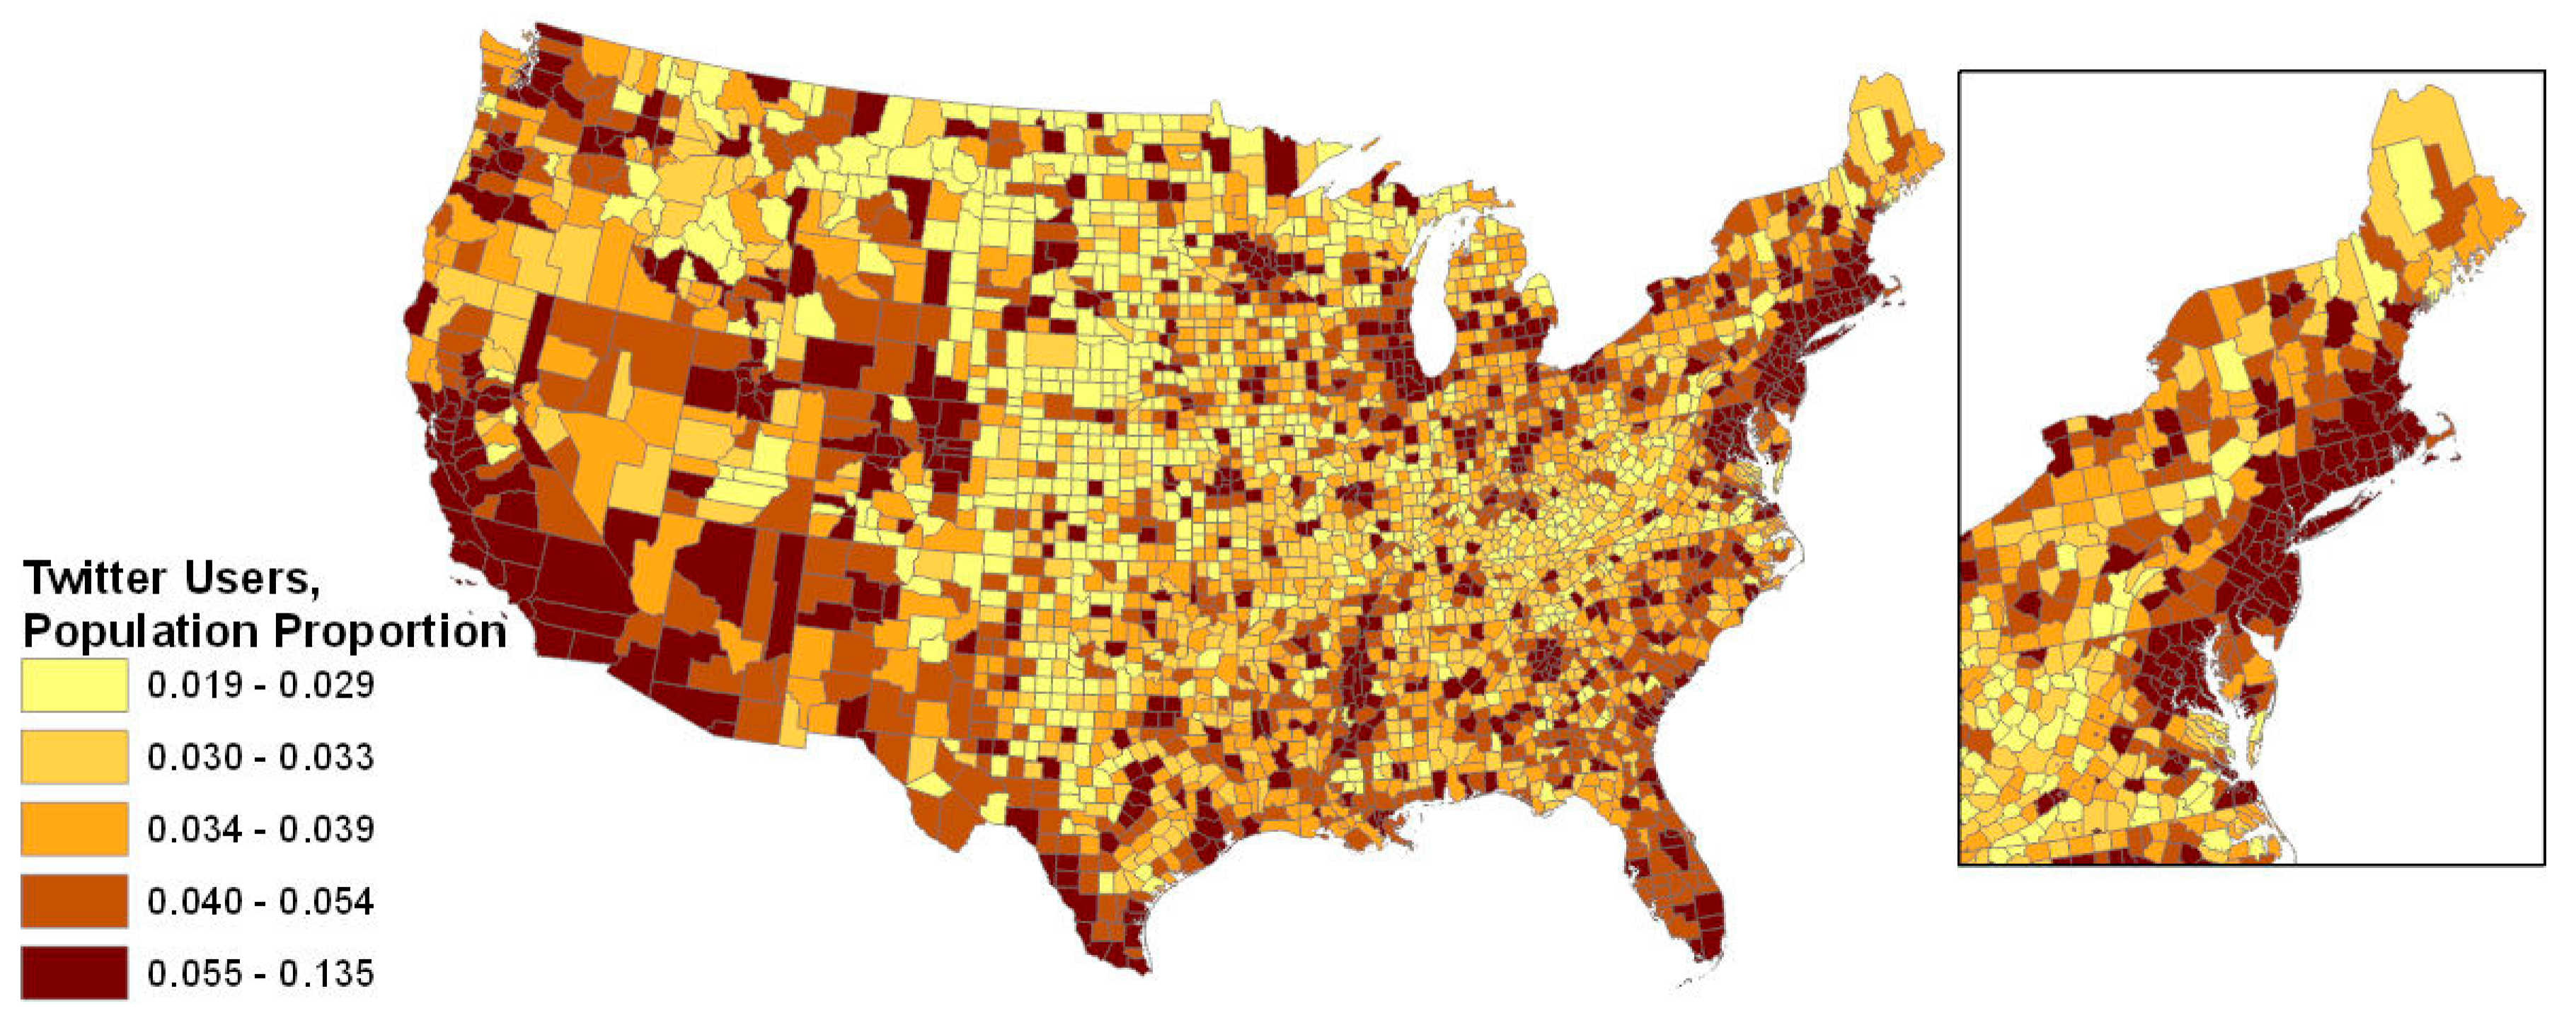
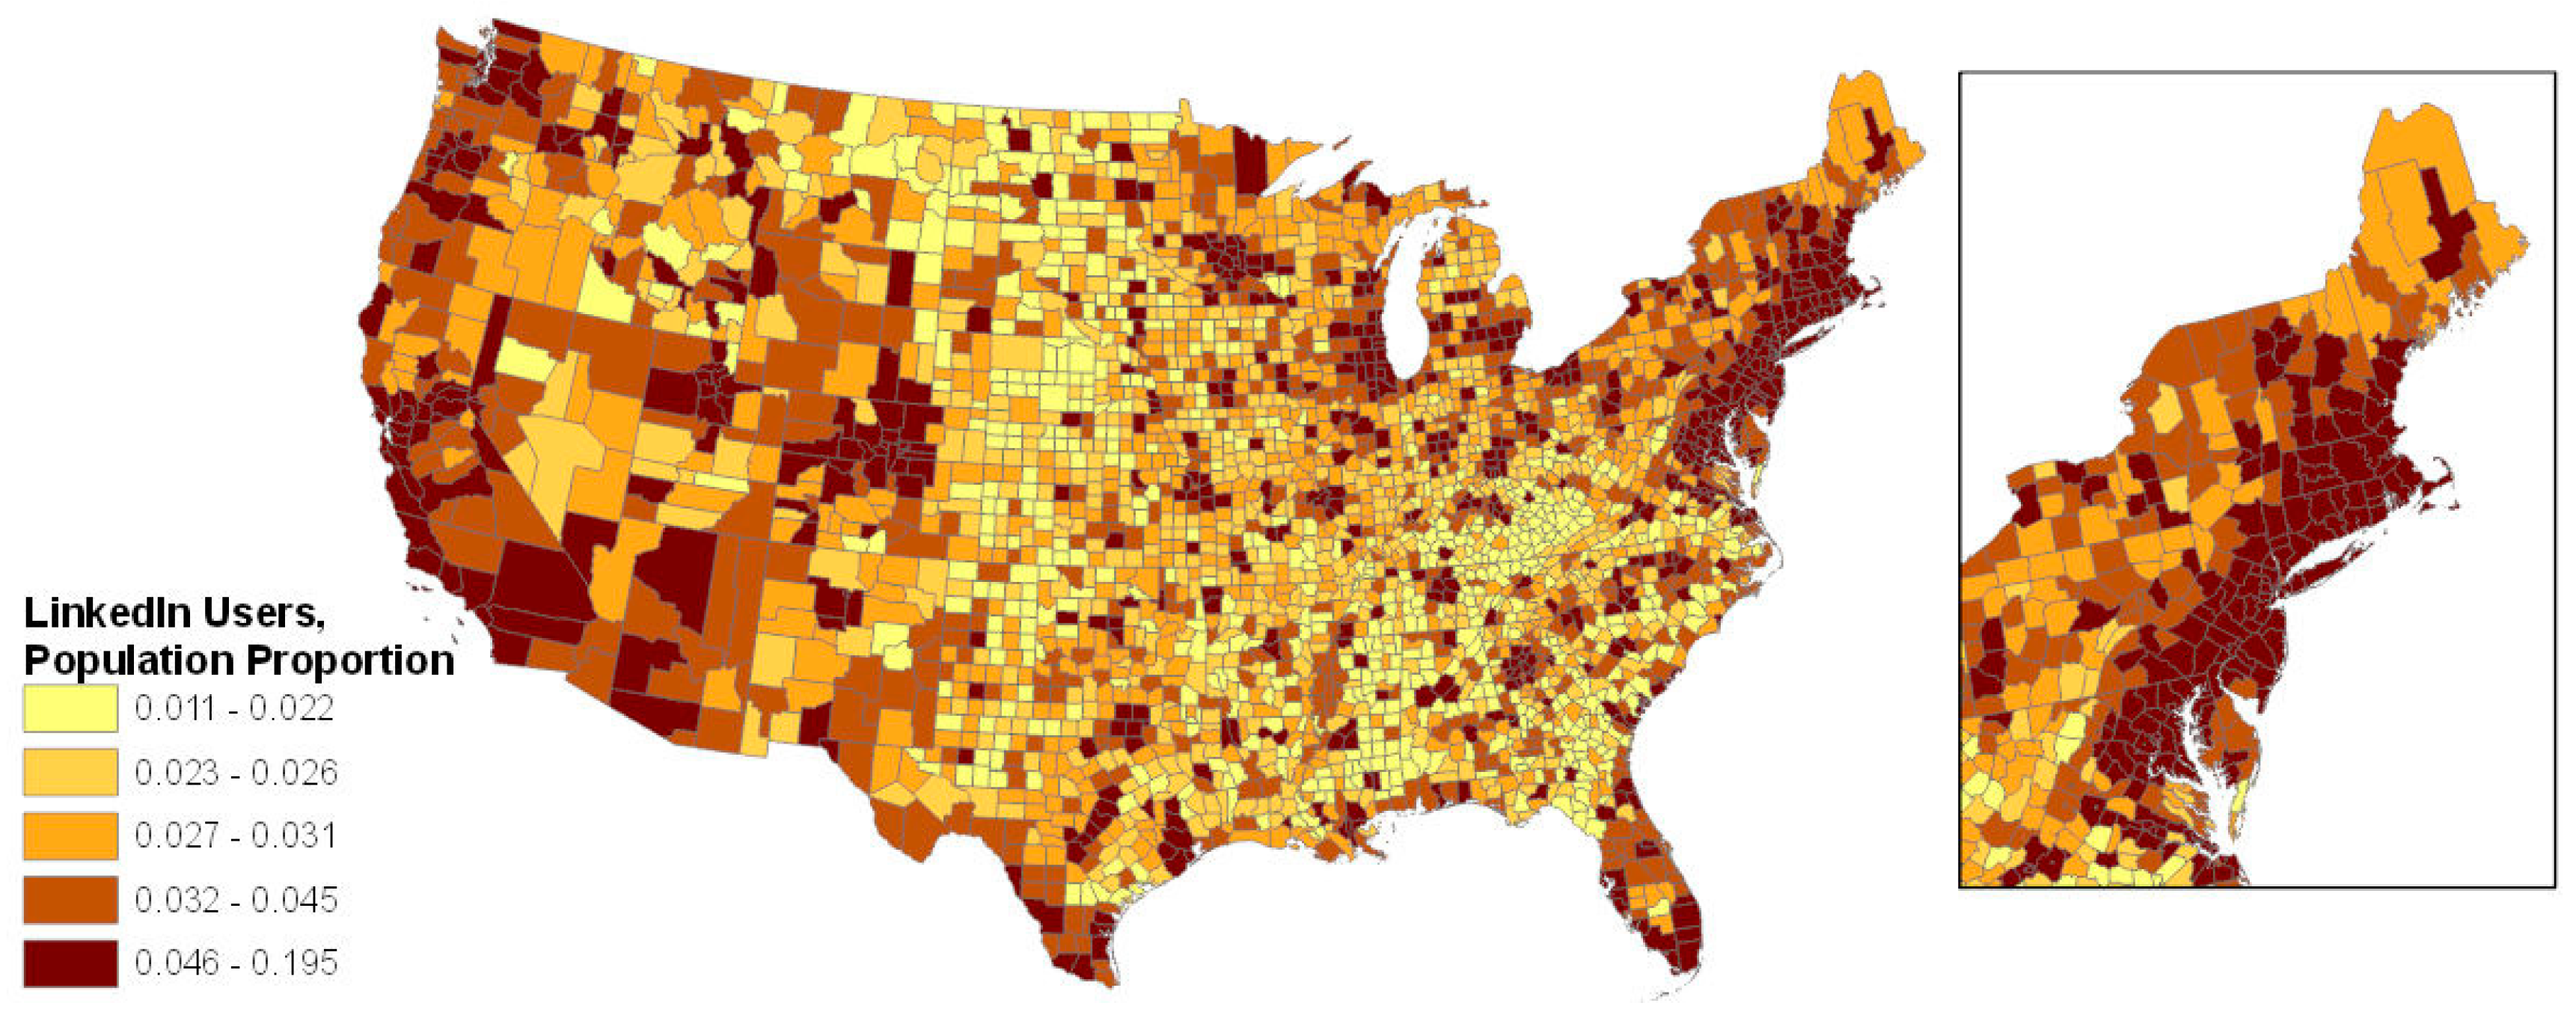
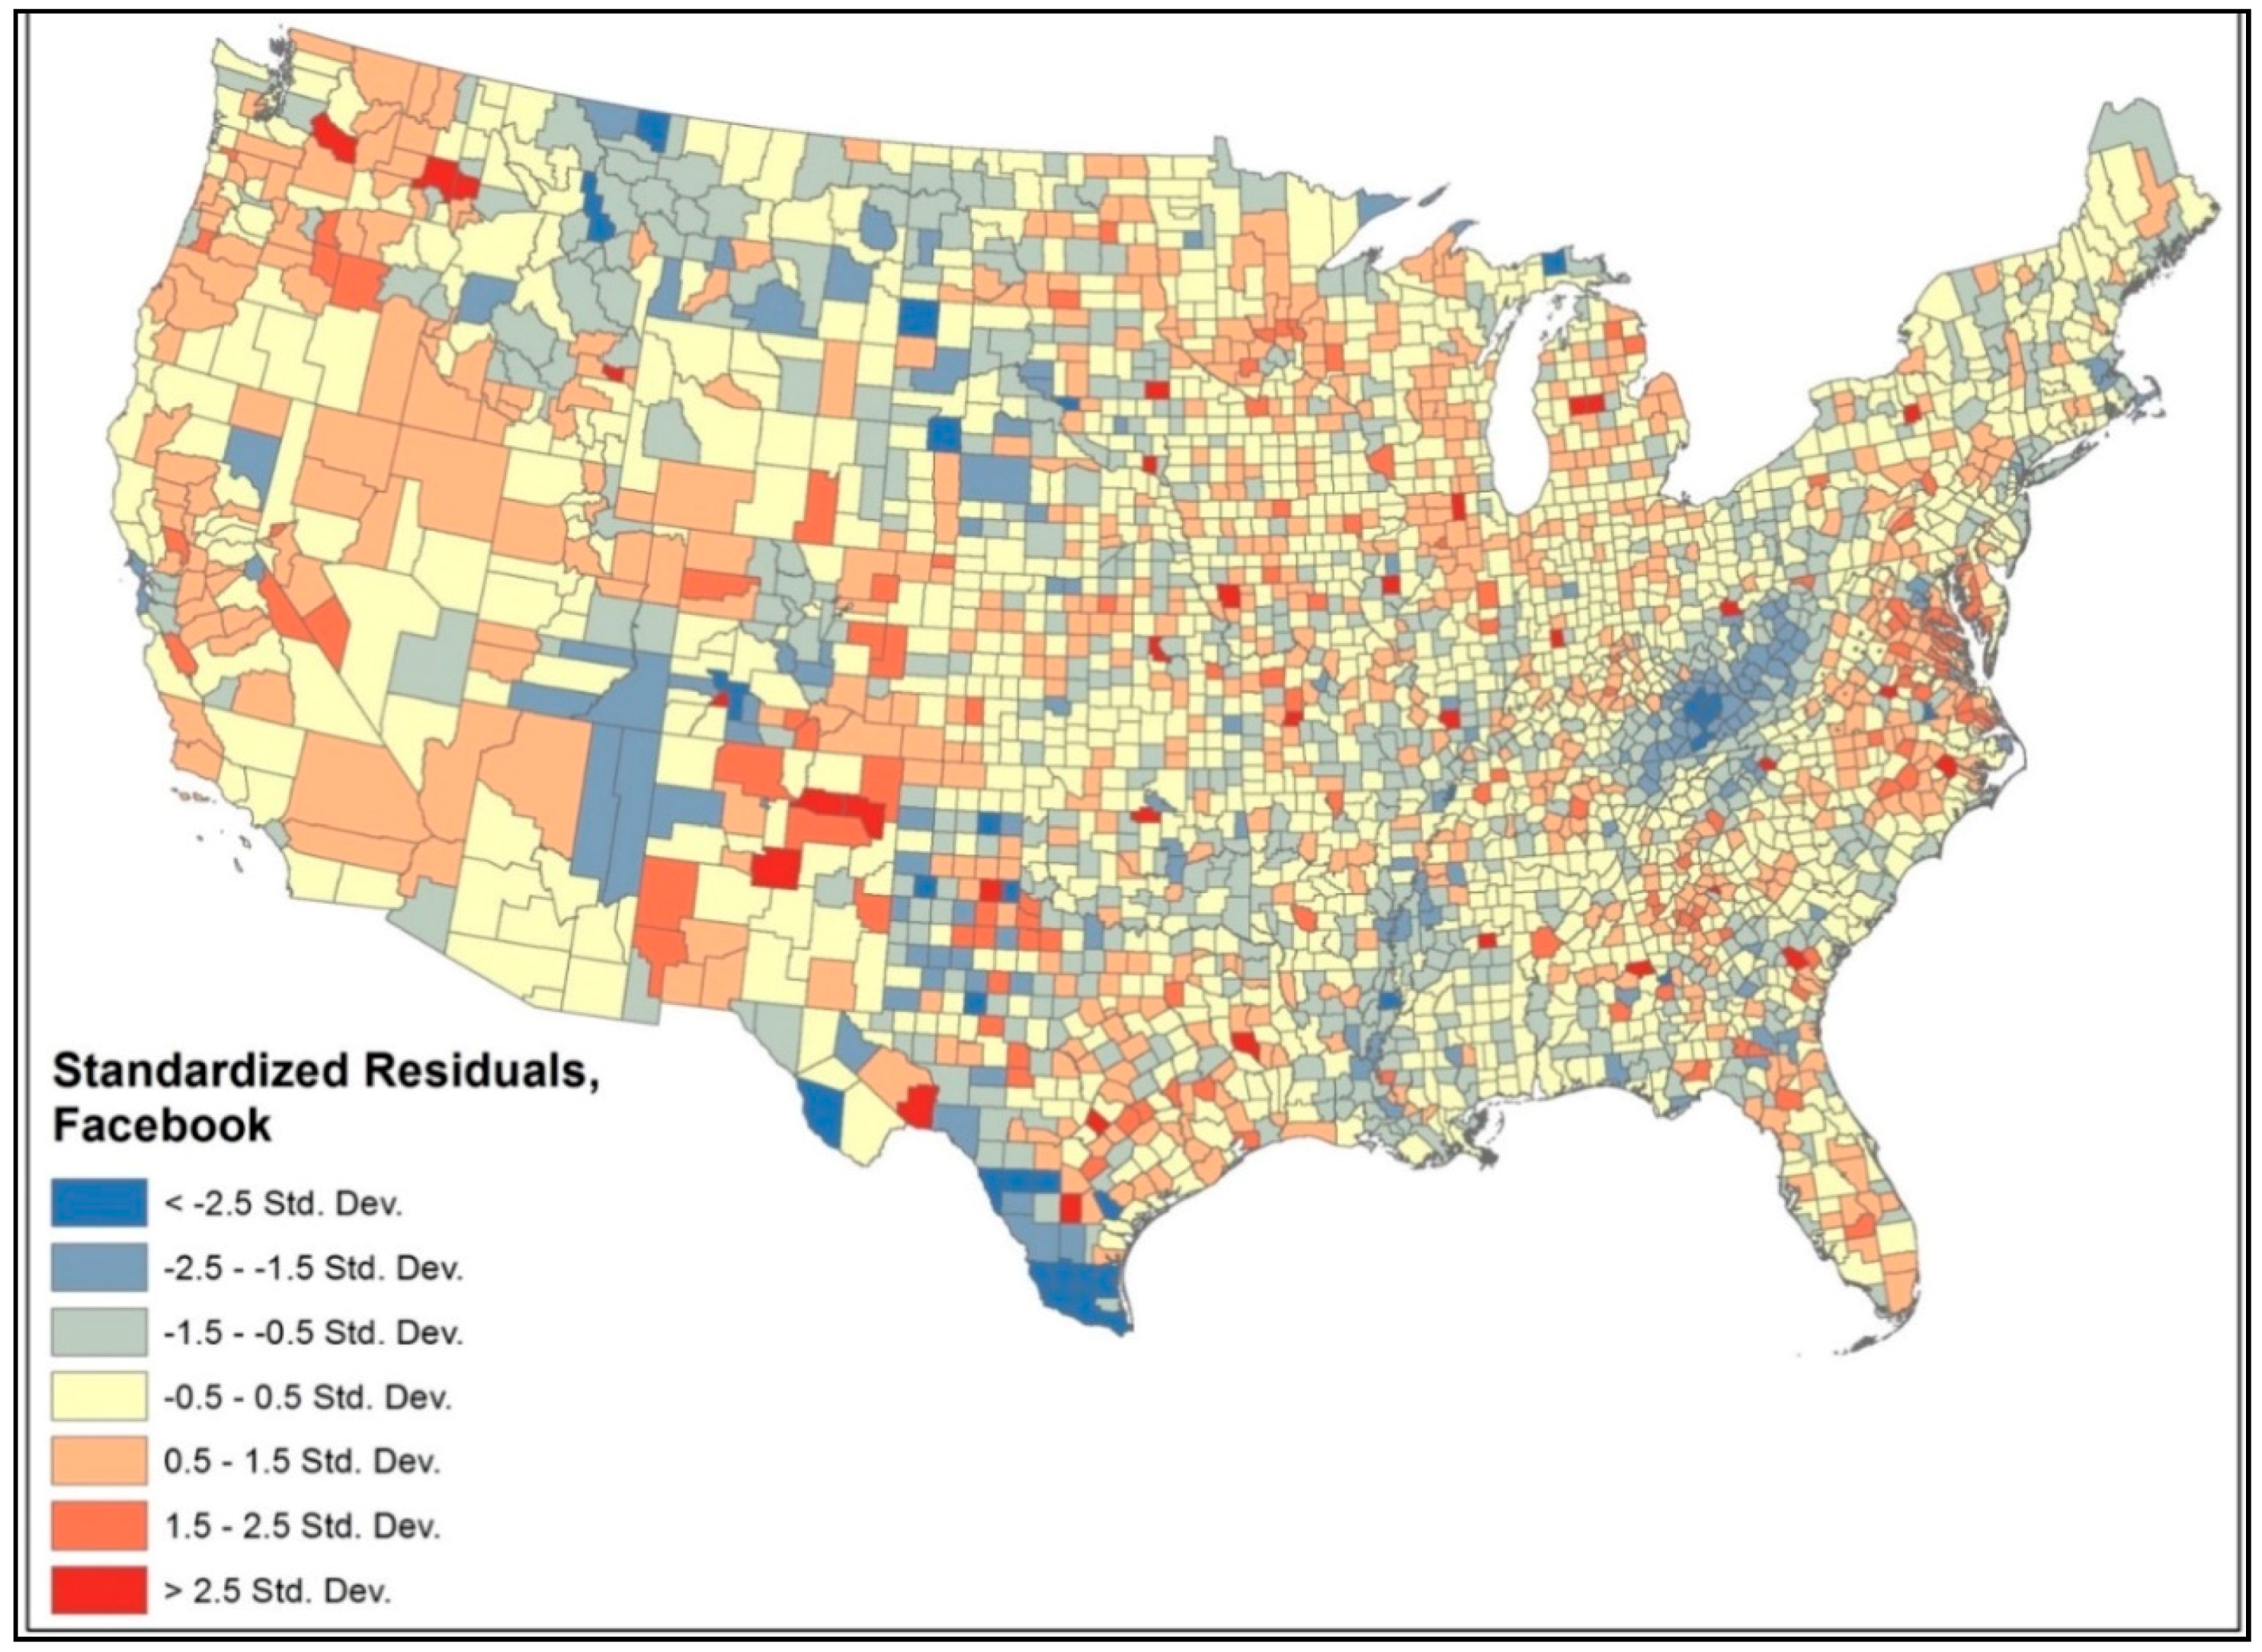
Table 1.
Definitions and descriptive statistics of the dependent and independent variables.
| Abbreviation | Name of Dependent Variable | Source | Year of Data | Definition | Minimum | Maximum | Mean | SD |
| FACEBOOKR | Visited website in last 30 days: facebook.com | BA | 2010-2012 | Facebook per capita | 0.20 | 0.69 | 0.40 | 0.06 |
| LINKEDINR | Visited website in last 30 days: LinkedIn.com | BA | 2010-2012 | LinkedIn per capita | 0.02 | 0.14 | 0.04 | 0.02 |
| TWITTERR | Visited website in last 30 days: twitter.com | BA | 2010-2012 | Twitter per capita | 0.01 | 0.19 | 0.03 | 0.02 |
| Variable | Name of Independent Variable | Source | Year of Data | Definition | Minimum | Maximum | Mean | SD |
| YOUNGDEPR | Young Dependency Ratio | CENDEC10_DP01 | 2010 | POP0-19/POP20-64 | 0.17 | 0.88 | 0.45 | 0.07 |
| COLLEGER | College Graduates or Higher, Age 18+ | CENACS10_DP02 | 2008-2012 | Population Estimate of College Graduates or Higher, Age 18+ | 0.03 | 0.54 | 0.13 | 0.06 |
| PINCPC12 | Personal Income Per Capita | BEA_CA1-3 | 2012 | Personal Income Per Capita | 17264.00 | 116843.00 | 36523.76 | 9182.78 |
| WKAGEPOP | Working Age Pop (Pop. 20-64)/Total Population | CENDEC10_DP01 | NA | POP20-64/TOTPOP | 0.46 | 0.74 | 0.58 | 0.03 |
| SERVICER | Service Occupations | CENACS10_DP03 | 2008-2012 | Persons 16+ in Service Occupations | 0.03 | 0.21 | 0.10 | 0.02 |
| CONSTRUCTR | Construction Industry, Employed Persons 16+ | CENACS10_DP03 | 2008-2012 | Construction Industry, Employed Persons 16+ | 0.00 | 0.16 | 0.04 | 0.01 |
| ASIANR | Asian Population | CENDEC10_DP01 | 2010 | Number; RACE - Race alone or in combination with one or more other races: [4] - Asian | 0.00 | 0.36 | 0.01 | 0.02 |
| BLACKR | Black Population | CENDEC10_DP01 | 2010 | Number; RACE - Race alone or in combination with one or more other races: [4] - Black or African American | 0.00 | 0.86 | 0.10 | 0.15 |
| HISPANICR | Hispanic/Latino Population | CENDEC10_DP01 | 2010 | Number; HISPANIC OR LATINO - Total population | 0.00 | 0.96 | 0.08 | 0.13 |
| URBAN | Urban Population | CENDEC10_DP01 | 2010 | Urban Population | 0.00 | 1.00 | 0.78 | 0.41 |
| LGOVEDEXPR | Local Govt Education Expenditures | NCES_F33 | 2009 | Total Expenditures | 69.57 | 36664.34 | 1985.97 | 1144.67 |
| PSTSVCEMPR | Professional, Scientific, and Tech Services Employees | CENECON07 | 2007 | Professional, Scientific, and Technical Services Employees per capita | 0.00 | 1.00 | 0.62 | 0.49 |
| FACTORAVE | Transformed Social Capital | Rupasingha and Goetz, 2008 | 2009 | US County Social Capital | 0.00 | 0.47 | 0.17 | 0.04 |
| SOURCES | Abbrev | Detailed Reference | ||||||
| US Census Bureau, DEC 2010, Table DP-01 | CENDEC10_DP01 | US Census Bureau, Decennial Census 2010, Summary File 1 | ||||||
| US Census Bureau, ACS 2012, Table DP-02 | CENACS12_DP02 | US Census Bureau, American Community Survey 2012, 5-year estimates, Table DP-02 | ||||||
| US Census Bureau, ACS 2012, Table DP-03 | CENACS12_DP03 | US Census Bureau, American Community Survey 2012, 5-year estimates, Table DP-03 | ||||||
| US Census Bureau, ACS 2012, Table DP-04 | CENACS12_DP04 | US Census Bureau, American Community Survey 2012, 5-year estimates, Table DP-04 | ||||||
| US Census Bureau, ACS 2012, Table DP-05 | CENACS12_DP05 | US Census Bureau, American Community Survey 2012, 5-year estimates, Table DP-05 | ||||||
| Federal Communications Commission, Form 477 | FCC_477 | Federal Communications Commission, Form 477, Local Telephone Competition and Broadband Deployment | ||||||
| Bureau of Economic Analysis, CA1-3 | BEA_CA1-3 | US Dept of Commerce, Bureau of Economic Analysis, CA1-3, Personal Income, Per Capita Income | ||||||
| Bureau of Economic Analysis, CA04 | BEA_CA04 | US Dept of Commerce, Bureau of Economic Analysis, CA04, Personal Income Summary | ||||||
| US Census Bureau, Economic Census 2007 | CENECON07 | US Census Bureau, Economic Census 2007 | ||||||
| US Department of Commerce, NTIA, State Broadband Initiative, Analyze Table | NTIA_SBI_Analyze | US Dept of Commerce, National Telecommunications and Information Administration, State Broadband Initiative (CSV format December 31, 2012). | ||||||
| National Center for Education Statistics, F-33 | NCES_F33 | US Census Bureau, Governments Division, Local Education Agency (School District) Finance Survey (F-33), National Center for Education Statistics, Common Core of Data | ||||||
| Esri Business Analyst Data | BA | Esri Business Analyst Data, GfK MRI DoubleBase Survey 2012 | ||||||
| Rupasingha and Goetz, 2008 | --- | Pennsylvania State University’s Northeast Regional Center for Rural Development | ||||||
Table 2.
Ordinary Least Square OLS regression findings for socioeconomic determinants of social media variables, 2010–2012, country and metropolitan samples.
Table 2.
Ordinary Least Square OLS regression findings for socioeconomic determinants of social media variables, 2010–2012, country and metropolitan samples.
| Country (Lower 48 States only) | Metropolitan | |||||
|---|---|---|---|---|---|---|
| Independent Variable | ||||||
| Young Dependency Ratio | 0.352*** | 0.357*** | 0.195*** | 0.493*** | 0.331*** | 0.225*** |
| College Graduates or Higher, Age 18+ | 0.443*** | 0.353*** | 0.591*** | 0.627*** | 0.575*** | 0.761*** |
| Personal Income Per Capita | ||||||
| Working Age Pop (Pop. 20–64)/Total Population | 0.350*** | 0.348*** | 0.267*** | 0.481*** | 0.414*** | 0.232*** |
| Persons 16+ in Service Occupations | 0.087*** | 0.092*** | 0.168*** | |||
| Persons 16+ in Construction Occupations | −0.209*** | |||||
| Asian | 0.135*** | 0.169*** | 0.173*** | |||
| Black | −0.261*** | 0.181*** | −0.178*** | 0.169*** | ||
| Hispanic | −0.249*** | −0.154*** | 0.176*** | |||
| Urban | 0.365*** | 0.272*** | 0.183*** | N/A | N/A | N/A |
| Local Govt Education Expenditures | ||||||
| Professional, Scientific, and Tech Services Employees | ||||||
| Social Capital | ||||||
| Adjusted R-squared | 0.760*** | 0.741*** | 0.820*** | 0.742*** | 0.755*** | 0.885*** |
| Sample Size | 3109 | 3109 | 3109 | 1161 | 1161 | 1161 |
| OLS Regression Diagnostic Tests | ||||||
| Joint Wald Statistic | 7592.998*** | 6197.461*** | 7132.232*** | 1938.830*** | 2916.017*** | 5654.608*** |
| Koenker (BP) | 268.437*** | 228.120*** | 362.019*** | 33.406*** | 28.579*** | 90.485*** |
| Jarque-Bera | 616.561*** | 15713.923*** | 18055.782*** | 260.933*** | 1860.032*** | 121.843*** |
| Spatial autocorrelation (Moran’s I) | ||||||
| Dependent Variable | 0.421*** | 0.363*** | 0.674*** | 0.434*** | 0.709*** | 1.168*** |
| Regression Residual | 0.433*** | 0.030 | 0.107 | 0.286*** | 0.163** | 0.252*** |
* Signif. at 0.05, ** signif. at 0.01, *** signif at 0.001.
Table 3.
Ordinary Least Square (OLS) regression findings for socioeconomic determinants of social media variables, 2010–2012, micropolitan, and rural samples.
Table 3.
Ordinary Least Square (OLS) regression findings for socioeconomic determinants of social media variables, 2010–2012, micropolitan, and rural samples.
| Micropolitan | Rural | |||||
|---|---|---|---|---|---|---|
| Independent Variable | ||||||
| Young Dependency Ratio | 0.545*** | 0.584*** | 0.338*** | 0.318*** | 0.619*** | 0.180*** |
| College Graduates or Higher, Age 18+ | 0.385*** | 0.516*** | 0.725*** | 0.355*** | 0.187*** | 0.355*** |
| Personal Income Per Capita | ||||||
| Working Age Pop (Pop. 20-64)/Total Population | 0.457*** | 0.539*** | 0.435*** | 0.202*** | 0.414*** | 0.222*** |
| Persons 16+ in Service Occupations | 0.175*** | 0.198*** | 0.160*** | 0.121*** | 0.161*** | 0.261*** |
| Persons 16+ in Construction Occupations | −0.177*** | −0.108*** | 0.089*** | |||
| Asian | 0.217*** | 0.130*** | 0.234*** | 0.125*** | 0.172*** | |
| Black | −0.291*** | 0.251*** | −0.397*** | 0.258*** | ||
| Hispanic | −0.343*** | −0.244*** | ||||
| Urban | N/A | N/A | N/A | N/A | N/A | N/A |
| Local Govt Education Expenditures | −0.125*** | −0.118*** | ||||
| Professional, Scientific, and Tech Services Employees | 0.058** | 0.086*** | ||||
| Social Capital | −0.087** | −0.111*** | −0.152*** | |||
| Adjusted R-squared | 0.694*** | 0.697*** | 0.771*** | 0.505*** | 0.361*** | 0.372*** |
| Sample Size | 637 | 637 | 637 | 1311 | 1311 | 1311 |
| OLS Regression Diagnostic Tests | ||||||
| Joint Wald Statistic | 894.903*** | 779.111*** | 424.397*** | 1004.646*** | 213.198*** | 149.722*** |
| Koenker (BP) | 72.313*** | 112.968*** | 127.845*** | 244.571*** | 190.195*** | 256.122*** |
| Jarque-Bera | 116.315*** | 420.707*** | 1504.491*** | 89.059*** | 18472.807*** | 70571.308*** |
| Spatial autocorrelation (Moran’s I) | ||||||
| Dependent Variable | 0.352 | −0.178 | −0.022 | 0.335*** | −0.160* | 0.105 |
| Regression Residual | 0.853 | 0.128 | 0.770 | 0.077 | −0.269*** | −0.020 |
* Signif. at 0.05, ** signif. at 0.01, *** signif at 0.001.
© 2019 by the authors. Licensee MDPI, Basel, Switzerland. This article is an open access article distributed under the terms and conditions of the Creative Commons Attribution (CC BY) license (http://creativecommons.org/licenses/by/4.0/).
Share and Cite
MDPI and ACS Style
Pick, J.; Sarkar, A.; Rosales, J. Social Media Use in American Counties: Geography and Determinants. ISPRS Int. J. Geo-Inf. 2019, 8, 424. https://0-doi-org.brum.beds.ac.uk/10.3390/ijgi8090424
AMA Style
Pick J, Sarkar A, Rosales J. Social Media Use in American Counties: Geography and Determinants. ISPRS International Journal of Geo-Information. 2019; 8(9):424. https://0-doi-org.brum.beds.ac.uk/10.3390/ijgi8090424
Chicago/Turabian StylePick, James, Avijit Sarkar, and Jessica Rosales. 2019. "Social Media Use in American Counties: Geography and Determinants" ISPRS International Journal of Geo-Information 8, no. 9: 424. https://0-doi-org.brum.beds.ac.uk/10.3390/ijgi8090424
Note that from the first issue of 2016, this journal uses article numbers instead of page numbers. See further details here.