1. Introduction
During the last decades in Spain, the urban growth process has affected not only the big metropolitan areas, but also the medium-sized ones, greatly altering their structure and nature. The urbanization processes during this period especially affect tourist areas of the Mediterranean coast, the periphery areas of the big cities, and also the environment of medium-sized cities and province capitals from the peninsular interior [
1]. The logic behind construction in cities that has emerged in the last two decades has altered the traditional compact structure, intense and dense, and is yielding to new ways of understanding territorial, social, functional and morphological dimensions [
2] (p. 25). Some authors had already announced the obsolescence of the theories and paradigms of how a city was considered until our days, as well as the appearance of a new type of emerging urbanization, with the configuration of a new urban system. In particular, the de-industrialization process surging brings to light the end of the relationship between the urban system and the production system, given that, with modern technology, there is a hyper-industrialization process taking place that does not obey classic location factors [
3] (p. 37).
Among this complex system, intermediate cities or medium-sized cities appear, which are integrated into an open urban system and take on the functions of service centers for a smaller administrative influence area, reinforcing the idea of a city region, and providing an intermediation role through distribution and interchange of social, cultural, and economic services, that generates a great territorial structure, joining in a particular position a given communication and transport network [
1] (pp. 30–31). For the case of Castilla-La Mancha, according to some quantitative classification [
4] (p. 58) and non-residential proposals [
5], there are seven medium-sized cities (Albacete, Talavera de la Reina, Toledo, Guadalajara, Ciudad Real, Cuenca and Puertollano).
Education inside classrooms provides unique opportunities to show these new urban changes, and to let the youth take part in the city transformation, training them as future citizens. Here, social science in general, and more specifically geography, gain great relevance, with their contribution to the curriculum with knowledge from the natural and cultural environment throughout the different educational stages [
6,
7]. There are clear examples, when it comes to this, about the concerns shown in some works regarding the transposition of landscape in the educational practice [
8].
In this frame, as research regarding the changes that have occurred in medium-sized Spanish cities is scarce, and the ones that have been carried out are done so from the urban and geographic field, and even scarcer are the works that face this problem from the learning and knowledge point of view, we consider carrying out a study about perception of urban environment in one of these medium-sized cities to be of the utmost interest. Our investigation intends to establish certain patterns in valuation and perception from the younger citizens—those of compulsory school age—in a medium-sized city located in the center of Spain, Ciudad Real, which belongs to the autonomous region of Castilla-La Mancha.
The interest for studying this zone lies in that it is a region located inside the metropolitan influence area of Madrid, characterized by two processes occurring: On the one hand, a high concentration of functions in the metropolis, and on the other hand, the area’s metropolization, that made Madrid dominate cities’ systems, becoming the center of gravity of centripetal flow that has created a great impact of the metropolis over the nearest provinces. This process brings along a series of social, functional and morphological changes of the cities in this influence area [
9] (p. 167), and is usually accompanied by a transformation of the interior of these cities and their heritage [
10] (p. 138).
In the following work, the first part is dedicated to touch on conceptual and methodological aspects, where there is a reference to the concept and elements of the urban space, as well as the design of the investigation that has been carried out (techniques, variables and sources). The second part focuses on an outline of the zones and the location of heritage in Ciudad Real, which is part of our investigation. In the third part, the results obtained are analyzed, and the final part contains the conclusions.
2. Background
We believe it is necessary to specify, before addressing our investigation results, two basic aspects: A conceptual one—urban space and the elements that form it—and the division of Ciudad Real in zones we have used:
2.1. The Urban Space and the Elements That Form it
At the end of the day, a city is a shared space where diverse people interact in a continuous manner. That is why social relationships are seen in squares, parks, streets, meeting points, etc., and a map of a city is a static image that shows the history of the urbanization process, or, in other words, the inhabitant’s life [
11] (p. 401).
That is why in any given urban space, both natural factors or elements, and human actions, take part in this process, without forgetting that, besides that reality, the ideas that we have about things and the way we live also take part. It is precisely the mixture of all these elements that provide each city with a series of particular characteristics. Hence, why the elements that configure the urban space make reference to the way the city has been built, and are shown in a series of elements such as: Road infrastructure, green areas, relief, etc. These urban space organization elements have a way of functioning, an organization pattern, or importance criteria, which varies from one city to another, and precisely, that variation is where we have to find each cities’ peculiarity. Some authors refer to this as urban landscape, understood as a place made up from a series of elements that confer a specific identity and make it different than any other space. We cannot forget that the knowledge of a city isn’t only made up of the physical foundation that forms it from a morphological perspective, but also how this space is understood and used by its citizens [
6] (p. 1154).
The ensemble of these constitutive elements that form space, is usually classified into three main groups: Physical, socio-cultural and organization elements.
The first group of urban elements is defined as the physical layout of the elements, such as the arrangement and type of housing, industries, government and institutional buildings, public and leisure areas, and shopping centers. All these are inter-connected by transport and communication services and they constitute the urban structure, after that, patterns about specific ground, economic activity, identity, social differentiation, and individual and group attributes, including relationships, thoughts, and inhabitants’ practices are added [
12] (p. 36).
The second group of elements is made up by the social reality built in that urban space, which are the ones that shape the urban space. A vast amount of literature that centers around the forces and agents that define space has been written, highlighting: The culture and adaptive processes of a city, mainly about urban Ecology from Chicago School; the distance, claimed by spatial tendency from the 1960s, which explains urban space structuring according to the distance from the area of business [
13]; even the post-modern discourse, popular nowadays, which yet again position culture as a decisive factor.
Finally, for practical purposes, urban space can be divided according to two organization standards: The continuity of the urban sprawl and the functions done by the resident population, which generally should be associated to industry, services and activities that involve knowledge [
14] (p. 230).
Another way of classifying urban space elements is into environmental elements and construction elements.
So, there is a big number of elements in an urban space, that are liable to be studied, and prove a huge potential of these types of spaces from an educational point of view, as it is possible to study them from various perspectives, and it also allows us to relate all of them, providing a comprehensive perception of this subject.
With this aim in mind, we are going to investigate one of the urban elements: Heritage, which has been structured into four blocks: Cultural heritage, natural heritage, leisure, and services.
2.2. Division of Ciudad Real in Zones
The present study, as mentioned above, concentrates on the analysis regarding the possible impact of the location of both primary and secondary schools, on the perception and evaluation of the different types of heritage (cultural, natural, leisure and services), based on their location in the urban space of a medium-sized city of Castilla-La Mancha such as Ciudad Real. The socio-spatial characteristics of the location of a school will not be studied, as the objective of our study is not this. So, we will simply name the schools in each of the zones established for the purposes of our study.
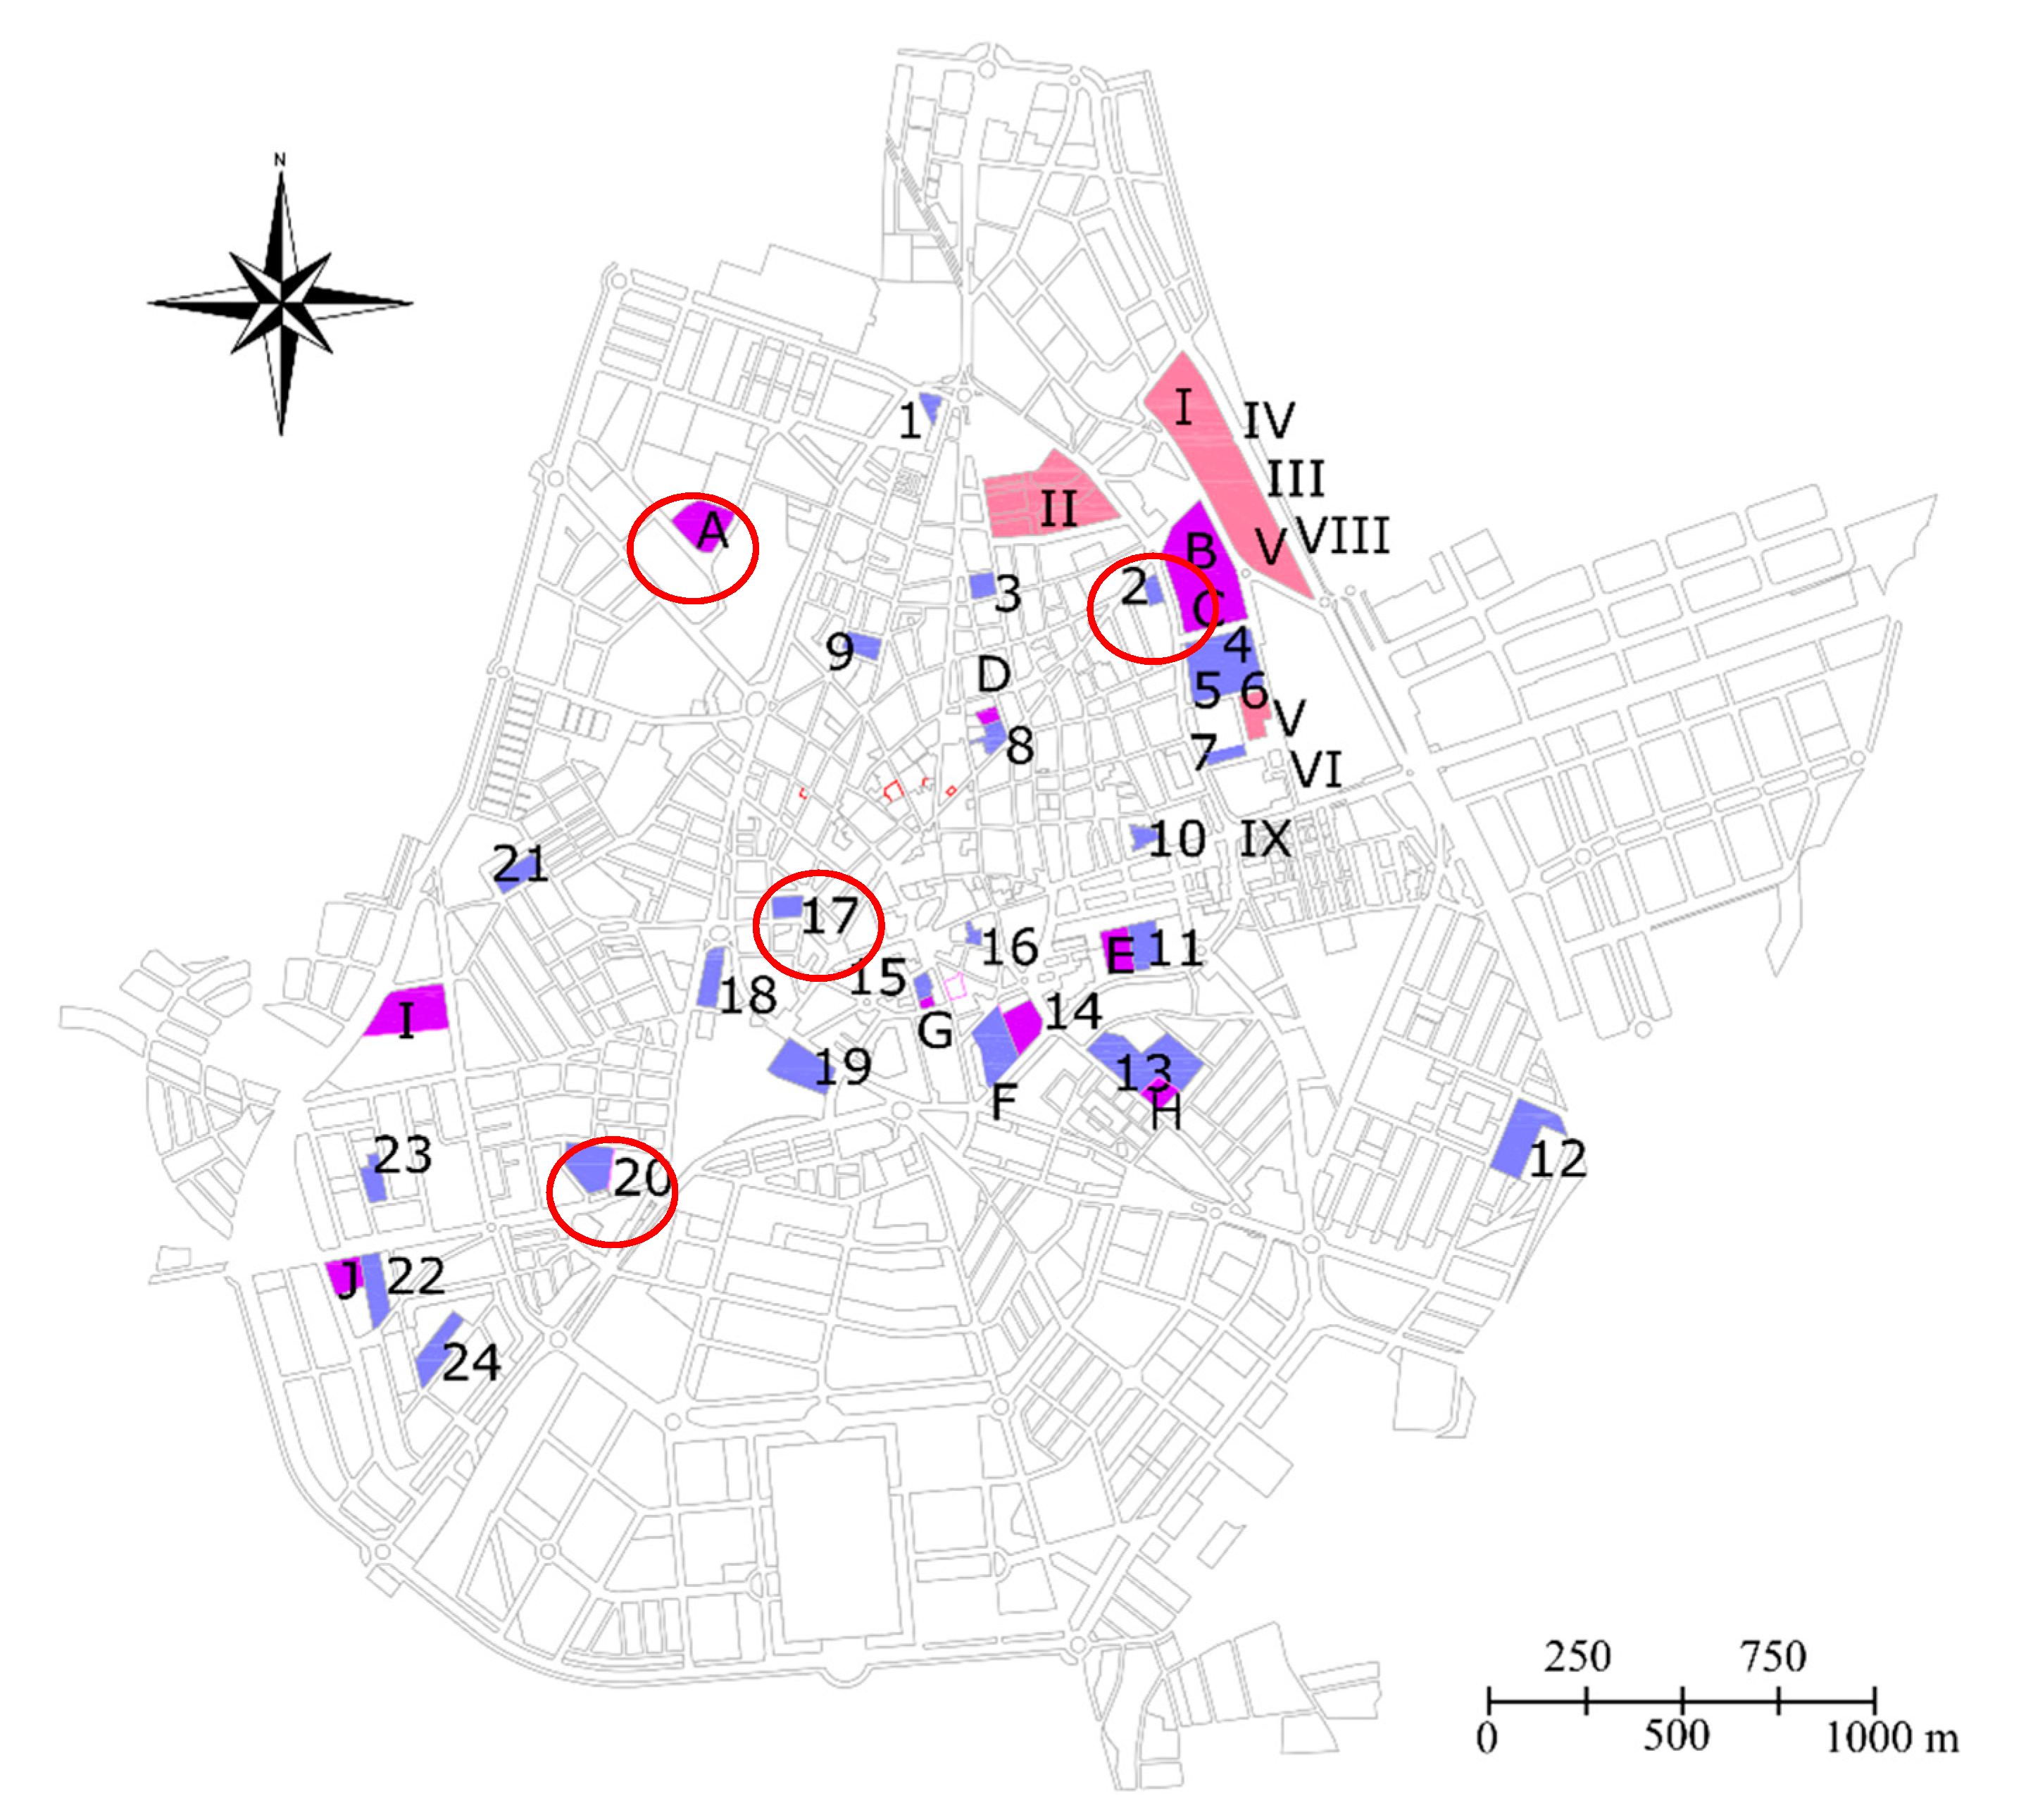
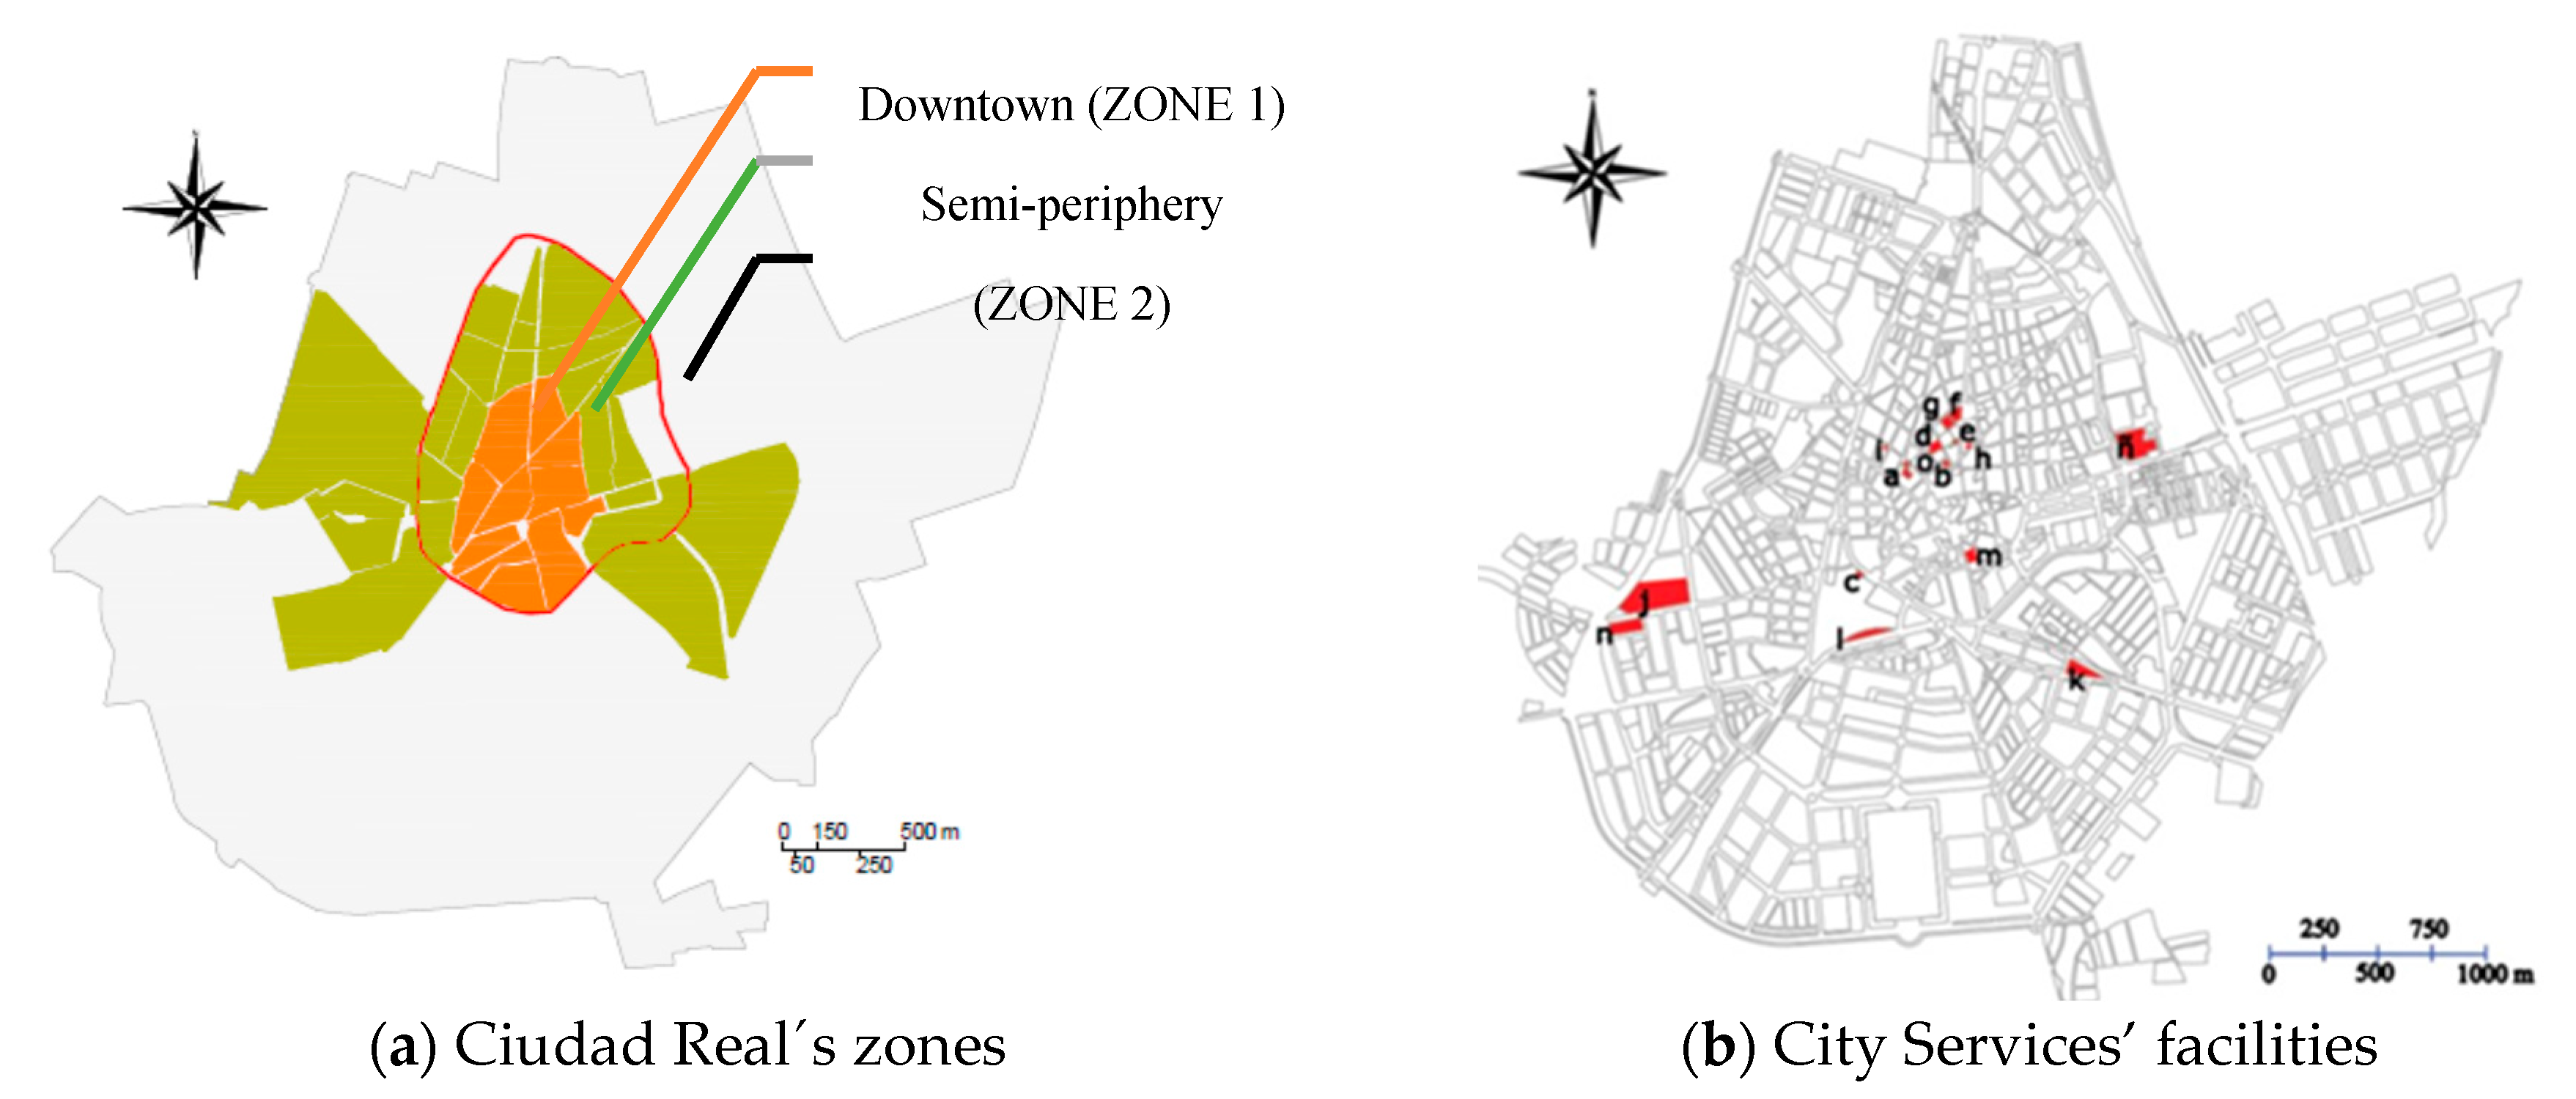
The following zones have been distinguished in Ciudad Real: Downtown, the first periphery inside the Ring roads, and the second periphery outside the Ring roads (
Figure A1).
The Downtown Zone corresponds to the historic part of the city, spanning around five important landmarks, which are very near to each other: Pilar Square, Main Square, San Pedro Church, Council, and the Cathedral. The semi-periphery, or first expansion of the city, which corresponds to the city’s growth between 1960 and 1990, include some emblematic neighborhoods such El Pilar, Pio XII, Casas Baratas, and Ciudad Jardín; and the periphery zone, or new city, outside the ring roads, corresponds to the city’s growth since the 90s.
This zone division allows us to generate: (a) Accessibility measures based on spatial analysis techniques such as the closest neighbor, which allow us to evaluate the spatial consistency and the spatial concentration of a given number of educational facilities; and (b) the graphic analysis of groups which study the characteristics of each group, establishing influence radiuses.
3. Methods and Hypothesis
This section describes population that has been studied, and the techniques and sources employed.
The spatial context has an important role on the general perception for quality of life [
15] (p. 30). As an indispensable instrument for the suggested analysis, we consider it advisable to point out the population profile of the schools from each of the big zones established in Ciudad Real, and also the location of the different types of local heritage taken into account. These will be the foundations of the subsequent analysis.
3.1. Demographic Profile of Schools in the Different Zones of Ciudad Real
This section may be divided by subheadings. It should provide a concise and precise description of the experimental results, their interpretation, and the experimental conclusions that can be drawn.
Taking into account the number of schools according to different educational stages (
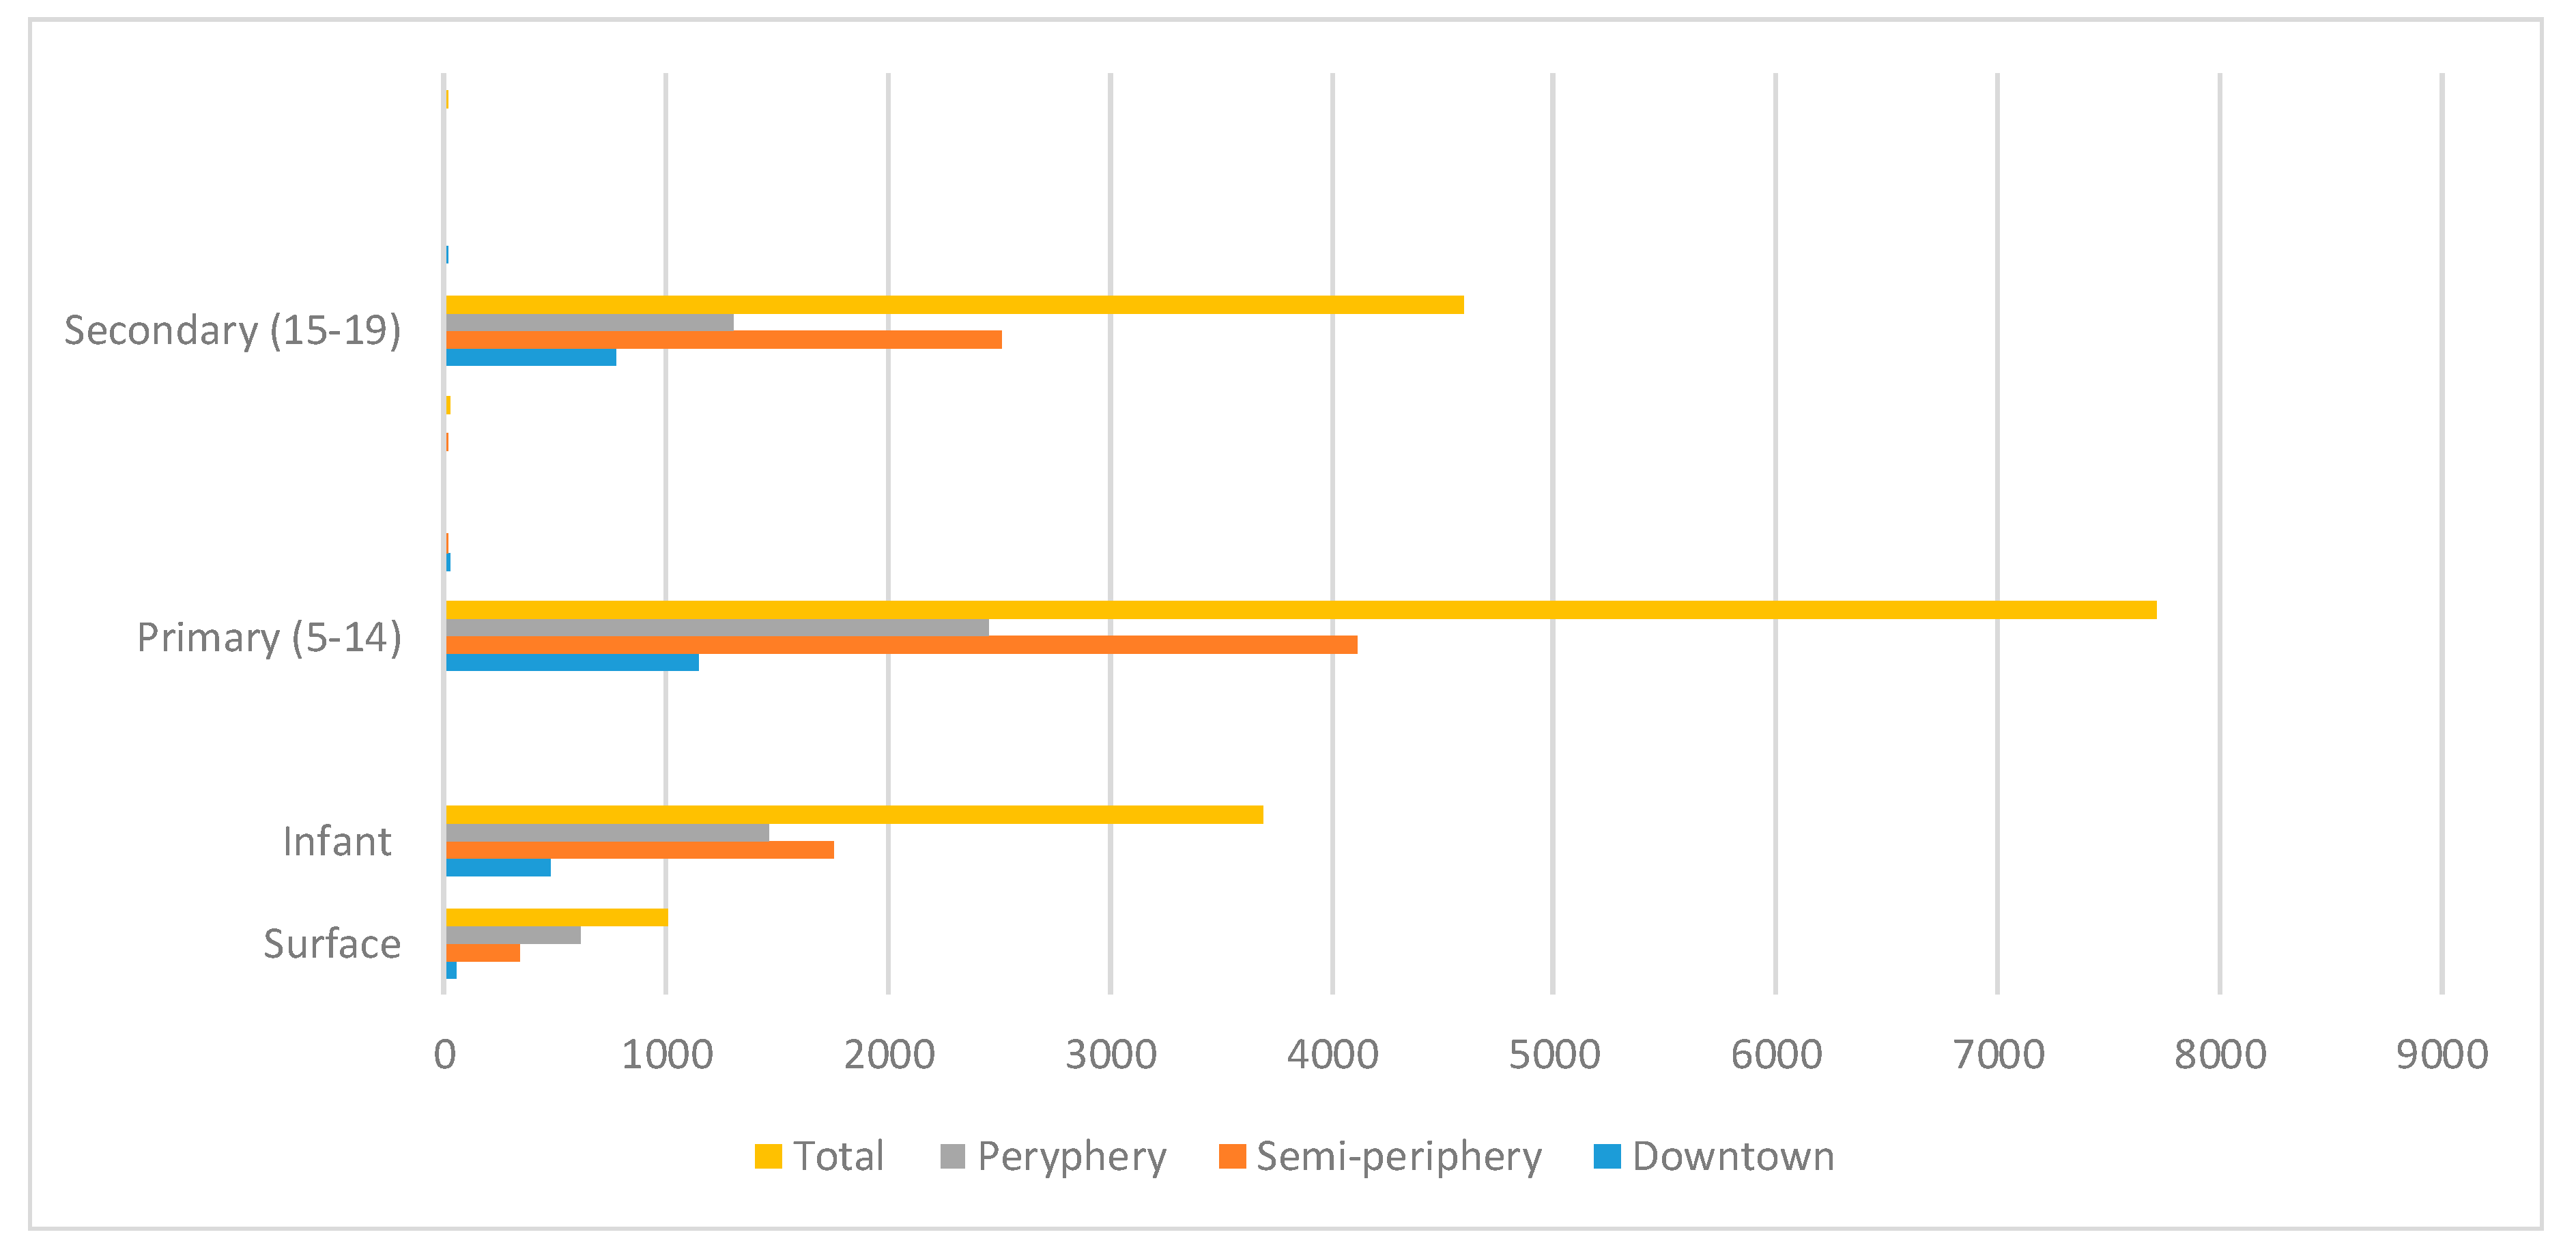
Figure A1) and the population by age in the different zones of the city, we can point out (
Figure 1;
Table A1):
- -
In the city centre or downtown, the density of school-age children from infant education is of 8.9 children/school, for Primary it is 21.4 children/school and for secondary it is 14.4 children/school.
- -
In the semi-periphery, the school-age population density for infant education is 5.2 children/school, for primary it is 12.2 children/school and for secondary it is 12.2 children/school.
- -
In the second periphery, the school-age population density for infant education is 2.4 children/school, for primary it is 4 children/school and for secondary it is 2.1 children/school.
Schools were selected according to different areas in which, as discussed earlier, Ciudad Real had been divided into for this investigation and that were made in relation to the distance from the city centre. Zone 1 or the Downtown Zone, is made made up of three schools: C.E.I.P. Ferroviario, C.E.I.P. Carlos Vázquez and C.C. San José; Zone 2 is the intermediate (semi-periphery) area formed by C.E.I.P. Pio XII and by C.C. Nuestra Señora del Prado; and Zone 3 is made up of periphery schools such as C.E.I.P. Cristóbal Colón and I.E.S. Hernán Pérez del Pulgar.
Likewise, using the same criteria as the schools, the spaces or constructions that make up the studied heritage, were classified and distributed in zones, so that each zone would have certain elements from each type of heritage, resulting as shown in the following
Table 1.
3.2. Hypothesis
Following the previous distributions, we propose the following general hypothesis for our study: The location of the school area determines the degree of preference of the spaces and heritage that are closer to the student’s influence area.
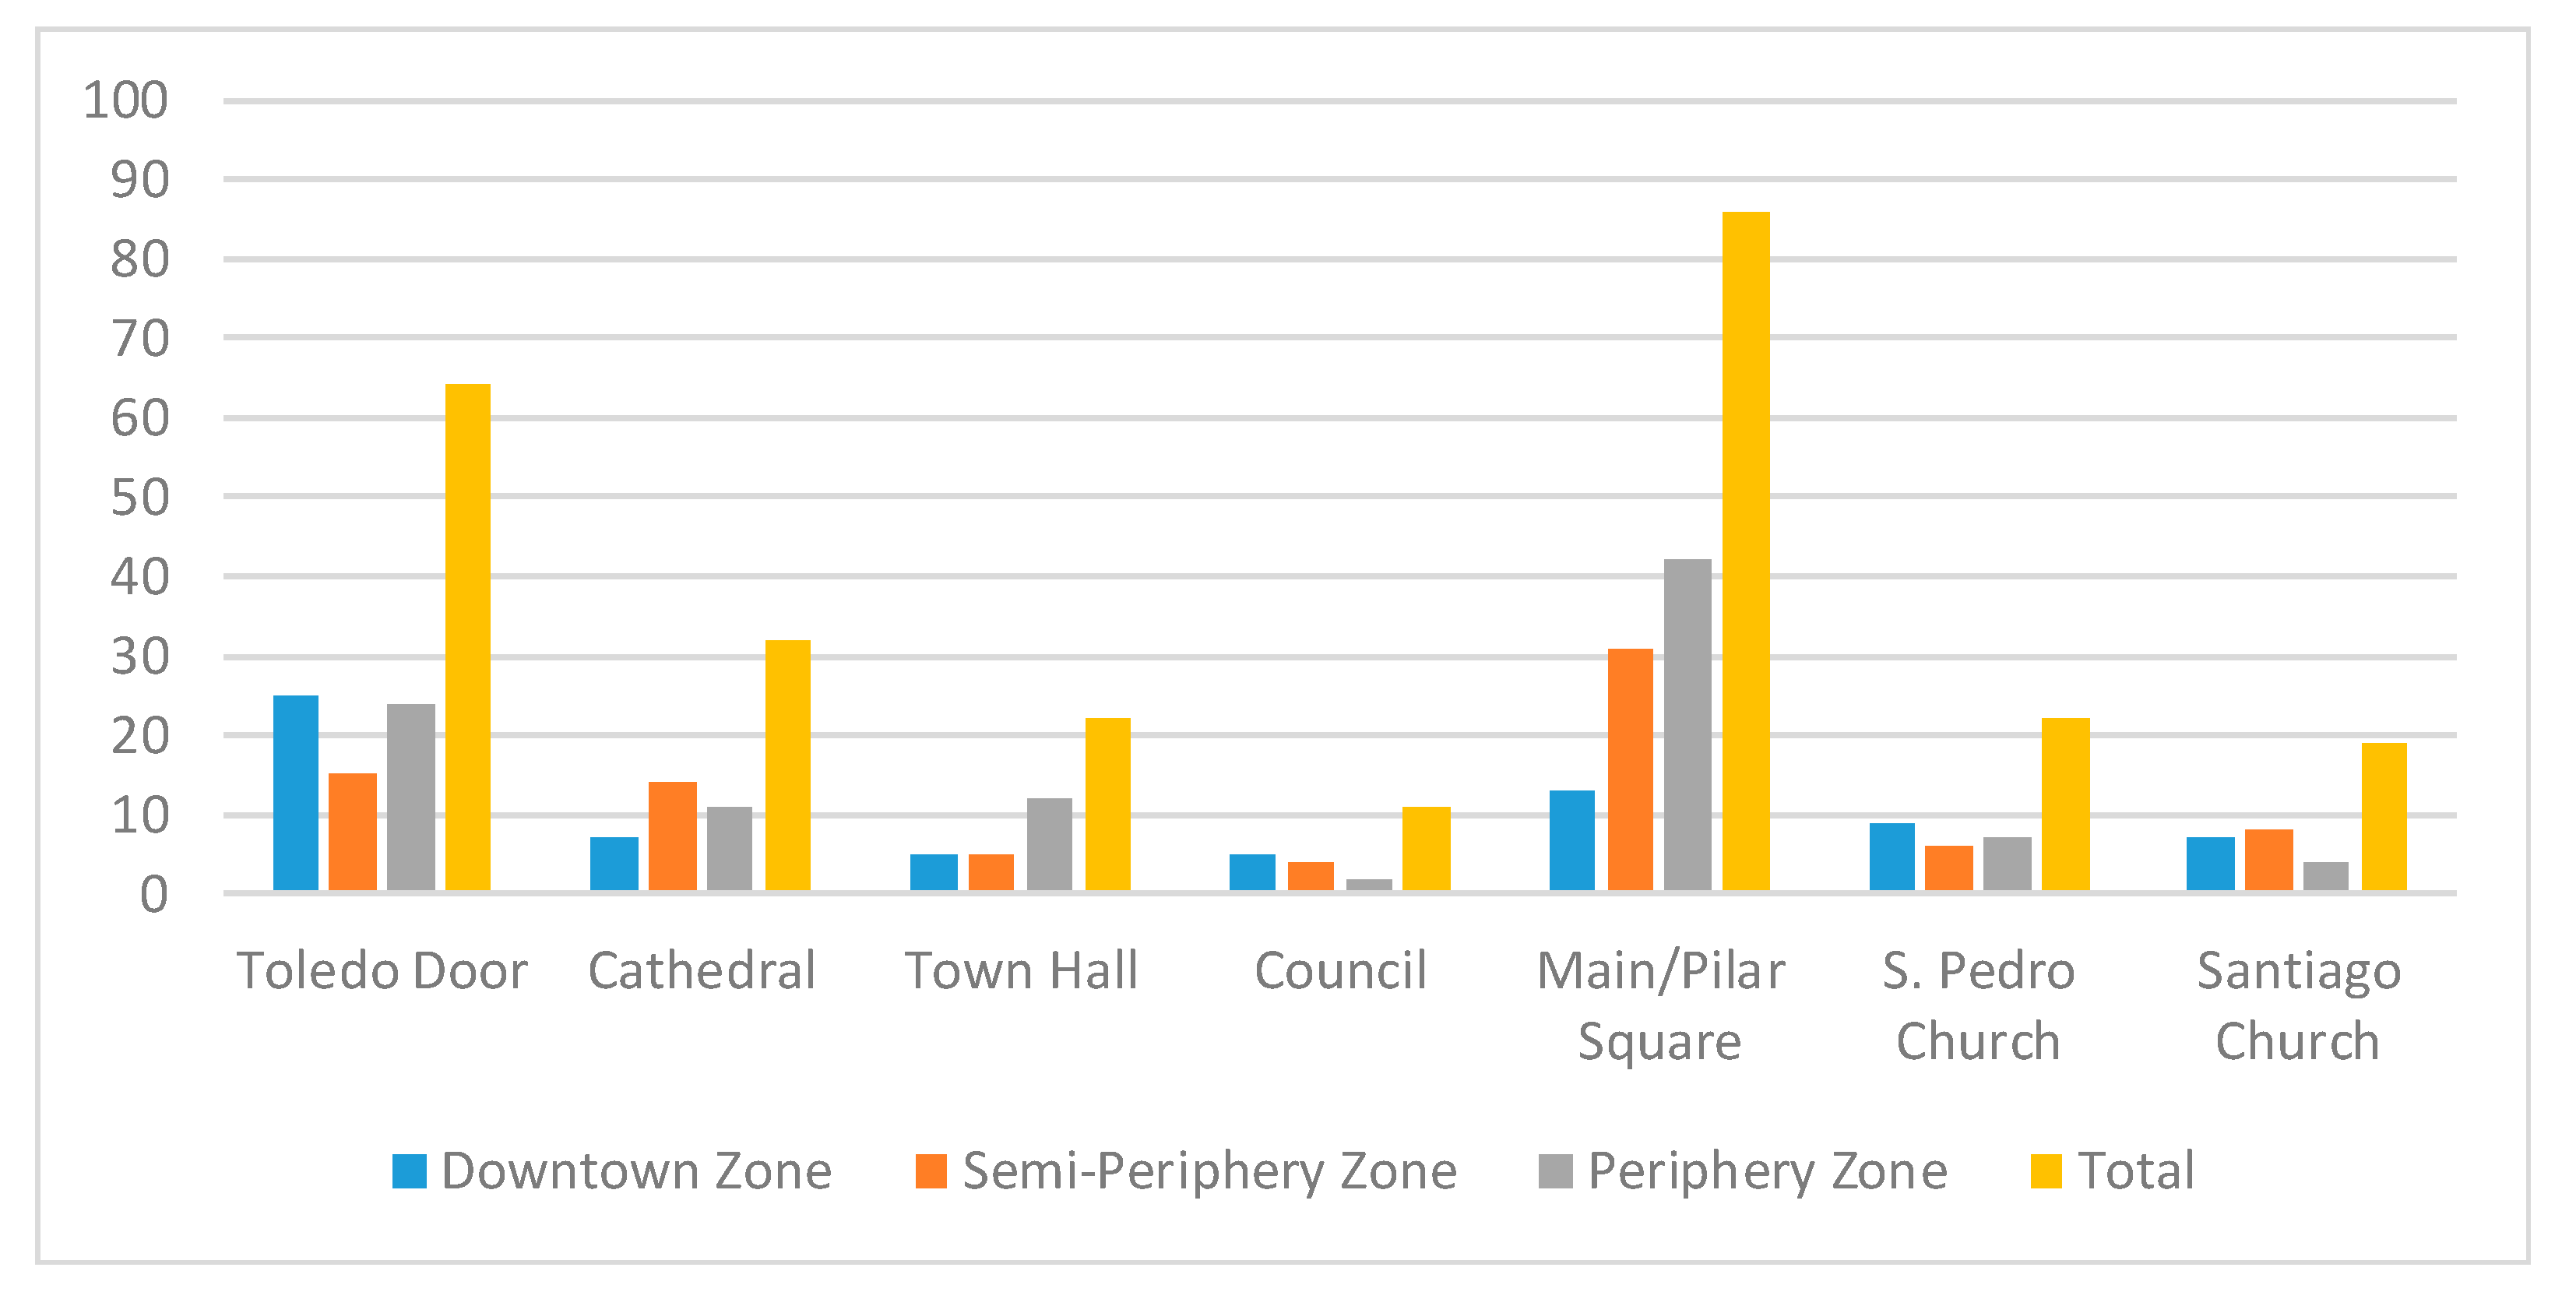
3.2.1. Spatial Distribution of the Cultural Facilities in Ciudad Real
We have considered cultural facilities to be the most emblematic elements of the city and these are located in the Downtown Zone, which is the historic part of the city, formed around five important landmarks, which are very near to each other: Pilar Square, Main Square, San Pedro Church, Council and the Cathedral.
Taking into account this circumstance, and in relation to the cultural space, we propose the following hypothesis:
Hypothesis 1a. Schools located in Zone 1 will have a high ratio of preference towards the Cultural heritage because of its relationship of proximity.
3.2.2. Spatial Distribution of Sporting and Recreational Facilities of Ciudad Real
Sports activities are becoming more important in our personal life, and therefore, there is a high demand for sporting facilities in our society, as they contribute to public health improvement and social wellbeing, providing a better lifestyle.
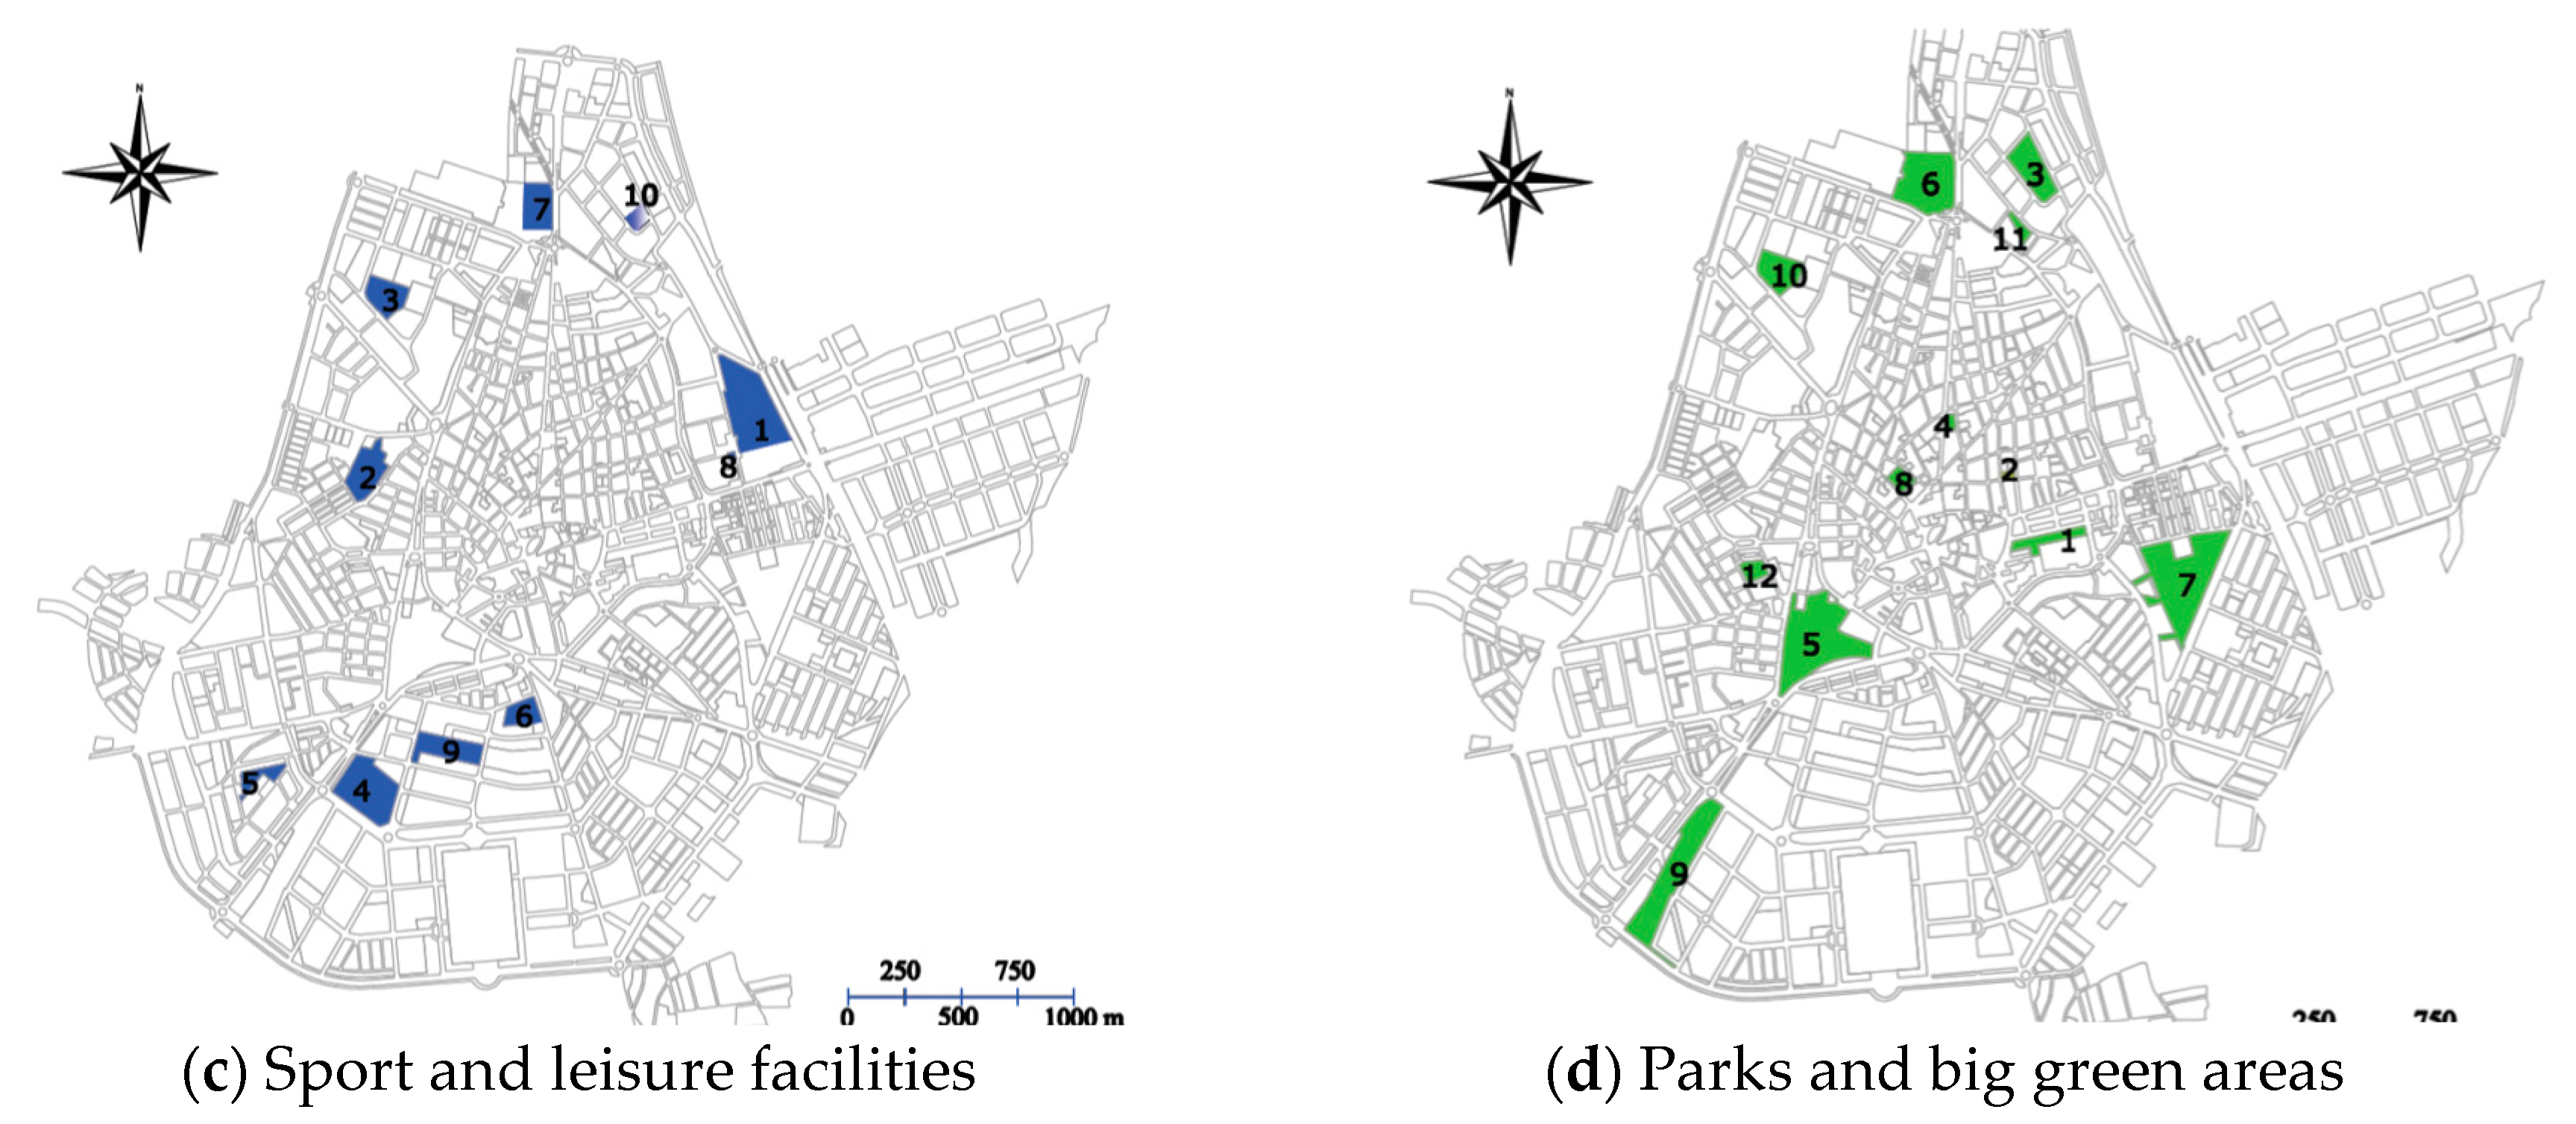
This activity needs equipment with certain characteristics, which not only makes the different administrations build them, but also allow a shared use of these services, incrementing number, saving on construction and maintenance, and gaining profitability. The sporting facilities of Ciudad Real (
Figure 2b) are located mainly outside the ring road, because of the vast amount of space needed.
Currently, there is a high demand for these types of facilities, looking for a greater timetable flexibility and more specialized facilities, so some private facilities have emerged in near municipalities. Many of Ciudad Real’s inhabitants travel to the private sporting clubs (such as Club de Campo, or the one located in the close town Poblete) searching for these advantages. It seems paradoxical that the inhabitants of the capital city have to travel to smaller towns and villages to exercise because the former lacks the necessary facilities, and that is without taking into account the handicap that these clubs are private, and using them costs money, conditioning their use.
Taking into account this circumstance and in relation to the cultural space, we propose the following hypothesis:
Hypothesis 1b. Schools located in Zone 2 and 3 will have a positive relationship of preference with the services heritage due to their proximity relationship.
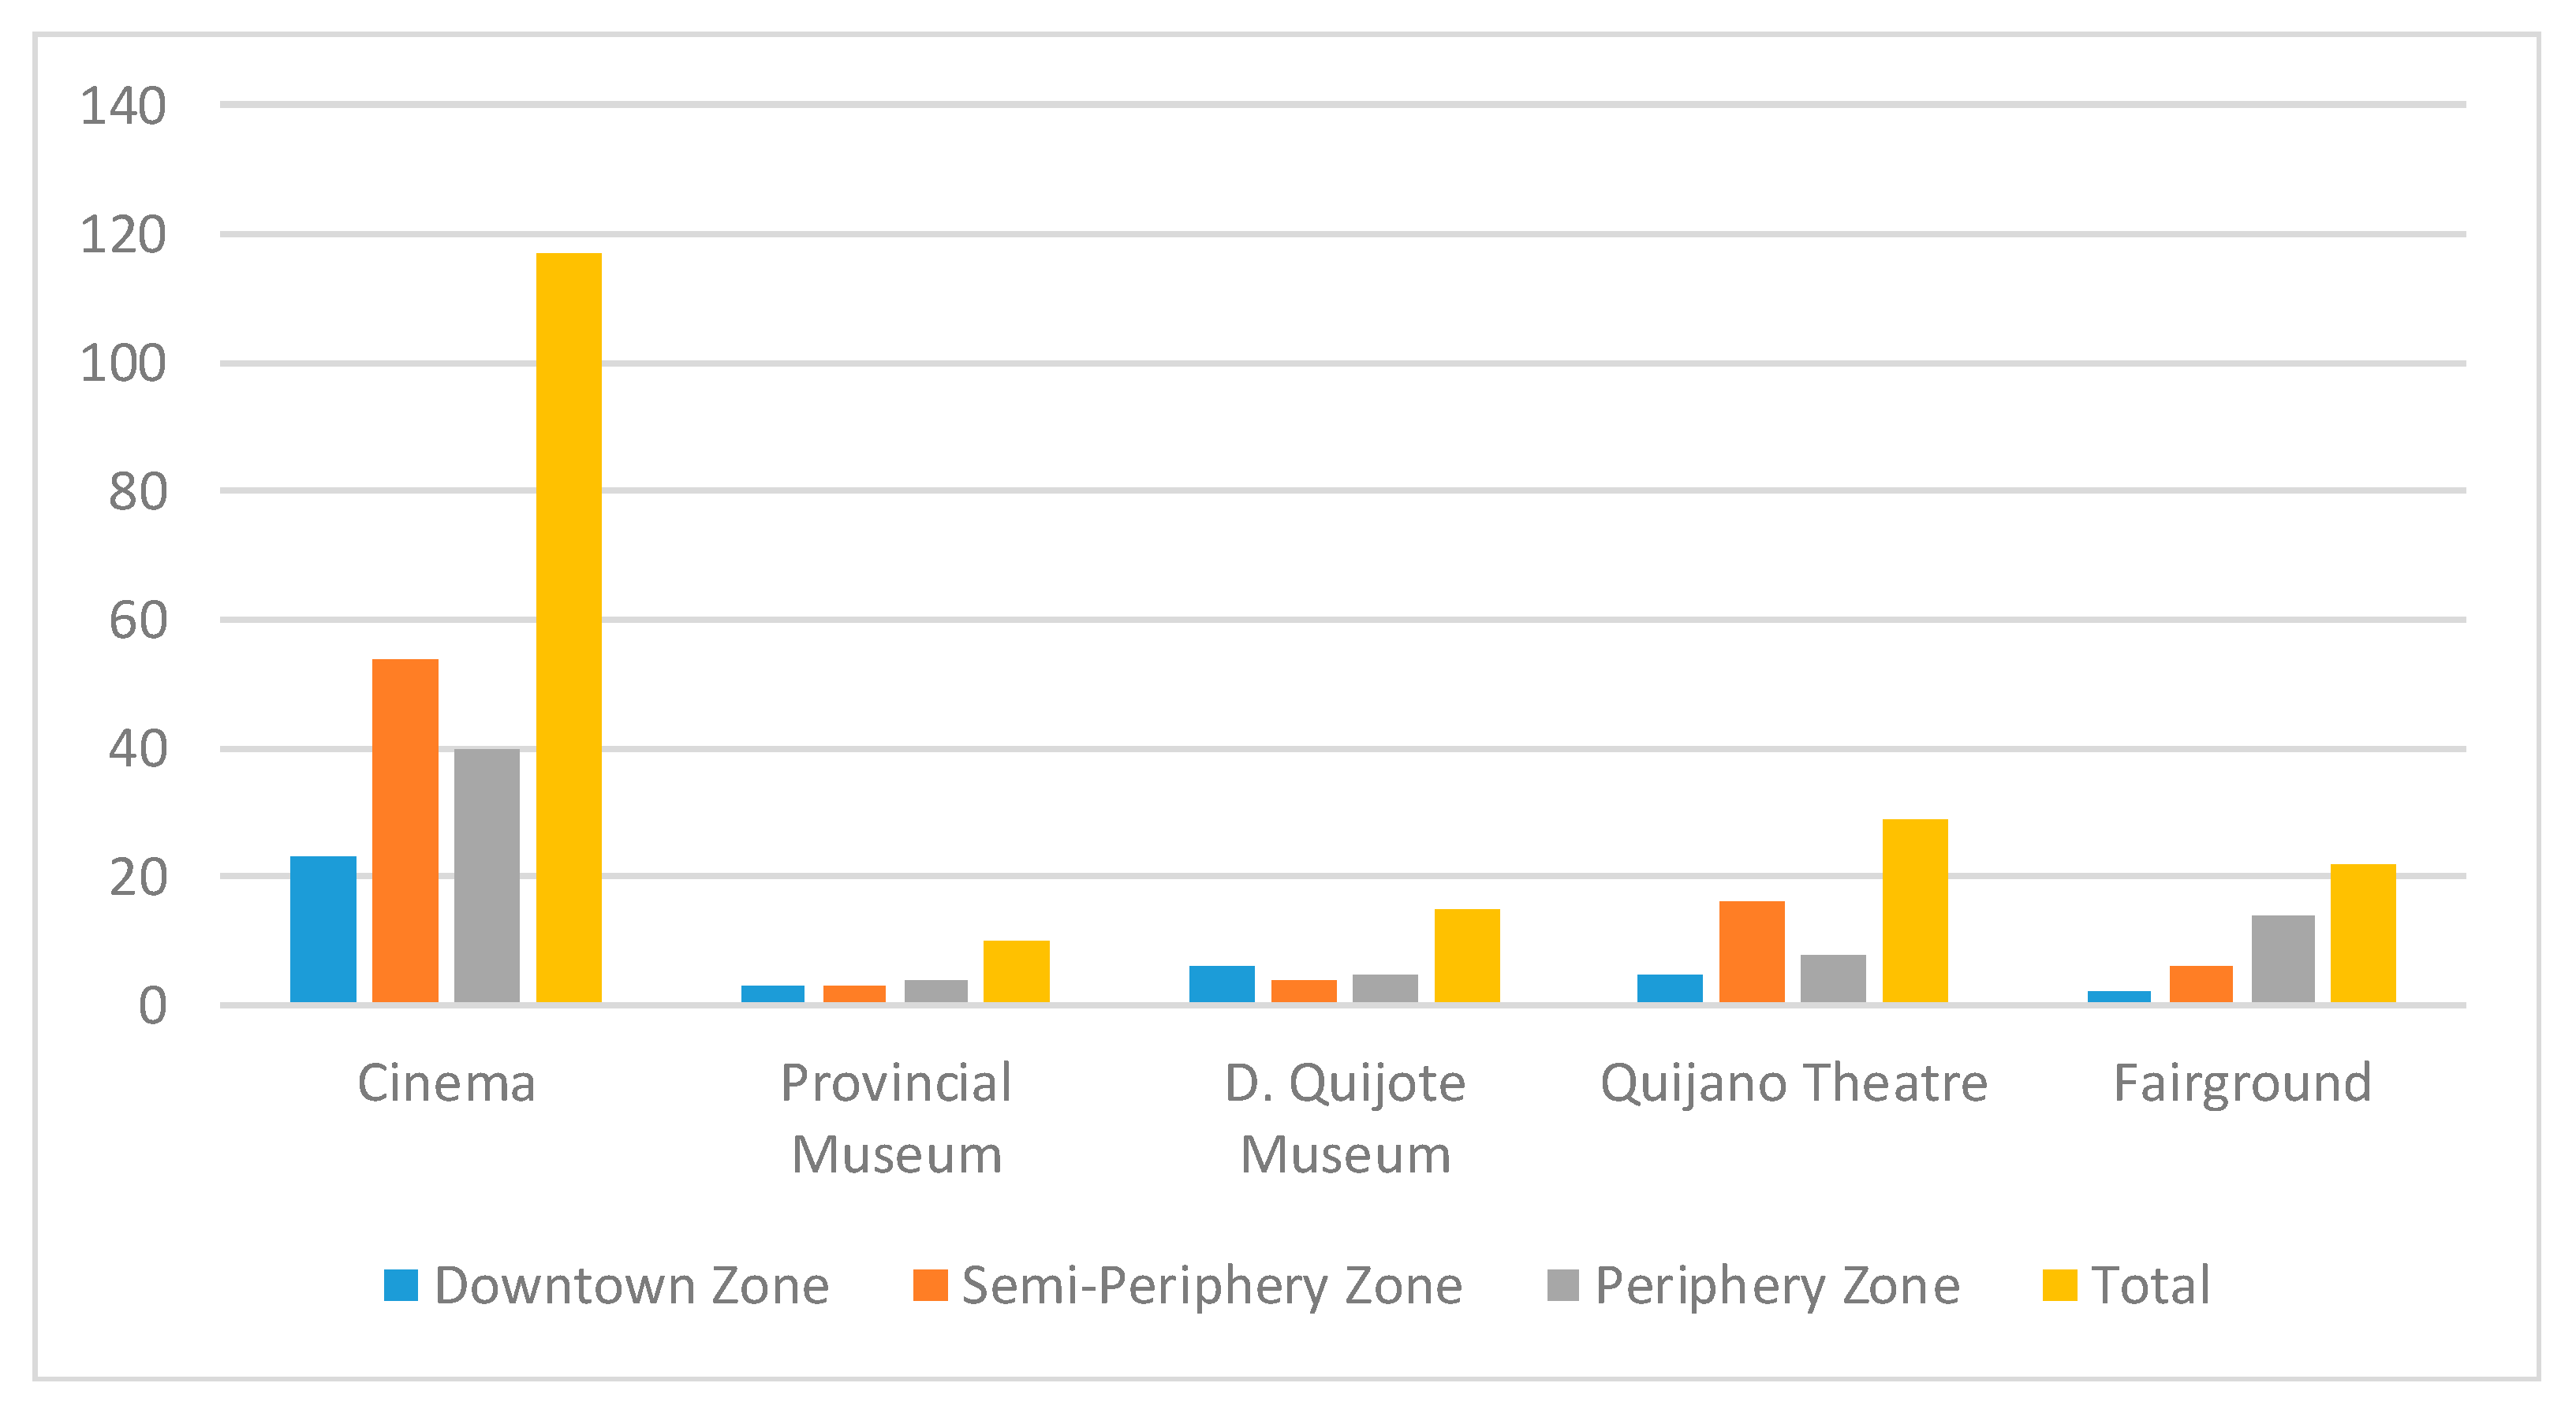
3.2.3. Spatial Distribution of the City Services’ Facilities in Ciudad Real
In the present-day society, culture has gone from being considered as a minor phenomenon, to a population right. Hence the need to satisfy society’s increasing cultural demand, which generally requires specific facilities as well as corresponding activities.
A big part of Ciudad Real’s city services’ heritage facilities is located in the Downtown Zone, except for the libraries—both the Public State Library with the local neighborhood libraries, and the Municipal Library, which still hasn’t been unveiled—and the auditoriums—one in the Granja, and another one in the new Music School building—which are in the two periphery zones. The rest of cultural heritage elements consist of six museums, both public and private exhibition rooms, and are located in Downtown Zone (
Figure 2b).
Taking into account this circumstance and, in relation to the cultural space, we propose the following hypothesis:
Hypothesis 1c. Schools located in Zone 1 will have a positive relationship of preference with leisure heritage because of their proximity relationship.
3.2.4. Spatial Distribution of Green Areas in Ciudad Real
The green areas located in the interior of cities have gained, thanks to urbanization development and derived problems, great importance, similar to the rest of urban resources and equipment [
16] (p. 224).
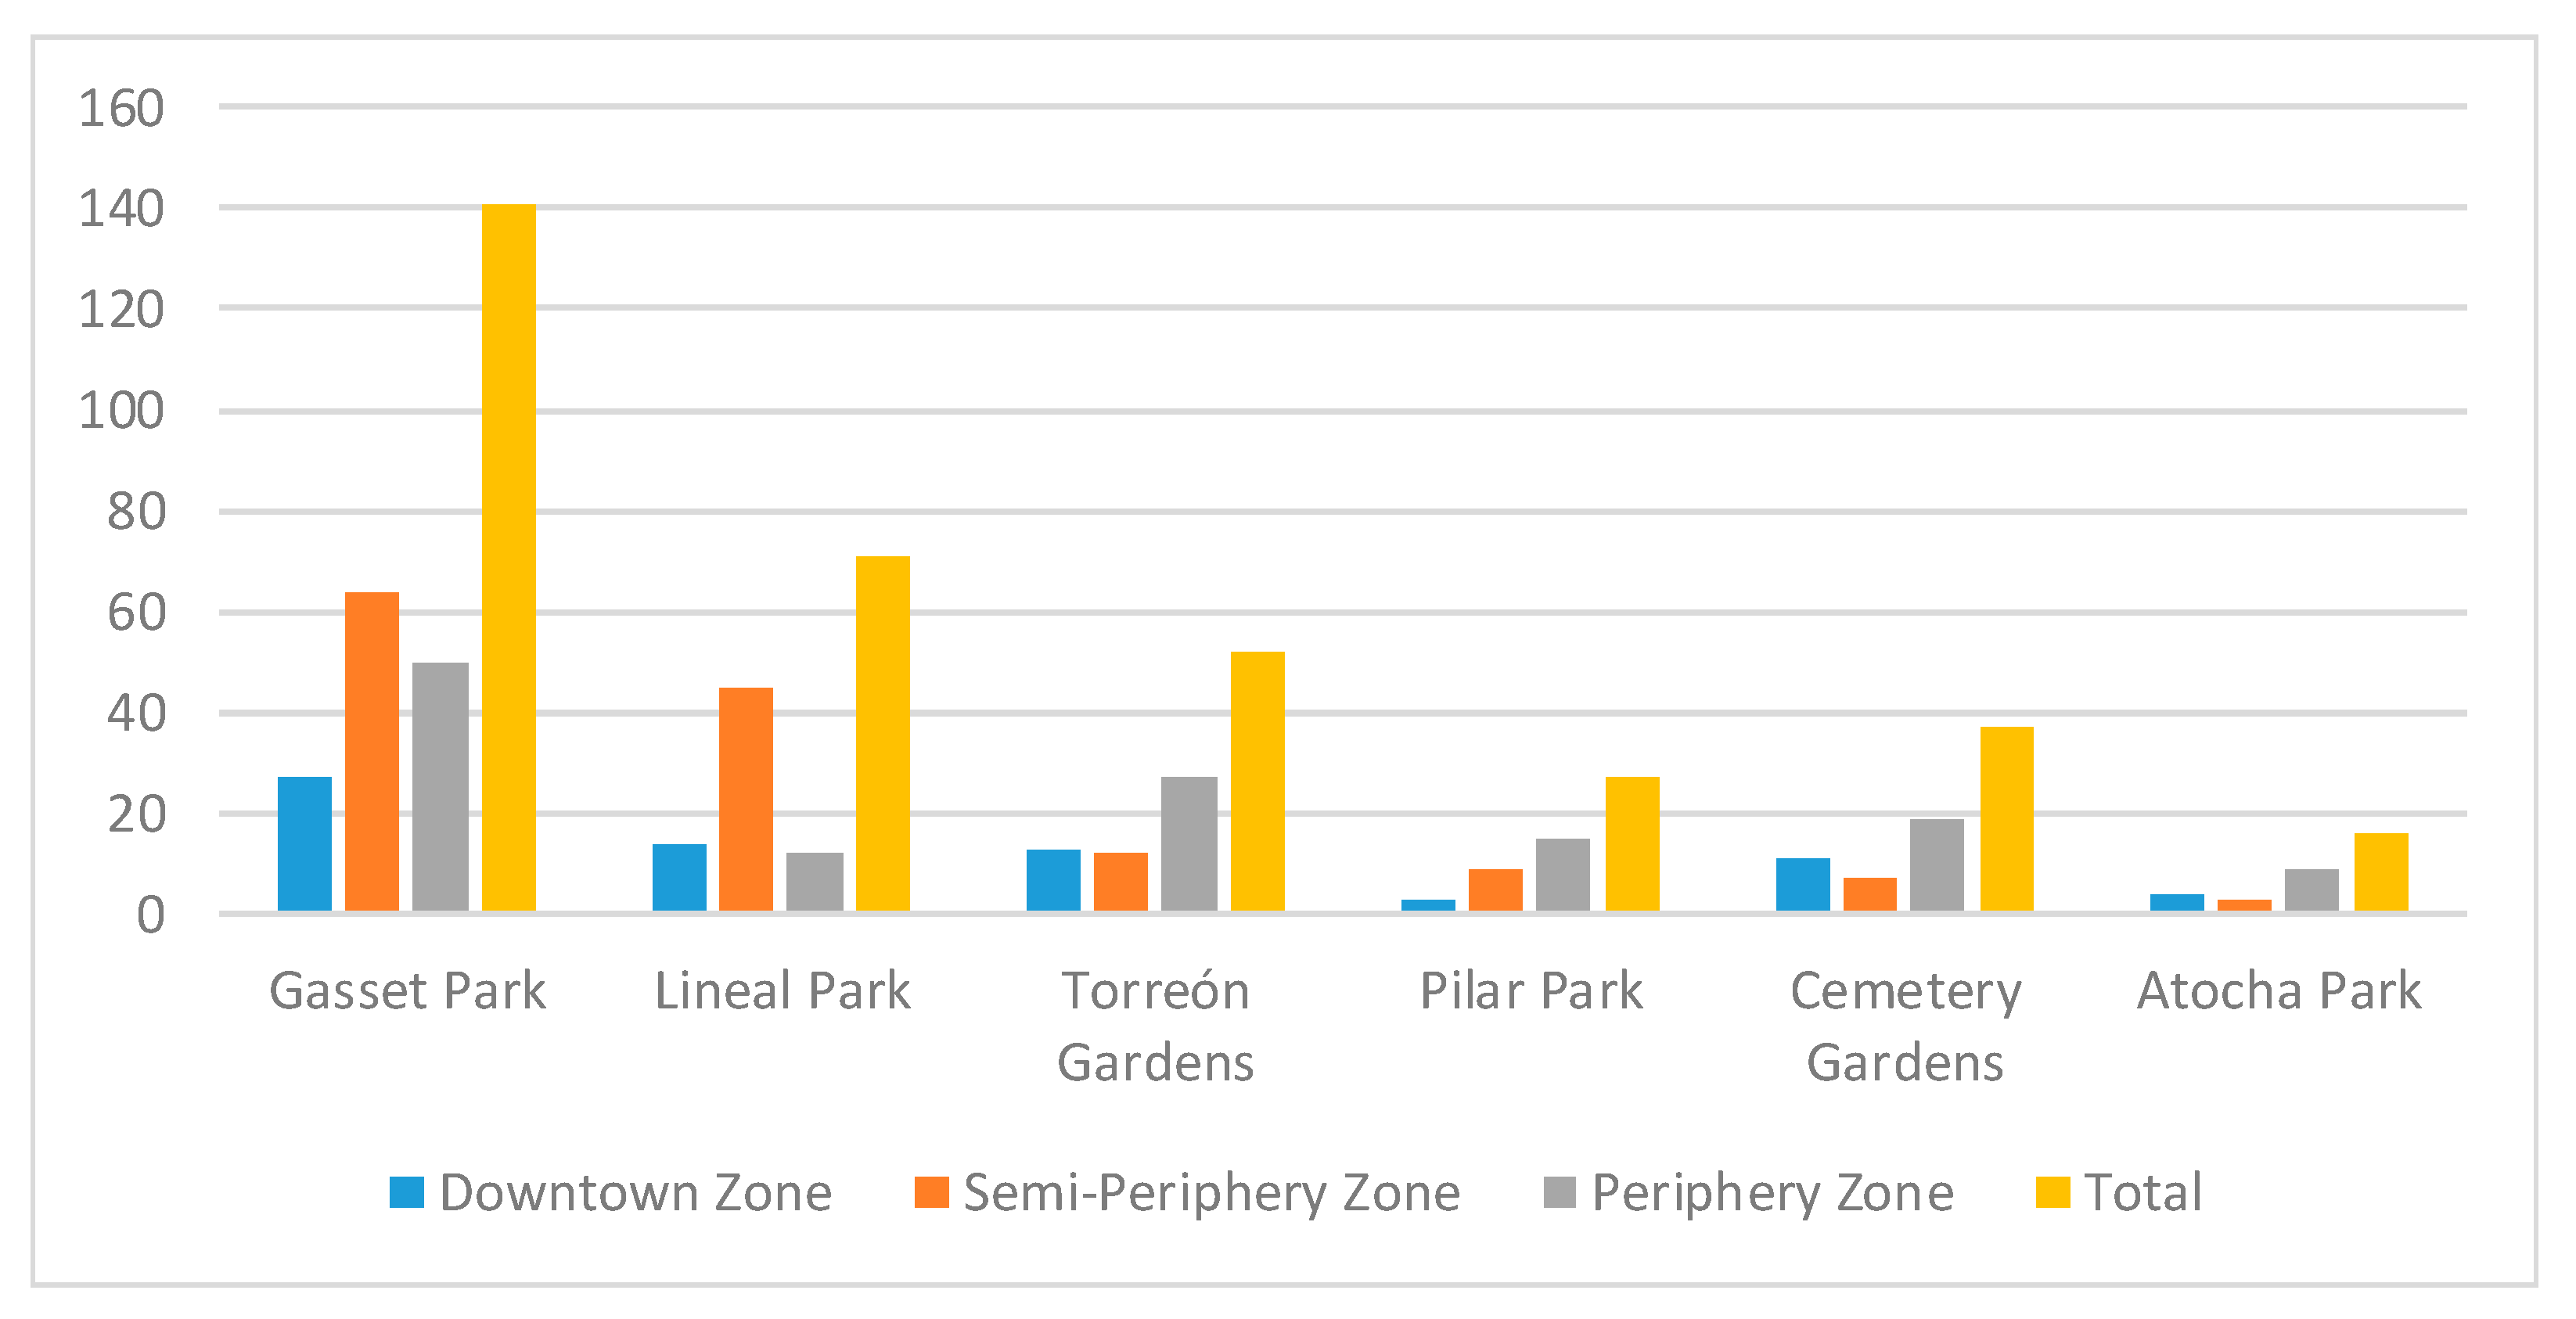
The size of these green areas in our city varies greatly. We encounter many small green areas, whose scope is restricted to the locals, and these are scattered around the different zones and are located around new constructions; and a few big ones, both in size and scope of population that use them, which are very present for the population.
The green areas inside the ring road of Ciudad Real are around 1.7 m2/inhabitant, facing 45.5 m2/inhabitant outside the ring roads. This difference is due to the great high density in the interior of the city, where 55% of the population live and with a density of 237.2 inhabitants/ha. The green area surface corresponding with the intra-ring road is 4% of the space.
The green areas inside the ring road are numerous and scattered around the whole urban area, most of them very small, as residential ground has made it practically impossible. Nevertheless, there are some spaces in squares and around churches that have been created and help to oxygenate these areas, not only referring to space, but also urban furniture (benches, rubbish bins and fountains).
The creation of gardens in squares has grown considerably, as has the urban furniture and infant parks. These improvements have had an effect on use, becoming, during sunny afternoons, genuine playgrounds full of children, elderly people and families going for a walk, contributing to a great dynamism in the zones where they are located.
The big green areas, located outside the Ring road due to the large surface needed, have also shown significant growth. In 1980, the city only had one true park, Gasset park, and nowadays it has over 11 (
Figure 2d) very big and well-equipped parks covering over 310.322 m
2. The spatial allocation of these parks was carried out until completing a parallel belt around the Ring road. In the mid 1990s, Ciudad Real had three big parks located near three of the city entries: Gasset Park for the south entry; Cemetery Park for the north entry, next to the Toledo Road; and Pilar Park around the entrance of the Valdepeñas Road. During the next decade, these parks have grown, creating an urban scheme with plenty of green areas, heavily demanded by the strong housing policy.
The proliferation of green areas has translated into not only the creation of new parks, but also, they have been built in other large vegetation areas among other constructions. This is the case of the University Campus, Tomelloso Street Pines, Fair Pavillion, Green Belt and Green Path, which add up to 192.580 m2 of the total surface of the urban core.
The new parks are fitted, generally, with sport areas which contribute to the use of these areas by young people. Night lighting of the pitches in Atocha Park make it a healthy alternative for leisure.
Taking into account this circumstance and in relation to the cultural space, we propose the following hypothesis:
Hypothesis 1d. Schools located in Zone 3 will have a favourable ratio of preference with the Natural Heritage due to its relationship of proximity.
As a summary for this section, we can state that the location of the cultural heritage facilities of the city are mainly located in Zone 1, whereas natural heritage is in Zone 2 and sport, leisure and services heritage are in Zone 3, and the proximity to schools will influence their preference.
4. Research Design and Sources
Among the different existing data collection methods, a paper-based survey and an on-line survey have been chosen. As [
17] claimed, this data collection method suits this investigation quite well, as it includes a defined sample with no reasons to think that there could be problems with the validity of the information that it provides (for example with a telephone or postal survey).
Likewise, regarding item measurement, validated scales have been used, and adapted to the context of this investigation. Aforementioned scales are easy to use and the interviewees usually understand how to answer the questions without difficulty [
18].
The making of the survey revolved around two blocks. Before starting the questionnaire, there were some demographic variables included related to the participants that could interfere with the existing relations between variables, with general matters based on personal information of the interviewees such as sex, course or education center they belong to.
The first block asks the survey respondents about their knowledge of the different spaces of the city of Ciudad Real. The second block asks them about which areas they prefer, with a maximum of five. Both blocks are divided into four distinguished sections; cultural heritage, natural heritage, leisure and services.
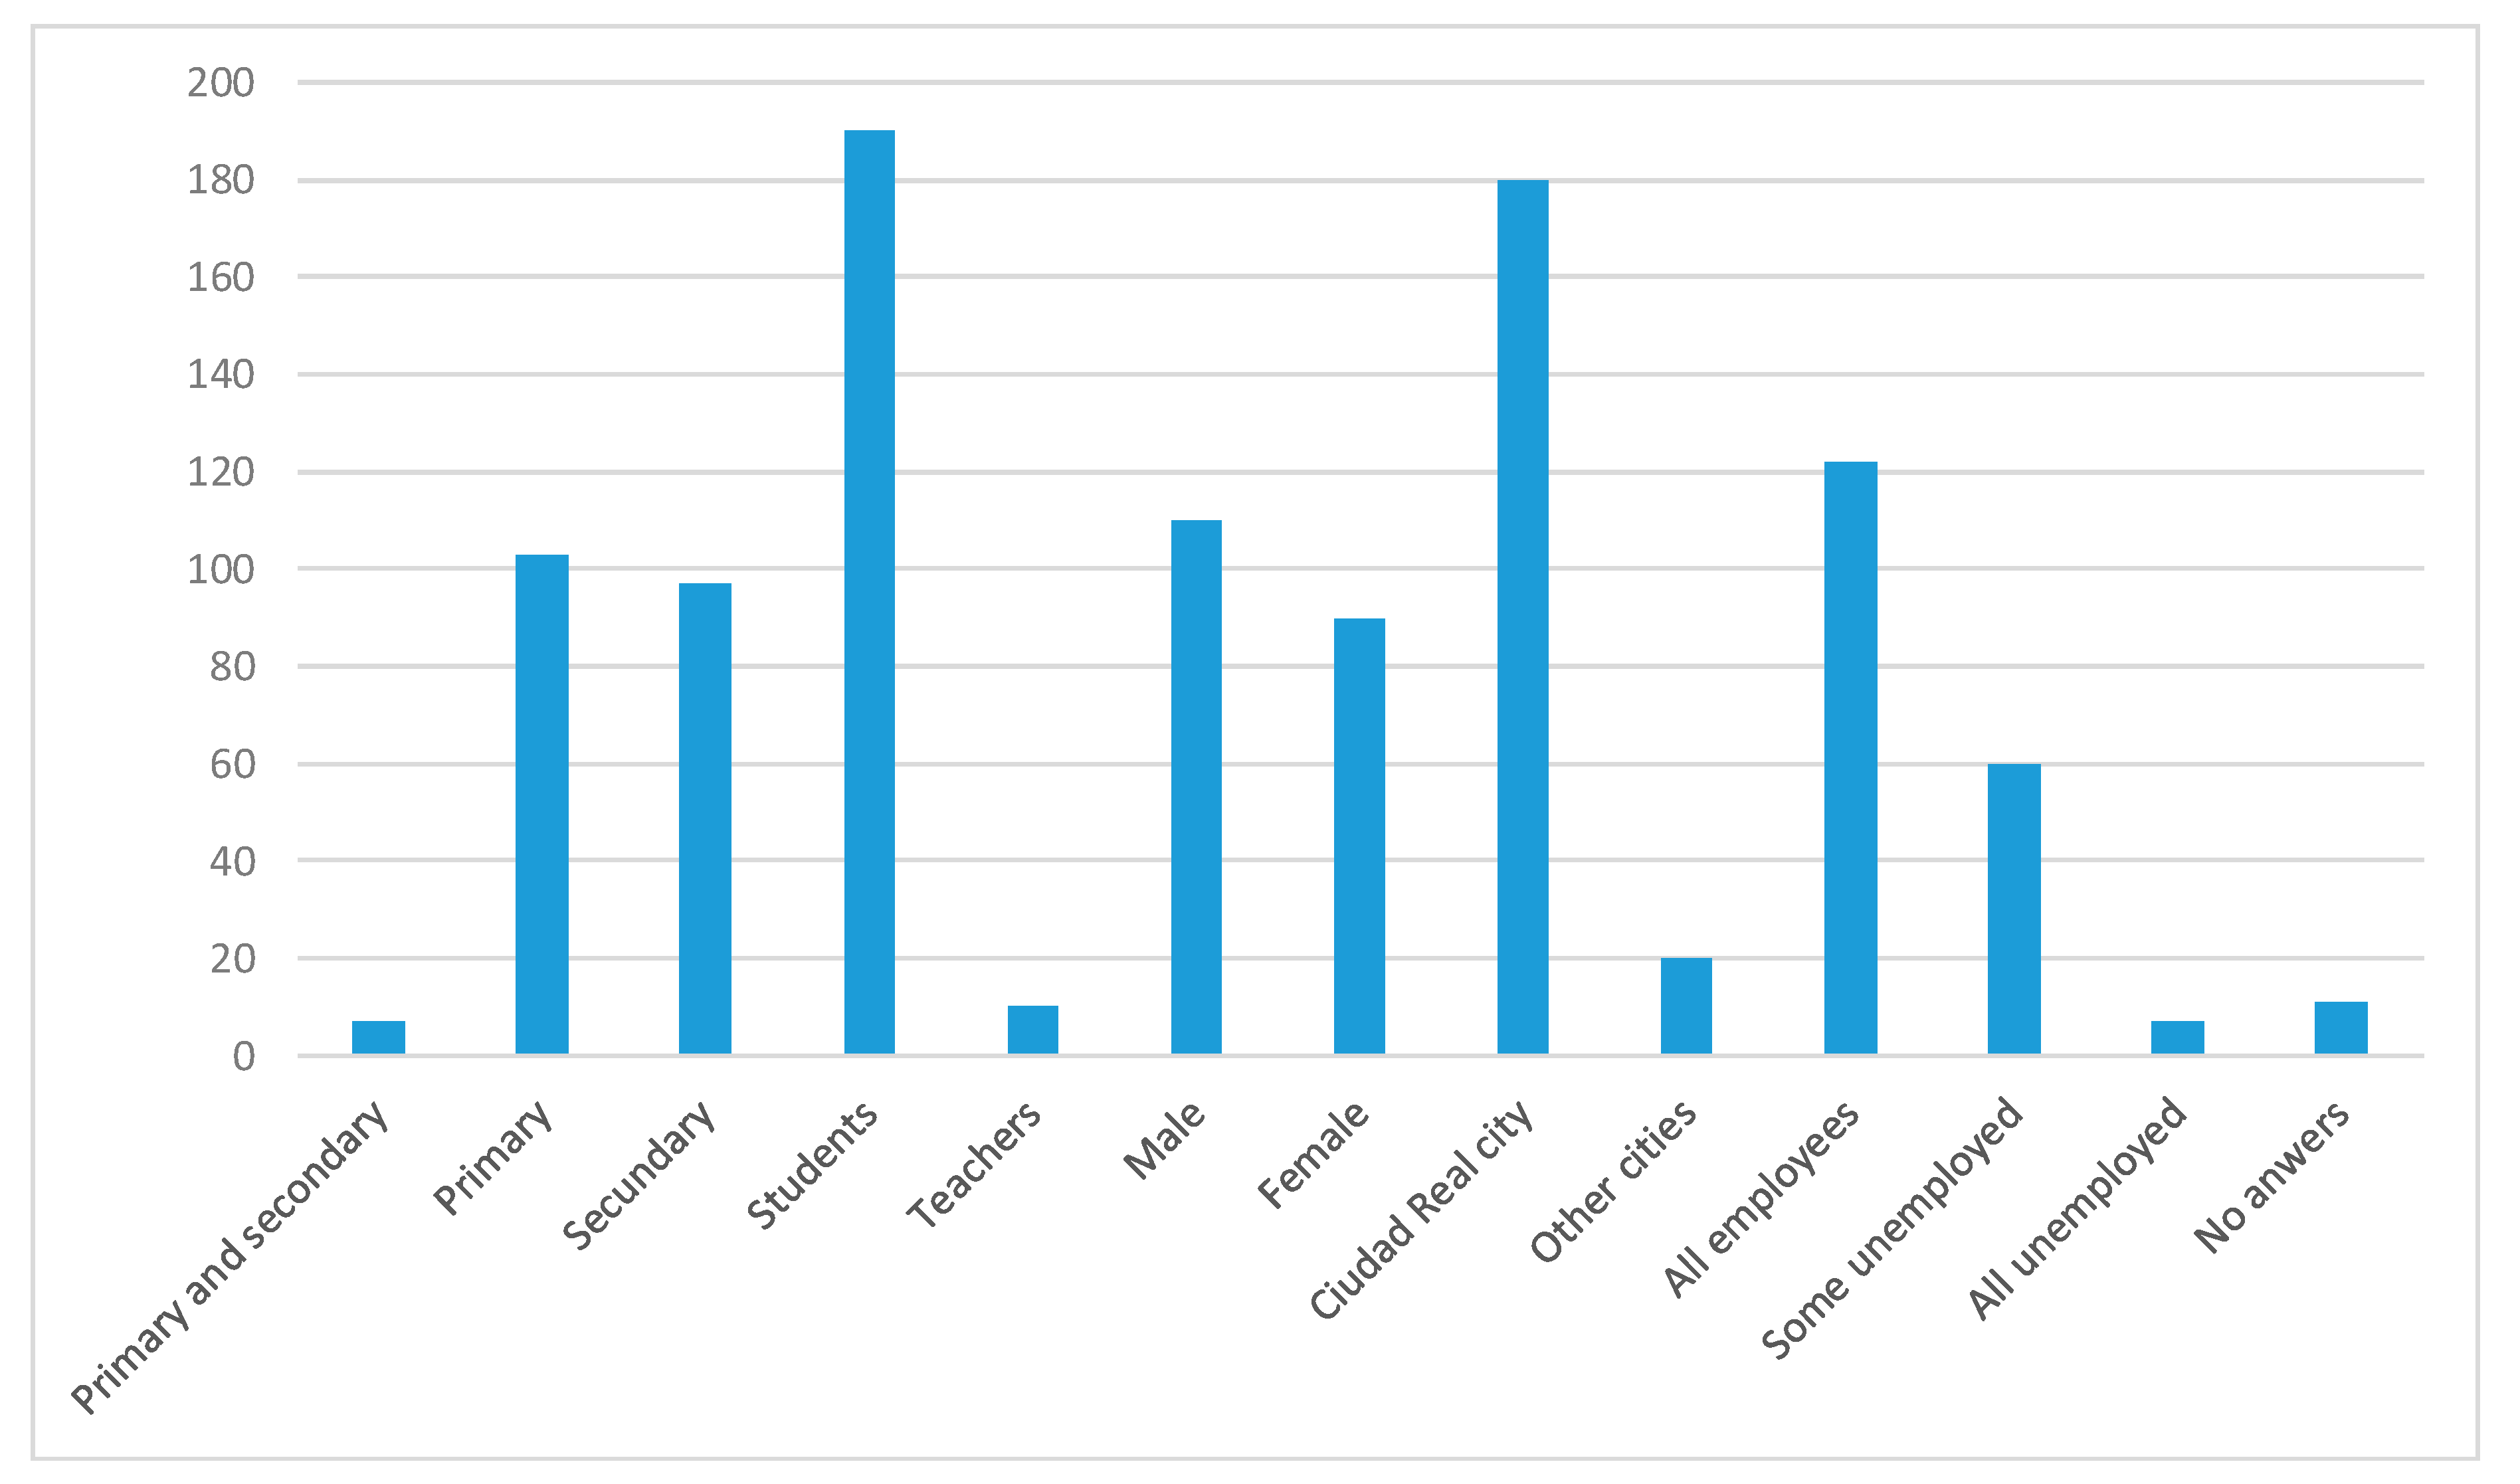
The survey was carried out in seven schools, with a total of 200 survey respondents, from which 190 were primary and secondary students, and the other 10 teachers. 97 participants belonged to secondary education and 103 to primary education. Of the total, 90 were female gender and 110 male gender. In relation to the place of residence, 180 live in the city of Ciudad Real, whereas 20 do so in other cities. Regarding family member labor activity, seven answered that none of their family members had a job, 60 replied that some of their family members were unemployed, 122 that all of their family members are employed, and 11 blank answers.
The utilized information belongs to the secondary data provided by the National Statistical Institute (INE
https://www.ine.es/), which has micro-scale data about the spatial location of the different state educational facilities, from basic primary education levels to secondary. The original urban map was supplied by the local Municipal Planning Service.
The educational centers have been georeferenced through the ArcGis 10.03 program.
For statistical analysis of the results, the statistical program SPSS version 24.0 has been used, as indicated above, in order to obtain results related to the relevant descriptions (frequency and percentage), and the relationships between variables and zones through the application cross tables statistics. The methodology applied in this study could be applied to any city, region or country.
In this sense, we point out that the interpretation of the models took into account: The number of variables that compose them, the order in which they appear, and the proportion of the explanation provided by each. These are details that are not usually specified but, in our opinion, are essential for a complete understanding of the results. The descriptive results of the investigation can be summarized in the
Figure 3.
5. Results
For the data analysis, a statistical program called SPSS (version 24.0) has been used, in order to obtain the corresponding descriptive results (mean, mode, median and standard deviation) and the correlations between the variables through the use of cross tables. The descriptive results of the research can be summarized in the
Figure 3 and
Table A2:
Before presenting the statistical analysis, we consider it necessary to keep in mind the linear correlations between the variables. In this sense, we point out that in the model interpretation the following things were not taken into account: The number of variables that form them, the order they appear in, and the explanation proportion accompanying each one. These details are normally not specified but, in our opinion, are vital to the overall comprehension of the results.
5.1. Correlation Results Between Different Zones andCcultural Heritage
The results regarding a significant relation between variables show that there is a positive correlation (
p = 0.1) (
P = level of significance, and can be significant at the 0.01 level and at the 0.05 level. The smaller this value, the greater degree of significance there is. The level of significance of a statistical test is a statistical concept associated with the verification of a hypothesis.) between the Main Square (Zone 1) and the survey respondents belonging to Zone 3. However, there is a significant negative correlation (
p = 0.01) between the Toledo Door (Zone 2) and the survey respondents pertaining to Zone 2 (
Table 2).
There is a significant preference between Zone 3 (participants) and Zone 3, that is, those subjects that are further away from the Main Square in the Downtown Zone show a greater preference. Nevertheless, for the participants that are closer (Zone 2), although their education centre is in a different zone, they have the opposite relationship, meaning, higher proximity does not make it a preference, at least based on this data.
5.2. Correlation Results Between Different Zones and Natural Heritage
In relation to the natural heritage (
Table 3), the results reflect a significant correlation (
p = 0.01) between the Green Path (Zone 3) and Zone 1 (
r = 0.002) (
r = indicates the level of correlation of Pearson. Pearson r correlation coefficient is measured on a scale of 0 to 1, both in the positive and negative direction. A value of “0” indicates that there is no linear relationship between the variables. A value of “1” or “−1” indicates, respectively, a perfect negative or perfect positive correlation between two variables.), which is positive, meaning there is a relation between the preferences of Zone 1 participants and the Green Path. Nevertheless, there is a negative (
r = 0.000) significant relation between Zone 3 participants and the Green Path, which could mean that by being in the same zone, the preference is inverse.
There is also a significant correlation (p = 0.05) between the Torreón Gardens (Zone 2) and the Zone 3 (periphery) participants, indicating once again a preference for places that are far from their convergence area.
5.3. Correlation Results Between Different Zones and Leisure Heritage
When it comes to leisure heritage (
Table 4), there is a significant correlation (
p = 0.01;
r = 0.000) between the Theatre (Zone 1) and the participants of Zone 2. Further, the Fairground (Zone 3) found a significant relation (
p = 0.01;
r = 0.008) with the Zone 3 participants.
5.4. Correlation Results Between Different Zones and Services Heritage
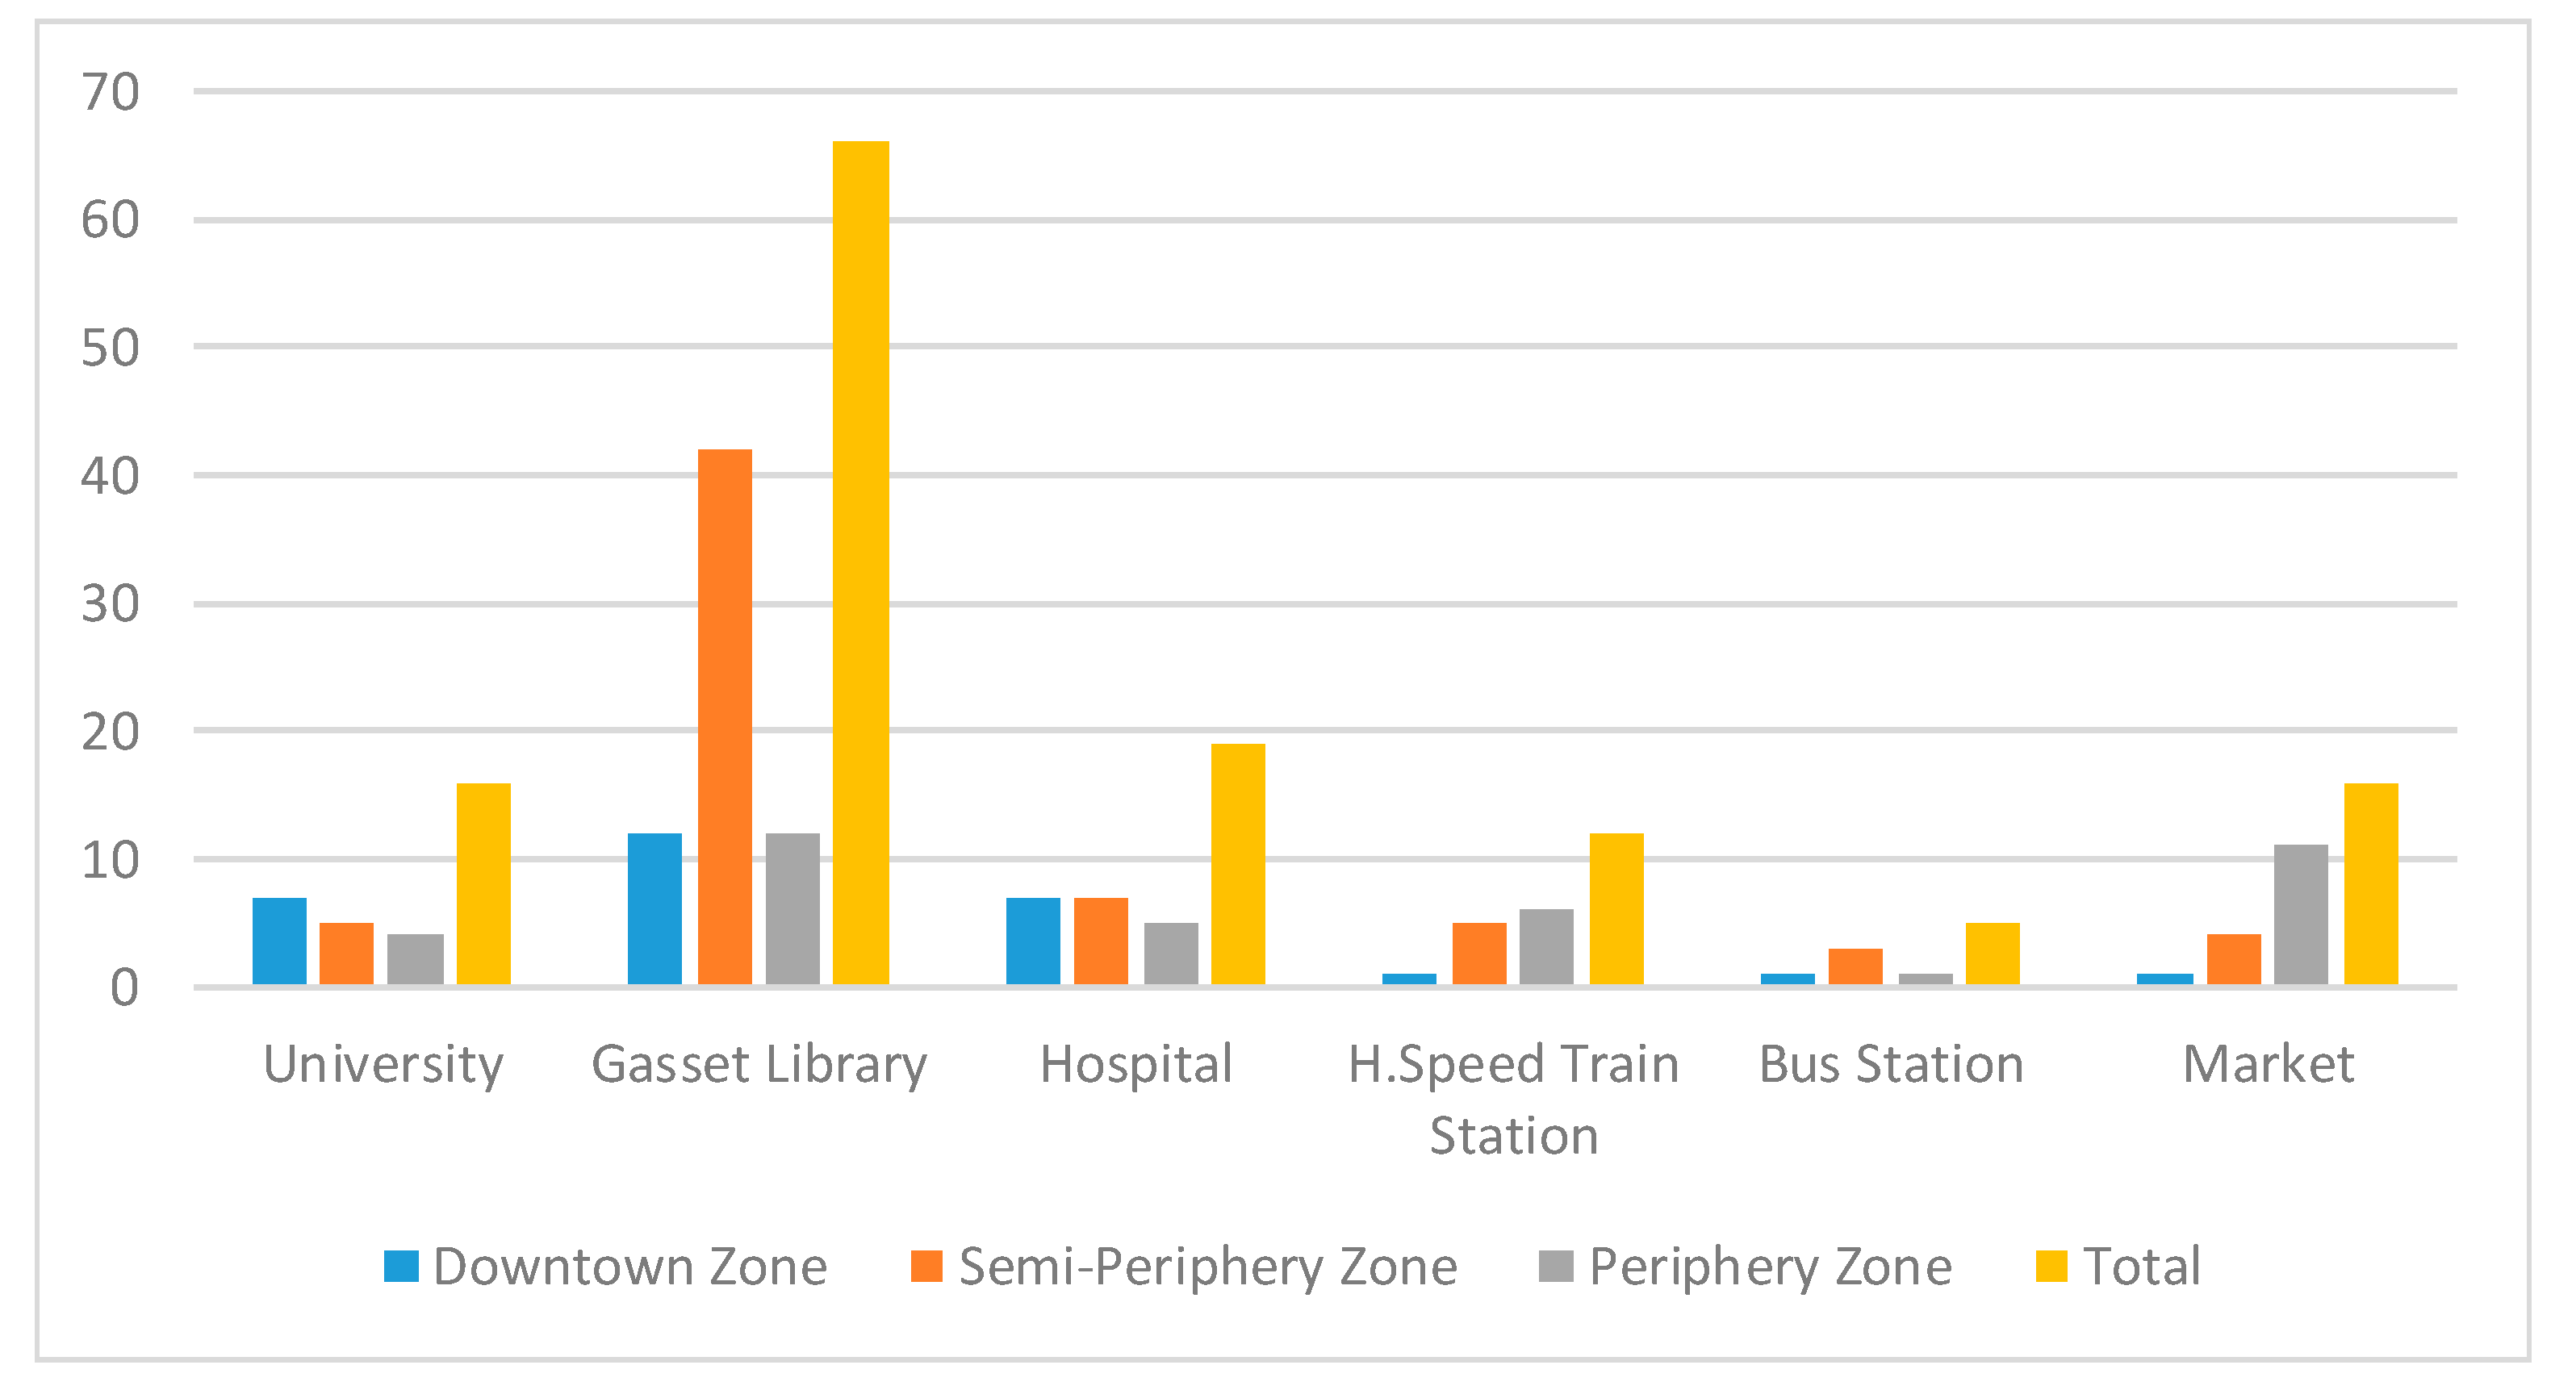
The relationship between the different zones and the services heritage (
Table 5) proves to be a positive significant correlation (
p = 0.01;
r = 0.002) between Gasset Park Library (Zone 1) and the participants from Zone 1, although there is a negative correlation between this space (
p = 0.01;
r = 0.000) and the survey respondents of Zone 3, which means, that the further from the zone of the participants, these will show less preference for the space.
5.5. Correlation Results Between Different Zones and Total Amount of Zone Heritage
The results of the crosstabs (
Table 6) between the zones where participants converge and the established heritages, show a significant correlation (
p = 0.01;
r = 0.003) between service heritage and Zone 3, proving that the participants of said zone tend to have little preference for the heritage related to city services.
6. Discussion
In view of the results of the total amounts from the cross-table area heritage, and the related assumptions, it can be stated that:
- -
H1a = stated that schools located in Zone 1 will have a high ratio of preference towards cultural heritage because of its proximity; this relationship should be rejected since there is no significant correlation between the area and the space indicated.
- -
Acceptance of the H1b = schools located in Zone 2 and 3 will have a positive relationship of preference with services heritage due to their proximity relationship, because there is a significant correlation between the areas mentioned in the hypothesis. It should be noted that Zone 3 has a negative relationship between services heritage and its location.
- -
Rejection of H1c = schools located in Zone 1 will have a positive relationship of preference with the leisure heritage due its proximity relationship; there was significant relationship between the area and exposed heritage is found.
- -
Rejection of H1d = schools located in Zone 3 will have a favorable ratio of preference with the natural heritage due to its relationship of proximity; there was no relationship, at the level of significance, between both variables.
In light of the results, the possibility could be assessed that the analysis of the center as the main axis for the knowledge of the local heritage could interfere with the preferences of patterns. The results will be more satisfactory if the heritage was related by the neighborhood or the location of the dwellings of the participating subjects, being one of the variants for future research. However, it should be generalized to any city that foresees a distribution by zones and identifies the different heritages and may be able to relate the variables worked in this analysis, as mentioned above, to the location area of the study center and/or dwelling, not based on the fact that the center will be close or in the same area as the dwelling.
7. Conclusions
The possibility of identifying preference patterns related to the local heritage in medium-sized cities, exemplified by Ciudad Real, is difficult to predict following the analysis of information obtained from the participants in this study, however, we can infer some interesting results that show a degree of statistical significance which allows us to make the following statements:
- -
Those survey respondents which study in a given zone, tend to choose cultural heritage constructions that are not in that same zone, or in other words, a higher proximity to this heritage, makes its preference further from it.
- -
Natural heritage is also inversely represented when it comes to significance, that is, preference is positioned in those natural spaces that are distant from the zone where the school is located.
- -
Regarding leisure, even it tends to follow the same path as the aforementioned, there is a significant difference, since the heritage from Zone 3 (periphery), represented by the fairground, was chosen by the participants from the same zone. Furthermore, the library (Zone 1), belonging to city services’ heritage, establishes a significant relation with the participants from the same zone, being in inverse relation with the members of Zone 3.
From the analysis of the results from this study, we can come to the conclusion that preference over city heritage cannot be predicted based on the proximity of the participant’s school, as this is not a decisive element according to the analyzed sample.
However, this study is of great interest to local authorities since they allow you to establish strategies that seek a better understanding of all the heritages of the city based on a source of ignorance. This study, in turn, is a pioneer in terms of the object of study, since no similar studies have been found that would allow us to make relevant comparisons, and it opens the door to interest in knowledge of the local heritage from the perspective of schoolchildren by allowing local authorities to promote cultural spaces, natural, leisure or services that may be less valued or simply unknown. In this type of study, local institutions can find references to improving the use and dissemination of heritage, regardless of the size, geographical location or age of the students.
In future lines of research, new variables that influence the preference of wealth and the socio-educational level of the centers could be included, such as the degree of unemployment found in the studied areas, or the academic level of the different teachers of the centers.
Another future line of research would be to use another type of statistical program to measure relationships, such as Amos or PLS, lately widely used to treat possible formative models.
Ultimately, from the analysis of the results of this study, we can conclude that preference over the heritage of the city cannot be predicted depending on the proximity of the participant’s school, as this is not a decisive element according to the sample analyzed. However, this study is of great interest to local authorities, as it allows them to set up strategies that seek a better understanding of all the city’s heritage based on a source of ignorance.

 ,
, 
