1. Introduction
With the acceleration of urbanization, human activities have changed land use and caused habitat loss [
1]. Fragmentation or loss of habitat has led to a continuous decline in the number of wildlife species [
2]. Biodiversity protection influenced by habitat change is currently attracting worldwide attention in response to the appeals of the New Urban Agenda and the UN 2030 Agenda for Sustainable Development. With the rapid development of China’s urban–rural integration, protecting biodiversity has become an important task and ecological corridor construction has been continuously proven to alleviate ecological fragmentation [
3,
4].
The urban ecological corridor is a concept in landscape ecology, referring to linear or banded landscape elements, common examples include roads, rivers and green belt systems [
5,
6]. From the perspective of spatial structure, it refers to the urban ecological network system constructed of intersecting corridors and ecological patches [
7]. These corridors make the spatial pattern of urban ecosystems holistic and internal. The ecological corridor can prevent soil erosion, improve carbon storage, and contribute to biodiversity conservation and ecosystem stability [
8,
9,
10].
Since the 1990s, many scholars in landscape ecology have attempted to construct ecological networks at different spatial scales. The least cost path model (LCP), namely the minimum cost model or the minimum path method, is a practical method used in landscape ecology to identify the most effective movement path [
11,
12]. In the LCP model, the source patches and cost surface (resistance surface) are the main factors used to determine the least cost path regarded as the ecological corridor with a great possibility. Source patches are those with positive net reproduction (i.e., births > deaths), which then are capable of exporting surplus individuals to nearby patches [
13,
14]. The cost surface reveals how cost factors facilitate or hinder movement when species migrate from one source patch to another; it is obtained by evaluating, weighting, and overlying cost factors [
15,
16].
Previous scholars mainly considered the area threshold or landscape pattern index for source selection, which was somewhat subjective [
12]. Currently, a few scholars have used the quantitative assessment of the value of ecological resources as the basis for their selection [
17,
18]. The Integrated Valuation of Environmental Services and Tradeoffs (InVEST) model is widely used to quantify ecosystem service functions [
19]. The quality of the habitat can be represented graphically by measuring the sensitivity and intensity of external threats [
19,
20]. Through the assessment of resources, the method of selecting patches with high habitat quality can be used as a complement to source selection for decision-makers.
Cost factor selection for quantifying cost surface has not yet achieved agreement in network construction [
6]. Except for land use types, several researchers have been searching for suitable cost factors. Miao et al. suggested that road networks are an essential manifestation of human interference [
16,
21,
22]. Geological hazards associated with slope and elevation affect the biological reproduction and selection of migration routes [
23]. Therefore, exploring the selection of cost factors is conducive to maximizing the function of network construction and minimizing economic costs [
17,
24].
In order to save the habitat in the existing matrix and explore the migration path of animals, the InVEST and LCP models were applied in the context of Wuhan to propose a network optimization strategy. We selected birds and small terrestrial mammals as the main research objects because of their good speed of movement and environmental adaptability. The primary purposes of our research are (1) to incorporate habitat quality into the source selection; (2) to explore what differences exist between the corridors of birds and small terrestrial mammals, and why are there these differences; (3) to propose an integrated network planning strategy for sustainable urban development.
2. Materials
2.1. Study Area
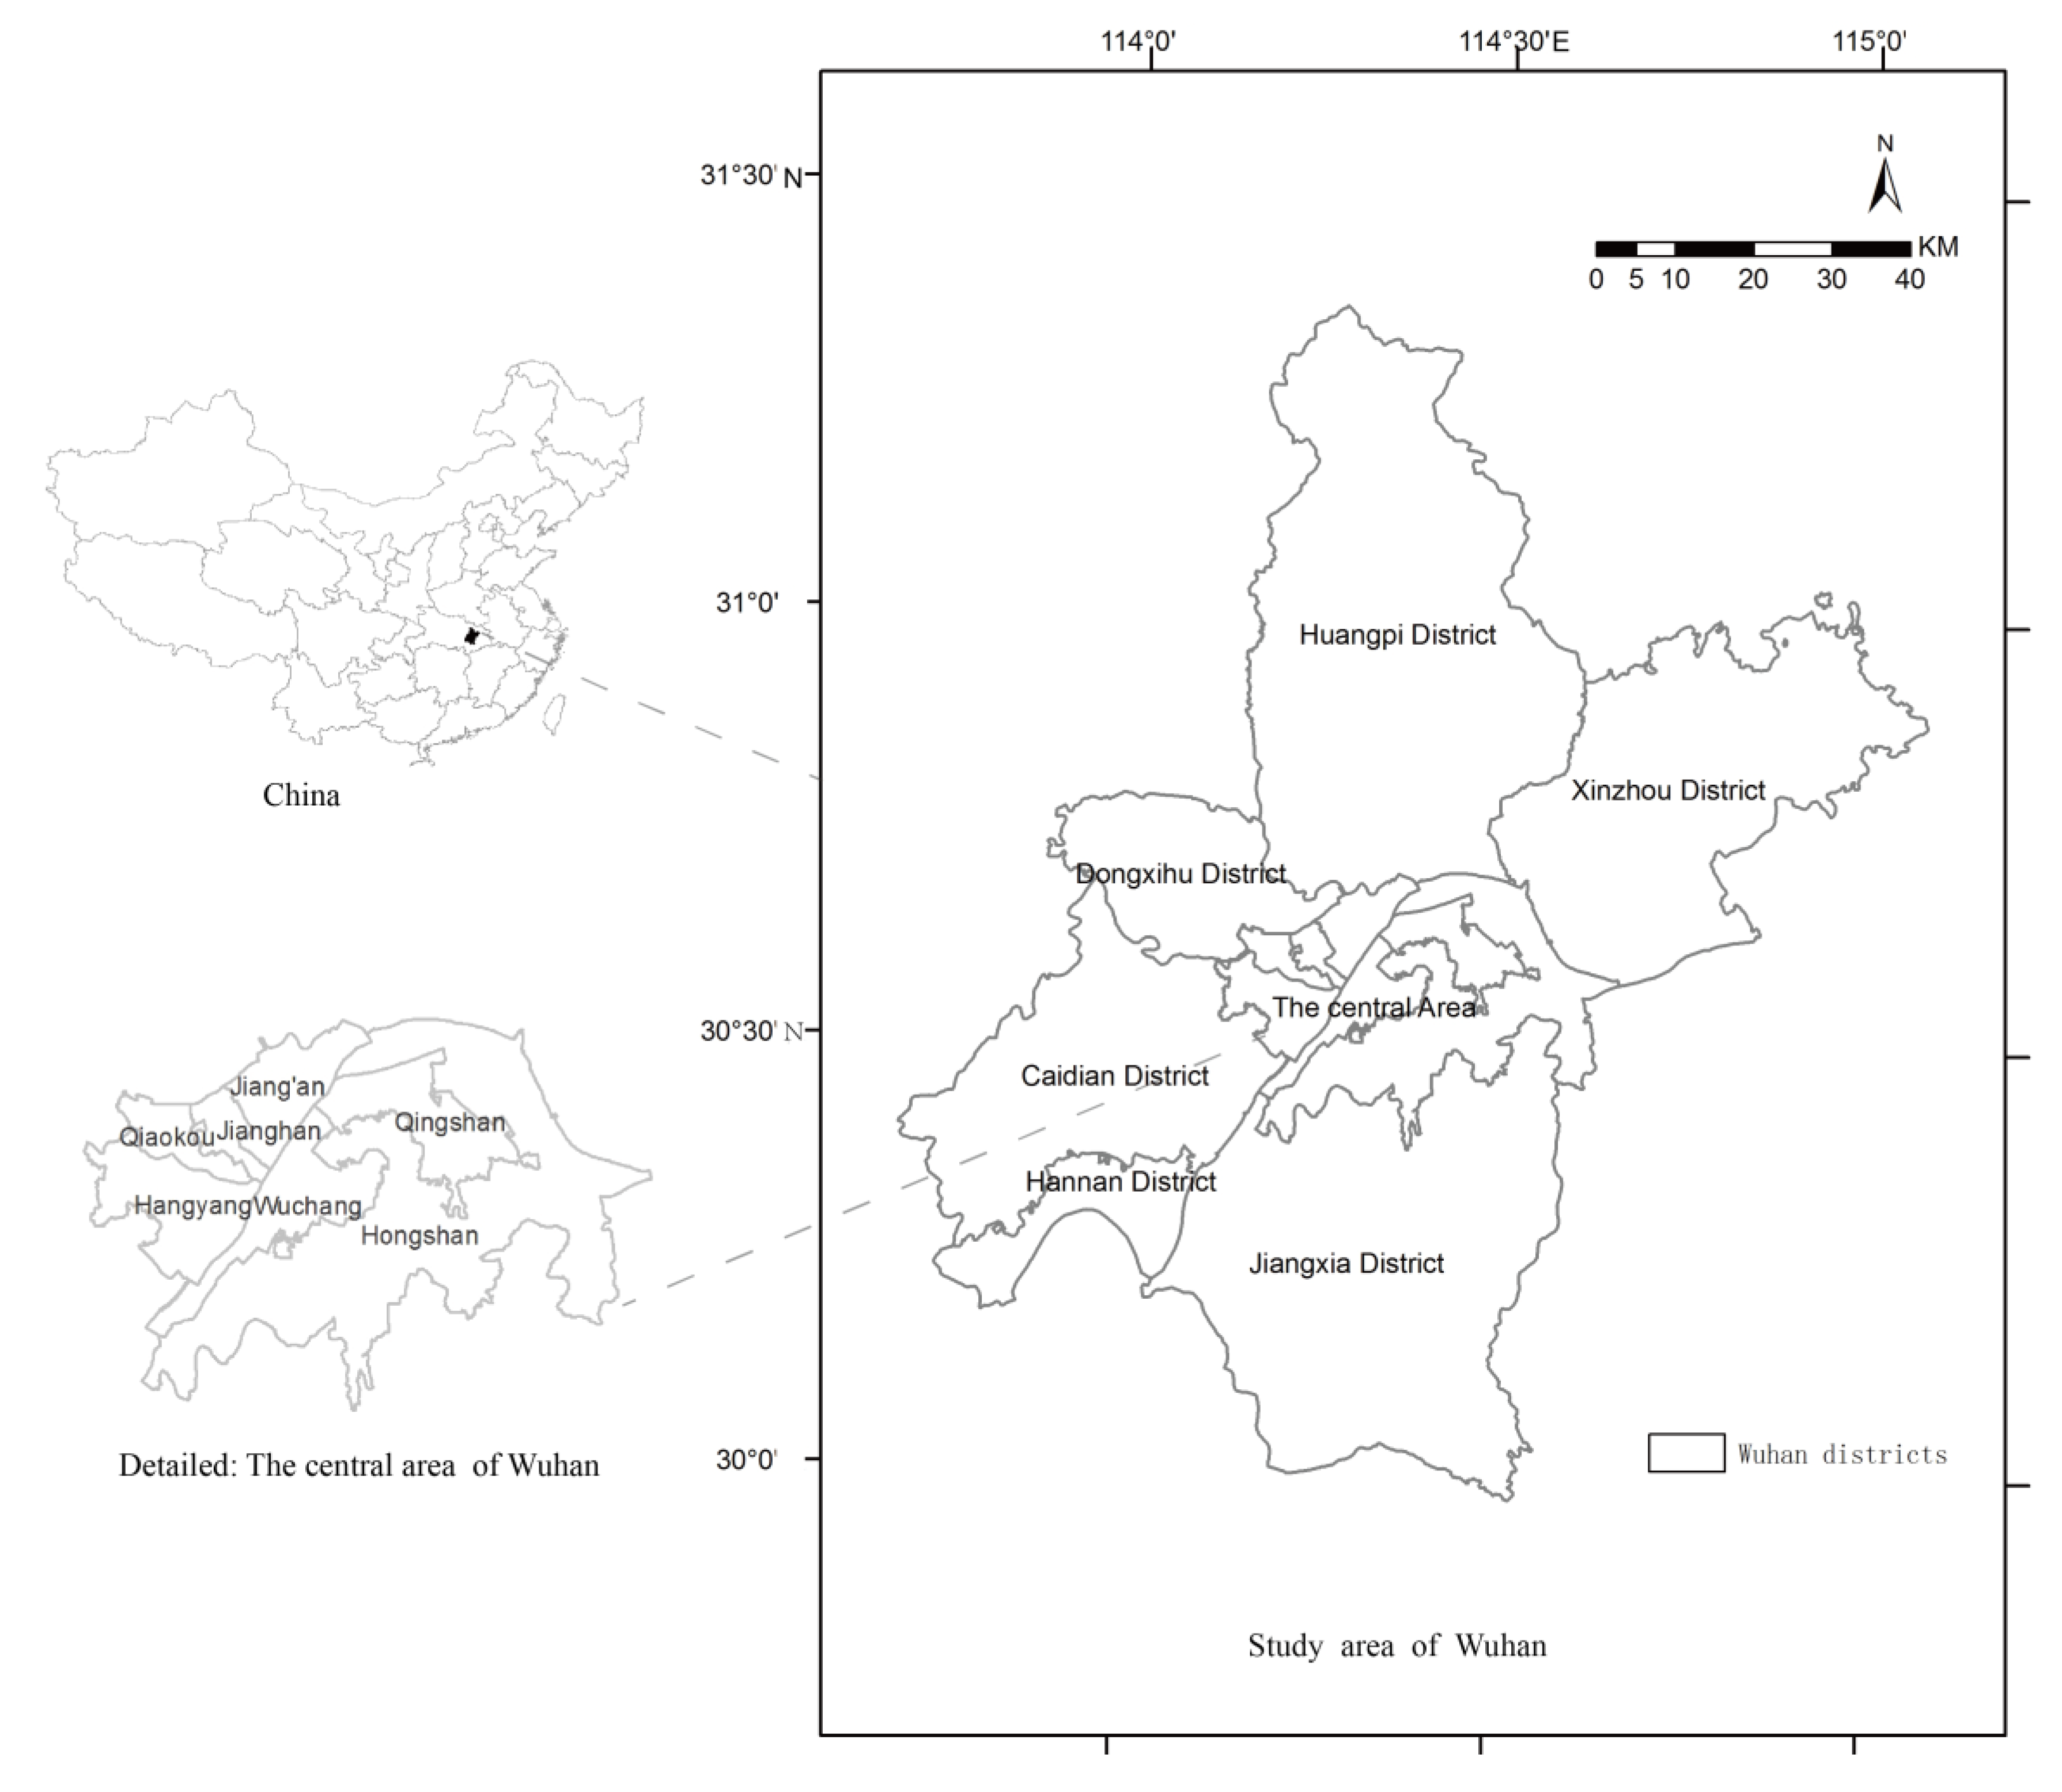
Wuhan is located in the middle reaches of the Yangtze River. As the provincial capital of Hubei Province, it serves as an important hub. With a vast population and an 80.2% urbanization rate, Wuhan covers 8569 km
2 and has 13 administrative districts. According to different development orientations and resource distribution, the city is divided into one central area and six suburban areas [
25]. The suburban areas include districts of Huangpi, Dongxihu, Caidian, Jiangxia, Hannan, and Xinzhou (
Figure 1). Wuhan is experiencing rapid urbanization due to the implementation of the “Rise of Central China” strategy; this has put pressure on Wuhan’s ecological landscape.
2.2. Data Processing
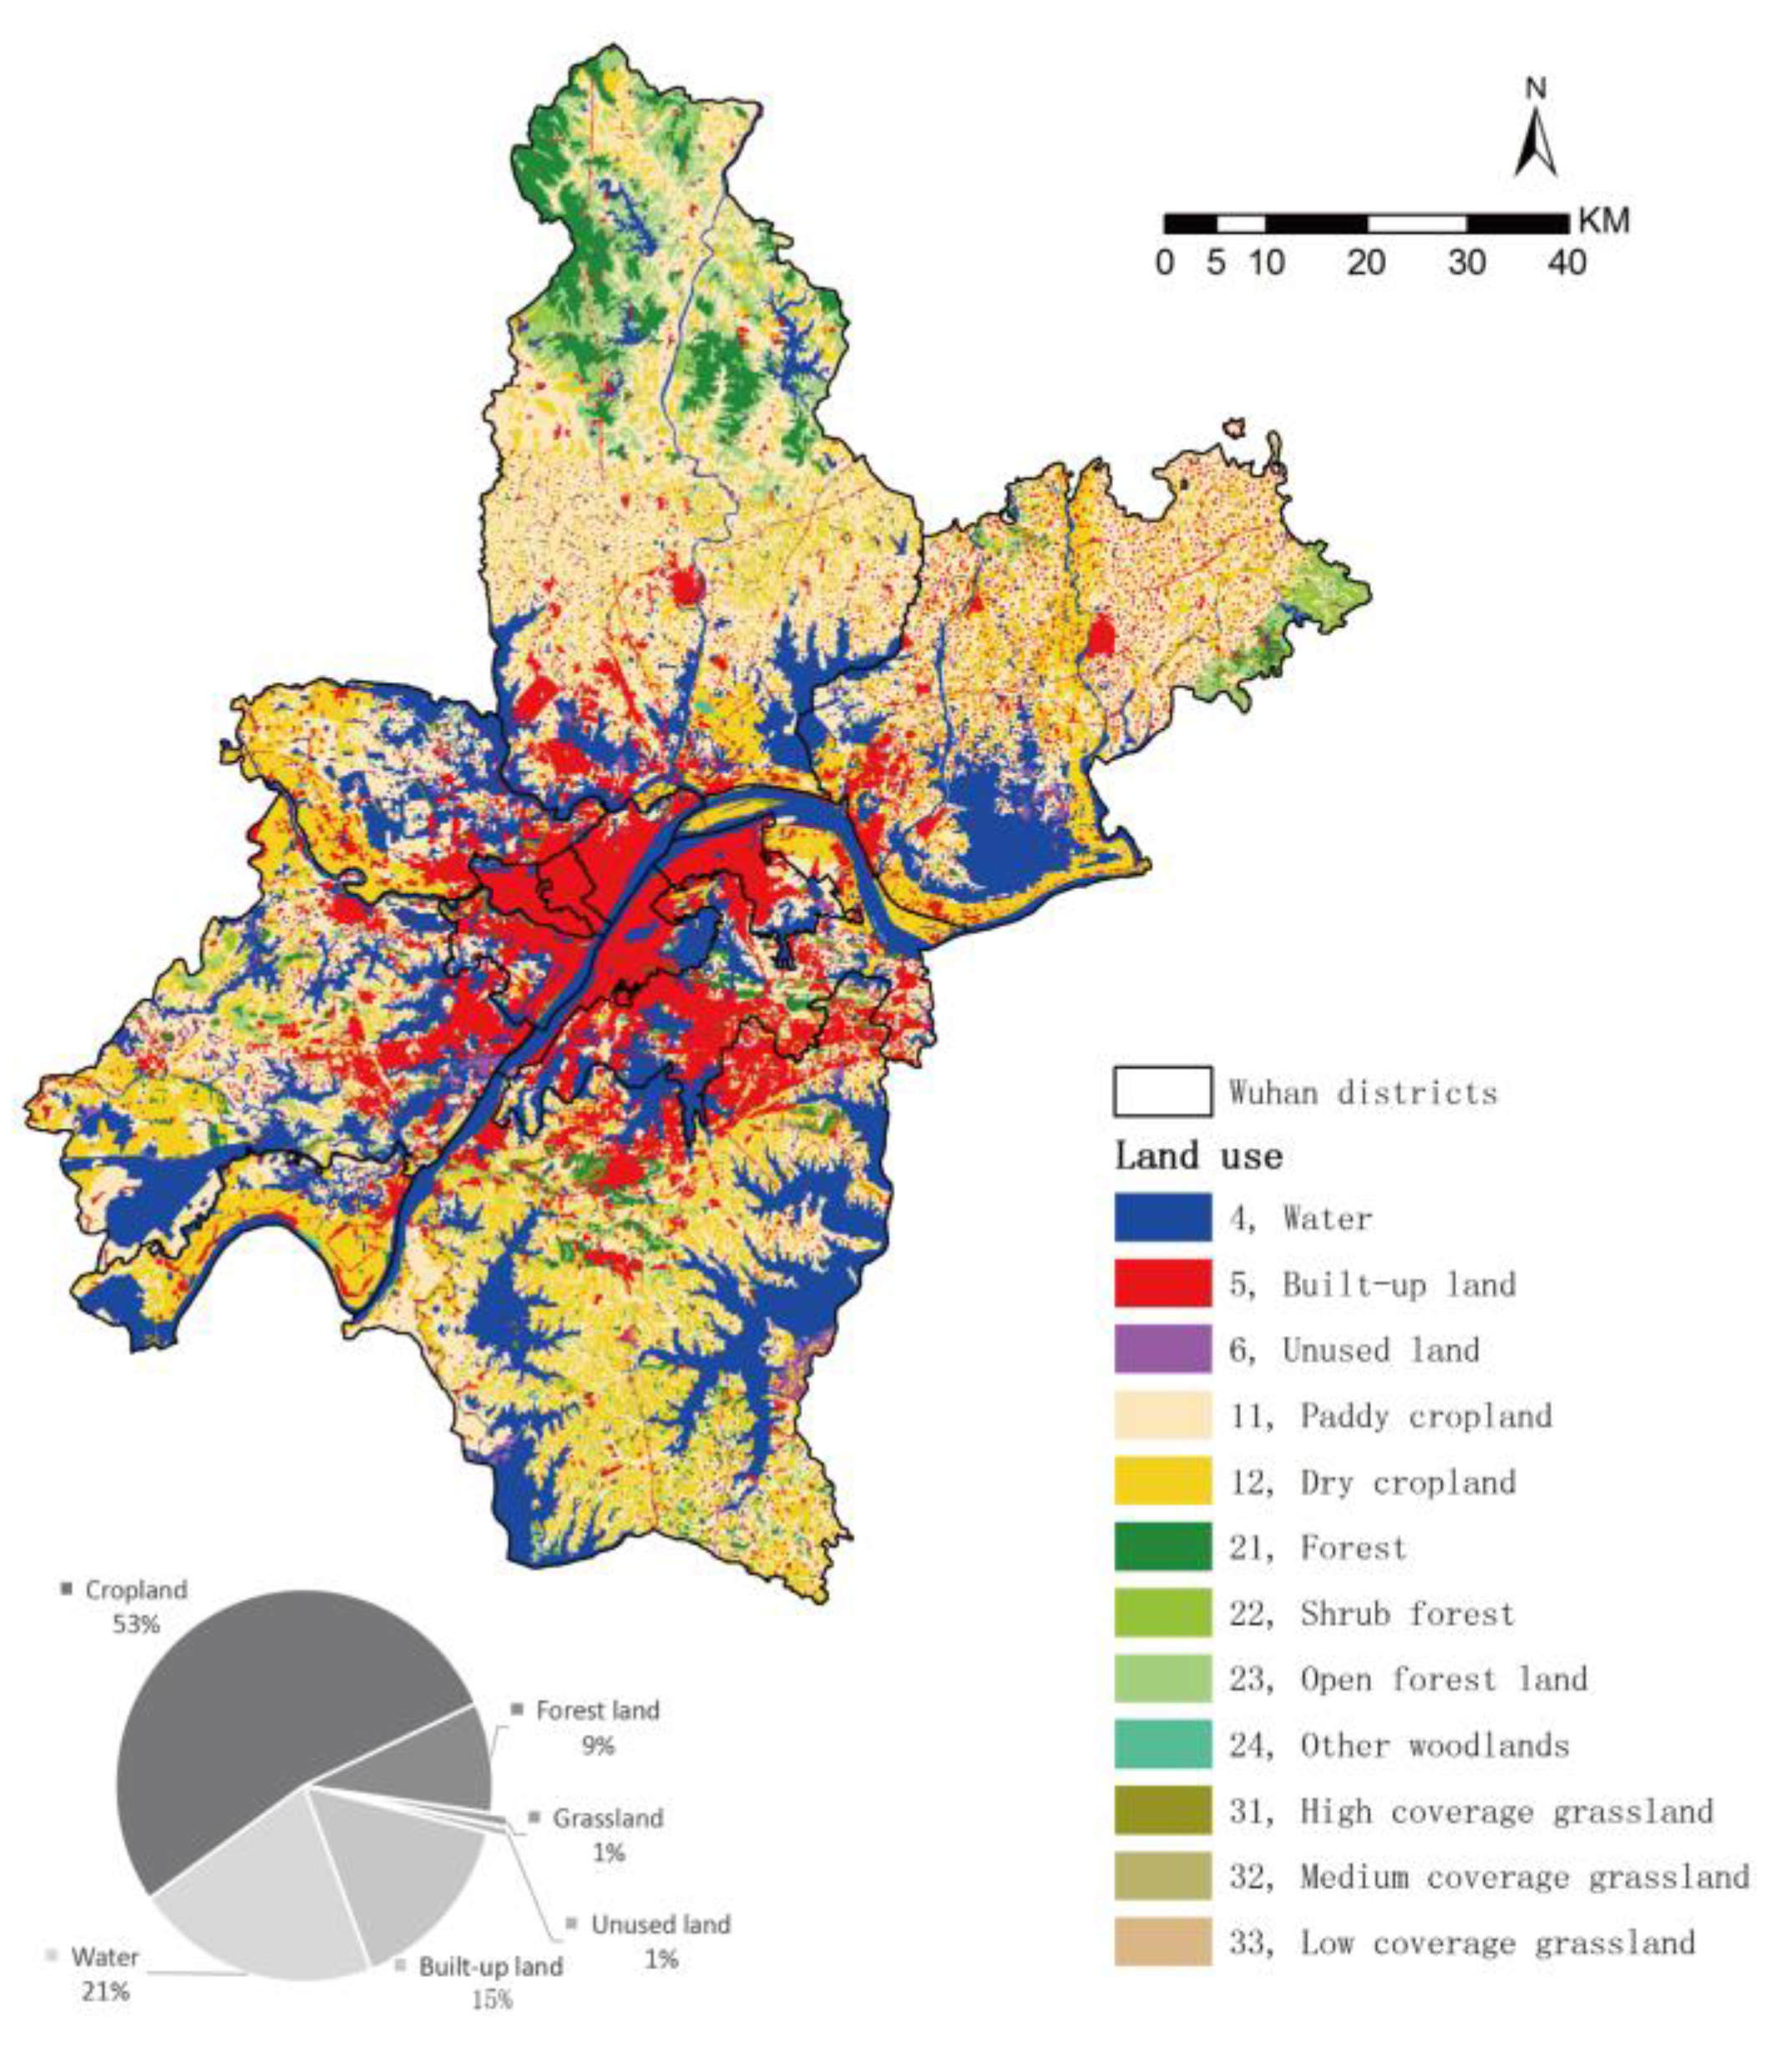
We divided land use into six categories of 12 types (
Figure 2): water (4), built-up land (5), unused land (6), grassland (11,12), forest land (21–24), and cropland (31–33). The water and cropland were the main types of landscapes in Wuhan. The cropland was concentrated on the periphery of the central area, of which the paddy cropland was 1.8 times the dry cropland [
22]. The land use water was evenly distributed and had a high density, accounting for 1/5 of the city. The Yangtze River runs through north to south, and the Han River runs across east to west, forming a vertical axis. Unused land and grassland only accounted for 1% of the city respectively. The small mountain was the remnant of the Dabie Mountains, and the forest land was distributed in the northern part of Huangpi district and Xinzhou district.
The land use data was provided by the Data Center for Resources and Environmental Sciences, Chinese Academy of Sciences (RESDC) (
http://www.resdc.cn). They used the same classification system of land use types with 30 m spatial resolutions [
26]. It was remotely sensed by Landsat8 from the Geospatial Data Cloud (
http://www.gscloud.cn/) in 2018 and preprocessed by ENVI (The Environment for Visualizing Images) for radiometric calibration, atmospheric correction, and fusion. The maximum likelihood method was used to supervise and classify land use types. Regions of interest of each type were selected as evaluation samples by visual interpretation, and the overall accuracy was higher than 80%. The DEM (Digital Elevation Model) data and road data came from the Wuhan Planning and Design Institute (WPDI
http://www.wpdi.cn/project-1.htm). We converted all generated raster maps to a common spatial reference (WGS1984, UTM Zone 50N) to reduce errors.
3. Research Methods
3.1. Research Framework
We aimed to propose an integrated network planning strategy based on the existing landscape characteristics of Wuhan. The models and main steps involved were as follows: (1) Use the InVEST model to analyze the habitat quality and extract the critical source patches. (2) Use the Analytic Hierarchy Process (AHP) to construct the cost surface of birds and small terrestrial mammals. (3) Combining the cost surface results, use the LCP model of GIS to simulate the corridor and construct an ecological network.
3.2. Analysis of Habitat Quality and Habitat Degradation
The InVEST model is designed to make natural resource management decisions effectively [
27,
28,
29]. The results of the assessment contribute to the rational development of land resources and the conservation of biodiversity to maintain a balance between social and natural interests. This model can reflect habitat quality and habitat degradation due to human impacts. This is done by accurately quantifying the intensity of external threats and the sensitivity of various habitats to those threats [
27]. Additionally, the model assumes that the higher the habitat quality, the higher the level of biodiversity [
19,
27]. Conversely, strong habitat degradation indicates high impact of human activities. The habitat quality index is calculated in Equation (1)
where
Qxj is the habitat quality index of grid
x in land use and land cover
j;
Dxj is the habitat stress level of grid
x in land use and land cover
j;
Hj is the habitat suitability of land use and land cover
j; and
k is the half-saturation constant.
The habitat degradation index is calculated in Equation (2):
where
Dxj is the habitat degradation or total threat level of the land use and land cover (LULC) type
j in a grid cell
x;
R is the number of threat factors;
r presents the threat layer;
y indicates all grid cells on a raster map of
r;
Yr indicates the set of grid cells on a raster map of
r;
ωr indicates the weight of each threat factor (value from 0 to 1);
ry indicates the effect of threat
r that originates in grid cell
y;
irxy indicates the distance between habitat and the threat source and the impact of the threat across space;
βx is the factor that may mitigate the impact of threats on habitat through various protection policies (here,
βx = 1); and
Sjr indicates the sensitivity of LULC type
j to threat factor
r, where values closer to 1 indicate greater sensitivity, (if
Sjr = 0, then
Dxj is not a function of threat
r).
Four basic data inputs are needed to perform this model. (1) Land use data: A GIS raster dataset, with an integer LULC code for each cell. (2) Threats factors: water, cropland, urban, rural, road, and expressway. (3) The sensitivity (
Table 1) of land cover types to habitat threat factors. (4) A half-saturation constant value of the parameter
k in Equation (1). More detail can be seen in the user’s guide of the InVEST Model [
30].
This ranking showed that the forest land had a generally higher score than the grassland and cropland across all threat factors. Furthermore, we chose the linear or exponential decay model corresponding to threat factors with the maximum influence distance and weight.
3.3. Analytic Hierarchy Process (AHP) for Cost Surface
AHP is a mature method to determine the weight of influence factors, especially for a multilevel and multifactor index system [
31,
32]. In this study, we invited 10 experts with more than 12 years of research experience in the fields of forestry, ecology, and landscape planning. We established a scoring table, where the cost surface was the target layer, while habitat, geophysical landscape, and human disturbance were the criterion layers. Experts scored the relative importance between the two indicators and obtained the judgment matrix of the indicators through AHP. Furthermore, the inconsistency ratio was calculated to examine the consistency and reliability of each matrix to enhance the AHP model conduction.
where
CI is the consistency index, and
RI is the consistency index of a randomly generated matrix, whose values depend on the size of the pairwise comparison matrix.
λmax is the biggest eigenvalue of the framework and can be effectively decided from the specified matrix and
n is the number of vulnerability assessment factors.
3.4. Spatial Autocorrelation Based on Getis–Ord Gi∗ Statistics (Gi*, for Short)
The
Gi* is a technique for cluster analysis which discusses the location-related inclination in the attributes of spatial data. As a tool integrated with GIS, this approach takes each raster pixel within the context of neighboring features into the calculation and outputs a new feature class with a z-score,
p-value, and confidence level [
33]. In this study, the
Gi* is used to identify hotspots (features with high z-score and small
p-value) and coldspots (features with low negative z-score and small
p-value) of cost surface. The magnitude of the absolute value of the z-score explains the intensity of the clustering (location-related inclination). The output hotspots and coldspots can present a better continuous surface, which is an expression of landscape connectivity. The
Gi* test can be described in Equation (5):
where the
Gi* is a z-score of patch
i.
xj is the attribute value for patch
j;
wij is the spatial weight between patch
i and patch
j, if the distance from a neighbor
j to the feature
i is within the distance,
wij = 1; otherwise
wij = 0;
n is the total number of grid cells; and
3.5. The Least Cost Path Analysis (LCP) Based on GIS
The LCP model is the least cost path for calculating the source to the target and is considered to be one of the most effective methods [
34,
35].
First, the locations of the critical patches are filtered, that is, the sources and target patches are determined.
Second, the cost surface is calculated by the cost value and weight of each cell. The cost surface is used to determine the minimum cumulative cost path, revealing how the cost factor promotes or hinders animal movement. The cost surface is treated as a relative value rather than an absolute value. Based on land use types, we integrated cost factors from biological habitats, human disturbances, and geographical landscape.
Third, the optimal least cost path between the source and the target is explored to determine the potential movement of target species [
6]. The results represent the closest cell source for the visual link control protocol from the selected location. This method may provide a basis for the protection of ecological corridors [
27].
4. Results and Discussion
4.1. Habitat Assessment and Source Identification Based on InVEST Model
4.1.1. The Assessments of Habitat Quality and Habitat Degradation
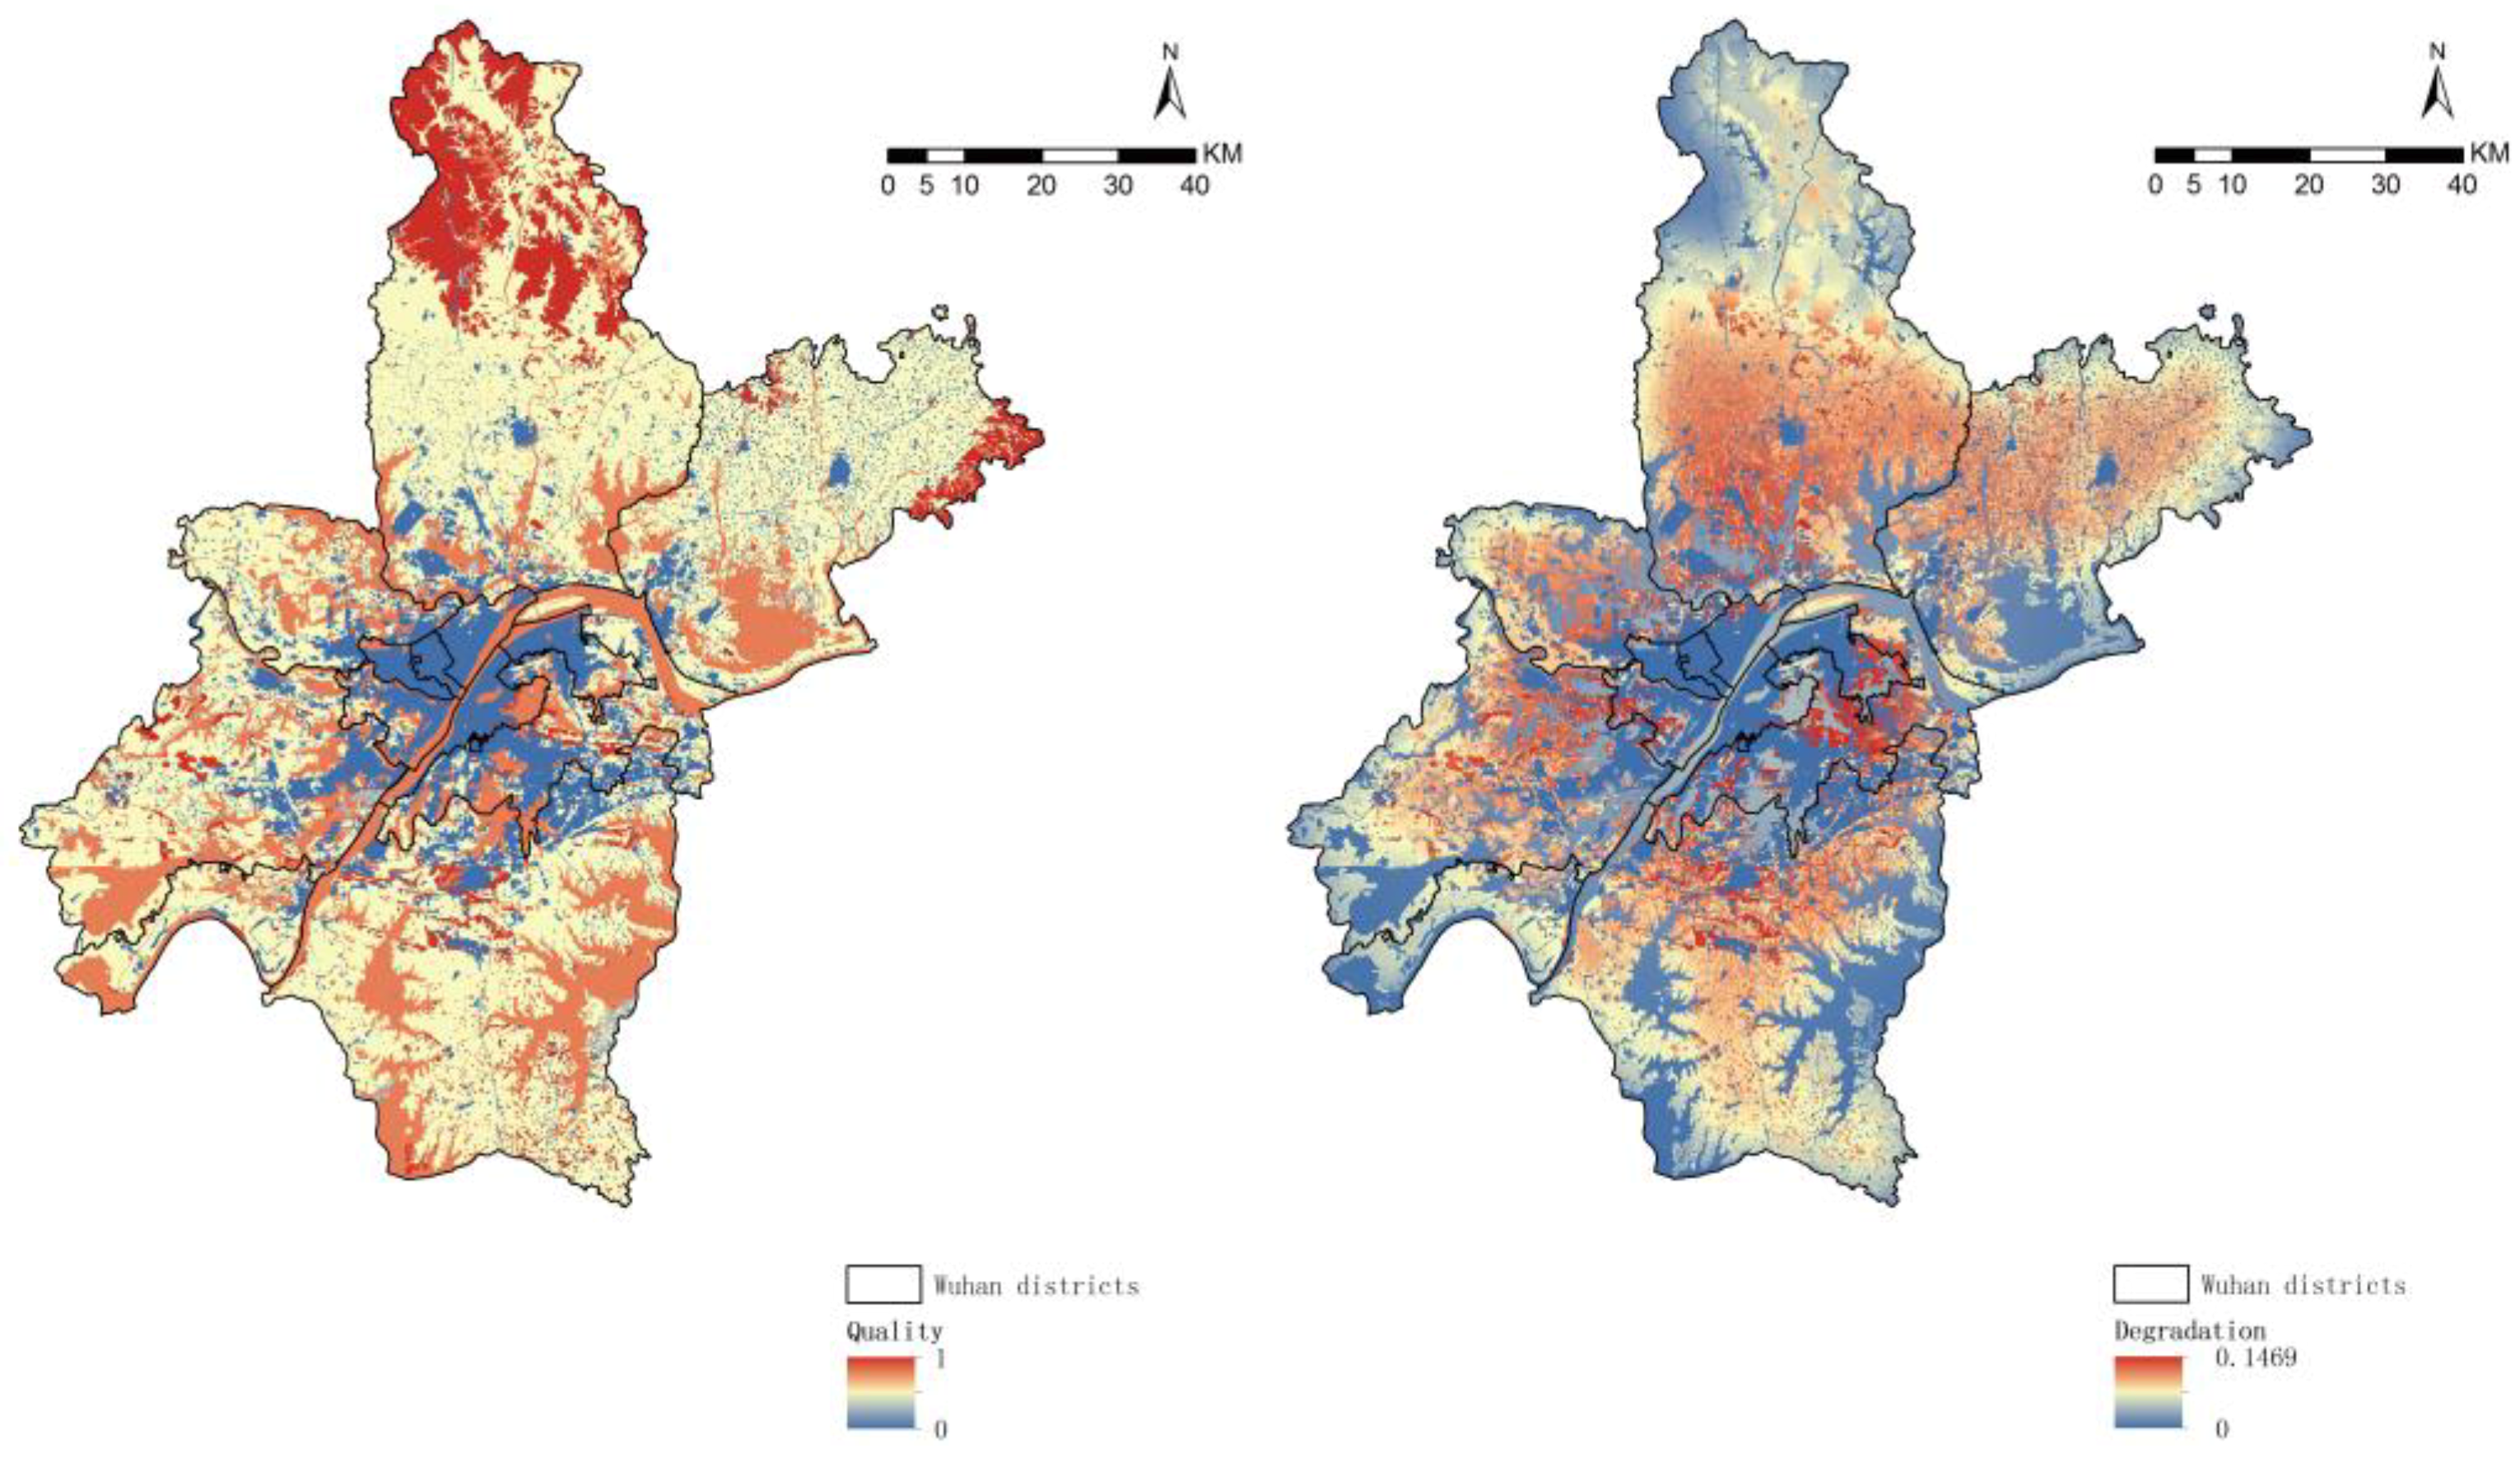
In terms of the quality measure (
Figure 3), the water habitat scored higher than the cropland, while the forest area in the north scored highest and the construction land scored lowest. Habitat degradation in water and built-up land was almost 0. Cropland degradation was the highest, with 65% of cropland degrading >0.12. Cropland degradation at the junction with the construction land was most pronounced, while degradation near water and vegetation was low. The most severely degraded areas in the central urban area were Hongshan and Hanyang districts.
The same as in previous studies, the degradation of cropland and forest caused by urban expansion was more severe [
36]. The forest landscape in the alpine mountains and tropical regions of China is of high quality and positively correlated with the forest area [
32]. The degree of habitat degradation of the Taihu Lake Basin has increased significantly over the past 30 years, especially in the construction of farmland for landscape heterogeneity [
1].
4.1.2. Patch Selection Based on the InVEST Model
If all the ecological resources are counted, the construction and management costs required will be multiplied, this leads to redundant corridor statistics and unrealistic results [
27]. Therefore, we combined the study area and used land distribution and habitat quality as screening indicators for basic habitats (
Table 2). We selected 126 patches for birds with a total area of 510 km
2, accounting for 59.6% of the greenspace. Meanwhile, 61 patches were picked for small terrestrial mammals with a total area of 481 km
2.
4.2. AHP-Based Cost Surface Analysis for Birds and Small Mammals
Based on expert assessments and literature reviews, we developed three factors (
Table 3 and
Table 4) that influenced the cost surface. These factors are habitat elements, geophysical landscape, and human disturbance [
32,
34]. According to the relative importance, we rounded each weight to four decimal places [
32,
37]. With the average inconsistency value of 0.06, the matrix analysis confirmed the consistency and reliability of the expert judgment [
34].
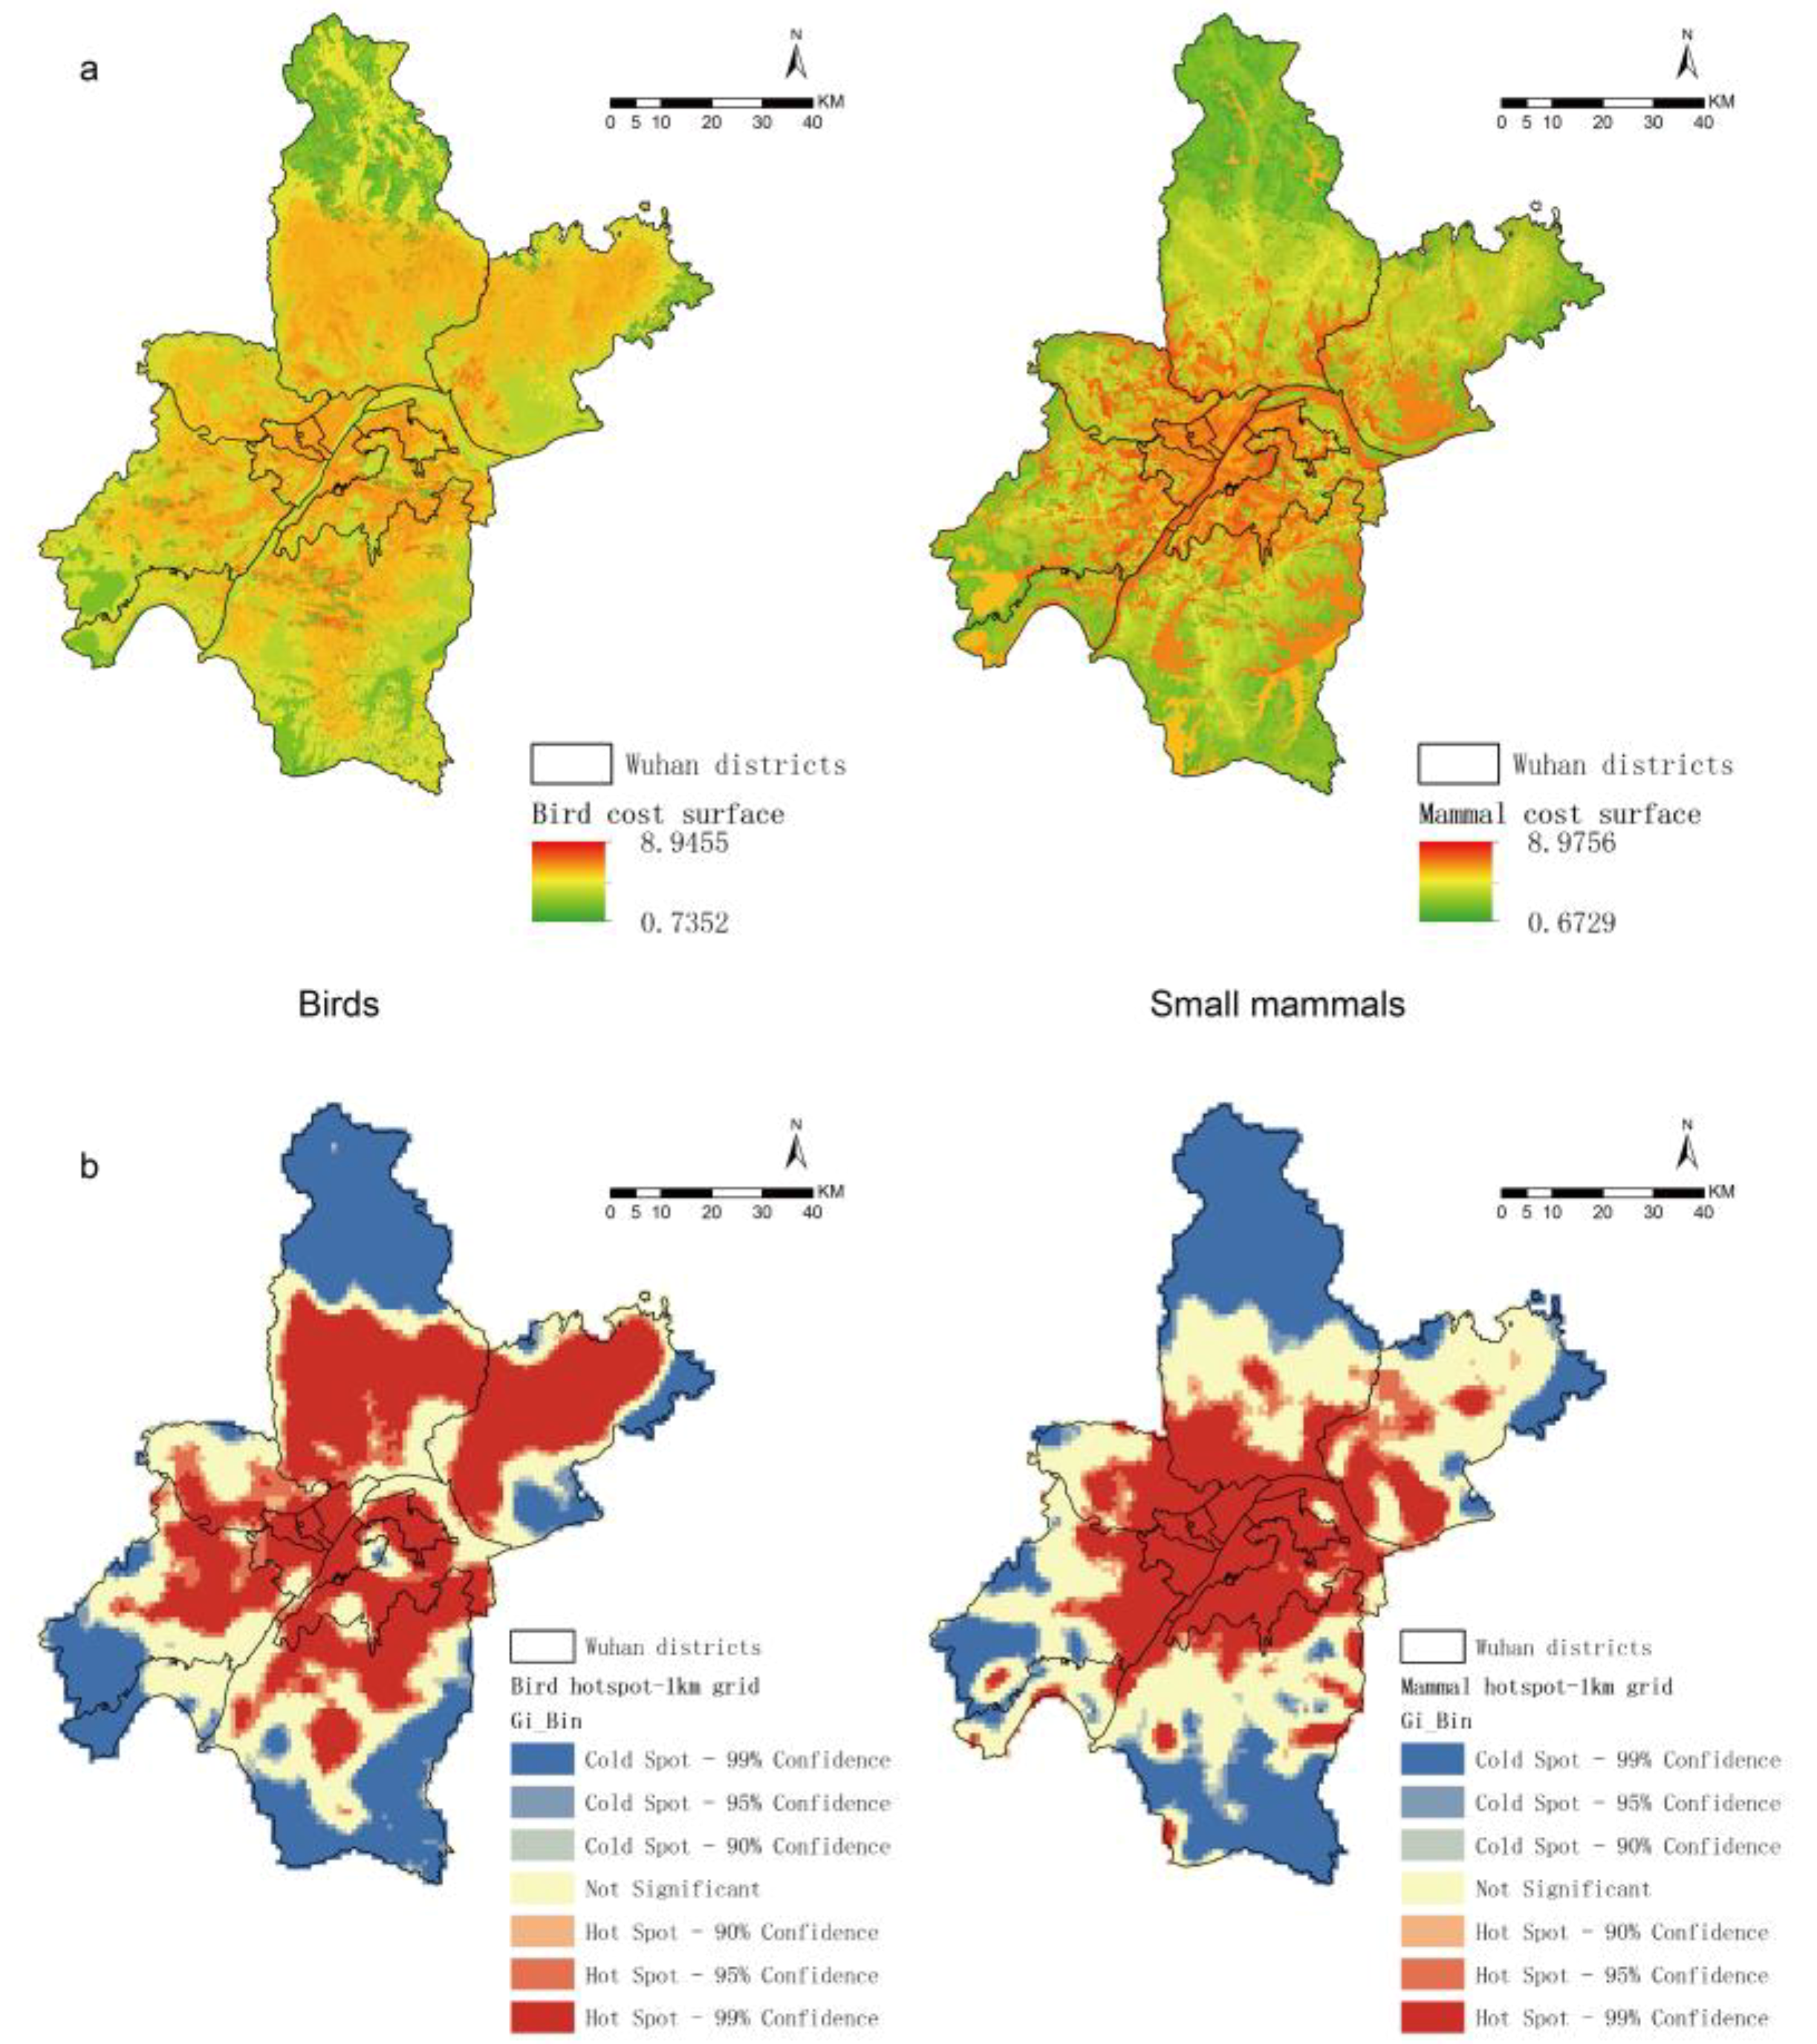
The cost surfaces and hotspots analysis with different confidence levels are shown in
Figure 4. The high–low clustering report of the cost surface showed that the
p-value was 0.000, and the z-score of the birds and the small mammals were 89.9 and 96.7, respectively. The cost surfaces all passed the 90% Getis-Ord
Gi* confidence level and exhibited a precise high-value clustering distribution (
Figure 4b). The Getis-Ord
Gi* statistic expressed landscape connectivity and displayed hotspot results by showing all adjacent features of the continuous surface.
Apart from towns and settlements, 99% of the hotspots of birds appeared in flat areas concentrated in between cropland and urban land, mainly due to the substantial interference of human activities [
1,
38]. However, mammalian hotspots concentrated in a range of 5.4 km of radiation in waters and central areas. Notably, the coldspots of birds and small mammals were all concentrated in the mountains, especially in forests with healthy vegetation (
Figure 4a). Moreover, the spatial distribution of hotspots could guide targeted priority policy-making for biodiversity reservation [
33].
4.3. Corridor Analysis and Network Construction Strategies Based on LCP
4.3.1. Corridor Comparison for Birds and Small Mammals
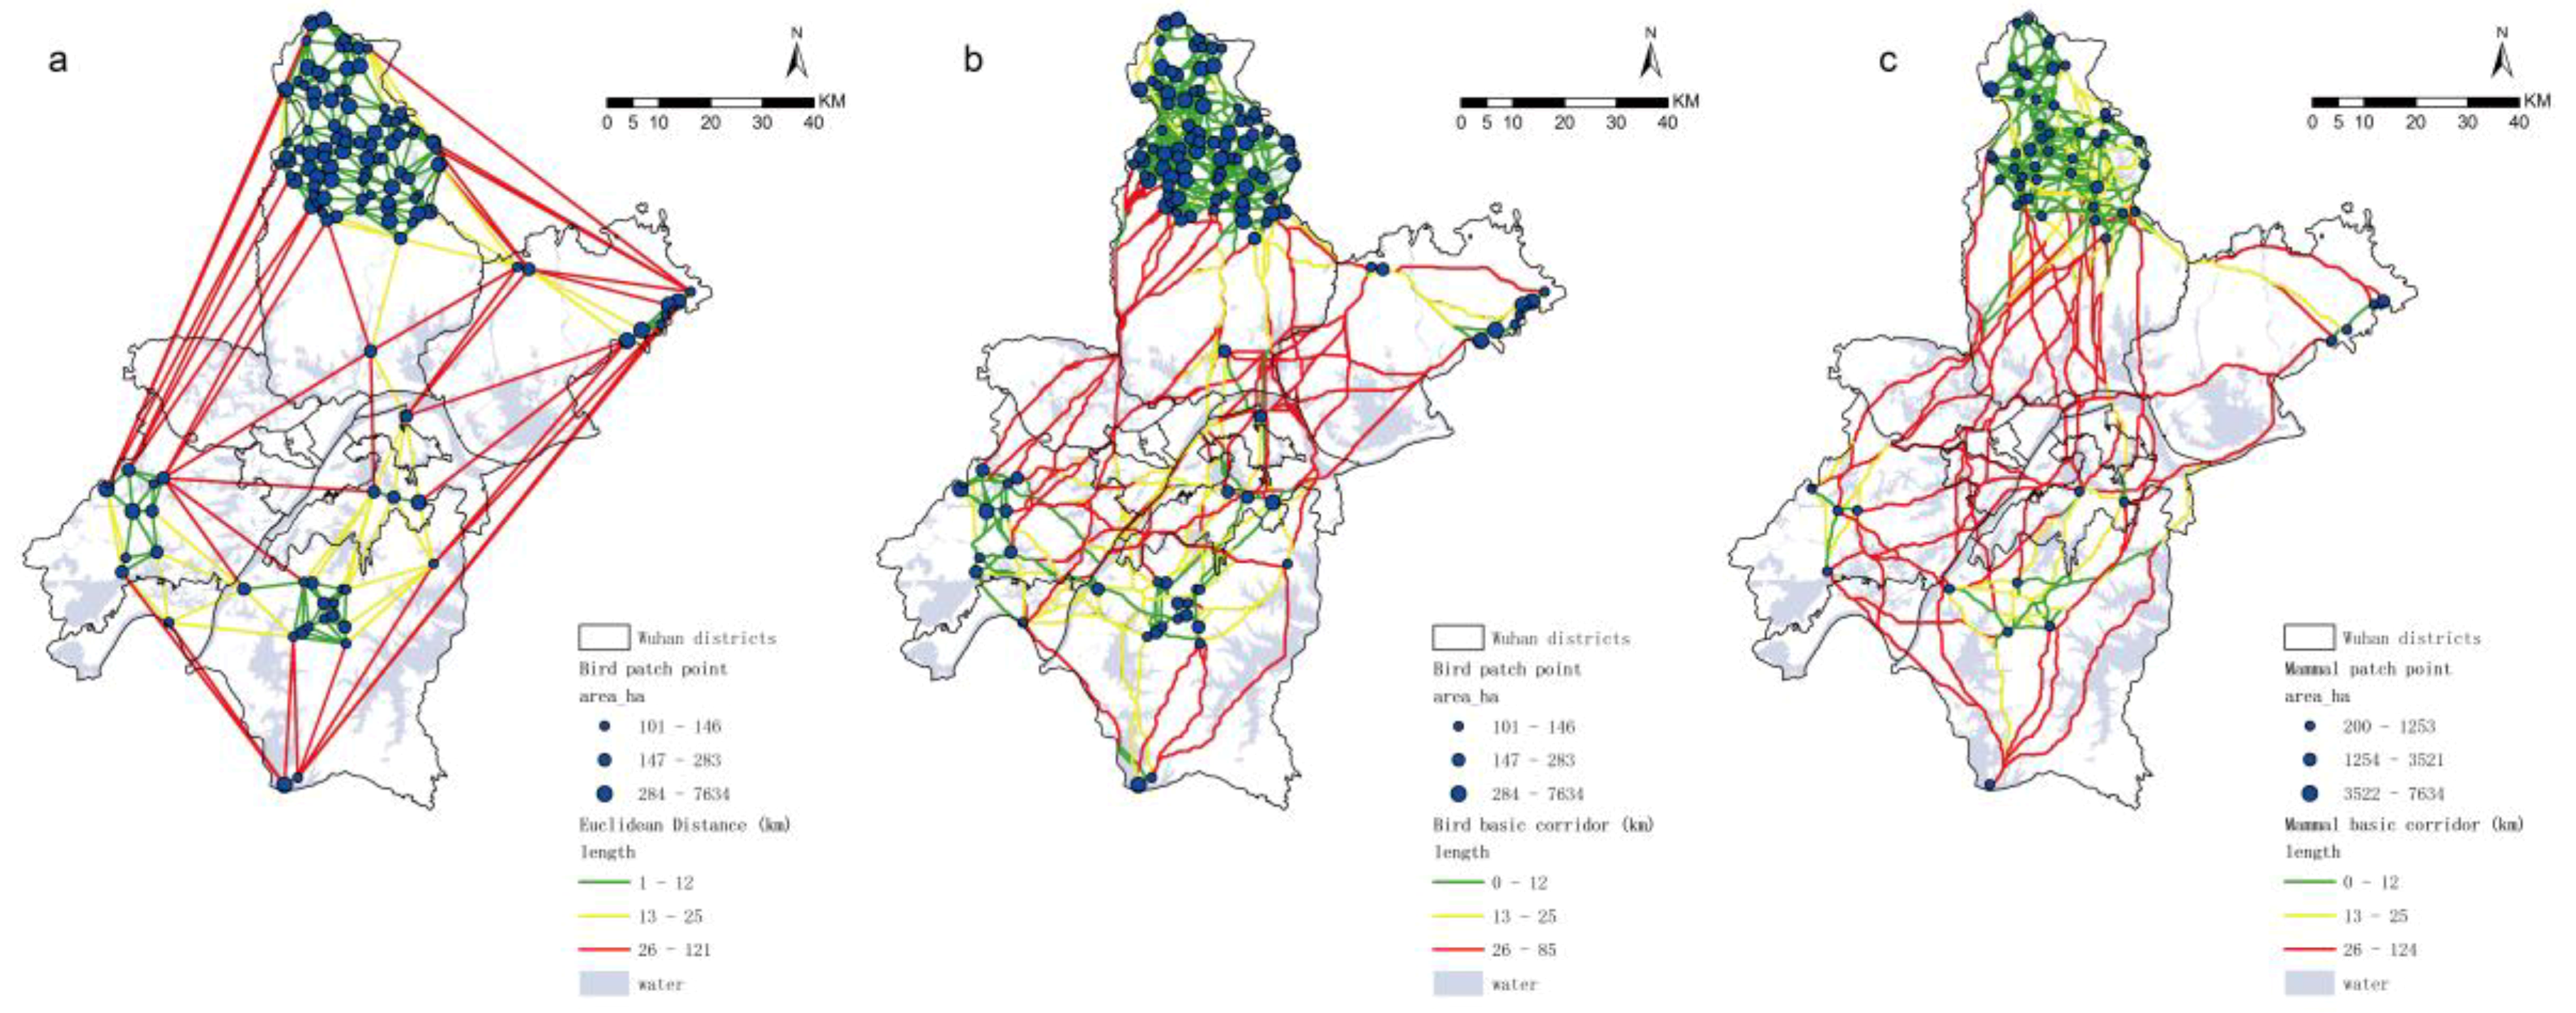
Different topological distances affect the choice of path; the Euclidean distance (
Figure 5a) was a measure of the linear distance between two adjacent patches, but ignored the plaque’s landscape permeability and spatial heterogeneity [
35].
The LCP has advantages over the “as the crow flies” Euclidean distance in comprehensive consideration of cost factors [
39]. After removing the duplicate lines, we obtained 14,769 bird corridors and 3684 small mammal corridors through the LCP (
Figure 5b,c). The results showed that the spatial distribution of the length of 12–25 km in the entire study area presented a “U” shape, namely the central urban area was well connected to the north and southwest. However, relatively independent patches between the northeast and west would be detrimental to biological and material cycling, especially in the Xinzhou and Dongxihu districts.
The mean corridor length of birds was 4.32 km longer than that of the small mammals. The corridors in Jianghan and Jiang’an districts were scarce. Mammal corridors were mainly located along the edge of the water body and the area with a low slope change rate, especially in the northern Huangpi and Xinzhou districts. Birds had more frequent corridors over the water, especially along the Yangtze River waterfront, this is probably due to their ability to simply fly over obstacles. Due to the length and width of the Yangtze River, small mammals may need more stepping stone configurations to connect the isolated patches in Hongshan district [
40].
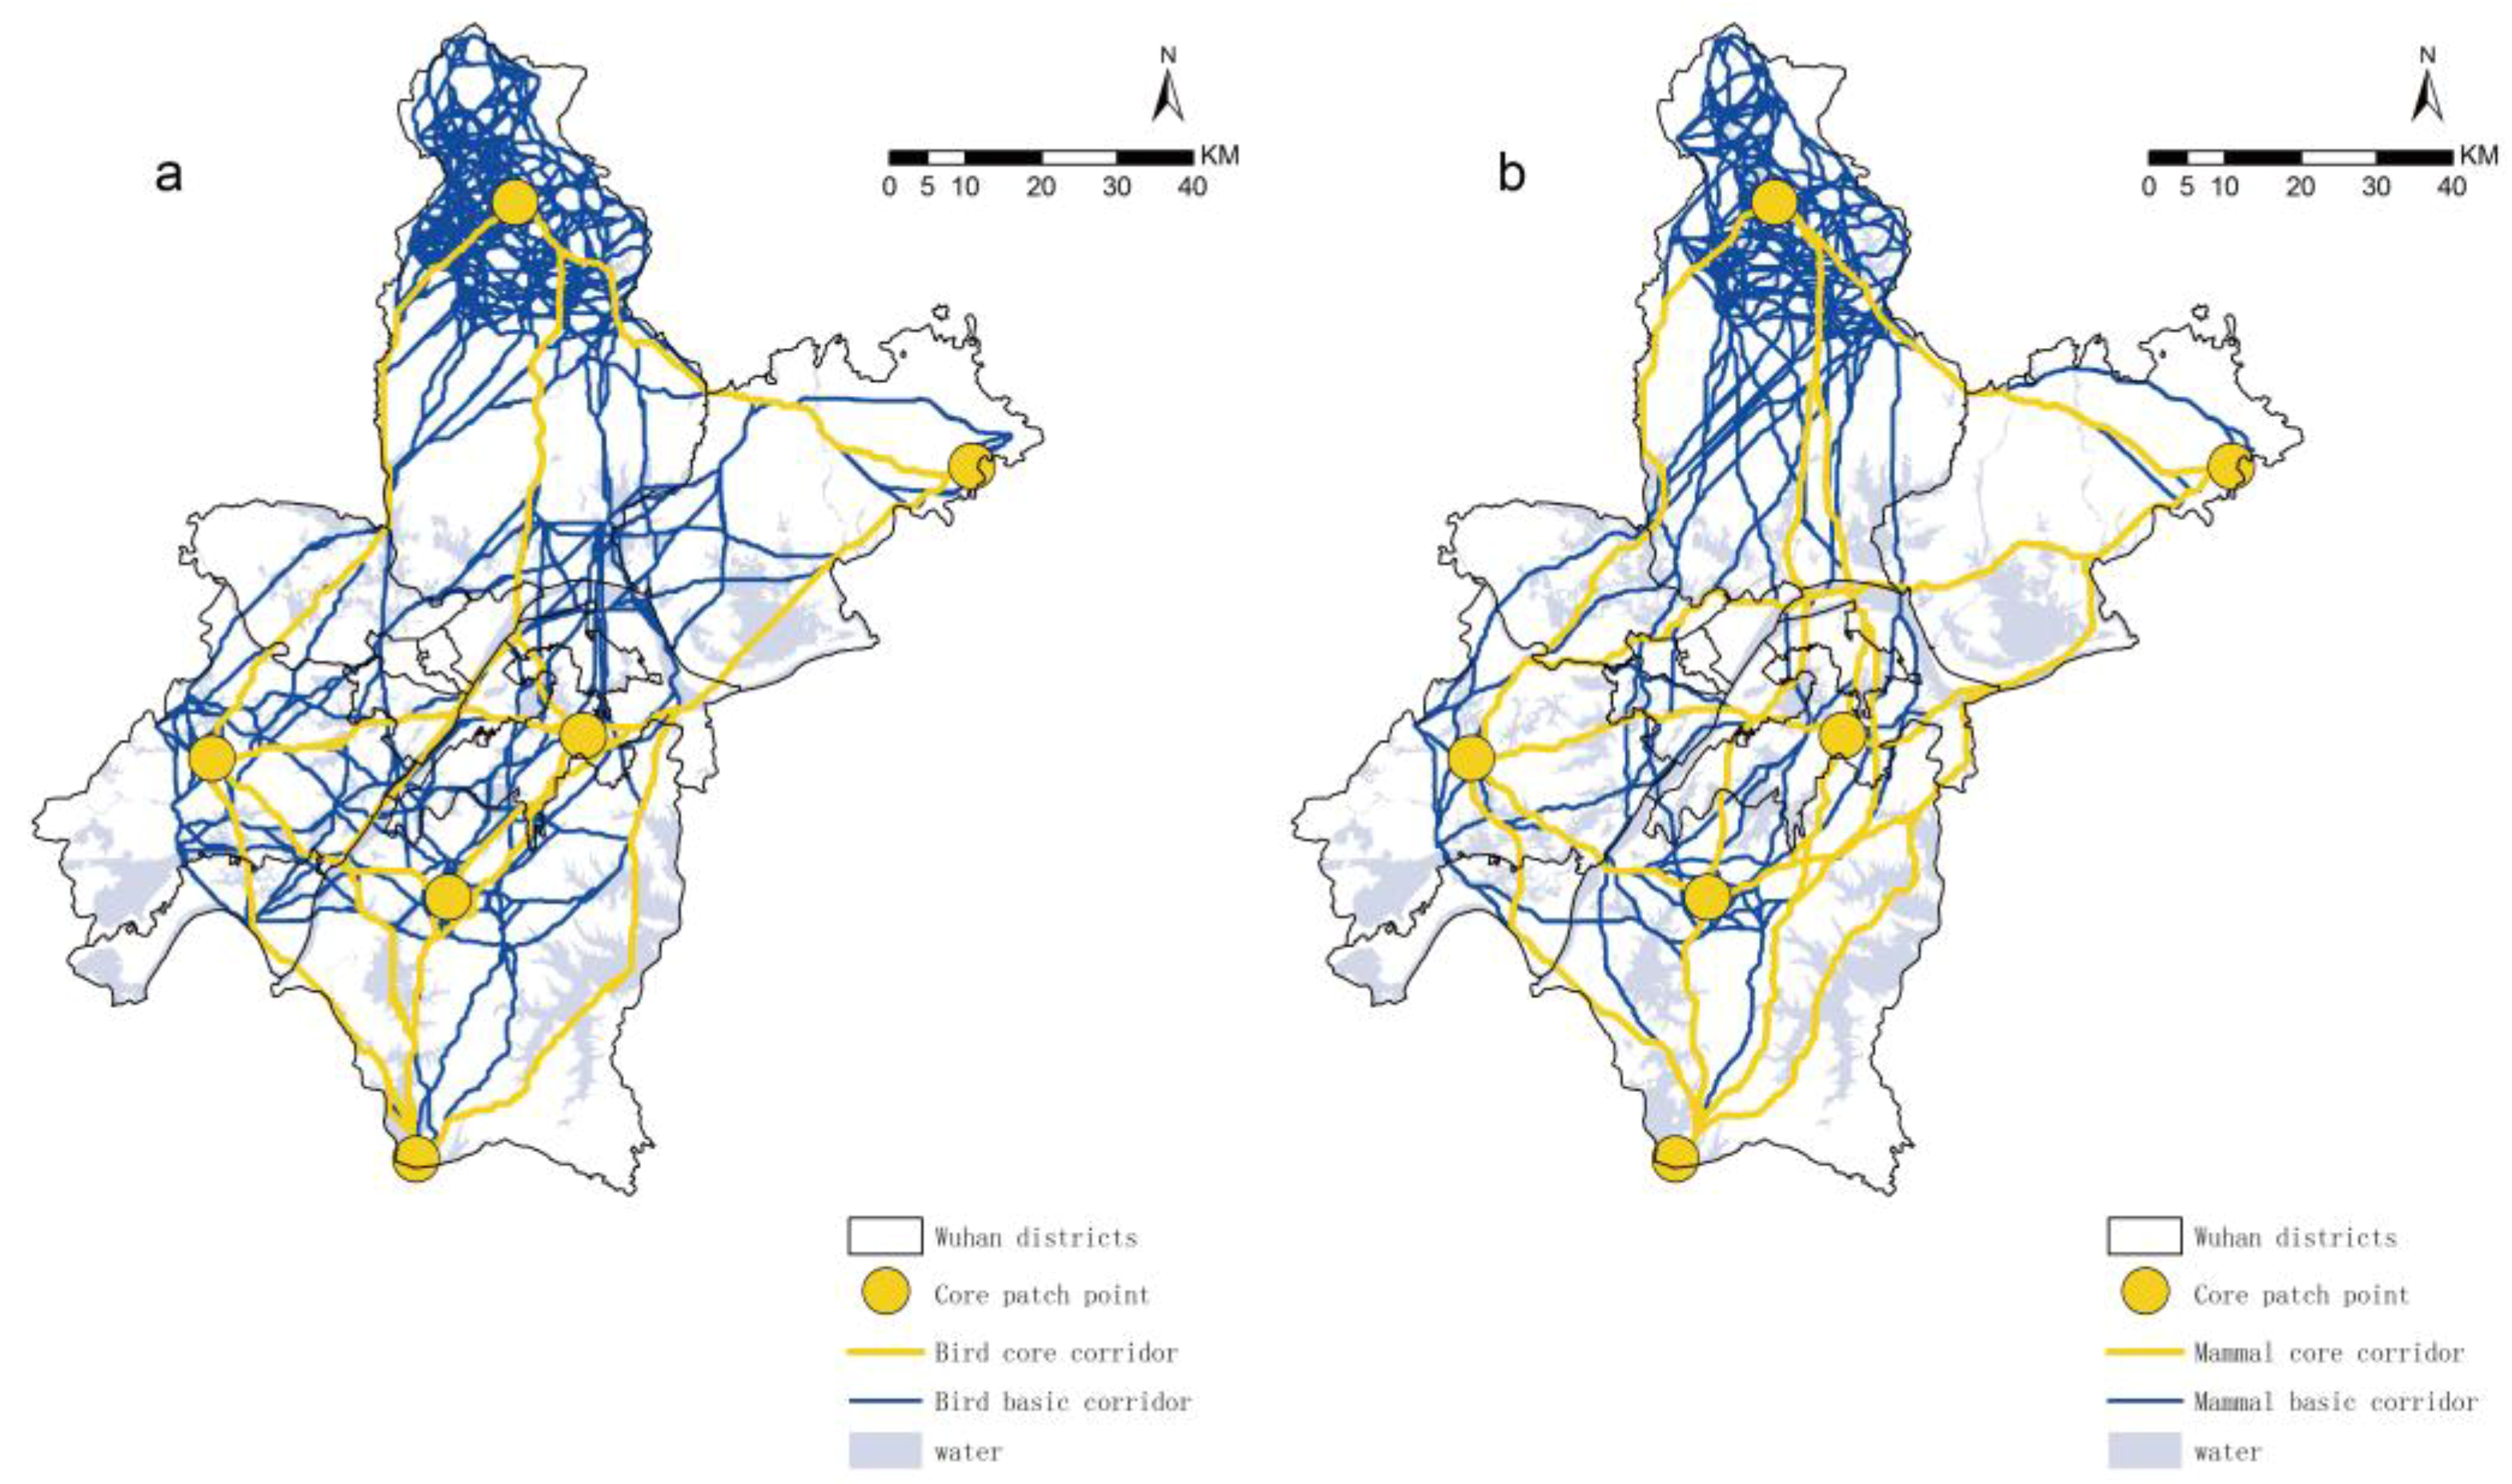
4.3.2. Corridor Network Priority Protection
The basic corridor network is complicated, and stratification would simplify the ecological conservation of relevant departments. We obtained six core patches and identified priority protection levels through nuclear density analysis tools and aggregation tools in GIS. The 15 core corridors greatly reduced the network complexity with a total length of 1506 km for birds and 2184 km for small mammals (
Figure 6). The distribution of the core corridors in the suburban districts was generally similar, but was quite different in the central area.
In the suburban districts, the hedges and shrubs planted in the cropland were completely marginal habitats [
40]. The marginal landscape was drier and brighter than its internal environment and was more suitable for wildlife activities, thus increasing the number of species. While in the fragmented artificial landscape of the central area, the ideal patches only appeared in the East Lake Scenic Area in Hongshan district, and hardly appeared in the districts of Jianghan, Jiang’an, and Qiaokou. Thus, methods of improving the marginal landscape quality and increasing the number of patches in these locations are needed. Our findings confirmed the results of Teng’s study that waterfront corridors could be set up around the Yangtze River, Han River, and large lakes, which could not only purify water but also provide habitat for terrestrial and aquatic animals [
15,
34].
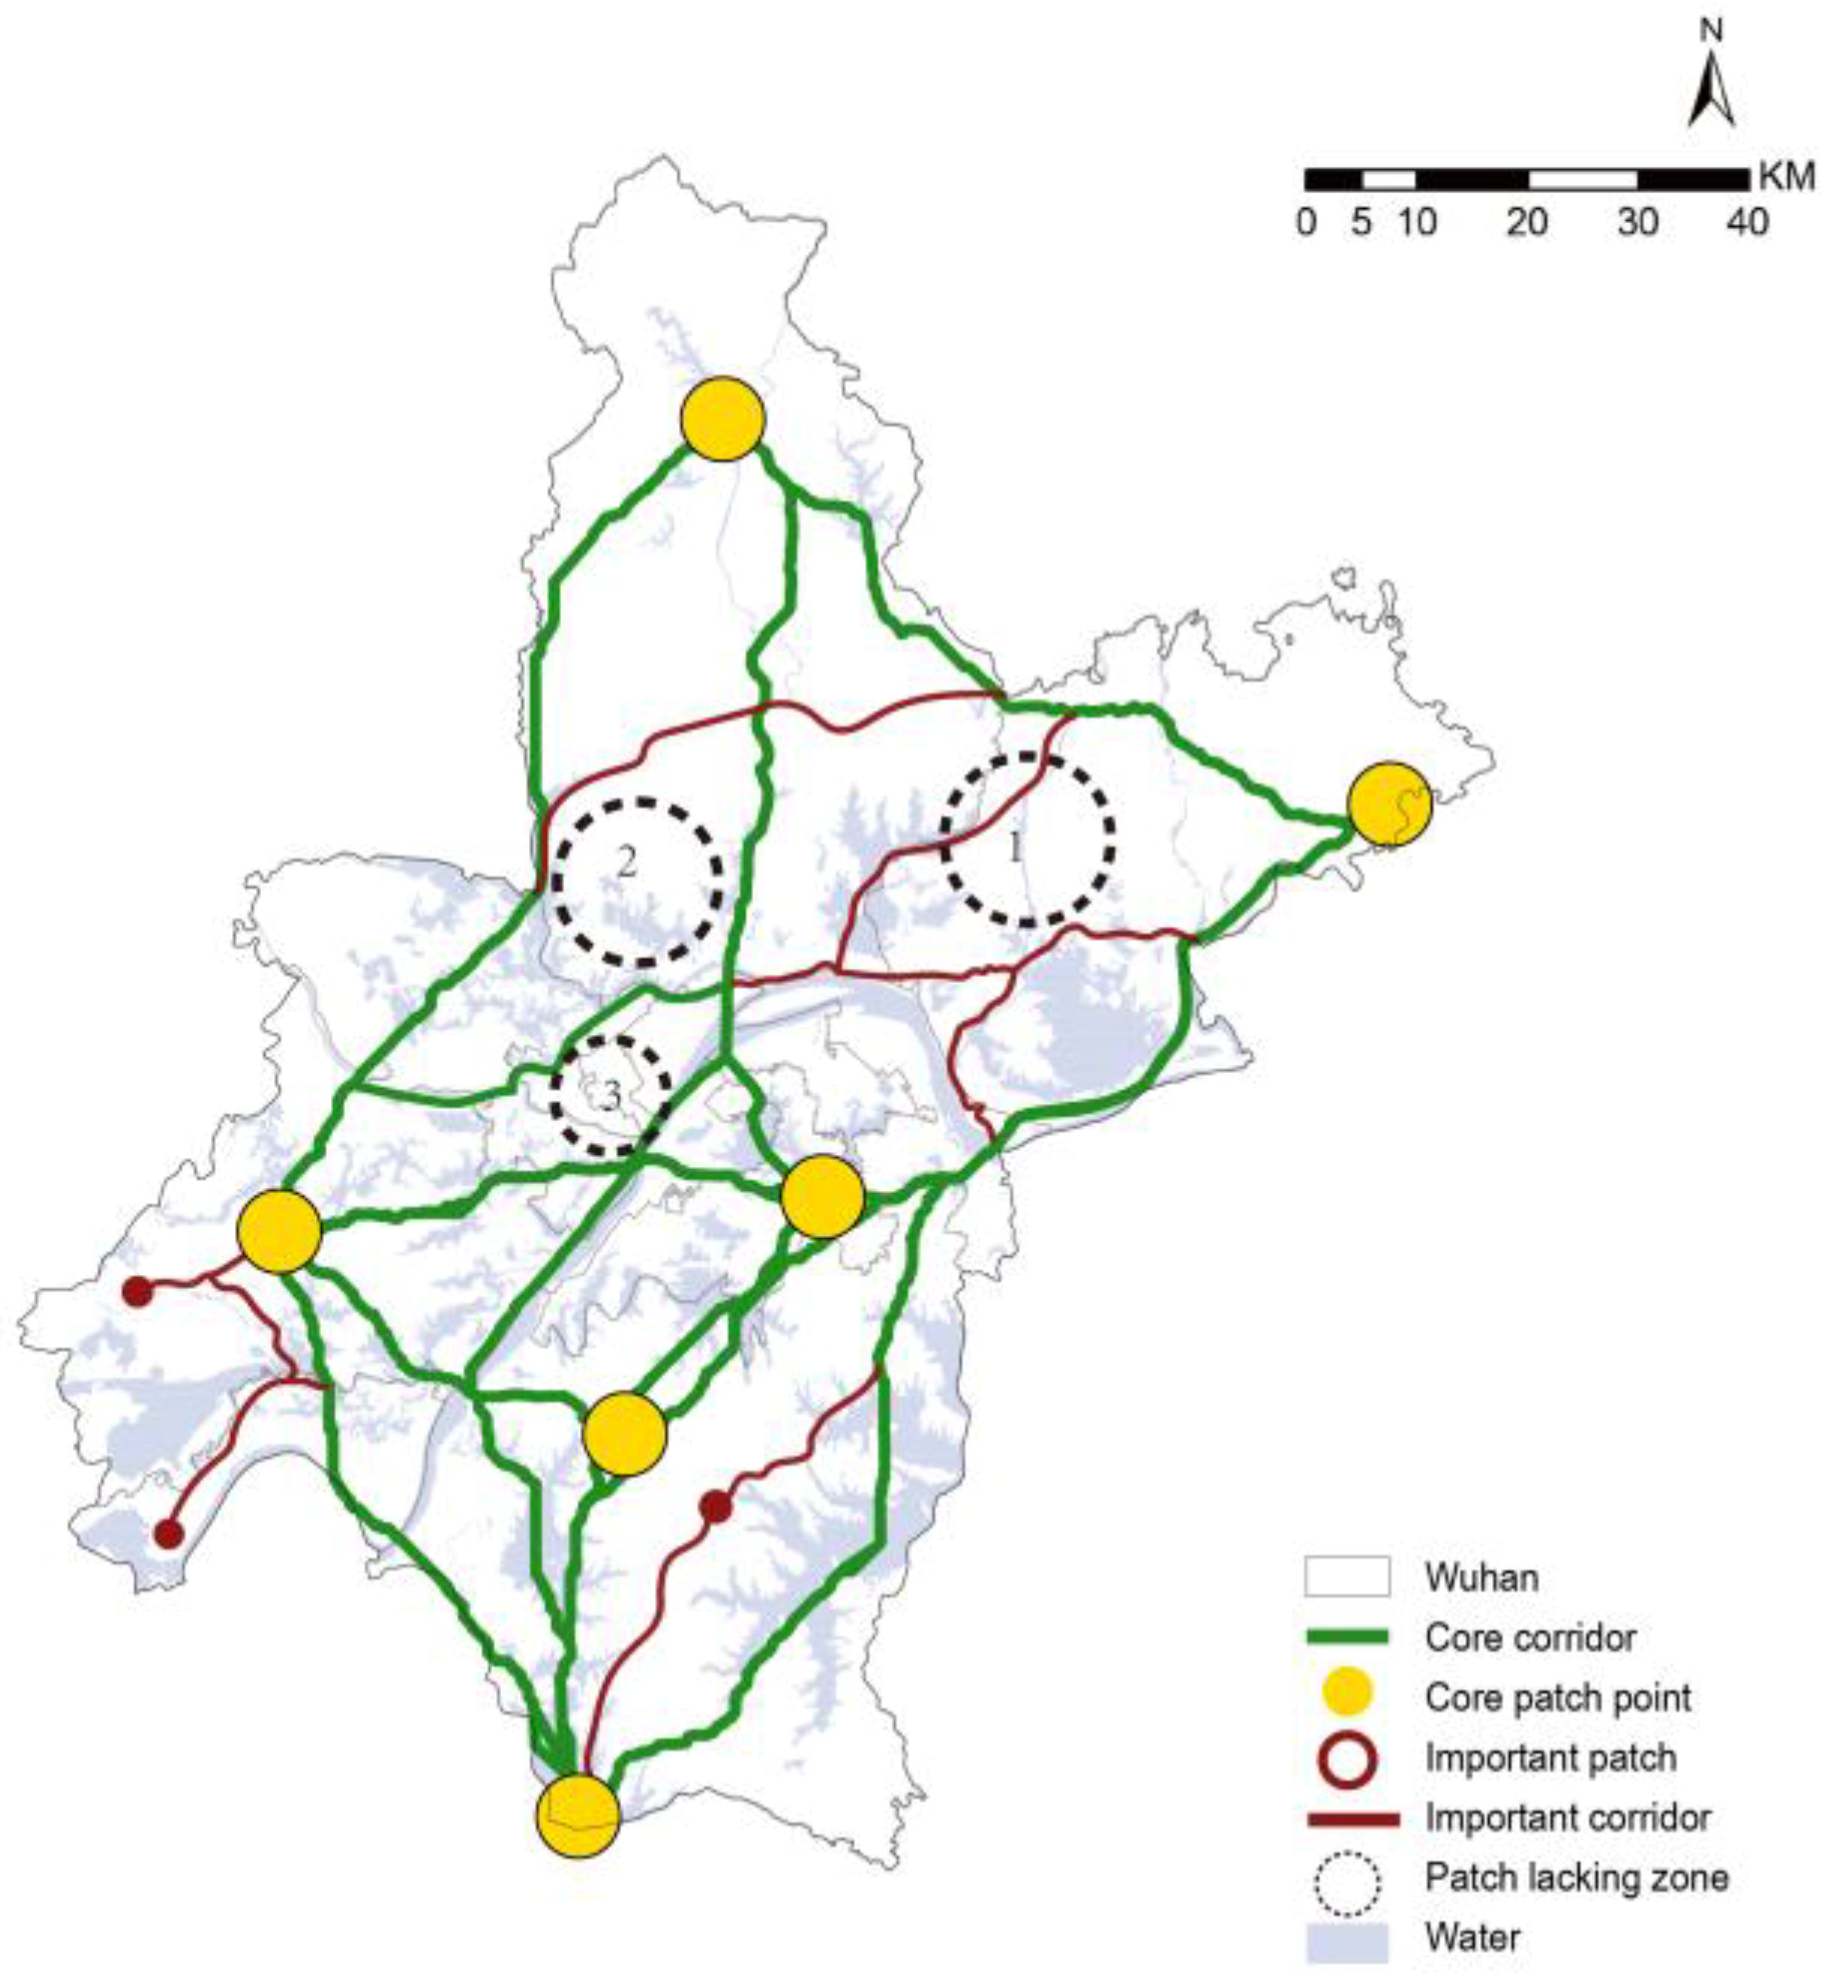
4.3.3. Integrated Priority Network Optimization Strategy
The phenomenon of high-quality cropland and natural waters swallowed by urbanization is increasing. To alleviate this symptom, we integrated the core corridors of birds and small mammals and proposed an integrated network planning strategy based on the principle of “point-line-plane” (
Figure 7).
1. Network density strengthening: The density distribution of the network in the north and south corridors was uneven, and the network density in the east–west direction had the worst results. The strict control of ecological red lines and corridor classification (core corridor in green) could constrain urban sprawl and reduce the impact of human activities on biological migration. The effective use of unused land and low coverage grassland was likely to reduce the exploitation of green space for ecological protection and intensive development [
16,
41].
2. Increasing corridor connection: The addition of seven important corridors could not only strengthen the connectivity of the Dongxihu district and the northern Xinzhou district, but also strengthen the connectivity of the southern Zhuankou and Caidian districts. During long-distance migration, species would settle or even multiply in natural habitat patches, and the function of the corridor as habitat and channels could be simultaneously exerted to achieve higher benefits and efficiency. The Yangtze River, Han River, and large water areas blocked the migration of small mammals. Adding green belts along with the remaining isolated plaques, rivers, or highways would help reduce the budget for network construction.
3. Patch protection and addition: Important patches need to be restored to avoid habitat degradation in the south, especially in cropland with lower habitat quality and higher degradation. A large number of unevenly isolated patches were scattered in the central area due to the effects of human activities. Although there were some patches in Luojiashan street and the East Lake scenic area, the patches in the Hankou and Hanyang districts (patch lacking zone 3) were very scarce, especially in the streets of Xinhua, Changqing, Sixin, and Minzu. Therefore, increasing the density of patches by adding stepping stones could be focused on these areas (patch lacking zone 3) as well as on Xinzhou and Hunagpi districts (patch lacking zone 1 and 2).
4. Plant configuration optimization: Despite the wide variety of plants in Wuhan, the original plants were severely damaged due to early reclamation. Although there were amounts of artificially cultivated cedar forests in the Jiangxia district, the average habitat quality was less than 0.6 due to the lack of dominant shrubs [
42]. In order to meet the needs of humans and animals by improving habitat quality, we proposed a configuration reference based on the protection of existing plant communities (
Table 5).
5. Conclusions and Prospects
Wuhan has many natural resources such as mountains, forests, cropland, rivers, and lakes which form part of an ecological community. Therefore, it is important to follow the laws of nature in the process of ecological restoration and assess the natural resources uniformly and holistically. The construction of the corridor network as outlined in this research takes on this uniform and holistic approach to considerably improve the living environment. With the combination of the InVEST model and the LCP model, the strategy of ecological source screening, and cost distribution we showed that the ecological network optimization could be improved. The results of our study are presented as follows:
In combination with the characteristics of threat factors, the InVEST model demonstrated the distribution of habitat quality and degradation. It provided a reliable basis for ecological source screening by selecting quality values higher than 0.8.
The cost surface had a significant high-value clustering distribution. Large waters and human activities had greater impacts on small mammals than on birds.
The integrated corridor network plan that adhered to the “point-line-plane” principle was conducive to improving migration efficiency, reducing construction costs, and promoting sustainable development in Wuhan.
Wuhan has a multi-center structure and the road network, and building density in the central area is complex [
43]. The construction investment in the central and suburban areas of Wuhan is determined by regional urbanization. An integrated corridor network plan could help local professionals reduce the economic costs of biodiversity conservation, especially under limited budgets [
16].
In this study, considering the mobility and variability of animal movements, we quantitatively assessed the spatial cost rather than the time cost or economic cost to explore migration paths between source patches, through factors of habitat elements, geophysical landscapes, and human disturbance.
Socio-economic data such as population density, local fiscal revenue, and education level of residents can be effectively used to assess the economic cost of a particular region. If specific development goals are combined with a corresponding economic cost, our proposed method can easily be applied to research in other regions at home and abroad.
Since these data are not easy to obtain, we conducted our research on existing data only. Our research results have proven to be in line with local needs and with the promotion of sustainable development in Wuhan. We will conduct a comparative study of Wuhan urban agglomerations.
Author Contributions
Yuhan Tang performed the data collection and analysis, calibrated and validated the model, completed the thesis writing. Xuefei Wu and Chi Gao designed the concept and methodology and revised the manuscript. All authors made contributions to the study and writing of the manuscript. All authors have read and agreed to the published version of the manuscript.
Funding
This work was supported by the Fundamental Research Funds for the Central Universities (grant number 2662018JC042) and the National Natural Science Foundation of China (grant number 31971715).
Acknowledgments
The authors appreciate the valuable comments of the anonymous reviewers and the editors. Thanks to Jing Li for collating the plant community data in Wuhan.
Conflicts of Interest
The authors declare no conflict of interest.
References
- Xu, L.; Chen, S.S.; Xu, Y.; Li, G.; Su, W. Impacts of Land-Use Change on Habitat Quality During 1985–2015 in the Taihu Lake Basin. Sustainability 2019, 11, 3513. [Google Scholar] [CrossRef] [Green Version]
- Mallegowda, P.; Rengaian, G.; Krishnan, J.; Niphadkar, M. Assessing Habitat Quality of Forest-Corridors through Ndvi Analysis in Dry Tropical Forests of South India: Implications for Conservation. Remote Sens. 2015, 7, 1619–1639. [Google Scholar]
- Choi, J.; Lee, S. Application of Habitat Evaluation Procedure with Quantifying the Eco-Corridor in the Process of Environmental Impact Assessment. Int. J. Environ. Res. Public Health 2019, 16, 1437. [Google Scholar] [CrossRef] [PubMed] [Green Version]
- Fábos, J.G.; Ryan, R.L. An Introduction to Greenway Planning around the World. Landsc. Urban Plan. 2006, 76, 1–6. [Google Scholar] [CrossRef]
- Noss, R.F.; Harris, L.D. Nodes, Networks, and Mums—Preserving Diversity at All Scales. Environ. Manag. 1986, 10, 299–309. [Google Scholar] [CrossRef]
- Peng, J.; Zhao, H.; Liu, Y. Urban Ecological Corridors Construction: A Review. Acta Ecol. Sin. 2017, 37, 23–30. [Google Scholar]
- Huang, C.; Huang, P.; Wang, X.; Zhou, Z. Assessment and Optimization of Green Space for Urban Transformation in Resources-Based City—A Case Study of Lengshuijiang City, China. Urban For. Urban Green. 2018, 30, 295–306. [Google Scholar]
- Wei, F.; Costanza, R.; Dai, Q.; Stoeckl, N.; Gu, X.; Farber, S.; Nie, Y.G.; Kubiszewski, I.; Hu, Y.B.; Swaisgood, R.; et al. The Value of Ecosystem Services from Giant Panda Reserves. Curr. Biol. 2018, 28, 2174–2180. [Google Scholar]
- Sharma, R.; Nehren, U.; Rahman, S.; Meyer, M.; Rimal, B.; Aria Seta, G.; Baral, H. Modeling Land Use and Land Cover Changes and Their Effects on Biodiversity in Central Kalimantan, Indonesia. Land 2018, 7, 57. [Google Scholar] [CrossRef] [Green Version]
- Pechanec, V.; Purkyt, J.; Cudlin, P. The Calculation of the Road Zone Effect and Its Impact on Carbon Sequestration in the Landscape. Inform. Geoinform. Remote Sens. 2015, 1, 859–866. [Google Scholar]
- Minor, E.S.; Urban, D.L. A Graph-Theory Frarmework for Evaluating Landscape Connectivity and Conservation Planning. Conserv. Biol. 2008, 22, 297–307. [Google Scholar] [CrossRef] [PubMed]
- Girvetz, E.H.; Greco, S.E. How to Define a Patch: A Spatial Model for Hierarchically Delineating Organism-Specific Habitat Patches. Landsc. Ecol. 2007, 22, 1131–1142. [Google Scholar] [CrossRef]
- Urban, D.L.; Minor, E.S.; Treml, E.A.; Schick, R.S. Graph Models of Habitat Mosaics. Ecol. Lett. 2009, 12, 260–273. [Google Scholar] [CrossRef] [PubMed]
- Pulliam, H.R. Sources, Sinks, and Population Regulation. Am. Nat. 1988, 132, 652–661. [Google Scholar] [CrossRef]
- Teng, M.; Wu, C.; Zhou, Z.; Lord, E.; Zheng, Z. Multipurpose Greenway Planning for Changing Cities: A Framework Integrating Priorities and a Least-Cost Path Model. Landsc. Urban Plan. 2011, 103, 1–14. [Google Scholar] [CrossRef]
- DeMatteo, K.E.; Rinas, M.A.; Zurano, J.P.; Selleski, N.; Schneider, R.G.; Argüelles, C.F. Using Niche-Modelling and Species-Specific Cost Analyses to Determine a Multispecies Corridor in a Fragmented Landscape. PLoS ONE 2017, 12, e0183648. [Google Scholar] [CrossRef] [PubMed] [Green Version]
- Nelson, E.; Mendoza, G.; Regetz, J.; Polasky, S.; Tallis, H.; Cameron, D.; Chan, K.M.A.; Daily, G.C.; Goldstein, J.; Kareiva, P.M.; et al. Modeling Multiple Ecosystem Services, Biodiversity Conservation, Commodity Production, and Tradeoffs at Landscape Scales. Front. Ecol. Environ. 2009, 7, 4–11. [Google Scholar] [CrossRef]
- Riedler, B.; Lang, S. A Spatially Explicit Patch Model of Habitat Quality, Integrating Spatio-Structural Indicators. Ecol. Indic. 2018, 94, 128–141. [Google Scholar] [CrossRef]
- Wei, F.; Zhan, X. Delineating Urban Growth Boundaries with Ecosystem Service Evaluation. Sustainability 2019, 11, 5390. [Google Scholar] [CrossRef] [Green Version]
- Zhao, Z.; Liu, G.; Mou, N.; Xie, Y.; Xu, Z.; Li, Y. Assessment of Carbon Storage and Its Influencing Factors in Qinghai-Tibet Plateau. Sustainability 2018, 10, 1864. [Google Scholar] [CrossRef] [Green Version]
- Spellerberg, I.F. Ecological Effects of Roads and Traffic: A Literature Review. Glob. Ecol. Biogeogr. 1998, 7, 317–333. [Google Scholar] [CrossRef]
- Miao, Z.; Pan, L.; Wang, Q.; Chen, P.; Yan, C.; Liu, L. Research on Urban Ecological Network under the Threat of Road Networks-a Case Study of Wuhan. ISPRS Int. J. Geo-Inf. 2019, 8, 342. [Google Scholar] [CrossRef] [Green Version]
- Berendt, F.; Fortin, M.; Jaeger, D.; Schweier, J. How Climate Change Will Affect Forest Composition and Forest Operations in Baden-Wurttemberg—A Gis-Based Case Study Approach. Forests 2017, 8, 298. [Google Scholar] [CrossRef] [Green Version]
- Means, M.M.; Ahn, C.; Korol, A.R.; Williams, L.D. Carbon Storage Potential by Four Macrophytes as Affected by Planting Diversity in a Created Wetland. J. Environ. Manag. 2016, 165, 133–139. [Google Scholar] [CrossRef]
- Tan, C.; Tang, Y.; Wu, X. Evaluation of the Equity of Urban Park Green Space Based on Population Data Spatialization: A Case Study of a Central Area of Wuhan, China. Sensors 2019, 19, 2929. [Google Scholar] [CrossRef] [PubMed] [Green Version]
- Liu, J.; Kuang, W.; Zhang, Z.; Xu, X.; Qin, Y.; Ning, J.; Zhou, W.C.; Zhang, S.W.; Li, R.D.; Yan, C.Z.; et al. Spatiotemporal Characteristics, Patterns, and Causes of Land-Use Changes in China since the Late 1980s. J. Geogr. Sci. 2014, 24, 195–210. [Google Scholar] [CrossRef]
- Lin, Q.; Mao, J.; Wu, J.; Li, W.; Yang, J. Ecological Security Pattern Analysis Based on Invest and Least-Cost Path Model: A Case Study of Dongguan Water Village. Sustainability 2016, 8, 172. [Google Scholar] [CrossRef] [Green Version]
- Arunyawat, S.; Shrestha, R. Assessing Land Use Change and Its Impact on Ecosystem Services in Northern Thailand. Sustainability 2016, 8, 768. [Google Scholar] [CrossRef] [Green Version]
- Ai, J.; Sun, X.; Feng, L.; Li, Y.; Zhu, X. Analyzing the Spatial Patterns and Drivers of Ecosystem Services in Rapidly Urbanizing Taihu Lake Basin of China. Front. Earth Sci. 2015, 9, 531–545. [Google Scholar] [CrossRef]
- Invest User’s Guide. Stanford University, Stanford, California 94305. Available online: http://releases.naturalcapitalproject.org/invest-userguide/latest/index.html (accessed on 8 December 2019).
- Zhang, Y.; Jia, X.; Lin, J.; Qian, C.; Gao, X.; Ding, S. The Relative Importance of Spatial Scale Variables for Explaning Macroinvertebrate Richness in Different Aquatic Ecological Function Regions. Water 2019, 11, 1550. [Google Scholar] [CrossRef] [Green Version]
- Wu, J.; Zhong, Y.; Deng, J. Assessing and Mapping Forest Landscape Quality in China. Forests 2019, 10, 684. [Google Scholar] [CrossRef] [Green Version]
- Li, Y.; Zhang, L.; Yan, J.; Wang, P.; Hu, N.; Cheng, W.; Fu, B. Mapping the Hotspots and Coldspots of Ecosystem Services in Conservation Priority Setting. J. Geogr. Sci. 2017, 27, 681–696. [Google Scholar] [CrossRef]
- Chang, H.; Li, F.; Li, Z.; Wang, R.; Wang, Y. Urban Landscape Pattern Design from the Viewpoint of Networks: A Case Study of Changzhou City in Southeast China. Ecol. Complex. 2011, 8, 51–59. [Google Scholar] [CrossRef]
- Lee, J.; Ellis, C.; Choi, Y.; You, S.; Chon, J. An Integrated Approach to Mitigation Wetland Site Selection: A Case Study in Gwacheon, Korea. Sustainability 2015, 7, 3386–3413. [Google Scholar] [CrossRef] [Green Version]
- Wei, H.; Fan, W.; Lu, N.; Xu, Z.; Liu, H.; Chen, W.; Sergio, U.; Wang, X.; Dong, X. Integrating Biophysical and Sociocultural Methods for Identifying the Relationships between Ecosystem Services and Land Use Change: Insights from an Oasis Area. Sustainability 2019, 11, 2598. [Google Scholar] [CrossRef] [Green Version]
- Durmaz, A.I.; Ünal, E.Ö.; Aydın, C.C. Automatic Pipeline Route Design with Multi-Criteria Evaluation Based on Least-Cost Path Analysis and Line-Based Cartographic Simplification: A Case Study of the Mus Project in Turkey. ISPRS Int. J. Geo-Inf. 2019, 8, 173. [Google Scholar] [CrossRef] [Green Version]
- Trevathan-Tackett, S.M.; Wessel, C.; Cebrián, J.; Ralph, P.J.; Masqué, P.; Macreadie, P.I. Effects of Small-Scale, Shading-Induced Seagrass Loss on Blue Carbon Storage: Implications for Management of Degraded Seagrass Ecosystems. J. Appl. Ecol. 2018, 55, 1351–1359. [Google Scholar] [CrossRef]
- Foltête, J.C.; Berthier, K.; Cosson, J.F. Cost Distance Defined by a Topological Function of Landscape. Ecol. Model. 2008, 210, 104–114. [Google Scholar] [CrossRef]
- Jepsen, J.U.; Baveco, J.M.; Topping, C.J.; Verboom, J.; Vos, C.C. Evaluating the Effect of Corridors and Landscape Heterogeneity on Dispersal Probability: A Comparison of Three Spatially Explicit Modelling Approaches. Ecol. Model. 2005, 181, 445–459. [Google Scholar] [CrossRef]
- Castro, J.; Zamora, R.; Hódar, J.A.; Gómez, J.M. Seedling Establishment of a Boreal Tree Species (Pinus Sylvestris) at Its Southernmost Distribution Limit: Consequences of Being in a Marginal Mediterranean Habitat. J. Ecol. 2004, 92, 266–277. [Google Scholar] [CrossRef]
- Neumann, C.; Weiss, G.; Schmidtlein, S.; Itzerott, S.; Lausch, A.; Doktor, D.; Brell, M. Gradient-Based Assessment of Habitat Quality for Spectral Ecosystem Monitoring. Remote Sens. 2015, 7, 2871–2898. [Google Scholar] [CrossRef] [Green Version]
- Xie, Z.; Ye, X.; Zheng, Z.; Li, D.; Sun, L.; Li, R.; Benya, S. Modeling Polycentric Urbanization Using Multisource Big Geospatial Data. Remote Sens. 2019, 11, 310. [Google Scholar] [CrossRef] [Green Version]
© 2020 by the authors. Licensee MDPI, Basel, Switzerland. This article is an open access article distributed under the terms and conditions of the Creative Commons Attribution (CC BY) license (http://creativecommons.org/licenses/by/4.0/).


