1. Introduction
Thanks to the development of increasingly meaningful monitoring technologies and sensors, the scientific community is undergoing a data-rich period with respect to the Earth’s surface. Nowadays, the amount of monitoring network acquisitions, both in-situ and by remote sensing techniques, is constantly increasing [
1,
2]. Recently, a lot of web approaches for monitoring measurements analysis and dissemination have been developed [
3,
4,
5] jointly as new tools for the effective management of huge archives of multisource data [
6]. In addition, the high availability of satellite images from different sensors (e.g., ERS-1/2, Envisat ASAR, RADARSAT) and the latest free images of the ESA’s constellation (i.e., Sentinel-1A, 1B), have significantly enlarged the surface information, both in space and time. From the processing and the analysis of geospatial data (GD) and surface information, new archives of multisource data are created, specifically in the framework of scientific projects to support environmental and climatic data sharing [
7,
8,
9], project results management and visualization, all applied to natural hazard risk management.
The development of large archives of multisource data is functional to the investigation of geo-hydrological processes’ evolution over time [
10]. With this purpose, the integration of GD and ground deformation measurements, derived from remote sensing and in-situ acquisitions, has become necessary. However, only the memorization of data does not meet all the needs and expectations of the different stakeholders in terms of data access, retrieval, investigation, visualization and analysis.
Web service technologies, as the spatial data infrastructures (SDIs), enable the scientific community to set up large and heterogeneous data infrastructures, developing reliable methods of representing and mapping information [
11,
12,
13]. SDIs are useful to implement a framework of geographic data and metadata, constituting an efficient and flexible way to discover and manage geospatial information. Moreover, SDIs are able to reply to the increasing demand for processing geospatial information and discovering of knowledge, for both scientists (e.g., researches, social scientist, geographers) and all the other stakeholders (e.g., government institutions, public authorities, citizens).
To cope with the interoperability management of heterogeneous GD-integrating sensors, instrumental data and geographic information, the SDI must agree with well-known standards like the ones sponsored by the Open Geospatial Consortium (OGC). This demand finds a useful answer in new technologies, especially with the development of web services structured according standard protocols that guarantee a simple access to the whole scientific community and all stakeholders.
The GeoNetwork open-source software (
https://geonetwork-opensource.org/) entirely fulfils the requirements previously described, using the principles of free and open-source software (FOSS) and international standards about services and protocols (International Organization for Standardization Technical Commission, ISO/TC211 and the OGC). This platform implements both a portal and a database, referring to an SDI defined in the “OGC Reference Architecture”. GeoNetwork provides an easy to use web interface to manage different resources at the same time, by ensuring the spatial exchanges and sharing, managing and publishing metadata and spatial data. This system allows data querying using a huge volume of metadata from different environments and provides a web-based interactive map viewer. Moreover, using this software allows anyone to independently discover and exploit the dataset, without any intermediary. Concerning huge information in terms of number of test sites, number of sensors, instruments and relative measurements, an interesting approach, easily integrable with the GeoNetwork, is represented by deep-learning approaches and convolution neural networks (CNNs), in particular related to landslides and slope failure detection [
14].
Inside the NextData Project (
http://www.nextdataproject.it/) framework, an Italian project of National Research Council for retrieval, storage, access and diffusion of environmental and climatic data, a special project named HAMMER (relationsHips between meteo-climAtic paraMeters and ground surface deformation time sEries in mountain enviRonments) was developed. The main objective of this special project was to promote the collection and implementation of a long-term series of ground deformations, focusing on high mountain regions spread over different physiographic and climatic environments. In this framework, time series acquisition and reconstruction have been realized by applying both traditional field monitoring techniques, obtaining short-term surface movements with high accuracy, and differential interferometry with synthetic aperture radar (DInSAR) techniques [
15,
16,
17], ensuring wide-area coverage (e.g., thousands of km
2), with a monthly temporal sampling.
The possibility of obtaining a long-term series of deformation relevant to several geo-hydrological processes in different physiographic and climatic regions may open the possibility of understanding the complex and largely unknown relationships between climate and its variation [
18,
19,
20]. A more effective combination and integration of DInSAR and in-situ measurements can be considered a convenient approach to analyze different phenomena at different spatial (regional, local) and temporal (months/weeks, days/hours) resolutions. The collection and organization of multisource data of surface deformations is a key element in finding eventual relationships between meteorological and climatic variables and slope instabilities over time.
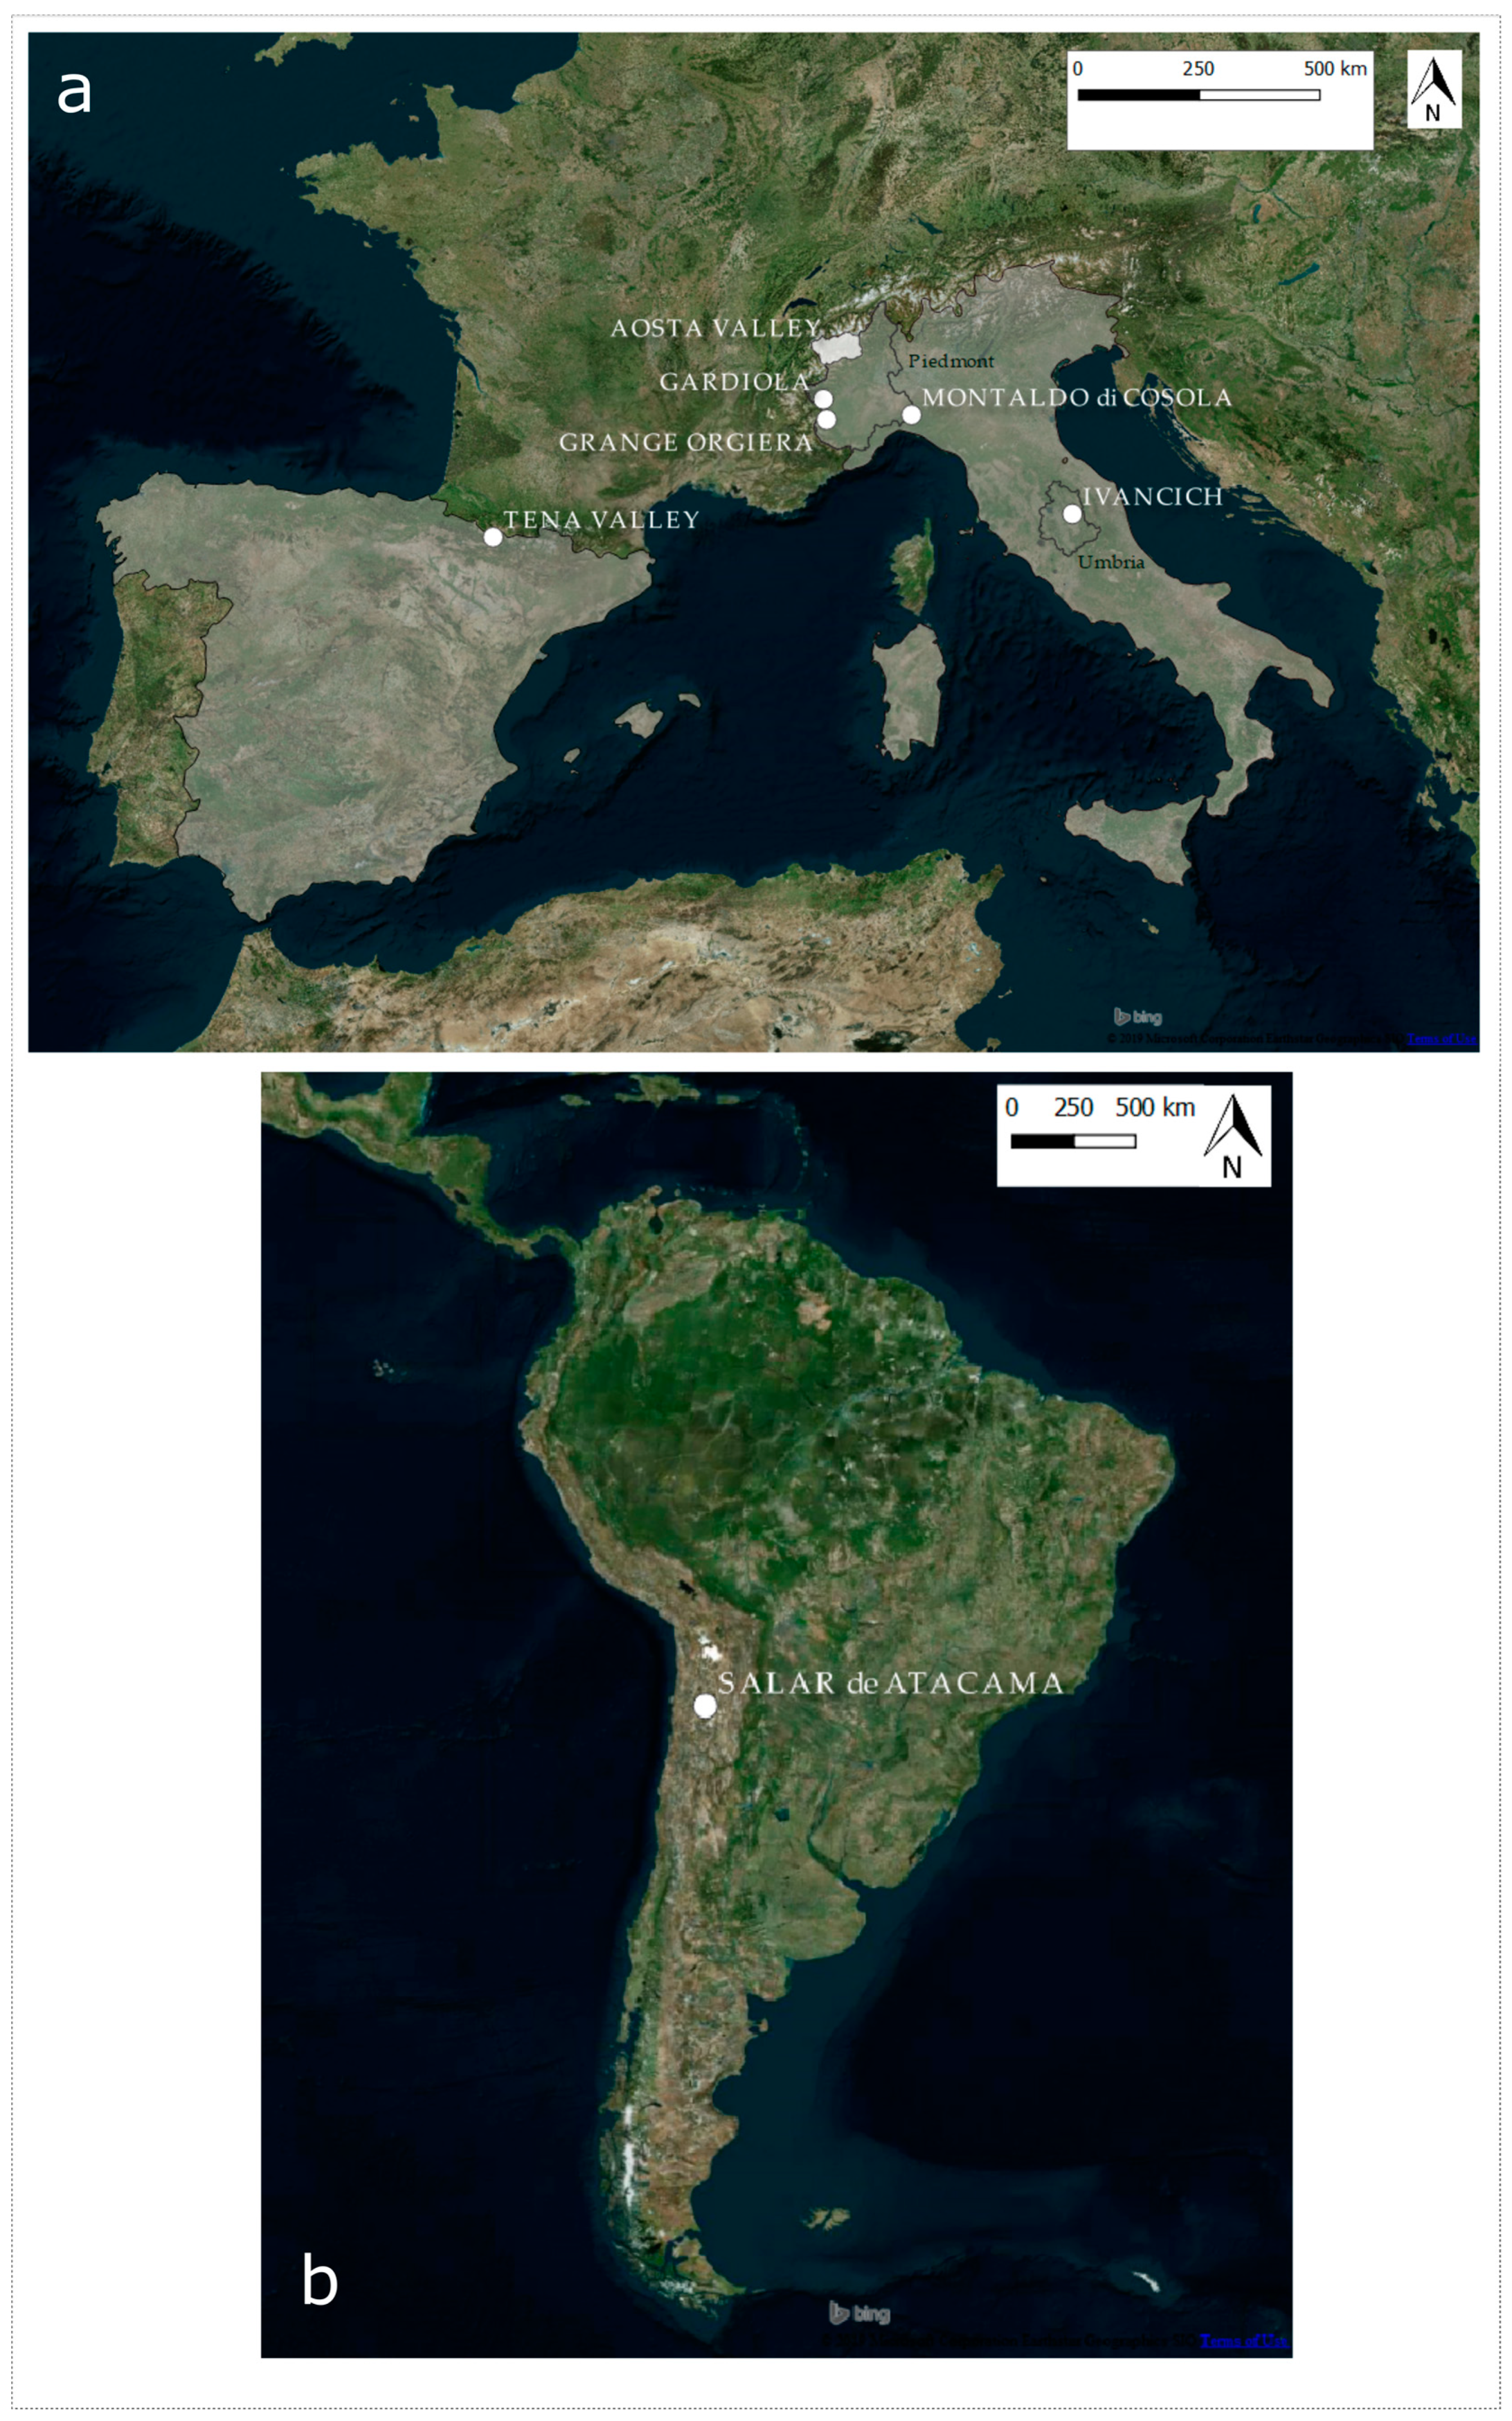
In large projects, such as NextData, the use of a dedicated GeoNetwork suits well with the integration of several subprojects, and becomes useful for the integration of different types of data. In our proposal, we focused on the implementation of the SDI dedicated for the HAMMER sub-project (H-SDI), adopting, among other software, the GeoNetwork platform predisposed for the main project. The H-SDI includes multisource data of mountainous regions and has been implemented in order to share, manage and disseminate all the acquired knowledge and information. Such SDI not only provides the postprocessed ground deformation time-series, but also the raw data from monitoring network measurements of specific landslides, carried out by expert geologists and engineers, and remote sensing data from satellite surveys. Seven study areas have been considered: five located in Italy (Western Alps and Northern and Central Apennines), one located in the Spanish Pyrenees and other one in the Atacama Desert (Chile).
The main aim of this paper is to show the structure developed for the management and sharing of monitoring data of active geomorphological processes. The paper also points out the functionalities of the GeoNetwork system as a tool for geospatial data and metadata organization and standardization inside the project. Moreover, we briefly present the selected study areas and the relative multisource data collected within the project. Then, we discuss the adoption of a dedicated GeoNetwork to manage and share the metadata and geospatial data, illustrating the hierarchical architecture of the heterogeneous information and time series of the different test sites. After that, we show a brief presentation of the web-interface and its potentials while, in the final section, we focus on the exploitation of the web-interface and the employment of the obtained results.
2. Data Collection
The generation of GD suitable for publishing and linked with descriptive information (i.e., metadata) arises from the need to collect and organize the results of the HAMMER project. This project focuses on the collection and generation of ground deformation time-series of several geo-hydrological processes located in high-mountain regions, in different geographic and physiographic settings, as a key issue for the correct analysis of slope hazards.
Little is known on the effects of environmental and climate changes on the frequency and the intensity of landslides [
20,
21]. Taking advantage of ground deformation time-series, as long as possible, derived from multisource instruments or sensors, we can analyze the eventual changes in deformation trends, useful to assess landslide behavior over time. This should also support effective ways of land use, planning and risk management. According to this purpose, an SDI was designed to incorporate and integrate multisource data from some settlements distributed in high mountain regions. The types of data source can be summarized in two main groups, based upon the instrument or sensor employed for the time series production:
In-situ: surface and sub-surface instruments providing ground deformation time-series with very high temporal sampling (e.g., hourly/daily), suited for local scale analysis, eventually with early warning purposes;
Satellite: active space sensors above Earth collecting synthetic aperture radar (SAR) images exploited by the DInSAR techniques, like PSInSAR [
15] or SBAS [
16], to obtain ground displacement time series with monthly temporal sampling and regional scale analysis of surface displacement.
Data collection and time series reconstruction refers to the seven study areas of the project.
Figure 1 shows the areas of interest (AOI) distribution, while
Table 1 summarizes some information of the selected areas. For each AOI, we specify the type of slope instability threatening the area, the instruments and/or sensors employed to ground deformation time-series acquisition, the corresponding acquisition time and the institution who acquires and processes the surface measurements. All these metadata are stored into the GeoNetwork.
3. Infrastructure Design
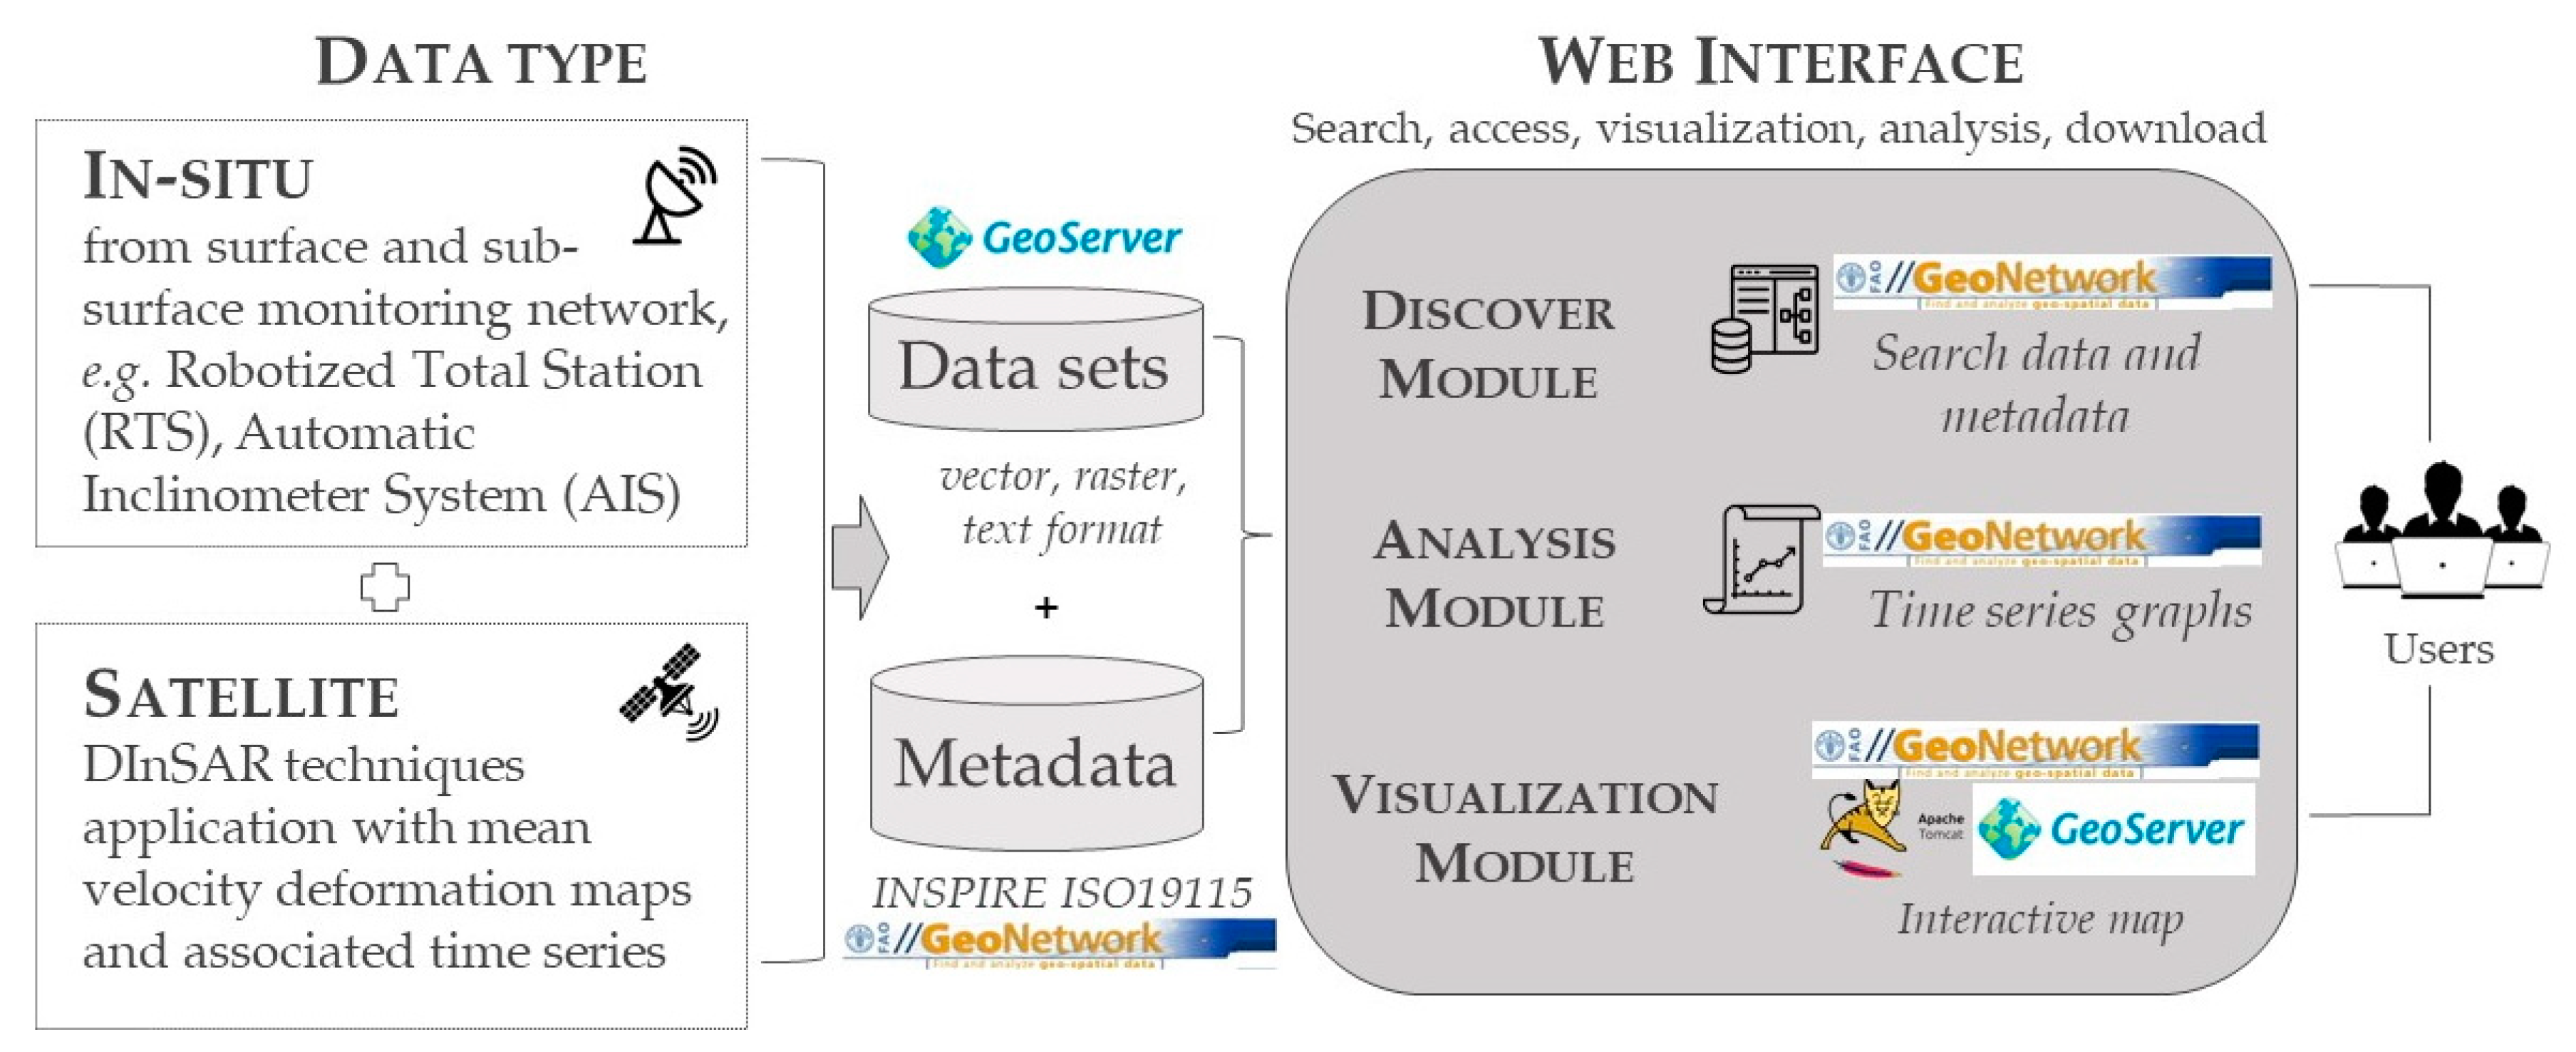
The requirement of managing different data formats (e.g., vector, raster, text), visualizing time series information derived from multisource instruments or sensors, querying the catalogue and portraying the data on a map made the implementation of a cataloguing system necessary. By using a geospatial catalogue service, we structured a web-based metainformation repository with a web-interface to advertise and query the available geospatial data. The H-SDI is managed and integrated in an open-source software like the previously cited GeoNetwork supported by a dedicated GeoServer.
Figure 2 sketches the different data types stored in the GeoNetwork/GeoServer structure and the web-interface facility.
GeoNetwork is a software for the management of geographic datasets, jointly developed between the Food and Agriculture Organization of the United Nations (FAO), the United Nations World Food Program (WFP) and the United Nations Environment Program (UNEP) in 2001 [
26]. It provides an easy-to-use web interface that allows managing different resources at the same time by ensuring the spatial information exchange and sharing. It offers metadata editing and search functions, in addition to a web viewer of georeferenced maps, highly suitable to SDI implementation. The GeoNetwork has been implemented to allow the shared access to data, supporting the communities that deal with geographic datasets through a modern distributed architecture that is both powerful and cheap. It is as a catalogue of metadata, indexing different geo-services and spatially referenced resources hosted by different societies. Using this free software (distributed with GPL license) it is possible to improve data access, integrate different spatial data and easily share geographically referenced thematic information between different organizations, since it is a catalog of location-oriented information. The GeoNetwork architecture and protocols are based on standards, offering a spatial information management environment designed to enable access to georeferenced datasets, cartographic products and related metadata from a variety of sources, using the capabilities of Internet. Using standard protocols (e.g., OGC CSW, OAI-PMH, OpenSearch, Z39.50, RDF), it both accesses remote catalogs and makes its data available to other catalog services, completely embracing the five star principles proposed by Tim Berner Lee for Linked Open Data (
https://www.w3.org/DesignIssues/LinkedData.html), even if you can also choose to use it as a stand-alone product. GeoNetwork is a cross-platform software that works on any server that is able to run a Java web container (e.g., Tomcat, JBoss) since it is distributed in a WAR (Web Application aRchives) file, making it completely independent from the operating system. Main advantages of using this software, in addition to the previously cited standardization of formats, are that the GeoNetwork could be seen as a single point of access to all georeferenced data. Several related tools are packaged with GeoNetwork, including GeoServer, which is normally associated to the GeoNetwork platform in order to store the data and to create an SDI. The GeoServer is a web mapping server for the dissemination of GD. GeoServer is a FOSS server written entirely in Java that allows users to store, view and edit geospatial data. Designed for interoperability, it publishes data from any major spatial data source using open standards. With GeoServer, it is possible to display spatial information using the Internet. Implementing the Web Map Service (WMS) [
27] standard (or even its extension with time series support, WMS-T), GeoServer can create maps in many output formats. OpenLayers, a free mapping library, is integrated into GeoServer, making map generation quick and easy. GeoServer also conforms to the Web Feature Service (WFS) [
28] standard, which permits the actual sharing and editing of the data that is used to generate the maps, letting others to incorporate your data into their website and applications with greater transparency. Among other standard protocols, it also supports Web Coverage Service (WCS) [
29], Web Processing Service (WPS) and Catalog Services for the Web (CSW), just to cite main ones. In our project, GeoServer could be thought of as a store for the raw data, with accurate publishing and visualization features, while the GeoNetwork can be seen as a catalogue that helps understanding the information stored and presented by the GeoServer.
4. Dataset Component
To analyze the landslide behavior of the AOI, we employed a wide spectrum of in-situ and remote sensing instruments and sensors to monitor surface and deep-seated deformation of the considered active geomorphological processes.
Generally, the short-term analysis of surface movements is obtained through quantitative or semiquantitative analysis of three-dimensional topographic data and high accuracy measurements, obtained by exploiting different monitoring techniques. The analysis of surface movements is primarily carried out by traditional field monitoring systems: (i) robotized total station (RTS) [
30]; (ii) global navigation satellite system (GNSS) [
31]; (iii) extensometer [
32]; (iv) inclinometer [
33]. All these instruments provide measurements with high temporal sampling (daily/hourly), useful for the reconstruction of the evolution of single phenomena over time [
24].
Alongside, remote sensing techniques such as DInSAR [
15,
16,
17] are used to process the huge archive of SAR images continuously acquired by radar satellites constellation (e.g., ERS-1/2, Envisat ASAR, Radarsat). The most recent constellations (e.g., Cosmo-SkyMed, Sentinel-1A and Sentinel-1B) also improve capabilities in terms of resolution and revisit time. The application of these techniques allows obtaining a wide-area coverage (thousands of km
2) and millimetric-accuracy time series.
The in-situ GD are mainly vector and text files, consisting of monitoring network information relative to specific activation and/or reactivation of a landslide, acquired by expert researchers of the National Research Council of Italy. Time series are characterized by limited temporal acquisition, usually during the emergency phases, with high temporal sampling and high accuracy, provided in comma-separated values (CSV) format.
The satellite GD products are both raster and vector files, consisting of mean velocity deformation maps, with distinct spatial and temporal resolution derived from the adopted radar sensors. The data source varies from internal data and previous project results to a fresh SAR data processing, taking advantage of the ESA G-POS free service [
25] based on the parallel-SBAS technique [
34]. The derived time series have monthly sampling and a precision of few millimeters, always provided in CSV format.
5. Data and Metadata Hierarchical Structure
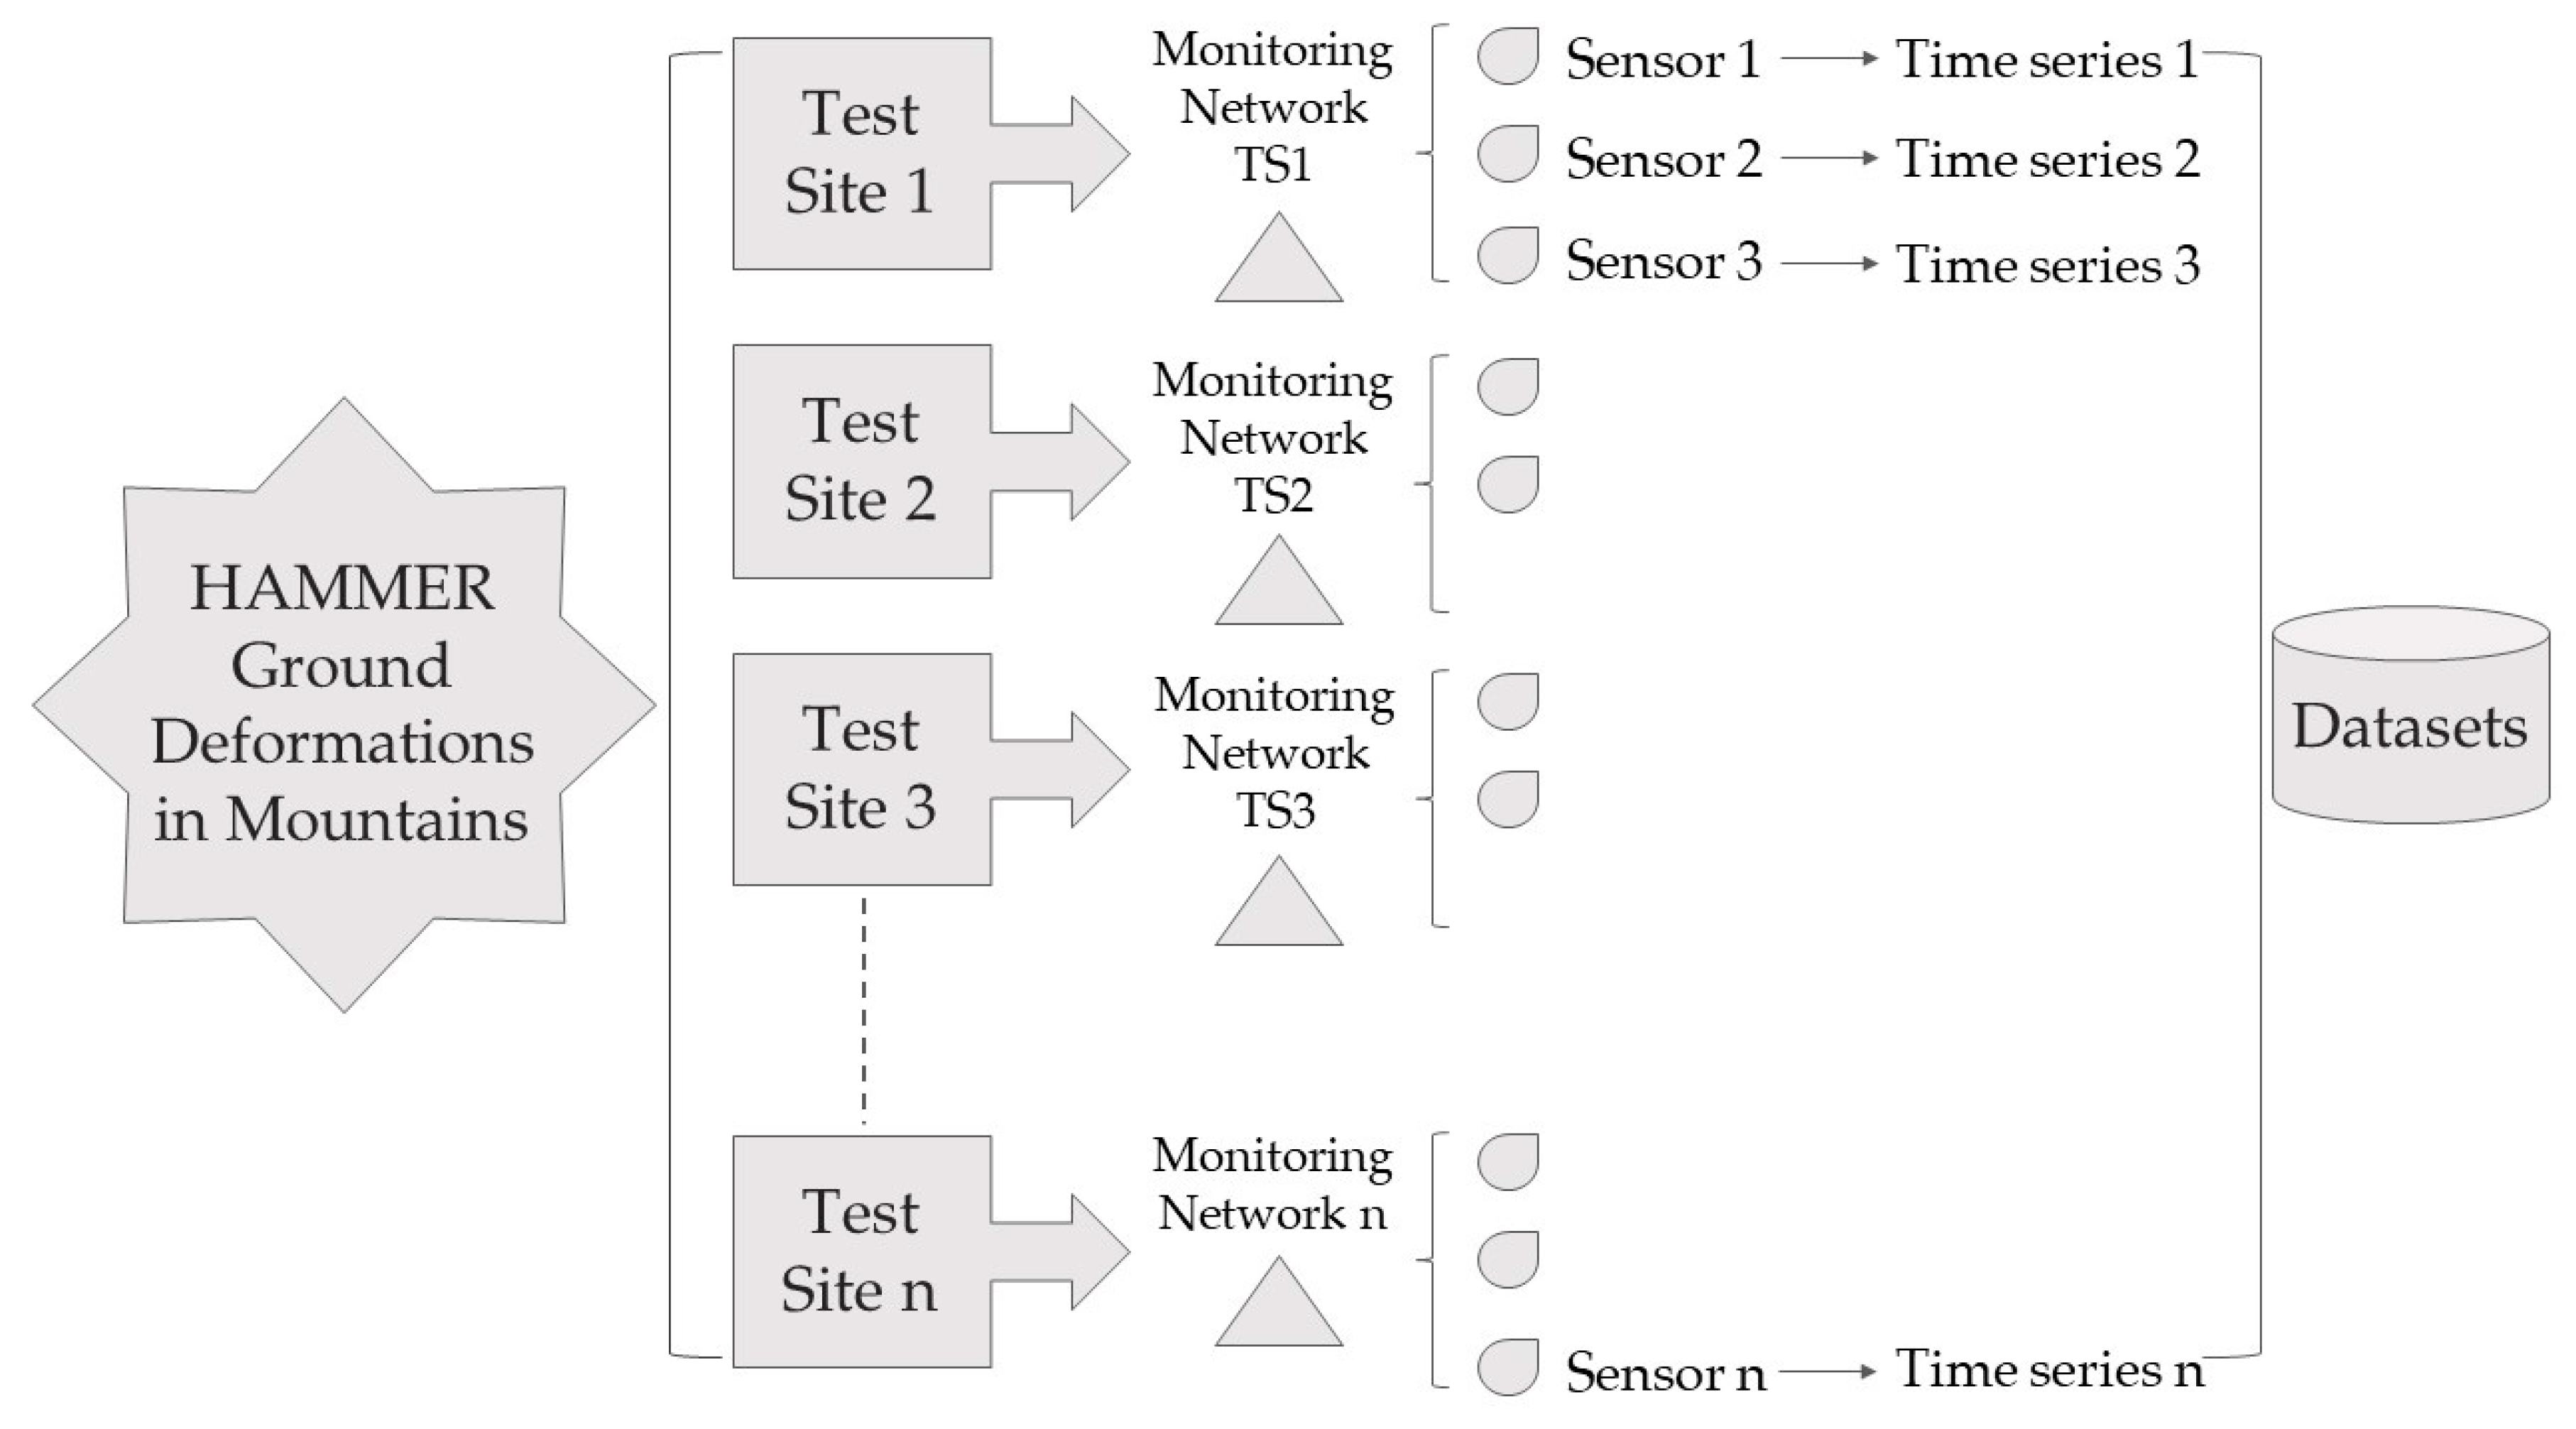
All the data hosted in the dataset are associated with semi-automatically-compiled metadata. In order to join different phenomena distributed in mountainous regions in the world that include multisensor acquisitions from multiple sources, a structural metadata archive is implemented. A hierarchical structure is developed, where any element of the chain depends on the element from which it derives. This dependency is based on a logical link named “Parent/Child” link (
Figure 3). All information always follows the same logical sequence:
This means that, frequently, in the first two levels of the structure we have mainly metadata (information on the site and the sensors adopted) and only some time we have raw data (i.e., a shape file of the full site) while, in the last layer, we have always both data and metadata (i.e., time series and information on them).
Besides the hierarchical structure, metadata uses a specific format that has to be filled in. The metadata format is made of specific fields like abstract, keywords, purposes, constraints on data, lineage and responsibility (creator, point of contact, distributor). In order to validate the metadata published in the GeoNetwork catalogue, the metadata follow the ISO19115 standard (INfrastructure for SPatial InfoRmation in Europe—INSPIRE directives). Throughout the time, updates are possible if metadata are modified or new data are added.
6. H-SDI GeoNetwork Web Interface
The implemented H-SDI in GeoNetwork consists of three main services, all obtained exploiting native features of the platform:
This interface guarantees an open data format that is freely and widely available to the scientific community and to any users. The dissemination data are published using a standard format, such as CSV and TXT files while, for the geospatial vector data, the use of shape format (e.g., SHP, SHX or DBF) is recommended. This is very useful to exploit and visualize data in a geographic information system (GIS), for the data publication in a web mapping software and/or for sharing it using web services (WMS, WFS and WCS).
6.1. Data Querying Service
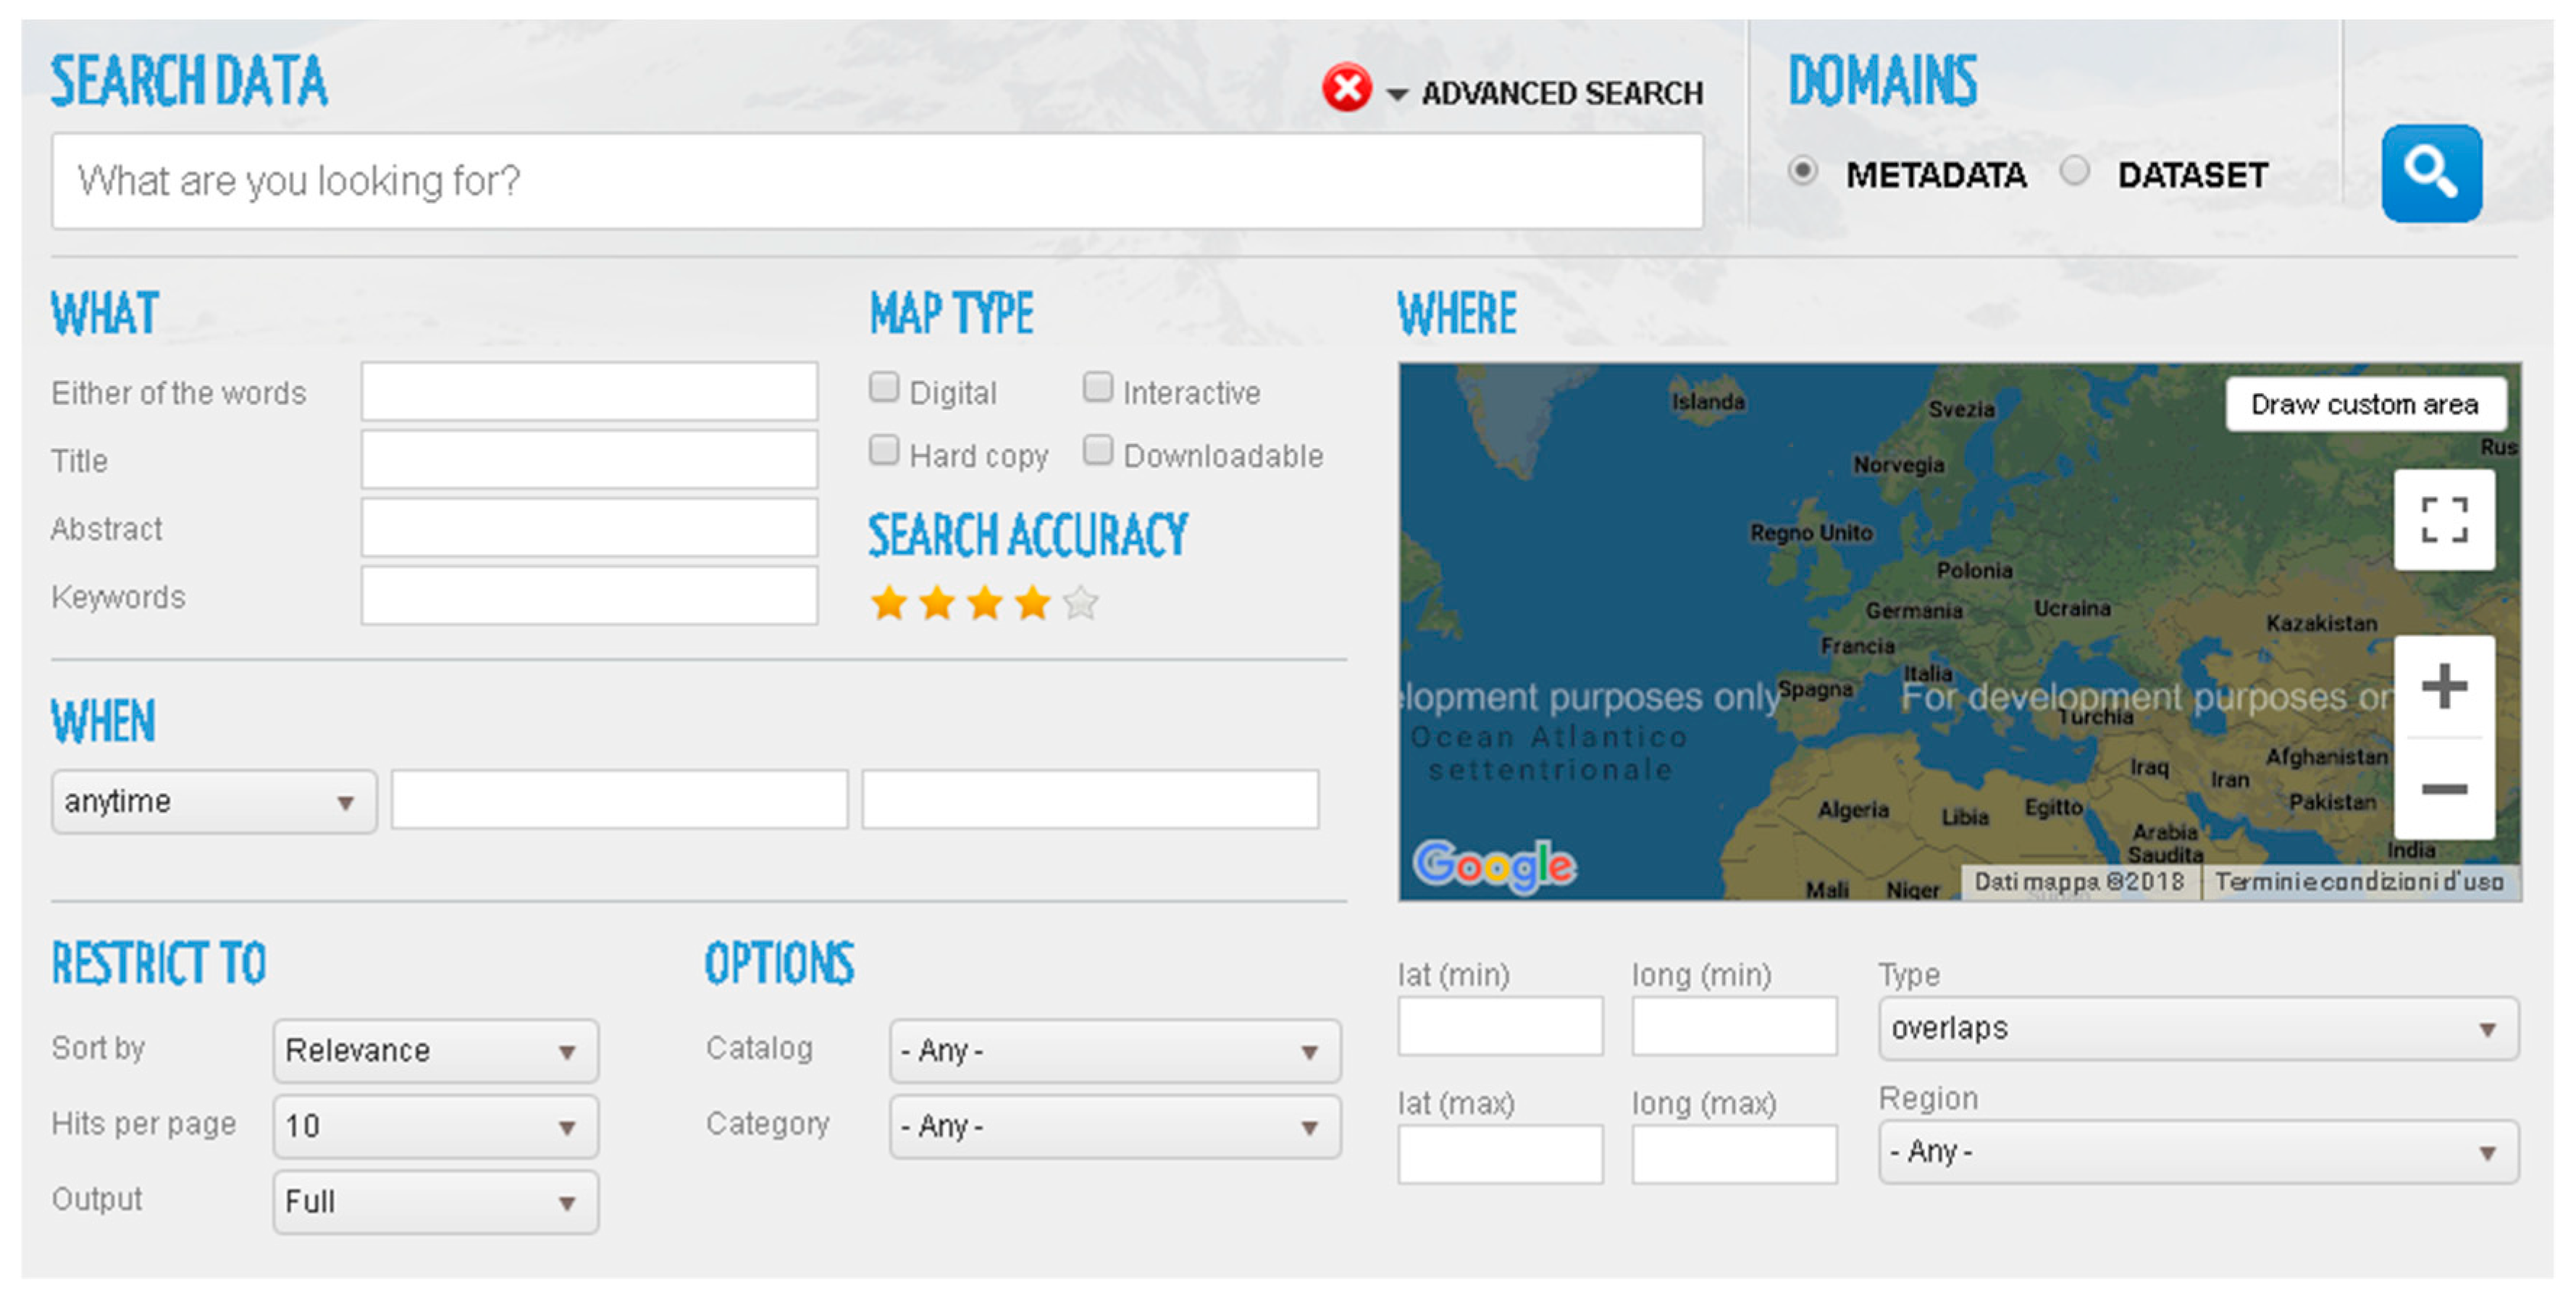
An advanced system of data querying allows users to access information through multivariable queries. The data search is divided in two principal domains “Metadata” and “Dataset”. Choosing the metadata domain, the user can query the metadata available for the collected data and measures relative to mountainous regions selected (
Figure 4). This selection can be done based on different criteria such as keywords, title, geographic coordinated, time and so on, showing the data location on an interactive map.
Choosing the dataset domain, instead, the interface has a sequential activation of the fields, starting from the selection in the “Dataset” field, followed by “Data provider”, “Location”, “Parameter” and “Reference time”, guiding the user in the data selection based upon spatial and temporal criteria. Three possible output of the data search are available: (i) table; (ii) plot; (iii) CSV file. Therefore, the user can obtain results in tabular and graphical format, choosing site, instrument and time period.
6.2. Data Analysis Service
The GeoNetwork web interface gives the opportunity to the users to analyze and acquire collected data from the H-SDI. As we said previously, two distinct domains for visualizing and analyzing the dataset are available: (i) dataset and (ii) metadata of dataset. Both domains are linked to the web mapping features offered by GeoServer to visualize vector and raster data in WMS format.
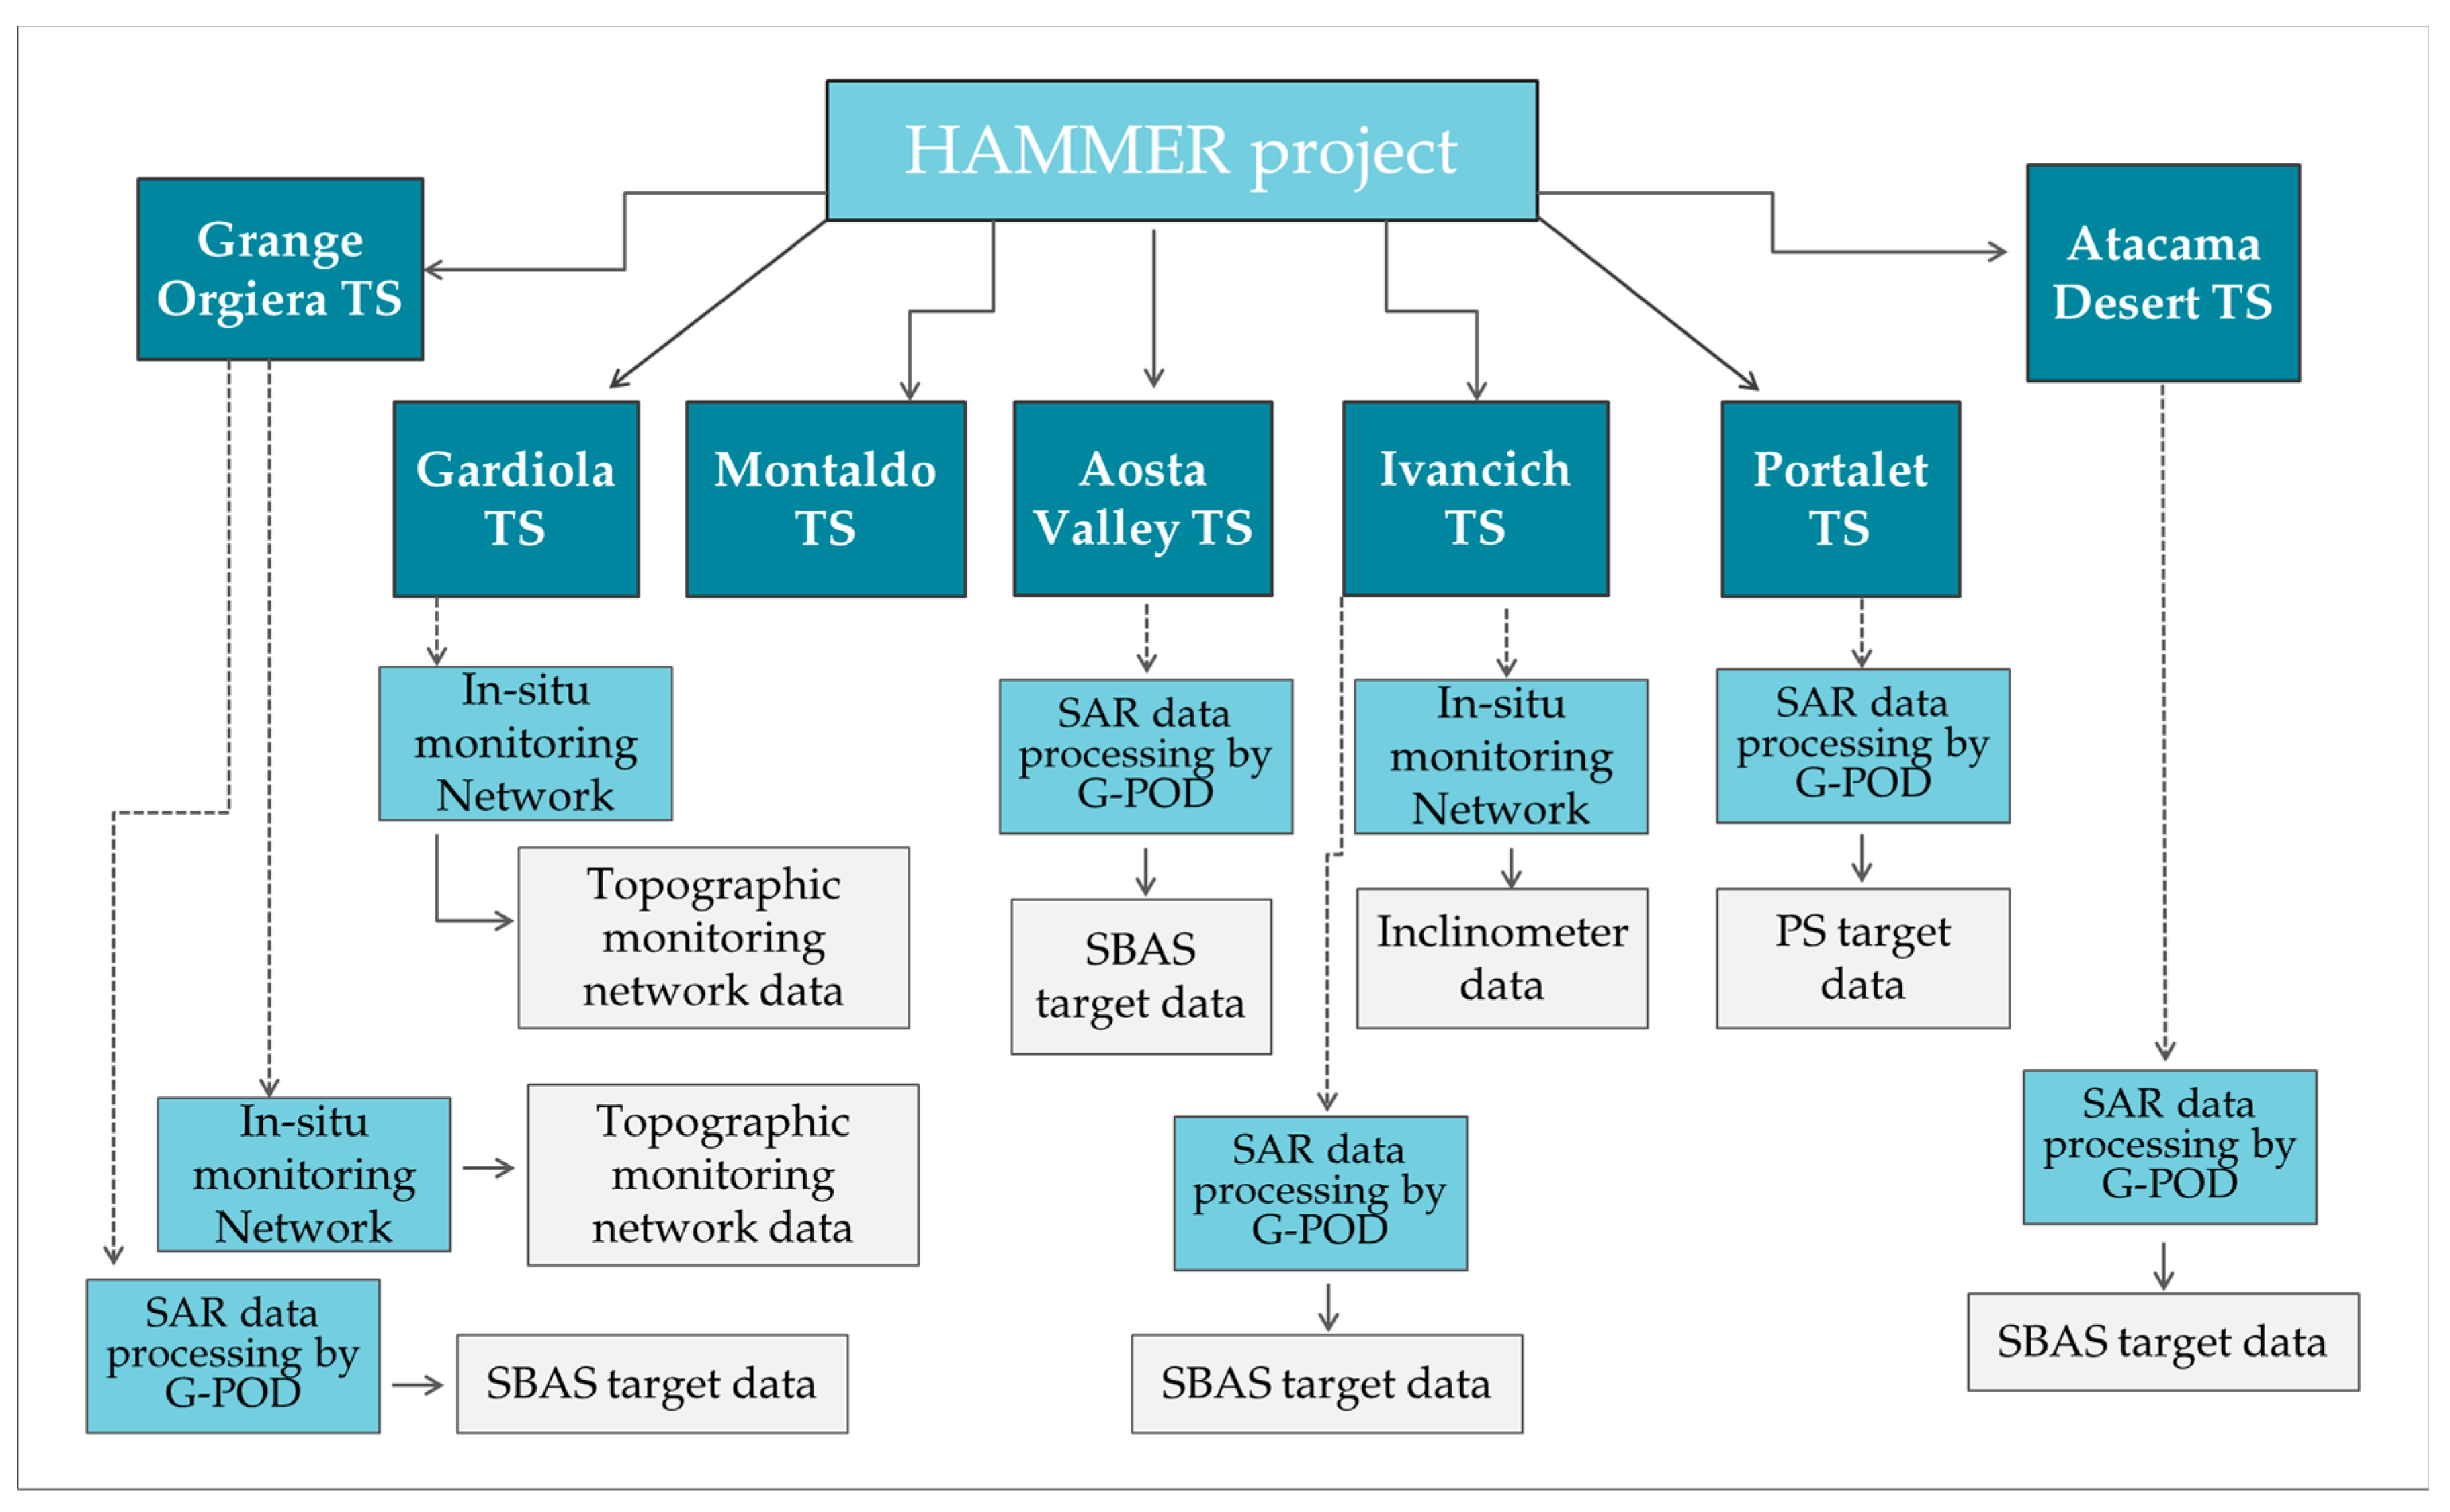
The information we manage in out H-SDI is about seven different study areas distributed in mountain regions (see
Table 1). The majority of the test sites focus on landslides affecting urban areas in the Alpines, Apennines and Pyrenees chains. Only in the case of the Salar de Atacama, the uplift in correspondence of the Salars has been analyzed.
In the Italian test sites (see
Table 1), the observation instrumentation includes an in-situ monitoring network, used in the past by the CNR IRPI in the framework of other scientific projects. The monitoring networks include the Grange Orgiera and Gardiola topographic network (RTS) [
22,
23], the Montaldo di Cosola automated inclinometer system (AIS) [
24] and the Ivancich inclinometer system [
18]. The instruments aim to characterize the slope instability of the study area, generating ground deformation time-series for a limited time span. Based upon the employed instruments, the time series have a different structure.
Usually, the topographic network time-series reports, for each prism of the network, the east, north and elevation coordinates and the differential and total displacement, with an hourly/daily acquisition range.
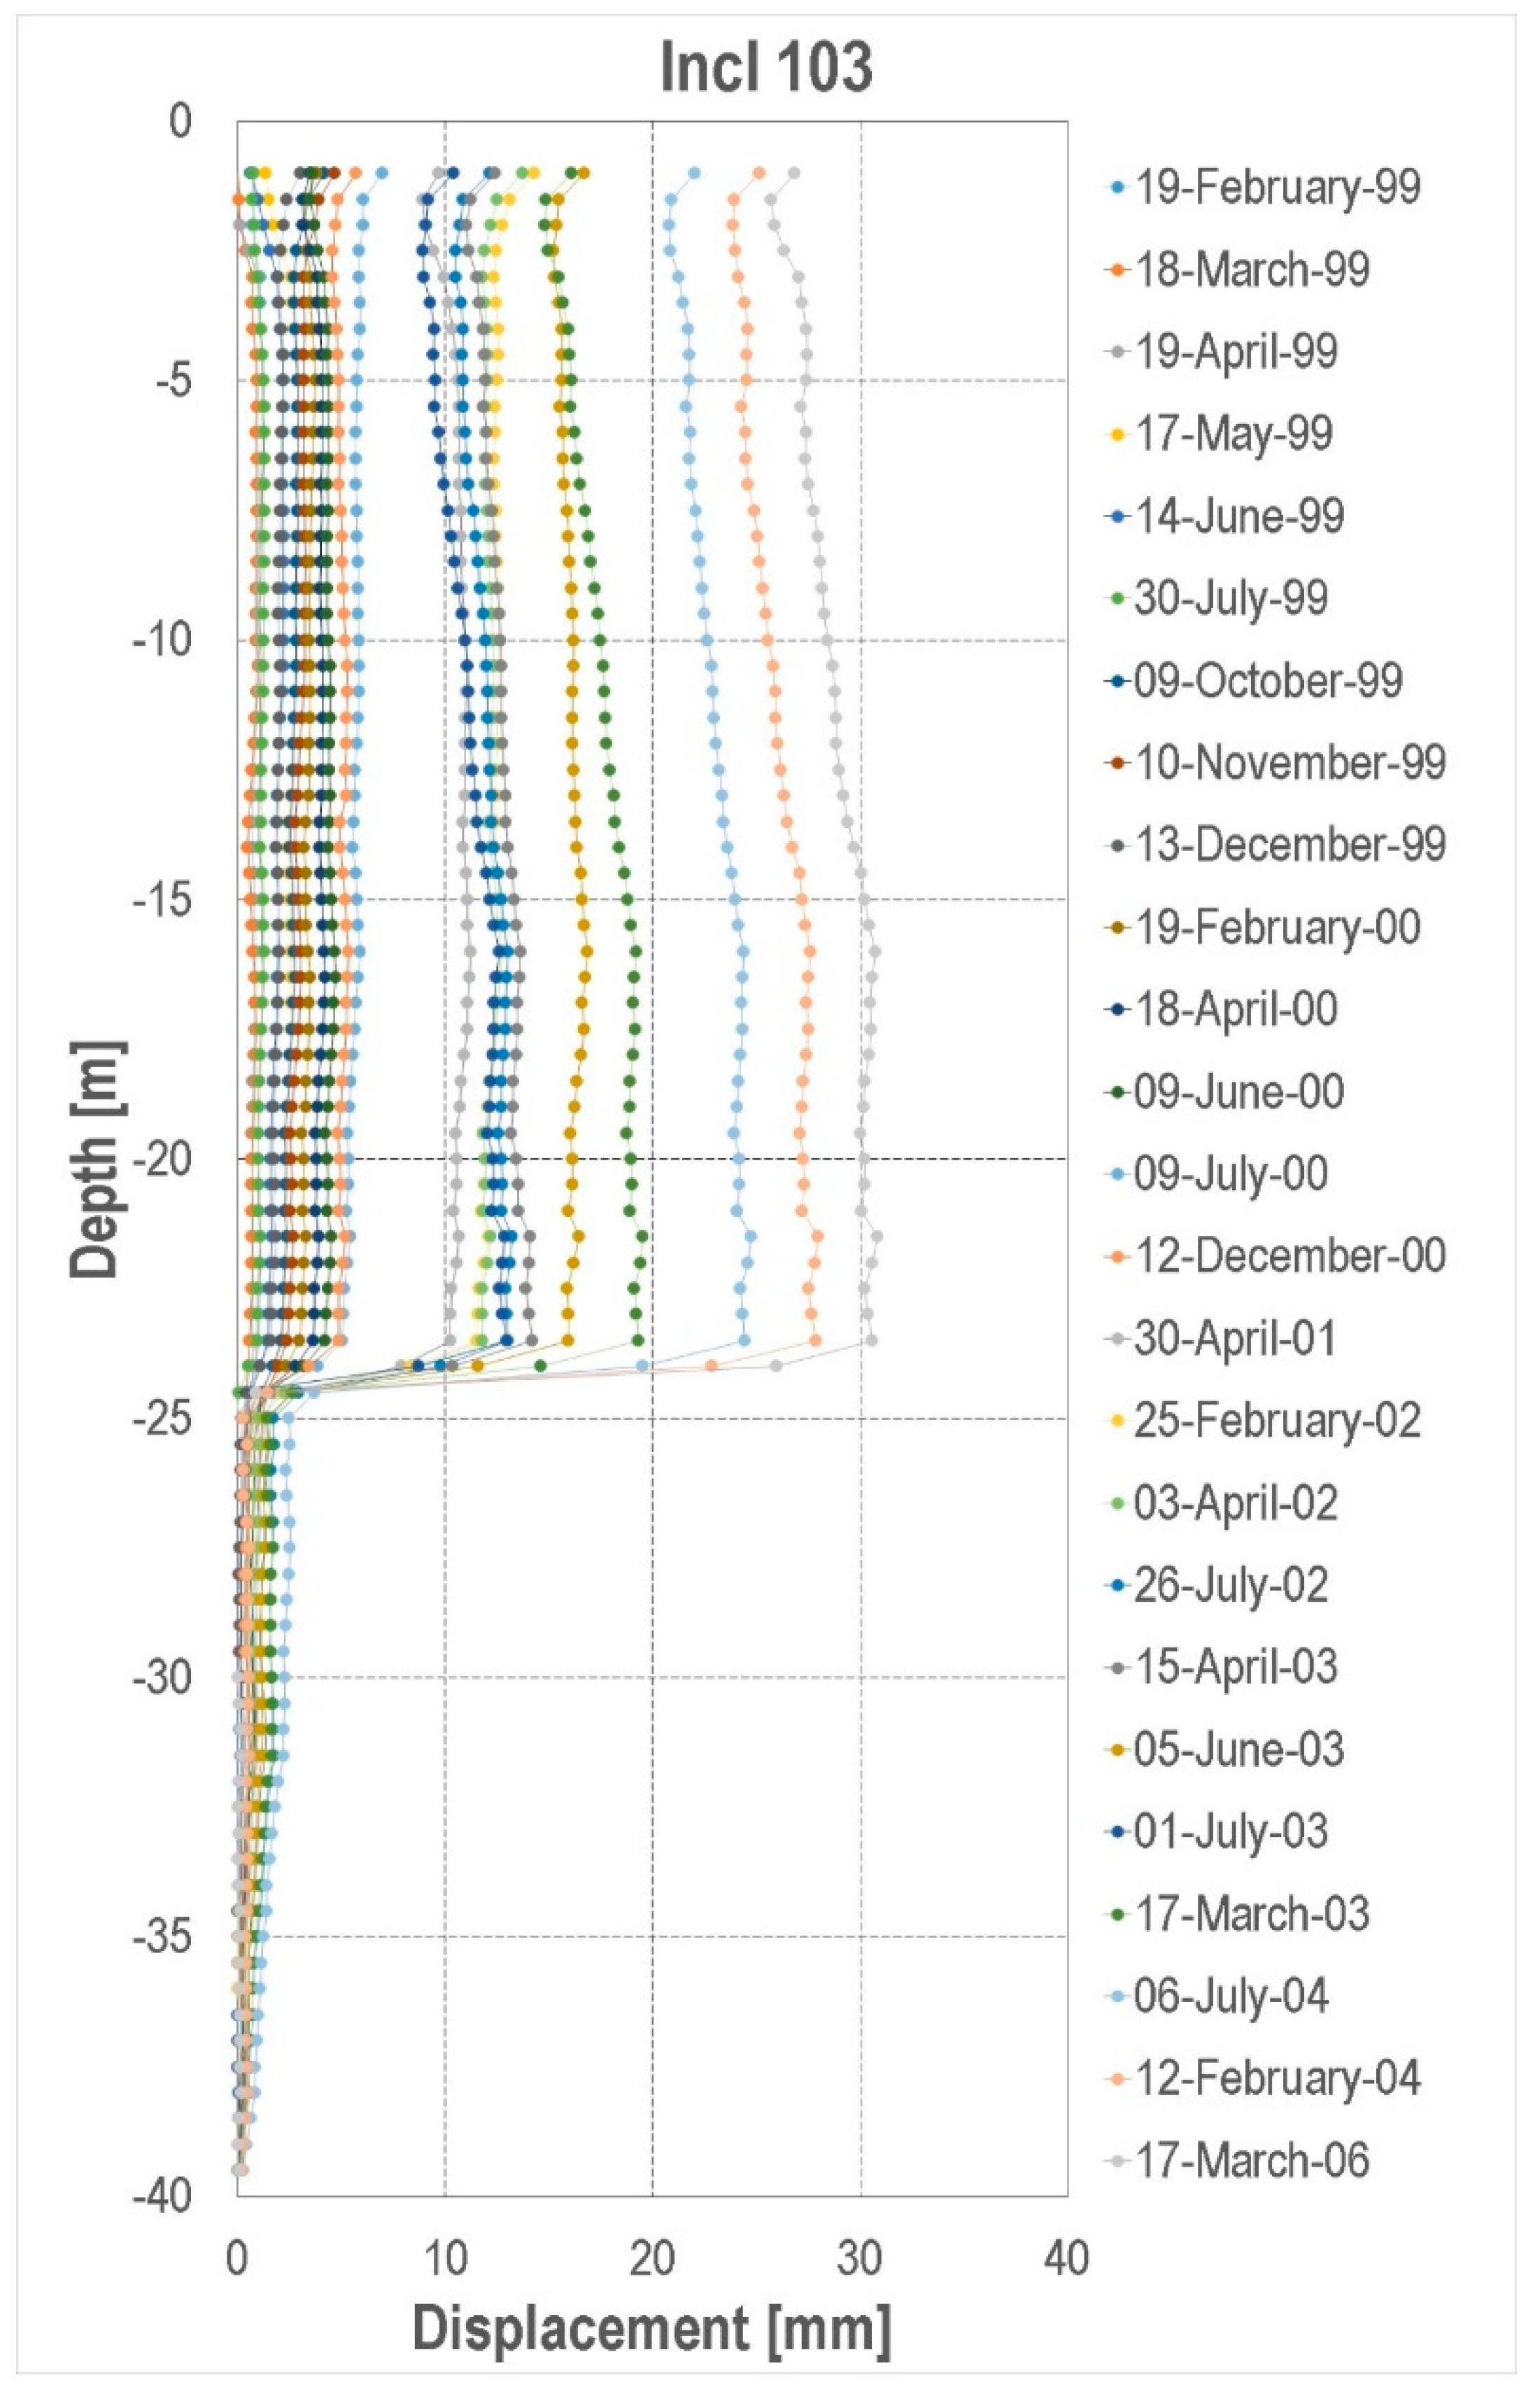
Inclinometers probe tilt for two orthogonal axes conventionally named “A” and “B”. In particular, they read a measure corresponding to the axes inclination (θ), returning the graph of the cumulative displacement computed by the sum of the incremental displacements.
Figure 5 shows an example of inclinometer data representation, relative to one of the Ivancich inclinometers’ cumulative displacement [
18].
In the case of SAR data, several satellites have been considered, including ERS-1/2, Envisat ASAR and Cosmo-SkyMed. The output of SAR data processing, in addition to the ground deformation time-series, also includes other information, such as: (i) geocoded coordinates; (ii) coherence; (iii) mean velocity; and (iv) standard deviation. Several SAR data were already available from previous projects, as in the case of the Pyrenees and Central Apennines test sites. Instead, in the Salar de Atacama, Grange Orgiera and Aosta Valley Region case studies, new SAR data-processing has been carried out from scratch, taking advantage of the ESA G-POD service [
25,
36], based on the parallel-SBAS chain [
34].
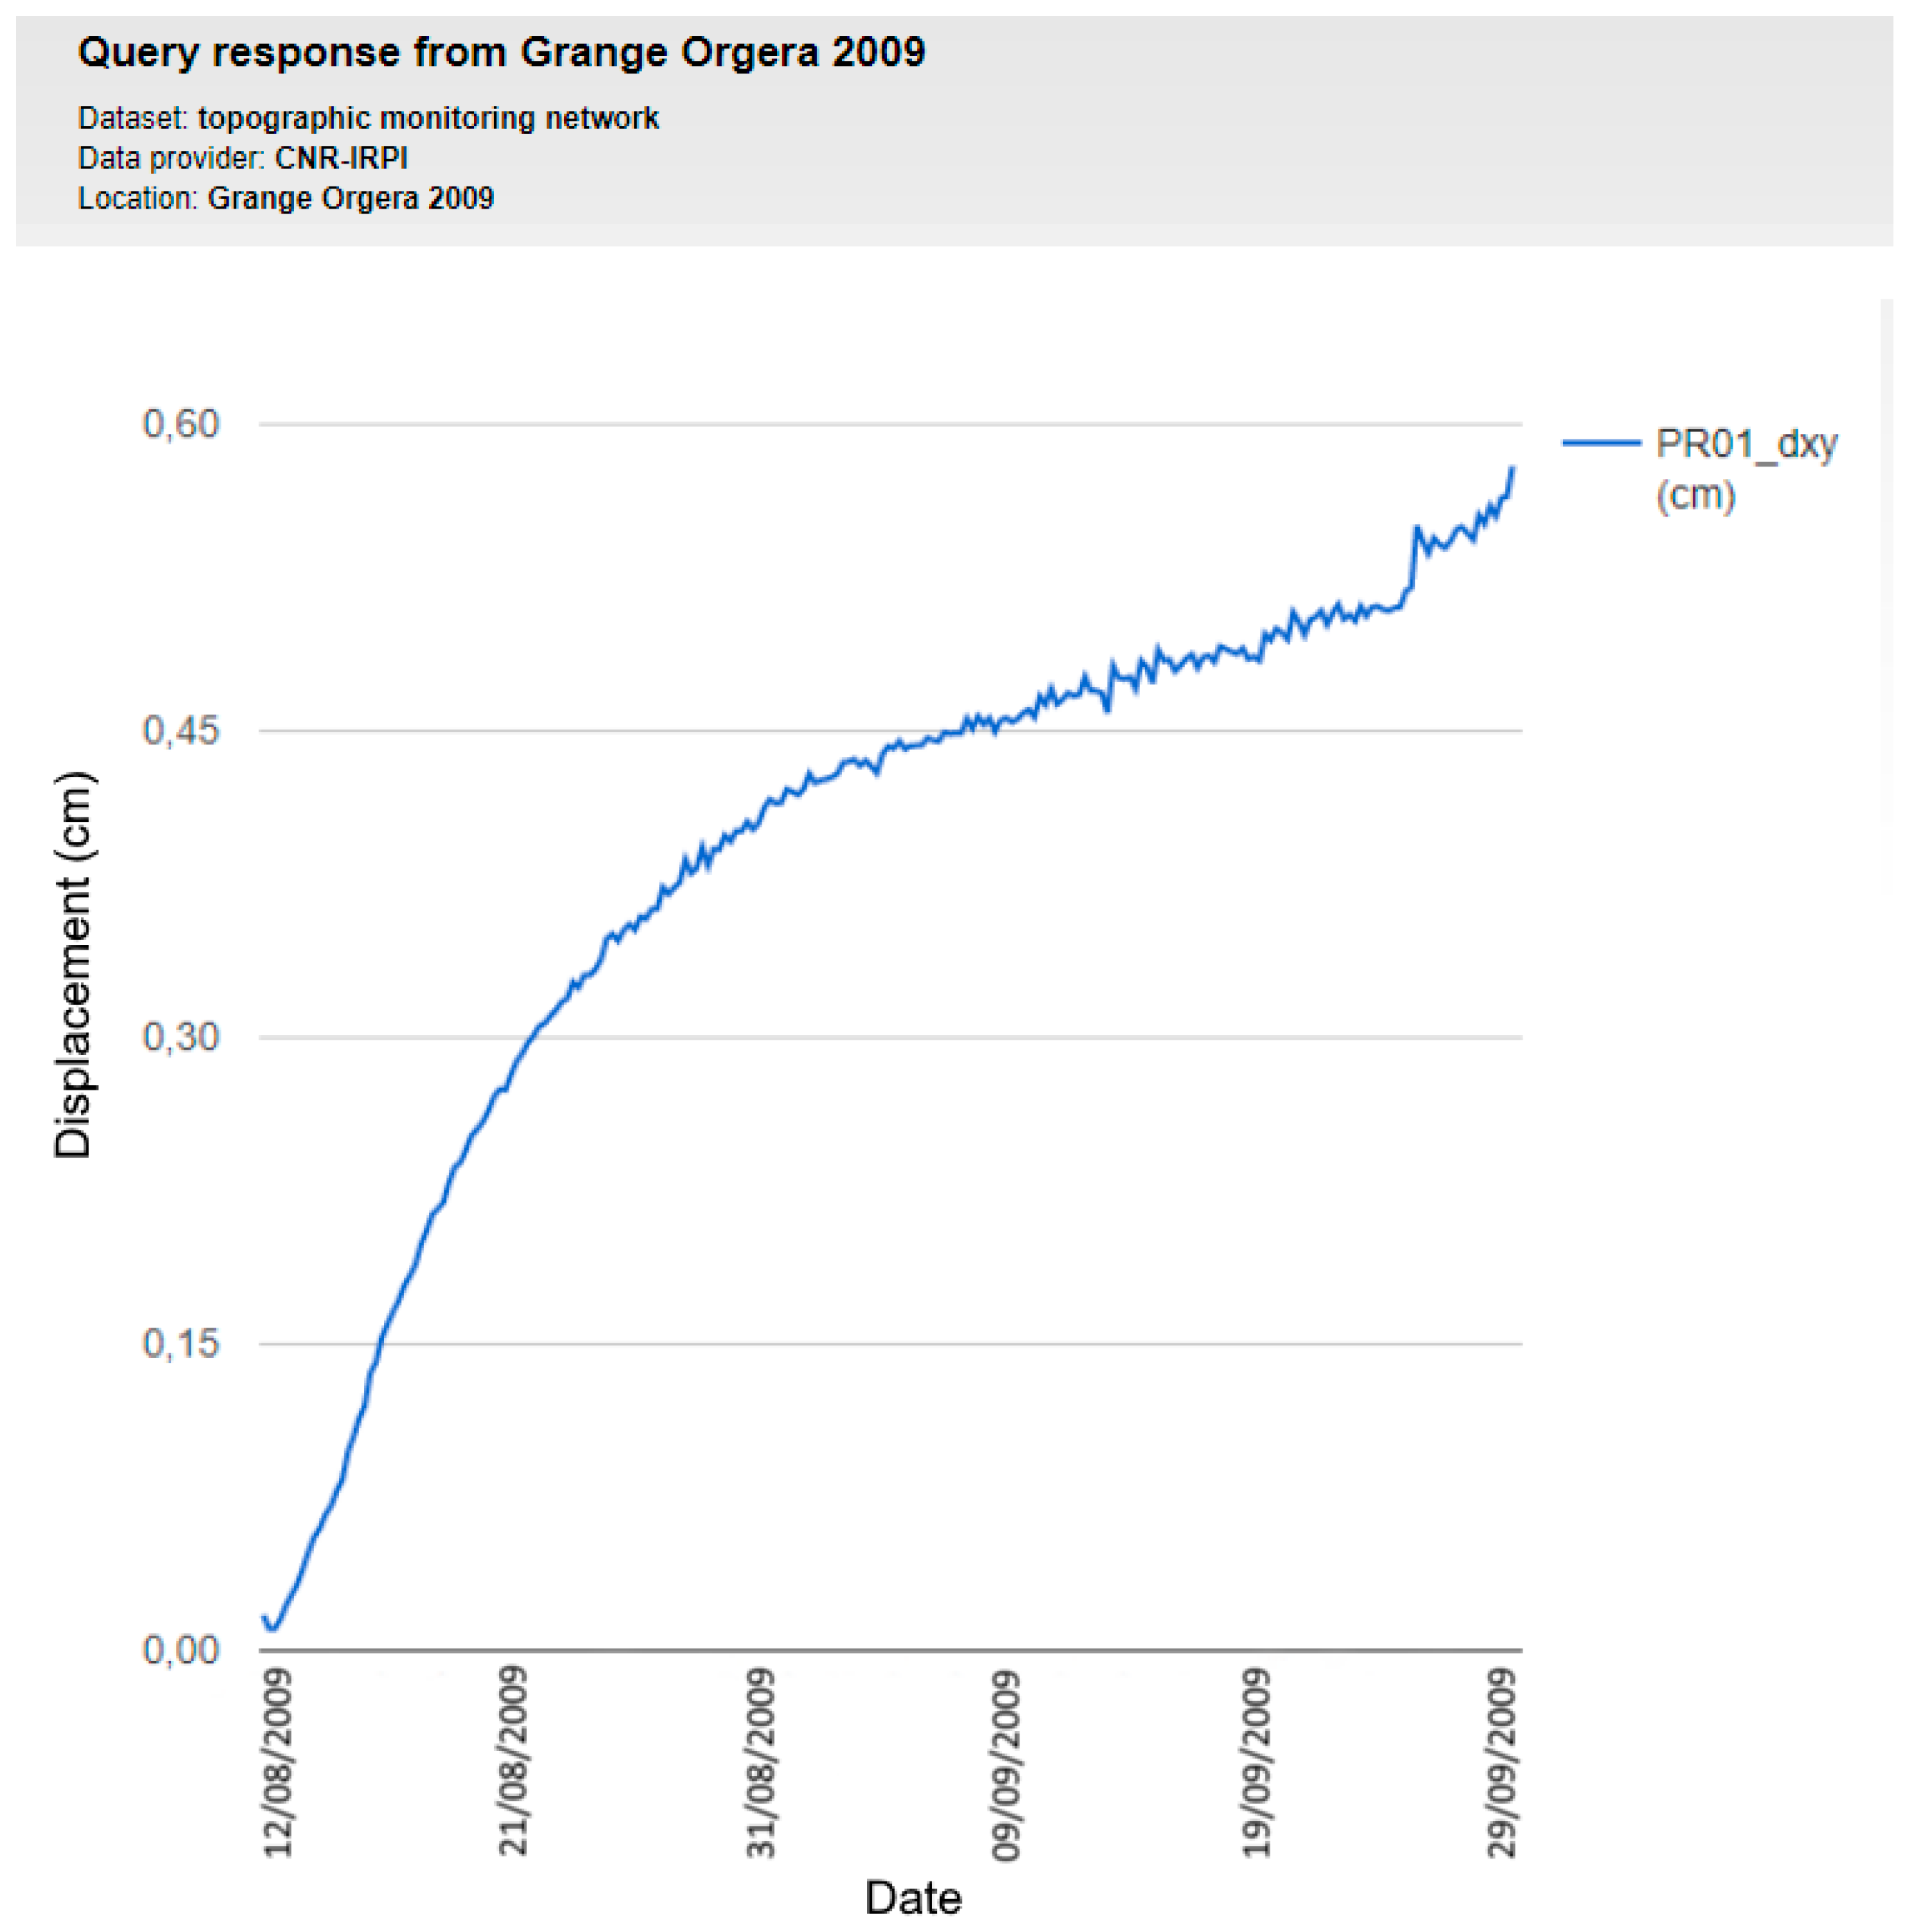
All the technical information relevant to the employed instrument and/or sensors, as well as the description of the surface deformation measurements, are largely reported in the metadata abstract. Most of the data are available as a free download and can be represented by graphs directly in the GeoNetwork portal (
Figure 6).
The catalogue of metadata of the dataset follows the Parent/Child link hierarchy, where the project metadata are the upper hierarchical unit (
Figure 7). The first series of metadata refers to the seven selected study areas, connected to monitoring network/sensor metadata and, in their turn, with the raw data. In some cases, more than one monitoring network metadata are connected with a single test site (e.g., Grange Orgiera, Ivancich), and consequently more raw data metadata are available.
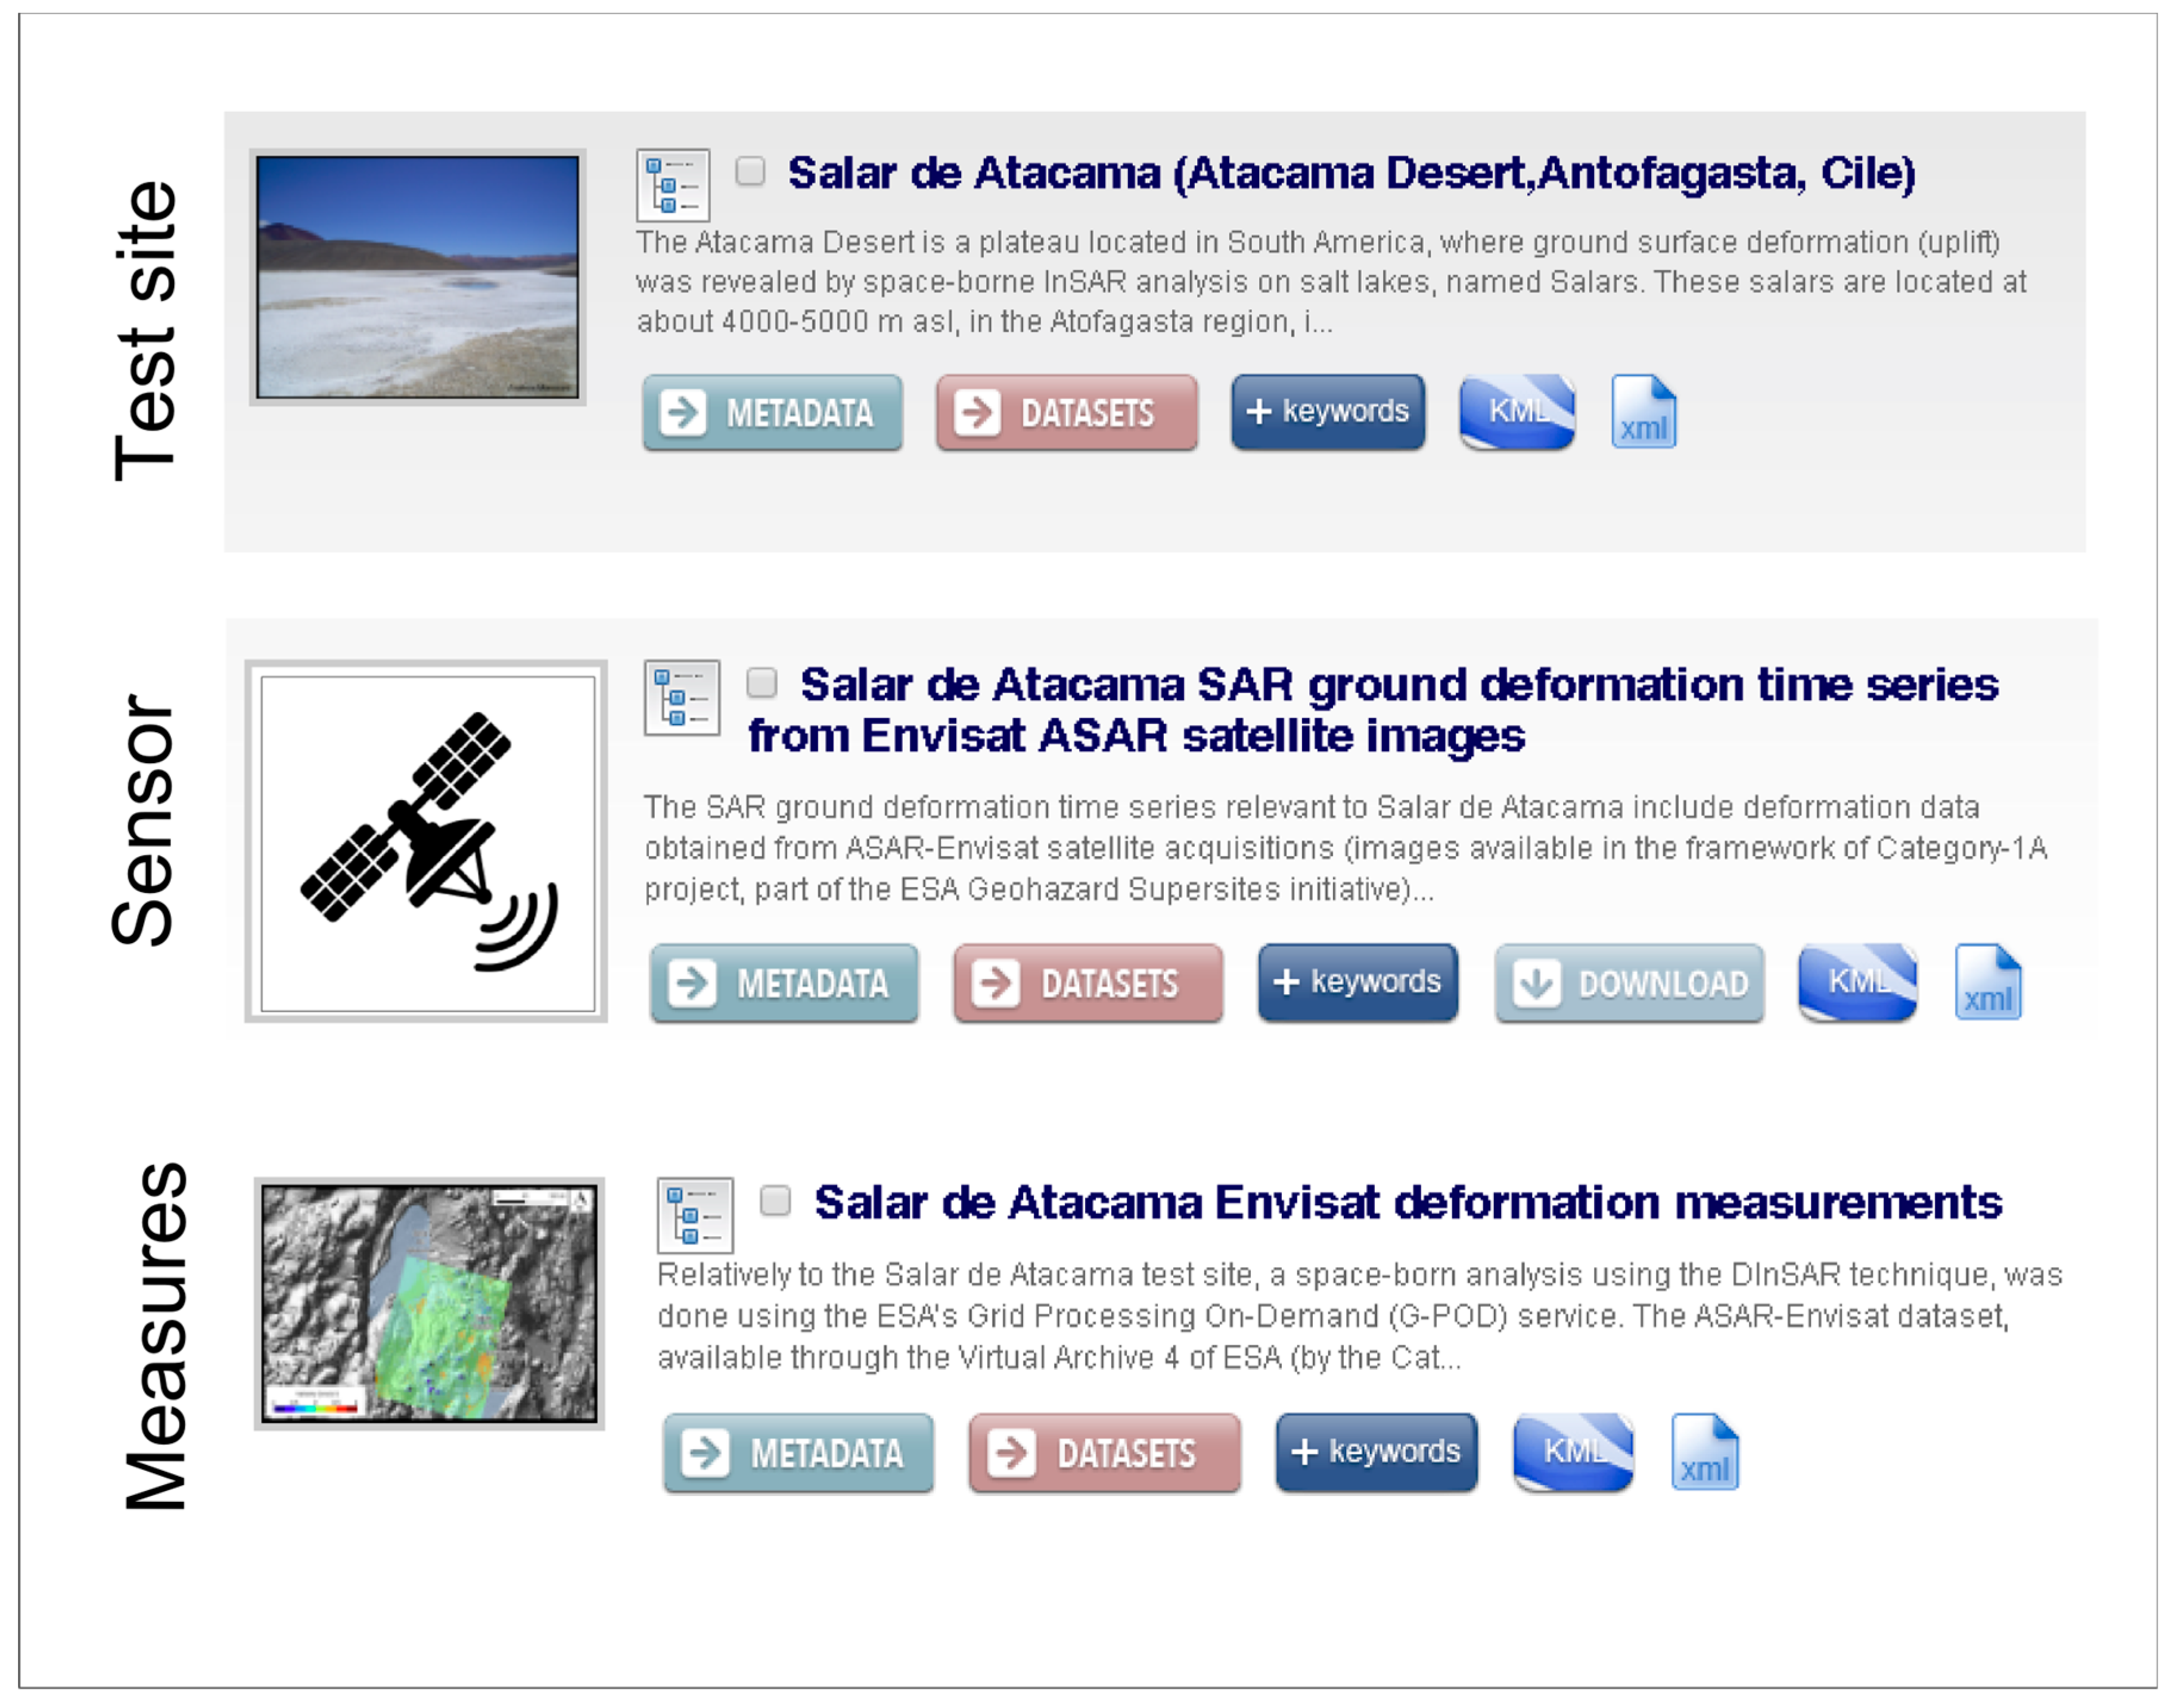
Here are show all 40 metadata that constitutes the H-SDI. Each element of this hierarchy contains all the information required by INSPIRE metadata regulation, with some common characteristics, such as the point of contact, inherited from the upper level of the hierarchy. Moreover, each metadata configuration in the web interface of the GeoNetwork has buttons linked to (i) dataset; (ii) keywords; (iii) KML file; and (iv) XML information (
Figure 8). This versatility is a powerful feature of the GeoNetwork platform, allowing the user to choose between many download and visualization formats. The metadata can be also downloaded in XML format.
6.3. Data Visualization Service
Data visualization is possible with the adoption of the previously described GeoServer that is integrated in the GeoNetwork. With this software, it is possible to publish and edit geo-referred information on the web. Data can be stored into common relational/spatial datasets or file systems and exported as a web service. Many clients could use those services. Some visualization tools are integrated in the GeoServer software (i.e., a fresh installation comes with OpenLayers libraries and a web mapping interface to preview the data loaded into the system), others could be chosen by the final users thanks to the adoption of standard protocols and formats defined by the Open Geospatial Consortium (OGC). i.e., WMS, WFS, WCS. As an example, GeoServer can display data on any of the popular mapping applications, such as Google Maps, Google Earth, Yahoo Maps, and Microsoft Virtual Earth (
Figure 9). Moreover, GeoServer can connect with traditional GIS architectures such as Earth ArcGIS and QGIS (
Figure 10). This flexibility makes GeoServer interoperable with many different platforms, making it one of the best FOSS for data visualization (
Figure 11).
7. Discussion
Cataloguing wide, multisource and heterogeneous geospatial data, published at the same time with a metadata link, has become an ever more common practice, especially for scientific project results management [
12,
26,
37,
38]. The problem becomes more complex with the generation of archives to investigate geo-hydrological processes and to assess their behavior; this increasingly demands the use of multisource and heterogeneous data acquisition and efficient tools and software.
Our SDI has been defined inside a framework based on institutional arrangements and technologies, with specific policies on metadata and data sharing and use. This guarantees the sharing and the effective utilization of geographic information, exploiting standard formats and protocols, focusing in particular on the accessibility and the interoperability. Moreover, with the employment of an SDI, different users can access, retrieve and disseminate spatial data in a friendly and secure way.
The presented work attempts to show an effective approach to catalogue heterogeneous geospatial data and metadata, acquired by the observation of different geo-hydrological processes, all located in mountainous environment of different geographic and physiographic settings. A great effort has been made to meet the demand of cataloguing high elevation environmental data and metadata in an integrated platform. This has been done both to effectively access postprocessed data (as usually happens) and to supply the original raw data acquired by in-situ and satellite sensors.
Frequently, many national and international projects exploit open-source GIS software, such as PostGIS and PostgreSQL for a WebGIS design [
11,
39], to provide to public users a practical data sharing and mapping service. With respect to these ones, an important additional feature is represented by the data association with metadata. Software as GeoNetwork and GeoNode appear more complete in this sense, providing a valid technology compliant with the internationally recognized standards (e.g., OGC) to improve managing, sharing and also analyzing data and metadata in a unique way [
7,
40]. A great added value is also represented by the possibility of producing graphs of the raw data, allowing an in-depth analysis of the collected measurements.
Here we focused on the exploitation of the GeoNetwork open-source software to provide an integrated platform to gain access to the data resulting from the HAMMER project. This software guarantees a solid basis and has been slightly modified and customized according to the project needs. Main modifications, besides the one to the front-end GUI, are related to the structure of the link between metadata and raw data.
The H-SDI is structured to collect multisource, multisensor geospatial data and measurement of high-altitude environments, following the specification of the main project (NextData). The test sites cover areas with different extensions (from local to regional scale) that are characterized by different geo-hydrological processes (e.g., landslide, uplift) and analyzed by different in-situ instruments and/or by satellite sensors. Overall, the ground deformation measurements cover wide time periods, up to decades, freely providing exceptionally long time series to everyone. Currently, all the project data are stored inside a single-node GeoServer (located in Turin, Italy) or a dedicated file server (hosted in Pisa, Italy). The whole GeoNetwork is also hosted inside a single-node server but, as a good practice, we are planning the strengthening all our infrastructure by adopting a redundant solution.
Taking advantage of the GeoNetwork platform, we were able to provide multiple services:
Dataset management and advanced structure of data query of multisource information aimed to collect and analyze ground deformation time-series both from in-situ and remote sensing observation measurements;
Metadata catalogue linked with the dataset, with a hierarchical structure based on “Parent/Child” structure, validated in accordance to the ISO19115 standard;
Web mapping features used to collect the georeferenced data obtained within the project, supported by a dedicated GeoServer.
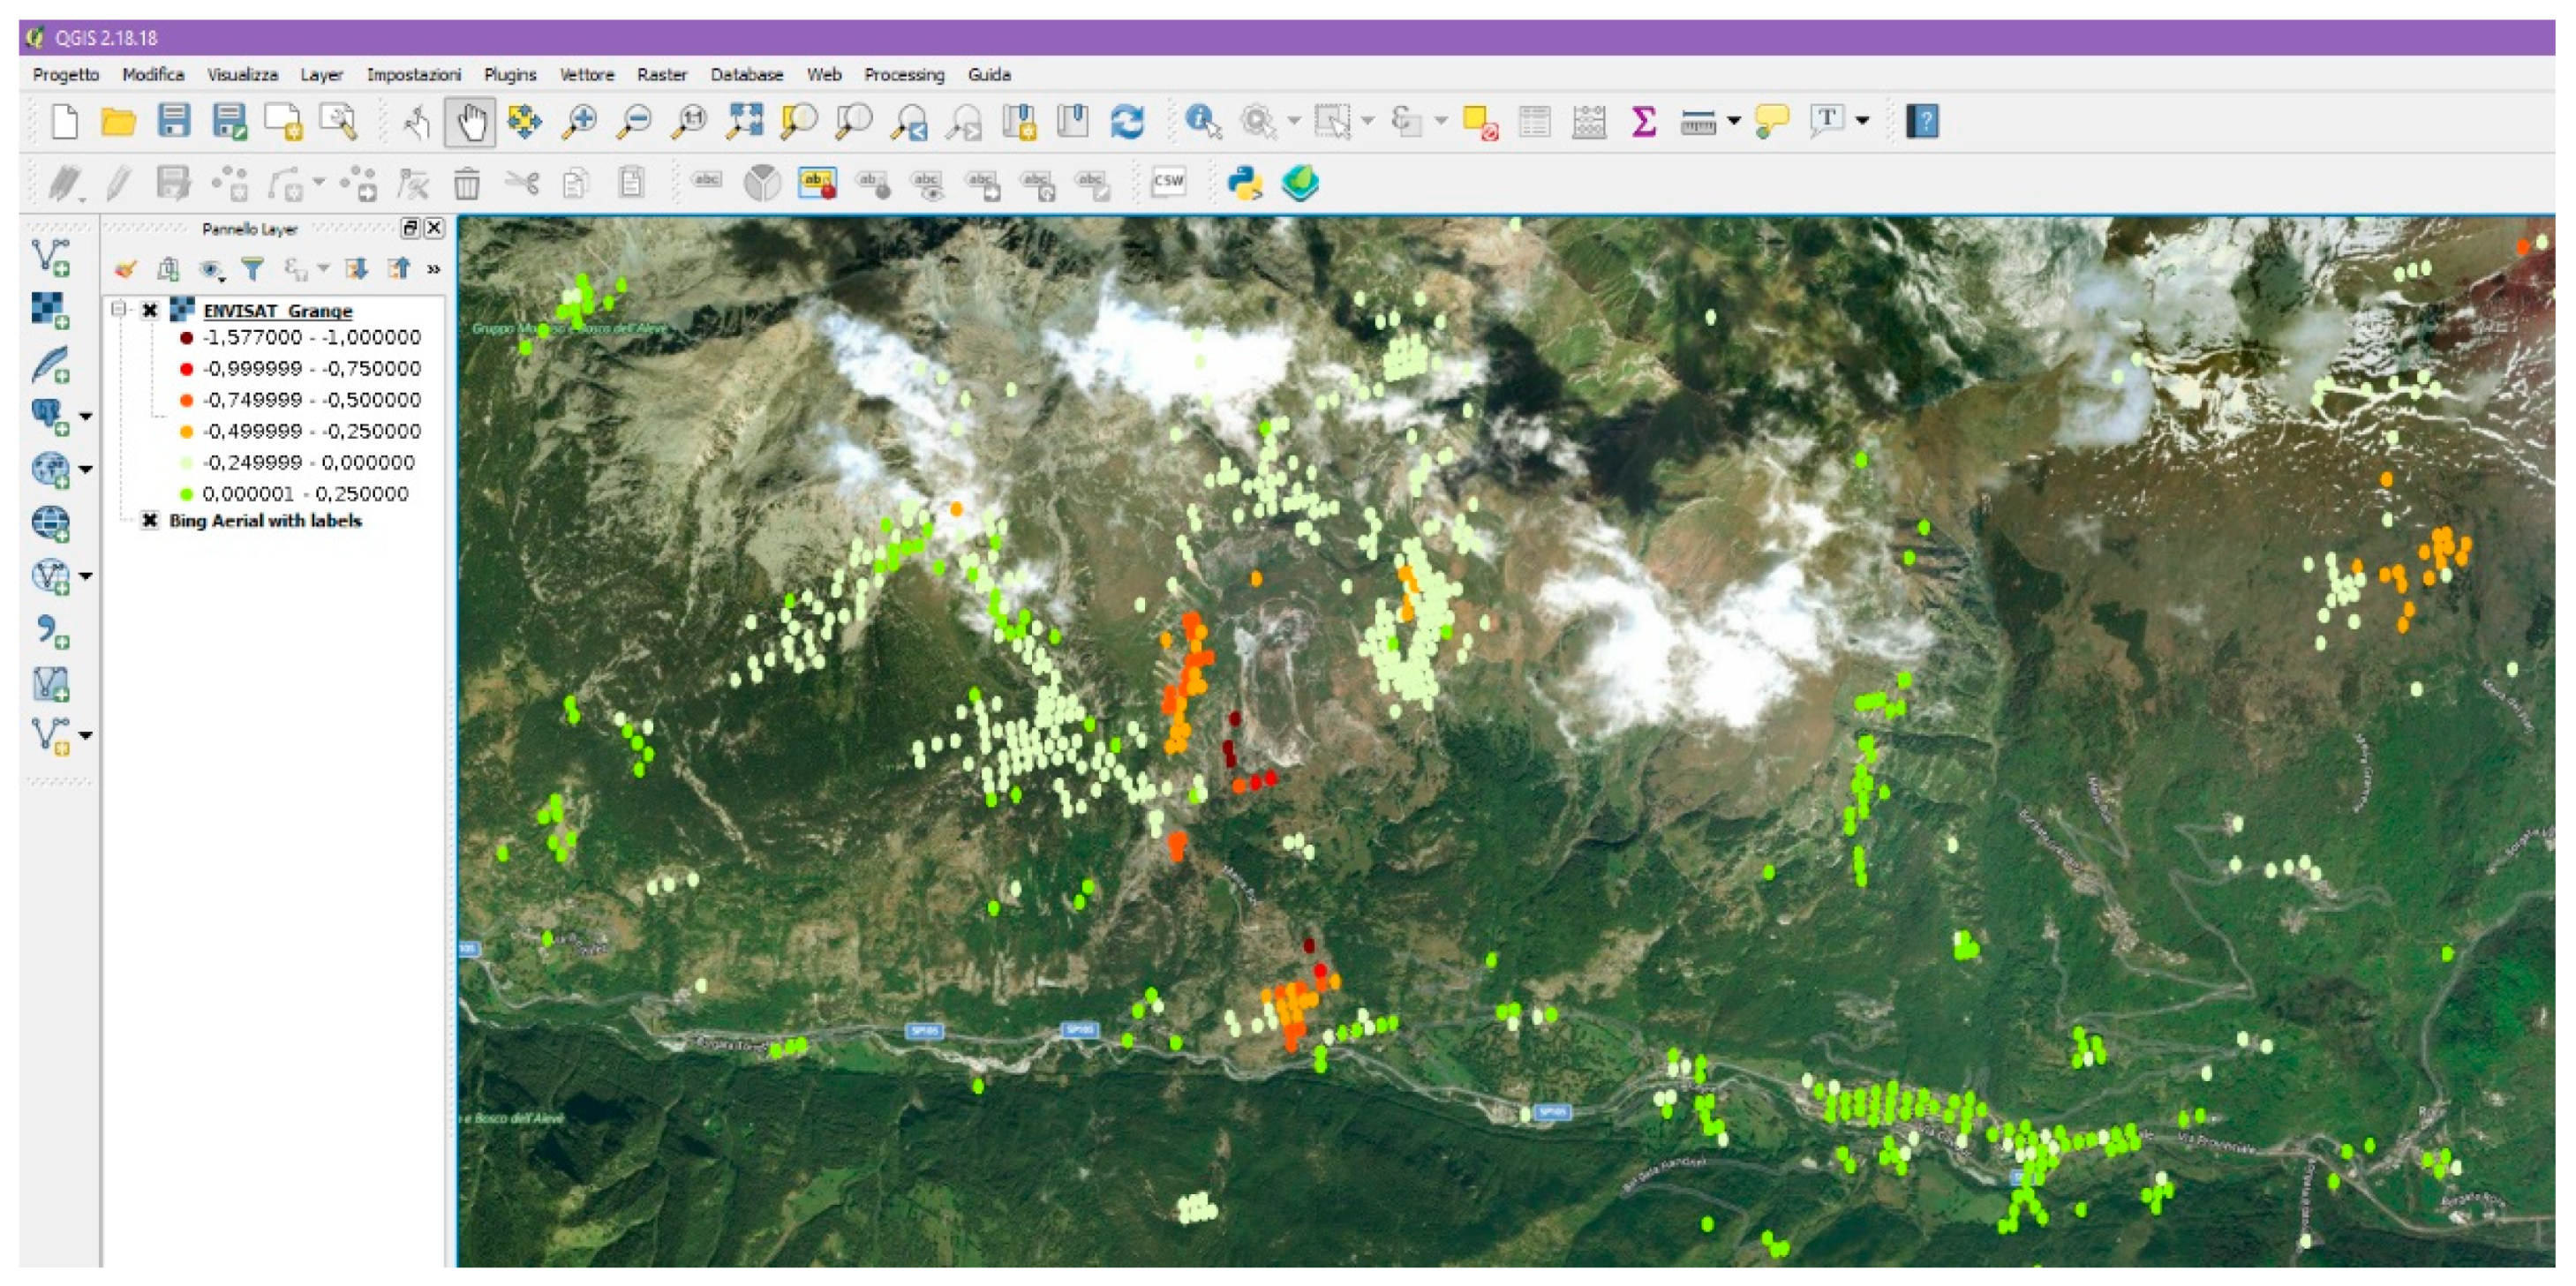
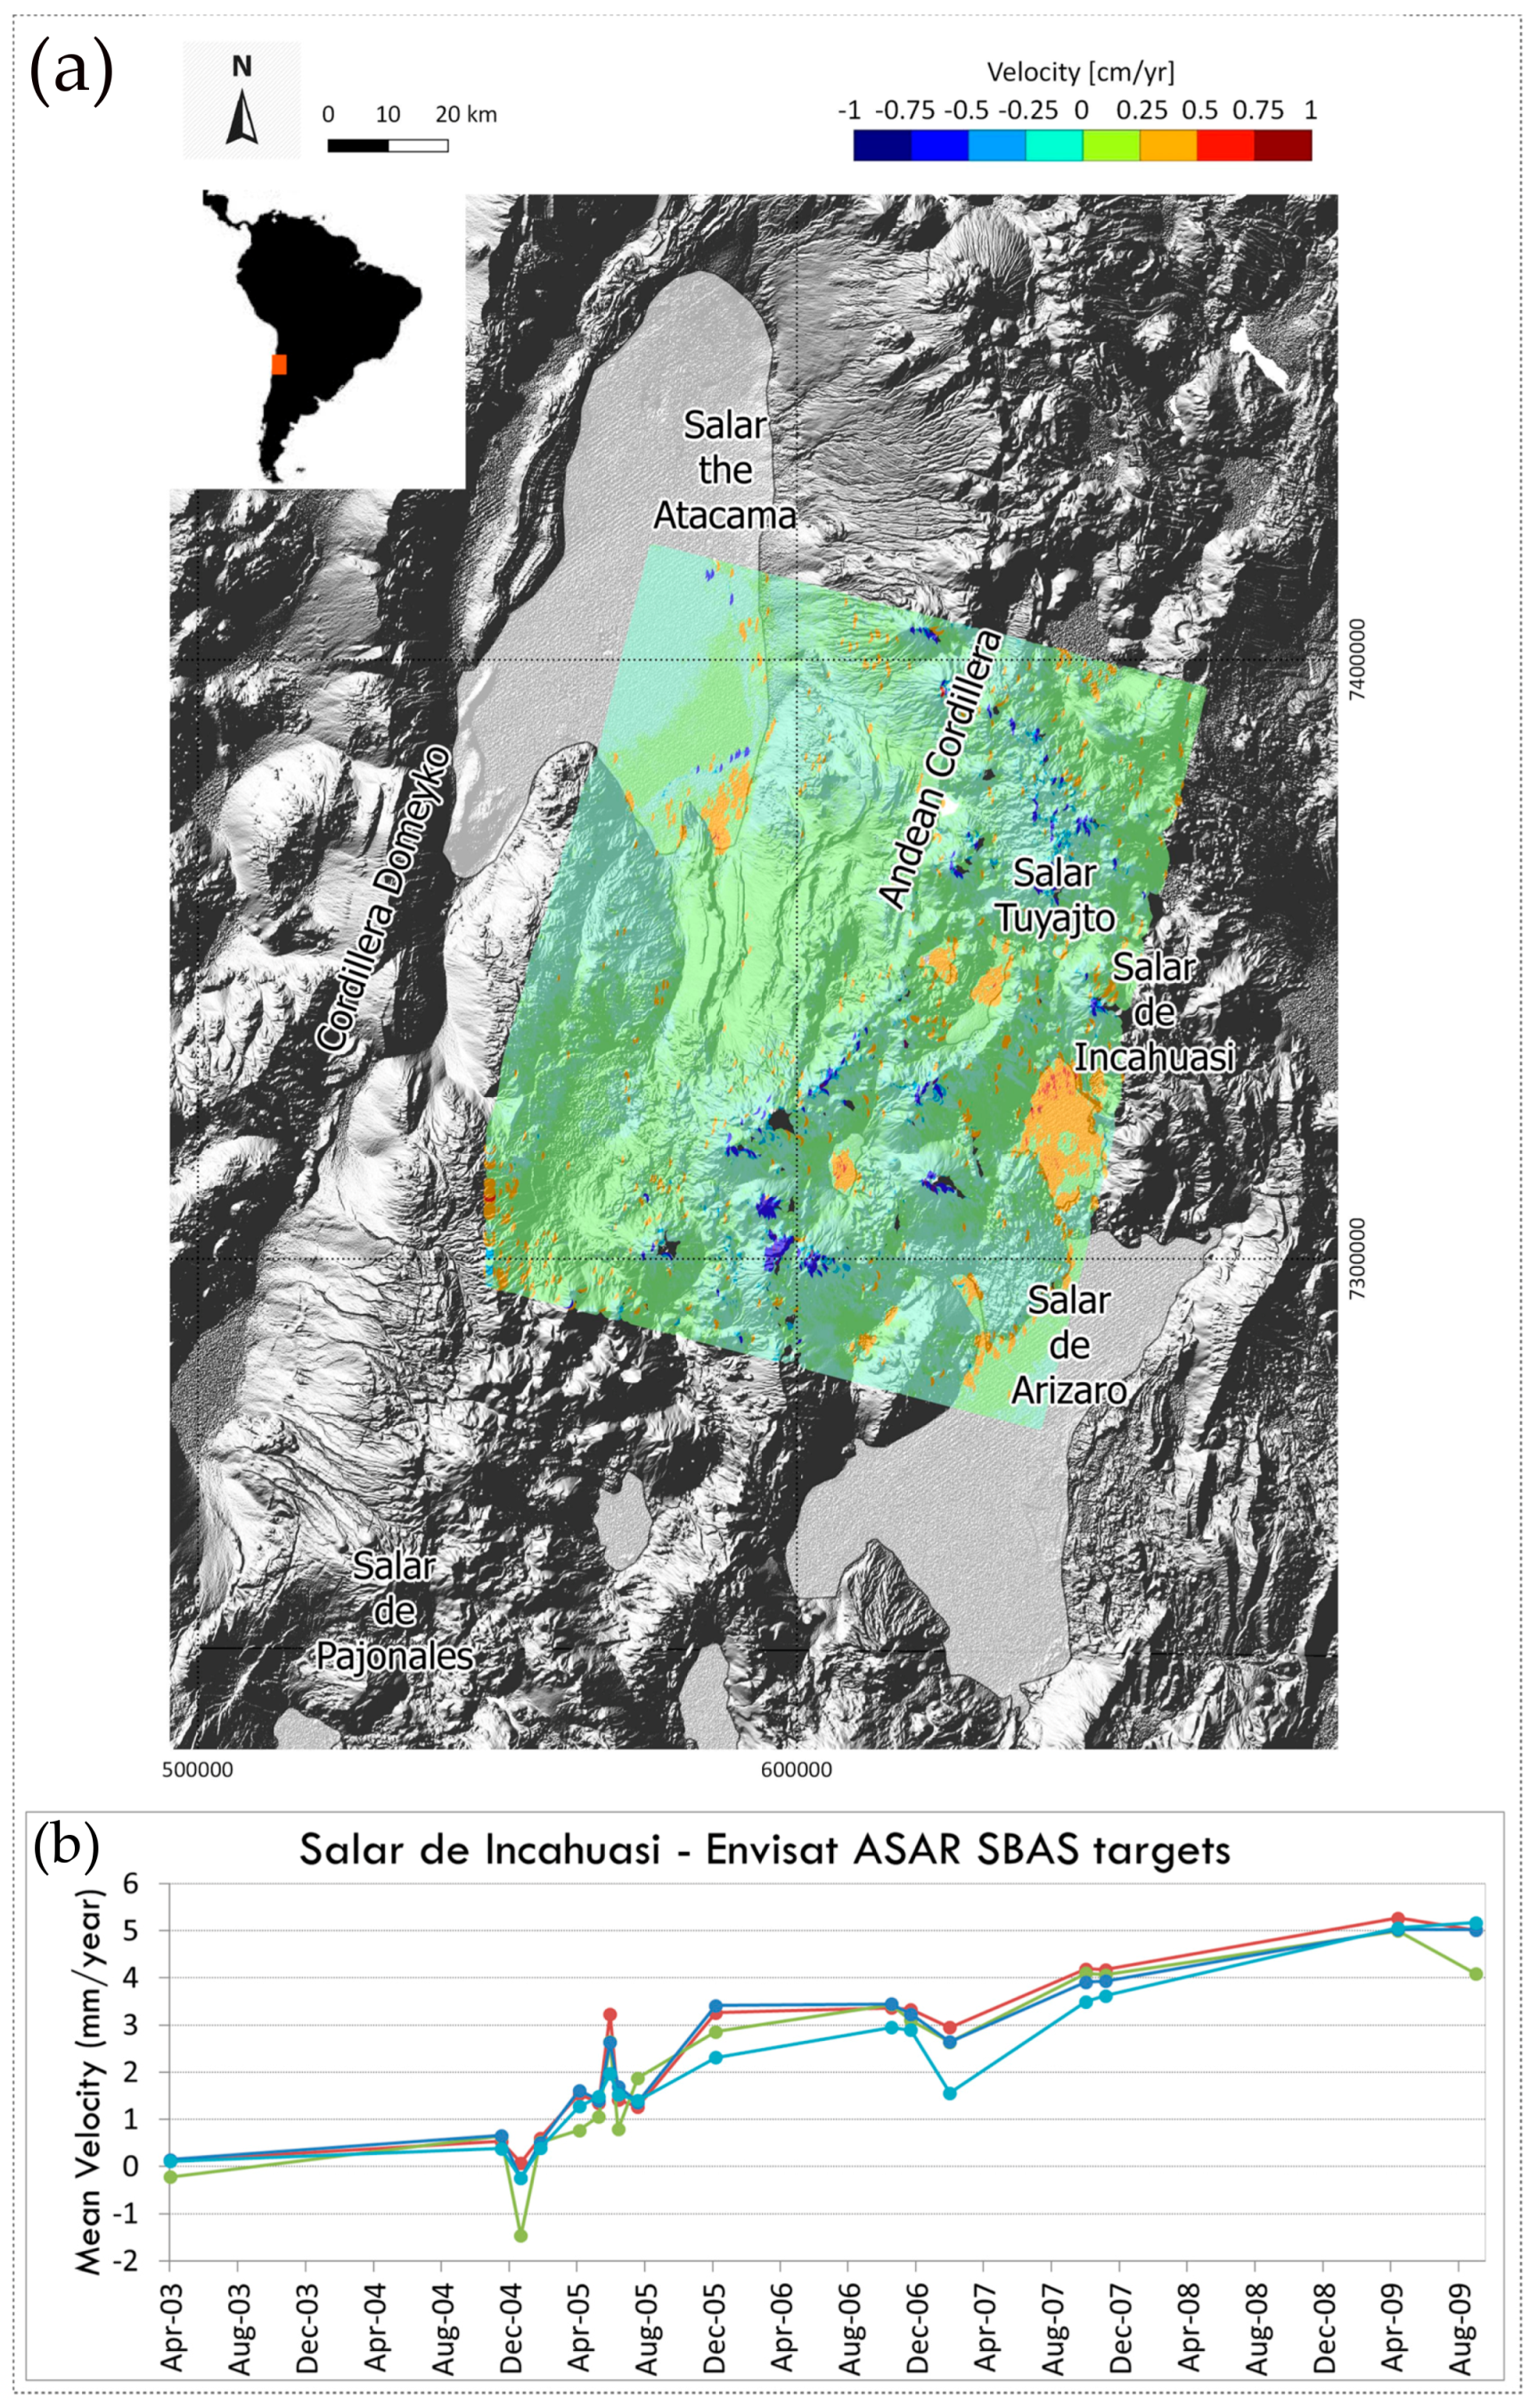
By exploiting the GeoNetwork, we achieve a monitoring data management structure, with free access, relevant to active geomorphological processes, that commonly is not made available to users and usually treated as private data. The resulting system can be easily exploited following the open data principles resulting in an architecture that could be used by third parties and customized for different needs, even for those users not familiar with using such kinds of data. Scientific users and other stakeholders can discover the predisposed web-portal and explore processed and validated data, including the use of the web mapping features. This guarantees the availability of well-prepared geospatial time-series for environmental and climatic investigation, partially overcoming the challenge for a nonexpert user to process the data independently. In our case, the added value is the availability of both processed and validated data with raw data (always in CSV or other standard formats), stored and managed on a standard platform, as requested by the main project directives. Moreover, taking advantage of a geographic information system such as QGIS, the user may simply link or download the collected data in order to portray it on a georeferenced map (
Figure 12a). In this way, any user can analyze and independently process data acquired both in-situ and by remote sensing measurements, obtained by expert geologists and engineers, and generate plots for a specific area of interest (
Figure 12b). By exploiting in-situ measurements and radar sensor acquisitions, every stakeholder can access the raw data in order to reprocess any single ground deformation time-series, by applying the same reference parameters or by modifying them, if required.
The employment of GeoNetwork guarantees a structure in accordance with internationally recognized standards, useful for sharing data in the scientific community. This platform ensures an easy way of reading, downloading and browsing interactively any single resource of the H-SDI by expert users and stakeholders. We decided to avoid any particular restrictions to access the information, and the data are freely downloadable, with only one minor exception to this that is covered by an intellectual property right. Instead, only authenticated users can create, import or edit data and metadata included in the platform.
Another important aspect is the possibility of analyzing, managing and sharing multiple datasets with a single instrument, allowing the exploitation of validated data mainly related to landslides and ground deformation analysis distributed in high mountain regions.
Currently, after a project remodulation, we did a migration from the previous GeoNetwork to a new one; this migration has been made in collaboration with the Institute of Geosciences and Georesources of the National Research Council (CNR-IGG). The employment of GeoNetwork guarantees the adoption of recognized standards, essential for sharing data in the scientific community, allowing the creation, management and analysis of huge amounts of information, composed by a multisource heterogeneous database and time series, easily adaptable for managing large amounts of data from both national and European projects.
8. Conclusions
The H-SDI was made to meet the demand of collecting, managing and sharing the HAMMER project data and metadata, in order to improve the knowledge of geo-hydrological processes occurring in high mountain regions. This information is focused on the test sites selected for the project that are inserted into a main project, aimed to share environmental and climatic data. The HAMMER data, related to hard-to-reach areas of high mountains (e.g., Andes, Western Alps), are acquired, collected and processed by expert geologists and engineers from in-situ monitoring networks and satellite sensors. The access to a collection of preprocessed and validated ground deformation measurements, as well as the related information of instruments and sensors used to acquired them, is the most important added value that this project is giving to the scientific community and other stakeholders.
Taking advantage of the combined use of GeoServer with a partially customized GeoNetwork, we could jointly organize in-situ measurements and satellite sensor observations related to the project test sites distributed in the Alpines, Apennines, Pyrenees and Andes chains, focusing on active landslides. In this way, we propose an infrastructure totally based on free software and internationally recognized standards, following the main project directives. We provided a valuable instrument to manage, collect, visualize and share multisource and multisensor data, that could be downloaded and exploited by anyone, including the uncommon possibility of reprocessing the raw data for other purposes and in other contexts.
Through the adoption of such software, it is possible to develop other platforms aimed to facilitate the convergence of multisource and multisensor information, following recognized policies for the access management and allowing the re-use of data even in other strategic projects. Moreover, it is important to underline that the adoption of open data principles enables the exploitation of the information contained inside the system in both research and industrial fields.

 ,
, 


