Article

An Efficient Staged Evacuation Planning Algorithm Applied to Multi-Exit Buildings

1
College of Geomatics, Shandong University of Science and Technology, Qingdao 266590, China
2
Key Laboratory of Geomatics and Digital Technology of Shandong Province, Shandong University of Science and Technology, Qingdao 266590, China
3
College of Computer and Information Engineering, Xiamen Institute of Technology, Xiamen 361024, China
*
Author to whom correspondence should be addressed.
ISPRS Int. J. Geo-Inf. 2020, 9(1), 46; https://0-doi-org.brum.beds.ac.uk/10.3390/ijgi9010046
Submission received: 4 December 2019 / Revised: 4 January 2020 / Accepted: 13 January 2020 / Published: 15 January 2020

Abstract

:
When the occupant density of buildings is large enough, evacuees are prone to congestion during emergency evacuation, which leads to the extension of the overall escape time. Especially for multi-exit buildings, it’s a challenging problem to afford an effective evacuation plan. In this paper, a novel evacuation planning algorithm applied to multi-exit buildings is proposed, which is based on an indoor route network model. Firstly, evacuees are grouped by their location proximity, then all groups are approximately equally classified into several evacuation zones, each of which has only one safe exit. After that, all evacuation groups in the same zone are sorted by their shortest path length, then the time window of each evacuation group occupying the safe exit is calculated in turn. In the case of congestion at the safe exit, the departure time of each evacuation group is delayed in its arrival order. The objectives of the proposed algorithm include minimizing the total evacuation time of all evacuees, the travel time of each evacuee, avoiding traffic congestion, balancing traffic loads among different exits, and achieving high computational efficiency. Case studies are conducted to examine the performance of our algorithm. The influences of group number, group size, evacuation speed on the total evacuation time are discussed on a single-exit network, and that of partitioning methods and evacuation density on the performance and applicability in different congestion levels are also discussed on a multi-exit network. Results demonstrate that our algorithm has a higher efficiency and performs better for evacuations with a large occupant density.

1. Introduction

With the rapid development of urban construction and building technology, more and more large buildings have been built in cities, and their internal structures are increasingly complex. When an emergency or disaster occurs inside the buildings, their complex internal structure makes it difficult for indoor occupants to evacuate as quickly as a disaster occurs outside, which leads to frequent tragedies. It is critical for emergency rescuers and evacuees to plan an effective emergency evacuation plan [1]. The reason for this is that the plan can not only provide a reasonable escape path for evacuees in the event of a disaster, but also provide a basis for rescuers to make a rescue plan. Additionally, it can also provide reasonable suggestions for the layout of fire control facilities and the design of escape routes inside the buildings [2,3].
Due to the rapid occurrence and spread of disasters, it is necessary to make the best emergency evacuation plan in the shortest time. Therefore, two key objectives of a practical evacuation plan are to ensure the shortest overall escape time and to design the plan as quickly as possible. So far evacuation plans can be roughly classified as optimization-oriented and simulation-oriented [2]. Our research belongs to the former category and aims at developing an optimal method to design evacuation plans. In this paper, we deeply analyze the staged-evacuation process in crowded indoor environments and present a simple and efficient algorithm for staged-evacuation path planning that is able to cope with multi-exit networks. Generally, indoor evacuation is a multi-exit evacuation problem. The algorithm first transforms the multi-exit evacuation problem into a single-exit problem by balancing the loads of evacuees at all emergency exits, then performs the single-exit evacuation. Our contribution includes: 1) for multi-exit indoor evacuation, a partitioned and staged evacuation planning approach is proposed, which effectively realizes the transform above and simplifies the planning of multi-exit evacuation; 2) for single-exit indoor evacuation, a new idea of determining the escape sequence of evacuees according to their shortest path length is proposed and verified, which improves the efficiency of developing evacuation plan. Furthermore, the efficient single-exit evacuation will effectively improve the efficiency of the multi-exit evacuation, because the multi-exit evacuation is composed of multiple single-exit evacuations in this paper.
The remainder of this paper is organized as follows. Section 2 reviews related work. Section 3 describes the problem. Section 4 gives related definitions and theorems and presents our method. Section 5 illustrates the results of the algorithm, evaluates its performance and effectiveness by a series of tests, and gives a testing simulation. Section 6 concludes the paper.

2. Related Work

From the perspective of implementation, Li et al. classify evacuation plans into two major types: spontaneous evacuation plans and organized evacuation plans [2]. The former is carried out by controlling the evacuation infrastructure (e.g., fire emergency lighting and dispersal indicator) while evacuees move spontaneously but are guided by the infrastructure. The latter is realized by controlling evacuees including their departure time, routes to safe exits, and so on. Each type of evacuation plans is applicable to a particular scenario.
Regarding spontaneous evacuation plans, many simulation models have been put forward to analyze the significant factors or parameters that influence the evacuation process or can be used in evaluating the evacuation performance under different scenarios and strategies. Existing typical models include network flow based models [4], cellular-automata (CA) models [5,6], agent-based models [7,8,9], social-force models [10,11], lattice gas (LG) models [12,13], and so on. These models have been successfully applied to study crowd evacuation under various situations because of their great ability in representing some key elements influencing human behaviors during evacuation process, such as the impact of the occupant density around exits [14,15] and spatial distance on human behaviors. Flow based models are easy to construct while they lack social interaction between evacuees, human behavior in emergency conditions and hazards representation [4]. CA models are very flexible and effective in simulating evacuation process under complex environment while in contrast with multi-agent system, they have more primitive agents that are arranged on a rigid grid and interacting with each other by very simple rules. LG models present a special case of cellular automata modes that utilize biased random rules to simulate counter flow in channels, or to evaluate the impact of building parameters to the evacuation efficiency. Agent-based or multi-agent-based models can represent various types of agents with different attributes and their interactions are more complex [8], and the disadvantages of them are generally more computationally expensive than cellular automata. Social force models are a kind of continuous model applying Newton’s second law to simulate pedestrian evacuation and are good at modeling interactions among pedestrians, but have low computational efficiency in simulating evacuation in complex buildings [6].
This paper focuses on organized evacuation planning requiring a comprehensive and effective escape plan for particular evacuation objectives according to different escape environments. Generally, these objectives include reducing traffic conflicts and minimizing the whole clearance time of all evacuees or the evacuation time of each evacuee. Network flow models, such as maximum-flow models and minimum-cost flow models [3,16,17,18], are the most widely used in optimizing the flow of evacuees, but they target the whole network and attempt to organize the origin, destination, and routes of evacuation flow at a mesoscopic level. The integer programming or linear programming method [16,19], as an exact algorithm, is applicable to small-scale problems and usually requires additional parameters (e.g., lower or upper bounds, etc.) that are generally difficult to estimate in advance. For large-scale evacuations, heuristic methods and scheduling algorithms are often adopted. The former, such as evolutionary algorithms [20] and ant colony optimization [21,22,23], are limited in terms of the quality of solutions and computing time. The latter are generally exact methods and are used to integrate the objectives and the constraints into the design of algorithms [2,24,25,26].
In the process of evacuation, if there is congestion, it will inevitably lead to the decrease of escape efficiency and even trample accident. In order to avoid congestion, waiting is necessary [27]. There are two ways of waiting in the strategies of scheduling algorithms. One is waiting at the starting point and the other is waiting on the way. Li et al. proposed an innovative method to make a staged-evacuation plan for emergency situations, but it is only applied to the network with a single safe exit and it is assumed that the speed of evacuees is constant and equal [25]. Later, they extended the staged-evacuation plan method from two aspects. One is to make it apply to multi-exit evacuation based on the time-extended network model by balancing traffic loads to different exits [26]. The other is to make it fit multi-speed evacuations with a single exit [2]. Although these algorithms get excellent results, iterative computation of the time-extended network results in their low efficiency.
It should be noted that another research direction closely related to indoor emergency evacuation is to dynamically plan an indoor evacuation path based on the real-time perceived situation information about the spread of a disaster [28,29,30,31]. However, so far, the research results in this direction are more applicable to the situation without indoor congestion. Additionally, the acquisition technology of real-time disaster environmental information in the case of fire has made great progress, but remains a challenging work. Encouragingly, the arrival of smart city offers real-time access to indoor evacuation information such as the distribution of evacuees and the development of an indoor disaster, which provides a data base for the real-time design of an evacuation scheme. This is one of the reasons why we pay attention to the efficiency of the algorithm.

3. Problem Description

Once an emergency occurs in a building with multiple exits, evacuees would choose the nearest exit to escape if there are a few occupants in the building. However, if there are more occupants, due to the limitation of the capacity of the escape path, it is prone for evacuees to congest at the corners or intersections of the path or safety exits, which reduces their escape speed, prolongs the overall evacuation time, and increases the probability of risk for them [25]. Therefore, the problem of indoor emergency evacuation studied in this paper is how to let all evacuees escape from the dangerous buildings with multiple safe exits in the shortest time when the capacity of indoor route is limited and congestion may occur during evacuation. Figure 1 shows the abstract representation of the studied evacuation problem. There are three safety exits namely E1, E2 and E3 in the indoor route network whose edges contain both path cost and capacity. Ai represents the room node. In this paper, it is assumed that the capacities of all locations in the route network are equal.

4. Methodology

The purpose of emergency evacuation planning is to allocate a departure time and an escape path for each evacuee to ensure that all indoor occupants can safely and orderly escape to the safe area in the shortest time. When the number of evacuees is large, it is usually more effective to group them by the spatial proximity of their positions and then evacuate them in groups. A key issue during this procedure is congestion. To avoid the problem, two strategies are often adopted in case of emergency [25]. One such strategy is staged evacuation, and the other is simultaneous evacuation. However, in the second case, it is hard for subsequent groups to wait to escape until all prior groups have fully passed. Someone would likely abandon waiting at the congestion and escape blindly, which increases the degree of congestion and the total escape time. Therefore, we choose the former for emergency escape planning.
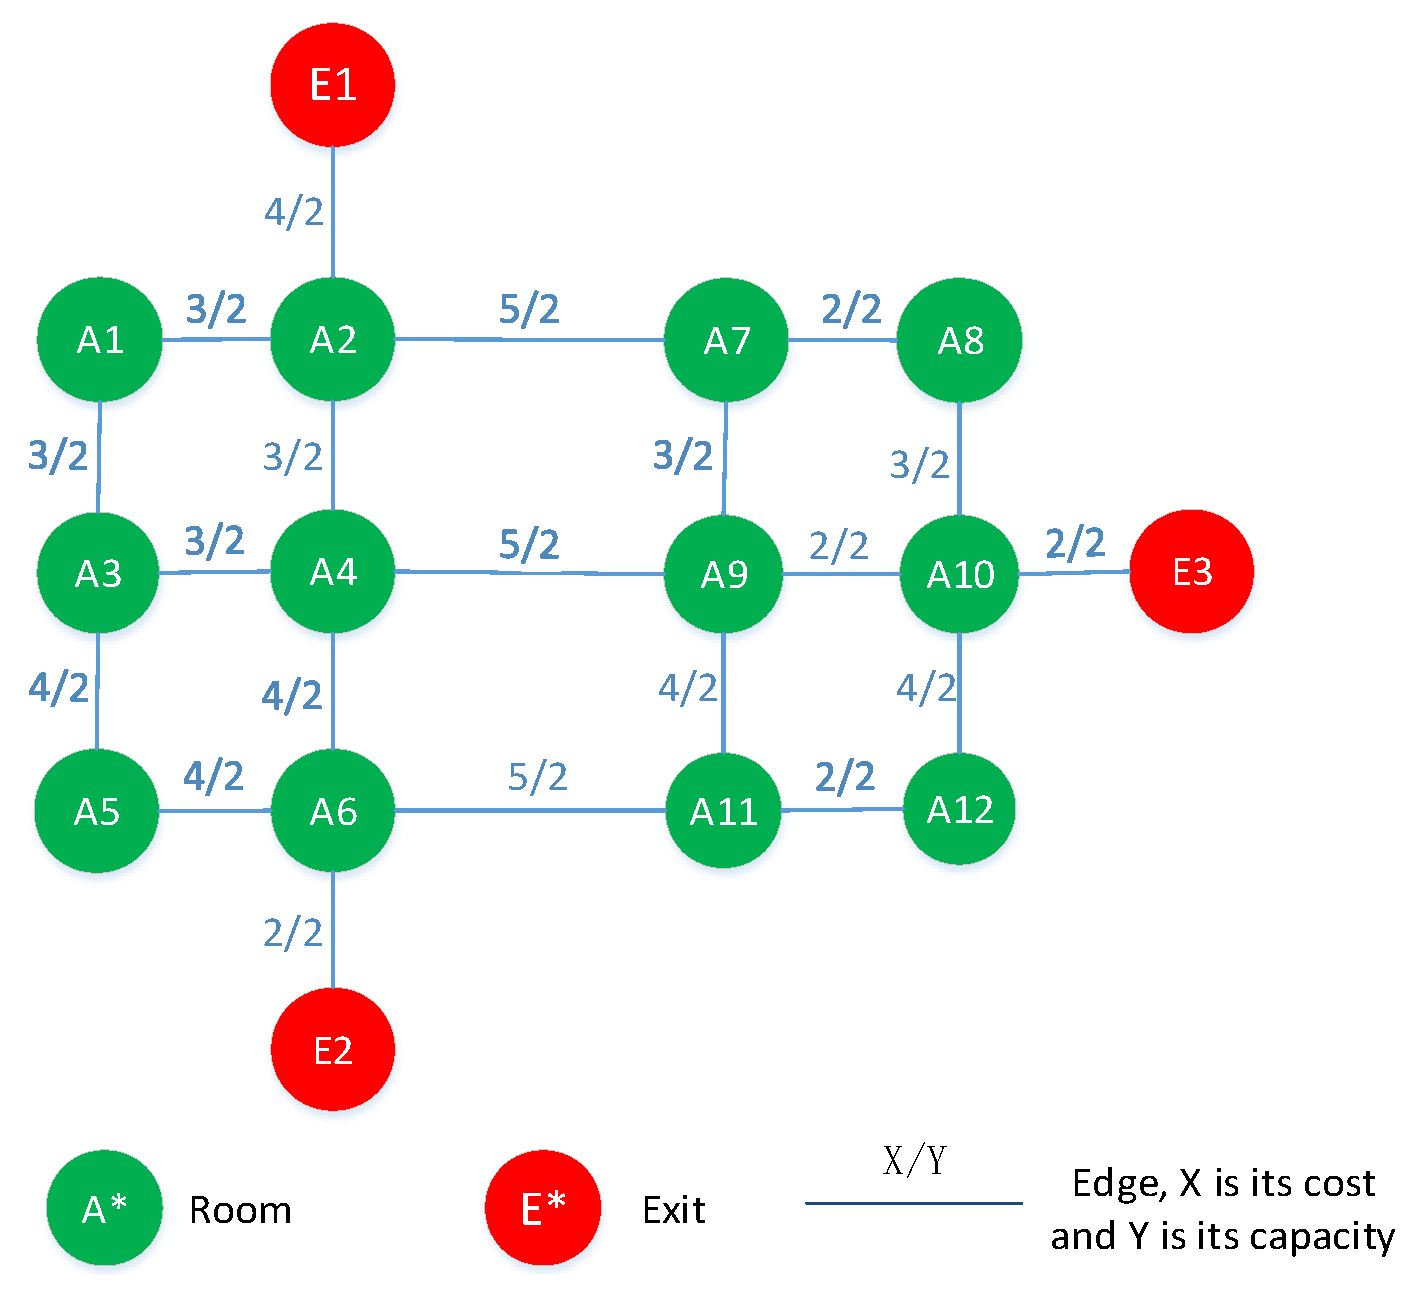
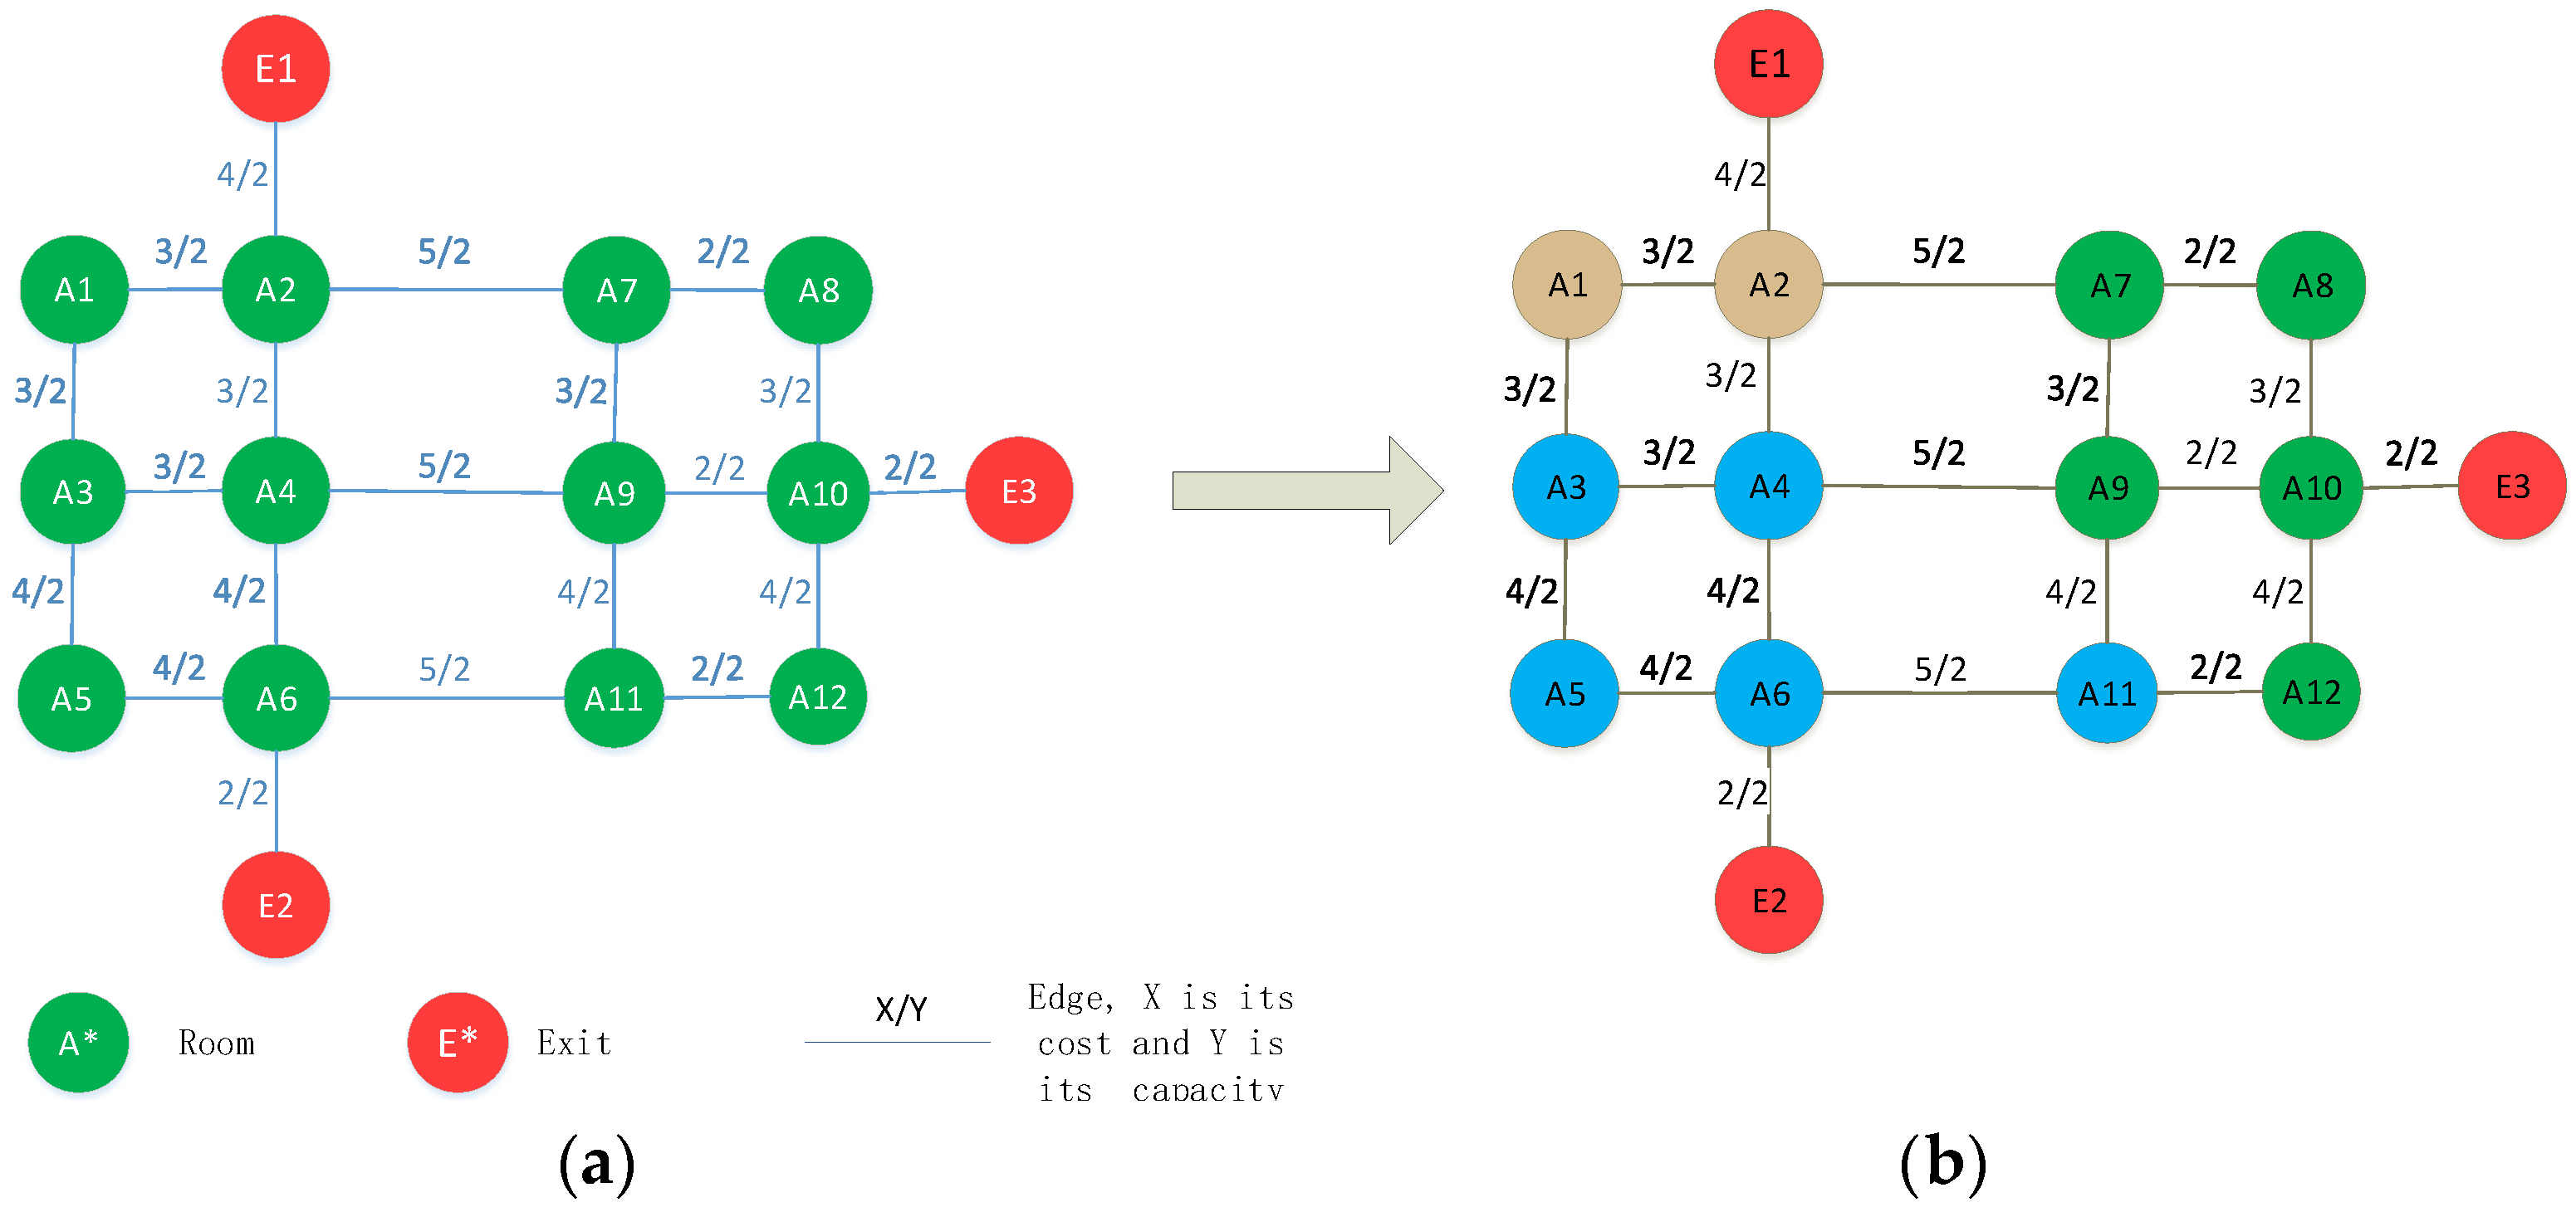
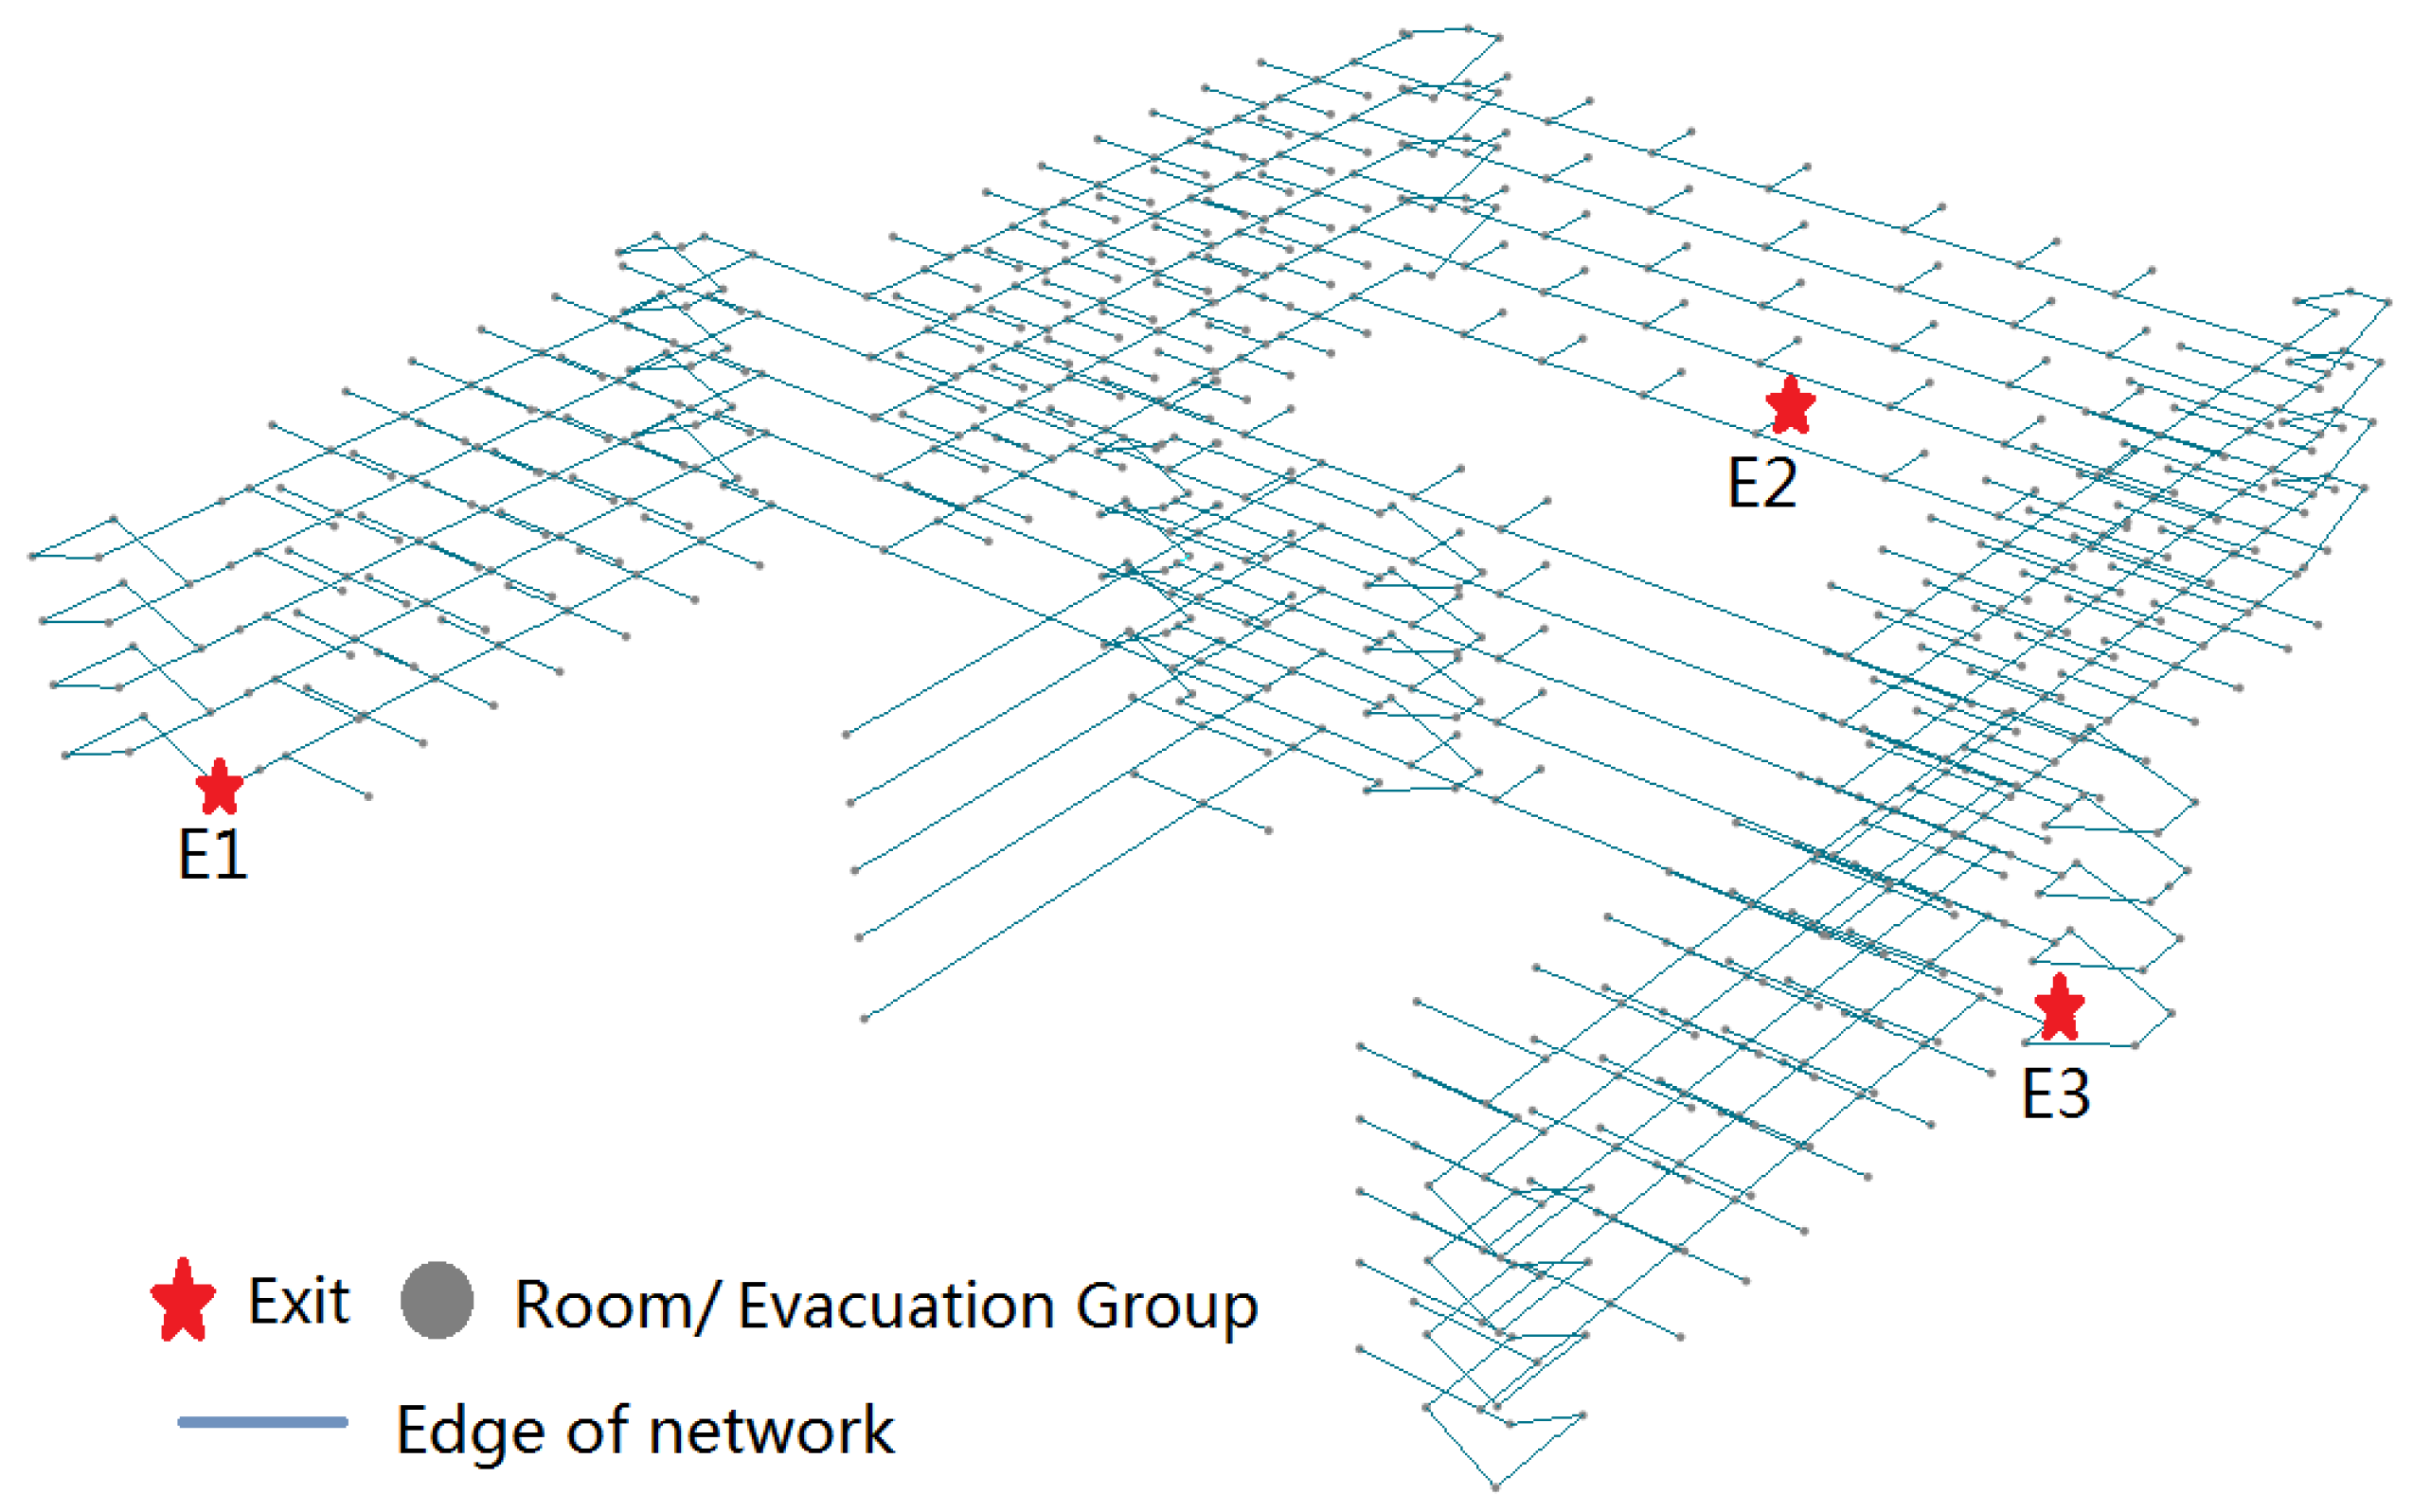
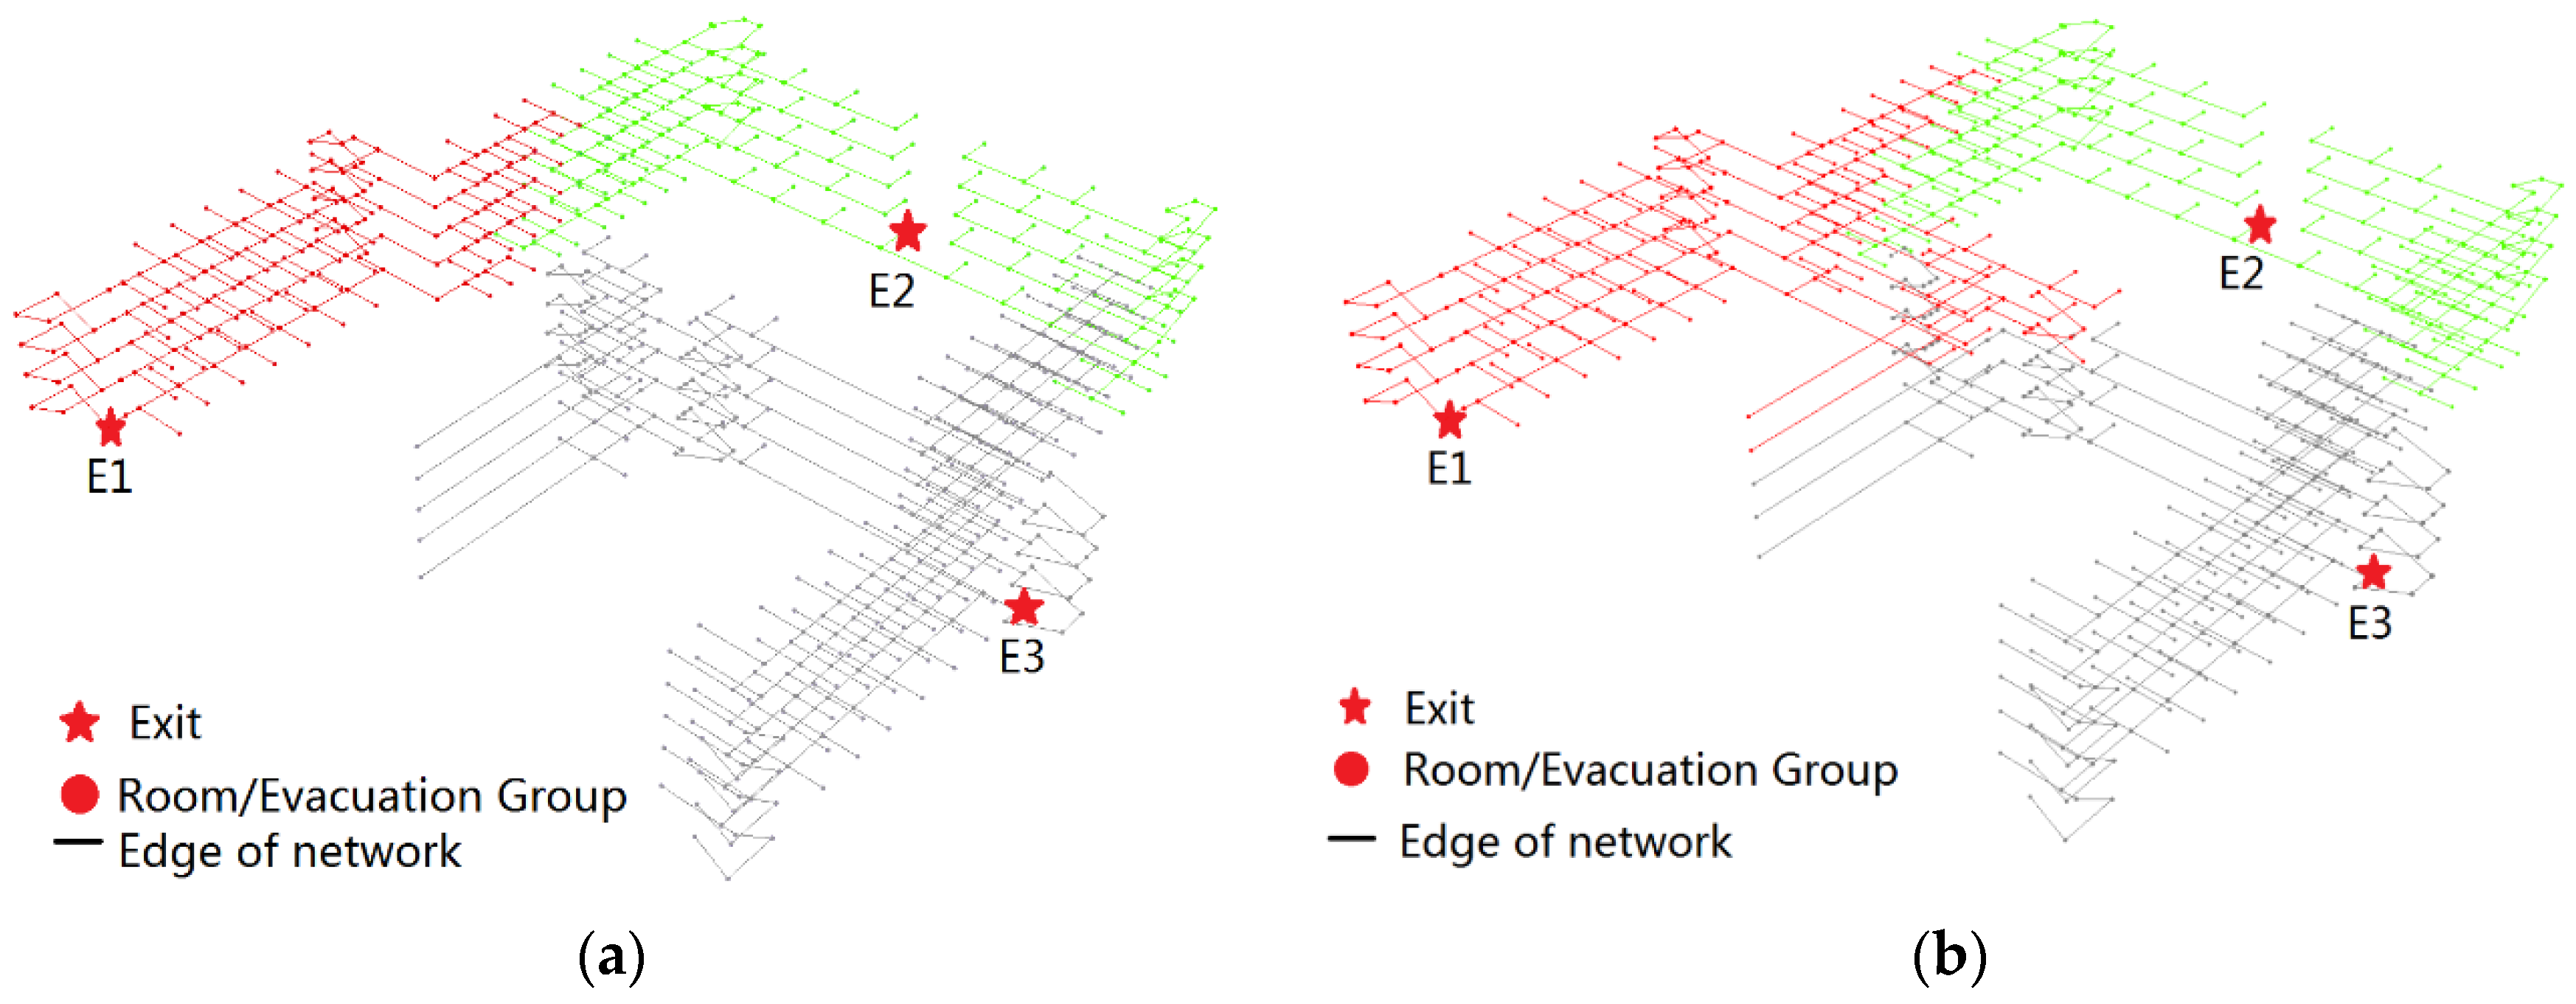
For an uncrowded multi-exit building, each safety exit has its corresponding service zone where evacuees can flee to the safety exit by their shortest paths [32]. When an emergency occurs, indoor occupants can escape from the exit of the evacuation zone where they are located. Therefore, the emergency evacuation planning for a multi-exit indoor emergency can be easily transformed into that for a single-exit indoor emergency according to the service zones of building exits (Figure 2). However, it must be noted that the goal of evacuation planning is to ensure the shortest overall evacuation time for all evacuees, rather than the shortest escape time for a single person. When the density of indoor occupants is very large or the distribution of them is non-uniform, the two factors should be taken into account when zoning. Only in this way can the number of evacuees in each evacuation zone be approximately equal, thereby making full use of all safety exits and getting the minimum of the total evacuation time.
Our proposed approach is mainly inspired by that in [25] which is only suitable for the single-exit problem. But our approach can solve the multi-exit problem well, especially with crowded evacuees. Its key issues include how to transform the multi-exit problem into the single-exit problem to make the total evacuation time minimum and how to improve the approach in [25] to get higher efficiency. Firstly, evacuees are grouped by their location proximity, then all groups are approximately equally classified into several evacuation zones by the improved Dijkstra algorithm according to the load of each exit. Secondly, all evacuation groups in the same zone are sorted by their shortest path length, then the time window of each evacuation group occupying the safe exit is calculated in turn. In the case of congestion at the safe exit, the departure time of each evacuation group is delayed in its arrival order.

4.1. Staged Evacuation for Single-Exit Network

In the case of congestion, the evacuation process involves many factors, such as the weight and capacity of route network, the total number and total evacuation time of evacuees, the time when an evacuation order is issued, the waiting time, departure time and escape speed of each evacuee, etc. To describe and analyze the evacuation conveniently in theory, related variables are defined below.
n: the number of evacuation groups.
t0: the earliest departure instant, that is, the time when an evacuation order is issued.
t p i : the time consumed by the escape group i from the origin to the safety exit E along the escape path.
t e i : the time consumed by the queue of group i to completely pass through a point such as E on the route network.
t d i : the delay of the departure time of the escape group i.
t l i : the time interval between the group i and its prior group along the route.
V: the escape speed of escape groups.
T: the total evacuation time of all escape groups that is the time from t0 to the instant when the last evacuation group has passed through the emergency exit.
It is assumed that the escape speed V of each group is the same and the evacuation network has only one safety exit. At the same time, the staged evacuation process has four assumptions:
  • Each edge of the evacuation network has the same capacity, and when a node of the network is occupied by a group, other escape groups cannot pass through the node.
  • The delay time between two adjacent groups is to ensure that their time windows don’t overlap or separate.
  • During the staged escape procedure, each group escapes along the shortest path to the exit.
  • The evacuation network is an undirected graph in which it will take the same cost to go or come along the same edge.
In the process of staged evacuation, each group arrives at the safety exit along their shortest path without any congestion. Then each group successively passes through the exit to complete the evacuation [25]. Accordingly, the total evacuation time of each group may be divided into three parts that include t e i , t l i and t p i . The total evacuation time T is equal to the time when the safety exit is occupied in the whole evacuation process, therefore T can be expressed as follows:
T = t p 1 + 1 n ( t l i + t e i )
In the staged evacuation planning, the first key work is to determine the evacuation order of each evacuation group. We deeply analyzed the operation of the staged evacuation process and obtained Theorem 1. It is the basis of our proposed approach.
Theorem 1.
In order to obtain the shortest total evacuation time, all escape groups should escape in stages according to their distance from the emergency exit. The group near the exit has priority to depart and that far from the exit will be delayed if there are conflicts between their time windows.
Proof of Theorem 1.
Assuming that group Gi and group Gi + 1 need to be evacuated and only one of them is allowed to pass in the process of evacuation for the limits of path and node capacity. That is, when one group is passing through exit E, other groups can’t pass through it. Then, several situations may occur at exit E (or path intersection) when the two groups are evacuated.
Situation 1. The two groups depart at the same time and arrive at the emergency exit successively without congestion.
As shown in Figure 3, assuming that Gi arrives at the emergency exit E before Gi + 1, the condition for no congestion at the exit is as follows:
t p i + t e i < t p i + 1
At this time, Gi + 1 need not delay its departure time, t d i + 1 = 0 . Their total evacuation time passing through the exit E successively can be expressed as follows:
T = t p i + t e i + t l i + 1 + t e i + 1
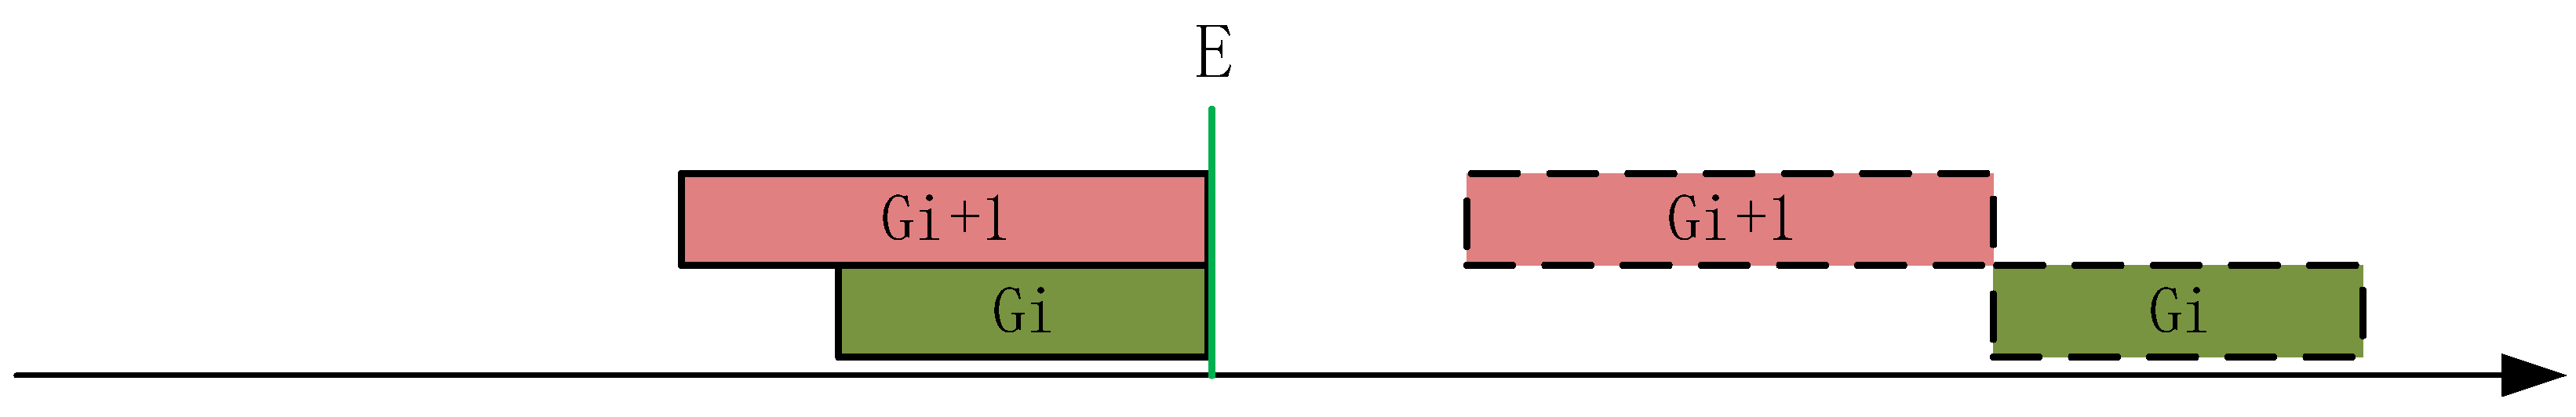
Situation 2. Two groups depart at the same time and arrive at the exit at the same time, causing congestion
Group Gi and group Gi + 1 reach the emergency exit at the same time, namely t p i = t p i + 1 , as shown in Figure 4. In order to avoid the congestion of Gi and Gi + 1 at the emergency exit, one of them can start to escape immediately while the other must delay its departure time and wait at origin. To find the shortest total evacuation time, the delay time should ensure that the two groups pass through the emergency exit successively, and at the same time there is no time interval when they pass through the exit. There are two evacuation solutions to be discussed:
  • In case of emergency, Gi departs immediately and Gi + 1 delays its departure time. For t l i + 1 = 0 , their total evacuation time is as follows
    T = t p i + t e i + t e i + 1
  • In case of emergency, Gi + 1 departs immediately and Gi delays its departure time. For t l i = 0 , their total evacuation time is as follows:
    T = t p i + 1 + t e i + 1 + t e i
    because t p i = t p i + 1 , any of them can be delayed reasonably to avoid congestion when they arrive at the exit at the same time.
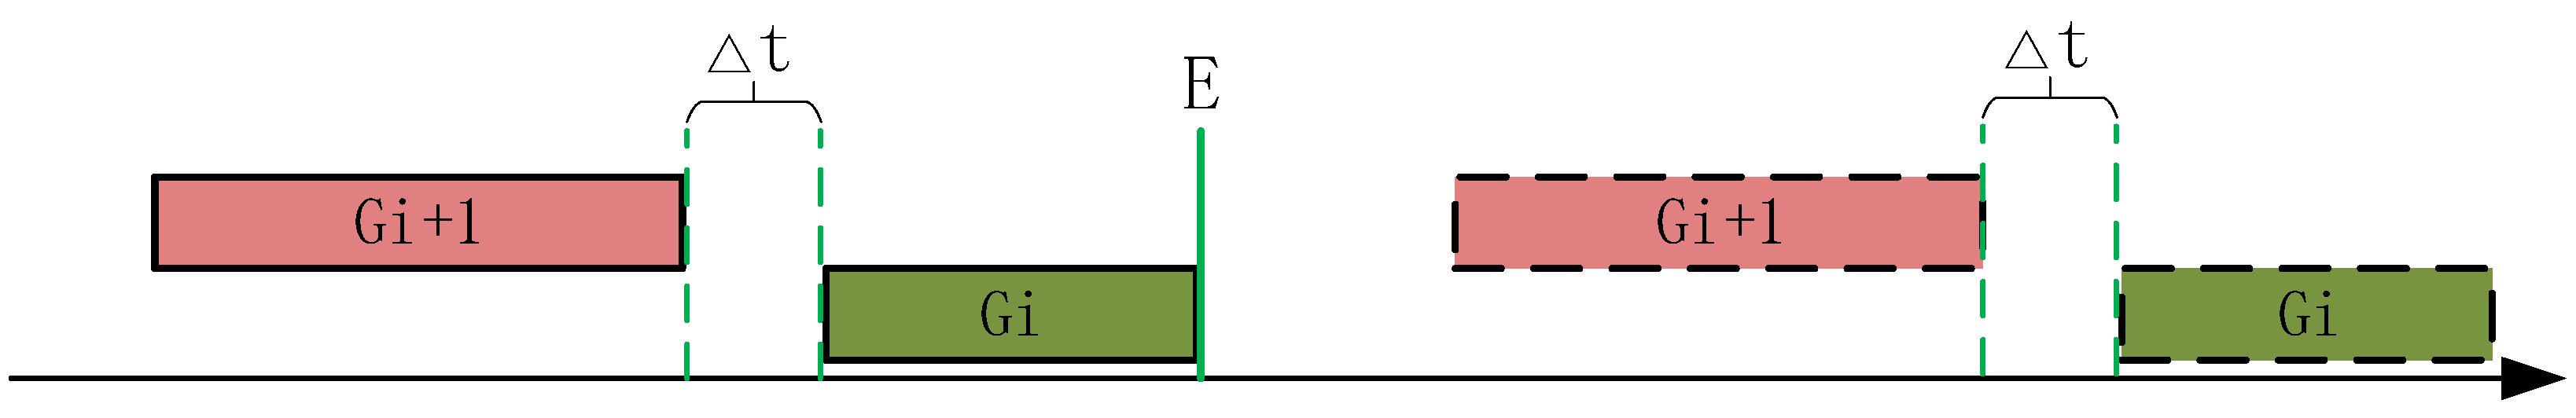
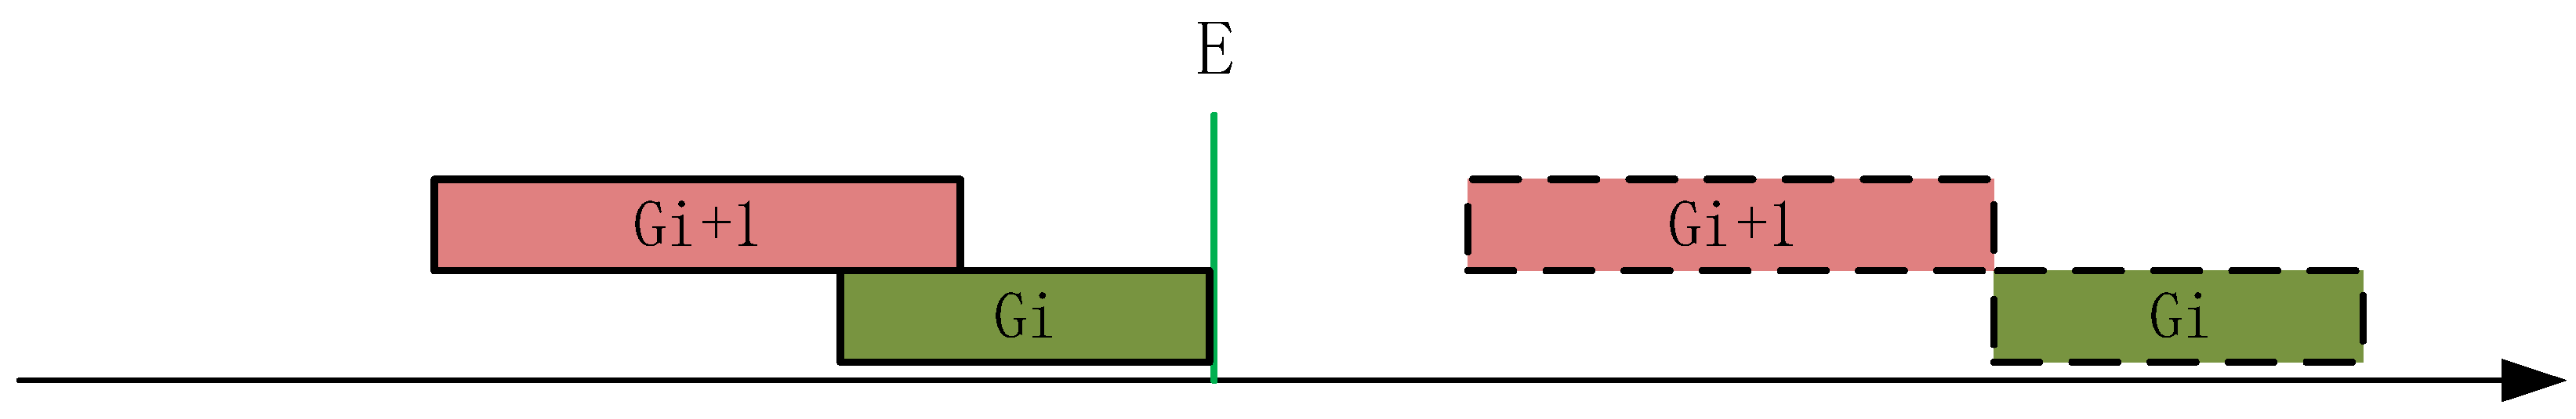
Situation 3. Two groups set out at the same time and arrive at the exit successively, causing congestion.
Assuming that Gi reaches E before Gi + 1, and Gi + 1 reaches E when Gi does not pass through the exit completely, as shown in Figure 5, the conditions for congestion of the two groups are t p i < t p i + 1 and t p i + t e i > t p i + 1 . To find the shortest total evacuation time, the delay time should ensure that the two groups pass through the emergency exit successively, and at the same time there is no time interval when they pass through the exit. There are two evacuation solutions to be discussed:
  • In case of emergency, Gi departs immediately and Gi + 1 delays its departure time. For t l i + 1 = 0 , their total evacuation time is as follows
    T a = t p i + t e i + t e i + 1
  • In case of emergency, Gi + 1 departs immediately and Gi delays its departure time. For t l i + 1 = 0 , their total evacuation time is as follows:
    T b = t p i + 1 + t e i + 1 + t e i
    because t p i < t p i + 1 , T a < T b . Therefore, when two evacuation groups are congested, the group close to the emergency exit E should first start to escape.
In conclusion, in order to minimize the total evacuation time, that is, to ensure the full use of the emergency exit, the group close to the emergency exit should give priority to escape. □
In the staged evacuation planning, the second key work is to calculate the delayed departure time of each evacuation group. Li et al. used the time extended network to calculate the delay time of each group [25]. The method first calculates the time window of each node on the evacuation path occupied by each escape group, and then calculates the latency of each group’s departure time by the arrival sequence and the overlay of these time windows. The iterative process leads to redundant calculations in the algorithm, which results in its low efficiency. To avoid the problem, we comprehensively analyzed the operation of the staged evacuation process, and found Theorem 2 that simplifies the calculation process of the staged evacuation planning.
Theorem 2.
When evacuation groups are congested, the result of calculating their delayed departure times at the congested node is the same as that at the emergency exit.
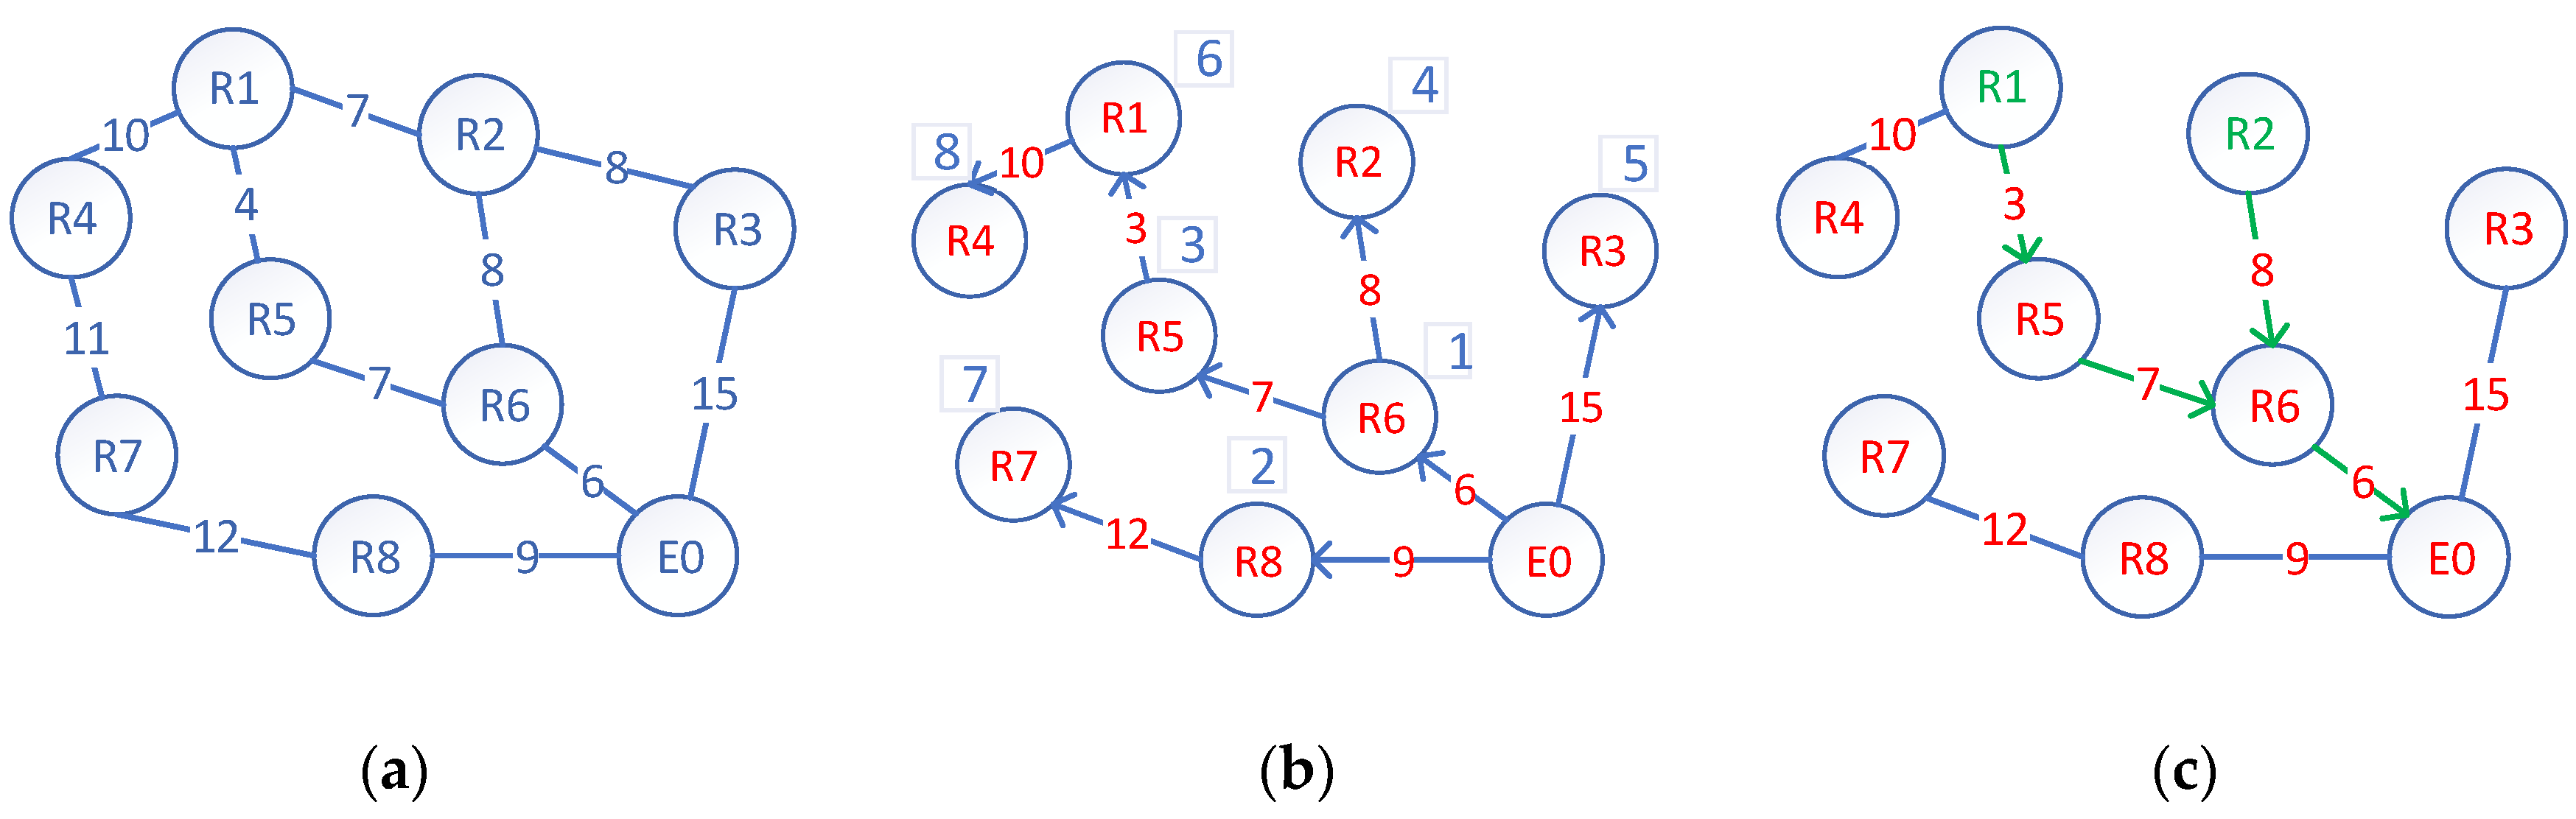
Proof of Theorem 2.
According to Assumptions 3 and 4, in the evacuation network, the shortest paths from the exit to other nodes are equivalent to the shortest paths from other nodes to the exit. Therefore, the shortest paths of all groups can be obtained through Dijkstra algorithm to calculate the shortest paths from the exit to the nodes where each group is located. According to the operation principle of Dijkstra algorithm, the shortest path from the exit to each node will be obtained in the order of the shortest path length from small to large, so as to form the shortest path tree. Figure 6a is an indoor evacuation network. Ri represents a room and E0 represents an exit. When Dijkstra algorithm is called, it will find in turn the shortest paths (P1(E0-R6), P2(E0-R8), P3(E0-R6-R5), P4(E0-R6-R2), P5(E0-R3), P6(E0-R6-R5-R1), P7(E0-R8-R7), P8(E0-R6-R5-R1-R4)) from E0 to R6, R8, R5, R2, R3, R1, R7 and R4 respectively. The route length of these paths will increase in turn, which are 6, 9, 13, 14, 15, 16, 21, 26. These paths compose a shortest path tree with E0 as the root node. The tree is shown in Figure 6b, where the number marked on each node represents the order of obtaining its shortest path when running Dijkstra algorithm. When the shortest path from E0 to each room node is calculated, the shortest path from each room to E0 can be obtained by flipping the path direction. Figure 6c illustrates the two shortest paths. One is the path from R1 to the emergency exit E0 and the other is that from R2 to E0. They meet each other at node R6 and overlap from R6 to E0. □
We can see from the execution process of Dijkstra algorithm that the shortest path of any node whose shortest path isn’t determined will be obtained by the determined shortest paths. Therefore, once the evacuation paths of any two evacuation groups has an intersection, the two paths will be completely overlapped from the intersection to the exit, as shown in Figure 6c. In the process of evacuation, because the two groups have the same escape speed, their travel time after passing the intersection (that is, from the intersection to the emergency exit) is also equal. As a result, it is equivalent to calculate the delay time at the exit or intersection when the two groups are congested at the intersection. Assume that the evacuation speed V = 1 , G1 represents the evacuation group starting from R1, t e 1 = 3 ; G2 represents the evacuation group starting from R2, t e 2 = 5 ; t p i 1 is the evacuation time of G1 from R1 to R6; t p i 2 is the evacuation time of G2 from R2 to R6; t p e 1 is the evacuation time of G1 from R1 to E0; t p e 2 is the evacuation time of G2 from R2 to E0. Then, the delay time of G1 at the intersection t i = t p i 2 + t e 2 t p i 1 , and the delay time of G1 at the exit t e = t p e 2 + t e 2 t p e 1 . t p e 1 t p i 1 = t p e 2 t p i 2 , so t i = t e .

4.2. Proposed Algorithm for Multi-Exit Network

Based on the discussion above, we propose a partitioned and staged evacuation planning (PSEP) algorithm applied to multi-exit buildings. It should be noted about the algorithm that: a) evacuation planning is processed in groups to reduce the complexity of processing; b) for all groups in each evacuation zone, the staged evacuation is implemented; c) in order to minimize the total evacuation time, any two congested groups must successively pass through the emergency exit when delaying their departure time in each zone.

4.2.1. Algorithm Description

The whole algorithm is divided into two procedures. The first procedure will allocate an optimal exit to each evacuation group (all evacuation groups passing through the same exit belong to the same evacuation zone), and the second will compute the departure time of each evacuation group in the same zone. Their pseudo code is as follows.
Input: indoor road network model, exits, escape speed (V), group size (uniform or random) and the number of groups (n).
Output: Total evacuation time (T), the departure time ( t d i ) and the evacuation path for each group.
Notes about Procedure 1: Line 5 adds all evacuation groups in the network into an array N. Line 6 adds all exits in the network into an array E. Line 7 initializes the number of evacuees evacuated by each exit to 0. While N is not empty, namely there are any evacuation groups in N that aren’t allocated to any exits, Lines 9 to14 compare the number of evacuees passing through each exit to find the exit minE with the fewest evacuees. Lines 15 to 16 take minE as the starting point, run Dijkstra algorithm to expand a new shortest path. The group located at the end node of the new path is minG. Then let minG evacuate through minE. Next, update the number of evacuees passing through minE (Line 19) and remove minG from N (Line 20). Thus, an evacuation group is allocated to one exit by one loop. When all evacuation groups are allocated to an exit (that is, until N is empty), the loop ends.
Procedure 1 (Allocate an optimal exit to each evacuation group):
1   Integer ne  //ne represents the number of exits in the network.
2   Array N[n]  //N is used to store all evacuation groups.
3   Array E[ne]  //E is used to store all safety exits.
4   Array G[ne]  //G is used to store the current number of evacuees at each exit.
5   Add all evacuation groups into N
6   Add all evacuation exits into E
7   Initialize all elements of G to 0
8   While N is not empty do
9    Let minE = 1 //minE is a variable used to record the index of the exit with the minimum evacuees.
10     For e = 2 to ne //e is a local loop variable
11       If G[e] < G[minE], then
12         Let minE = e
13       End if
14     End for
15     Take minE as the starting point
16     Run Dijkstra algorithm to expand a new shortest path//referring to Figure 6a
17     Let minG = N[i] //N[i] is the group located at the end node of the new path
18     Let minG evacuate passing through minE
19     Update the number of evacuees passing through minE
20     Remove minG from N
21   End while
In brief, during the implementation of Procedure 1, there is a Dijkstra algorithm at each exit, but only the Dijkstra algorithm on the exit with the least number of evacuees runs at each time, and the Dijkstra algorithm only expands one shortest path at a time (that is, to find an evacuation group). Then the number of evacuees allocated to each evacuation exit is compared with each other to determine which exit to run Dijkstra algorithm until all evacuation groups are allocated.
Notes about Procedure 2: Lines 3 adds all evacuation groups in the network into an array N with the array length of n. Line 4 sorts all evacuation groups in N according to their shortest route length. Then an outer loop (Line 5) is used to process each zone, namely, each exit. There are two inner loops in the outer loop. The first inner loop (Lines 6 to 10) is used to extract all each evacuation groups passing through the same exit from N, then adds them into M by order. Line 11 makes group 1 in M depart immediately once an emergency occurs, and a = 1, where a is the evacuation sequence number of the first group in each evacuation combination that successively passes through the emergency exit. Then the second inner loop (Lines 12 to 17) is executed to compute the departure time of Gi in M, where i is from 2 to m that is the number of groups in the same zone. The departure time of Gi is calculated as follows: t d i = t p a + ( t e a + + t e i 1 ) t p i . If t d i > 0 , the delayed time of Gi is t d i . Otherwise, Gi evacuates immediately without any delay once an emergency occurs, and let a = i . Execute the inner loop until all evacuation groups in M get their departure time, then return to Line 5. When the outer loop finishes and the procedure ends.
Procedure 2 (Calculate the departure time of each group in each zone):
1   Array N[n] //N is used to store all evacuation groups
2   Array M[n]  //M is used to record the groups assigned to the same exit
3   Add all evacuation groups into N
4   Sort N By their route length
5   For e = 1 to ne //to process each zone by the loop
6    For j = 1 to n  //find all groups that passes through Exit E[e] by the loop
7      If N[j] passes through E[e] then
8        Add N[j] into M
9      End if
10    End for
11    Let t d 1 = 0 , a = 1
12    For i = 2 to m //to compute the departure time of all groups passing through Exit E[e] by the loop
13       t d i = t p a + ( t e a +       + t e i 1 ) t p i
14      If t d i < 0 , then
15        t d i = 0 , a = i
16     End if
17    End for
18  End for

4.2.2. Time Complexity Analysis

In Procedure 1, the while loop runs n times, and the for loop runs ne times. In addition, when running Dijkstra algorithm to expand each node, the path length of all nodes in the network needs to compare n times. So, the time complexity of Procedure 1 is O ( n ( n + n e ) ) . For n e n , the final time complexity is O ( n 2 ) .
In Procedure 2, the outer for loop runs ne times, the first inner for loop runs n times, the second for loop runs m times. So, the time complexity of Procedure 2 is O ( n e ( n + m ) ) . For m n , the final time complexity is O ( n * n e ) . Of course, this process also includes a sorting process with the time complexity O ( n 2 ) or O ( n log 2 n   ) .
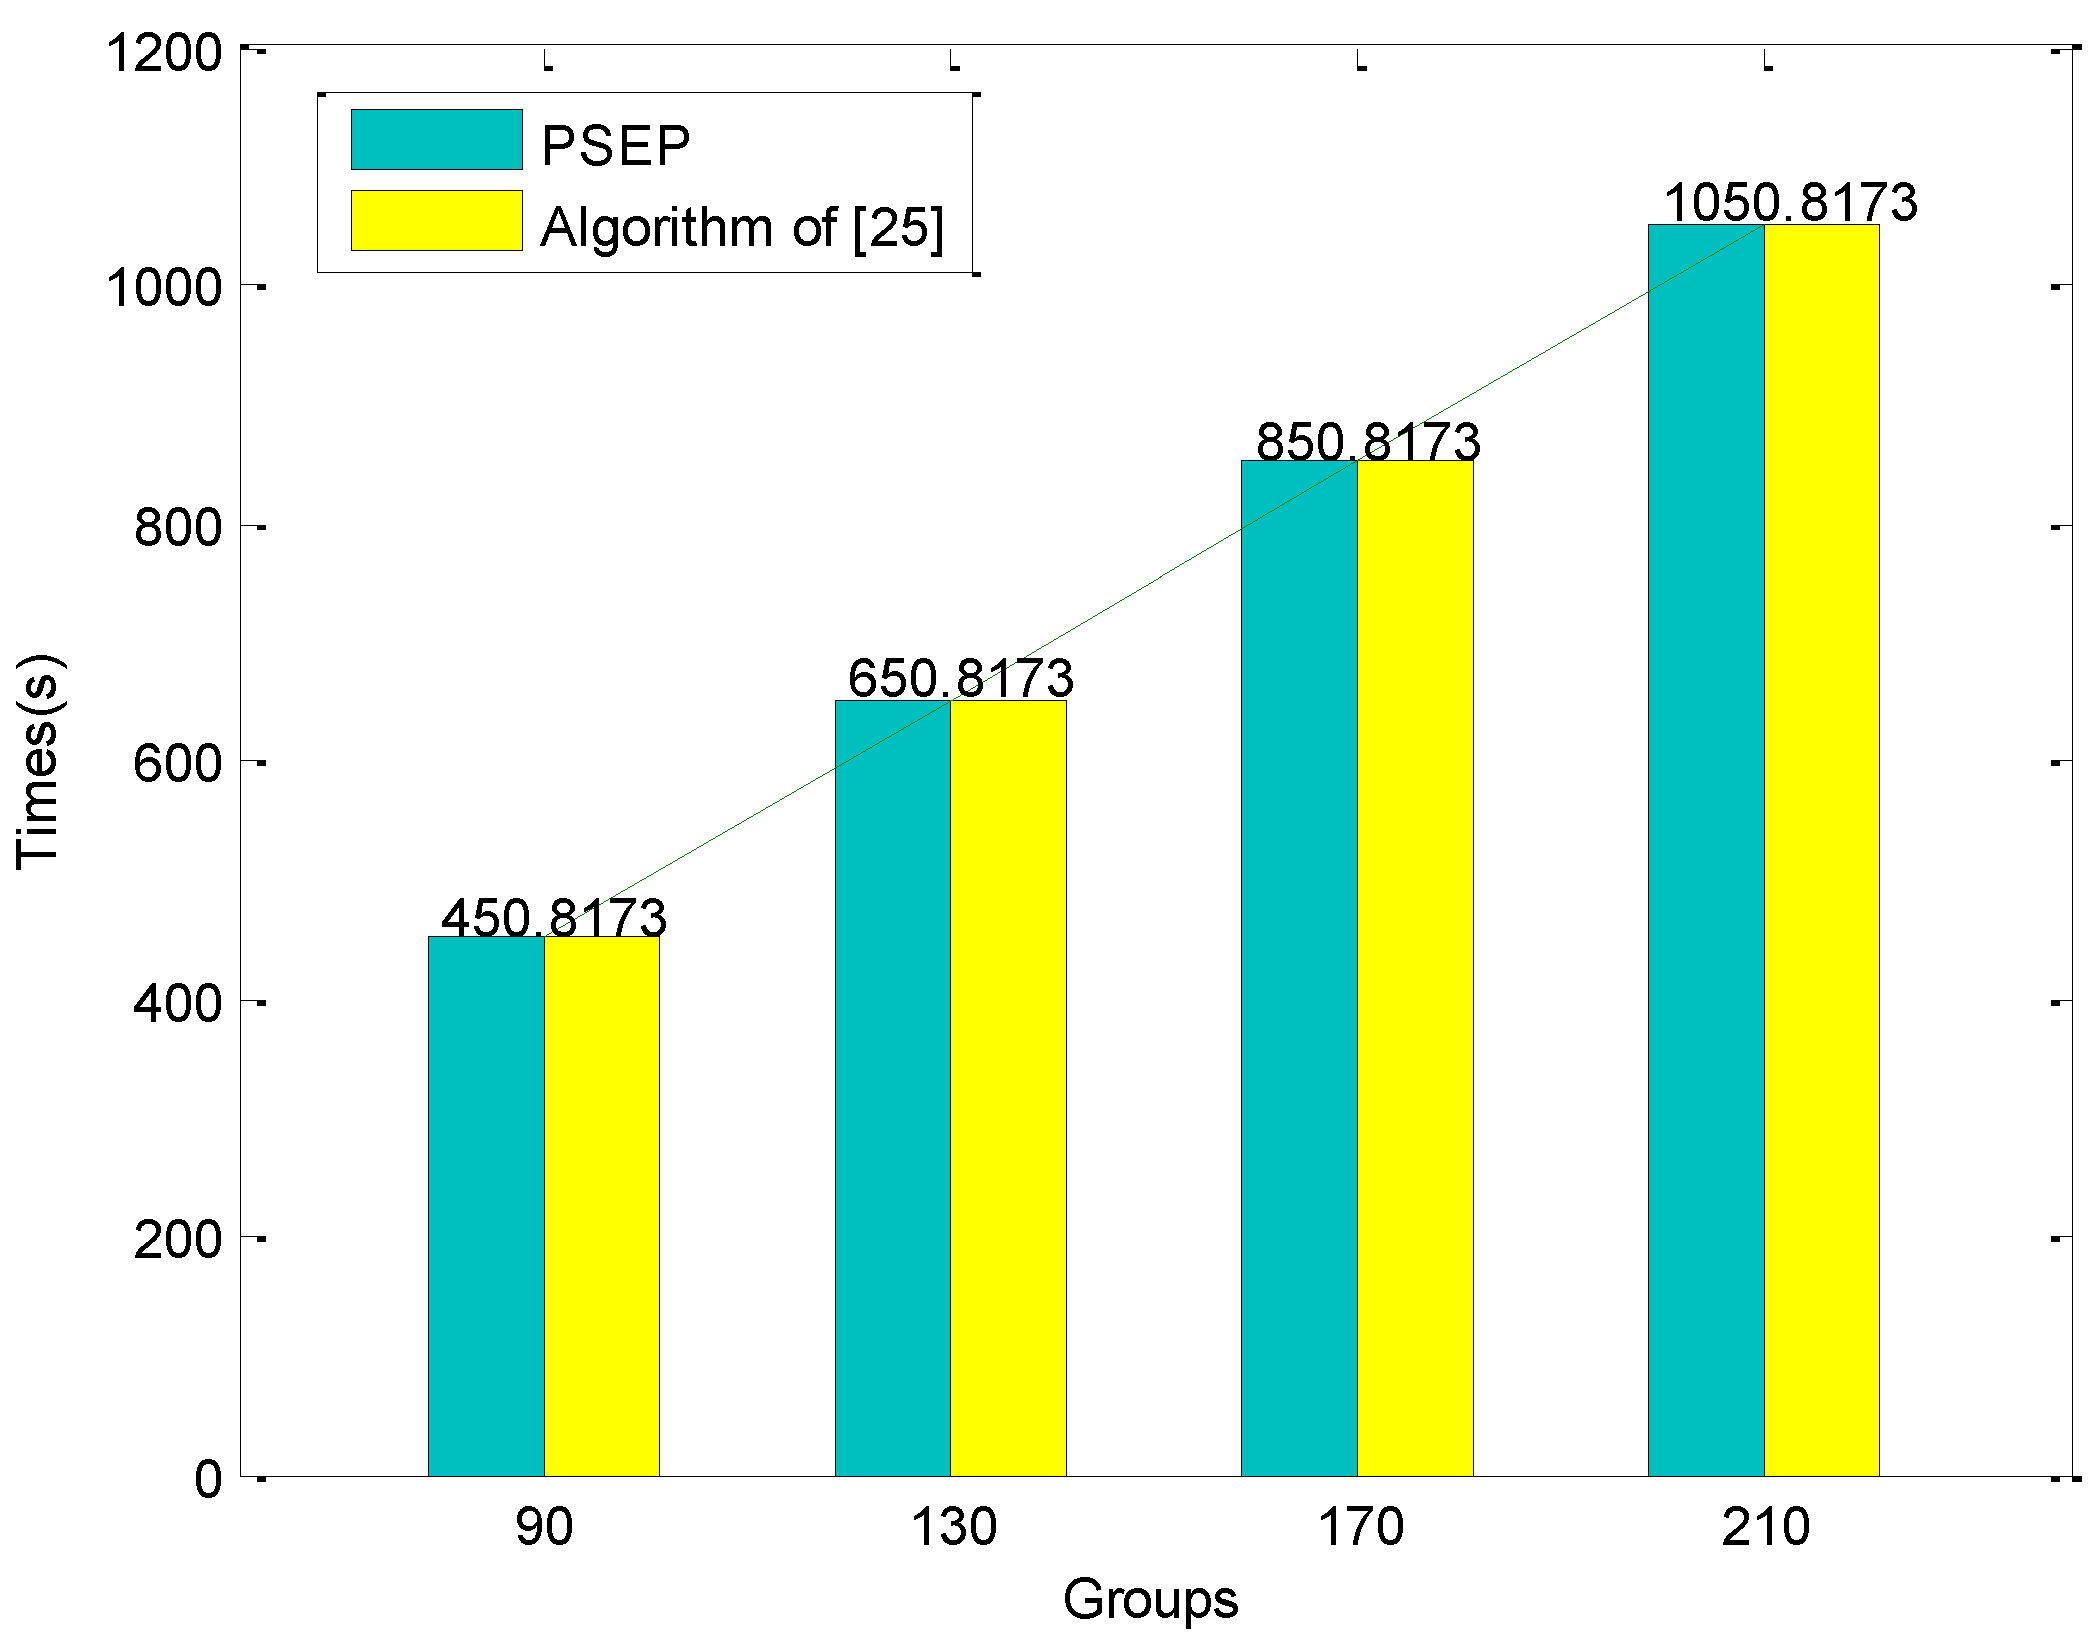
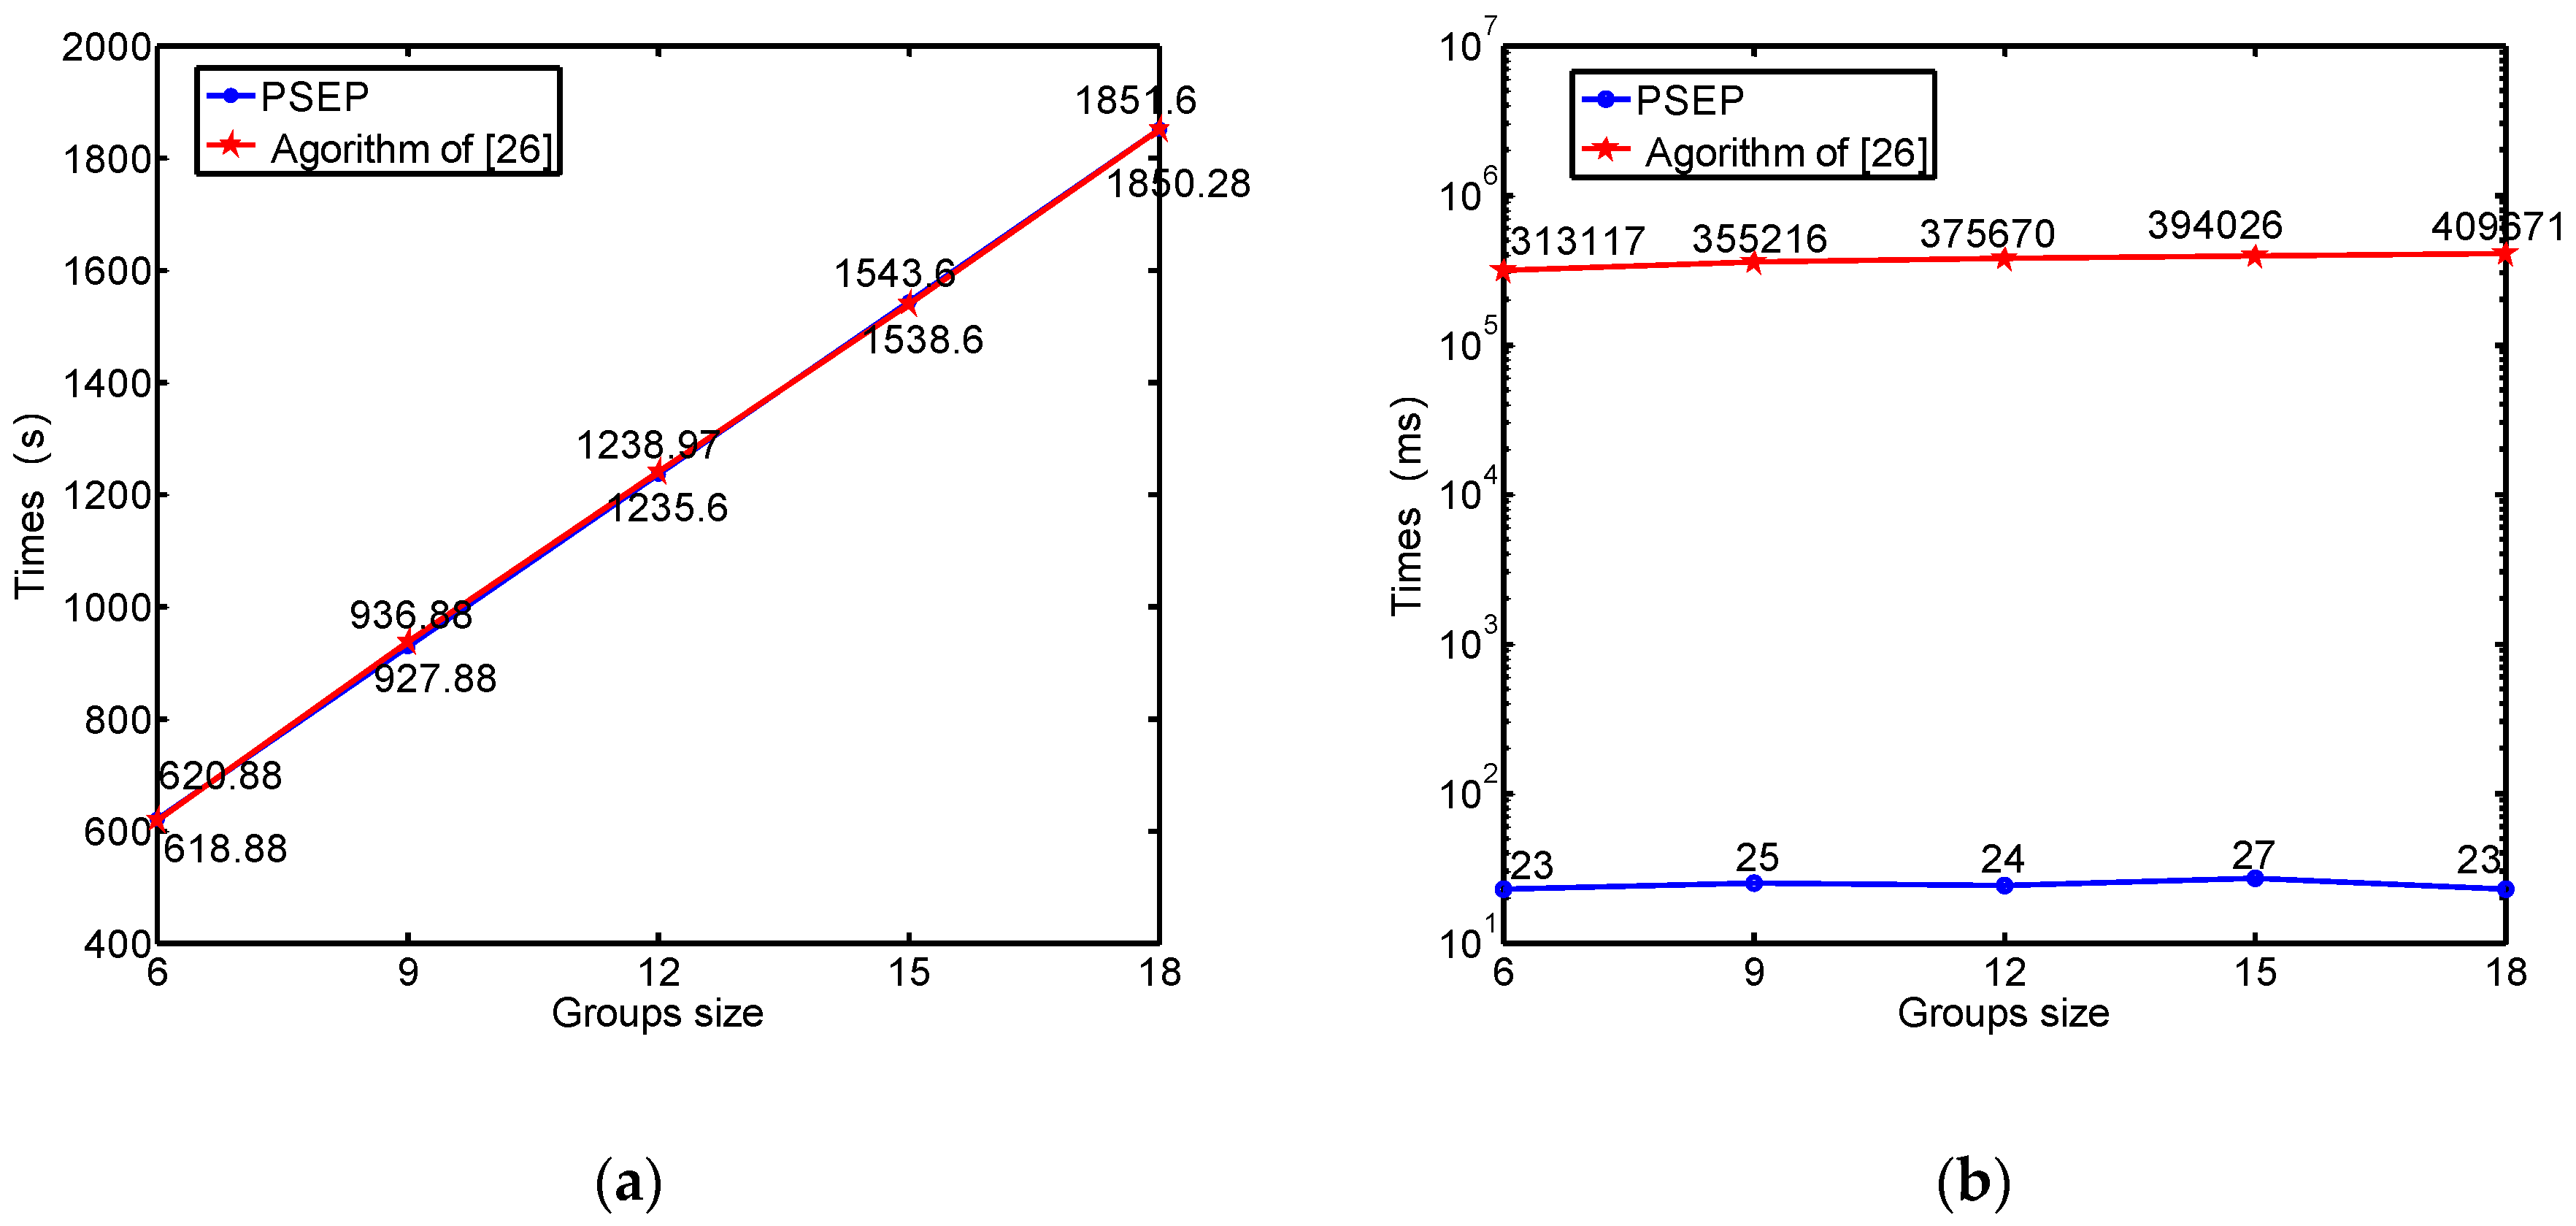
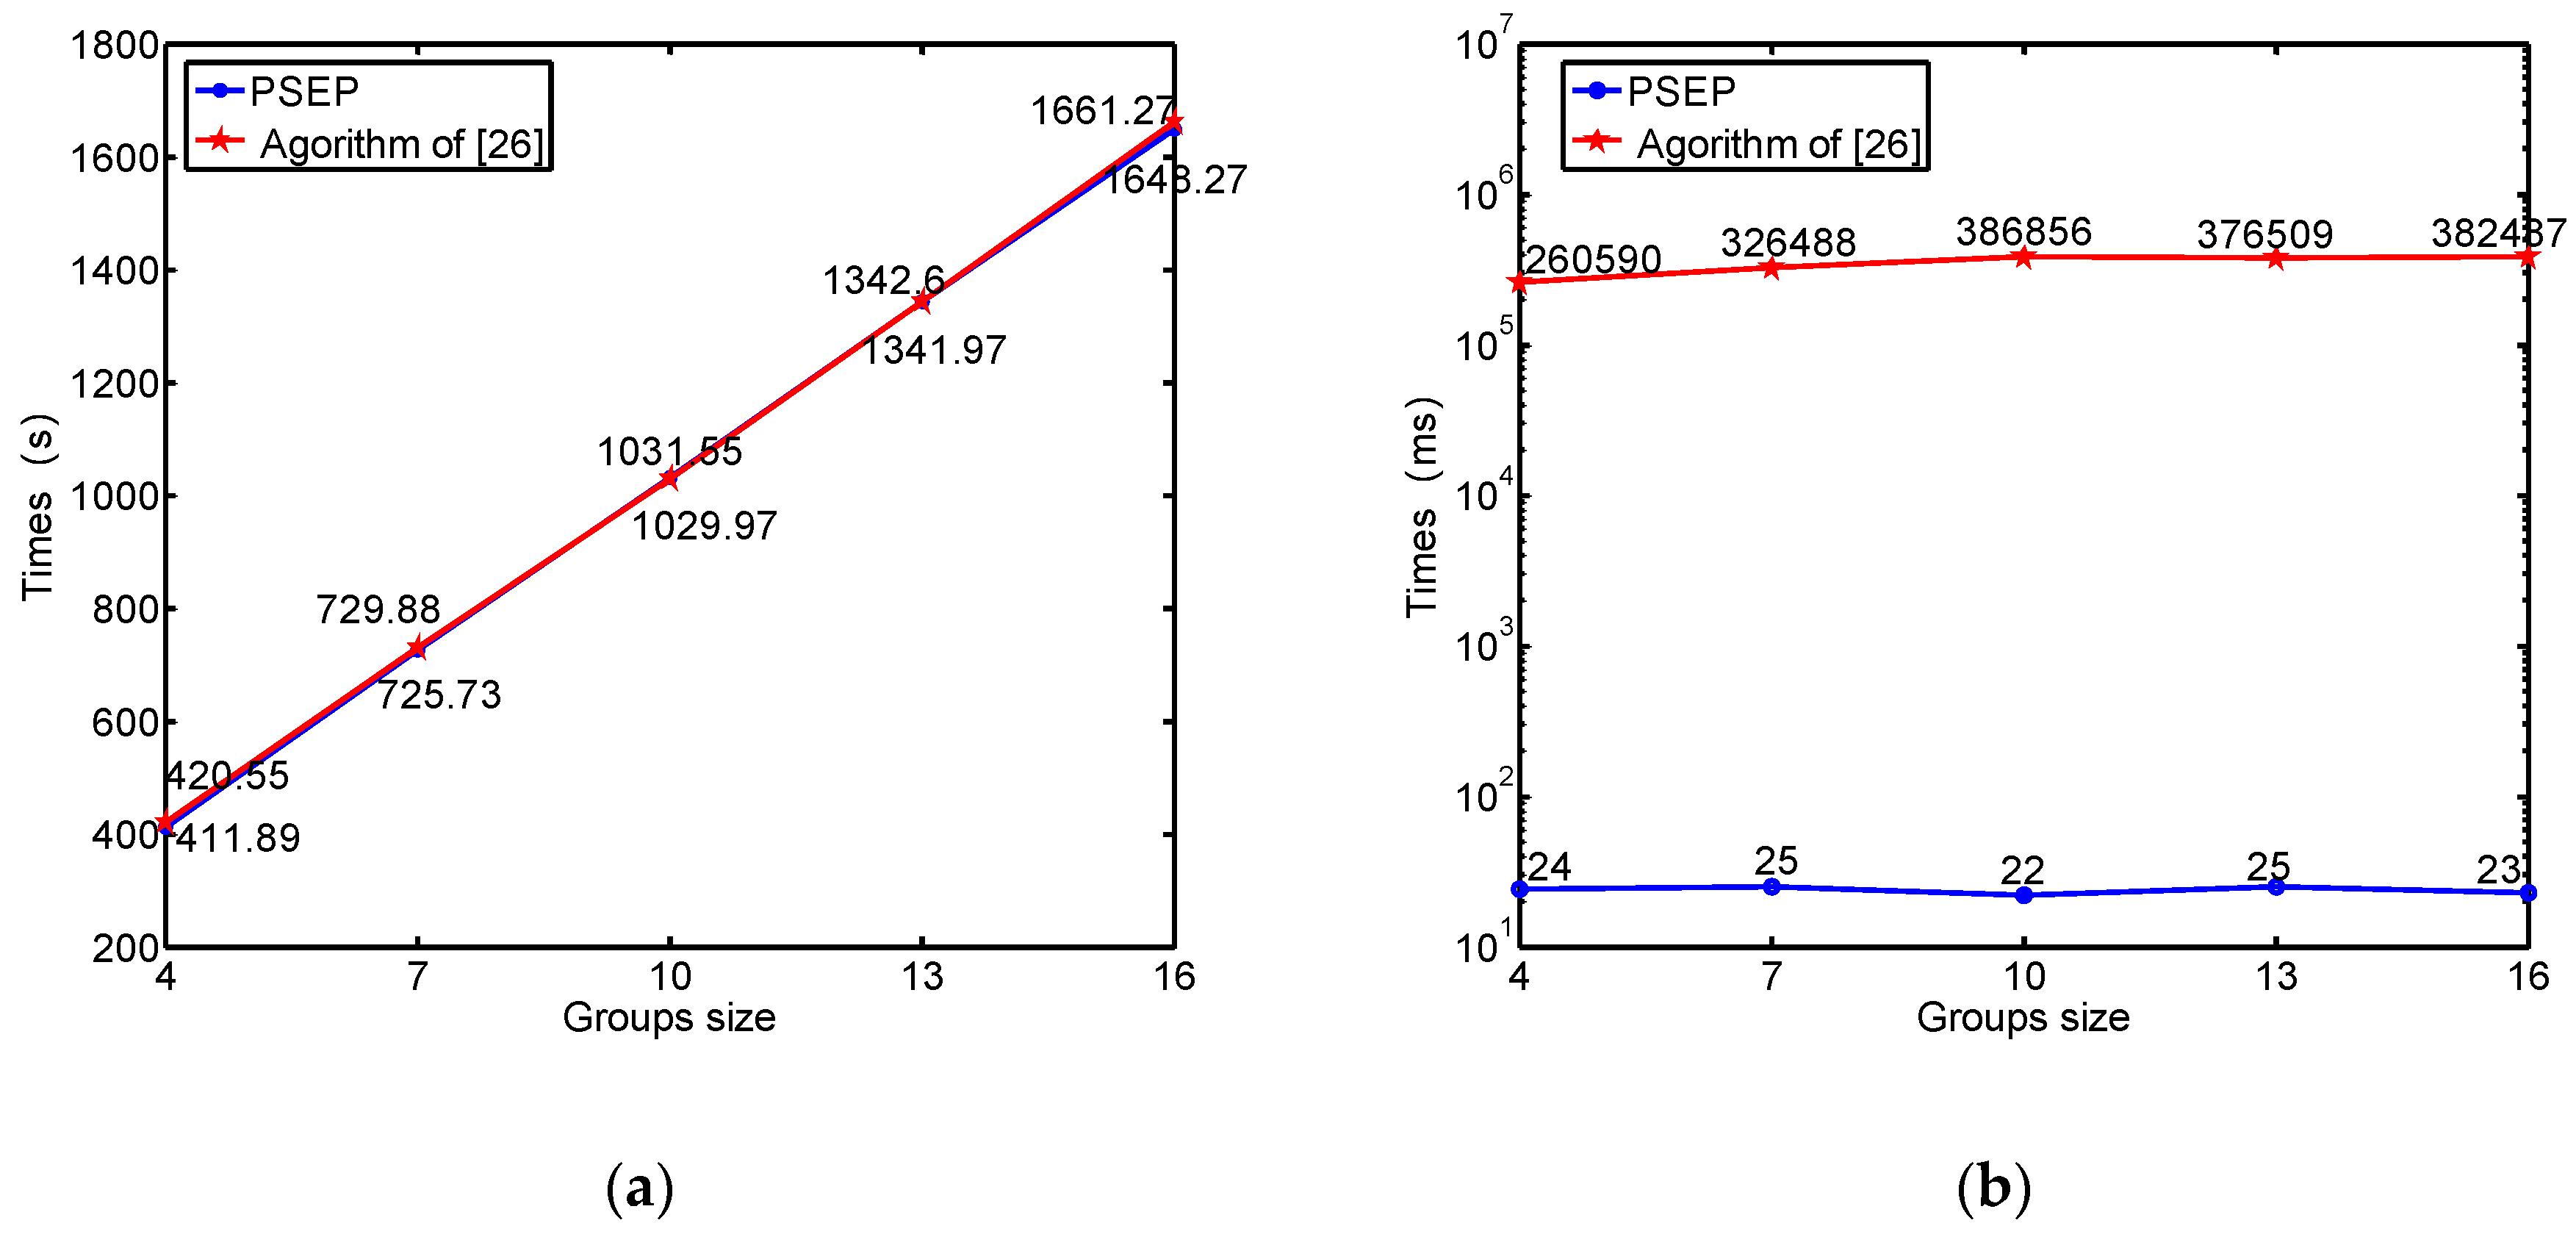
Once the PSEP algorithm completes partition, each zone is equivalent to a single-exit evacuation network. For a zone, the time complexity of calculating the departure time of each evacuation group is O ( m ) , while the time complexity of completing the calculation by the algorithm in [25] is O ( m 2 k ¯ ) , where m is the number of groups in the zone, k is the number of arcs of all evacuation path and k ¯ is the arithmetic mean of k.

5. Case Study

To verify the validity and efficiency of the PSEP algorithm, we conducted two tests. One was used to verify the correctness and efficiency of the algorithm for the single-exit evacuation; the other to discuss the rationality of the partition method of the PSEP algorithm and to compare its performance with an existing algorithm. Since the PSEP algorithm is based on the single-exit evacuation algorithm, both tests are valuable to illustrate the advantages of the PSEP algorithm. Test data is the three-dimensional path network of the teaching building J6 of Shandong University of Science and Technology (SDUST), as shown in Figure 7, where each vertex (i.e., node) in the network represents an escape group and each edge (i.e., arc) represents a segment of indoor path. The network model consists of five layers, 818 nodes and 853 edges. On the first floor, there are three safety exits: E1, E2 and E3). During the tests, nodes in the route network are randomly selected as the starting nodes in order to simulate the evacuation environment in reality.
All involved algorithms were developed in C-Sharp and run on the portable notebook whose configuration were as follows: CPU i7-6500u, main frequency 2.5 GHz, running memory 12 G and the solid-state disk with capacity of 256 G.

5.1. Tests Based on Single-Exit Network

The PSEP algorithm is mainly inspired by the algorithm of [25]. We firstly compare and discuss their efficiency and results. Additionally, the algorithm of [25] is only suitable for the single-exit network, so we choose a part of the teaching building J6 (i.e., an evacuation zone with one safety exit) as the test zone to test the influence of the number of escape groups, the size of groups, the escape speed and other factors on the total evacuation time, as well as the efficiency of the two algorithms. The test network includes only one exit E1, 210 edges and 210 vertices. When the PSEP algorithm is applied to the single-exit network, the first procedure of the algorithm is omitted for the network has only one exit.

5.1.1. Influence of the Number of Groups on Total Evacuation Time

The size of all groups is 15 m, the escape speed is fixed as 3 m/s, and the number of evacuation groups is set to 90, 130, 170, 210 respectively. The test results are shown in Figure 8.
Figure 8 shows that when the group size and the escape speed of each evacuation group are fixed, their total evacuation times increase linearly with the number of evacuation groups for both algorithms. At the same time, the total evacuation times of the two algorithms are equal.

5.1.2. Influence of Evacuation Speed on Total Evacuation Time

The number of evacuation groups is 210, the group size is 15 m, and the escape speed is set to 2, 3, 4, and 5 m/s respectively. The test results are shown in Figure 9.
Figure 9 illustrates that when the number of evacuation groups and the group size are fixed, the total evacuation times of the two algorithms decrease with the increase of the escape speed.

5.1.3. Influence of Group Size on Total Evacuation Time

The number of evacuation groups is 210, the escape speed is 3 m/s, and the group size is set to 6, 15, 24, and 33 m. The test results are shown in Figure 10.
Figure 10 illustrates that when the number of evacuation groups and the escape speed are fixed, their total evacuation times increase linearly with the increase of the group size for both algorithms.

5.1.4. Comparison of Operating Efficiency

The group size is 15 m, the escape speed is 3 m/s, and the number of evacuation groups is set to 120, 280, 440, 600, 760, 920 and 1080 respectively. The test statistics are shown in Table 1. Td represents the time consumed by the algorithm of [25] and Tp represents that by the PSEP algorithm. Figure 11a shows the curves of the time consumed by the two algorithms, from which we can see that their time consumption is increasing with the increase of the number of evacuation groups, but the time consumed by the PSEP algorithm is significantly less than that by the algorithm of [25]. Figure 11b indicates the ratio curve of the time consumed by the two algorithms, from which we can see that the more evacuation groups there are, the more obvious the efficiency advantage of the PSEP algorithm over the algorithm of [25] is. When the number of groups is 1080, Td/Tp reaches 41465.
It can be seen from the first three tests that the total evacuation time of the two algorithms is the same regardless of the evacuation condition, which proves the correctness of the proposed algorithm. Test 4 illustrates that the PSEP algorithm is much more efficient than the algorithm of [25]. The reason is that there are a lot of repeated calculations in the algorithm of [25]. Every time the departure time of an evacuation group is determined, it is necessary for each evacuation group whose departure time has not been determined to recalculate its time windows at all nodes on its evacuation path, while the PSEP algorithm only needs to calculate the time window of each group occupying the exit to determine the departure time of all escape groups. In addition, the tests above also prove the correctness of Theorems 1 and 2.

5.2. Tests Based on Multi-Exit Network

According to the principle of the PSEP algorithm, the partition method and the density of indoor evacuees are two important factors that affect the overall evacuation time. Therefore, we tested their influence on evacuation efficiency. Furthermore, the relation between the evacuation path length and delayed time of each evacuation group is tested. Its performance is also compared with that of an existing algorithm.

5.2.1. Influence of Partitioning Methods on Evacuation Efficiency

In theory, the partition method based on the principle of “nearest evacuation” will increase the overall evacuation time when the density of indoor evacuees is larger. In order to verify the theory, we apply the principles of “nearest evacuation” and “balanced evacuation” to the PSEP algorithm respectively to test their influence on evacuation. Figure 12a shows the partitioned indoor network only based on “nearest evacuation” that will find the nearest exit for each group, and Figure 12b shows that based on “balanced evacuation” that makes every exit have the approximately equal number of evacuees by considering both the number of evacuees and their path length. It can be seen from Figure 12 that the partition of some nodes in the route network has changed. Many nodes originally belonging to the zone E3 are assigned to E1, while the zone E1 also occupies part of the nodes in the original zone E2, and the zone E2 regains part of the nodes from the original zone E3. Furthermore, these adjusted nodes are mainly distributed in the adjacent area of the original zones.
Table 2 shows the number of evacuation groups, the number of evacuees of each evacuation zone and their total evacuation time when the PSEP algorithm adopts the two partitioning methods respectively. It can be seen from the table that the number of evacuation groups of each exit when using the principle of “nearest evacuation” is not balanced while that are balanced when using the principle of “balanced evacuation”. The nearest evacuation makes exits E1 and E2 are not fully utilized, which increases the overall evacuation time by 265 seconds compared with that of the balanced evacuation. Therefore, we can conclude that the partition strategy of evacuation zones will greatly affect the evacuation efficiency of the evacuation scheme.

5.2.2. Influence of Evacuation Density on Total Evacuation Time

Let the evacuation density ER = EL/NL, where EL is the total length of all evacuation groups and NL is the total length of all edges of the evacuation network. To test the influence of the evacuation density on the total evacuation time of different evacuation plans, we implemented the nearest evacuation and the balanced evacuation respectively with different evacuation densities. The total length of the evacuation route network is 5443.3 m, and the number of evacuation groups is 818. The length of all evacuation groups is set as 0.5, 1, 2, 3, 4 and 5 m respectively. The test results are shown in Table 3, where Tn represents the total evacuation time of nearest evacuation and Tb represents that of balanced evacuation. We can see that balanced evacuation has obvious advantages over nearest evacuation when the density of evacuees is large but nearest evacuation has a shorter overall evacuation time when the density of evacuees is small. Figure 13 shows that the greater the density of evacuees, the more advantageous balanced evacuation will be.

5.2.3. Evacuation Process Simulation

In order to visually verify the effectiveness of our algorithm, we took the whole teaching building J6 of SDUST as the test scene to simulate the emergency evacuation process using our evacuation simulation software. In the simulation scene, color is used to identify different evacuation groups, and the length of line segment represents group size. Assuming that the start time of evacuation is t0, escape speed is 3 m/s, group size is random and the sum of evacuation groups is 818. In case of emergency, the visual simulation results of evacuation process of all groups starting to escape at the same time are shown in Figure 14, where (a)–(d) are the distribution of all escape groups at t0 + 8 s, t0 + 16 s, t0 + 24 s, and t0 + 32 s, respectively. From Figure 14, we can see that many colorful line segments are mixed together, which indicates that there is a large area of congestion. Obviously, serious congestion will reduce the escape speed of evacuees and ultimately lead to the extension of the total evacuation time.
Figure 15 shows the visual simulation results of the PSEP algorithm, where (a)–(f) are the distribution of all escape groups at t0 + 32 s, t0 + 64 s, t0 + 112 s, t0 + 144 s, t0 + 232 s, t0 + 272 s, respectively. The simulation process shows that all groups escape orderly according to the assigned departure time without any congestion on the way and all groups pass through the emergency exit successively. All of these ensure the efficient operation of the whole evacuation process and reduce the overall evacuation time.
The PSEP algorithm adopts the partitioned and staged evacuation strategy. Once evacuation partition is completed, the evacuation process in each zone is independent of each other. The total evacuation time of all escape groups is the maximum evacuation time of each zone. Table 4 shows the relationship between the evacuation path length and the delayed departure time of some evacuation groups in the zone E1, and Figure 16 shows that of all evacuation groups in zones E1, E2, and E3 respectively. We can see that the delayed departure time of all groups in each zone increases with the increase of the evacuation path length.

5.2.4. Relation between Evacuation Path Length and Delayed Time

Table 4 shows the relationship between the length of the evacuation path and the delayed time in the case of a large density of evacuees. To get a more comprehensive picture of their relationship, we conducted the other test in the case of a low density of evacuees. Let all evacuation groups be 2 m in size and the other test conditions will remain the same. Table 5 shows the evacuation path length and the delayed departure time of the partial evacuation groups in zone E1. Figure 17 shows the relationship between the evacuation path length and the delayed departure time for all evacuation groups in zones E1, E2, and E3, respectively.
Table 5 shows that the delayed time of the evacuation groups will not increase completely with the increase of their evacuation path length, and some of them will be exceptional. This exception occurs because of the time interval between some of the adjacent evacuation groups (Figure 3), which will reduce the delayed departure time of the group that arrives later. For example, if the time windows of two groups A and B occupying the same exit are [23.0, 25.0] and [29.0, 32.0] respectively when they start to escape at the same time, they will not congest with each other. But, if the groups ahead of A makes it have to delay 5 s to depart in order to avoid congestion at the exit, the time window of the group A occupying the exit becomes [28.0, 30.0]. To avoid congestion with the group A, and the group B should be delayed by 1 second that is less than the delayed time of the group A.

5.2.5. Performance Comparison

Li et al. extended their approach suitable for the single-exit evacuation to the multi-exit evacuation in [26]. Here, our algorithm is compared with that in [26] based on a testing network model consisting of 923 nodes and 1779 edges. Three of these nodes are exits. When the group size is uniform, the test results are shown in Table 6, where Ng and Ne are the number of groups and the number of evacuees passing through each exit and Te is the evacuation time at each exit. Figure 18 shows the change of the total evacuation time and the operation time of each algorithm when the group size increases gradually.
To make the test more realistic, we let the group size go to random numbers. When the group size is random, the test results are shown in Table 7, where the value of the group size is a range, which means that the group size can take any value within this range randomly. Figure 19 shows the change of total evacuation time and the operation time of each algorithm when the group size increases gradually.
As shown in Table 6 and Table 7 and Figure 18 and Figure 19, our algorithm and that of [26] are very close in the overall evacuation time, but the planning efficiency of our algorithm is much higher than that of [26]. For applications that require rapid or real-time evacuation planning, our algorithm has obvious advantages.

6. Conclusions

For indoor emergency evacuation with a large number of evacuees, a partitioned and staged evacuation planning algorithm considering indoor congestion is proposed. According to the idea of “balanced evacuation”, the algorithm coordinates the number of evacuees at different exits by the improved Dijkstra algorithm, which partitions the whole evacuation area and turns the multi-exit evacuation into the single-exit evacuation, thus simplifying the complexity of problem processing. For the single-exit evacuation, the proposed algorithm only needs to consider the time conflict between the time windows of all evacuation groups at exits, then it can calculate the departure time of each group. Compared with the traditional algorithm that considers the conflict between the time windows of all evacuation groups at every node of the evacuation paths to calculate the departure time of each group, it reduces the calculation at redundant path nodes and greatly improves the efficiency of emergency evacuation planning. In practice, the PSEP algorithm in this paper provides not only the best evacuation path but also the optimal departure time for each group to ensure that all groups will not be congested during evacuation, which has a strong operability. The smart city makes it possible to access indoor evacuation information in real time such as the distribution of evacuees and the development of an indoor disaster, which provides a data base for the real-time design of an evacuation scheme. The design requires high efficiency of planning algorithms. Our algorithm is simple and has great advantages in operating efficiency, which will meet the development and demand for intelligent emergency evacuation systems and emergency command.
Although the PSEP algorithm achieves better results in the case of crowded indoor occupants by transforming the multi-exit indoor evacuation problem into the single-exit indoor evacuation problem based on the “balanced evacuation” principle, it is still an approximate optimal result due to the lack of rigorous mathematical reasoning and proofs. Meanwhile, the partition strategy may not obtain the global optimal solution when the indoor occupants are sparse. Therefore, we will consider the influence of the density and distribution of evacuees on the total evacuation time and the connection among all exits in the future to optimize the total evacuation time further. In addition, when an emergency occurs, let the groups that may be congested wait in the original place, which is not applicable to the occurrence of local disasters such as indoor fire. It should be considered to set up an indoor disaster risk area, evacuate the evacuees in the risk area to the safety area first, and then evacuate them to the safety exit. We will attempt to resolve this in a further study.

Author Contributions

Conceptualization, Litao Han and Haisi Zhang; Methodology, Litao Han, Huan Guo and Qiaoli Kong; Software, Huan Guo, Haisi Zhang and Cheng Gong; Validation, Huan Guo, Haisi Zhang and Cheng Gong; Writing–original draft, Litao Han, Huan Guo and Aiguo Zhang; Writing–review & editing, Litao Han, Qiaoli Kong and Aiguo Zhang. All authors have read and agreed to the published version of the manuscript.

Funding

This research was funded by the Natural Science Foundation of Shandong Province (Grant Nos. ZR2017MD003 and ZR2017MD032), the National Natural Science Foundation of China (Grant No. 41704015), and the Natural Science Foundation of Fujian Province (Grant No. 2016J01198).

Acknowledgments

We are grateful for the assistances of the reviewers and editors, and especially would like to express our gratitude to Xiang Li and his team from Key Lab of Geographical Information Science, Ministry of Education, East China Normal University for providing their source code that makes us able to compare our algorithm.

Conflicts of Interest

The authors declare no conflict of interest.

References

  1. Kinateder, M. Human behaviour in severe tunnel accidents: Effects of information and behavioural training. Transp. Res. Part F Traffic Psychol. Behav. 2013, 17, 20–32. [Google Scholar] [CrossRef]
  2. Li, X.; Li, Q.; Xu, X.; Xu, D.; Zhang, X. A novel approach to developing organized multispeed evacuation plans. Trans. GIS 2018, 22, 1205–1220. [Google Scholar] [CrossRef]
  3. Shin, Y.; Kim, S.; Moon, I. Simultaneous evacuation and entrance planning in complex building based on dynamic network flows. Appl. Math. Model. 2019, 73, 545–562. [Google Scholar] [CrossRef]
  4. Bi, H. Evacuee flow optimisation using G-network with multiple classes of positive customers. In Proceedings of the IEEE 24th International Symposium on Modeling, Analysis and Simulation of Computer and Telecommunication Systems, London, UK, 19–21 September 2016; pp. 135–143. [Google Scholar] [CrossRef]
  5. Pelechano, N.; Malkawi, A. Evacuation simulation models: Challenges in modeling high rise building evacuation with cellular automata approaches. Autom. Constr. 2008, 17, 377–385. [Google Scholar] [CrossRef]
  6. Wang, R.; Zhou, L.; Liu, J. Study on cellular automation evacuation model based on improved ant colony optimization algorithm. China Saf. Sci. J. 2018, 28, 38–43. [Google Scholar] [CrossRef]
  7. Pan, X.; Han, C.; Dauber, K.; Law, K.H. A multi-agent based framework for the simulation of human and social behaviors during emergency evacuations. Ai Soc. 2007, 22, 113–132. [Google Scholar] [CrossRef]
  8. Ren, C.; Yang, C.; Jin, S. Agent-based modeling and simulation on emergency evacuation. Complex Sci. 2009, 5, 1451–1461. [Google Scholar] [CrossRef]
  9. Chen, X.; Zhan, F. Agent-based modeling and simulation of urban evacuation: Relative effectiveness of simultaneous and staged evacuation strategies. J. Oper. Res. Soc. 2008, 59, 25–33. [Google Scholar] [CrossRef]
  10. Parisi, D.R.; Dorso, C.O. Microscopic dynamics of pedestrian evacuation. Phys. A Stat. Mech. Appl. 2005, 354, 606–618. [Google Scholar] [CrossRef]
  11. Yang, X.; Dong, H.; Wang, Q.; Chen, Y.; Hu, X. Guided crowd dynamics via modified social force model. Phys. A Stat. Mech. Appl. 2014, 411, 63–73. [Google Scholar] [CrossRef]
  12. Helbing, D.; Isobe, M.; Nagatani, T.; Takimoto, K. Lattice gas simulation of experimentally studied evacuation dynamics. Phys. Rev. E 2003, 67, 067101. [Google Scholar] [CrossRef]
  13. Guo, X.; Chen, J.; Zheng, Y.; Wei, J. A heterogeneous lattice gas model for simulating pedestrian evacuation. Phys. A Stat. Mech. Appl. 2012, 391, 582–592. [Google Scholar] [CrossRef]
  14. Li, W.; Li, Y.; Yu, P.; Gong, J.H.; Shen, S.; Huang, L.; Liang, J.M. Modeling, simulation and analysis of the evacuation process on stairs in a multi-floor classroom building of a primary school. Phys. A Stat. Mech. Appl. 2017, 469, 157–172. [Google Scholar] [CrossRef]
  15. Liu, S.; Yang, L.; Fang, T.; Li, J. Evacuation from a classroom considering the occupant density around exits. Phys. A Stat. Mech. Appl. 2009, 388, 1921–1928. [Google Scholar] [CrossRef]
  16. Fleischer, L.; Skutella, M. Minimum cost flows over time without intermediate storage. In Proceedings of the 14th Annual ACM-SIAM Symposium on Discrete Algorithms, Baltimore, MD, USA, 12–14 January 2003; Society for Industrial and Applied Mathematics Philadelphia: Philadelphia, PA, USA, 2003; Volume 8, pp. 66–75. [Google Scholar]
  17. Zhang, X.; Chang, G. A dynamic evacuation model for pedestrian–vehicle mixed-flow networks. Transp. Res. Part C Emerg. Technol. 2014, 40, 75–92. [Google Scholar] [CrossRef]
  18. Zheng, X.; Cai, L.; Zhang, M.; Jing, H.L.; Chen, Y. Emergency evacuation path optimization model under multi-export conditions. China Saf. Sci. J. 2019, 29, 180–186. [Google Scholar] [CrossRef]
  19. Stepanov, A.; Smith, J.M. Multi-objective evacuation routing in transportation networks. Eur. J. Oper. Res. 2009, 198, 435–446. [Google Scholar] [CrossRef]
  20. Fang, Z.; Li, Q.; Li, Q.; Han, L.; Shaw, S. A space–time efficiency model for optimizing intra-intersection vehicle–pedestrian evacuation movements. Trans. Res. Part C Emerg. Technol. 2013, 31, 112–130. [Google Scholar] [CrossRef]
  21. Fang, Z.; Zong, X.; Li, Q.; Li, Q.; Xiong, S. Hierarchical multi-objective evacuation routing in stadium using ant colony optimization approach. J. Trans. Geogr. 2011, 19, 443–451. [Google Scholar] [CrossRef]
  22. Li, Q.; Fang, Z.; Li, Q. Ant colony based evacuation route optimization model for mixed pedestrian-vehicle flows. In Proceedings of the Sixth International Conference on Pedestrian and Evacuation Dynamics, ETH, Zurich, Switzerland, 6–8 June 2012; Weidmann, U., Kirsch, U., Schreckenberg, M., Eds.; Springer: Cham, Switzerland, 2014; pp. 1213–1224. [Google Scholar] [CrossRef]
  23. Wang, L.; Wang, R.; Tao, K. Research on capacity constrained evacuation route planning method in large-scale networks. Sci. Surv. Mapp. 2019, 35, 235–241. [Google Scholar] [CrossRef]
  24. Sbayti, H.; Mahmassani, H.S. Optimal scheduling of evacuation operations. Trans. Res. Rec. 2006, 1964, 238–246. [Google Scholar] [CrossRef]
  25. Li, X.; Huang, B.; Liu, Z.; Zhang, X.; Sun, J. A novel method for planning a staged evacuation. J. Syst. Sci. Complex. 2012, 25, 1093–1107. [Google Scholar] [CrossRef]
  26. Li, X.; Li, Q.; Claramunt, C. A time-extended network model for staged evacuation planning. Saf. Sci. 2018, 108, 225–236. [Google Scholar] [CrossRef]
  27. Chow, W.K.; Ng, C.M. Waiting time in emergency evacuation of crowded public transport terminals. Saf. Sci. 2008, 46, 844–857. [Google Scholar] [CrossRef]
  28. Liu, S.; Zhu, G. The application of GIS and IOT technology on building fire evacuation. Procedia Eng. 2014, 71, 577–582. [Google Scholar] [CrossRef] [Green Version]
  29. Wang, J.; Zhao, H.; Winter, S. Integrating sensing, routing and timing for indoor evacuation. Fire Saf. J. 2015, 78, 111–121. [Google Scholar] [CrossRef]
  30. Ding, Y.; He, X.; Zhu, Q.; Lin, H.; Hu, M. A dynamic optimization method of indoor fire evacuation route based on realtime situation awareness. Acta Geod. Cartogr. Sin. 2016, 45, 1464–1475. [Google Scholar] [CrossRef]
  31. Zhu, J.; She, P.; Li, W.; Cao, Y.; Qi, H.; Wang, B.; Wang, Y. Dynamic planning method of indoor fire escape path based on navigation grid. J. Southwest Jiaotong Univ. in press. Available online: http://kns.cnki.net/kcms/detail/51.1277.U.20190320.1146.018.html (accessed on 14 January 2020).
  32. Han, L.; Guo, H.; Zhang, H. An algorithm for route planning applied in multi-exit indoor emergency. Sci. Surv. Mapp. 2018, 43, 105–110. [Google Scholar] [CrossRef]
Figure 1. The indoor network with multiple exits.
Ijgi 09 00046 g001
Figure 2. Transformation from the multi-exit route network to several single-exit route networks. (a) The multi-exit route network; (b) The partitioned multi-exit route network.
Ijgi 09 00046 g002
Figure 3. Two groups arrive at the exit successively without congestion.
Ijgi 09 00046 g003
Figure 4. Two groups arrive at the emergency exit at the same time.
Ijgi 09 00046 g004
Figure 5. The two groups arrived at the intersection successively, causing congestion.
Ijgi 09 00046 g005
Figure 6. Illustration of generation of the shortest path tree and convergence of two escape groups. (a) Indoor evacuation network; (b) Shortest path tree; (c) Two shortest paths with intersection.
Ijgi 09 00046 g006
Figure 7. The indoor network model of the teaching building J6 of SDUST.
Ijgi 09 00046 g007
Figure 8. Comparison of their total evacuation time varying with the number of evacuation groups.
Ijgi 09 00046 g008
Figure 9. Comparison of their total evacuation time varying with the escape speed.
Ijgi 09 00046 g009
Figure 10. Comparison of their total escape time varying with the group size.
Ijgi 09 00046 g010
Figure 11. Comparison of the efficiency of the two algorithms. (a) The curves of the consumed time by the two algorithms; (b) The efficiency ratio of the two algorithms
Ijgi 09 00046 g011
Figure 12. Comparison of results partitioned by two different partitioning methods. (a) The partitioned network based on nearest evacuation; (b) The partitioned network based on balanced evacuation
Ijgi 09 00046 g012
Figure 13. Comparison of the total evacuation time of two strategies under different evacuation density. (a) The change of their total evacuation time with the increase of evacuation density; (b) The change of the total evacuation time difference with the increase of evacuation density
Ijgi 09 00046 g013
Figure 14. The simulation of simultaneous evacuation for the multi-exit network. Four screenshots are given at different times as follows: (a) t0 + 8 s; (b) t0 + 16 s; (c) t0 + 24 s; (d) t0 + 32 s.
Ijgi 09 00046 g014
Figure 15. The simulation of partitioned and staged evacuation for the multi-exit network. Six screenshots are given at different times as follows: (a) t0 + 32 s; (b) t0 + 64 s; (c) t0 + 112 s; (d) t0 + 144 s; (e) t0 + 232 s; (f) t0 + 272 s.
Ijgi 09 00046 g015aIjgi 09 00046 g015b
Figure 16. The relationship of the evacuation path length and the delayed departure time of all groups in each zone when evacuation density is large. (a) Zone E1; (b) Zone E2; (c) Zone E3.
Ijgi 09 00046 g016
Figure 17. The relationship of the evacuation path length and the delayed departure time of all groups in each zone when evacuation density is low. (a) Zone E1; (b) Zone E2; (c) Zone E3.
Ijgi 09 00046 g017
Figure 18. The comparative results when the group size is uniform. (a) The change of the total evacuation time with the increasement of the number of groups; (b) The change of the operation time with the increasement of the number of groups.
Ijgi 09 00046 g018
Figure 19. The comparative results when the group size is random. (a) The change of the total evacuation time with the increasement of the number of groups; (b) The change of the operation time with the increasement of the number of groups.
Ijgi 09 00046 g019
Table 1. Statistical results of time consumed by the two algorithms.
Group Number1202804406007609201080
Tp(ms):12712182736
Td(ms):329771142,366142,399363,591773,8201,492,754
Td/Tp:3293856605211,86720,20028,66041,465
Table 2. The number of evacuees, the number of evacuation groups in different zones and their total evacuation time based on balanced evacuation and nearest evacuation
ID of ExitsE1E2E3
Balanced evacuationThe number of groups264277277
The number of evacuees235223452393
Evacuation time (s)785.13786.18798.57
Nearest evacuationThe number of groups210236372
The number of evacuees184520573188
Evacuation time (s)616.13690.181063.57
Table 3. Comparison of the total evacuation time of two strategies under different evacuation density
Group Length (m)ERTn (s)Tb (s)Tn-Tb (s)
0.57.5%70.70385.101−14.398
115%128.6410226.64
230%250.35188.3562
345%373.49280.4993
460%496.91372.91124
575%620.91465.91155
Table 4. The relationship of the evacuation path length and the delayed departure time of some groups planned by the PSEP algorithm when evacuation density is large.
Group IDGroup Size (m)Escape Speed(m/s)Path Length (m)Delayed Time (s)
11133.400.00
2835.802.87
3837.614.93
45313.055.78
511314.466.98
65314.5710.61
77319.2710.71
813319.3313.02
94319.8017.20
1012322.0717.78
117326.0220.46
129326.0422.79
…………………………
Table 5. The relationship of the evacuation path length and the delayed departure time of some groups planned by the PSEP algorithm when evacuation density is low
Group IDGroup Size (m)Escape Speed (m/s)Path Length (m)Delayed Time (s)
1233.400.00
2235.800.00
3237.610.06
42313.050.00
52314.460.20
62314.570.83
72319.270.00
82319.330.65
92319.801.16
102322.071.07
112326.020.42
122326.041.08
…………………………
Table 6. The test results when the group size is uniform.
ERGroup SizeAlgorithmParametersE1E2E3Clearing Time (s)
32.6%6PSEPNg305307308620.88
Ne183018421848
Te (s)613.20619.06620.88
Algorithm of [26]Ng307306307618.88
Ne184218361842
Te (s)617.20618.77618.88
48.9%9PSEPNg305307308927.88
Ne274527632772
Te (s)917.97925.06927.88
Algorithm of [26]Ng304305311936.88
Ne273627452799
Te (s)922.05919.06936.88
65.2%12PSEPNg3053073081235.60
Ne366036843696
Te (s)1222.971231.981235.60
Algorithm of [26]Ng3093073041238.97
Ne370836843648
Te (s)1238.971233.151227.59
81.5%15PSEPNg3053073081543.60
Ne457546054620
Te (s)1527.971538.981543.60
Algorithm of [26]Ng3073063071538.60
Ne460545904605
Te (s)1537.971533.971538.60
97.8%18PSEPNg3053073081851.60
Ne549055265544
Te (s)1832.971845.981851.60
Algorithm of [26]Ng3073063071850.28
Ne552655085526
Te (s)1844.971850.281845.60
Table 7. The test results when the group size is random.
ERGroup SizeAlgorithmParametersE1E2E3Clearing Time (s)
21.5%3–6PSEPNg313306301411.89
Ne121112181219
Te (s)408.20411.89411.89
Algorithm of [26]Ng311299310420.55
Ne121411891245
Te (s)411.28406.19420.55
38.2%6–9PSEPNg304309307725.73
Ne215121622157
Te (s)719.97725.73723.55
Algorithm of [26]Ng304304312729.88
Ne213721572176
Te (s)715.30728.88729.88
54.3%9–12PSEPNg3053093061031.55
Ne303630743083
Te (s)1014.971028.641031.55
Algorithm of [26]Ng3093033081029.97
Ne308130503062
Te (s)1029.971020.641024.55
70.8%12–15PSEPNg3053063091342.60
Ne397339994017
Te (s)1327.301336.981342.60
Algorithm of [26]Ng3083063061341.97
Ne401739963976
Te (s)1341.971335.981328.94
87.1%15–18PSEPNg3043073091648.27
Ne488149264934
Te (s)1629.971645.981648.27
Algorithm of [26]Ng3053043111661.27
Ne489948694973
Te (s)1635.971640.371661.27

