1. Introduction
In the current context of global warming and rising sea level, marine disasters caused by natural events such as storm surges, huge waves, sea ice, and tsunamis are occurring with increasing frequency and having greater impact on coastal countries worldwide. Among the various natural marine disasters, storm surges, because of their high frequency rate and intensity, have long been the greatest cause of substantial economic loss, human injury, and damage to livelihoods and property. Therefore, it is very important to study the prediction and assessment of storm surge disasters, and to construct a real-time, dynamic, automated system designed as a “one-click” operation through an Internet web browser for use by the public or the government. In the field of oceanography, previous studies have focused primarily on the precision and accuracy of numerical models, the coupling of multiple marine dynamics, and the applicability of different assessment methods. Research on integrated applications has included integrating numerical forecasting and data processing in an automatic system, performing specific analysis of numerical models and assessment methods for specific cases, or combining numerical forecasting with visualization technology to build a more comprehensive automated oceanographic system. A comprehensive and automatic assessment system is required that is capable of providing functions for numerical ocean models with forecast results, automated processing of massive data, multiple disaster/element coupled assessment, and multidimensional display and expression.
As the frequency and severity of marine disasters might increase further, research on early warning and emergency response in relation to marine dynamic disasters has become an important subject for disaster prevention and reduction. China borders the northwest Pacific Ocean and its diverse marine environmental conditions lead to the frequent occurrence of marine disasters. With the implementation of China’s economic development strategy for coastal areas, the risk of marine disasters in such regions has intensified further, and recent associated economic losses have shown a clear upward trend. In recent years, China’s coastal areas have experienced an average of more than 20 storm surges each year with directly associated economic losses of more than 10 billion yuan [
1].
To predict storm surge disasters, it is important to establish a numerical ocean prediction system in which an ocean model forms the dynamic framework and core component. Marine models have been under development since the early 1950s. With the rapid advancements in computer technology at the end of the last century, dozens of ocean models have been proposed and developed, for example, HYbrid Coordinate Ocean Model (HYCOM) [
2], Nucleus for European Modelling of the Ocean (NEMO) [
3], Modular Ocean Model (MOM) [
4], Regional Ocean Modeling System (ROMS) [
5], and Princeton Ocean Model (POM) [
6]. The models have different characteristics and are applicable in various sea areas (e.g., oceans, regional seas, and continental shelves) and different marginal areas (e.g., coasts, bays, and estuaries). According to different research objectives and research regions, marine researchers usually choose well developed models as the base, and add specific conditions to modify and run the models to get the expected results from the numerical model. Currently, global ocean circulation models are mainly based on HYCOM, NEMO and MOM. ROMS is applied to regional ocean models. POM can be applied to the continental shelf or the coast, and the unstructured grid Finite Volume Community Ocean Model (FVCOM) is used for straits, bays and estuaries [
7]. Simulation results are becoming increasingly accurate and ocean models have evolved from 2D to 3D forms or from regular grid to unstructured triangular mesh structures, which help to improve the resolution and accuracy of such models. Moreover, operational oceanography is also improving rapidly, and it provides many important products including nowcasts, forecasts, and hindcasts [
8,
9,
10,
11]
The development of numerical models has enabled researchers to obtain increasingly accurate assessments of storm surge disasters. Early studies focused on evaluating the natural attributes of storm surge disasters, namely, the intensity of storm surges. Numerical simulations of storm surge processes and estimates of typical recurring storm surges were obtained and maximum predicted storm surge levels were calculated. Recently, 3D ocean circulation numerical models such as the FVCOM [
12,
13,
14] and ADvanced CIRCulation model (ADCIRC) [
15] have been used widely in numerical simulation and operational forecasting of storm surges.
Extensive research on disaster risk has been published over the last four decades. The Society for Risk Analysis (SRA), established in 1981, is mainly engaged in disaster risk analysis. Since the 1990s, the National Oceanic and Atmospheric Administration (NOAA), National Hurricane Center, and other institutions have joined forces with local governments to assess storm surge risk. Such work has focused on estimating the maximum water levels associated with storm surges produced by tropical cyclones with different intensity levels [
16]. The results are used mainly by local government, insurance companies, and community members. In 1995, the Caribbean Sea Disaster Reduction Project developed The Arbiter of Storms (TAOS) to simulate natural marine disaster processes—from strong winds and rainfall to storm surges and waves—and to analyze their comprehensive risks. By considering local socioeconomic conditions, storm surge maps and vulnerability maps are able to assist in the development of evacuation plans and the construction of disaster shelters [
17].
As research on disaster risk expands, the field of disaster risk assessment is also developing with the aim of clarifying the causes of natural disasters and formulating strategies to reduce the possibility of disasters occurring, thereby improving the ability to prevent disasters or reduce the damage they cause [
18]. Typical applications have included analysis of storm surge risk along the coast of New York City [
19], on the coast of northern Germany [
20], and on the coasts of the US Gulf of Mexico and Florida [
21]. Additionally, economic models and mathematical programming methods have been introduced to assess the losses associated with storm surge disasters or to study their social impact [
22,
23,
24,
25].
With the rapid development of computer technology, progress in the development of GIS technology has been substantial and such systems have been incorporated into storm surge assessment. GIS technology is used to achieve the assessment process and to improve the display of assessment results in order to enhance decision-making [
26]. Research in this field initially focused on the technical aspects of GIS software, e.g., spatial data acquisition technology, analysis of spatial distribution of disasters, and visualization of the results. Subsequently, GIS technology has been applied in the emergency management of storm surge disasters to improve the effectiveness of emergency management agencies and reduce losses associated with storm surge disasters [
27,
28].
Based on the above research, increasingly advanced systems have been applied to marine and coastal disaster response and regional layout optimization. Now, these systems play a significant role in disaster prevention and decision-making processes [
29,
30,
31].
Despite the above research, current capabilities regarding early warning and risk assessment of marine disasters, which are important elements in reducing marine disaster risks, remain far below the levels required, especially in high-risk areas and given recent coastal socioeconomic development. The research objective was to find a solution that integrates marine forecasting and disaster assessment to provide marine dynamic disaster assessment, early warning, and decision-making support. Moreover, the quantification, modeling, systematization, and automation of disaster assessment are areas of active research in the field of disaster risk management. The development of a comprehensive and integrated system that considers the characteristics of disasters in China’s coastal areas will provide decision-making support for urban planning, community disaster reduction, and disaster emergency response in coastal areas, and play an effective role in marine disaster prevention and reduction.
For optimal assessment of storm surge disasters, a system that incorporates all the core elements is required. These include numerical models, operational oceanography, disaster assessment, dynamic visualization, and online real-time calculation. Current research methods can only integrate some of these, e.g., combining operational oceanography and disaster assessment, numerical models and GIS, or numerical models and visualization technology. Moreover, the existing applications are used mainly by scientists or managers. In this paper, we propose the integration of all the elements mentioned above and aim to provide a convenient online system that enables public users and government officials to perform rapid assessment of storm surge disaster risk.
2. Architecture
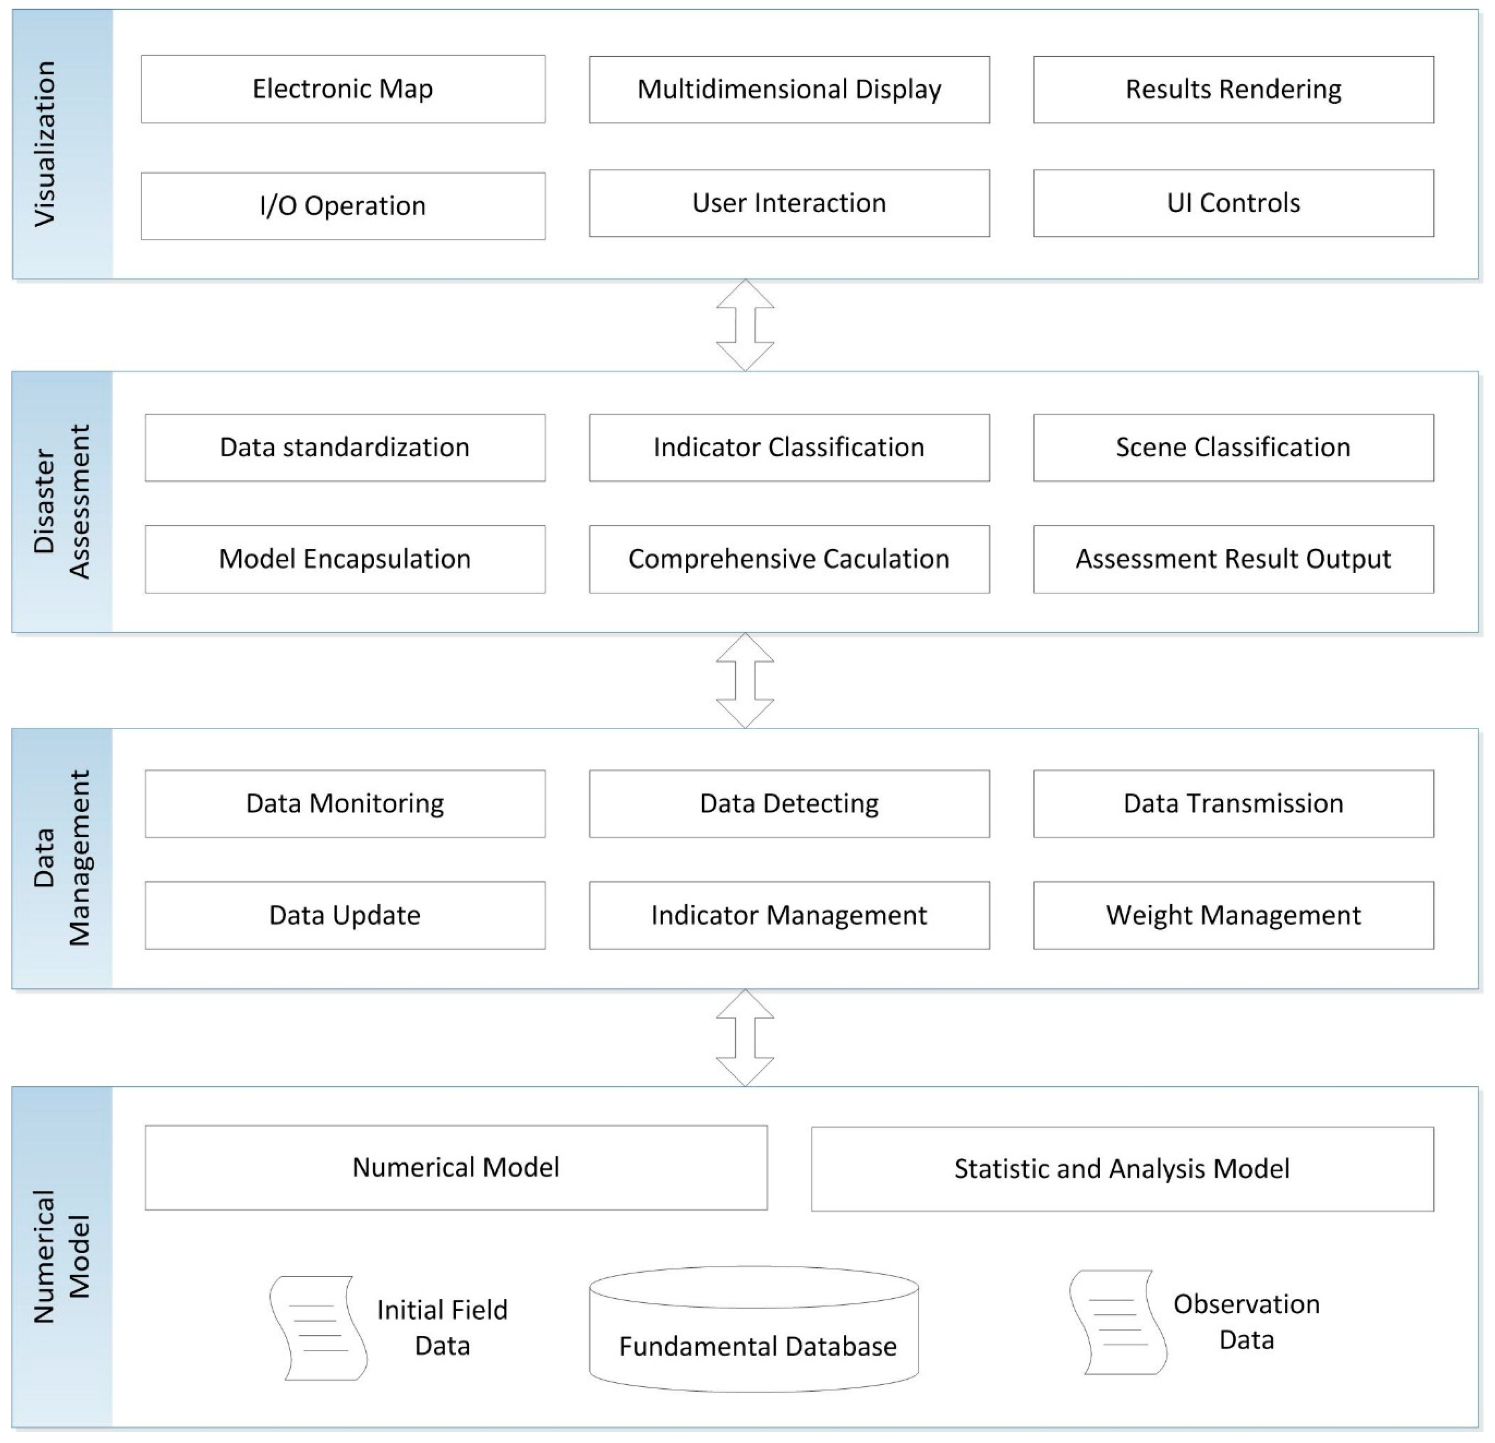
In accordance with the research objectives, the design and development of the proposed system involves four-tier architecture. The four-tier architecture divides the entire process into a numerical model tier, data management tier, disaster assessment tier, and visualization tier, thus embodying the concept of “high cohesion and low coupling” [
32].
The numerical model tier is the basis of the system. It contains the data for the key elements such as wind, waves, currents, and tides, which are provided by numerical ocean models, e.g., FVCOM. It also supplies a large amount of statistical analysis data, which is required in the assessment process.
The data management tier uses a management module for the numerical results data and assessment data, using information technology such as databases and File Transfer Protocol (FTP). In this module, we utilize data operation functions such as real-time monitoring, data detection, transmission, and updating, as well as storage functions for the indicator data and weighting data. The data management tier provides an effective link between the numerical model tier and the disaster assessment tier.
The disaster assessment tier, based mainly on real-time data and statistical analysis data, performs the dynamic assessment of storm surge disasters. Utilizing data standardization methods and assessment methods, this tier focuses on the assessment process to achieve both high efficiency and portability of the assessment model through remote access and enquiry by a network user. The disaster assessment tier is responsible for generating a series of assessment results and for providing users with interactive browsing and acquisition functions that require the assistance of the user interfaces in the visualization tier.
The visualization tier provides interactive operation interfaces for the users, receiving user requests and displaying the assessment results in multiple visualization forms. This tier applies GIS technology and visualization technology to achieve 2D/3D mapping, and it utilizes a Graphical User Interface (GUI) for human–computer interaction. This tier provides the functions that allow users to communicate with other tiers.
The four-tier architecture has the following advantages.
- (1)
A researcher may focus their efforts on only one of the tiers.
- (2)
It is easy to replace the implementation of any tier with a new one.
- (3)
It reduces interdependence between different tiers.
- (4)
It promotes standardization of the R&D process.
- (5)
It increases the reusability of the working logic in each tier.
- (6)
The structure of the application is clear.
- (7)
In terms of maintenance procedures, the total cost is greatly reduced.
Figure 1 shows the overall structure of the proposed application.
3. Models and Approach for Integrated Visualization
Here, we introduce the design process and results of each tier of the four-tier architecture.
3.1. Numerical Model Tier
3.1.1. Atmospheric Model
This study used the Weather Research and Forecasting (WRF) model developed by the US National Center for Atmospheric Research (NCAR). This model, which has largely replaced the MM5 model, is now used for research by many international research centers or for providing automated services by national forecasting departments, e.g., NCEP.
The WRF system contains two dynamical solvers that are referred as to the ARW (Advanced Research WRF) core and the NMM (Nonhydrostatic Mesoscale Model) core. The system proposed in this paper is based mainly on the ARW core developed by NCAR.
In the ARW model, we used Arakawa C-grid staggering as the horizontal grid, and we applied high-resolution data for topography and the underlying surface. In the vertical direction, the WRF offers two options: Eulerian height coordinates and Eulerian mass coordinates. For the temporal integration scheme, a third-order Runge–Kutta scheme is recommended, while a second-order Runge–Kutta scheme is also supplied to users. Generally, the WRF model has a high starting point and many new characteristics. In this model, the horizontal resolution, vertical gradation, integration area, and various physical processes can be adjusted according to the user’s needs.
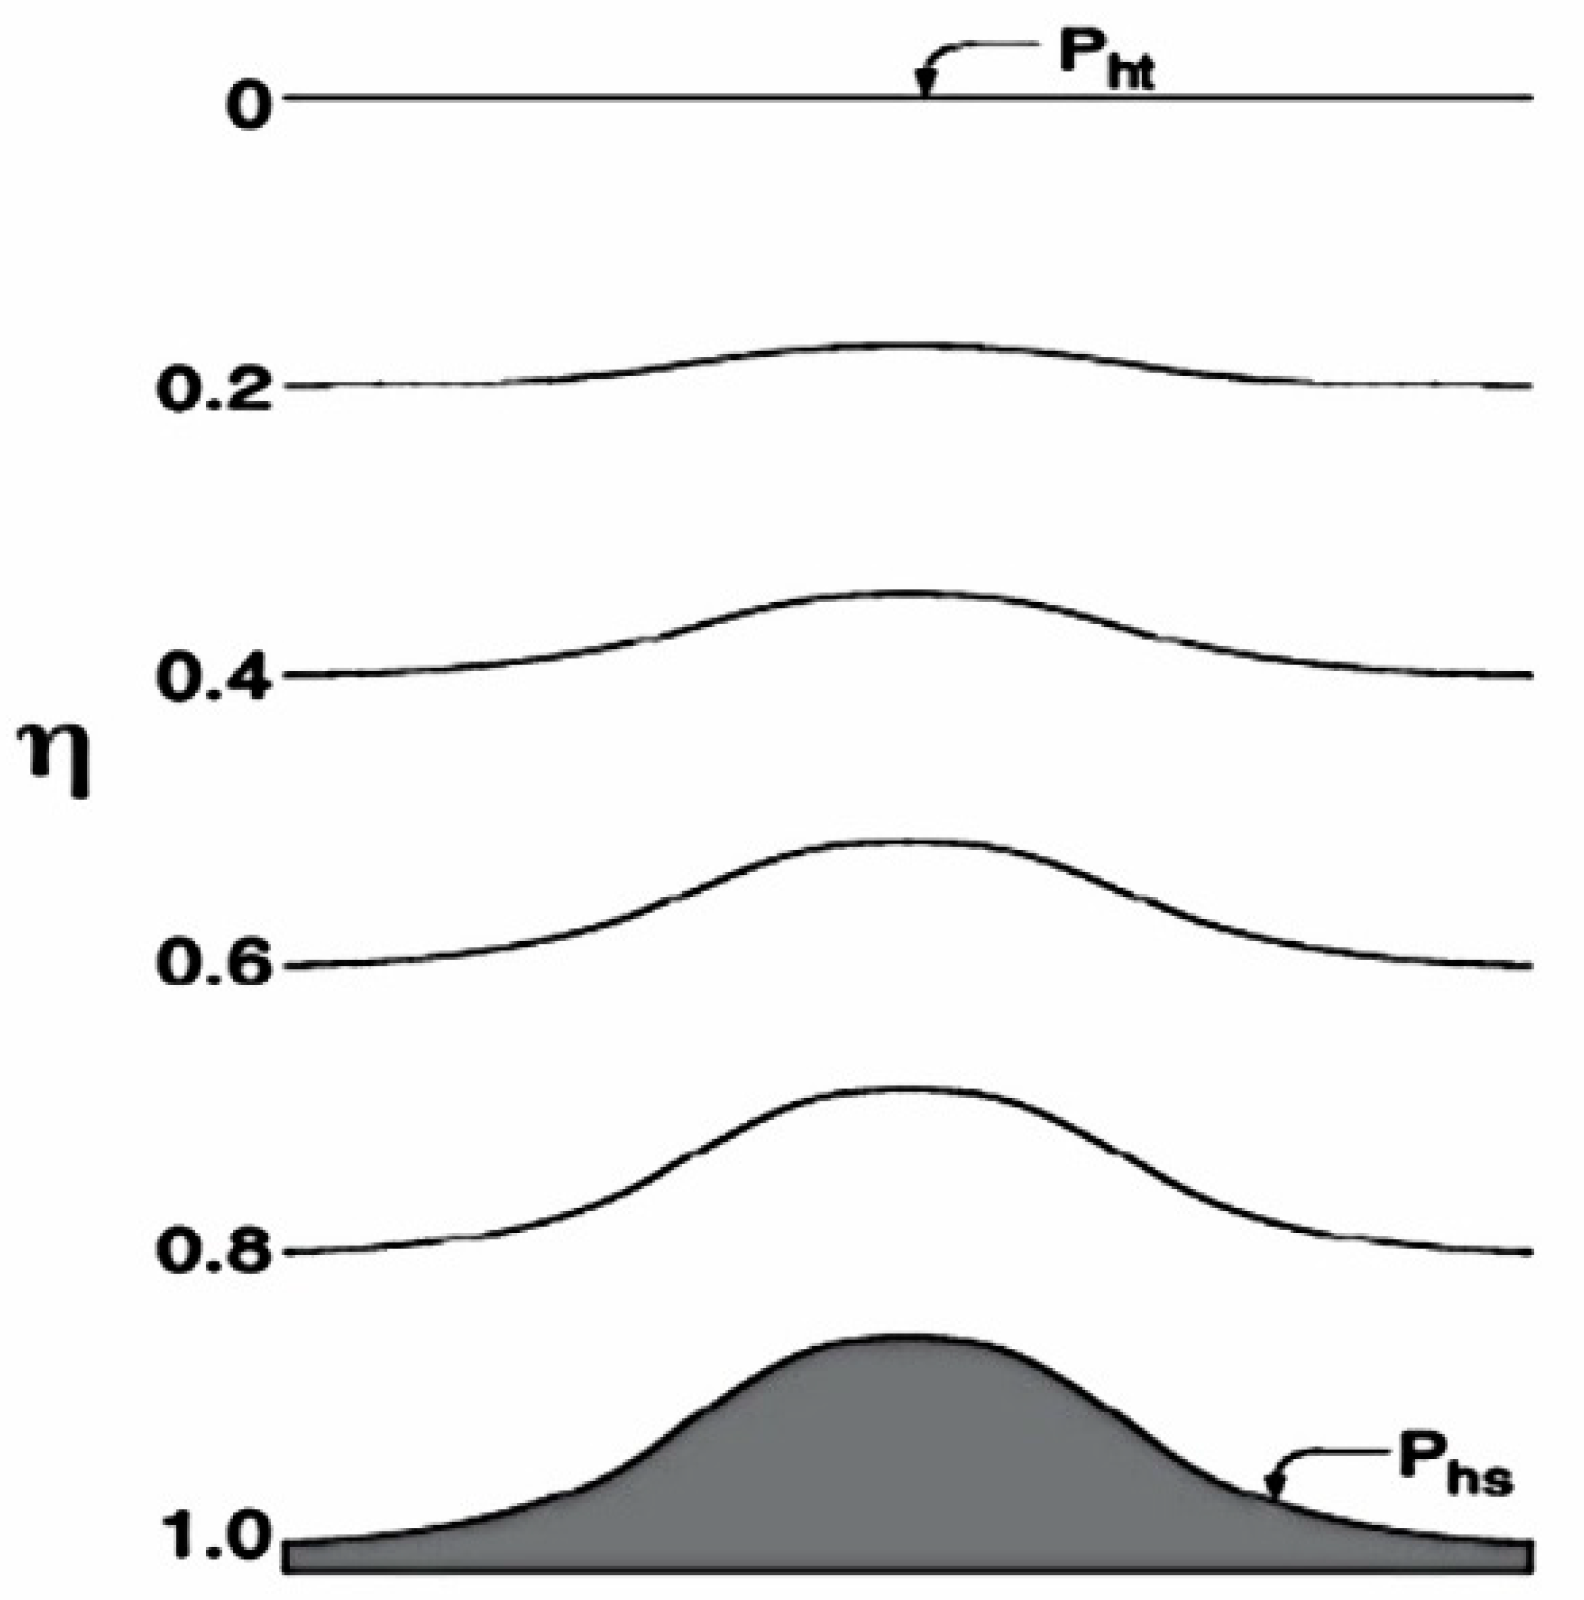
In this paper, we set the parameters for the physical processes according to the characteristics of the sea along China’s coast. The parameters include land surface processes, horizontal and atmospheric vertical eddy diffusion, a cumulus convective parameterization scheme, and solar shortwave radiation and atmospheric longwave radiation schemes. Equation (1) describes the terrain-following barometric coordinate as the vertical coordinate:
where
,
is the static equilibrium part of air pressure,
is the air pressure on the ground, and
is the air pressure of the top model layer, which is designated as constant. The vertical coordinate is shown in
Figure 2.
To obtain high-resolution forecasts of sea surface wind, the initial and boundary conditions were based on global reanalysis data provided by NCEP. The spatial resolution of the data is 1° × 1° and the time interval is 6 h. We used the nonhydrostatic WRF model (i.e., Version 3.4). We selected the Eulerian coordinate system, Lambert projection method, and Runge–Kutta time integration scheme. There were 31 sigma levels used in the vertical direction: 0.995, 0.980, 0.966, 0.950, 0.933, 0.913, 0.892, 0.869, 0.844, 0.816, 0.786, 0.753, 0.718, 0.680, 0.639, 0.596, 0.550, 0.501, 0.451, 0.398, 0.345, 0.290, 0.236, 0.188, 0.145, 0.108, 0.075, 0.046, 0.021, and 0.000. For improved simulation of the sea surface, we set the sigma level to a minimum value of 0.995. The numerical model outputs the result every hour, and the valid range for the integration is 20°–42° N, 115°–132° E.
In the calculation of the wind field, the intensity of a typhoon in the initial field does not usually reach the intensity of the observed typhoon, and its center position and maximum wind speed all have certain deviations from the observations. To ensure the typhoon has realistic strength in the initial field and to improve the quality of the simulated typhoon wind field, a Bogus scheme developed from the Regrid scheme in MM5 was adopted. The typhoon position in the initial field was first detected and effectively removed, and then the Rankine Vortex ideal typhoon model in combination with measured typhoon information was used to reconstruct the typhoon. The typhoon boundary and background field were smoothed to prevent the generation of parasite waves.
The operating environment of the mode is shown in
Table 1.
3.1.2. Storm Surge Model
The storm surge model used in this paper is based on the unstructured grid FVCOM. This model combines the advantages of a finite difference model and finite element model. The numerical calculation solves the problem of complex seashore fitting, mass conservation, and computational efficiency in shallow seas. Similar to other free-surface ocean models, FVCOM uses the modified Mellor–Yamada 2.5-level and Smagorinsky turbulence closure schemes to calculate vertical and horizontal mixing. Similar to other currently popular structured grid models (e.g., POM and ROMS), FVCOM also uses a time-splitting algorithm. The external mode has 2D form and uses the vertical integration equations; the internal mode has 3D form and uses the vertical structural equations.
In the original difference equation used by FVCOM, the influence of sea-level variation caused by surface pressure is not considered; however, this factor makes anon-negligible contribution to a storm surge, especially during typhoon-generated storm surges. Therefore, we modified the original FVCOM to account for surface pressure.
Considering the combined effects of pressure and wind on the sea surface, Equation (2) determines the wind stress on the sea surface:
where
is the wind vector,
and
are the wind components, and Equation (3) defines
as the wind drag coefficient:
As storm surges are forced responses covering a large sea area, a storm surge in a local sea area is not simply the response of that sea area to changes in local air pressure and surface wind. Large catastrophic storm surges are often a combination of seawater influx from distant sea areas and the local increase of seawater in coastal areas. Therefore, our model was constructed based on the Bohai Sea, Yellow Sea, and East China Sea, while the grid was encrypted in the coastal area. The minimum resolution for the horizontal grid is 30 m. The model has 89,541 mesh nodes and 168,373 finite elements. The time interval of the external mode is 1.5 s, while that of the internal mode is 15 s. In the vertical direction, the model is divided into 10 layers.
Equations (4)–(6) set the boundary conditions of the model:
(1) Surface boundary condition
(2) Bottom boundary condition
where
and
are the
x and
y components of surface wind stress and bottom stress, respectively;
are the
x and
y components of surface and bottom velocity, respectively; drag coefficient
is determined as the maximum value between the calculated bottom boundary and a constant value (i.e.,
, where
is the bottom roughness parameter);
is the tide level; and
H is the water depth.
(3) Open boundary condition
where
is the average tidal level,
A is the constituent amplitude,
ω is the constituent angular rate,
t is the zone time, and
is the initial phase angle of the equilibrium tide expansion.
When the model is running, the final forecast of the storm surge is output regularly and stored in an FTP folder for dynamic access.
3.1.3. Model Validation
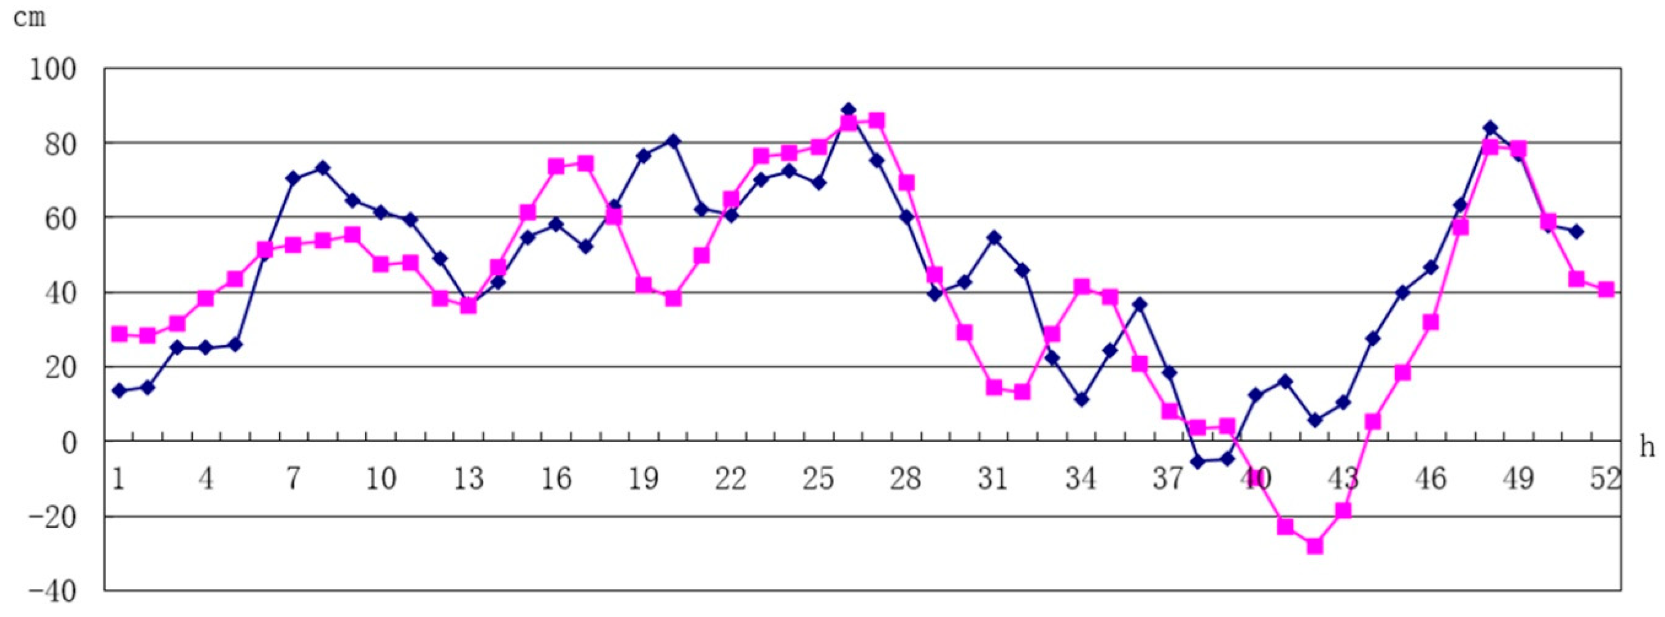
To validate the storm surge model, calculated storm surge results for the Wuhaomatou marine station (located in the city of Qingdao) were compared with observed measurements. The storm surge processes that occurred during Typhoon 8509 and Typhoon 9216 were selected as case studies.
Typhoon 8509 was the ninth typhoon in 1985. It formed over the seas northwest of Okinawa (Japan) and landed in Qingdao (Shandong Province, China) on August 19, causing strong winds and heavy rain.
Figure 3 illustrates the storm surge levels calculated by our model compared with the measurements recorded at the Wuhaomatou marine station. The model captured the overall pattern of the storm surge reasonably well, as well as the peak value and its timing. The average simulation error was less than 20 cm.
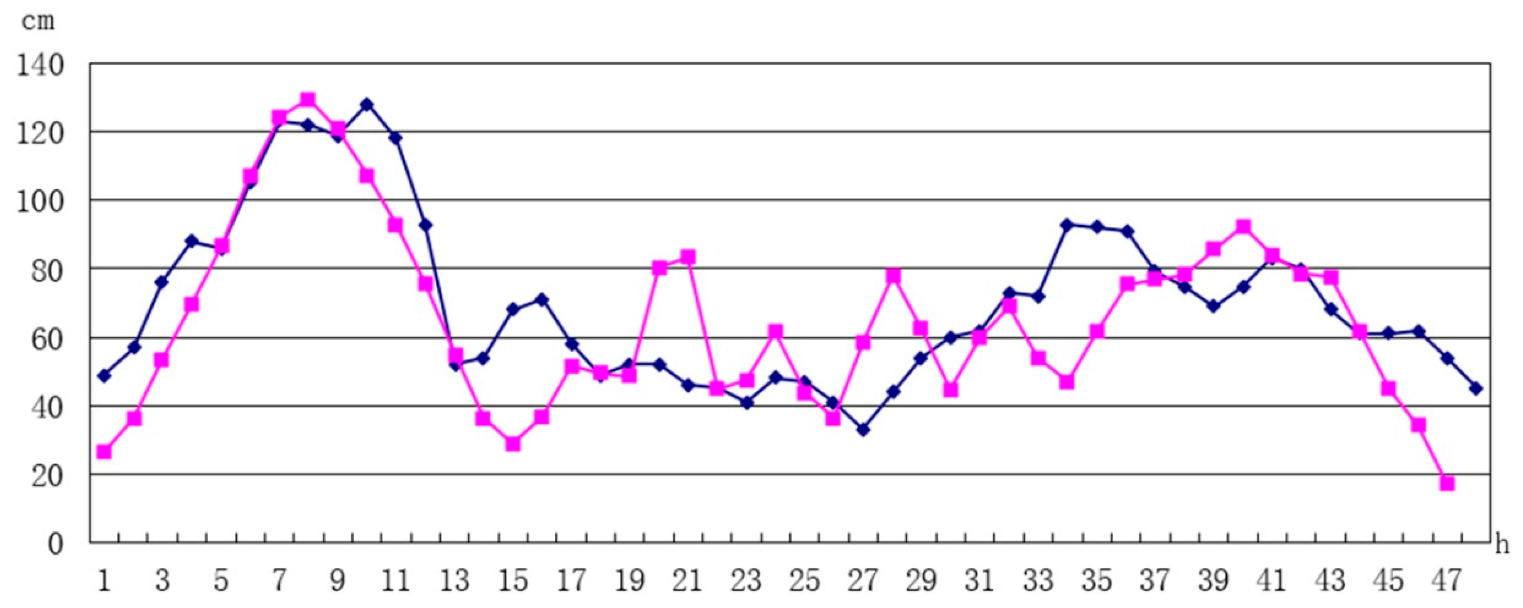
The performance of the model was also assessed based on the storm surge process associated with Typhoon 9216, which was the strongest typhoon to hit China in 1992. It made landfall in the south of Shandong Peninsula in early September, causing a storm surge at the Wuhaomatou marine station.
Figure 4 shows the model results compared with the recorded measurements. The peak surge value, which was captured well by the model, was around 130 cm. Subsequent surges fluctuated and the second largest surge occurred after approximately 34 h. After the peak surge, the modeling was less accurate; however, the average simulation error remained below 20 cm, indicating the overall reliability of the model to predict storm surges.
3.2. Data Management Tier
3.2.1. Data Detecting and Updating Module
We developed a data processing module for automatic processing of the data. The module can monitor, detect, and analyze the status of the data, and it can update the forecast data of the numerical model in real time.
This module was developed using Interactive Data Language (IDL). IDL has several advantages including openness, high-dimensional analysis capabilities, scientific computing capabilities, usability, and visual analysis. It is an efficient programming language for data analysis and image processing. Data can be converted to images quickly and easily using IDL, which can facilitate analysis and understanding. It is also easy to connect IDL with C and C++ for integration with other modules. Its built-in math library functions can greatly reduce the development workload of the image processing algorithm. Programs written in IDL can be run on other IDL-compatible platforms without modification. Thus, applications developed using IDL are inherently portable.
In this study, the results of the numerical model were stored in netCDF format, which is very suitable for managing the large amount of data generated each time. However, a special function library is required to read and process the data. Moreover, as the model utilizes an irregular triangular network, which is not convenient for subsequent calculation and assessment, the module needs to first identify the triangular network and convert it into a rectangular grid when processing the data (as shown in
Figure 5). Owing to the different densities of the original triangular mesh, not all of the meshes can be filled in the transformed rectangular mesh. To maintain the authenticity of the system, no interpolation was performed in this study and thus the sparse area of the grid retained many blank values.
The module for managing data was developed using the IDL platform. In addition to data transformation, this module can connect regularly to the numerical modeling server to check the latest version of the data and identify data that should be downloaded. After confirmation of the data update requirements, the data transmission and acquisition processes are executed via an integrated FTP protocol, following which, the data are handled by LIB function libraries. The data transformation function should be encapsulated as a LIB function library so that it can be called and integrated easily. After data processing, the parameters for system configuration are also updated by this module, and an operation log is generated to complete the data detection and updating process.
This module plays an important role in the assessment process. Therefore, to ensure its long-term unassisted operation, we performed extensive testing of the module running in automatic mode. The tests confirmed that the module performs well in most situations, monitors the update status of disaster data, and quickly acquires the latest data for assessment and visualization.
3.2.2. Indicator and Weighting Management
We used database technology to store and read the indicator and weighting information. Focusing on the basic characteristics of storm surge disasters, a data table for the assessment indicators was designed, and a four-level structure was used to classify and manage the indicators. A specific module was developed to manage the assessment indicators. Once a successful connection to the database is established, a series of functions such as adding indicators, editing indicators, and deleting indicators are provided to the user, and all specific assessment indicators are displayed in a tree-structured control. In this way, the hierarchical features of the indicators can be highlighted, making it much easier for users to understand them and make appropriate selections for the assessment process.
The entire assessment process is managed as a project, and database technology was adopted to store the information for the entire process. The database structure is designed to store all the elements involved in the assessment process, e.g., indicators, weights, process control parameters, data sources, and the results. In this way, users can quickly load previous assessment processes and repeat them easily. This also reduces the complexity of user operations.
3.3. Disaster Assessment Tier
We mostly used historical observation data, statistical analysis data, and numerical simulation products to evaluate storm surge risk. Therefore, when determining the assessment indicators, it is necessary to take into account the automated requirements of the system, which must satisfy the data availability and automatic processing conditions. The assessment indicators are current velocity, wave height, wind speed, tide level, height above critical level, and maximum historical water level rise.
We divided the criteria for the assessment indicators into four levels and set a score for each level. According to the criteria, Level 1 is the highest risk and Level 4 is the lowest risk.
Table 2 lists the specific classification scores for risk assessment.
The data processing module classifies and standardizes the data. After referring to various common specifications and classification standards such as the “Guidelines for storm surge disaster risk assessment and zoning (State Oceanography Administration)”, “Method for issuing early warning signals of sudden meteorological disasters (China Meteorological Administration)”, and “China Tropical Cyclone Climate Atlas (1951–2000)”, the final standard used here for the data processing is shown in
Table 3. However, these classification standards, which are only loaded for the initialization process of the module as default values, can be modified by users according to different goals or specific conditions.
Unlike previous studies, this study identified assessment parameters related specifically to coastal facilities. We considered the main scenarios that coastal areas are used for: port construction, oil and gas development, marine aquaculture, ecological protection, and tourism. According to the different development requirements of these coastal areas in terms of spatial planning, we set a series of different weights for the assessment. By means of expert scoring, questionnaires were presented, the responses were analyzed, and weights for each scene were determined, as shown in
Table 4.
Finally, after obtaining the latest data from the numerical forecasting model, together with statistical analysis data, the disaster assessment module updates the corresponding data for the target area. It automatically gives a score according to the above criteria, and it determines a corresponding weight for the calculation from the weight series. Equation (7) calculates the storm surge assessment risk index:
where R is the storm surge assessment risk index,
is the value of each indicator after standardization, and
is the weight of the indicator in the corresponding situation.
Research and development of real-time dynamic assessment technology aims to provide a reliable remote assessment tool, which means the application should be deployed on an online platform. Therefore, the key technology is focused on the development, packaging, and remote access of the module. The assessment process must be transferable to a networked platform and be available for interpretation. In this way, we can ensure that the results of the complex assessment model are easily accessible via the Internet, and that the process can run automatically, smoothly, and reliably.
Finally, we used Common Gateway Interface (CGI) technology to encapsulate the model such that the application could be released under the Browser/Server (B/S) architecture. Users can engage with the server-side encapsulated model to perform real-time dynamic assessment of storm surge disasters at any time using their Internet web browser. Thus, the application can respond quickly and accurately, enhancing the overall user experience.
3.4. Visualization Tier
Based on GIS technology, we adopted both Client/Server (C/S) architecture and B/S architecture to display and share the assessment results. Additionally, 2D/3D visualization methods were used to optimize the display. This tier plays an important role in helping users to understand the assessment process better, providing certainty regarding the results, and assisting in decision-making processes, which ensure that the application has high practical value.
First, using ArcGIS development components with Visual C++ and other visualization toolkits, the storm surge assessment results are processed and displayed under C/S architecture. In accomplishing this process, users are able to modify the details of all the elements used for the assessment, e.g., indicators, weighted parameters, and data sources. Users are even able to adjust the symbolization scheme and the render mode to present the results in a particular style.
Figure 6 shows an example of the results regarding storm surge risk in certain coastal areas, which could be rendered further by users depending on their individual needs.
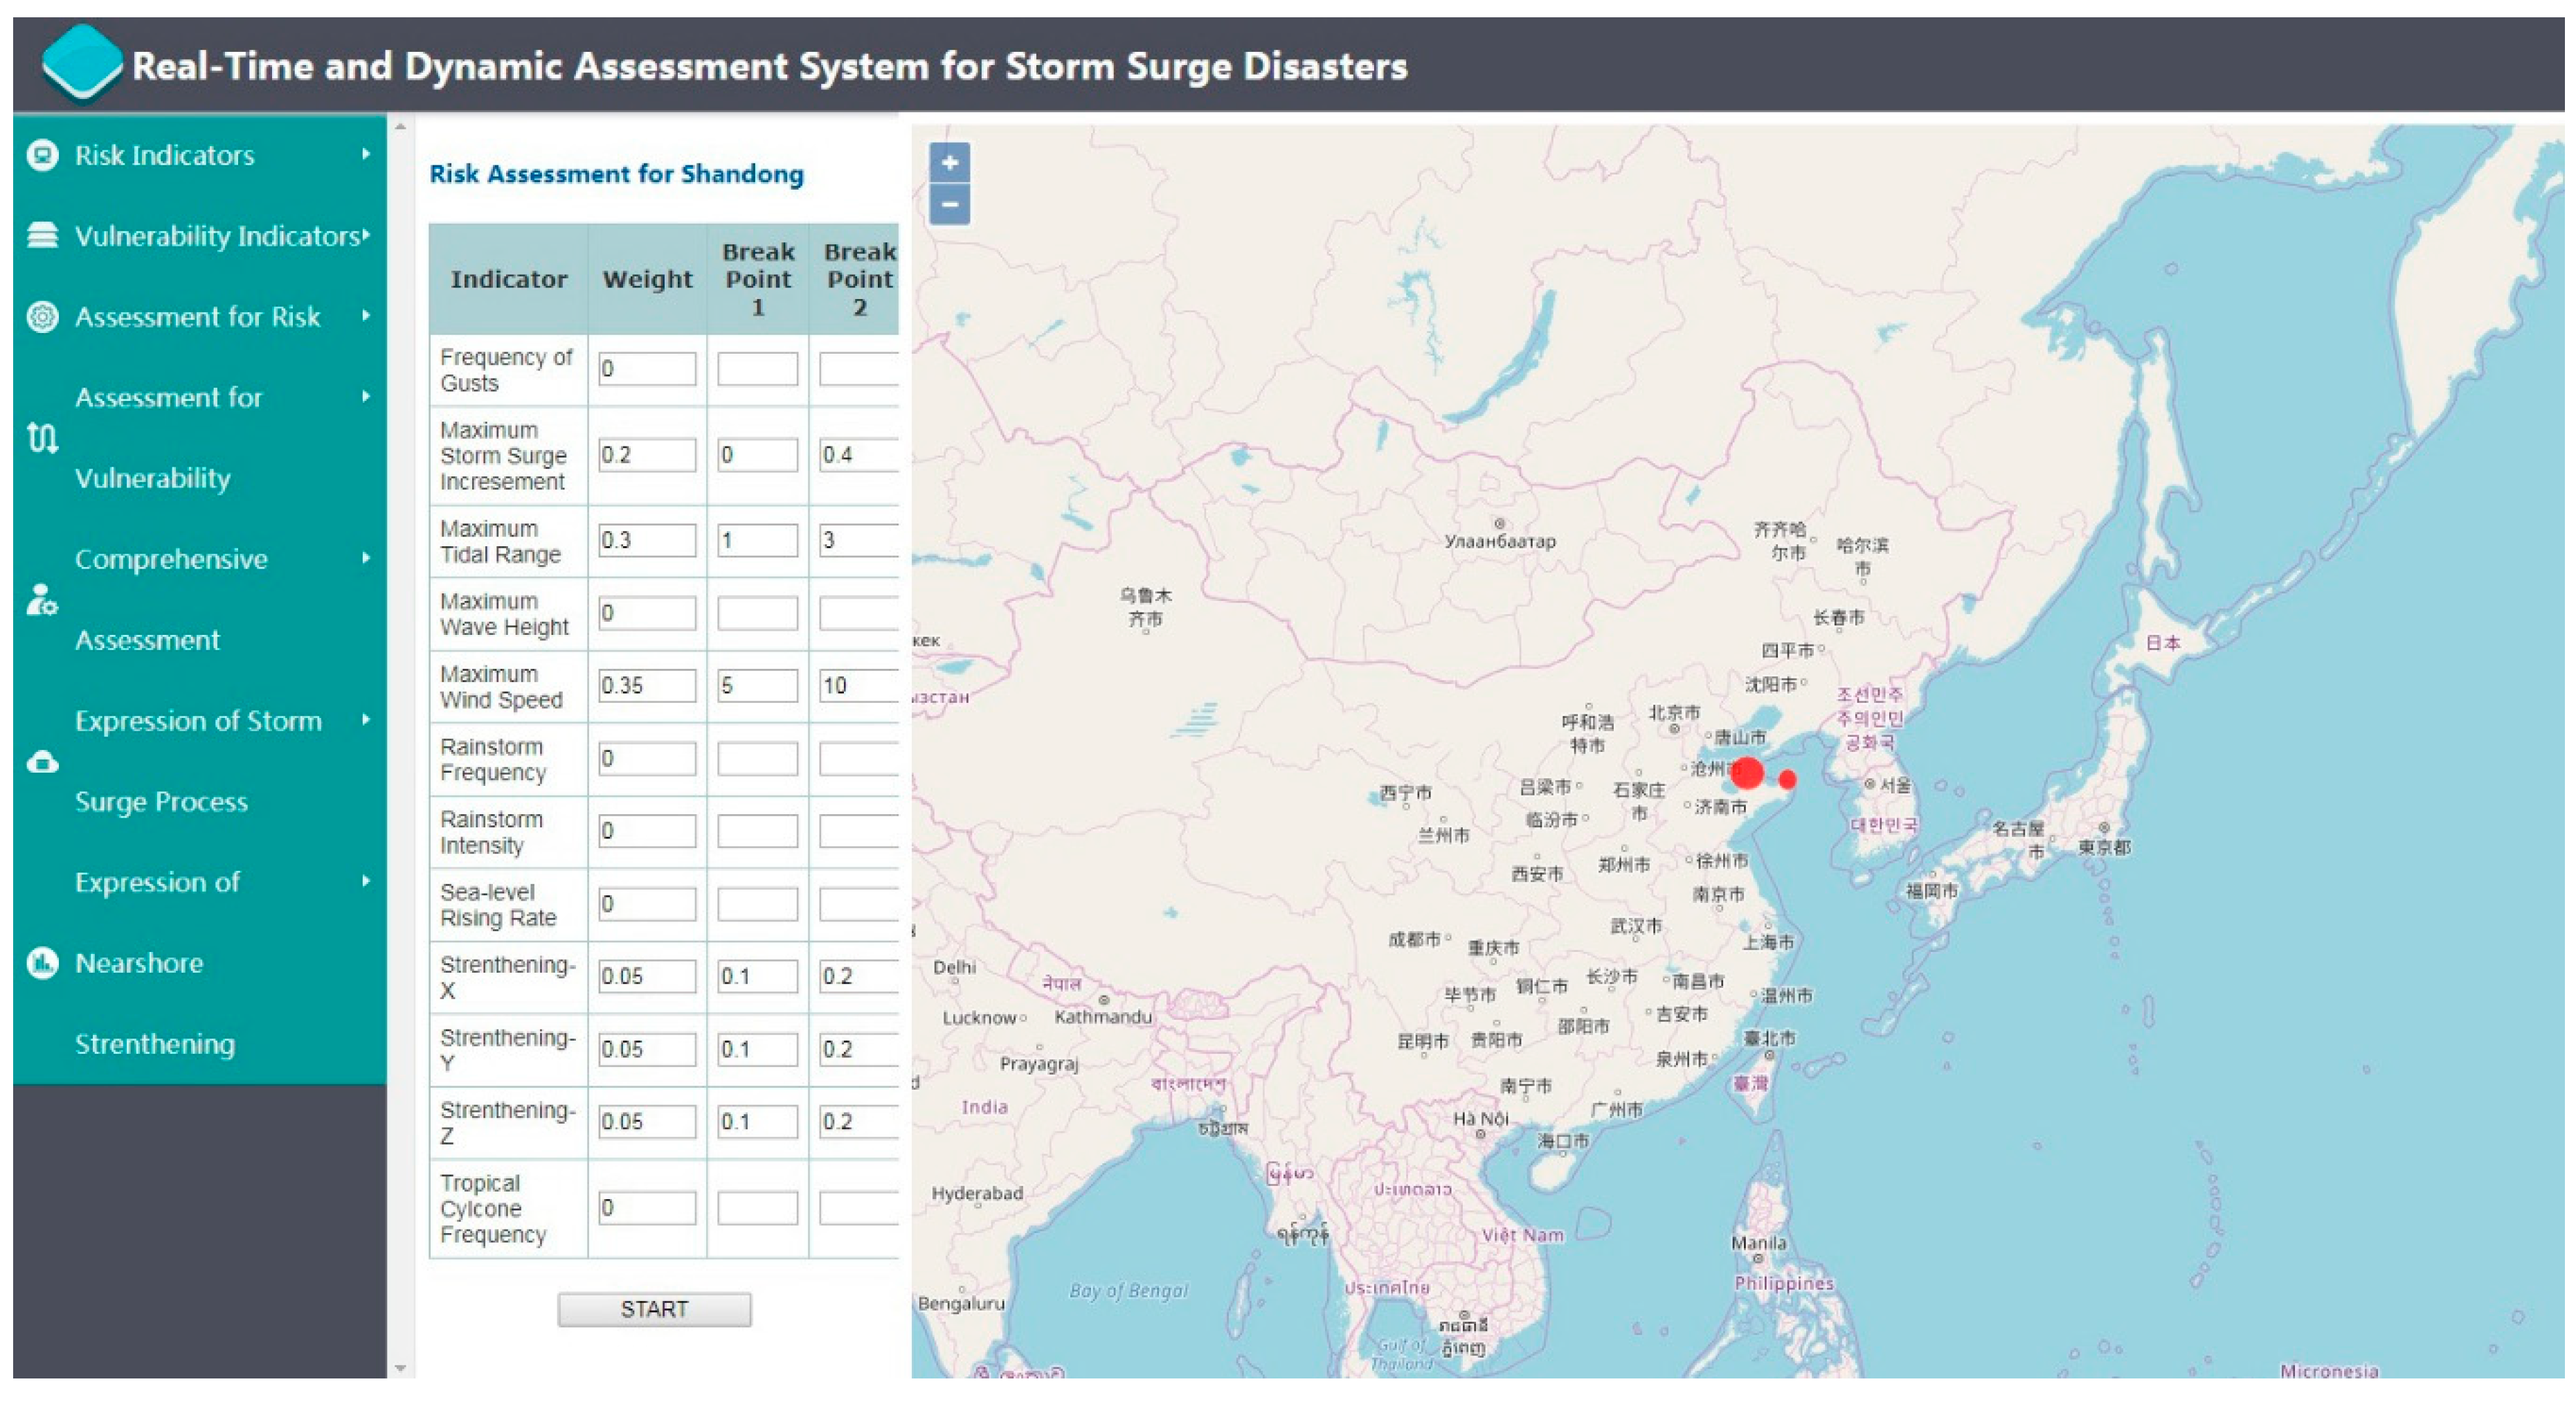
With the rapid development of the Internet and the growth of network bandwidth, there is increasing demand from public users for the ability to utilize this application through a web browser. Correspondingly, through combination with open source WebGIS software technologies such as Openlayers and Mapserver, the visualization module also functions under B/S architecture, displaying the storm surge assessment results in an Internet browser. Users can call the encapsulated model, which is deployed on the server side, while most of the calculation process is completed by the server. The browser side only needs to receive the assessment results and display them with an online map as background. For improved display, the application can publish personalized maps with the help of Mapserver or different online map sources such as Open Street Map (OSM) can be selected, as shown in
Figure 7.
Figure 6 and
Figure 7 show the final assessment results, in which the size of the red dot indicates the magnitude of storm surge risk. The module shown in
Figure 6 is developed using C/S architecture, while the module shown in
Figure 7 is developed using B/S architecture. The two applications have a similar function, but the application under B/S architecture is better and more scalable than that under C/S architecture, making it easier for users to perform fast operations and real-time assessment.
In terms of the regional scale, the application could also be configured to show the results for larger areas. After the server side sends the results to the browser side, users can check the hourly results separately or start an animation to make the results easier to understand.
Figure 8 shows a sequence of results at different moments for the sea area near the Shandong Peninsula in China.
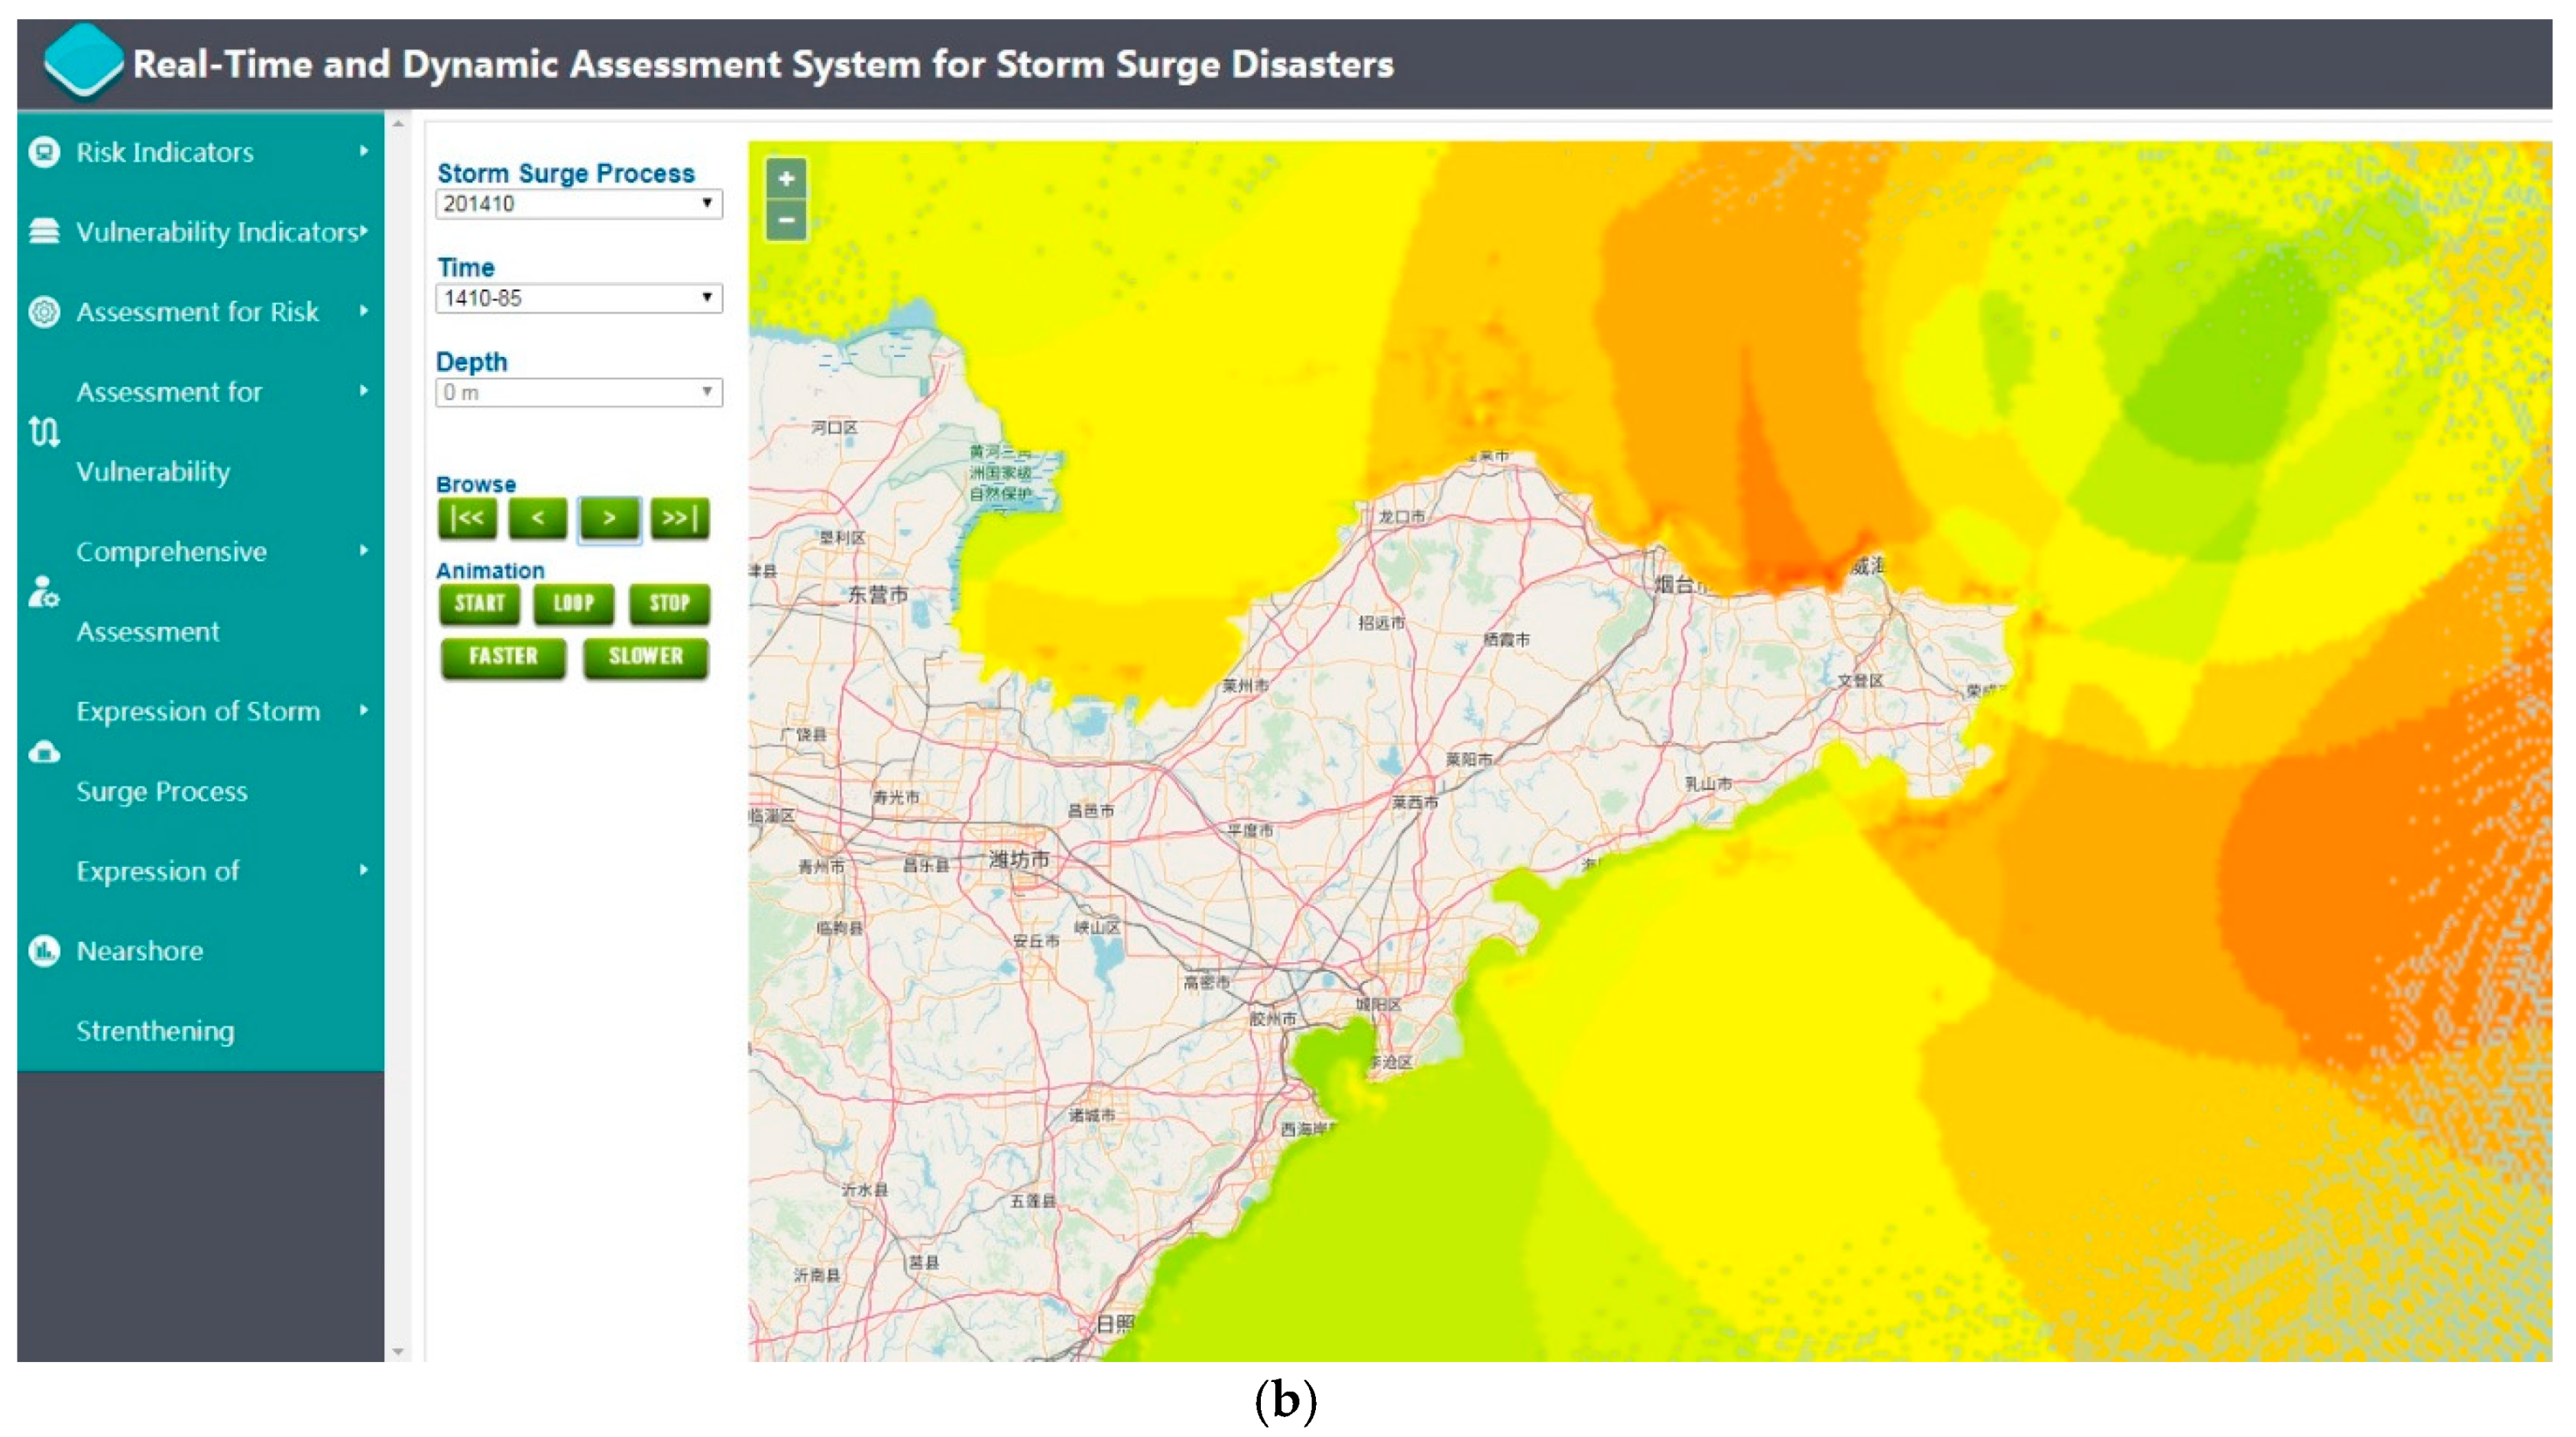
The final stage of the risk assessment and display process is the integration of 2D and 3D visualization. To optimize the display effect, we used a 3D sphere to show the assessment results. The core sphere is constructed using OSG Earth and GIS technology, while the read and write operations of the data are performed through library files such as GDAL. This sphere provides users with a 3D spatial information display and a query interface to meet further user requests.
The 3D module contains many GIS-related functions and it uses many GIS concepts. The basic function includes 3D scene roaming, layer control, layer display, and other GIS functions. The application combines basic geographic data and marine environment data, e.g., currents, tides, sea level, water level rise, wind speed, and water age. This module finds a way to achieve real-time rendering and 3D rendering data. Similar to the 2D application, the 3D application also provides a function for visualization of the time series assessment results, e.g., display, hide, loop, and animation. Users can also request element attribute information, elevation information, coordinate information, and other information related to different marine environment elements.
Figure 9 shows examples of 3D visualization of the assessment results.
3.5. Results Verification
After integrating the four tiers of technology, the proposed approach was initially tested using historical storm surge data from around the Shandong Peninsula in China. Subsequently, it was verified with data from actual storm surge processes and its use was promoted in some marine management departments of local government. In some typical storm surge processes, such as Typhoon Hato (No. 1713), it was applied to generate real-time assessment results to help with the emergency response and to reduce disaster losses. Finally, the credibility of the assessment results of the proposed approach was proven by comparing them to the post-disaster investigation results.
Typhoon Hato (No. 1713) was one of the strongest typhoons in recent years, and it caused considerable damage to several coastal areas in China. At 14:00 local time (LT) on August 20, 2017, the storm formed over the northwest Pacific. Its intensity continued to strengthen and it turned into a typhoon at 15:00 LT on August 22. At around 12:50 LT on August 23, Hato landed in Zhuhai (Guangdong Province, China) as a strong typhoon (45 m/s). Typhoon Hato caused China’s National Meteorological Center to issue the first typhoon red warning signal of 2017, while China’s Hong Kong and Macau Meteorological Department issued a Category 10 hurricane signal. When the typhoon landed, it coincided with the astronomical tide, which led to six observation stations in Guangdong Province recording the highest tide level in history and the highest level in a century. On August 23, violent waves with heights of 6–10 m appeared in the sea area to the east of Guangdong Province and over the northern part of the South China Sea as the typhoon passed. Storm surges and huge waves affected low-lying coastal areas around the city of Zhuhai, Hong Kong, Macau, and in other regions causing 24 fatalities and economic losses of US$6.82 billion.
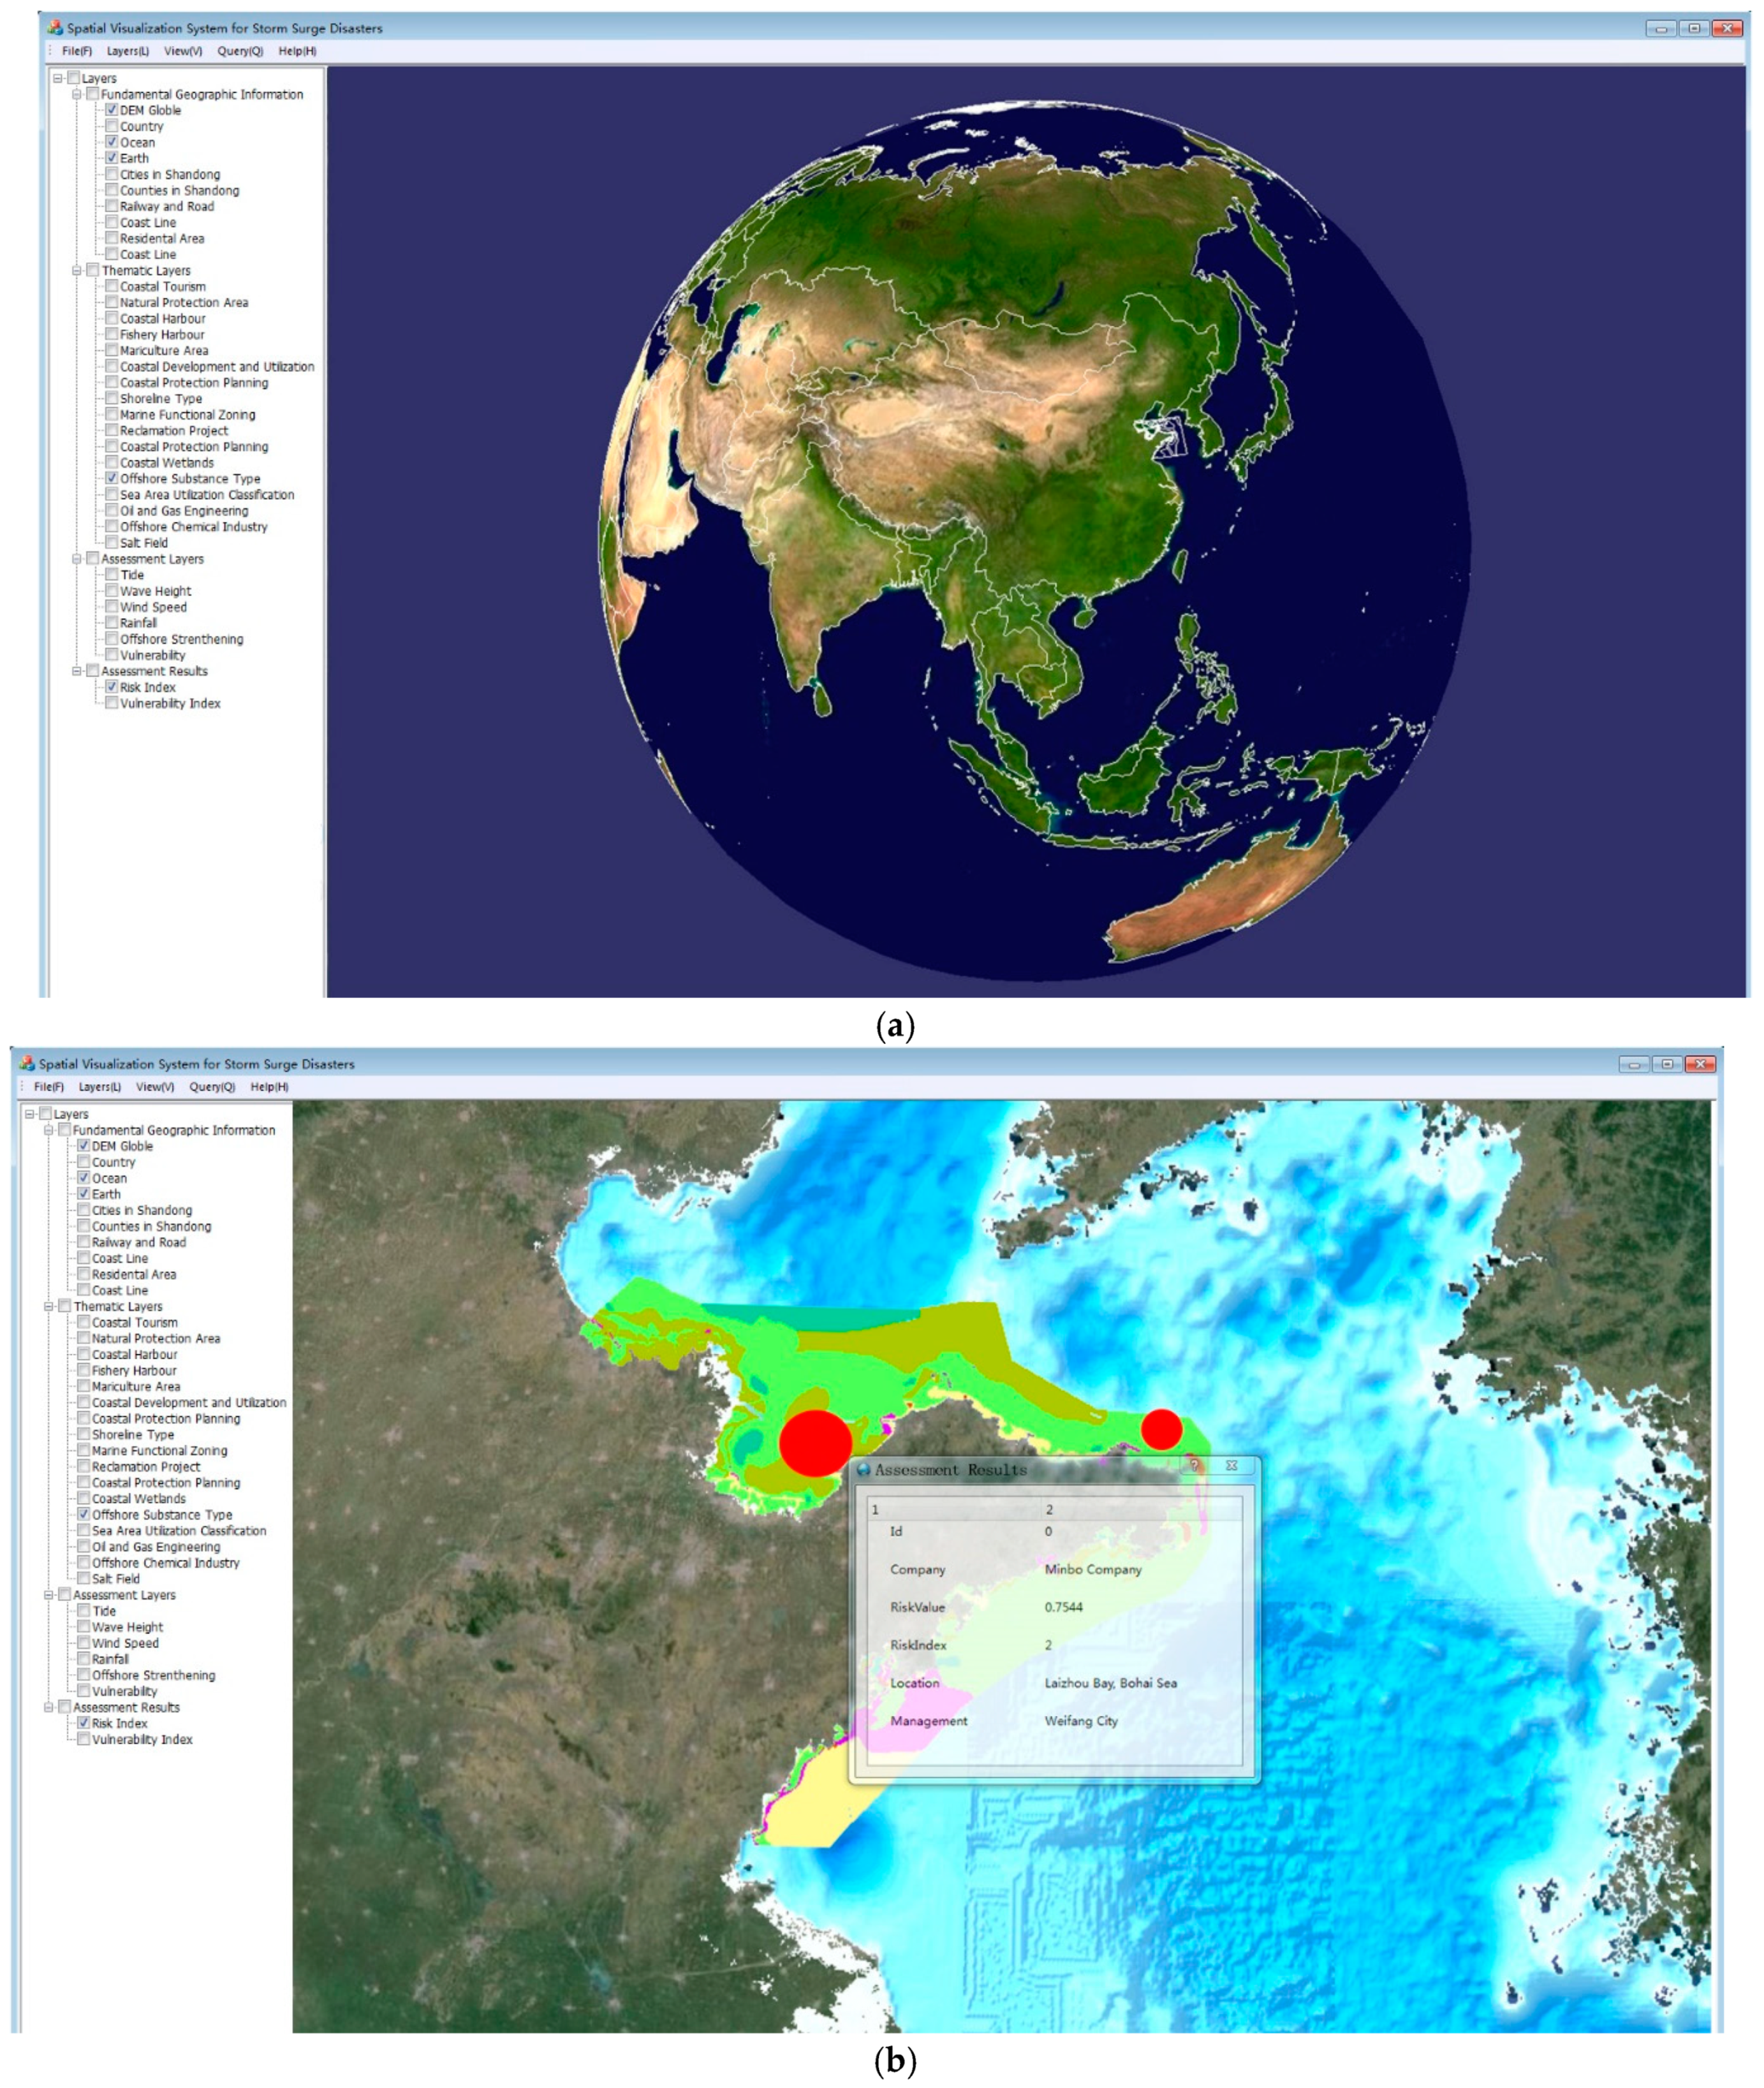
As a case study, the proposed system was applied to the city of Shenzhen (Guangdong Province, China). It carried out a long-term sequence forecast, producing assessment results for the storm surge process and visualization interfaces for these results. In addition to the animation effect, it was also continuously updated according to the numerical prediction model, which modified the assessment results in real time. Based on the default parameters, users were able to adjust the indicators and weights to realize dynamic assessment. Finally, the system was configured to produce the assessment results shown in
Figure 10. Thus, local beach managers and government officers could obtain information from this application, both to support the evacuation of the public and to help safeguard property and infrastructure.
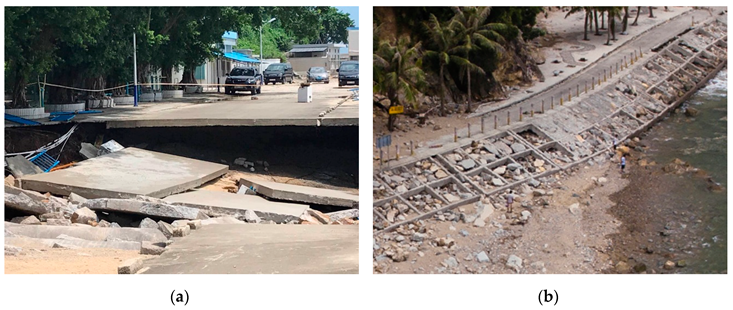
After Typhoon Hato passed, a disaster investigation was performed in the city of Shenzhen (
Figure 11). To verify the assessment results, the coastal area at high risk shown in
Figure 10 was also located. Assessment revealed that a section of dam of over 200 m was destroyed, a roadbed was hollowed out and the road surface damaged in multiple places, and an area of dike of approximately 300 m
2 was washed away. The location and intensity of the damage matched the results of the system assessment results, confirming the reliability and ease of use of the proposed approach.
4. Conclusions and Discussion
Based on GIS technology, we performed real-time dynamic assessment of storm surge disasters. In this paper, a comprehensive system is described in which several complex modules and processes are integrated, e.g., numerical modeling, data detection, information transmission, file interpretation, indicator management, multidimensional visualization, and human–computer interaction. The entire system, which can operate automatically, is accessible via a web browser interface. With so many modules integrated and working together, it represents a uniquely comprehensive system when compared with other similar applications. After deployment and practical testing, especially in comparison with an actual storm surge disaster (Typhoon Hato), the high level of reliability and stability of this system was proven.
The main purpose of this work was to establish an integrated system framework for assessing storm surge disasters and to ensure automated and stable running of this integrated system. A four-tier model was adopted to accomplish the disaster assessment. These four tiers comprised a numerical model tier, data management tier, disaster assessment tier, and visualization tier, reflecting the “high cohesion and low coupling” concept. Using the automated numerical model, various information techniques were utilized to perform a systematic assessment of the application. The visualization tier adopts dual C/S and B/S architecture, and it optimizes the visualization effect by using multidimensional visualization methods. This comprehensive application could constitute a useful tool for the development of risk assessment processes for other kinds of marine disasters. While the basic model was verified using data for certain storm surge processes, the proposed assessment method still requires some modification to improve its performance.
The disaster assessment of storm surges focuses mainly on disaster risk; however, the current risk indicators are not sufficiently precise, and additional indicators could be added in the next version of the model. Moreover, the impact of a storm surge and the magnitude of associated losses depend not only on the risk indicators but also on the vulnerability indicators, which need further research. In future work, the assessment of vulnerability should be considered in terms of sensitivity, exposure, and vulnerability. Finally, the impact of a storm surge should be evaluated based on the combined results of risk and vulnerability.
The proposed framework described in this paper for risk assessment of storm surge disasters is also applicable to other marine disasters such as huge waves, sea ice, and tsunamis. Starting with this proposed framework, we could develop automated dynamic assessments for other types of disaster. At the same time, continuous improvement of the assessment method is necessary, e.g., coupling of the common influencing factors of multiple disasters, or analysis of disaster risk assessment methods for multi-hazard events. Improvement in the accuracy of the assessment model could be achieved by adopting more complex methods, i.e., either traditional methods (e.g., analytic hierarchical process or gray correlation analysis) or modern methods (e.g., orthogonal design method or variation coefficient method).


