Article

Mutualistic Pattern of Intra-Urban Agglomeration and Impact Analysis: A Case Study of 11 Urban Agglomerations of Mainland China

Urban and Rural Planning, School of Architecture, Soochow University, Suzhou 215123, China
ISPRS Int. J. Geo-Inf. 2020, 9(10), 565; https://0-doi-org.brum.beds.ac.uk/10.3390/ijgi9100565
Submission received: 12 August 2020 / Revised: 24 September 2020 / Accepted: 28 September 2020 / Published: 29 September 2020

Abstract

:
Despite the worldwide studies on urban agglomeration (UA), the effects of intra-UA interaction patterns have not been thoroughly elucidated to date. To fill the research gap, first, this study utilized the Baidu Internet search data to quantify the internal interaction patterns of 11 main UAs in China. Rail-way data were referenced for verification. Based on building intercity interaction network, the node symmetry index (NSI) was calculated. Considering the estimated interaction strength and mutuality, the intra-interaction patterns were classified into symmetrical and asymmetrical mutualism, where the former indicates that the interactions of cities are mutually beneficial and the latter means that the interactions are unbalanced. The socio-economic development levels of cities and UAs were estimated by the entropy-TOPSIS (Technique for Order Preference by Similarity to an Ideal Solution) method. Finally, the impacts of intra-UA interaction were explored through ordinary least square regression. This study obtained two findings. Firstly, at the city scale, symmetrical mutualism had a greater impact than asymmetrical mutualism on the city’s socio-economic development level. Secondly, at the regional scale, both symmetrical and asymmetrical mutualism were related with regional socioeconomic development level; however, only symmetrical mutualism showed a correlation with regional coordinated development level. Respondent suggestions and implications to promote regional coordinated development were then offered based on the results of the analysis. Limitations of this study include that exogenous interactions between UAs and their backlands, and other relationships, such as competition, were not discussed. These issues can be considered in future researches. This study characterizes the interaction pattern of intra-urban agglomeration and offers advice and suggestion for implementing regional sustainable development.

1. Introduction

Urban agglomeration (UA) is a special geospatial organization of a series of cities formed when the city crosses a highly developed stage. As a principal unit for regional participation in globalization, UA has considerable significance for regional development [1]. Taking China for example, the Yangtze River Delta, Pearl River Delta, Jinjingji, and Chengyu UAs produce more than half of the national gross domestic product (GDP) with 45% of the total population and only 9% of the total area [2]. The development of UA forms the pillar of regional and national development, thereby capturing scholarly attention worldwide. The tight and close interactions of intra-UA are considered one of its basic characteristics [3], which have profound effects on the development of UA. The intra-UA interaction structure positively affects the flow of elements and knowledge spillover and therefore promotes movements of the labor force, construction of infrastructure, aggregation of industries, and technology innovation [4,5,6,7].
There are disparities in the development levels of different UAs. Taking China for example, the eastern coastal UAs are founded nearly 30 years earlier than the western inland UAs. Besides, the development gap in fields like GDP, import and export trade, scientific research expenditure, education input, and medical security is also obvious. Yangtze River Delta is one of the representative UA in eastern coastal China, which is characterized by highly connected intercity transportation and frequent cooperation. The development disparity among cities in the Yangtze River Delta is insignificant. As a comparison, Chengyu UA is a symbol of western China UAs. Unlike the multi-core city network of eastern coastal UA, Chengyu UA is a typical single-core network and the unbalanced development has been the bottleneck for regional sustainable development [8]. Therefore, quantifying intra-UA interaction patterns and analyzing the relationship between the interaction and the development at both the city and UA scale, is important to understand the effects of intra-UA interaction.
Existing studies on UA interaction were conducted using data such as people flow, industry chains, and social networking sites (SNS) [9,10,11], and they focused mostly on delineating the whole endogenous structure. Considering the large data demand for intercity connection building, especially for a complex city network, some studies utilized an Internet search index such as the Baidu Index (BI), which indicates the interest of people in one place with regard to another place to simulate the potential city interaction [12,13]. As a result of the differences in development bases, conditions, and functions of UA cities, the interaction types among cities are heterogeneous, thereby generating different effects on cities and the region. However, the identification of different intra-UA interaction patterns and analysis of respondent effects is insufficiently discussed.
To quantify and analyze the intercity connection patterns, the symbiotic theory can be applied. Symbiosis was firstly proposed by a biologist Heinrich Anton de Bary in 1879 as “the living together unlike organisms” [14]. Later on, the symbiotic theory was applied in urban and regional studies by extending the study objectives from biological organisms to geographical objects, such as communities, agencies, industries, and cities [15,16,17,18]. One of the advantages of using the symbiotic theory is that it can distinguish the interaction patterns among the participant units, which includes parasitism, commensalism, and mutualism. In a UA symbiotic system, the component cities are the symbiotic units, and the intercity interactions form the symbiotic patterns. The intercity interaction can be reflected from the perspective of city flow, namely, people, material, and information flow. Given that intercity connection is the priority to form a UA, mutualism is the basic interaction type among UA cities, which means that the flows among cities are mutual. However, due to the differences in cities’ development and function, the flow direction, frequency, and strength vary, and the mutualistic relationship can be further classified into symmetrical and asymmetrical. The former type means that both cities gain equal benefits from the interactions among them, whereas the latter type denotes that one city gains more benefits than the other. Different mutualism is assumed to generate different effects on the socio-economic development of both cities and the UA. This study attempts to identify the mutualistic types and further analyzes their impacts on the socio-economic development of UAs at both the regional and city scales. The highlights of this study are quantification of the intra-UA interactions, identification of the heterogeneity in the intercity connections, and analysis of the effects of different interaction patterns on city and regional socio-economic development.
Two hypotheses are proposed in this study:
  • The proportion of endogenous mutualism of a UA has a positive effect on its coordinated development;
  • Symmetrical and asymmetrical mutualism have different impacts on the socio-economic development of cities.
Based on identifying the intra-UA symmetrical and asymmetrical mutualism and comprehensively evaluating the socio-economic development at the city and UA scale, the ordinary least square (OLS) regression is applied to verify the hypothesis. The main structure of this paper is as follows. After the introduction, a literature review is conducted on the endogenous relationships within a UA and its impacts on the region and the application of symbiotic theory in regional studies. Next, the methodologies are offered and the study area and the data that are adopted in the analysis are introduced. Through the verification of the two proposed hypotheses, the discussion section offers the implications and limitations of the study. The final section concludes the study.

2. Literature Review

2.1. Definition of Urban Agglomeration

UA is the product of urbanization and industrialization at a certain stage, which can be traced back to the 19th century. In 1898, Ebenezer Howard proposed the concept of “town cluster” [19], which is commonly recognized as the prototype of “urban agglomeration”. He integrated cities and their surrounding rural areas and claimed that an urbanized landscape includes not only urban areas but also several “garden cities” at the periphery. Later on, in 1915, British urban scholar Patrick Geddes proposed the concept of “conurbations”, which denotes the spatial urban sprawl caused by population concentration along with transportation (such as railways) and resource distribution (such as coal) [20]. French geographer Gottmann [21] proposed the concept of the “megalopolis” in his study “Megalopolis: The Urbanization of the Northeastern Seaboard of the United States”. It denotes the phenomenon in which metropolitan areas gradually merged with nearby urban regions based on the interactions of population and economic activities, finally forming a huge area with multiple cores. He concluded the conditions for developing a metropolis: (1) it is a large multi-core urban system that develops along a specific axis, (2) many forms of interactions occur between cities, (3) the spatial form of cities are interconnected spatially, and (4) the industries are highly concentrated in this region. Subsequent scholars mostly followed the concept of “metropolis” when studying the connotation of UA [22].
In the 1980s, the concept of the “metropolis” was introduced into China; wide-ranging studies and discussions on UAs in China have been conducted since then. Different scholars have varying definitions of UA. For example, Fang, et al. [23] indicated that in a UA, at least one central city serves as the core and other metropolitan areas or cities serve as the foundation, thereby forming the basic structure of UA. Yao, et al. [24] defined the UA as an organism whose internal parts are interdependent and connected by various types of transportation networks. According to the location, scale, and socioeconomic development level, UAs in China can be classified into national, regional, sub-regional, and local types. For example, “The Central Government’s Proposal on the Formulation of the Eleventh Five-year Plan” and “National New Urbanization Plan” pointed out that the national UAs included the Yangtze River Delta city group, the Jingjinji city group, the Pearl River Delta city group, the Chengyu city group, and the Yangtze River Delta UA [25]. Considering the representativeness and significance, the 11 UAs selected in this study are all national UAs according to the updated national plan.

2.2. Endogenous Interactions of UA

The analysis of the intra-UA interaction pattern has attracted much attention in both developed and developing countries. Methodologies can be summarized as empirical studies and model applications, and the study purposes can be concluded as the analysis of the development process, driving forces, and impacts.
In empirical studies, the measured data that reflect the real interactions among cities of UA such as transportation, cargo movement, people flow, and Internet communication are utilized. For example, Bruinsma and Rietveld [26] built a public transportation infrastructure network of the main cities of Europe by using the road, railway, and airline data and analyzed the connections of European UAs based on an accessibility analysis. By using the panel population data of core cites and fringe areas of Europe from 1991–2004, Kabisch and Haase [27] discussed the diversified patterns of European agglomerations. With the development of data collection and processes, big data from SNS such as Facebook, Twitter, and Weibo are applied to build social connections among cities, based on which economic interactions can be simulated [11,28].
To comprehensively estimate city interactions, mathematical-statistical and spatial simulation models were adopted in some studies. For example, by applying a doubly constrained model, Kauffmann [29] simulated the commuting patterns of the central German metropolitan region. Cao, et al. [30] analyzed the subpixel-level impervious surfaces of Beijing–Tianjin–Hebei (BTH) and Boswash UA. By utilizing landscape metrics and the gravity model, they concluded that the spatial structure of BTH experienced stages from a single-center structure to a network structure, whereas the intra-Boswash pattern is more stable. Other studies analyzed the urban interactions from the perspective of urban landscape patterns. Yu, et al. [31] utilized nighttime light satellite images to identify urban built-up areas, and they characterized the urban clusters at the national level by analyzing its geometric and shape features. Ramachandra, et al. [32] used remote sensing data with zonal gradients and spatial metrics to analyze the urbanization pattern and extent of a UA in India. They successfully identified the spatial structure of UA and concluded that its sub-parts were spatially integrated into a single and large urban patch.
Instead of utilizing an empirical method based on the collection of a large amount of data and modeling a simulation method that depends on the spatial, social, and economic estimations of cities, this study proposes a new method to build intercity connection based on an Internet search index with the development of web search services. Baidu (www.baidu.com) is the largest Chinese search engine. The BI is a free massive data analysis service that is based on Baidu web search and Baidu news, which reflects the keyword’s “user awareness” [33]. With the user’s location and main search keywords being set, for example, setting the user’s location as Beijing and using such keywords as “Shanghai city map”, “Hongkong city map”, and “Taipei city map”, the values of BI can show the levels of interest and awareness of the people in Beijing for the three cities. This finding indicates the connection between cities based on possible people flow. BI has been applied to describe and analyze cities’ interactions [34,35]. Therefore, this study utilizes the BI to build an intra-UA network, based on which the symbiotic theory is applied to identify the interaction pattern among cities. Then, the effects of different interaction patterns on both cities and UA are analyzed.

2.3. Symbiotic Analysis of Urban and Regional Studies

The symbiotic theory is widely applied to study the interaction between geographical entities, such as urban and rural areas, urban areas and its natural environment, and industries. Generally, two main methods are used to study the symbiotic relationships, namely, qualitative and quantitative methods: (1) The qualitative method mainly decouples the relationship between two units theoretically. For example, Qu and Hao [36] proposed an urban-rural integrated planning model by using the symbiotic theory. In their model, the symbiotic units were the city and the country; through the development of a symbiotic environment and interface, feasible measures were offered for urban-rural coordinated development. Zhu [37] applied the symbiotic theory to discuss the cooperation system of a UA. In his study, the multi-core cities of the UA were symbiotic units, and symbiotic relationships were developed based on close and various socioeconomic cooperation. He pointed out that the symbiotic relationship analysis of intra-UA would be an important direction for the spatial structure of mega-cities in the future. (2) The quantitative method focuses on quantifying the symbiotic relationship pattern and respondent effects. For example, Vukonic [38] discussed the symbiotic relationship between religion, tourism, and the local economy. Based on his research, religion and tourism can exist and cooperate, thereby positively affecting local economic development. Lee et al. [39] used a symbiotic analysis to describe and explain the relationship between Asian port cities. By studying Hongkong and Singapore, they illustrated the impact of this symbiotic relationship on urban development in the context of globalization. To conclude, the qualitative studies proved that the symbiotic theory can explain the structure of a UA, and the quantitative studies indicate that the symbiotic relationship pattern can be identified by estimating the interaction outcome, i.e., how much benefit the symbiotic units obtain from such relationships.
Referring to previous studies, this study utilized the symbiotic theory to explain the UA system qualitatively. The cities are the “living together units”, and intercity interaction forms a symbiotic pattern. Then, the intercity connection was studied quantitatively to display the internal symbiotic patters of different UAs. Furthermore, the respondent impacts on the socio-economic development of both the region and every single city were analyzed.

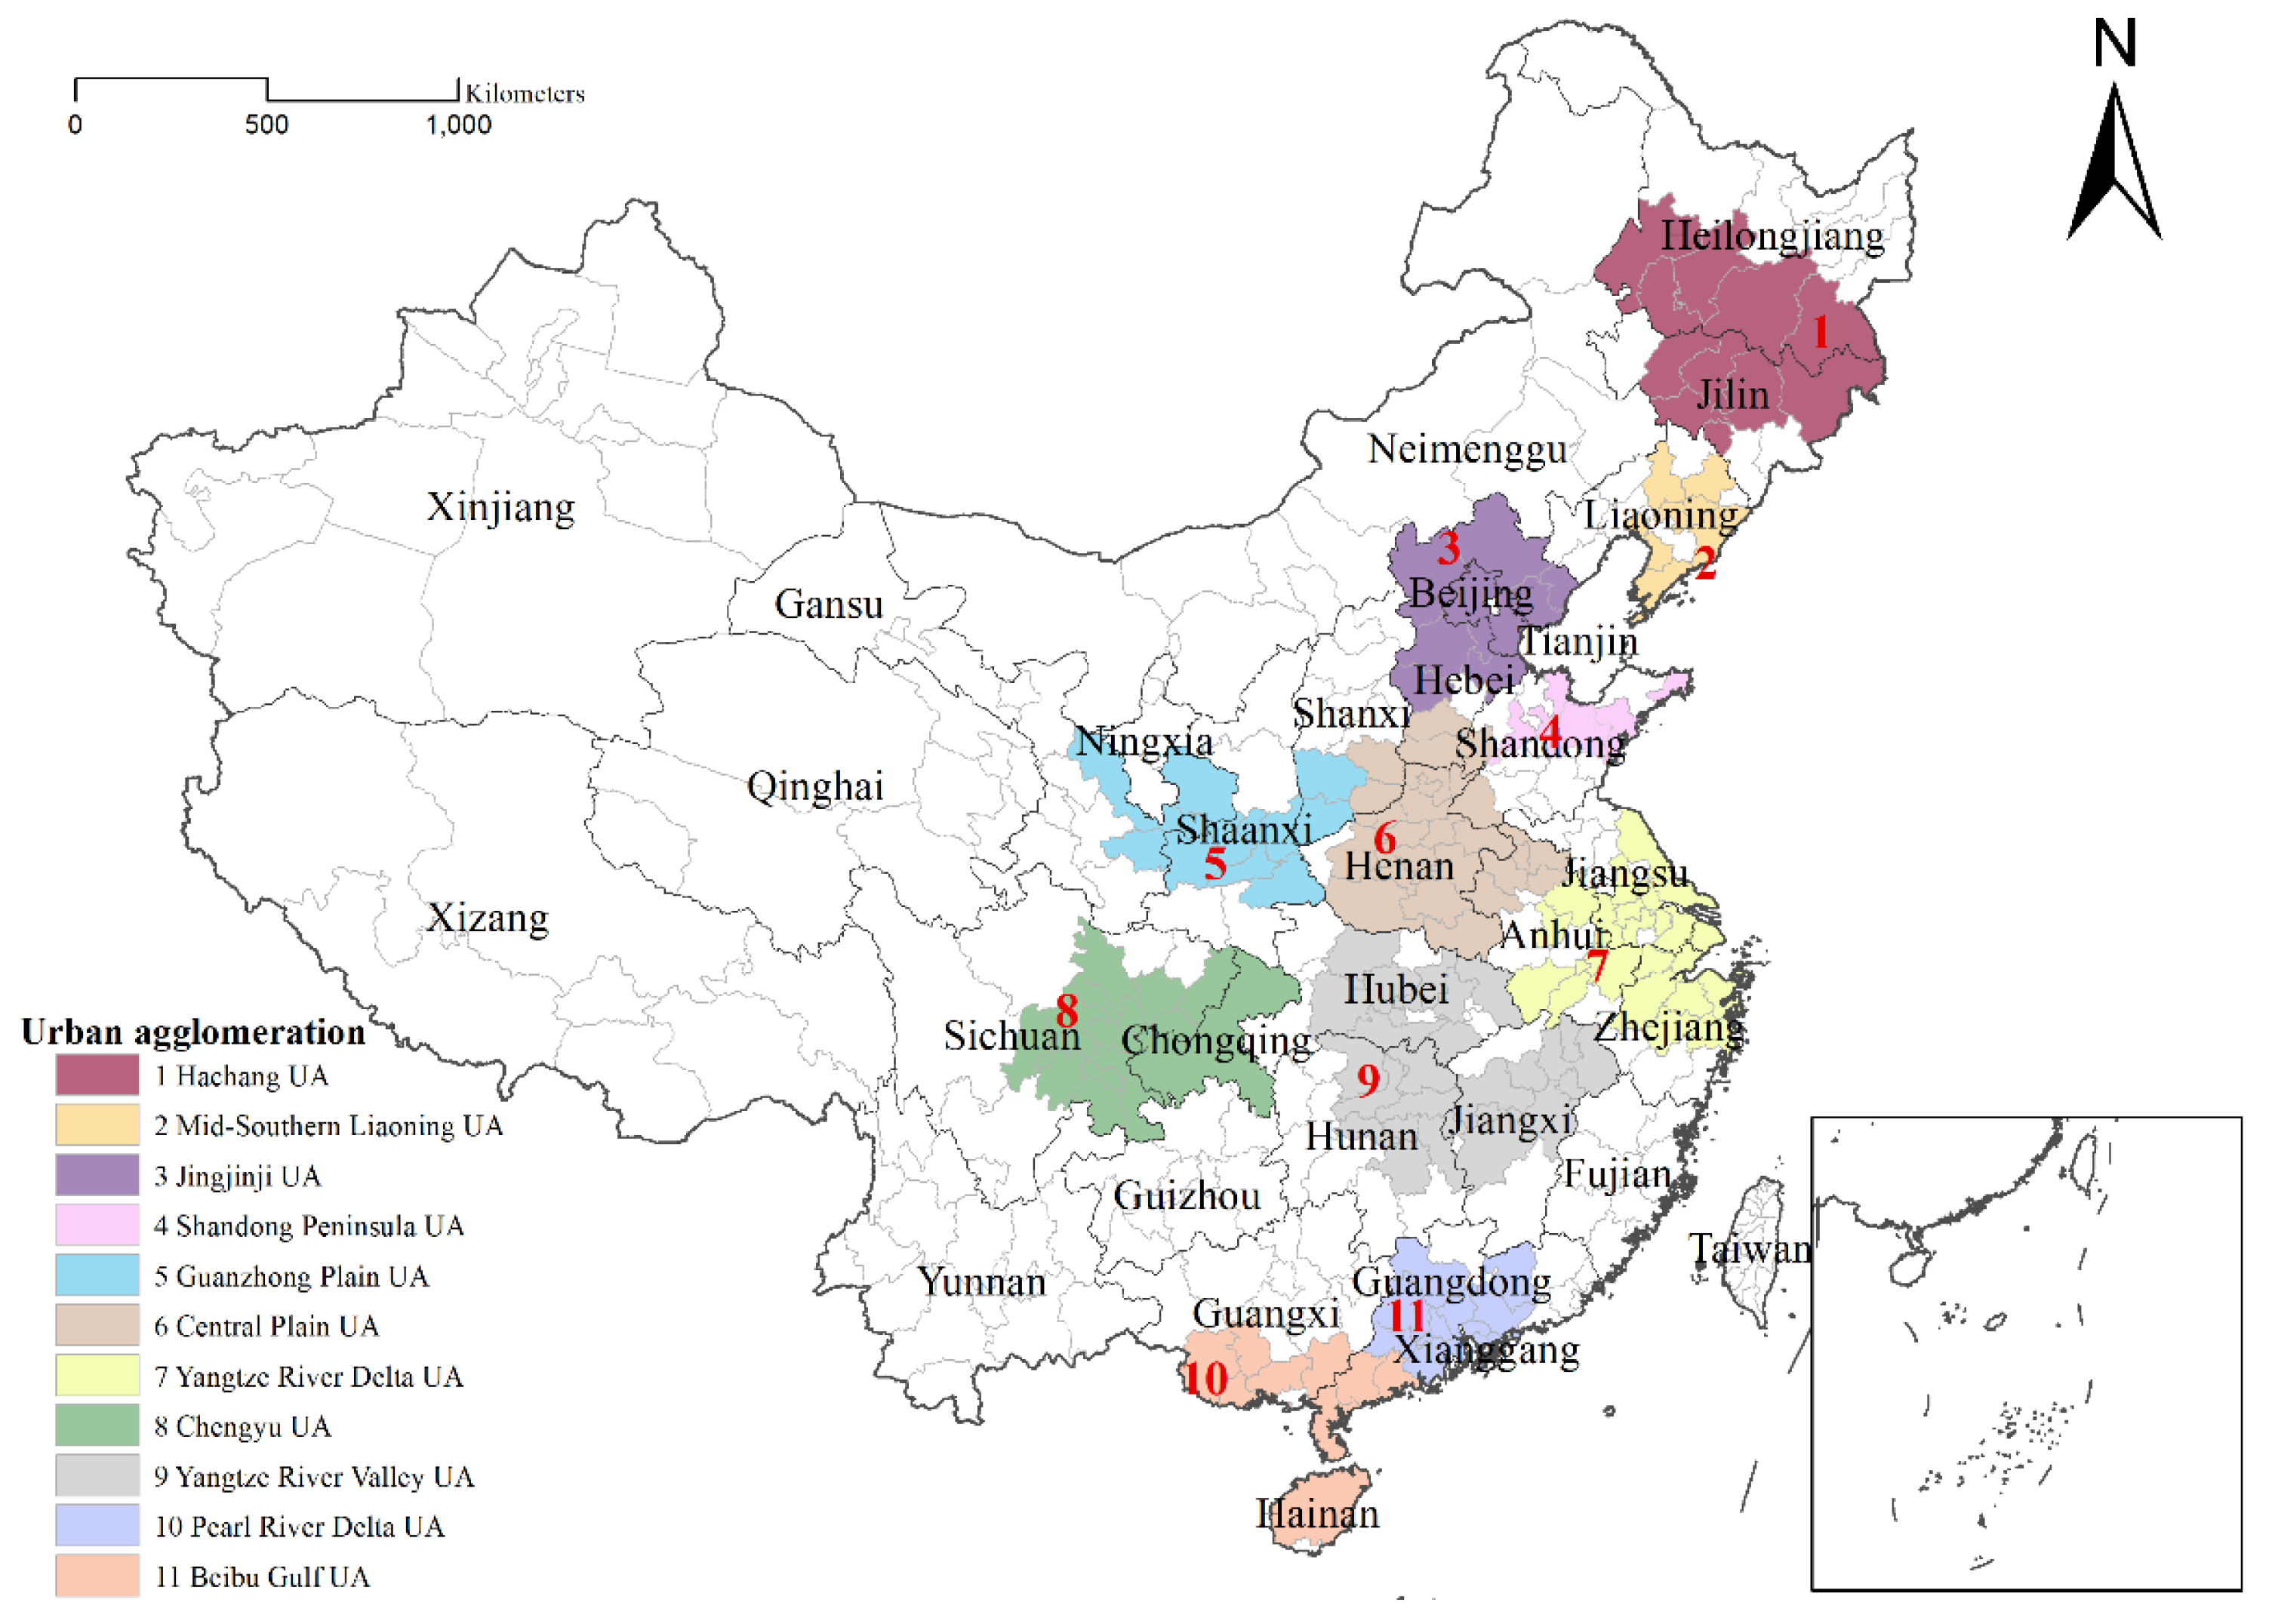
3. Study Area and Data Source
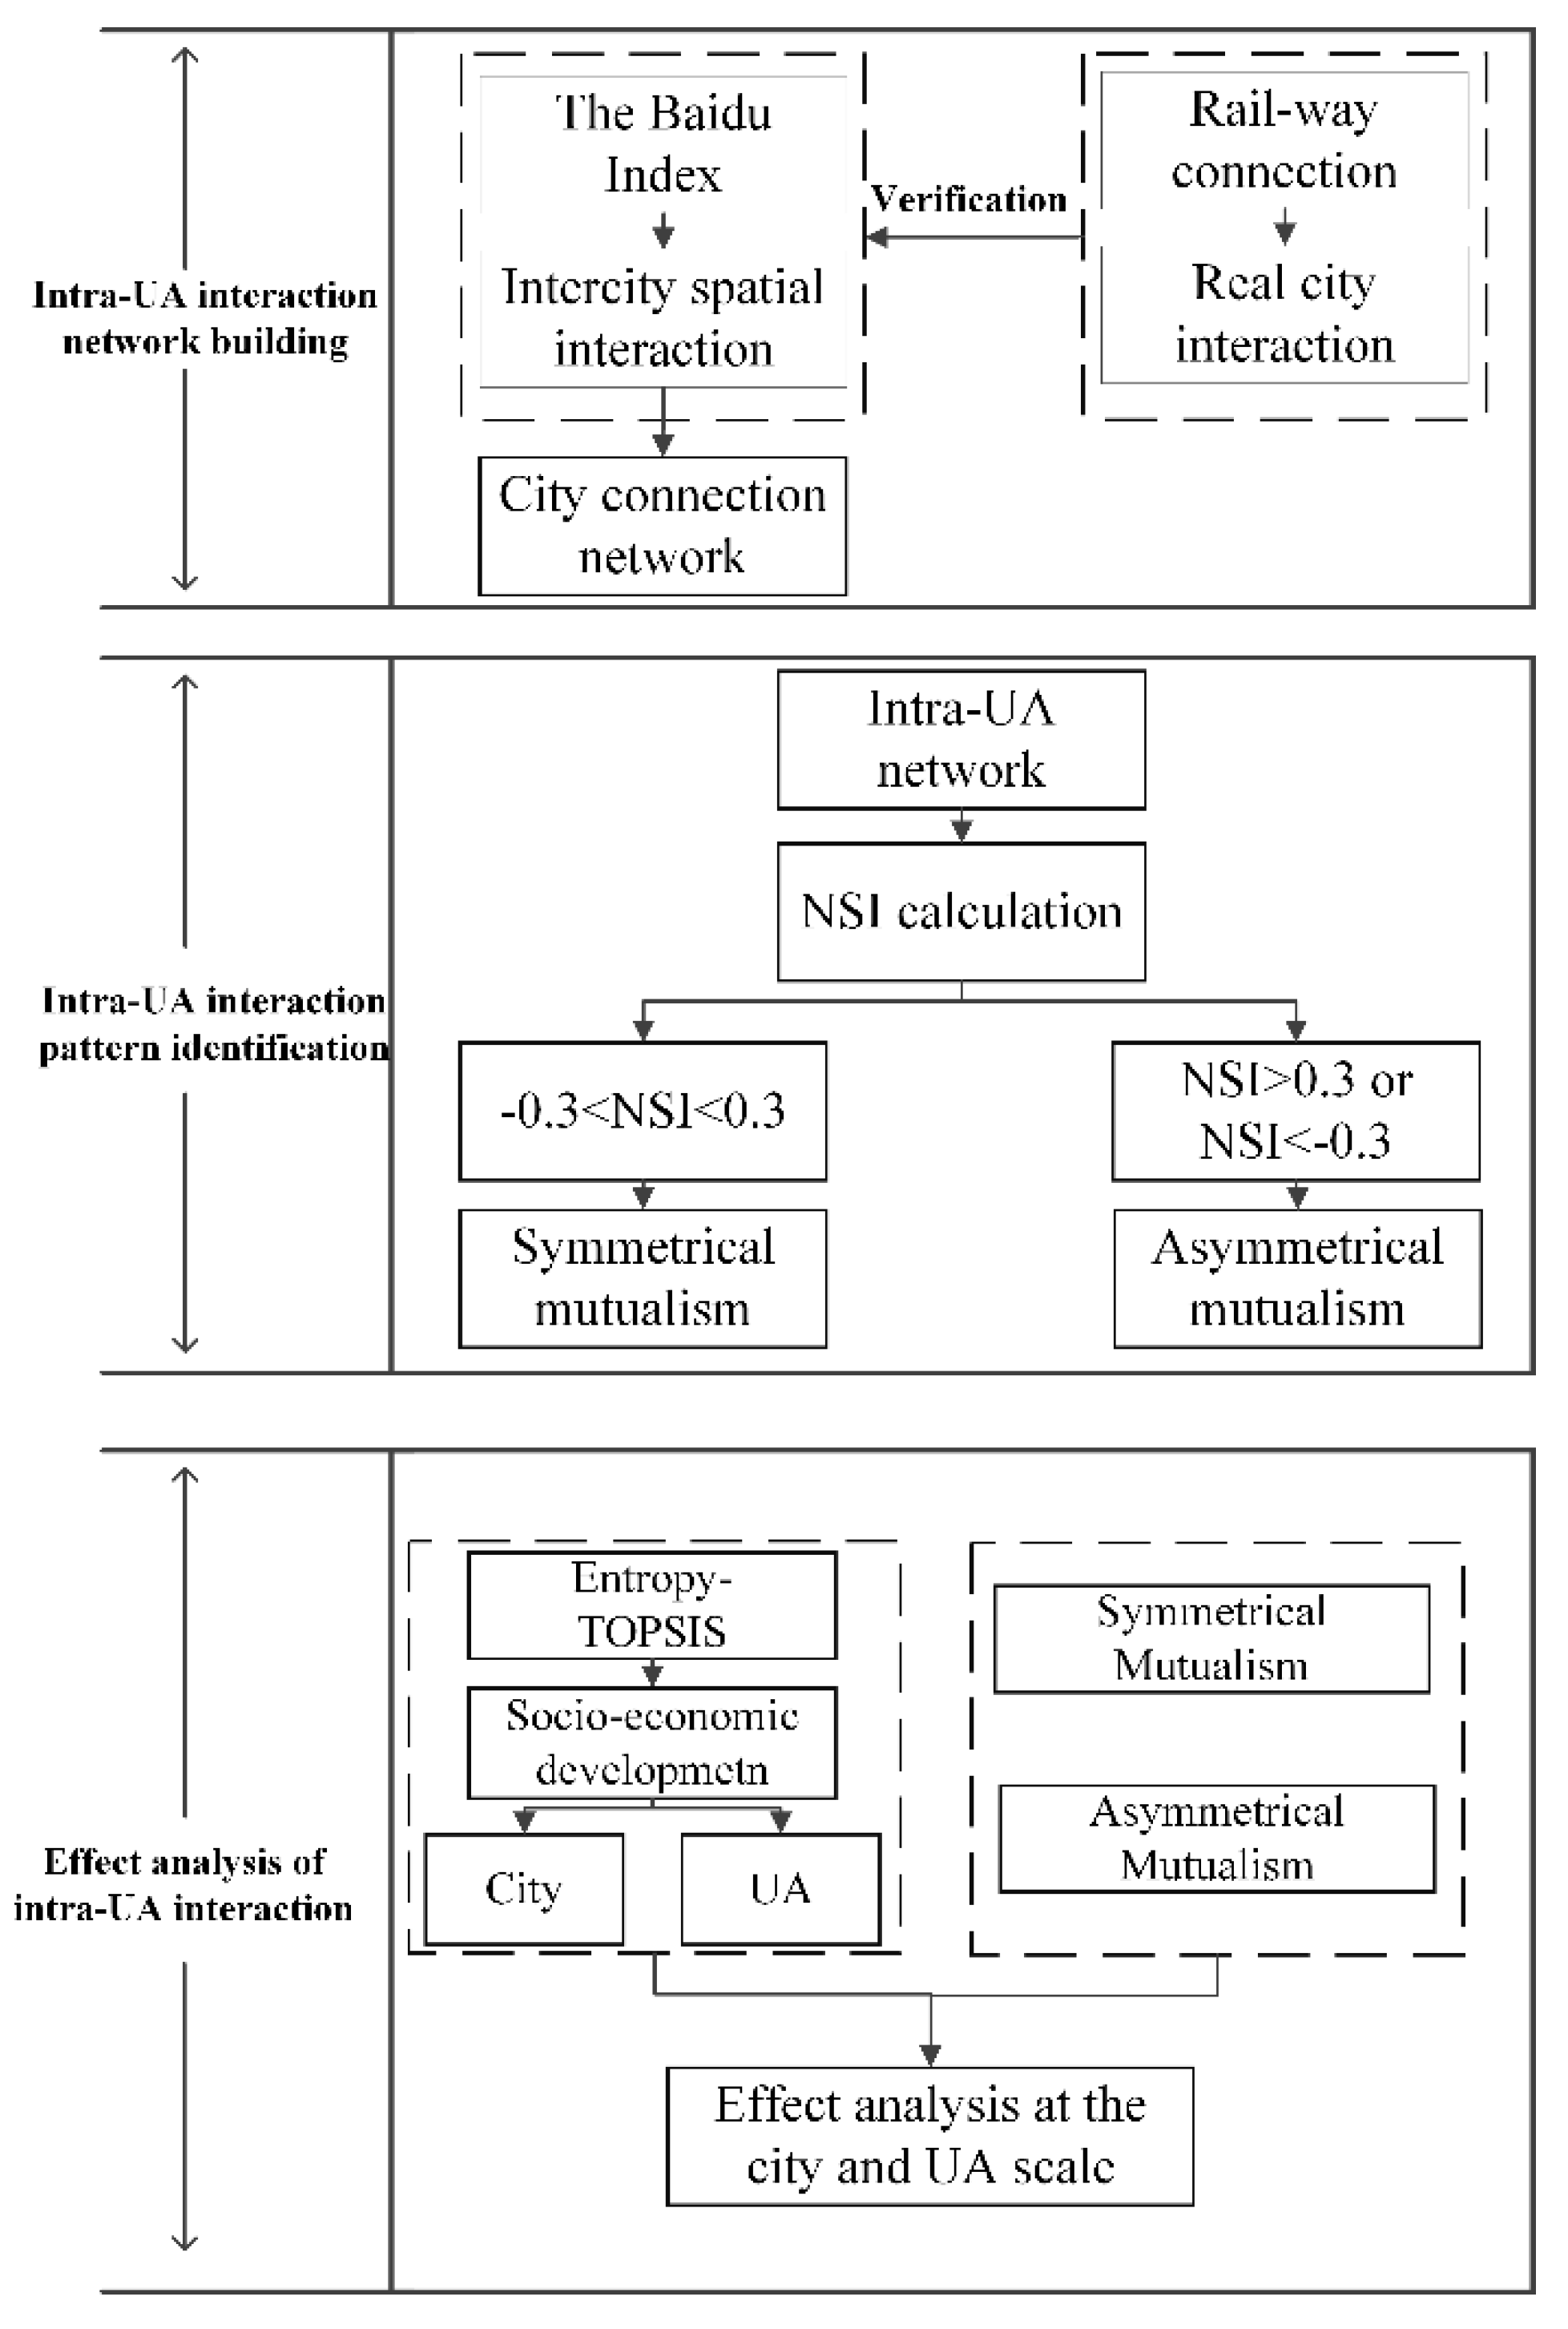
In accordance with the national UAs approved by the state council of China, 11 of the main UAs of mainland China which includes 167 cities were chosen as the study area to analyze and compare their internal symbiotic patterns. The western regions of China are comparatively less developed than the other parts, and the situation of UA is, accordingly, less obvious. Hence, as shown in Figure 1, the chosen agglomerations include regions that are located in the northern, middle, eastern, and southern parts.
BI is from the service of the Baidu Index. The train running information is collected by Python 3.7 from Baidu Map open platform. The social and economic statistical data are from the China Statistical Yearbook.

4. Methodologies

BI indicates potential interaction between two cities. To reduce the deviation of BI in weekdays and weekends, first, the daily BI of two cities is collected on each day of one week. Second, the average value of BI is calculated. Finally, the BI of each pair of cities in a UA is obtained and the intercity connection is estimated. The real connection derived from railway data was referenced as verification. Then, the node symmetry index (NSI) was applied to distinguish symmetrical and asymmetrical mutualism among cities. Finally, the effects of the mutualistic relationships were analyzed. Figure 2 shows the flow chart of the methodologies.

4.1. Identification of Mutualism of Intra-UA

4.1.1. City Connection Matrix Based on the BI

Cities in each UA were set as [ x 1 , x 2 , , x n ] . The interaction between each pair of cities can be estimated by obtaining the BI of every pair of cities.
To verify the estimated intercity connections, with the geographic proximity of cities in a UA taken into consideration, real city connections were built on the railway timetable to verify the recognized city connection based on BI. The railway timetable was collected online. Train numbers, running frequencies, station names, and stopping time of a train at every station were collected. The connection strengths of stations a and b based on a train are defined as
C a b i = t = 1 3 l = 1 5 w t · w l
where t is the time of a train stopping at the station and the respondent weight w t is given by the Delphi method accordingly (Table 1).
Following the running speed, trains in mainland China can be classified into five basic types. The detailed information regarding trains and respondent weights is given in Table 2.
The comprehensive connection of cities a and b is calculated as
C a b = C a b i
A linear regression model between the estimated intercity connection based on the BI and the real connection based on the railway data was developed. The accuracy of estimated city connections based on the BI can be verified by checking the values of R 2 and significance.

4.1.2. Identification of Intra-UA Mutualistic Patterns

Through classification of the connections of the built network into weak, medium, and strong types based on the natural break method, only medium and strong connections were considered, and then the NSI was calculated [40]. The NSI estimates the imbalance of in-degree and out-degree of nodes in a directed network. The basic formula of NSI is:
N S I i j = T i j i n T i j o u t T i j i n + T i j o u t
where T i j i n and T i j o u t denote the inflow and outflow from node j to node i, respectively. The value range of NSI is [−1,1]. When NSI = 0, all the flows between i and j are symmetrical. If it is −1, it indicates that people only flow from city i to city j, and if it is 1, it shows that people only flow from city j to city i. Mutualism can be further classified into symmetrical mutualistic pattern (SMP) and asymmetrical mutualistic pattern (AMP). To describe city mutualism, the NSI value is classified into three types: −1 to −0.3, −0.3 to 0.3, and 0.3 to 1, which represent outward AMP, SMP, and inward AMP, respectively. The SMP and AMP for each city i indexes are calculated as shown in Table 3.
At the UA scale, the proportion of SMP is calculated to show the overall intra-UA interaction pattern. Its formula is as follows.
P r o p o r t i o n m = N m N
where N m is the total number of SMP in a UA, while N is the total number of city relations in the UA.

4.2. Effects of Intercity Mutualism on Cities and UAs

The effects of intercity mutualism on cities and UAs are analyzed based on a comprehensive evaluation of the development of cities and UAs. Referring to previous studies [41,42,43,44], the evaluation system is built as Table 4.
The demographic indicators reflect the city scale and urbanization level from the population. City construction denotes the public infrastructure service ability from the perspective of land use. Economic indicators refer to economic development such as GDP and industrial structure. Social improvement focuses on indicators that correlate with public resource equalization and urban residents’ objective well-being. For example, the proportion of people with endowment and health insurance are included. Related data were collected from the China Statistical Yearbook, the China City Statistical Yearbook, and the city statistical bulletin offered by the city government office and the Internet.
Entropy-TOPSIS method was applied to get the final evaluation. The entropy-TOPSIS method is improved based on the traditional TOPSIS method, including the weight decision based on the information entropy calculation and the comprehensive evaluation based on the TOPSIS method. The information entropy was a physical concept of thermodynamics proposed by Shannon in 1948, which can decide the weights of indicators. Its main thought is that the more uncertain the result is, the more uniform the probability assigned to the result will be [45]. With the advantage of avoiding subjectivity, the entropy method is more reliable compared with subjective methods like the Delphi method and the Analytic Hierarchy Process method. TOPSIS method was first proposed by Hwang and Yoon in 1981. It is a ranking method based on the similarity between a limited number of evaluation objects and an idealized goal, and it evaluates the relative merits of existing objects [46]. TOPSIS method has the advantages of being intuitive and reliable. Moreover, it has no special requirements for the sample data. TOPSIS can focus on reflecting the overall situation, therefore it is suitable for comprehensive evaluation. The steps are as follows: (1) Build the initial decision matrix X = ( x i j ) m × n ,   i = 1 , 2 , , m ,   j = 1 , 2 , , n , where m denotes the cities and n refers to the indicators. (2) For each indicator, standardize the indicator value of cities, x i j = x i j x m a x . (3) Calculate the information entropy: H j = k i = 1 m p i j ln p i j ;   p i j = x i j i = 1 m x i j ; k = 1 ln m . (4) Calculate the weight: w j = 1 H j j = 1 n ( 1 H j ) . Then, the TOPSIS method is applied. (5) Build the weighted matrix R = ( r i j ) m × n ,   r i j = w j × x i j . (6) For each indicator, obtain the optimal and worst value sets S j + = max ( r 1 j ,   r 2 j ,   ,   r n j ) ,   S j = min ( r 1 j ,   r 2 j ,   ,   r n j ) , then calculate the Euclidean distance between the real values of each city and optimal and worst value sets: s e p i + = j = 1 n ( s j + r i j ) 2 ,   s e p i = j = 1 n ( s j r i j ) 2 . (7) Calculate the final comprehensive evaluation: C i = s e p i s e p i + + s e p i . To integrate the local impacts, we conduct the comprehensive evaluation by each UA.
The OLS regression was applied to conduct the effect analysis of the intra-UA interaction. In addition, the effect on the coordinative development of intra-UA cities was also analyzed because coordination is an important goal of UA construction. The coordination among intra-UA cities is calculated by the coupling coordination degree. The coupling coordination estimation refers to the capacity coupling coefficient model in Physics and is commonly utilized to evaluate the coordination between systems. It is an indicator to reflect the extent to which the cities of a UA are correlated and compatible with each other [47]. The quantification of the coupling coordination degree is as follows.
C = n m = 1 n Y m ( m = 1 n Y m ) n n
where C refers to the coupling degree of n cities and Y m is the evaluation for each city. Because C only reflects the interrelation between the cities, the coupling coordination degree D is further applied to reflect whether the interrelation is positive or negative.
D = C × T
T = m = 1 n β m Y m
where T denotes the coupling degree, and β m represents the contribution of each city. By considering the equal significance of cities, β m in this study is set to 1/n. The coupling coordination degree D is a combination of the coupling degree and the coordination degree, which indicate a balanced and benign development situation of cities in a UA.

5. Results and Analyses

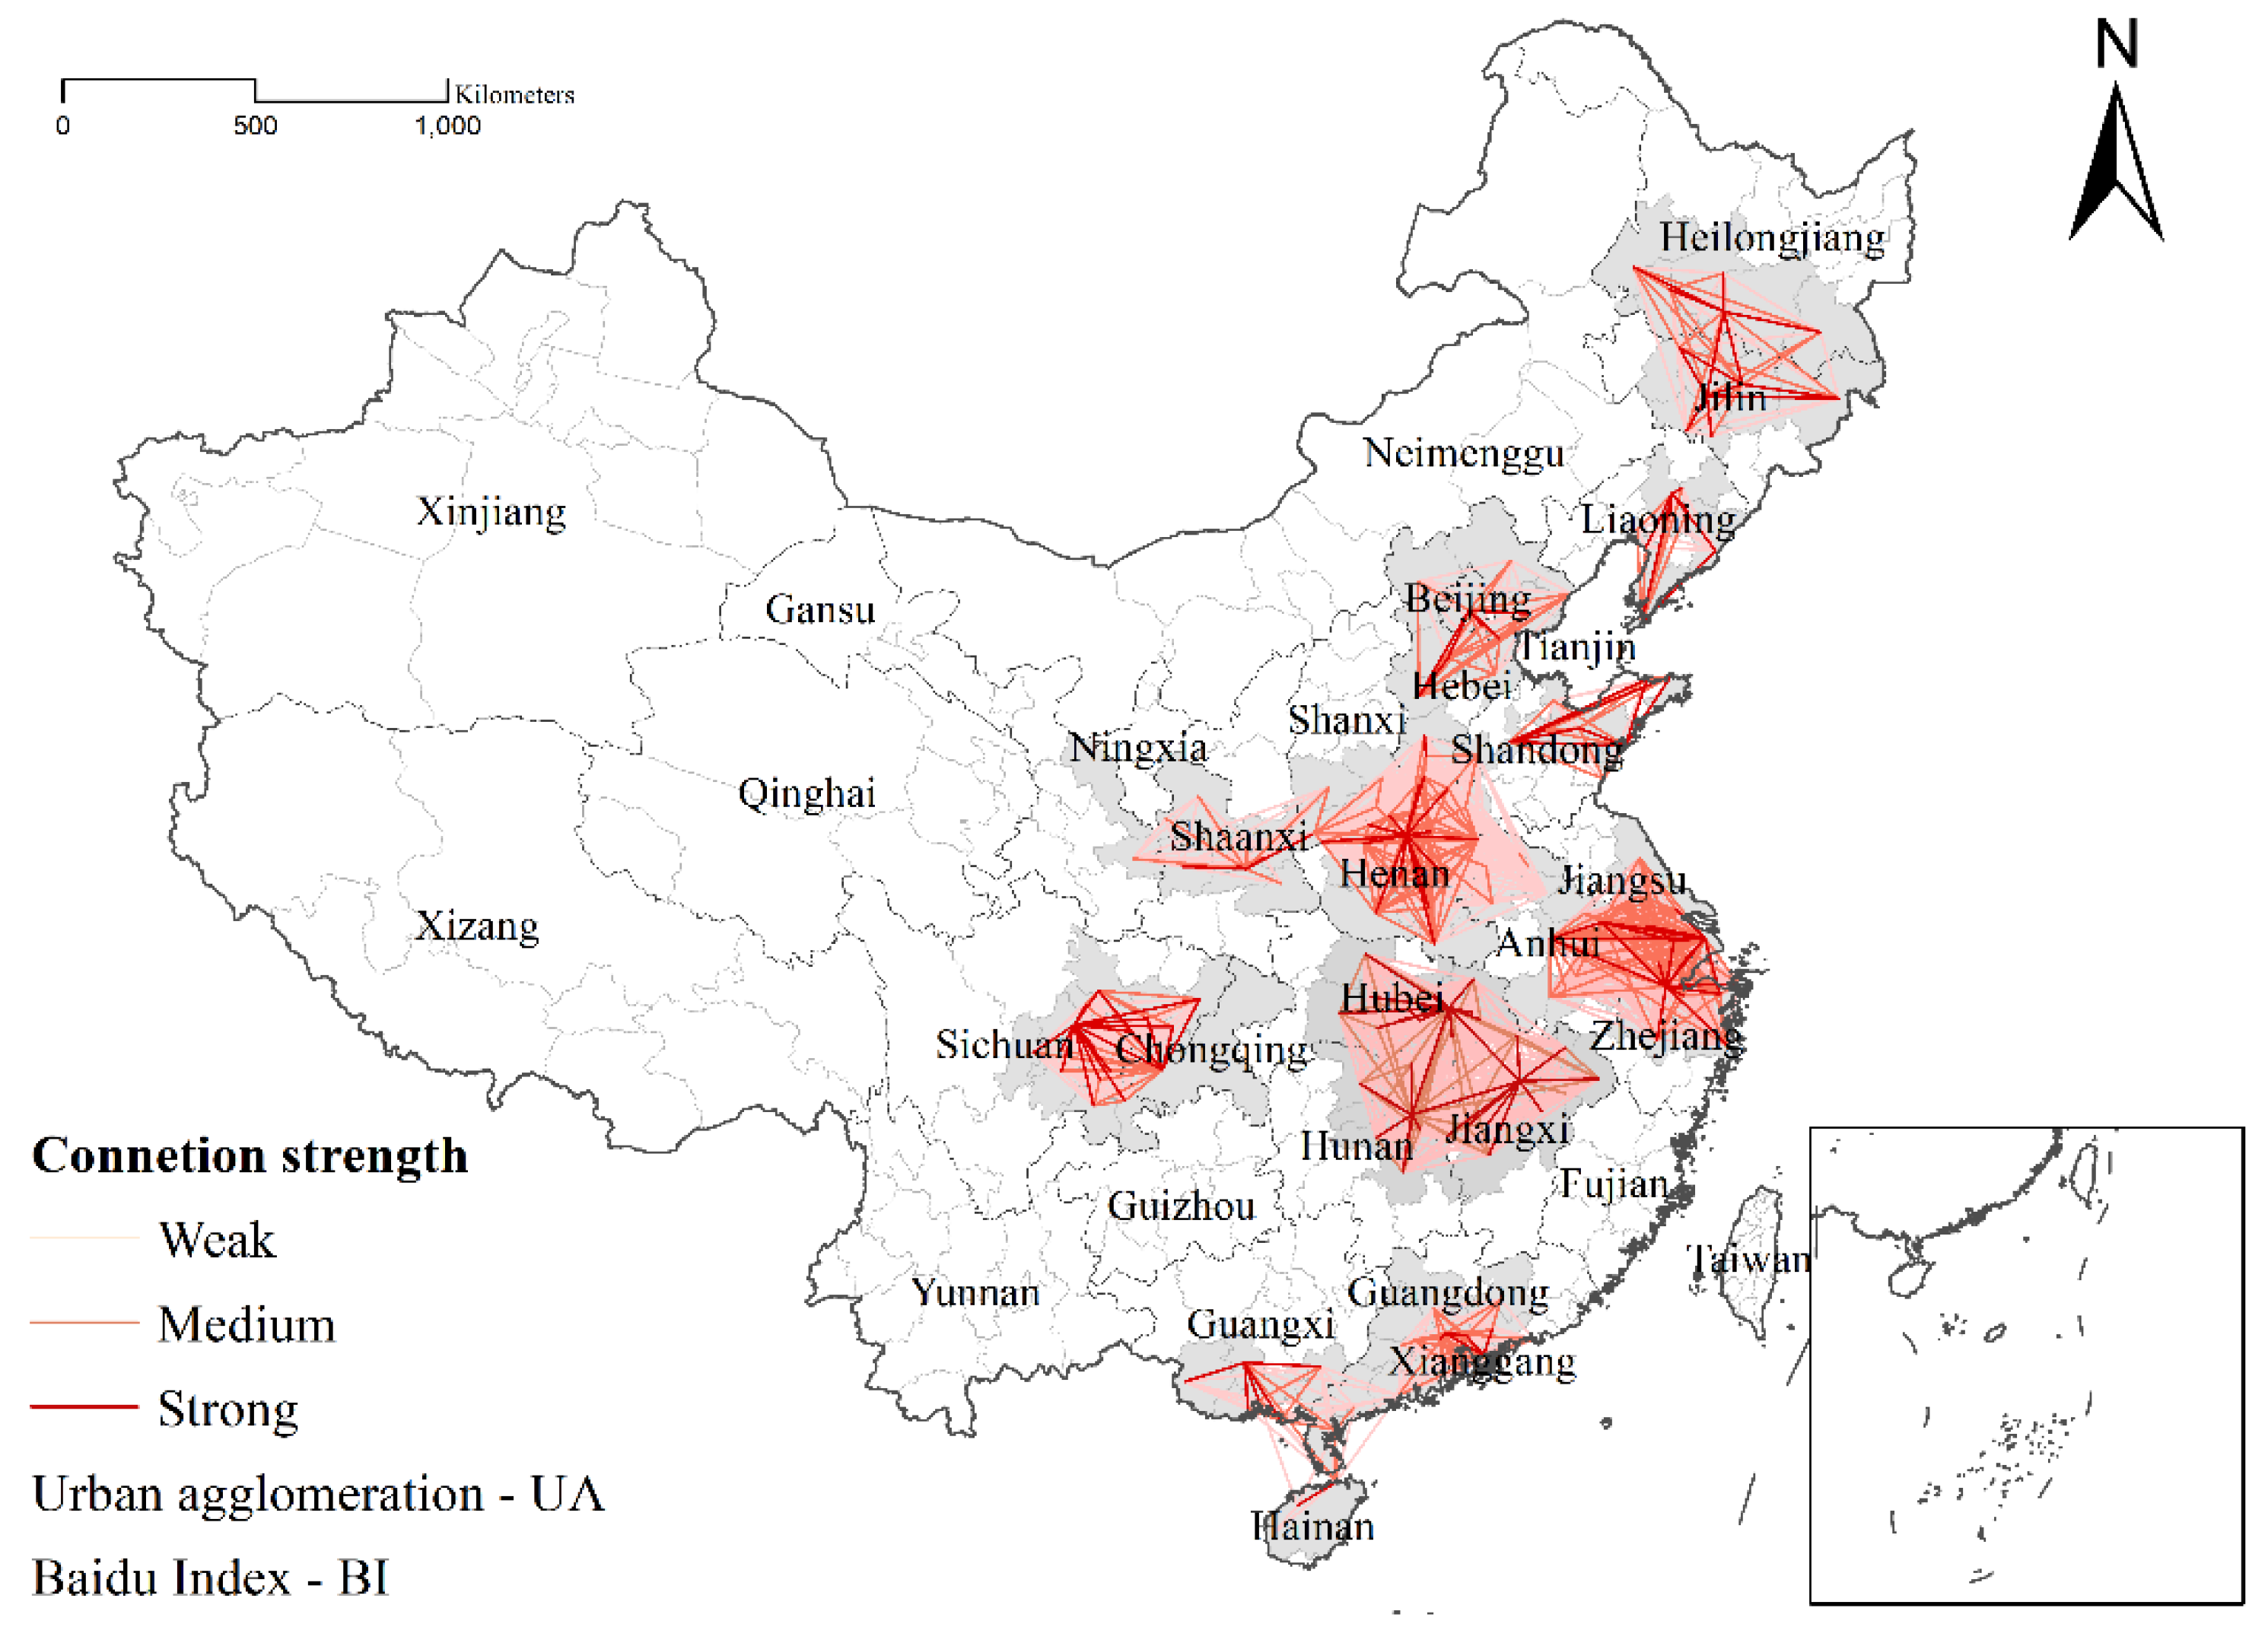
5.1. Interaction Network Based on the BI

With the location set as a component city of the studied UAs and the keyword set as a city map of the other city, the BI of each pair of cities of every UA was extracted as the intercity connections. To verify the accuracy of the estimated connection, the real connection was estimated from the railway data, and linear correlation analysis was conducted between the estimated and the real connections. For all the 11 UAs, the significance values range from 0 to 0.08; the average value of R 2 is 0.72, which indicates the good performance of the intercity connection estimation based on the BI. Then, the interaction networks of 11 UAs were built. Considering all city connection values, the three types were classified by the natural break method into weak, medium, and strong connections (Figure 3).

5.2. Internal Mutualistic Pattern of the 11 UAs

SMP and AMP were identified in every UA by extracting medium and strong connections from the original network. SMP refers to an equal and reciprocal relationship between two cities. For the AMP index, a positive value denotes an input of resources, while a negative value represents an output of resources. The symbiotic characteristics of the 11 UAs are shown in Table 5.
From the analysis results, UAs of the Jingjinji, Yangtze River Delta, and Pearl River Delta occupy the highest proportion of symmetrical mutualistic relation. This finding indicates that most cities of these three UAs share mutual and strong interactions, which means that frequent and reciprocal movement of varied resources occurs based on the people, material, and information flows. The situation of inflow and outflow of every city can also be analyzed through the symbiotic analysis.
An interesting detail is that the city that holds the highest inward AMP index is not most socio-economically developed in the UA. For example, in the Jingjinji UA, Chengde holds the highest value, and not Beijing or Tianjin. Beijing is the capital city of China, and its GDP in 2018 was 446.6 billion U.S. dollars. Tianjin is a municipality that comes directly under the central government, and its GDP in 2018 was 279.9 billion U.S. dollars. Chengde is a prefecture-level city that belongs to Hebei Province, and its GDP in 2018 was 21.83 billion U.S. dollars. It is the same in other UAs such as the Yangtze River Delta region and the Pearl River Delta region, where the cities that hold the highest value are Zhoushan and Yangjiang, but not Shanghai and Shenzhen, which are the two most developed cities in China. This result occurred because, in these UAs, these developed cities mostly share SMP with other cities, and the socio-economic benefits they gain from the equalized interactions are greater than what they obtain from an unequal interaction. This finding also indicates that symmetrical mutualism has greater positive effects on city development.
Given this interesting finding, we wanted to demonstrate whether asymmetrical or symmetrical mutualism is more important for cities’ social and economic development. This issue will be analyzed in the next section.

5.3. Effect Analysis of the Intra-UA Mutualism

To examine the impacts of the intra-UA mutualism on the socio-economic development of cities and UAs, first, the comprehensive development of each city and each UA were estimated by the entropy-TOPSIS method. Considering local impacts, the evaluation was conducted by each UA. Table 6 lists the weights of the indicators in each of the UA evaluation model.
Then, the socio-economic development level of all the 167 cities of the 11 studied UAs were estimated. The top five cities are Shanghai (4.767), Beijing (4.672), Guangzhou (4.424), Shenzhen (3.903), and Tianjin (3.853). The last five cities include Tianmen (0.264), Qianjiang (0.268), Dongfang (0.391), Xiangyang (0.434), and Dongfang (0.443). Similarly, the development levels of the 11 selected UAs were also estimated by the entropy-TOPSIS method. Yangtze River Delta (39.618), Pearl River Delta (32.250), and Yangtze River Valley (28.761) are the top three UAs, while Mid-Southern Liaoning (9.410), Beibu Gulf (10.925), and Guanzhong Plain (10.956) are estimated as the last three UAs.
(1) Effects of intra-UA interaction at the city scale
At the city scale, some studies on city networks proved that a high in-degree city node has a positive effect on the city’s development [48,49,50]. However, the inflow of a city can occur in both an equal connection or an unbalanced connection. To explore the different effects, the SMP and AMP indexes of each city are calculated by using the formulas mentioned in Section 4.1.2. The SMP   index is positive. The AMP index could be positive or negative. A negative value means that outflow from city i occurs, and a positive value represents that inflow to city i occurs. Table 7 shows the results of the OLS regression at the city scale.
From the results, both the SMP and AMP show positive effects. This finding is observed because the inflow of people, goods, and information exist in both SMP and AMP, and cities can take good advantage of such relations. However, a greater significance is found in the regression between SMP and city development, indicating a mutually symbiotic relationship among cities, which positively promotes the socio-economic development of cities. Coexistence and co-prosperity of cities is a “multi-win” outcome that is driven by the development of a symmetrical mutualistic relation [51], because all the participant cities can gain benefits from mutual interactions, thereby promoting the coordinated development of the cities. Therefore, based on the premise of limited resources, even an unbalanced relation can bring a city more resources; however, a balanced and mutual relation can lead to a lasting and beneficial situation and therefore promote its socio-economic development.
(2) Effects of intra-UA interaction at the UA scale
At the UA scale, to analyze the effects of the intra-UA interactions, indicators that reflect the characteristics of the connection network were calculated. Two types of indicators were included. One denotes the size features of the UA, which contains the number of nodes (cities), number of connections, and connection density. The other one indicates the symbiosis, including SMP and AMP indexes. Then, the OLS regression analysis was conducted. Table 8 shows the regression results.
The results show that both the numbers of cities and connections are related with the UA socio-economic development and intra-UA coupling coordination, which indicates that the UA size has a positive effect. In addition, the impact of connection density is insignificant. Since the interactions among cities are directed and the interaction strength varies, the connection density cannot well reflect the interaction pattern. The results also show that both SMP and AMP have positive effects on the regional socio-economic development level. Mutualism indicates the existence of people mobility, information diffusion, and product exchange, which promote the development of the region and propel the average development of the sub-cities. However, only SMP shows a positive effect on the coupling coordination of cities in UA, whereas AMP shows no significant impact. SMP denotes not only mutual but also equal interactions among cities, based on which people, material, and information capital flow actively and evenly, thus promoting the equalized allocation of various resources. As a result, SMP brings positive effects on the coordinated development inside the UA.

6. Discussion

With the social and economic development of UAs, the intercity connection experiences change simultaneously. The intra-UA pattern not only affects every single city’s development but also decides the competition ability of the region and even the country in globalization. Hence, quantifying, analyzing, and monitoring the intra-UA interaction pattern is important. Besides, mutualism refers to a reciprocal relationship among cities, which is beneficial for regional coordinated development. Therefore, the mutualistic pattern of intra-UA analysis is significantly important.

6.1. Understanding the Symbiotic System of UA

By verifying the two proposed hypotheses, this study proved that mutualism affects the development of UA at both the regional and city scales. Symmetrical mutualism was proven to be positively related to the city’s socio-economic development and regional coordinated development.
In a symbiotic UA system, the component cities are the symbiotic units. Multiple connection channels such as the railway, public road, and communication system form a symbiotic interface, which enables interactions among cities. Together, natural, social, economic, political, and cultural elements build a symbiotic environment. Cities of a UA share a similar symbiotic environment because of their geographical proximity. Given the spatial structure of a UA, mutualistic interrelations exist commonly. Therefore, mutualism is the symbiotic pattern that is the topic of focus in this study. Mutualism is classified into symmetrical and asymmetrical patterns, and their impacts are studied to analyze the inherent difference of the interrelations.
Based on the analysis results, at the city scale, both symmetrical and asymmetrical mutualism bring positive effects on the city’s development; however, considering regional development, symmetrical mutualism is more helpful for promoting regional coordinated development. Following the trend of regional polycentric development under the background of globalization [52], symmetrical mutualism encourages mutual interactions of various elements, promotes the allocation of resources, and enables coordinated development inside the region. Hence, symmetrical mutualism is believed to be the ideal situation for regional development [53,54].
To apply the symbiotic theory in studying intra-UA interaction patterns, an intercity interaction network needs to be built first. Real flow data such as people migration flow, transportation, infrastructure, and SNS data can be applied to build the network. This study utilized the BI to simulate the intercity connection; in other cases, Google Trends can be used similarly. Data that reflect real people, material, and information flows can be used to verify the estimated intercity connection. In this study, we utilized the railway data; in other cases, data such as airplane flows and SNS connections could be referenced. Then, the symbiotic theory can be applied to identify the mutualistic patterns of intra-UA. The NSI is mainly referenced in this study. Other social network indicators such as node degree can also be utilized to reflect the symmetry of intercity connections. Further analysis like effects, impacts, and driving forces can be conducted based on the symbiotic analysis results, which offers implications for the city and regional management and planning.

6.2. Mutualistic Development of Intra-UA

Mutualism can be implemented by the development of symbiotic units, strengthening of the symbiotic interface, and integration of the symbiotic environment. In a UA, the construction of cities can be promoted by people attraction through population policy, economic development through industrial progress, and social improvement through a social security system. The symbiotic interface can be strengthened through the construction of a high-way road and a railway structure.
In China, component cities that form UA usually have a comparatively better development level than other cities and have good traffic accessibility with one other. Therefore, other ways can be used to promote intra-regional mutualism. Taking the Yangtze River Delta region for example, this region has an interesting online shopping rule called “free-shipping of Jiang-Zhe-Hu”. This rule means that the shipping fee for goods shipped between places within Jiangsu, Zhejiang, and Shanghai is free irrespective of the price of the goods. Such a strategy promotes the rapid development of e-commerce in this region and leads to considerable economic profits. Similarly, policies and strategies that enable the interaction of people flow and socioeconomic capital can be introduced to promote equalized mutualistic connections of intra-UA. For people flow, a people registration system (“hukou” system) can be adjusted to relocating and resettling easier for people. The regional labor market can implement respondent rules to encourage the mobility of talented people within the region. Preferential policies can be applied to promote the development of the chain industry across cities.
Some critical views suggest that the polycentric form of an urban system possibly leads to unequal regional development [55,56]. Hence, several points need to be given attention when promoting regional mutualism. Firstly, the development base needs to be considered when choosing strategies to promote mutualism. The implementation of “free-shipping of Jiang-Zhe-Hu” is based on the well-developed traffic conditions of this region. Secondly, the promotion of interaction of intra-UA does not mean that it neglects external interaction with other regions. According to the “new type urbanization” strategy of China, UA is the main body of the current urbanization of China, which is an important force for promoting regional development and urban-rural integration [57]. Therefore, UA can be treated as the growth pole at regional and national scales. Promoting the development of UA can lead to large-scale regional development.

6.3. Implications on the Planning and Management of UA

Sustainable development is the common goal of UA development worldwide, which indicates the internal integration and external competitiveness of UA. Factors that contribute to achieving the goal can be concluded as direct and implicit factors. Direct factors include an environment with abundant resources, a well-connected transportation and communication network, and supported government policies that offer an objective environment for the development of UA and enable the flows of varied elements among cities. Implicit factor is the intercity interaction, which is formed based on the direct factors and benefit a city externally and internally, thereby encouraging people, information, and material flows to move among cities, such interactions promote exchange and optimization of resources and thus, bringing benefits for the city’s comprehensive development and finally strengthen the UA’s competitiveness. According to the “Key tasks of new urbanization construction in 2019” proposed by The National Development and Reform Commission of China, the three basic development strategies on UA construction are as follows: (1) enhance the leading power of central cities of UA, increase the driving force of central cities, and provide an important impetus of central cities for high-quality development; (2) explore the establishment of a coordinated promotion mechanism for the development of UA led by central cities; and (3) accelerate the integrated planning and construction of well-connected transportation infrastructure. The statements emphasize the importance of intercity interaction and functional complementation. In this case, coordination does not mean that every single city develops at a same pace. Rather, it indicates a symbiosis in which all cities obtain benefits from the coordinated relationships.
This study demonstrates the ability of symbiotic analysis to identify the intra-UA interaction and respondent effects on the city and regional development. In summary, the implications of intra-UA interaction analysis on urban and regional planning can be concluded as follows:
(1) Estimate the integration level of UA
Studying the intercity connection pattern of different UAs is helpful to estimate the integration level of UAs. Domestically, by analyzing the intra-UA connection, cities that are isolated from the connection network can be recognized, and respondent solutions can be proposed like improving public road construction or airport building. Internationally, the analysis results can offer suggestions for UAs that aim to be world-class. For example, the Yangtze River Delta UA is internationally recognized as one of the six major world-class urban agglomerations; however, from the point of the global dimension, there still exist obvious disparities compared with other world-class UA. The intercity connection is an important dimension of UA development; therefore, it is necessary to estimate, analyze, and compare the integration level of UA to enhance the development quality and international competitiveness.
(2) Provide implications for regional sustainable development
Coordinative development among cities is an important indicator of regional sustainability [58]. Specifically, uncoordinated development among cities is correlated with issues such as widening the gap between the rich and the poor, increasing social conflict and resulting in public resource inequality. Symbiosis has been proven to have a positive effect on both cities’ socioeconomic development and the coordinative level of cities’ development level. Analyzing the intra-UA interaction pattern ensures that cities that fail to develop a symbiotic relationship with other cities can be identified and measures can be targeted. Under the framework of symbiotic theory, applications from several aspects can be taken. Firstly, a symbiotic unit can be strengthened by improving the socio-economic development of the cities through regional policy support and industry restructuring. Secondly, the symbiotic interface can be constructed by increasing the connectivity of these cities, such as through the construction of a high-speed railway system. Thirdly, the coordinative policy environment is important to improve the symbiotic environment. Take the Yangtze River Delta UA, for example. In December 2019, “The outline of the plan for the integrated development of the Yangtze River Delta” was proposed by the central government of China as the guideline for the development of this area, and integration was the primary thought in the construction of innovative industries, environmental protection, and public services. The plan pointed out that the ultimate goal is to “build a harmonious and symbiotic region”. In summary, intra-UA symbiotic analysis can offer advice and suggestions for implementing regional sustainable development.

6.4. Priority for Future Studies

The study has two main limitations. Firstly, this paper focuses only on the impacts of intra-regional symbiosis on UA itself. However, UA usually covers a large area. The effects of the internal symbiosis of UA on its hinterland need to be analyzed in future studies. Secondly, this paper analyzes only the symbiotic relationship among cities. Competition and symbiosis exist simultaneously and have different impacts on the region. In subsequent studies, a competitive pattern among cities of a UA can be quantified, analyzed, and then combined with an analysis of the internal symbiosis of the region.

7. Conclusions

By proposing two hypotheses and setting the 11 main UAs of mainland China as the study areas, this paper verified that the mutualistic pattern of intra-UA has impacts on the cities’ socioeconomic development and regional coordinated development. Specifically, the symbiotic relationships of intra-UA were classified into symmetrical and asymmetrical mutualistic relationships. The results showed that heterogeneity exists in the symmetrical mutualism and asymmetrical mutualism of intra-UAs. Jinjingji UA was identified to have the highest symmetrical mutualism, and the Central Plain UA has the highest asymmetrical mutualism. The OLS regression results verified the effects of the symbiotic relationship on the cities’ socio-economic development and intra-UA coordinative development level. At the city level, symmetrical mutualism was proven to have a greater positive effect than asymmetrical mutualism on the city’s socio-economic development. At the regional scale, the symmetrical mutualism of intra-UA was verified to positively affect the regional socio-economic development and coordinated development level. By verifying the significance of intra-UA symbiosis with cities’ development and regional coordinated development, this study concluded that intra-UA symbiotic analysis helps estimate the integration level of UA, monitor the state of UA development, and provide implications for regional sustainable development.
This study proposed a method to quantify the mutualistic pattern of intra-UA and identify the different mutualistic patterns in the region. In addition, this study analyzed the effects of mutualistic patterns on the socio-economic development of UA at both the regional and city scales. Finally, by decomposing the symbiotic system, suggestions and implications were offered from aspects of people, social and economic interactions to promote the implementation of intra-UA mutualism. This study contributes to the understanding of the internal interaction of UAs and offers a new perspective for the development and planning of UAs.

Funding

This research was funded by the “National Natural Science Foundation of China, grant number 41901203” and the “China Postdoctoral Science Foundation, grant number 2019M661919”.

Conflicts of Interest

The author declares no conflict of interest.

References

  1. Ye, C.; Zhu, J.; Li, S.; Yang, S.; Chen, M. Assessment and analysis of regional economic collaborative development within an urban agglomeration: Yangtze River Delta as a case study. Habitat Int. 2019, 83, 20–29. [Google Scholar] [CrossRef]
  2. Xia, C.; Zhang, A.; Wang, H.; Zhang, B.; Zhang, Y. Bidirectional urban flows in rapidly urbanizing metropolitan areas and their macro and micro impacts on urban growth: A case study of the Yangtze River middle reaches megalopolis, China. Land Use Policy 2019, 82, 158–168. [Google Scholar] [CrossRef]
  3. Lin, J.; Wu, Z.; Li, X. Measuring inter-city connectivity in an urban agglomeration based on multi-source data. Int. J. Geogr. Inf. Sci. 2019, 33, 1062–1081. [Google Scholar] [CrossRef]
  4. Tripathi, S. Relationship between Infrastructure and Population Agglomeration in Urban India: An Empirical Assessment. Available online: https://www.adb.org/publications/relationshipbetween-infrastructure-population-agglomeration-india (accessed on 28 September 2020).
  5. Zeng, C.; Song, Y.; Cai, D.; Hu, P.; Cui, H.; Yang, J.; Zhang, H. Exploration on the spatial spillover effect of infrastructure network on urbanization: A case study in Wuhan urban agglomeration. Sustain. Cities Soc. 2019, 47, 101476. [Google Scholar] [CrossRef]
  6. Zong, J.; Lin, Z.; Guo, M.; Zhou, L. Urban agglomeration and job search behavior: Evidence from China. J. Asia Pac. Econ. 2020, 25, 307–325. [Google Scholar] [CrossRef]
  7. Zheng, S.; Du, R. How does urban agglomeration integration promote entrepreneurship in China? Evidence from regional human capital spillovers and market integration. Cities 2020, 97, 102529. [Google Scholar] [CrossRef]
  8. Weiwei, C.; Fei, Y.; Yuxian, G.; Zhenjing, P. Economic Network Structure of Urban Agglomeration in Chengdu-Chongqing Economic Zone. Technol. Econ. 2016, 35, 52–57+128. [Google Scholar]
  9. Arribas-Bel, D.; Kourtit, K.; Nijkamp, P.; Steenbruggen, J. Cyber cities: Social media as a tool for understanding cities. Appl. Spat. Anal. Policy 2015, 8, 231–247. [Google Scholar] [CrossRef]
  10. Han, J.; Liu, J. Urban Spatial Interaction Analysis Using Inter-City Transport Big Data: A Case Study of the Yangtze River Delta Urban Agglomeration of China. Sustainability 2018, 10, 4459. [Google Scholar] [CrossRef] [Green Version]
  11. Zhen, F.; Cao, Y.; Qin, X.; Wang, B. Delineation of an urban agglomeration boundary based on Sina Weibo microblog ‘check-in’data: A case study of the Yangtze River Delta. Cities 2017, 60, 180–191. [Google Scholar] [CrossRef]
  12. Zhang, L.; Du, H.; Zhao, Y.; Wu, R.; Zhang, X. Urban networks among Chinese cities along” the Belt and Road”: A case of web search activity in cyberspace. PLoS ONE 2017, 12, e0188868. [Google Scholar] [CrossRef] [PubMed] [Green Version]
  13. Wang, Q.; Zhao, M. Research on the city network of Guangdong, Hongkong and Macao from the perspective of information flow: Analysis based on baidu index. J. Reg. City Plan. 2018, 29, 281–293. [Google Scholar] [CrossRef] [Green Version]
  14. Paracer, S.; Ahmadjian, V. Symbiosis: An Introduction to Biological Associations; Oxford University Press: Oxford, UK, 2000. [Google Scholar]
  15. Jensen, P.D.; Basson, L.; Hellawell, E.E.; Leach, M. ‘Habitat’suitability index mapping for industrial symbiosis planning. J. Ind. Ecol. 2012, 16, 38–50. [Google Scholar] [CrossRef] [Green Version]
  16. Díez-Pisonero, R. Airports and cities in the context of globalisation: A multidimensional symbiosis in Adolfo Suárez-Madrid Barajas Airport. Geogr. J. 2019, 185, 485–497. [Google Scholar] [CrossRef]
  17. Wang, Y.; Li, P.; Zhu, Z.; Liu, Z. The evaluation of eco-efficiency of the industrial coupling symbiosis network of the eco-industrial park in oil and gas resource cities. Energy Sci. Eng. 2019, 7, 899–911. [Google Scholar] [CrossRef] [Green Version]
  18. Lu, C.; Wang, S.; Wang, K.; Gao, Y.; Zhang, R. Uncovering the benefits of integrating industrial symbiosis and urban symbiosis targeting a resource-dependent city: A case study of Yongcheng, China. J. Clean. Prod. 2020, 255, 120210. [Google Scholar] [CrossRef]
  19. Howard, E. Garden Cities of to-Morrow; Routledge: London, UK, 2013. [Google Scholar]
  20. Geddes, P. Cities in Evolution: An Introduction to the Town Planning Movement and to the Study of Civics; Williams: London, UK, 1915. [Google Scholar]
  21. Gottmann, J. Megalopolis or the urbanization of the northeastern seaboard. Econ. Geogr. 1957, 33, 189–200. [Google Scholar] [CrossRef]
  22. Yao, C. Research on the Coordinated Development of Chinese Urban Agglomeration in the New Era from the Perspective of Polycentric Spatial Structure; Jilin University: Jilin, China, 2019. [Google Scholar]
  23. Fang, C.; Song, J.; Zhang, Q.; Li, M. The formation, development and spatial heterogeneity patterns for the structures system of urban agglomerations in China. Acta Geogr. Sin. 2005, 60, 827. [Google Scholar]
  24. Yao, S.; Chen, Z.; Zhu, Y. China’s Urban Agglomeration; University of Science and Technology of China Press: Hefei, China, 2006. [Google Scholar]
  25. Liu, S. Some important Issues about urban agglomeration planning and construction in China. Jiangsu Soc. Sci. 2015, 5, 30–38. [Google Scholar]
  26. Bruinsma, F.; Rietveld, P. Urban agglomerations in European infrastructure networks. Urban Stud. 1993, 30, 919–934. [Google Scholar] [CrossRef]
  27. Kabisch, N.; Haase, D. Diversifying European agglomerations: Evidence of urban population trends for the 21st century. Popul. Space Place 2011, 17, 236–253. [Google Scholar] [CrossRef]
  28. Takhteyev, Y.; Gruzd, A.; Wellman, B. Geography of Twitter networks. Soc. Netw. 2012, 34, 73–81. [Google Scholar] [CrossRef]
  29. Kauffmann, A. Is the ‘Central German Metropolitan Region’spatially integrated? An empirical assessment of commuting relations. Urban Stud. 2015. [Google Scholar] [CrossRef]
  30. Cao, S.; Hu, D.; Hu, Z.; Zhao, W.; Chen, S.; Yu, C. Comparison of spatial structures of urban agglomerations between the Beijing-Tianjin-Hebei and Boswash based on the subpixel-level impervious surface coverage product. J. Geogr. Sci. 2018, 28, 306–322. [Google Scholar] [CrossRef] [Green Version]
  31. Yu, B.; Shu, S.; Liu, H.; Song, W.; Wu, J.; Wang, L.; Chen, Z. Object-based spatial cluster analysis of urban landscape pattern using nighttime light satellite images: A case study of China. Int. J. Geogr. Inf. Sci. 2014, 28, 2328–2355. [Google Scholar] [CrossRef]
  32. Ramachandra, T.; Aithal, B.H.; Sowmyashree, M. Urban structure in Kolkata: Metrics and modelling through geo-informatics. Appl. Geomat. 2014, 6, 229–244. [Google Scholar] [CrossRef]
  33. Huang, X.; Zhang, L.; Ding, Y. The Baidu Index: Uses in predicting tourism flows—A case study of the forbidden city. Tour. Manag. 2017, 58, 301–306. [Google Scholar] [CrossRef]
  34. Li, S.; Chen, T.; Wang, L.; Ming, C. Effective tourist volume forecasting supported by PCA and improved BPNN using Baidu index. Tour. Manag. 2018, 68, 116–126. [Google Scholar] [CrossRef]
  35. Pei, Z.; Xiao, X. Urban spatial structure of hunan province from the perspective of space flow—Based on tencent location big data and baidu index analysis. Chin. Overseas Archit. 2018, 10, 80–84. [Google Scholar]
  36. Qu, L.; Hao, Y. Research on planing urban and rural areas as a whole based on symbiosis theory. Res. Agric. Mod. 2004, 5, 371–374. [Google Scholar]
  37. Zhu, J. Regional cooperation research based on symbiosis theory—A case study of Wuhan urban agglomeration. J. Huazhong Univ. Sci. Technol. (Soc. Sci. Ed.) 2010, 24, 92–97. [Google Scholar]
  38. Vukonic, B. Religion, tourism and economics: A convenient symbiosis. Tour. Recreat. Res. 2002, 27, 59–64. [Google Scholar] [CrossRef]
  39. Lee, S.; Song, D.; Ducruet, C. A tale of Asia’s world ports: The spatial evolution in global hub port cities. Geoforum 2008, 39, 372–385. [Google Scholar] [CrossRef] [Green Version]
  40. Limtanakool, N.; Dijst, M.; Schwanen, T. A theoretical framework and methodology for characterising national urban systems on the basis of flows of people: Empirical evidence for France and Germany. Urban Stud. 2007, 44, 2123–2145. [Google Scholar] [CrossRef]
  41. Jia, S.; Wang, C.; Li, Y.; Zhang, F.; Liu, W. The urbanization efficiency in Chengdu City: An estimation based on a three-stage DEA model. Phys. Chem. Earth Parts A/B/C 2017, 101, 59–69. [Google Scholar] [CrossRef]
  42. Trukhachev, V.I.; Kostyukova, E.I.; Gromov, E.I.; Gerasimov, A. Comprehensive socio-ecological and economic assessment of the status and development of Southern Russia agricultural regions. Life Sci. J. 2014, 11, 478–482. [Google Scholar]
  43. Bowen, R.E.; Riley, C. Socio-economic indicators and integrated coastal management. Ocean Coast. Manag. 2003, 46, 299–312. [Google Scholar] [CrossRef]
  44. Girard, L.F.; Cerreta, M.; De Toro, P. Towards a local comprehensive productive development strategy: A methodological proposal for the metropolitan city of Naples. Qual. Innov. Prosper. 2017, 21, 223–240. [Google Scholar] [CrossRef] [Green Version]
  45. Jha, R.; Singh, V.P. Evaluation of riverwater quality by entropy. Ksce J. Civ. Eng. 2008, 12, 61–69. [Google Scholar] [CrossRef]
  46. Tzeng, G.-H.; Huang, J.-J. Multiple Attribute Decision Making: Methods and Applications; CRC Press: Boca Raton, FL, USA, 2011. [Google Scholar]
  47. Liu, W.; Jiao, F.; Ren, L.; Xu, X.; Wang, J.; Wang, X. Coupling coordination relationship between urbanization and atmospheric environment security in Jinan City. J. Clean. Prod. 2018, 204, 1–11. [Google Scholar] [CrossRef]
  48. Linneker, B.; Spence, N. Road transport infrastructure and regional economic development: The regional development effects of the M25 London orbital motorway. J. Transp. Geogr. 1996, 4, 77–92. [Google Scholar] [CrossRef]
  49. Perloff Harvey, S.; Dunn, E.S., Jr.; Lampard, E.E.; Keith, R.F. Regions, Resources, and Economic Growth; University of Nebraska Press: Lincoln, NE, USA, 1960. [Google Scholar]
  50. Derudder, B.; Taylor, P.J.; Hoyler, M.; Ni, P.; Liu, X.; Zhao, M.; Shen, W.; Witlox, F. Measurement and interpretation of connectivity of Chinese cities in world city network, 2010. Chin. Geogr. Sci. 2013, 23, 261–273. [Google Scholar] [CrossRef] [Green Version]
  51. Mu, H.; Yao, L.; Zhang, W.; Ban, Q.; Lei, Z. Research on symbiotic spatial structure of scenic spots based on the original authenticity construction—Take three gorges as an example. In Tourism and Hospitality Development Between China and EU; Springer: Berlin/Heidelberg, Germany, 2015; pp. 73–84. [Google Scholar]
  52. Brezzi, M.; Veneri, P. Assessing polycentric urban systems in the OECD: Country, regional and metropolitan perspectives. Eur. Plan. Stud. 2015, 23, 1128–1145. [Google Scholar] [CrossRef]
  53. Tian, Y.; Liu, Y.; Kong, X. Restructuring rural settlements based on mutualism at a patch scale: A case study of Huangpi District, central China. Appl. Geogr. 2018, 92, 74–84. [Google Scholar] [CrossRef]
  54. Wang, C.; Huang, B.; Deng, C.; Wan, Q.; Zhang, L.; Fei, Z.; Li, H. Rural settlement restructuring based on analysis of the peasant household symbiotic system at village level: A Case Study of Fengsi Village in Chongqing, China. J. Rural Stud. 2016, 47, 485–495. [Google Scholar] [CrossRef]
  55. Veneri, P.; Burgalassi, D. Questioning polycentric development and its effects. Issues of definition and measurement for the Italian NUTS-2 regions. Eur. Plan. Stud. 2012, 20, 1017–1037. [Google Scholar] [CrossRef] [Green Version]
  56. Malý, J. Impact of polycentric urban systems on intra-regional disparities: A micro-regional approach. Eur. Plan. Stud. 2016, 24, 116–138. [Google Scholar] [CrossRef]
  57. Shan, Z.; Huang, Y. China’s new urbanization: Strategy, action, and performances assessment. Planner 2013, 4, 10–14. [Google Scholar]
  58. Ding, Y.; de Vries, B.; Han, Q. Measuring regional sustainability by a coordinated development model of economy, society, and environment: A case study of Hubei Province. Procedia Environ. Sci. 2014, 22, 131–137. [Google Scholar] [CrossRef] [Green Version]
Figure 1. Study area.
Ijgi 09 00565 g001
Figure 2. Flowchart of the methodologies.
Ijgi 09 00565 g002
Figure 3. City connection network of 11 UAs based on the BI.
Ijgi 09 00565 g003
Table 1. Weights of different stopping time.
ScenarioStopping Time (min) w t
t = 1<3 0.132
t = 23 < t < 50.358
t = 3t > 50.510
Table 2. Type of trains and respondent weights.
lSpeed (km/h) w l
Fast train1200.048
Express train1400.120
Direct express train1600.157
Bullet train2000.293
High-speed rail3000.382
Table 3. Calculation of SMP and AMP indexes.
IndexValues of NSIFormulaExplanation
SMP[−0.3,0.3] | N S I | SMP indicates the extent to which a city mutually interacts with the other city. It is a positive indicator, representing a reciprocal interaction.
AMPNSI > 0.3 or
NSI < −0.3
N S I The value of AMP index could be positive or negative. If positive, it means that it has inward connections considering overall connections; otherwise, it has outward connections.
Table 4. Indicators for socioeconomic development estimation.
AspectIndicatorsDirection
DemographyTotal population+
Urban population+
City constructionPer capita urban construction land +
Per capita road mileage+
Per capita public green area+
Economic developmentGross domestic product+
Secondary industry output +
Tertiary industry output+
Annual per capita income +
Per capita fixed investment+
Social improvement Per capita educational time+
Proportion of people with endowment insurance +
Proportion of people with health insurance+
Number of colleagues or universities per 10,000 people+
Number of hospitals per 10,000 people+
Table 5. Symbiotic characteristics of the 11 UAs.
UAProportion of SMPAMP Index of Cities
City with Maximum ValueCity with Minimum Value
Hachang28.9%3.46 (Songyuan)−5.09 (Yanbian)
Mid-Southern Liaoning17.6%1.01 (Benxi)−1.48 (Yingkou)
Jingjinji65.1%1.63 (Chengde)−1.36 (Qinghuangdao)
Shandong Peninsula26.5%1.79 (Rizhao)−1.47 (Zibo)
Guanzhong Plain42.9%1.86 (Shangluo)−2.38 (Yuncheng)
Central Plain38.9%16.59 (Jiyuan)−12.55 (Xinxiang)
Yangtze River Delta74.0%14.02 (Zhoushan)−11.03 (Jinhua)
Chengyu54.3%3.51 (Chongqing)−4.15 (Deyang)
Yangtze River Valley29.6%7.58 (Ezhou)−14.66 (Huanggang)
Pearl River Delta62.2%2.72 (Yangjiang)−2.46 (Jiangmen)
Beibu Gulf36.1%2.35 (Maoming)−4.37 (Yulin)
Table 6. The weights of indicators in each of the UA evaluation model.
123456789101112131415
a0.1220.1480.0810.0360.040.180.1080.10.0460.0210.0340.0120.0320.00990.030
b0.1860.1610.0020.0050.0840.1260.0370.1330.0860.0120.0140.0140.0130.0520.075
c0.1150.160.0480.0350.0470.1240.0910.080.0560.020.0120.0150.0110.10.086
d0.1420.1950.0250.0280.0350.0560.0450.1840.0420.0340.0350.0120.0120.0720.083
e0.1160.1920.0380.0370.0450.1250.0840.1310.0510.0250.0110.0210.0150.0380.071
f0.1870.1630.0370.0340.1160.0730.0370.120.0430.0260.0160.0110.0150.0390.083
g0.1230.1630.0260.0260.0730.1140.0870.0940.0470.0270.0280.0120.0190.0450.116
h0.1390.1670.0110.0520.0520.1190.0790.1120.0710.0130.0120.0260.0220.1050.020
i0.1650.1740.0350.0330.0480.1110.0490.1460.0510.0180.0270.0130.0180.0340.078
j0.1140.1380.0890.0720.0810.0770.0820.1250.0460.0320.0250.0210.0150.0160.067
k0.1630.1840.0750.0640.0550.1390.0160.0680.0540.0330.0170.0120.0320.0660.022
a–k: The 11 UAs as listed in Table 5. 1–15: The 15 indicators as listed in Table 4.
Table 7. The ordinary least squares (OLS) regression results at the city scale.
SMPAMP
Btp R 2 Btp R 2
Hachang0.4601.9110.0880.5370.3452.9810.0150.705
Mid-Southern Liaoning 4.4753.3210.0130.7821.20410.6580.0000.971
Jingjinji 8.1262.8640.0210.7111.9573.6790.0060.793
Shandong Peninsula 1.7735.1660.0020.9040.5113.3930.0150.811
Guanzhong Plain 0.4026.1790.0000.9000.2092.5880.0290.653
Central Plain 2.43510.1810.0000.8870.5134.5170.0000.649
Yangtze River Delta 3.8904.4110.0000.6693.5925.3650.0000.738
Chengyu 7.60610.7670.0000.9452.1395.4140.0000.823
Yangtze River Valley 2.8755.0300.0000.6830.6523.1820.0030.509
Pearl River Delta 3.94710.8340.0000.9522.7554.8560.0000.814
Beibu Gulf 0.6772.1240.0600.6580.4253.5610.0050.748
Table 8. The OLS regression results at the UA scale.
Socio-economic Development
R 2 =   0.935
Coupling Coordination
R 2 =   0.901
BtpBtp
Number of cities0.9192.0030.0120.8033.1650.025
Number of connections0.4063.4870.0180.1732.6850.044
Connection density−19.460−0.9910.367−5.561−0.7610.481
SMP20.9932.0720.09310.3322.7420.041
AMP12.1002.0440.096−0.023−0.0100.992

