Article

Multitemporal Analysis of Deforestation in Response to the Construction of the Tucuruí Dam

by
Andres Velastegui-Montoya
1,*,
Aline de Lima
2 and
Marcos Adami
3
1
Facultad de Ingeniería en Ciencias de la Tierra, Escuela Superior Politécnica del Litoral (ESPOL), Campus Gustavo Galindo, Guayaquil P.O. Box 09-01-5863, Ecuador
2
Geoscience Institute, Federal University of Pará, Belém 66075-110, Brazil
3
Amazon Regional Center, National Institute for Space Research (INPE), Belém 66077-830, Brazil
*
Author to whom correspondence should be addressed.
ISPRS Int. J. Geo-Inf. 2020, 9(10), 583; https://0-doi-org.brum.beds.ac.uk/10.3390/ijgi9100583
Submission received: 1 September 2020 / Revised: 21 September 2020 / Accepted: 28 September 2020 / Published: 3 October 2020

Abstract

:
The expansion of hydroelectric dams that is planned, and under construction, in the Amazon basin is a proposal to generate “clean” energy, with the purposes of meeting the regional energy demand, and the insertion of Brazil into the international economic market. However, this type of megaproject can change the dynamics of natural ecosystems. In the present article, the spatiotemporal patterns of deforestation according to distance from the reservoir in the vicinity of the lake of Tucuruí, and within a radius of 30 km from it, are analyzed. A linear spectral mixture model of segmented Landsat-thematic mapper (TM), enhanced thematic mapper plus (ETM+), and operational land imager (OLI) images, and proximity analysis were used for the mapping of the land-cover classes in the vicinity of the artificial lake of Tucuruí. Likewise, landscape metrics were determined with the purpose of quantifying the reduction of primary forest, as a mechanism of loss of ecosystem services in the region. These methods were also used for the evaluation of the influence of the distance from the reservoir on the expansion of anthropogenic activities. This methodology was used for the scenarios of pre-inauguration, completion of phase I, beginning of construction phase II, full completion of the Tucuruí hydroelectric project, and the current scenario of the region. The results showed that the highest deforestation rate occurred in the first period of the analysis, due to the areas submerged by the reservoir and due to the anthropogenic disturbances, such as timber extraction, road construction, and the conversion of forests into large areas of agribusiness.

1. Introduction

The Brazilian Amazon attracts continued interest in its natural resources and its energy sources. This situation is due to the increase in the insertion level of Brazil into the international economic market, with the export of primary products, such as agricultural and mineral commodities [1]. One of the factors that contributed to the exploration of new sources of energy was the “blackout crisis” in 2001, which was linked to the combination of a lack of planning, and lack of investments in the generation and transmission of electrical energy, with a prolonged drought. This drastically reduced the levels of the main water reservoirs in the Southeast and Northeast regions. Thus, the Brazilian population was forced to change its energy consumption habits [2,3]. Therefore, in the Brazilian territory, hydroelectric dams are proposed under the concept of “energy security”, with the highest hydroelectric potential in South America, and expected to supply energy and meet the growing regional demand [4,5,6].
In recent years, the accelerated expansion of the hydroelectric dams planned and under construction in the Brazilian Amazon has raised social and environmental concerns, due to its impacts on the Amazon basin. On the one hand, hydropower is clean, efficient, renewable, and allows for multiple uses of the water [7,8]. On the other, researchers argued that dams can motivate hydrological and climatic alterations; can affect the fauna and flora due to the flooding of forests, fields, and arable areas; and can also modify land use and provoke the need to relocate the population, leading to the fragmentation and loss of forests [9,10,11,12,13,14,15,16].
The conjunctures of the oil crisis of the 1970s and the stimulus of the Japanese government led to the construction of the Tucuruí hydroelectric dam, with the objective of developing the energy-intensive industry of aluminum in the Brazilian Amazon [17,18]. The construction of the Tucuruí hydroelectric dam was a milestone in the socio-economic dynamics of the region, due to the magnitude of the hydroelectric project. This event led to labor mobility, to meet the strategy of forming labor markets in the border areas of natural resource extraction, and lead to resettling residents of the flooded area, causing significant social problems in the region [19]. The construction of the Tucuruí hydroelectric dam was the first large-scale hydroelectric project in the Amazon region [20], and due to its 33 years of operation, is an ideal case to evaluate the long-term impacts of mega-dams on the loss and degradation of tropical forests.
Regarding the loss of tropical forest induced by the Tucuruí dam, when the period between 1988 and 2008 was analyzed, it was found that the deforestation rates were equal around the dam, both in the river downstream as well as in the river upstream [21]. Nevertheless, this rate was significantly reduced during the last period, between 2008 and 2013. Following a protocol using remote sensing, it was found that the average degradation rate was 17.8% of the rate of deforestation [21]. In that study, the edges’ effects were not taken into account, but recent studies showed the harmful effects of the edges for biodiversity, water and carbon cycle, and other ecosystem processes [22,23]. In addition, others studies revealed that deforestation in the municipalities affected by the construction of the Tucuruí hydroelectric plant was not proportional to the percentage of territory occupied by the lake in each of the municipalities, between the years 1988, 1999, and 2010 [24,25]. This leaves open the question of what happened to the deforestation rates and spatiotemporal patterns of the forest cover in the vicinity of the artificial lake of Tucuruí.
In this way, the importance of mapping the land-cover is highlighted as a mechanism to identify and spatialize the influence of the reservoir on the changes in forest cover. In this study, geotechnologies and landscape analysis were used to evaluate the deforestation patterns around the reservoir. These patterns were formed by the Tucuruí hydroelectric dam during its 33 years of operation and expansion, from 1984 to 2017.

2. Materials and Methods
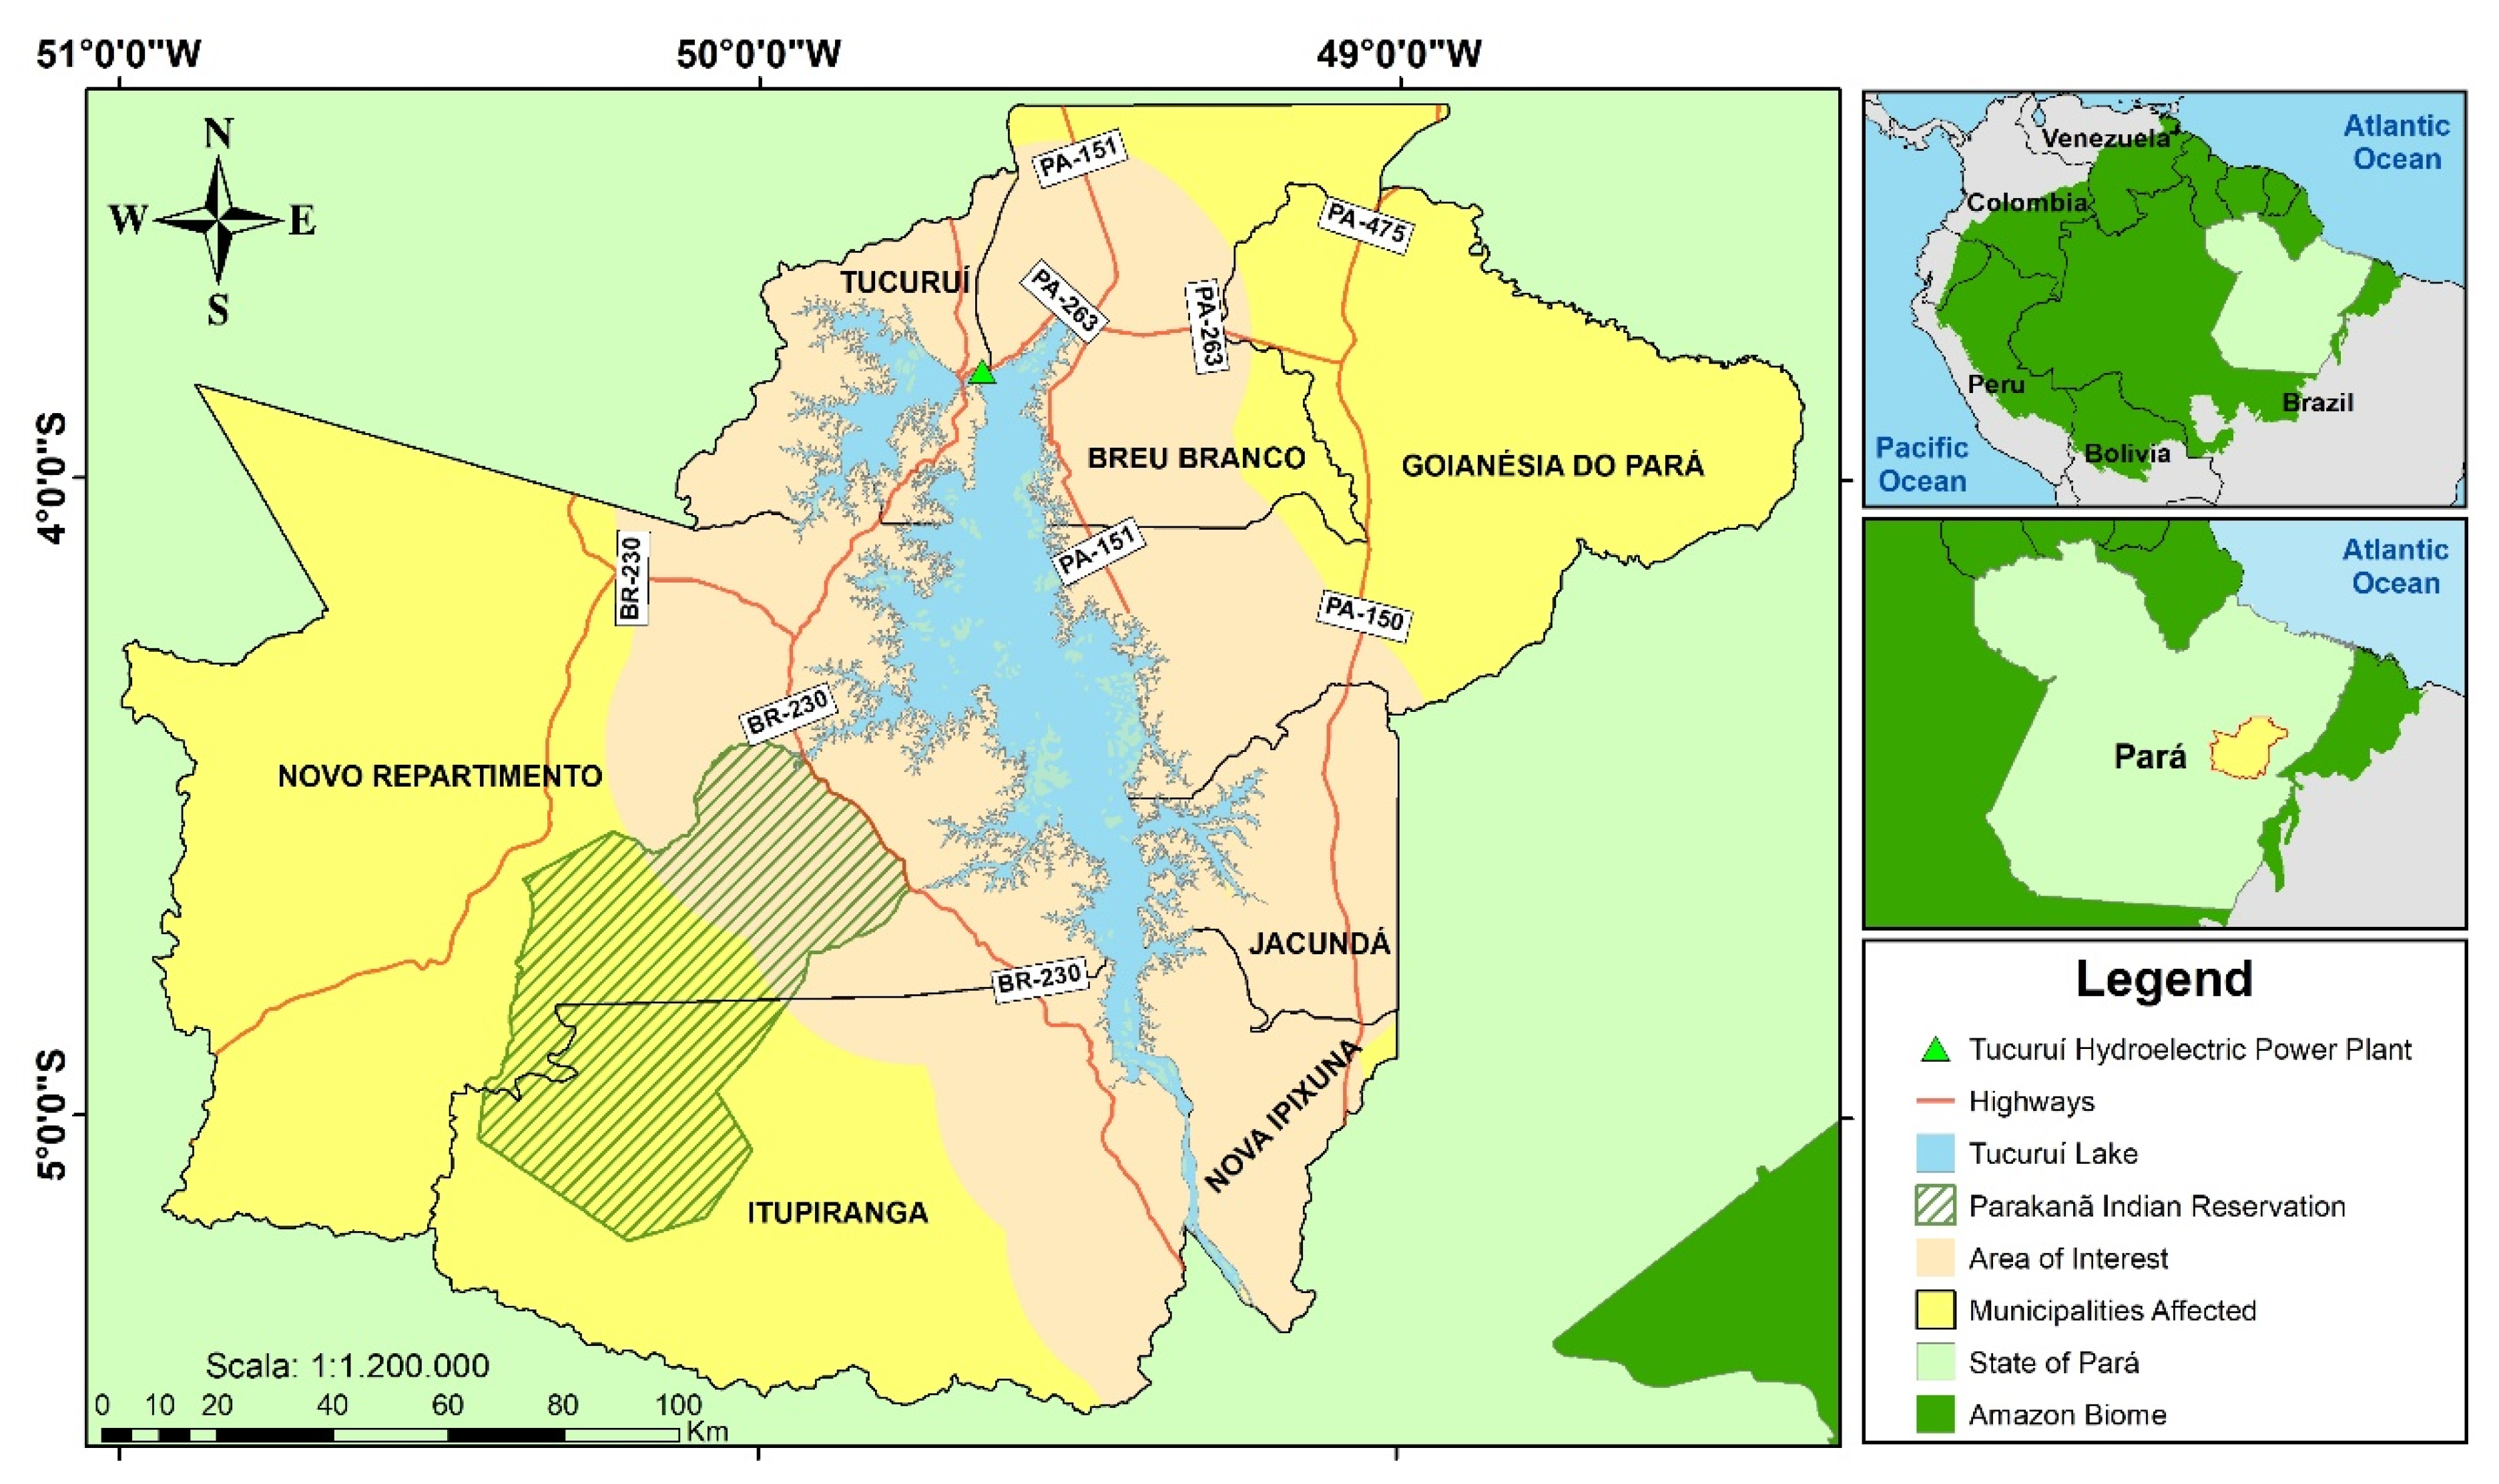
2.1. Study Area

The study area included a buffer of 30 km around the reservoir centered on Lake Tucuruí (03° 28’ and 05° 27’ S, 50° 13’ and 48° 57’ W). It encompassed part of the seven municipalities (Breu Branco, Goianésia do Pará, Itupiranga, Jacundá, Nova Ipixuna, Novo Repartimento, and Tucuruí) directly affected by the construction of the Tucuruí Hydropower Complex, all in the State of Pará (Figure 1).
The Tucuruí Hydropower Complex, in the Baixo Tocantins basin, obstructed the Tocantins river and flooded an area of 2430 km2 [26]. This complex was the first large-scale hydroelectric project in the Amazon region [12,27]. The construction of phase I of the Tucuruí Hydropower Complex, to generate 4000 MW (Megawatts) of electric power, was completed in 1984 [26,28]. Phase II of the construction began in 1998, reaching an installed capacity of 8370 MW of electric power in 2007 [9]. Finally, in 2010, the works of the mega hydroelectric project were concluded, with the inauguration of the Tucuruí locks, which allowed reestablishment of the navigability of the Tocantins river [29,30].

2.2. Acquisition of Remote Sensing Data
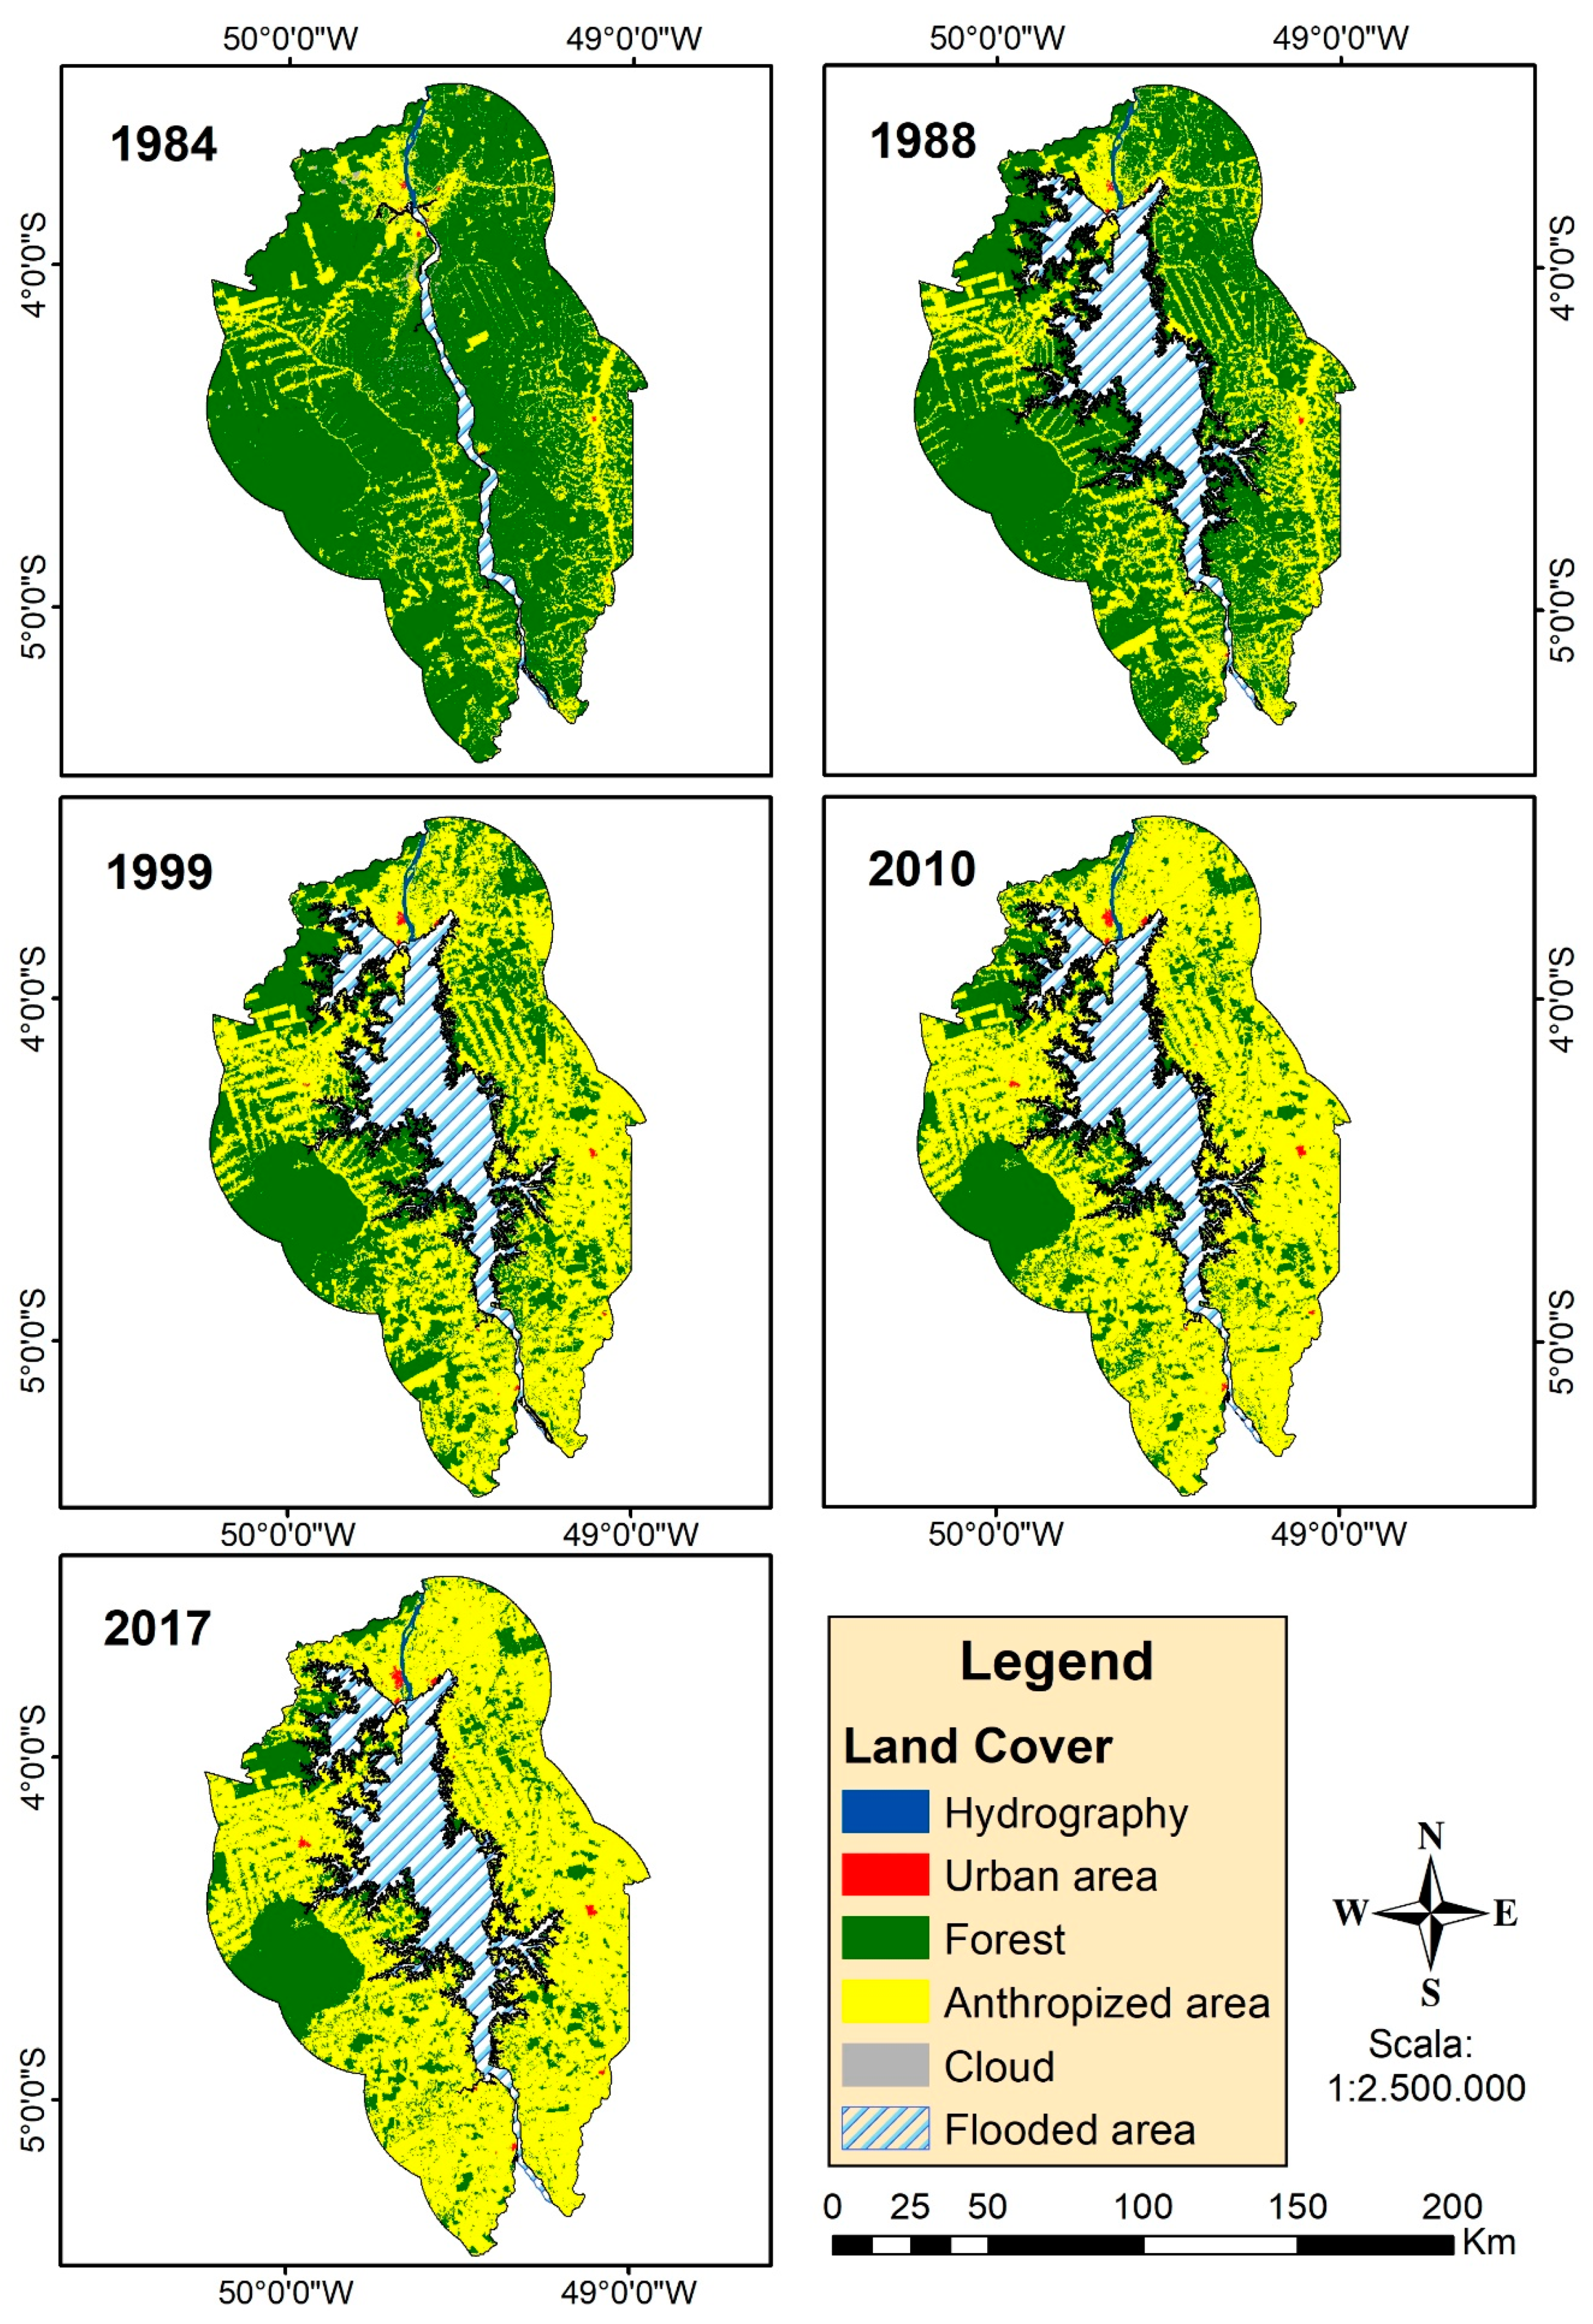
The images used (scenes) were obtained by the Landsat 5, 7, and 8 satellites. They were acquired from the collection of images by the United States Geological Survey, with level L1TP (level-1 terrain precision correction), atmospherically corrected, orthorectified with universal transverse mercator (UTM) projection, a WGS1984 datum/spheroid, and an accuracy greater than 0.8 pixels [31]. The images correspond to the months of May to October of the years 1984, 1988, 1999, 2010, and 2017, composing a series covering 33 years (Table 1). In particular, the data for the years 1984, 1988, and 2010 were acquired by the Landsat-5 TM sensor. The data from 1999 were collected by the Landsat-5 TM and Landsat-7 enhanced thematic mapper plus (ETM+) sensors. For the data of 2017, images from the Landsat-8 operational land imager (OLI) sensor were used. Although multiple sensors were used to collect the data, the quality of the images, the spatial resolution, the geometry and the length of the images remained consistent [31].
In order to cover the entire study area, five scenes of adjacent images were acquired for each year (Table 1). Due to the high percentage of cloud cover in the region, and with the objective of minimizing the area of this type, complementary images of different dates were used for three scenes of the year 2010 with orbits/points: 223/64 dated 8 January 2009, 224/63 dated 21 June 2009, and 224/64 dated 8 August 2009.

2.3. Classification

The software TerraAmazon [32] and PostgreSQL [33] were used to perform the classification and store the results. First, the geographic projection UTM zone 22S and the WGS84 coordinate system were defined. Subsequently, the boundaries of the municipalities surrounding the Tucuruí reservoir were imported in vector format and scaled 1:250,000, as made available by the Brazilian Institute of Geography and Statistics [34].
In order to assist with the identification of the features in the classification process, the RGB (Red, Green, and Blue) color compositions were prepared using the near-infrared (NIR), shortwave infrared (SWIR-1), and red (R) bands respectively. A linear contrast enhancement was applied on the images, to improve the distinction between classes.
In addition, the linear spectral mixture model (LSMM) for each image listed in Table 1 was used. Thus, endmembers representative of the shadow, soil, and vegetation components of the image [35], and the spectral behavior were analyzed. The LSMM was used to estimate the pixel proportions of shadow, vegetation, and soil, and to enhance these components. This also facilitated the identification of deforestation [36].
To facilitate the discrimination of the classes, an algorithm of image segmentation by region growth, aiming at group adjacent and similar pixels, was applied, generating homogeneous regions based on two thresholds; similarity and area. The similarity threshold indicates the distance (in digital number) at which a pixel may belong to the cluster, whereas the area threshold defines the minimum area (in pixels) to form each group of pixels [35]. For the algorithm, the similarity thresholds of 16 digital numbers, and area thresholds of 8 pixels (~0.7 ha) were used. These values were previously used in part of the study area, providing good results [24,25,37]. The segmented shade and soil fraction images were also used for the visual interpretation in the polygon-to-polygon classification.
The key to the class identification was based on the Amazon Deforestation Monitoring Project (PRODES, by its name in Portuguese) [36,38,39] and on the spectral behavior of the components, primarily in relation to the shade and soil response of the LSMM. Based on reference [24], the following classes were considered: (1) forest, considered as forest formations with little or no anthropogenic disturbance; (2) anthropized areas, including areas where anthropogenic interference occurred in forest formations, directly related to human activities that resulted in deforested areas, occupation mosaics, agriculture, pasture, and exposed soils; (3) flooded areas, encompassing all water of the Tocantins River upstream of the dam; (4) hydrography, comprising the area downstream of the hydropower plant occupied by the Tocantins River and other bodies of water (rivers and lagoons); (5) urban areas, involving urban sites and major engineering ventures, such as airports and the Tucuruí dam; (6) clouds, areas covered by cloud and their shadows.
Based on [25], the polygon–polygon classification of the fraction images for shade and soil was performed. The classification was obtained according to the spectral responses of the components in the RGB color composition of the NIR, SWIR-1, and red bands of the satellite images. A scale of 1:30,000 was used on the computer monitor. Then, the matrix editing of the edges of the polygons that presented mixed classes, by means of visual classification with the scale 1:30,000, was performed.

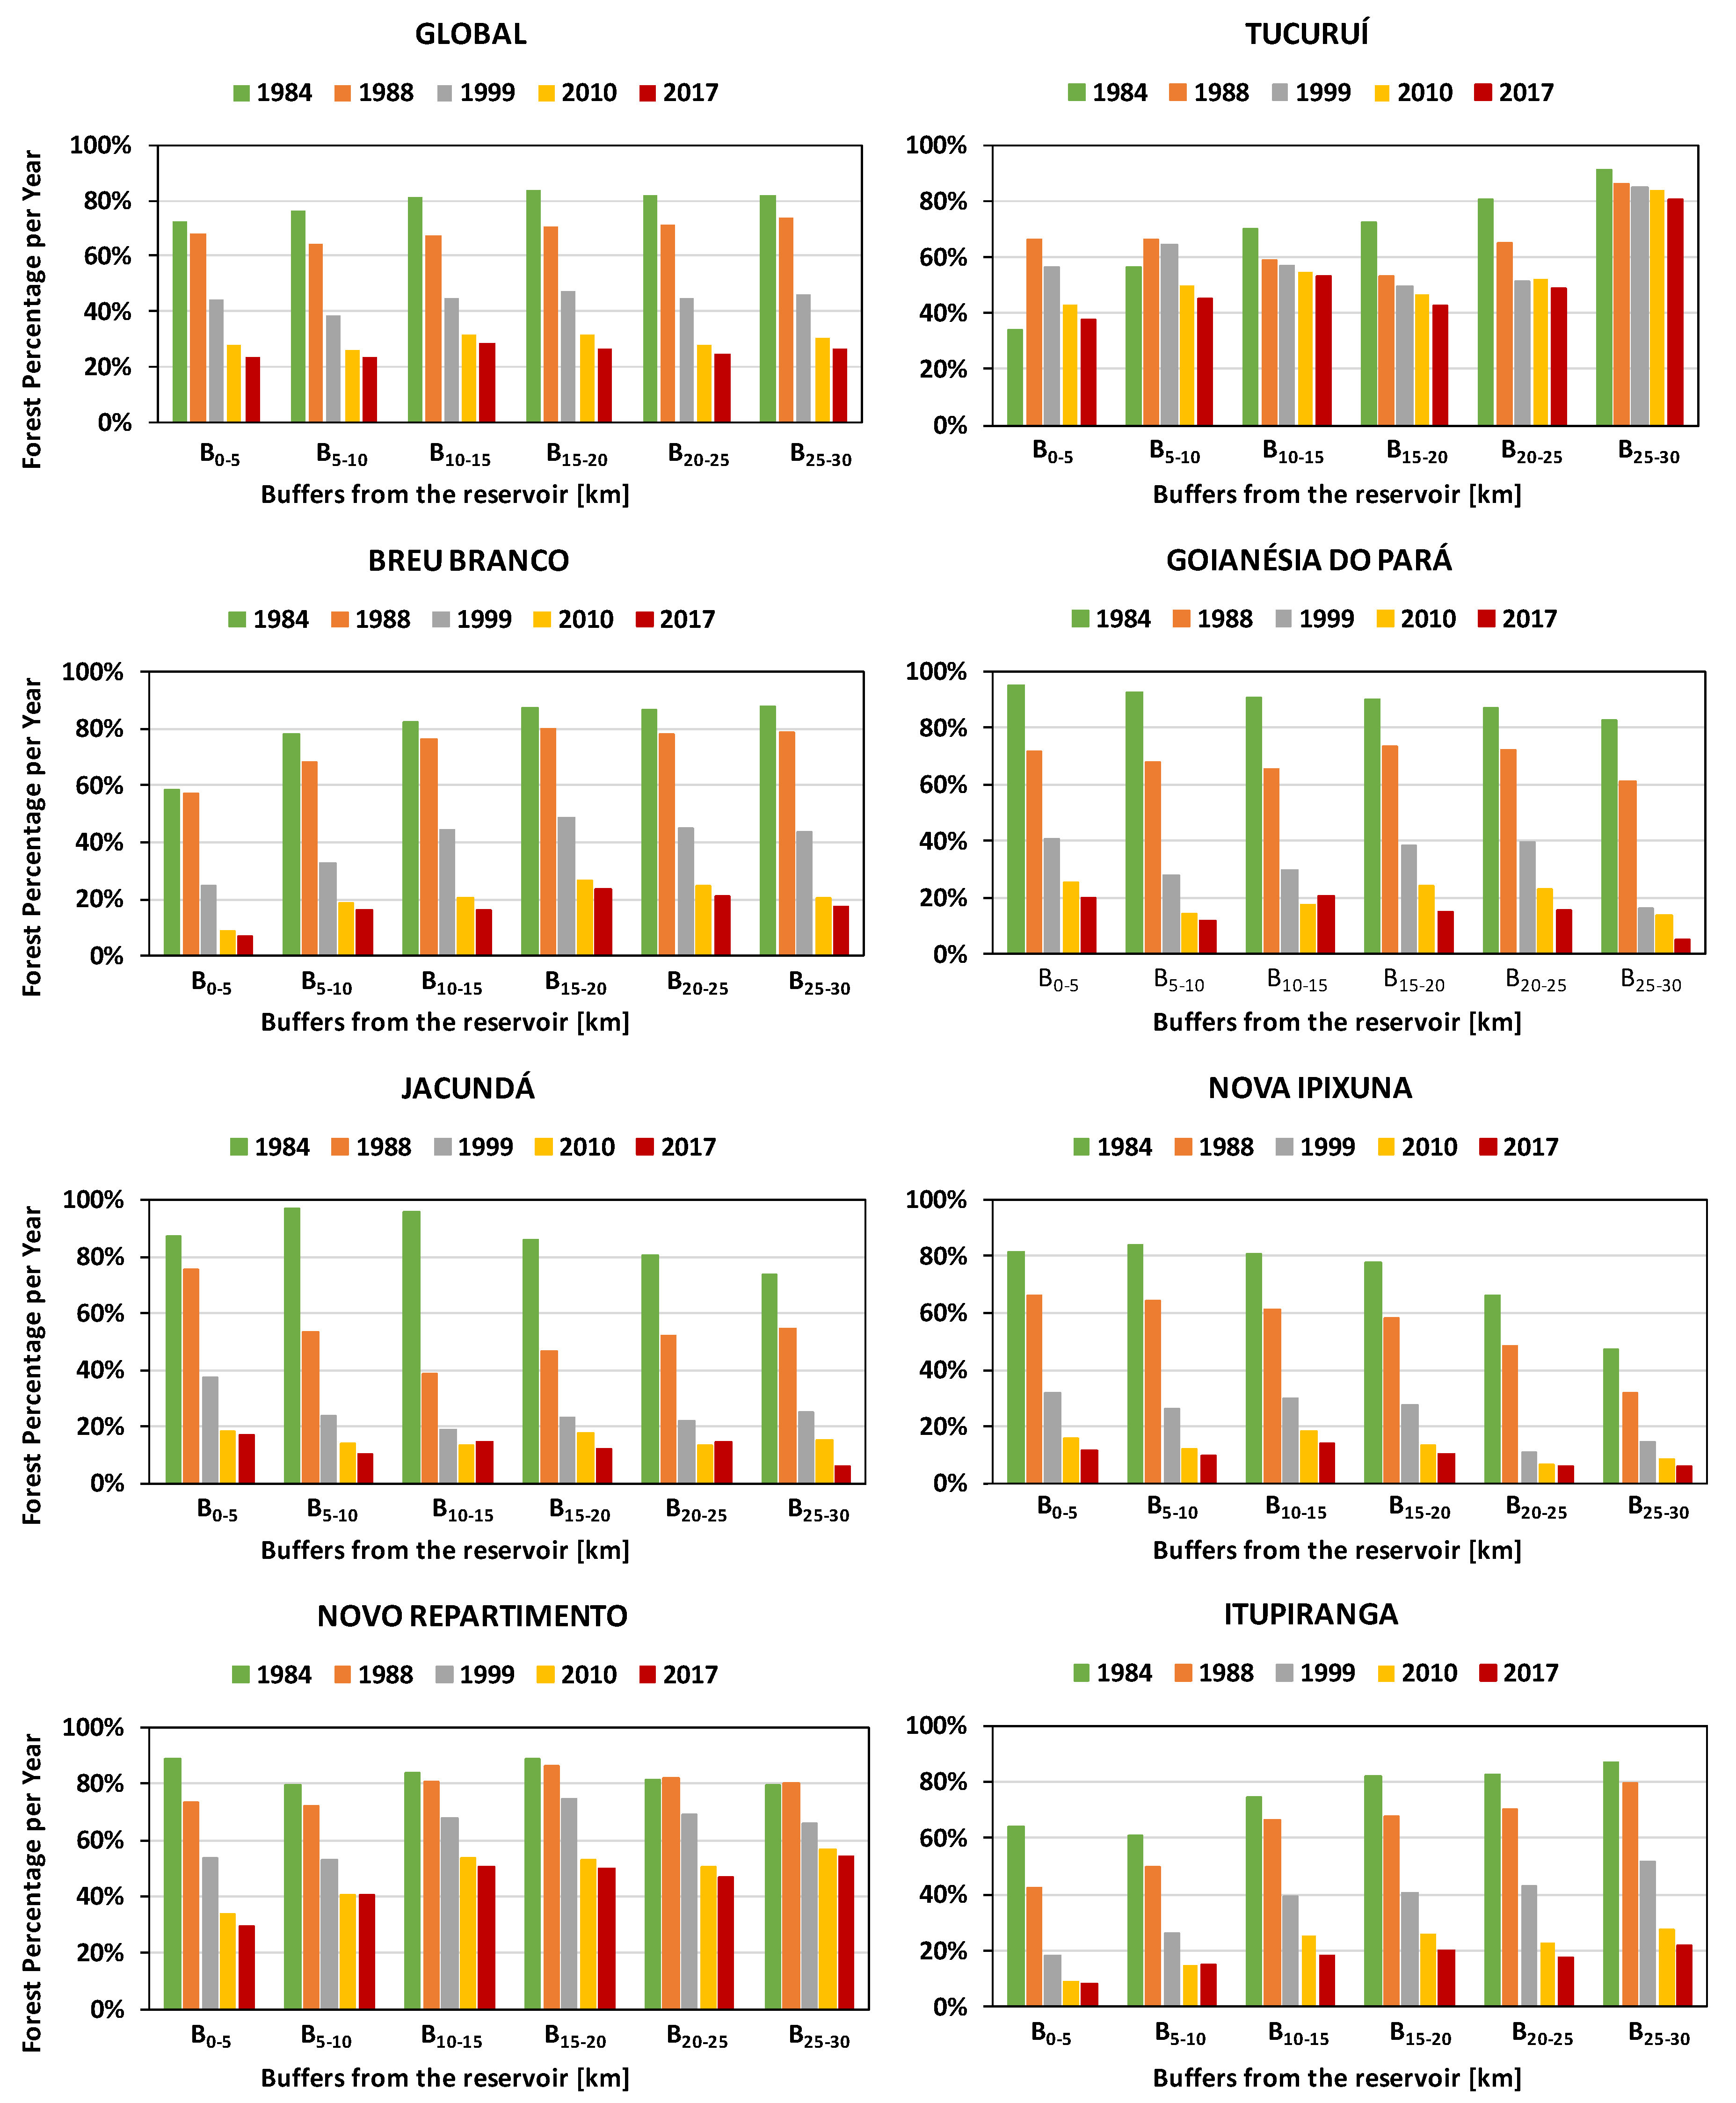
2.4. Analysis of Deforestation Patterns

After obtaining the land-cover maps, a GIS (geographic information system) proximity analysis was used to evaluate the influence of the distance from the reservoir on the loss of forest areas, using ArcGIS software [40]. Specifically, six buffer rings were used, from 5 to 30 km around the Tucuruí Lake of each mapped year, at intervals of 5 km per ring. This methodology was adapted from the method found in [21]. Due to variations in the flooded area in each scene, for all years, the buffer rings were made using the 1988 artificial lake edge as a reference, except for the year 1984, in which the border of the river was used. Thus, it was possible to determine the percentage of land-cover of the forest fragments in the six buffer rings around the Tucuruí reservoir, in the years 1984, 1988, 1999, 2010, and 2017. It was also possible to elaborate the transition matrices of the land-cover within a 30 km radius of the lake during the periods 1984–1988, 1988–1999, 1999–2010, and 2010–2017. In addition, the relative annual deforestation rates (ADR) were calculated based on following Equation (1),
A D R t = 1 + d t f t 1 1 n 1              
where ADR is the annual deforestation rate, t is the time (mapping year), n is the number of years between t and t − 1, f is the forest area, and d is the total deforested in the period, n; it can also be obtained from ft−1ft.
In addition, the amount of carbon (C) emissions was calculated using the above ground biomass (AGB) 266 Mg ha−1 [41], and assuming that 48% of it is carbon. Furthermore, it was considered that 20% of the AGB is below ground biomass (BGB). Thus, the total of C emission considering AGB and BGB was 153.2 Mg ha−1.

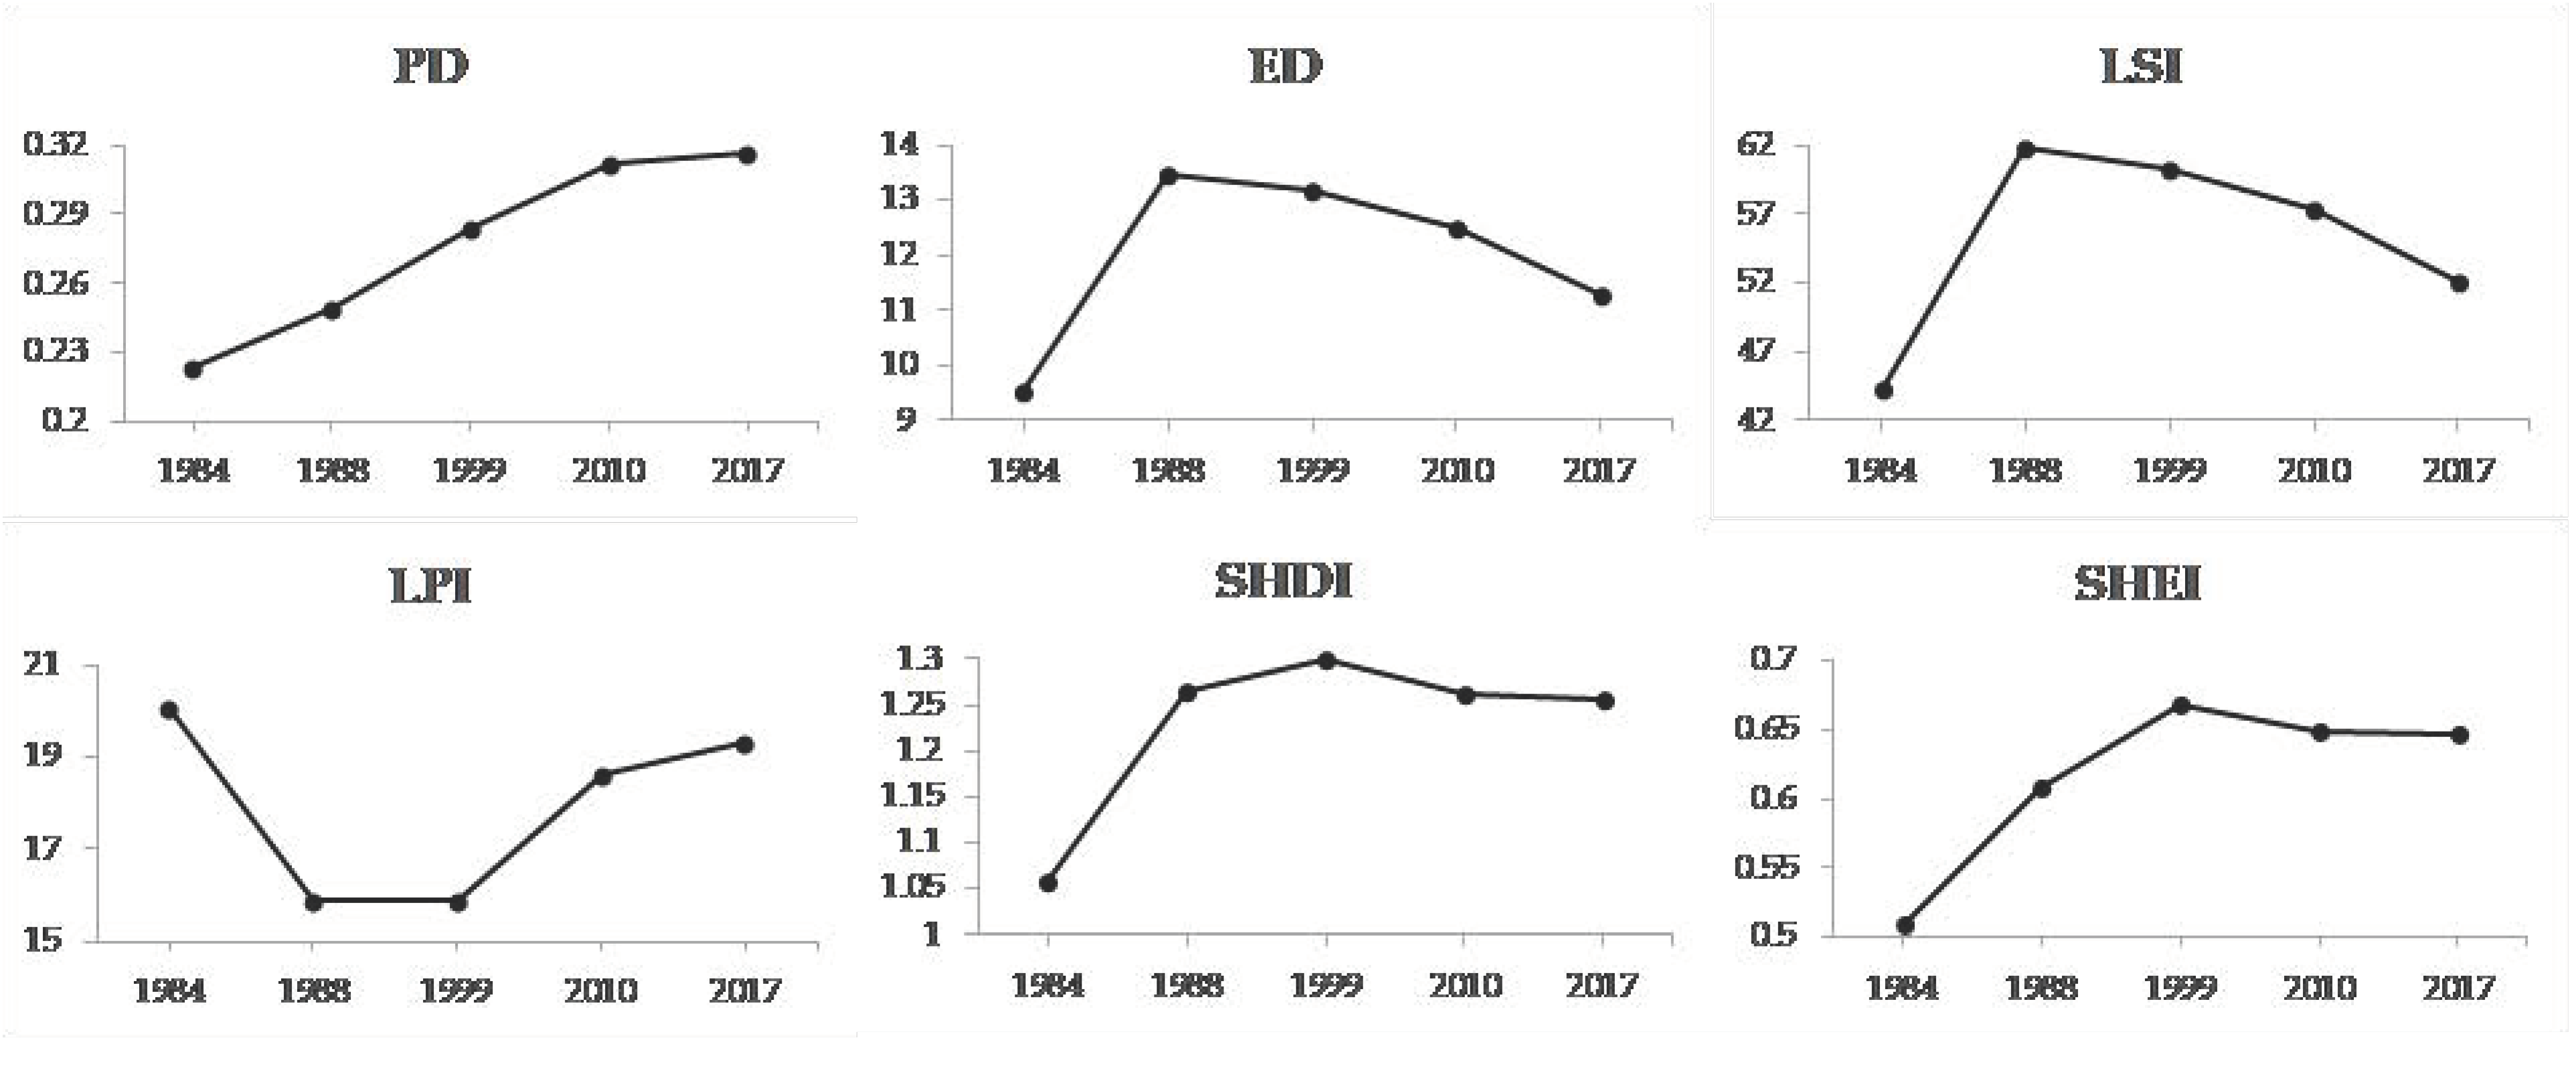
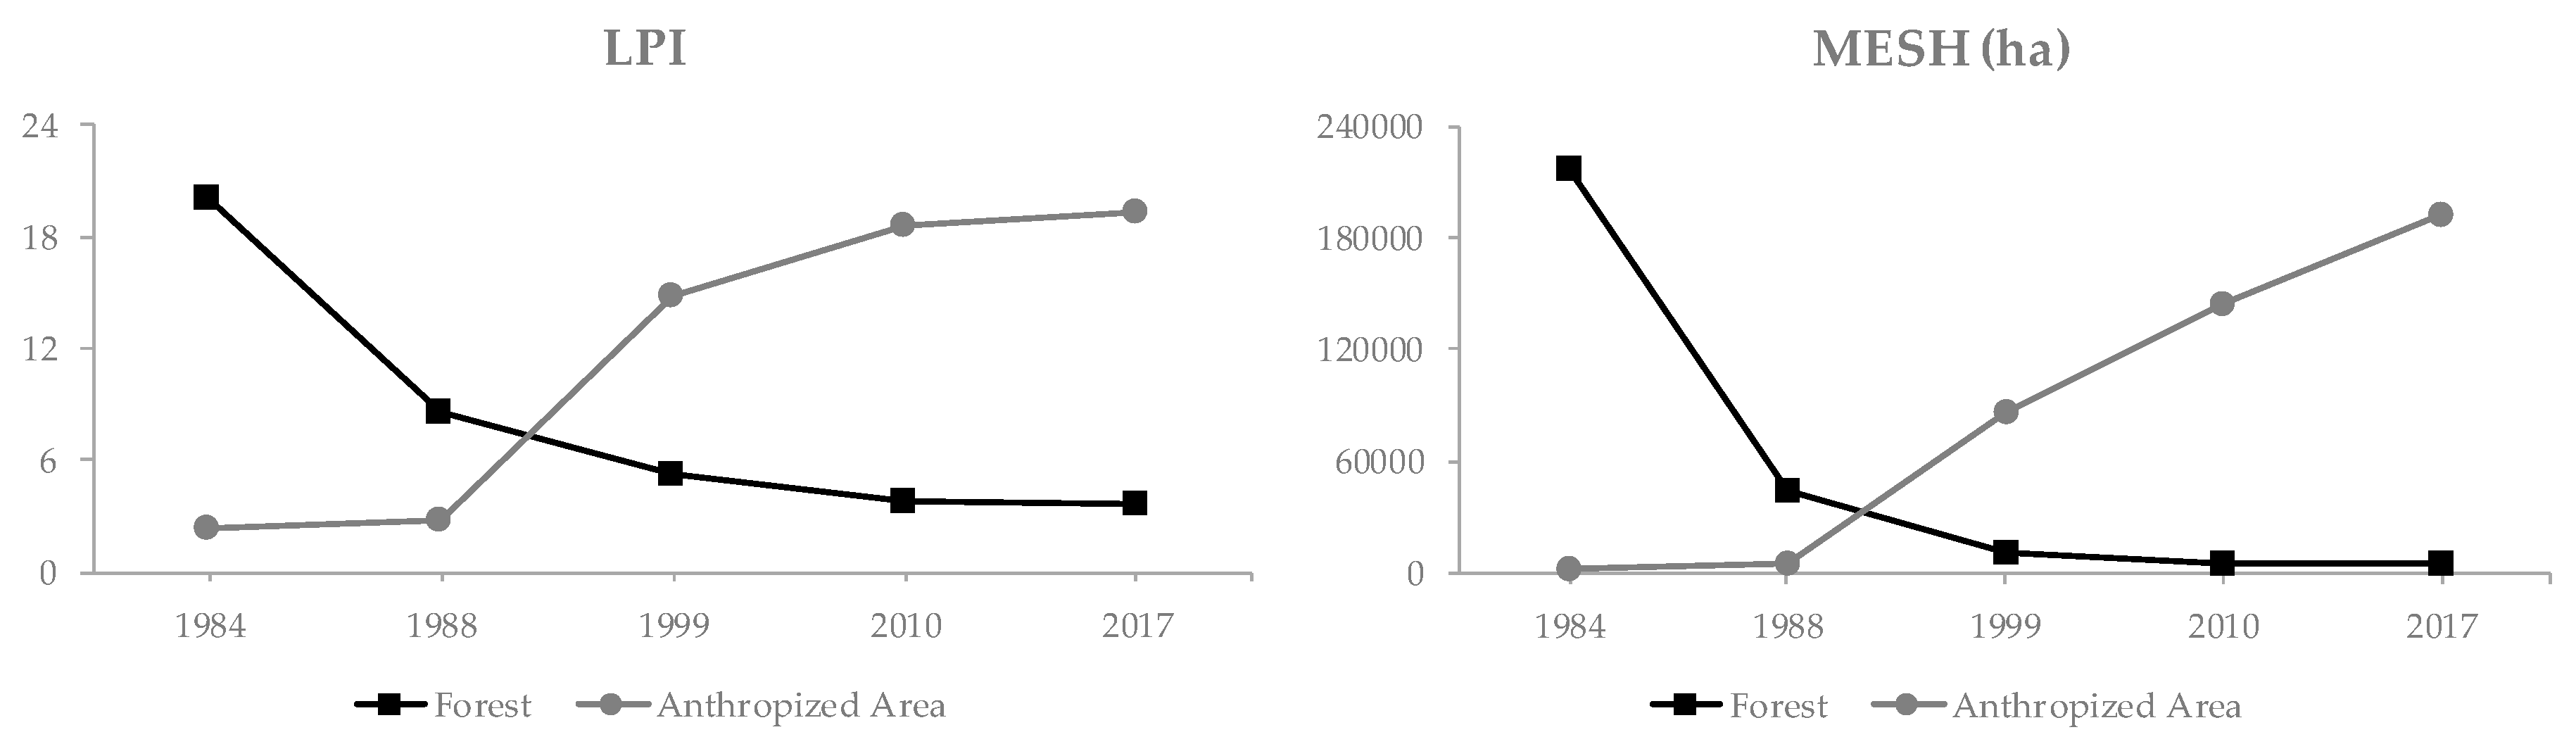
2.5. Landscape Structure Metrics

Metrics at the landscape level were employed to analyze the spatiotemporal patterns of landscape change to estimate the loss of ecosystem services within a 30 km radius of the lake. Seven landscape metrics were selected, including patch density (PD), edge density (ED), largest patch index (LPI), landscape shape index (LSI), effective mesh size (MESH), Shannon’s diversity index (SHDI), and Shannon’s evenness index (SHEI) because they are related to fragmentation and changes in forest cover [42,43,44]. The calculation of landscape level indexes (PD, ED, LPI, LSI, SHDI, and SHEI) aimed to give an overview of the variations in landscape patterns. The software FRAGSTATS [45,46] was used to compute the selected metrics. After getting the indexes value, a comparative analysis was done, in respect of landscape fragmentation between the years 1984, 1988, 1999, 2010, and 2017.
Overall landscape level diversity was assessed by calculating Shannon’s diversity index (SHDI) and Shannon’s evenness index (SHEI). SHDI = 0 when the landscape contained only one patch, and the value increased with the number of patch types and/or as the proportional distribution of the area among patch types became more equal. However, the SHEI was also used to describe the distribution of patches [45].

3. Results and Discussion

Based on the land-cover results obtained within a 30 km radius of the Lake Tucuruí for the years 1984, 1988, 1999, 2010, and 2017, roads were the primary driver inducing the spread of deforestation. In the 1984 classification, the main roads, classified as anthropized area, followed the North–South direction, the same as the main river. In the following years, this anthropized area began around the highways and spread from them [47]. The opening of roads, the improvement of the road network, along with the flows of population and investment that the roads attracted, generated the continuous creation of corridors to access the region, which were the main determinants for the constant increase in deforestation [48,49] (Figure 2).
According to the thematic maps of the land-cover in Figure 2, the map of the year 1984 has the smallest flooded area, as this represents the reservoir filling period, that is, the pre-inauguration scenario of the Tucuruí hydroelectric dam. At this stage, the area of the Tocantins river, classified as a flooded area, extended over 37,728 ha. In the maps of other years, the length of Lake Tucuruí was 276,114 ha, 264,264 ha, 262,688 ha, and 290,992 ha for the 1988, 1999, 2010, and 2017 scenarios, respectively (Table 2).
From the thematic maps, land-cover transition matrices (between the years analyzed) within the 30 km radius of the Tucuruí reservoir (Table 2) were generated. Likewise, it was possible to generate information on the dynamics of the propagation of the anthropized areas, in time and space, in the six buffer rings surrounding the flooded area, within the municipalities directly affected by the construction of the Tucuruí Hydropower Complex, for the five scenarios analyzed (Figure 3).
From the forested area in 1984 (1,500,572 ha) only 28% remained as forest in 2017 (418,141 ha). More than a million hectares were converted into another land cover type. In this area, 185,386 ha of forests (9.7% of the territory) were flooded by the Tucuruí reservoir and 189,085 ha of forests (9.9% of the territory) changed to anthropized areas. This also impacted part of the Parakanã Indian reservation, with 2290 ha deforested throughout the analysis period. Lake Tucuruí flooded, in addition to forest areas, 46,541 ha of anthropized areas (2.4% of the territory), reaching part of the railway Estrada de Ferro Tocantins and the highways BR-230 and BR-422 [50].
In the year 1984, the deforested areas were concentrated in the rings B0–5 and B5–10 of the municipalities of Tucuruí and Itupiranga (Figure 3). The urban spots of the old Tocantins railroad and the highways Transamazônica (BR-230) and BR-422 are located in these areas. The latter were implemented in the first half of the 1970s by the road program and the colonization policies of the National Integration Program [49]. In the municipality of Breu Branco, in the B0-5 ring, there was a reduced concentration of forest fragments (Figure 3), a zone influenced by the urban centers (Breu Velho and Breu Branco) and by the PA-263 and PA-151 highways. In comparison to the other municipalities, Nova Ipixuna presented low forest cover in the B25-30 ring buffer (Figure 3), presumably due to the settlements along the PA-150 highway.
For the year 1988, the lowest percentage of forest cover was located in the regions distant from the reservoir, in the rings B10–15, B15–20, B20–25, and B25–30 of the municipality of Nova Ipixuna, and in rings B5–10, B10–15, B15–20, B20–25, and B25–30 in the municipality of Jacundá (Figure 3). These localities were affected by the urban settlements and farms along the PA-150 highway, which is an interlinking road with the dynamic city of Marabá [26]. There were also low percentages of forest cover in the ring near the lake in the municipalities of Itupiranga (B0–5) and Breu Branco (B0–5) (Figure 3). Coincidentally, the territory within this ring is crossed by the highways BR-230, PA-263, and PA-151.
In the last three scenarios, the percentage of forest cover in every ring declined drastically for all the municipalities (Figure 3). Globally, in the scenario of 1999, between 39% and 47% of the areas in the rings were covered by forest fragments. For the year 2010, this percentage was between 26% and 32%; and in the 2017 scenario, between 23% and 28% of these areas were covered by forest. These results corroborate the transitions of land-cover that occurred between 1988 and 1999, 1999 and 2010, and 2010 and 2017, as presented in Table 2.
Between 1988 and 1999 (Table 2), 37.3% (710,221 ha) of the territory remained as forest but suffered the highest substitution of forest by anthropized areas, with the alteration of 21.6% (411,021 ha) of the territory. Between 1999 and 2010 (Table 2), 24.4% (464,599 ha) of the territory continued as a forest, and 13.9% (264,084 ha) of the territory was substituted by anthropized areas. Finally, between 2010 and 2017 (Table 2), 21.4% (406,593 ha) of the territory remained as forest. This period experienced the smallest modification of forest by anthropized areas, with a change of 3.8% (72,262 ha) of the territory.
Thus, it is possible to have a representation of the variation of the patterns of deforestation in the surroundings of Lake Tucuruí, among the five scenarios of 1984 and 2017. Specifically, the highest forest loss rate occurred in the first period (1984–1988), with a loss of 374,726 ha of forests (93,681 ha/year). This effect is corroborated by Table 3, which presents the deforestation rates in relation to the remaining forest area, with a deforestation rate of 5.7% in this first period, caused mostly by the filling of the artificial lake of Tucuruí. All areas would have been deforested in less than eighteen years if these deforestation rates were kept at the same level. In addition, land was needed for the resettlement of the residents, who had previously lived in the areas flooded by the reservoir [12]. According to [50], the Timber Industry Union of Tucuruí and Region, in the period between 1983 and 1990, the region had become the largest center of timber extraction and processing in the state of Pará.
In relation to other periods, deforestation led to the loss of 394,108 ha, 248,431 ha, and 65,167 ha of forest, that is, deforestation rates of 2.8%, 2.7%, and 1.8% in the periods from 1988 to 1999, 1999 to 2010, and 2010 to 2017, respectively (Table 3). Although the rate of deforestation decreased over time, the total percentage of forest dominance has been severely affected. Two main reasons may have contributed to the decline in deforestation rates. First, since 1999, more than 50% of the study area was already deforested (Figure 3 and Table 2). Secondly, in 1998, the Law of Life was promulgated: Law on Environmental Crimes (Law No. 9605, dated February 12, 1998), with the objective of protecting the country’s flora and fauna, as well as curbing degradation and deforestation of the forest [51]. Another factor that also contributed was The Action Plan for the Prevention and Control of Deforestation in the Legal Amazon (PPCDAm) that reduced Amazon deforestation from 27,772 to 4571 km2 [52,53].
This deforestation associated with the construction of the Tucuruí plant was directly responsible for the emission of more than 218,000 Gg of carbon during the analysis period (Table 3). Other factors that should also be considered, but that were not measured in this work, are the loss of the carbon absorption that the forest stopped performing, and the amount of methane that it started to emit because of the flooding of the forest for the creation of the artificial lake [9]. However, the harmful effects are not restricted to the emission of greenhouse gases, the loss of habitat must also be taken into account. The calculation of the landscape structures can be of great assistance to achieve this.
The landscape metrics showed that the PD increased over time, with less variation in the last period (Figure 4). Considering the land cover transitions (Table 2), it was inferred that numerous fragments of anthropized area replaced the large patches of forest, while the patches fragmented over time. The LSI and ED showed similar trends between them. The smallest values, presented in 1984, indicate patches of greater compaction, linked in particular to the consolidation of the forest. On the other hand, the highest LSI and ED values imply disaggregated covers in the landscape matrix, which, for 1988, experienced the highest value, influenced by the recent presence of Lake Tucuruí. For the coming years, these metrics gradually decreased in value. This can be understood as a process of landscape compaction, associated exclusively with the continuous predominance of anthropized areas.
In the metrics at class level, the values of LPI and MESH showed different behaviors between the two classes considered in Figure 5. The high values of LPI and MESH for the forest class in 1984 confirmed their initial predominance and the good connectivity for patches. The most notorious variation in habitat loss and fragmentation occurred in 1988. The LPI and MESH values of the forest patches experienced a considerable drop in their predominance and connectivity, as the anthropized patches grew even greater. This effect was caused by the sudden presence of Lake Tucuruí. In the following scenarios, the LPI and MESH indicators of the forest patches recorded their lowest values, being surpassed by the LPI and MESH of the anthropized areas, which gradually increased for each scenario. This implies the loss of large patches of forest, giving space to the predominance and good connectivity of the patches of anthropized areas. This caused a diversity of effects, altering the size and dynamics of populations, trophic interactions, and ecosystem processes [54].
The years 1984 and 2017 presented the highest LPI values, which quantifies the total percentage of the landscape area covered by the largest patch. For the year 1984, this value is associated with the dominance of forest cover and, for the year 2017, with the predominance of anthropized areas. The smallest LPI values were presented in 1988 and 1999, related to the loss of tropical forest prevalence and to the competition of different classes in the new process of consolidation of the landscape matrix, as shown in Figure 4. Finally, the SHDI and SHEI diversity indexes demonstrated similar behaviors, with the smallest value in 1984, which indicates a landscape with smaller types of patches and smaller distribution in the area of the different types of patches present. This is understood as a less fragmented landscape. For the years 1988 and 1999, consecutive increases were observed, with the highest value in the year 1999, a scenario where more than 50% of the study area was deforested (Table 2).
It is important to know the behavior and evolution of the deforestation that causes loss of habitat in areas of the Amazon forest, affected by the implementation of hydroelectric projects, to plan and prevent the same issues from occurring again. Studies have found that deforestation rates were consistent in the first 80,000 km2 around the Tucuruí hydroelectric dam during the period 1988-2008 [21]. This behavior was not the same if they analyzed the municipalities directly affected by the reservoir. The deforestation in these municipalities was not proportional to the percentage of territory occupied by Lake Tucuruí in each of them between 1988, 1999, and 2010 [24,25]. Therefore, it is necessary to know the behavior and progress of deforestation and forest fragmentation exclusively around the reservoir, associated with the creation of Lake Tucuruí in 1984. In this study, the highest rate of deforestation per year (5.7%) was detected during the pre- and post-inauguration period of the hydroelectric project (1984–1988); in this period an emission of over 109,000 Gg of carbon was observed (Table 3). It is important to note that the behavior and evolution of deforestation exclusively around the lake was distinct within each affected municipality (Figure 3).
With the increase in fragmentation there was a strong reduction in the abundance of plant and animal species, sometimes even promoting changes in the composition of entire communities. The edge effects caused a large number of patches between 1984 and 2017, with a high prevalence of deforested areas for the 2017 scenario. It is known that a forest divided into small fragments causes several effects such as the change of size and dynamics of populations, trophic interactions and ecosystem processes as isolated fragments degrade [55,56]. In tropical forests, the reduction in the size of the fragment and the increase in the proportion of the edge habitat cause changes in the physical environment that lead to the loss of large and old trees in favor of pioneer trees, with subsequent impacts on the community of insects. In addition to these changes in the physical environment, forest fires are facilitated due to the reduction in the relative humidity of the air. The size of the fragment also affects the rate of succession, so that the increased penetration of light and the sources of altered seeds in smaller fragments modify the ecological succession rate in relation to the larger fragments [55,56]. In the 33 years of analysis, the region under study experienced a high fragmentation of its forests, producing many small fragments, encouraging the reduction of the population of species housed within each forest fragment, since the effects of habitat loss and fragment size act together.
For purposes of reflection, in 2002, through Law No. 6451, the government of the state of Pará created the Environmental Protection Area (APA, by its name in Portuguese) of the Lake de Tucuruí, with an extension of 568,667 ha [57]. According to the objectives proposed for the creation of APA-type protected areas, biodiversity should be protected and restored, altered areas should be restituted, and the natural resources needed for the subsistence of the local population should be protected, among other things. However, it is easy to verify that the achievement of these objectives did not occur. This was in view of the reduction of the forest cover prevalence in the B0-5 ring at a global level, which was the best indicator to prove this fact. Thus, forest areas covered 44%, 28%, and 23% of the areas of the first buffer ring, in the scenarios of 1999, 2010, and 2017, respectively.

4. Conclusions

The results obtained allowed us to evaluate the changes in forest cover related to the implementation of the artificial lake of the Tucuruí hydroelectric dam, and its complementary works, over time. Such results also provide vital information to be considered in the evaluation of future ventures in the Amazon rainforest. It was found that the highest rate of deforestation occurred in the first period (1984–1988), with a loss of 93,681 ha per year. From these areas, 185,386 ha were flooded by the Tucuruí reservoir and another 189,085 ha were affected by anthropized areas, associated with timber extraction and the expansion of agro-cultivable areas and roads. These activities focus on distant territories from the reservoir banks (more than 5 km from the reservoir, in areas not bordered by highways conducing to the lake), and close to the main highways in the region (BR-230, PA-263, PA-150, and PA-151). The peak values in the LSI and ED metrics, as well as the sudden drop in the LPI and MESH values of the forest patches for the 1988 scenario confirm the degradation in the landscape matrix and loss of connectivity between the forest patches for this scenario.
In the last three periods, the deforestation rates were lower, with losses of 35,828 ha per year, 22,585 ha per year, and 9,310 ha per year, for the periods 1988 to 1999, 1999 to 2010, and 2010 to 2017, respectively. This effect may be associated with the high percentage of areas already deforested (approximately 50% of the study area) since the 1999 scenario, together with the promulgation of the Law of Life: Law of Environmental Crimes, which had the purpose of stopping forest deforestation.
Without doubt, the construction of the Tucuruí hydroelectric plant and the implementation of the artificial lake modified the ecosystem of the region, responsible for the emission of more than 218 thousand Gg of carbon during the entire period analyzed. However, roads and highways were found to route the devastation, and they accelerated forest deforestation when they were located in the vicinity of the reservoir (in the first 5 km of the lake).

Author Contributions

Conceptualization, Andres Velastegui-Montoya, Aline de Lima and Marcos Adami; Formal analysis, Andres Velastegui-Montoya; Investigation, Andres Velastegui-Montoya, Aline de Lima and Marcos Adami; Methodology, Aline de Lima and Marcos Adami; Project administration, Andres Velastegui-Montoya; Supervision, Aline de Lima and Marcos Adami; Writing–original draft, Andrés Velástegui-Montoya; Writing–review and editing, Andres Velastegui-Montoya, Aline de Lima and Marcos Adami. All authors have read and agreed to the published version of the manuscript.

Funding

This research received no external funding.

Conflicts of Interest

The authors declare no conflict of interest. The funders had no role in the design of the study; in the collection, analyses, or interpretation of data; in the writing of the manuscript, or in the decision to publish the results.

References

  1. Moretto, E.M.; Gomes, C.S.; Roquetti, D.R.; de Jordão, C.O. Histórico, tendências e perspectivas no planejamento espacial de usinas hidrelétricas brasileiras: A antiga e atual fronteira Amazônica. Ambient. Soc. 2012, 15, 141–164. [Google Scholar] [CrossRef] [Green Version]
  2. Gall, N. As dificuldades em tomar decisões: Apagão na política energética. Braudel Pap. 2002, 32, 1–12. [Google Scholar]
  3. Grün, R. Apagão cognitivo: A crise energética e sua sociologia. Dados 2005, 48, 891–928. [Google Scholar] [CrossRef]
  4. Ministério de Minas e Energia. Plano Nacional de Energia 2030; MME: Brasília, Brazil, 2007. Available online: http://www.mme.gov.br/documents/36208/468569/03.+Geração+Hidrelétrica+%28PDF%29.pdf/12662270-da6d-a990-664e-9668e3141264 (accessed on 19 March 2020).
  5. Bermann, C. O projeto da usina hidrelétrica Belo Monte: A autocracia energética como paradigma. Novos Cad. NAEA 2012, 15, 5–23. [Google Scholar] [CrossRef]
  6. Tundisi, J.G.; Goldemberg, J.; Matsumura-Tundisi, T.; Saraiva, A.C.F. How many more dams in the Amazon? Energy Policy 2014, 74, 703–708. [Google Scholar] [CrossRef]
  7. Blanco, C.J.C.; Secretan, Y.; Mesquita, A.L.A. Decision support system for micro-hydro power plants in the Amazon region under a sustainable development perspective. Energy Sustain. Dev. 2008, 12, 25–33. [Google Scholar] [CrossRef]
  8. Pottmaier, D.; Melo, C.R.; Sartor, M.N.; Kuester, S.; Amadio, T.M.; Fernandes, C.A.H.; Marinha, D.; Alarcon, O.E. The Brazilian energy matrix: From a materials science and engineering perspective. Renew. Sustain. Energy Rev. 2013, 19, 678–691. [Google Scholar] [CrossRef]
  9. Fearnside, P.M. Greenhouse Gas Emissions from a Hydroelectric Reservoir (Brazil’s Tucuruí Dam) and the Energy Policy Implications. Water Air Soil Pollut. 2002, 133, 69–96. [Google Scholar] [CrossRef]
  10. Sanches, F.; Fisch, G. As possíveis alterações microclimáticas devido a formação do lago artificial da hidrelétrica de Tucuruí—PA. Acta Amaz. 2005, 35, 41–50. [Google Scholar] [CrossRef]
  11. Sternberg, R. Damming the river: A changing perspective on altering nature. Renew. Sustain. Energy Rev. 2006, 10, 165–197. [Google Scholar] [CrossRef]
  12. Manyari, W.V.; de Carvalho, O.A. Environmental considerations in energy planning for the Amazon region: Downstream effects of dams. Energy Policy 2007, 35, 6526–6534. [Google Scholar] [CrossRef]
  13. Sieben, A.; Cleps Junior, J. Política energética na amazônia: A UHE estreito e os camponeses tradicionais de Palmatuba/Babaçulândia (TO). Soc. Nat. 2012, 24, 183–196. [Google Scholar] [CrossRef] [Green Version]
  14. Finer, M.; Jenkins, C.N. Proliferation of hydroelectric dams in the Andean Amazon and implications for Andes-Amazon connectivity. PLoS ONE 2012, 7, e35126. [Google Scholar] [CrossRef]
  15. Ferreira, L.V.; Cunha, D.A.; Chaves, P.P.; Matos, D.C.L.; Pia, P. Impacts of hydroelectric dams on alluvial riparian plant communities in eastern Brazilian Amazonian. An. Acad. Bras. Cienc. 2013, 85, 1013–1023. [Google Scholar] [CrossRef] [Green Version]
  16. Barrow, C.J. The environmental impacts of the Tucuri dam on the middle and lower Tocantins river basin, Brazil. Regul. Rivers Res. Manag. 1987, 1, 49–60. [Google Scholar] [CrossRef]
  17. Coelho, M.; Miranda, E.; Wanderley, L.J.; Garcia, T.C. Questão energética na Amazônia: Disputa em torno de um novo padrão de desenvolvimento econômico e social. Novos Cad. NAEA 2011, 13, 83–102. [Google Scholar] [CrossRef] [Green Version]
  18. Fearnside, P.M. Environmental and Social Impacts of Hydroelectric Dams in Brazilian Amazonia: Implications for the Aluminum Industry. World Dev. 2016, 77, 48–65. [Google Scholar] [CrossRef]
  19. Becker, B. Amazônia; Ática: São Paulo, Brazil, 1990. [Google Scholar]
  20. de Souza, A.C.C. Assessment and statistics of Brazilian hydroelectric power plants: Dam areas versus installed and firm power. Renew. Sustain. Energy Rev. 2008, 12, 1843–1863. [Google Scholar] [CrossRef]
  21. Chen, G.; Powers, R.P.; de Carvalho, L.M.T.; Mora, B. Spatiotemporal patterns of tropical deforestation and forest degradation in response to the operation of the Tucuruí hydroelectric dam in the Amazon basin. Appl. Geogr. 2015, 63, 1–8. [Google Scholar] [CrossRef]
  22. Hansen, M.C.; Wang, L.; Song, X.P.; Tyukavina, A.; Turubanova, S.; Potapov, P.V.; Stehman, S.V. The fate of tropical forest fragments. Sci. Adv. 2020, 6, eaax8574. [Google Scholar] [CrossRef] [Green Version]
  23. Matricardi, E.A.T.; Skole, D.L.; Costa, O.B.; Pedlowski, M.A.; Samek, J.H.; Miguel, E.P. Long-term forest degradation surpasses deforestation in the Brazilian Amazon. Science 2020, 369, 1378–1382. [Google Scholar] [CrossRef] [PubMed]
  24. Montoya, A.D.V.; de Lima, A.M.M.; Adami, M. Analysis of the land cover around a hydroelectric power plant in the Brazilian Amazon. Anu. Inst. Geociênc. 2019, 42, 74–86. [Google Scholar] [CrossRef]
  25. Montoya, A.D.V.; de Lima, A.M.M.; Adami, M. Mapping and temporary analysis of the landscape in the Tucuruí-pa reservoir surroundings. Anu. Inst. Geociênc. 2018, 41, 553–567. [Google Scholar] [CrossRef]
  26. La Rovere, E.L.; Mendes, F.E. Tucuruí Hydropower Complex. 2000. Available online: https://www.internationalrivers.org/sites/default/files/attached-files/csbrmain.pdf (accessed on 17 June 2020).
  27. Fearnside, P.M. Análisis de los Principales Proyectos Hidro-Energéticos en la Región Amazónica; DAR, CLAES: Lima, Peru, 2014. [Google Scholar]
  28. Fearnside, P.M. Social Impacts of Brazil’s Tucuruí Dam. Environ. Manag. 1999, 24, 483–495. [Google Scholar] [CrossRef] [PubMed]
  29. Ministério do Planejamento. 11° Balanço Completo do PAC—4 Anos (2007–2010); Ministério do Planejamento: Brasília, Brazil, 2012. Available online: http://pac.gov.br/pub/up/relatorio/b701c4f108d61bf921012944fb273e36.pdf (accessed on 15 June 2020).
  30. Furtado, G.C.A.; Mesquita, A.L.A.; Morabito, A.; Hendrick, P.; Hunt, J.D. Using hydropower waterway locks for energy storage and renewable energies integration. Appl. Energy 2020, 275, 115361. [Google Scholar] [CrossRef]
  31. Gutman, G.; Huang, C.; Chander, G.; Noojipady, P.; Masek, J.G. Assessment of the NASA–USGS Global Land Survey (GLS) datasets. Remote Sens. Environ. 2013, 134, 249–265. [Google Scholar] [CrossRef]
  32. Instituto Nacional de Pesquisas Espaciais. TerraAmazon; INPE: São Jose dos Campos, Brazil, 2016; Available online: http://www.terraamazon.dpi.inpe.br/ (accessed on 2 September 2018).
  33. University of California. PostgreSQL; UC: Berkeley, CA, USA, 2012; Available online: https://www.postgresql.org/ (accessed on 2 September 2018).
  34. Instituto Brasileiro de Geografia e Estatística. Malhas Digitais: 2015; IBGE: Río de Janeiro, Brazil, 2015. Available online: https://mapas.ibge.gov.br/ (accessed on 2 June 2018).
  35. Shimabukuro, Y.E.; Mello, E.M.; Moreira, J.C.; Duarte, V. Fraction images derived from Terra Modis data for mapping burnt areas in Brazilian Amazonia. Int. J. Remote Sens. 2009, 30, 1537–1546. [Google Scholar] [CrossRef]
  36. Shimabukuro, Y.E.; Batista, G.T.; Mello, E.M.K.; Moreira, J.C.; Duarte, V. Using shade fraction image segmentation to evaluate deforestation in Landsat Thematic Mapper images of the Amazon Region. Int. J. Remote Sens. 1998, 19, 535–541. [Google Scholar] [CrossRef] [Green Version]
  37. Vasconcelos, C.H.; de Novo, E.M.L.M. Mapeamento do uso e cobertura da terra a partir da segmentação e classificação de imagens-fração solo, sombra e vegetação derivadas do modelo linear de mistura aplicado a dados do sensor TM/Landsat5, na região do reservatório de Tucuruí—PA. Acta Amaz. 2004, 34, 487–493. [Google Scholar] [CrossRef] [Green Version]
  38. Camara, G.; Valeriano, D.; Vianei, J. Metodologia para o Cálculo da Taxa Anual de Desmatamento na Amazônia Legal; INPE: São Jose dos Campos, Brazil, 2013; Available online: http://www.obt.inpe.br/OBT/assuntos/programas/amazonia/prodes/pdfs/metodologia_taxaprodes-1.pdf (accessed on 2 June 2018).
  39. Souza, A.; Monteiro, A.M.V.; Rennó, C.D.; Almeida, C.A.; de Valeriano, D.M.; Morelli, F.; Vinhas, L.; Maurano, L.E.P.; Adami, M.; Escada, M.I.S.; et al. Metodologia Utilizada nos Projetos PRODES e DETER; INPE: São Jose dos Campos, Brazil, 2019; Available online: http://www.obt.inpe.br/OBT/assuntos/programas/amazonia/prodes (accessed on 15 June 2020).
  40. Environmental Systems Research Institute. ArcGIS Desktop; ESRI: Redlands, CA, USA, 2018; Available online: https://desktop.arcgis.com/es/ (accessed on 24 June 2018).
  41. Nogueira, E.M.; Fearnside, P.M.; Nelson, B.W.; Barbosa, R.I.; Keizer, E.W.H. Estimates of forest biomass in the Brazilian Amazon: New allometric equations and adjustments to biomass from wood-volume inventories. For. Ecol. Manag. 2008, 256, 1853–1867. [Google Scholar] [CrossRef]
  42. Xu, X.; Xie, Y.; Qi, K.; Luo, Z.; Wang, X. Detecting the response of bird communities and biodiversity to habitat loss and fragmentation due to urbanization. Sci. Total Environ. 2018, 624, 1561–1576. [Google Scholar] [CrossRef] [PubMed]
  43. Dutta, S.; Dutta, I.; Das, A.; Guchhait, S.K. Quantification and mapping of fragmented forest landscape in dry deciduous forest of Burdwan Forest Division, West Bengal, India. Trees For. People 2020, 2, 100012. [Google Scholar] [CrossRef]
  44. Hietala-Koivu, R.; Lankoski, J.; Tarmi, S. Loss of biodiversity and its social cost in an agricultural landscape. Agric. Ecosyst. Environ. 2004, 103, 75–83. [Google Scholar] [CrossRef]
  45. McGarigal, K.; Marks, B.J. FRAGSTATS: Spatial Pattern Analysis Program for Quantifying Landscape Structure; U.S. Department of Agriculture, Forest Service, Pacific Northwest Research Station: Portland, OR, USA, 1995. Available online: https://www.fs.usda.gov/treesearch/pubs/3064 (accessed on 22 June 2018).
  46. McGarigal, K.; Cushman, S.A.; Neel, M.C.; Ene, E. FRAGSTATS: Spatial Pattern Analysis Program for Categorical Maps; University of Massachusetts: Amherst, MA, USA, 2002; Available online: https://www.umass.edu/landeco/ (accessed on 2 September 2018).
  47. Pinheiro, T.F.; Escada, M.I.S.; Valeriano, D.M.; Hostert, P.; Gollnow, F.; Müller, H. Forest Degradation Associated with Logging Frontier Expansion in the Amazon: The BR-163 Region in Southwestern Pará, Brazil. Earth Interact. 2016, 20, 1–26. [Google Scholar] [CrossRef]
  48. Fearnside, P.M. Amazon Forest maintenance as a source of environmental services. An. Acad. Bras. Cienc. 2008, 80, 101–114. [Google Scholar] [CrossRef] [Green Version]
  49. Carvalho, T.S.; Magalhães, A.S.; Domingues, E.P. Desmatamento e a contribuição econômica da floresta na Amazônia. Estudos Econ. 2016, 46, 499–531. [Google Scholar] [CrossRef] [Green Version]
  50. de Rocha, G.M. Todos Convergem para o lago: Hidrelétrica Tucuruí, Municípios e Territórios na Amazônia; NUMA, UFPA: Belém, Brazil, 2008. [Google Scholar]
  51. Instituto Brasileiro do Meio Ambiente e dos Recursos Naturais Renováveis. Lei dos Crimes Ambientais, no 9.605, de 12 de Fevereiro de 1998 e Decreto no 6.514, de 22 de Julho de 2008; Diário Oficial da União: Brasília, Brazil, 2014. Available online: https://www.fob.org.br/Pdfs/Resolucoes/LEI_9.605.pdf (accessed on 30 June 2018).
  52. Assunção, J.; Gandour, C.; Rocha, R. Deforestation slowdown in the Brazilian Amazon: Prices or policies? Environ. Dev. Econ. 2015, 20, 697–722. [Google Scholar] [CrossRef] [Green Version]
  53. Instituto Nacional de Pesquisas Espaciais. Monitoramento do Desmatamento da Floresta Amazônica Brasileira por Satélite; INPE: São José dos Campos, Brazil, 2020; Available online: http://www.obt.inpe.br/OBT/assuntos/programas/amazonia/prodes (accessed on 20 September 2020).
  54. Laurance, W.F.; Vasconcelos, H.L. Ecological consequences of forest fragmentation in the amazon. Oecol. Bras. 2009, 13, 434–451. [Google Scholar] [CrossRef]
  55. Laurance, W.F.; Camargo, J.L.C.; Luizão, R.C.C.; Laurance, S.G.; Pimm, S.L.; Bruna, E.M.; Stouffer, P.C.; Bruce Williamson, G.; Benítez-Malvido, J.; Vasconcelos, H.L.; et al. The fate of Amazonian forest fragments: A 32-year investigation. Biol. Conserv. 2011, 144, 56–67. [Google Scholar] [CrossRef]
  56. Haddad, N.M.; Brudvig, L.A.; Clobert, J.; Davies, K.F.; Gonzalez, A.; Holt, R.D.; Lovejoy, T.E.; Sexton, J.O.; Austin, M.P.; Collins, C.D.; et al. Habitat fragmentation and its lasting impact on Earth’s ecosystems. Sci. Adv. 2015, 1, e1500052. [Google Scholar] [CrossRef] [Green Version]
  57. Assembléia Legislativa do Estado do Pará. Cria Unidades de Conservação da Natureza na Região do Lago de Tucuruí no Território sob Jurisdição do Estado do Pará, e dá Outras Providências; Assembléia Legislativa do Estado do Pará: Belém, Brazil, 2002. Available online: http://www.ideflorbio.pa.gov.br/wp-content/uploads/2015/09/Lei-de-Criação-UCs-do-lago-de-Tucuruí.pdf (accessed on 30 June 2018).
Figure 1. Location of the study area: the lake of Tucuruí and the radius of 30 km around the reservoir.
Ijgi 09 00583 g001
Figure 2. Thematic maps of land-cover within the 30 km radius of Lake Tucuruí in the five scenarios from 1984 to 2017.
Ijgi 09 00583 g002
Figure 3. The percentage of forest per year in the six buffer rings surrounding the flooded area. The data belong to the scenarios of 1984, 1988, 1999, 2010, and 2017, for the entire study area, and part of the municipalities of Tucuruí, Breu Branco, Goianésia do Pará, Jacundá, Nova Ipixuna, Novo Repartimento, and Itupiranga. B0–5—Buffer from 0 km to 5 km; B5–10—Buffer from 5 km to 10 km; B10–15—Buffer from 10 km to 15 km; B15–20—Buffer from 15 km to 20 km; B20–25—Buffer from 20 km to 25 km; and B25–30—Buffer from 25 km to 30 km.
Ijgi 09 00583 g003
Figure 4. Landscape change as measured by landscape-level metrics from 1984 to 2017.
Ijgi 09 00583 g004
Figure 5. Habitats loss and fragmentation as measured by class-level metrics from 1984 to 2017.
Ijgi 09 00583 g005
Table 1. Images (scenes) from the Landsat satellite used to map the deforestation.
Path/Row19841988199920102017
223/63 27 July22 July13 July5 September6 July
223/6411 July22 July21 July3 July6 July
224/6222 October14 August28 July26 July13 July
224/6331 May14 August5 August26 July13 July
224/6431 May29 July28 July26 July13 July
Table 2. Transition matrix of land-cover from 1984–1988, 1988–1999, 1999–2010, and 2010–2017, within 30 km of Lake Tucuruí, with areas in hectares (ha).
Land Cover 1984
Land Cover 1988HydrographyFlooded AreaUrban AreaForestAnthropizedCloudTotal (b)Var. (b-a)
Hydrography7131550368569138136−781
Flooded area57737,279320185,38646,5416012276,115238,386
Urban area35678019523151379267
Forest2753501,124,96756721,125,846−374,726
Anthropized89835313189,085293,0615856489,266147,864
Cloud00074614135922−11,011
Total (a)891637,72811131,500,572341,40211,9331,901,664
Permanence80%99%70%75%86%0%
Land Cover 1988
Land Cover 1999HydrographyFlooded AreaUrban AreaForestAnthropizedCloudTotal (b)Var. (b-a)
Hydrography748335542685508805669
Flooded area1258,7030410314507264,264−11,850
Urban area561357761005024491069
Forest20552810710,22115,733298731,738−394,108
Anthropized44312,09017411,021470,222616894,409405,143
Cloud0000000−922
Total (a)8136276,11413791,125,846489,2669221,901,664
Permanence92%94%98%63%96%0%
Land Cover 1999
Land Cover 2010HydrographyFlooded AreaUrban AreaForestAnthropizedCloudTotal (b)Var. (b-a)
Hydrography7803413269133509425620
Flooded area9253,8995278559900262,688−1577
Urban area811231711834041721723
Forest14515180464,59917,0450483,307−248,431
Anthropized8398832114264,084868,20401,142,072247,664
Cloud00000000
Total (a)8805264,2642449731,738894,40901,901,664
Permanence89%96%95%63%97%0%
Land Cover 2010
Land Cover 2017HydrographyFlooded AreaUrban AreaForestAnthropizedCloudTotal (b)Var. (b-a)
Hydrography7761133348179309935511
Flooded area64260,24938410326,5380290,99228,304
Urban area6240991101205120948
Forest10911580406,59310,2810418,141−65,167
Anthropized14851277272,2621,102,45001,177,47635,403
Cloud00000000
Total (a)9425262,6884172483,3071,142,07301,901,664
Permanence82%99%98%84%97%0%
Table 3. Amount of forest area and deforestation area in hectares (ha), cumulative deforestation rates in the period and relative annual deforestation rates in percentage (%), and carbon emissions from deforestation (Gg C) within a 30 km ring of Lake Tucuruí. ADR = annual deforestation rates.
Year (t)Forest [ha]
(f)
Deforestation [ha]Cumulative Deforestation Rates [%]ADR [%]Carbon Emissions from Deforestation
[Gg C]
19841,500,572341,402--52,308.25
19881,125,846374,72625.05.757,414.02
1999731,738394,10835.02.860,383.65
2010483,307248,43134.02.738,063.60
2017418,14165,16613.51.89,984.47

