Article

Urban Green Accessibility Index: A Measure of Pedestrian-Centered Accessibility to Every Green Point in an Urban Area

KAIST Urban Design Lab, KAIST Smart City Research Center, Department of Civil and Environmental Engineering, KAIST, Daejeon 34141, Korea
*
Author to whom correspondence should be addressed.
ISPRS Int. J. Geo-Inf. 2020, 9(10), 586; https://0-doi-org.brum.beds.ac.uk/10.3390/ijgi9100586
Submission received: 22 July 2020 / Revised: 19 September 2020 / Accepted: 4 October 2020 / Published: 6 October 2020
(This article belongs to the Special Issue Geodata Science and Spatial Analysis in Urban Studies)

Abstract

:
Advancements in remote sensing techniques and urban data analysis tools have enabled the successful monitoring and detection of green spaces in a city. This study aims to develop an index called the urban green accessibility (UGA) index, which measures people’s accessibility to green space and represents the citywide or local characteristics of the distribution pattern of green space. The index is defined as the sum of pedestrians’ accessibility to all vegetation points, which consists of the normalized difference vegetation index (NDVI) with integration and choice values from angular segment analysis. In this study, the proposed index is tested with cases of New York, NY, and San Francisco, CA, in the US. The results reveal differences based on the significance of streets. When analysis ranges are on a neighborhood scale, a few hotspots appear in well-known green areas on commonly accessible streets and in local neighborhood parks on residential blocks. The appearance of high-accessibility points in low-NDVI areas implies the potential of the efficient and proper distribution of green spaces for pedestrians. The proposed measure is expected to help in planning and managing green areas in cities, taking people’s accessibility and spatial relationships into consideration.

1. Introduction

Green space is one of the most essential elements relevant to the environmental and socioeconomic aspects of a city, such as social class or urban development. De Ridder et al. [1] verified the role of green space in improving the urban environment in European cities. The positive effect of green space on the strength of social bonding [2] and public health [3,4] has also been confirmed in earlier studies. Although the complexity of the nature–health relationship makes establishing causality a difficult task [5], a review on extant research has indicated that natural environment can promote population health in terms of air quality, physical activity, social cohesion and stress reduction [6]. Triguero-Mas et al. [7] evaluated the relationships and mechanics between natural outdoor environments and health using the interview data in Catalonia, Spain, and concluded that green spaces are positively associated with general and mental health. In response to the importance of green space in city landscapes, measuring the accessibility to urban green space has been a major issue for urban researchers [8,9]. For instance, the accessibility gap between different social groups in the UK [10] and an unbalanced distribution of urban green spaces within Africa [11] were identified in previous research. Walkability has also been a crucial concept in determining how pedestrian-friendly and accessible urban green space is, in relation to the improvement of public health and equality in park supply [12,13].
However, previous studies that measured access to urban green space have two common limitations. First, accessibility studies have thus far mostly been carried out based on the distance between population points and green area [14,15,16]. Distance-dependent measurement is insufficient in explaining different factors that affect people’s access to green areas. Second, although urban green elements exist in various forms (i.e., tree canopy, bush, lawn), polygon-type green space, primarily parks, has only been included in the analysis for reasons related to the ease of data collection [17,18,19]. Due to such limitations, increasing green space has been commonly suggested as one of the most direct strategies to improve provision of green space in cities. Furthermore, the limited scope of analysis has overlooked the complex nature of the relationship between people and green space, especially in access situations.
Meanwhile, the recent trend of providing open source data has opened up possibilities for the extensive use of high-resolution aerial images and various spatial data to monitor and evaluate the urban environment. Digital orthophotography was found to be effective in analyzing the distribution of the urban tree canopy [20,21,22], and street view imagery has become a promising as well as efficient source to assess street-level environment at eye-level [23,24]. Furthermore, advancements in geographic information systems (GIS) technology have enabled the integration of various sources of geospatial information to assess accessibility in connection with the behavioral patterns of people or the city’s physical or socioeconomic aspects [25]. In particular, space syntax theory, which interprets the configuration of urban space as a network of street segments and their connections [26,27,28,29], is becoming widely accepted in the fields of architecture and urban studies. Space syntax measures that result from the network analysis of either street segment maps or axial maps are used to explain and predict pedestrian movements in cities [30,31,32,33].
In this sense, there is a growing need for studies on how to utilize such advanced research methods in an urban context to effectively evaluate the amount and distribution of urban green space by associating it with the spatial structure of cities. Network analysis has been one of the most powerful tools to assess green space accessibility. Chen and Chang [34] constructed a network of bus stops in Hong Kong and suggested an optimization strategy that can help achieve equity in access to green space. Ye et al. [35] calculated the green view index from Google Street View images and combined it with a space syntax measure as a human-scale measurement of street greenery, in order to support urban planning decisions by comparing the result with a top-down measurement approach.
Building upon previous studies, we aim to develop an analytical model of people’s accessibility to green space in everyday lives by means of various indicators that explain the influence of greenness and street network characteristics. The distinctive approach in this study is to integrate multiple variables into individual green points that appear in the urban landscape, so that all forms of green space can be comprehensively covered in analysis. To achieve the research objective, this research was designed with two parts: developing the urban green accessibility (UGA) index and applying the urban green accessibility (UGA) index to the study area. Specifically, the normalized difference vegetation index (NDVI) and space syntax measures were obtained through a raster analysis of aerial images and an angular segment analysis of the street network, respectively, and included in the model. Then, we proceed by applying the developed model to the cases of New York and San Francisco to reveal that considering greenness and street network factors in accessibility measurement better highlights the qualitative aspects of access to urban green spaces that disagree with the quantitative distribution of such spaces in the city. Our research makes several contributions to the existing literature. A new measure proposed in this study is expected to provide a more human-centered evaluation of accessibility to green spaces and help urban planners and designers establish better management strategies for urban green spaces that are more responsive to real access situations.

2. Model Development of the Urban Green Accessibility (UGA) Index
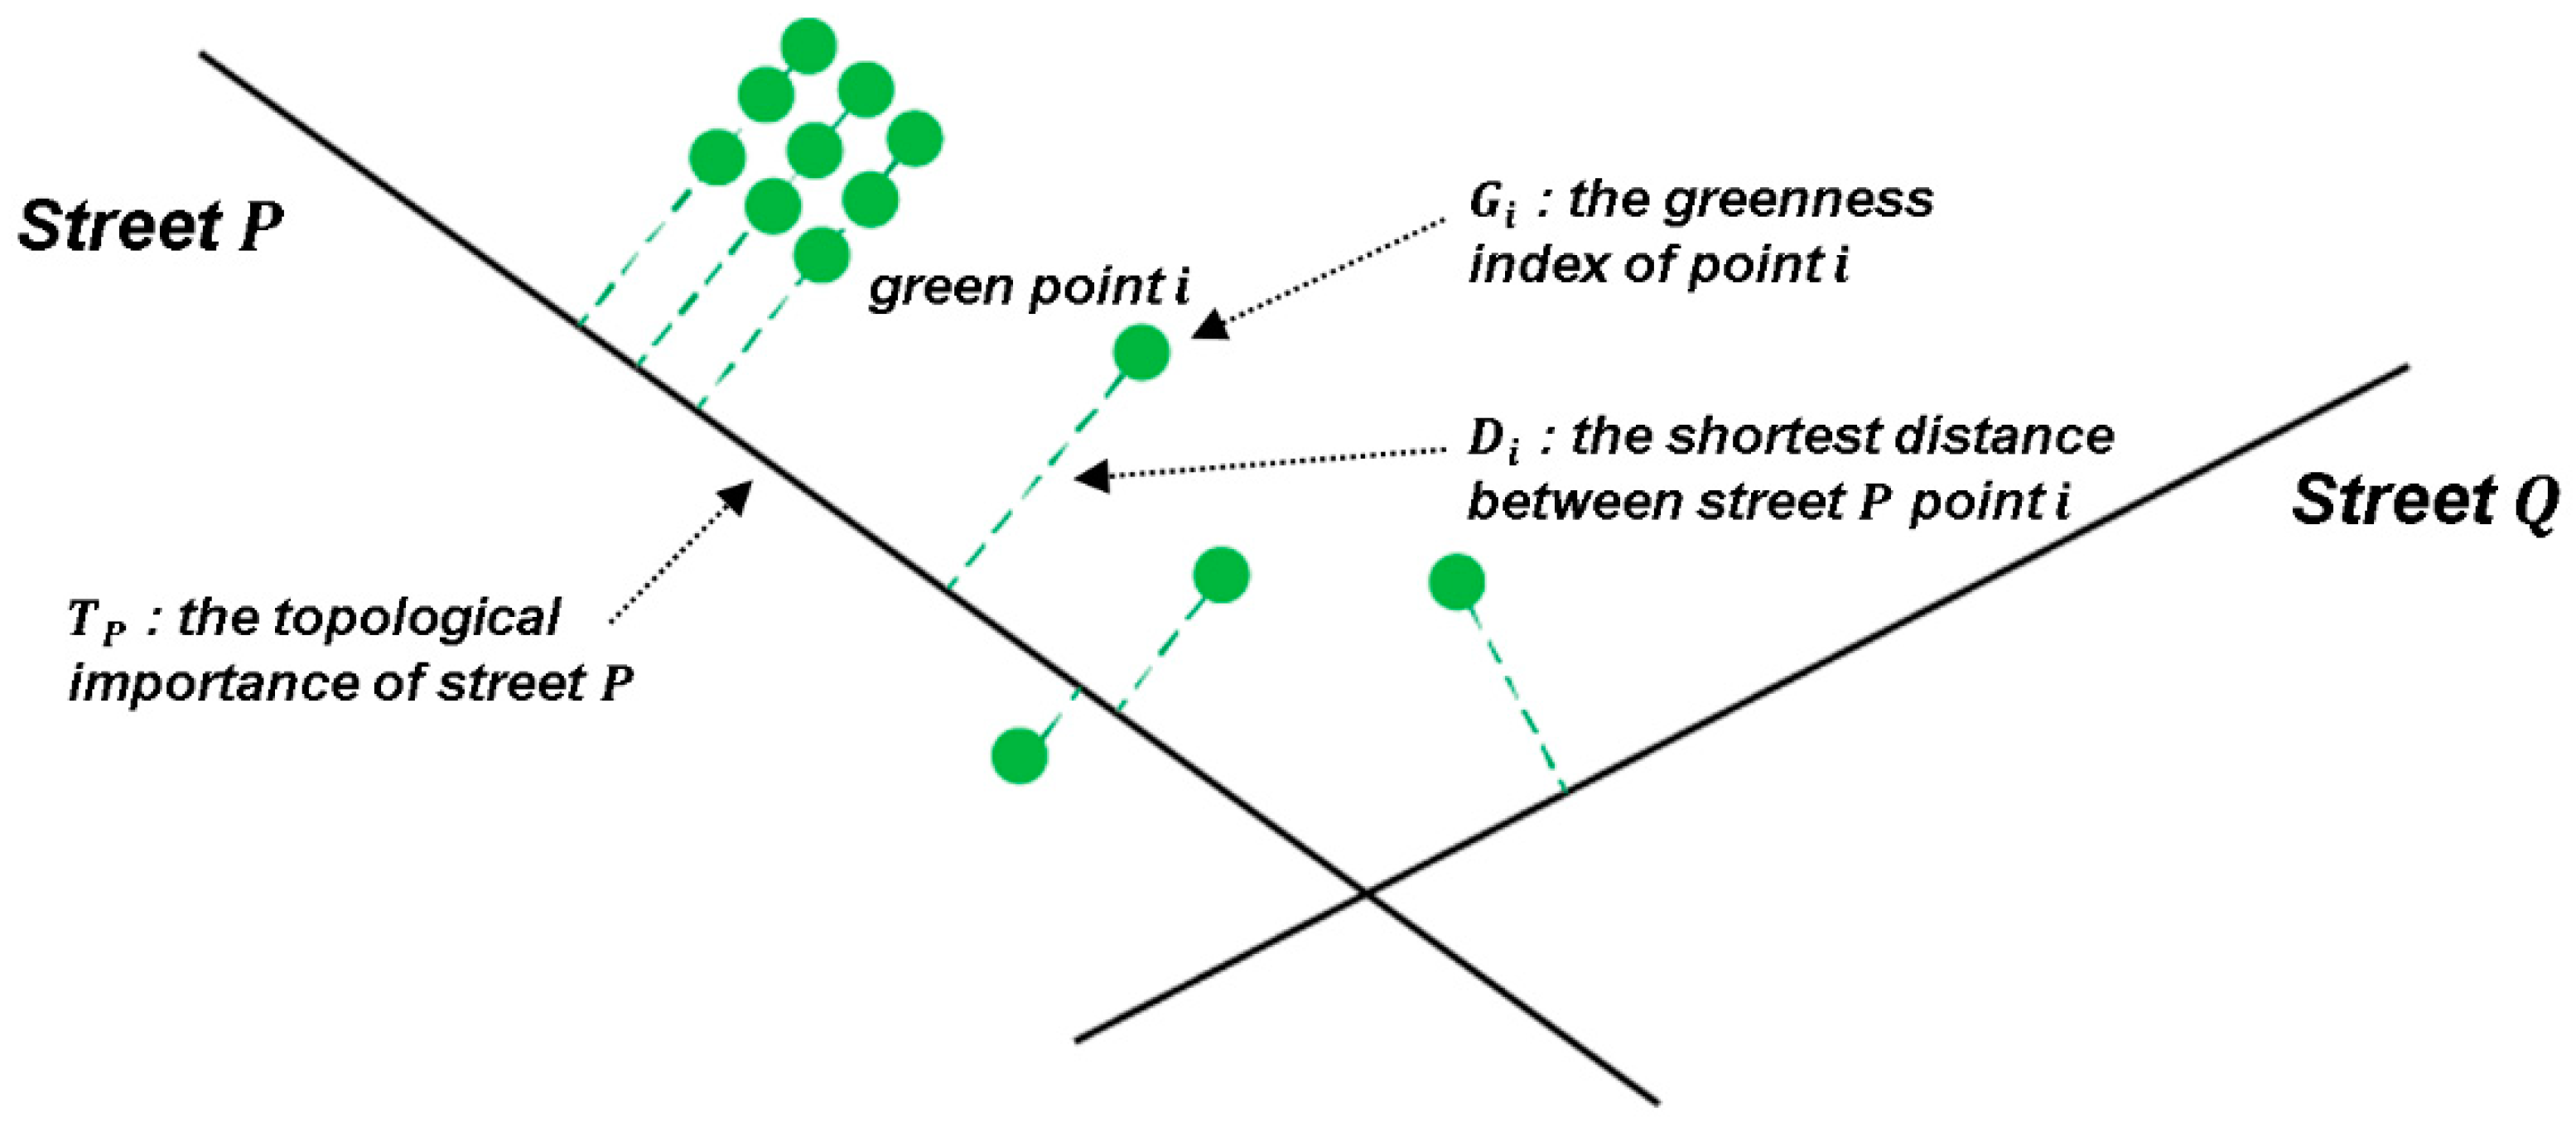
Following the research steps of each of the two parts, the first step was to develop the urban green accessibility (UGA) index. Accessibility, in its most basic form, is understood as the relative proximity of two points [36] and can be formulated using the following equation:
Accessibility i j = f ( w i , d i j )
where w i is the weight of point i , and d i j is the distance between points i and j . This definition connotes a positive correlation of the weight variable and a negative correlation of the distance variable with accessibility. In general, the weight variable describes the importance of a specific factor that is selected based on the study purpose. In other words, accessibility to a certain point increases with the weight factor value, while it decreases as it gets farther away. Therefore, to develop the urban green accessibility (UGA) index, this study began by defining variables that represent the weight and distance factors in actual access situations to green areas in an urban setting. In total, three variables, which are considered to affect accessibility, were included in the mathematical model: the greenness of individual green points, the distance to the nearest street segment, and the topological importance of the nearest street segment. The basic conception that explains the assumed access situation to green points in cities is visually represented in Figure 1. Here, although various transportation methods exist in cities, the model assumed and focused on pedestrians’ access situations, in order to measure the accessibility to green spaces that people naturally experience in their daily environment. People can simply approach green point i through a street segment that is adjacent to it and is in the nearest distance—taking either street P or street Q in the case in Figure 1. For each segment that constitutes the street network, a higher topological value represents higher traffic flow, which increases the possibility of people reaching target point i . In addition, it is plausible that the intensity of greenness can affect accessibility in a non-physical manner, especially in terms of people’s perception of how close they feel to green areas. As a result, we proposed an urban green accessibility (UGA) index that includes these relationships as follows:
UGA i =   T P × G i D i
Note that the distance factor is in a simple inverse relationship with accessibility. Although the power of distance parameter is commonly set to 2 in inverse distance weighting (IDW) to explain the distance decay between any two points in a two-dimensional space [37,38], we adopt the concept of geometric accessibility suggested by Jiang et al. [36] as access through linear segments of road network is assumed in this study.
Detailed information on the data collection and processing methods for each variable of the model is further described below and Table 1.

2.1. Greenness Index of Green Point i : G i

For the accessibility evaluation in the following parts of this study, the normalized difference vegetation index (NDVI) was applied for the greenness variable to highlight the importance and role of the green area itself as a measurement standard. This index is calculated as the ratio of the sum and difference between the spectral reflectance of near-infrared radiation and visible red light, which can be extracted from multiband aerial imagery [39]. During photosynthesis, the chlorophyll in the leaves of green plants is known to absorb visible light, while the cellular structure reflects near-infrared rays. For this reason, adjustments in the band settings of aerial images provide different results for parts with green and nongreen elements (e.g., snow, cloud, road, etc.): a pixel that contains a green element appears either dark under visible light radiation, due to absorption, or bright under near-infrared radiation, due to reflection, and vice versa for pixels with nongreen elements. As the NDVI is defined based on the biological characteristics of green plants, it has been widely applied in various studies that primarily monitored vegetation and environmental conditions via remote sensing techniques [40,41,42,43]. In this study, the NDVI value was measured for each pixel in the raster images of the study area via QGIS software, and those with NDVI values in the range of 0.3 to 0.8 were selected as green points [44].

2.2. Topological Importance of Street P : T P

The topology variable was defined as representing the importance that each street segment possesses within the urban street network. In this study, the choice and integration index derived from space syntax theory was applied. Space syntax is a series of theories and techniques that measure the configuration of urban space to analyze the relative accessibility and hierarchy of road segments based on the mutual topological relations within the entire road network [26,28]. Choice is useful for understanding the flow or movement of information between spaces and is calculated by the total number of shortest paths connecting any two segments in the region that pass through the target segment [45]. Integration is a value indicating the spatial depth from one space to another and is calculated by the reciprocal sum of the shortest distance between each road segment and all remaining road segments. Angular segment analysis was conducted in depthmapX software [46] to obtain the values for the T P variable that will represent the topology of street segments in the road network [31,47]. The analysis range was set to n (global), 400 m (1/4 mile), 800 m (1/2 mile) and 1600 m (1 mile) in the measurement of two indexes to compare the differences in accessibility between citywide and walking distance ranges.

2.3. The Shortest Distance between Street P and Green Point i : D i

To obtain the accessibility of green point i , we assumed that access is made through the road network formed in the city, and applied the shortest distance to the nearest street segment P to express the correlation between point i and segment P . The shortest distance variable D i was obtained by finding the vertically connecting points from green point i to street segment P using vector analysis tools in QGIS software.

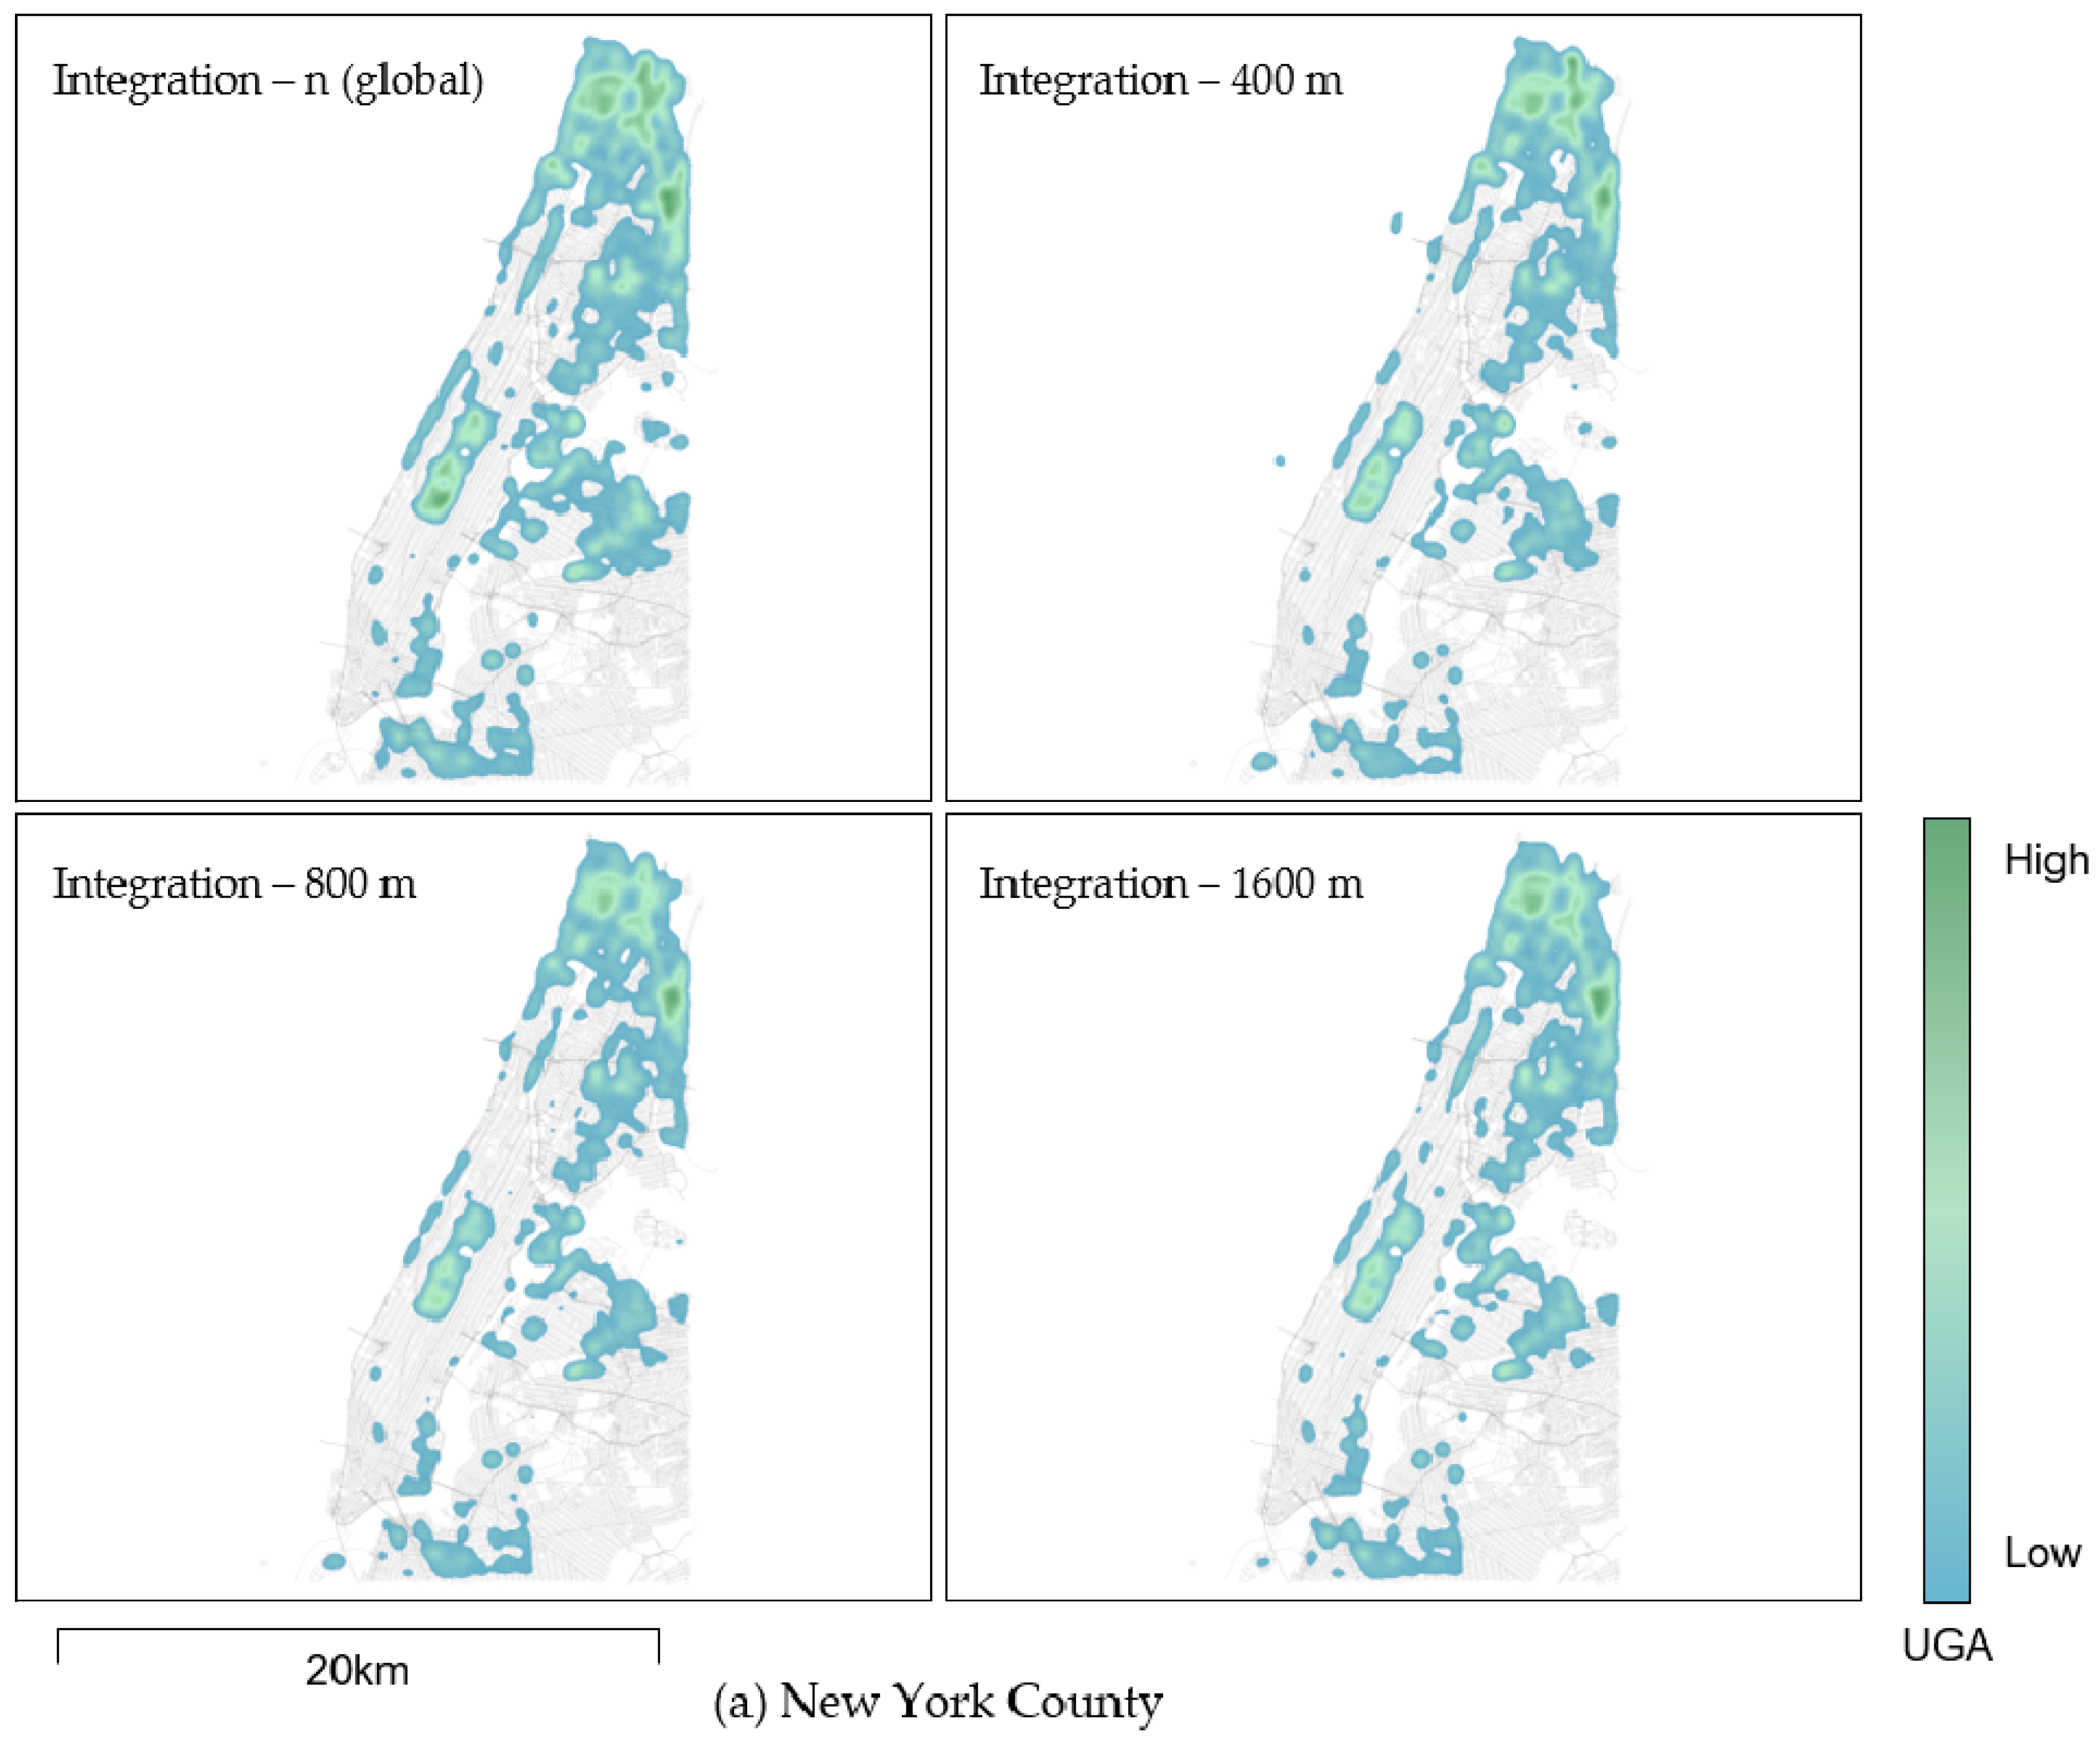
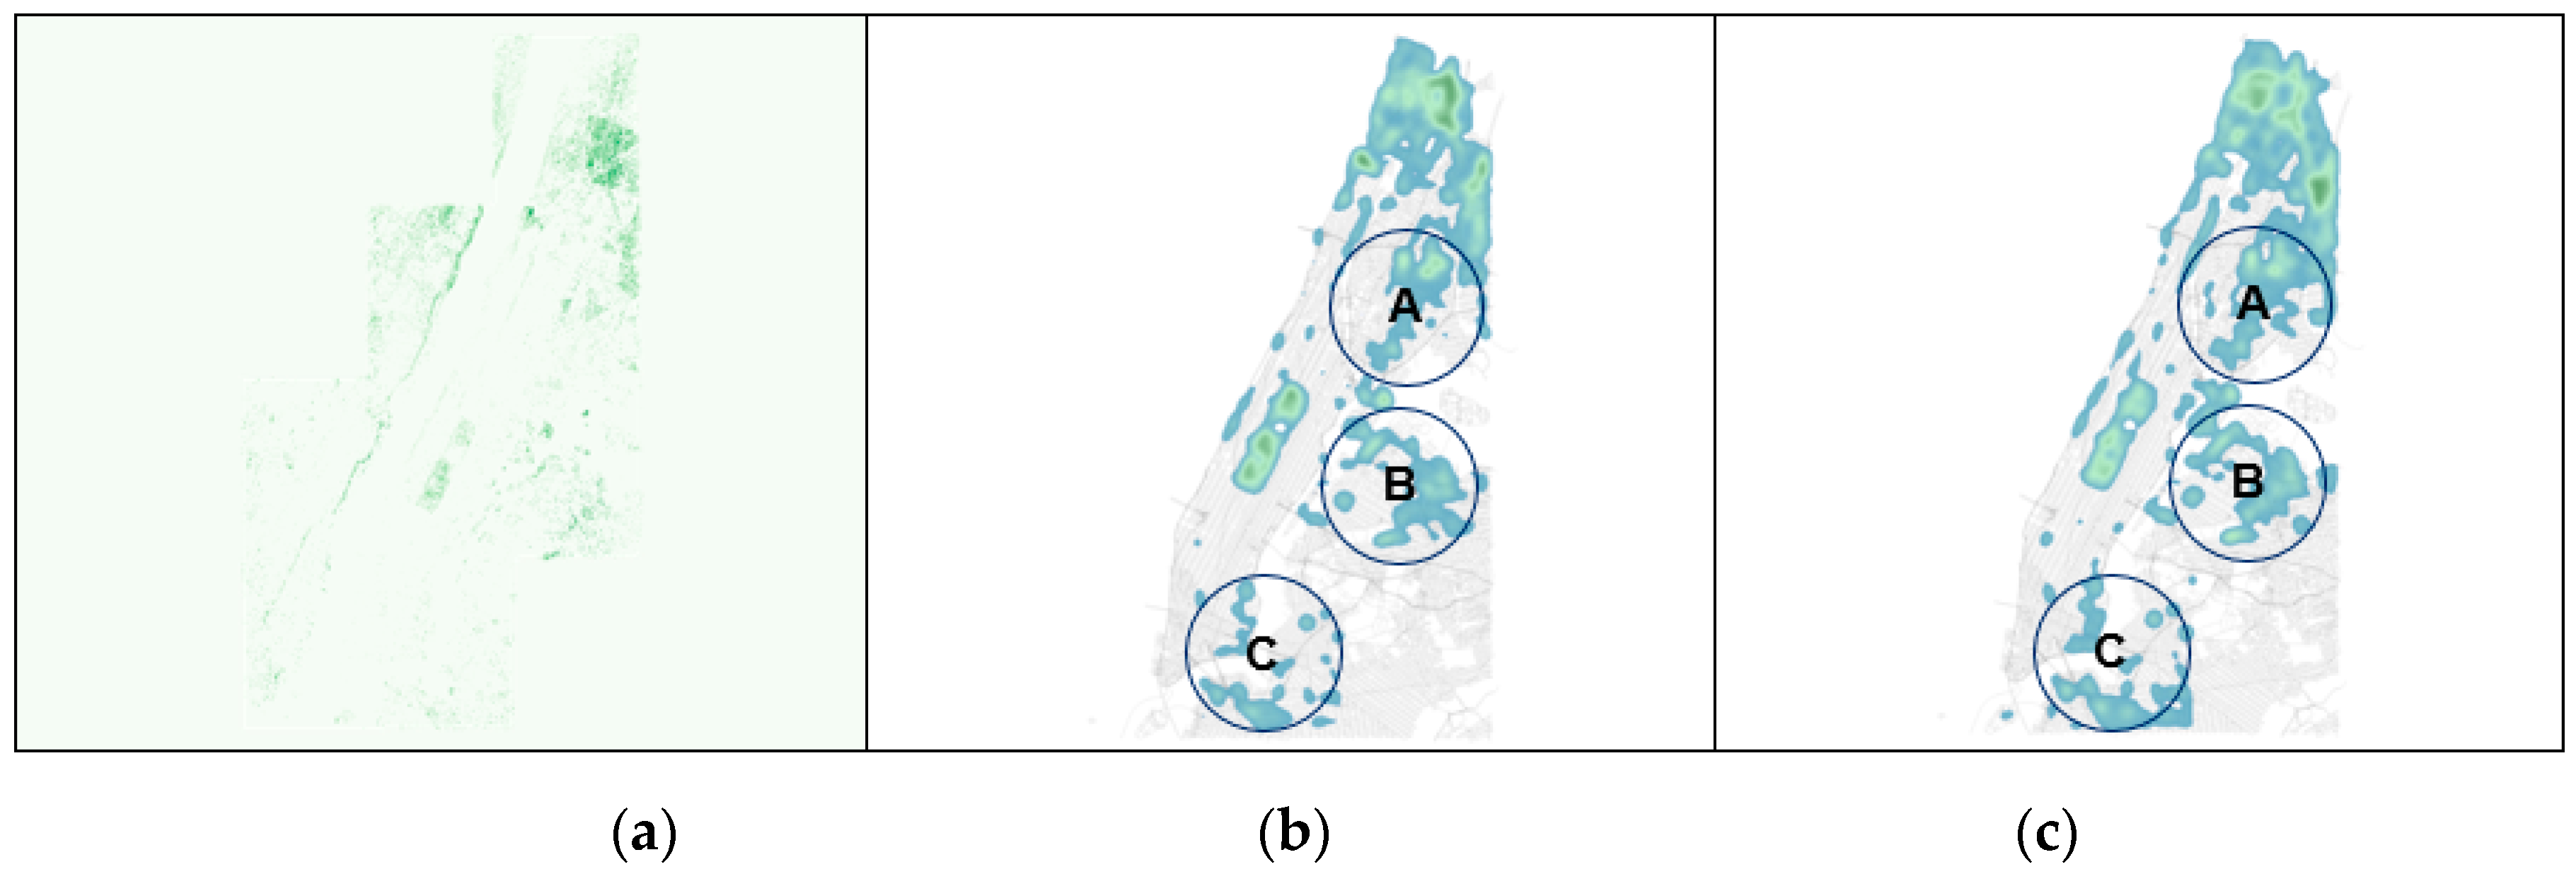
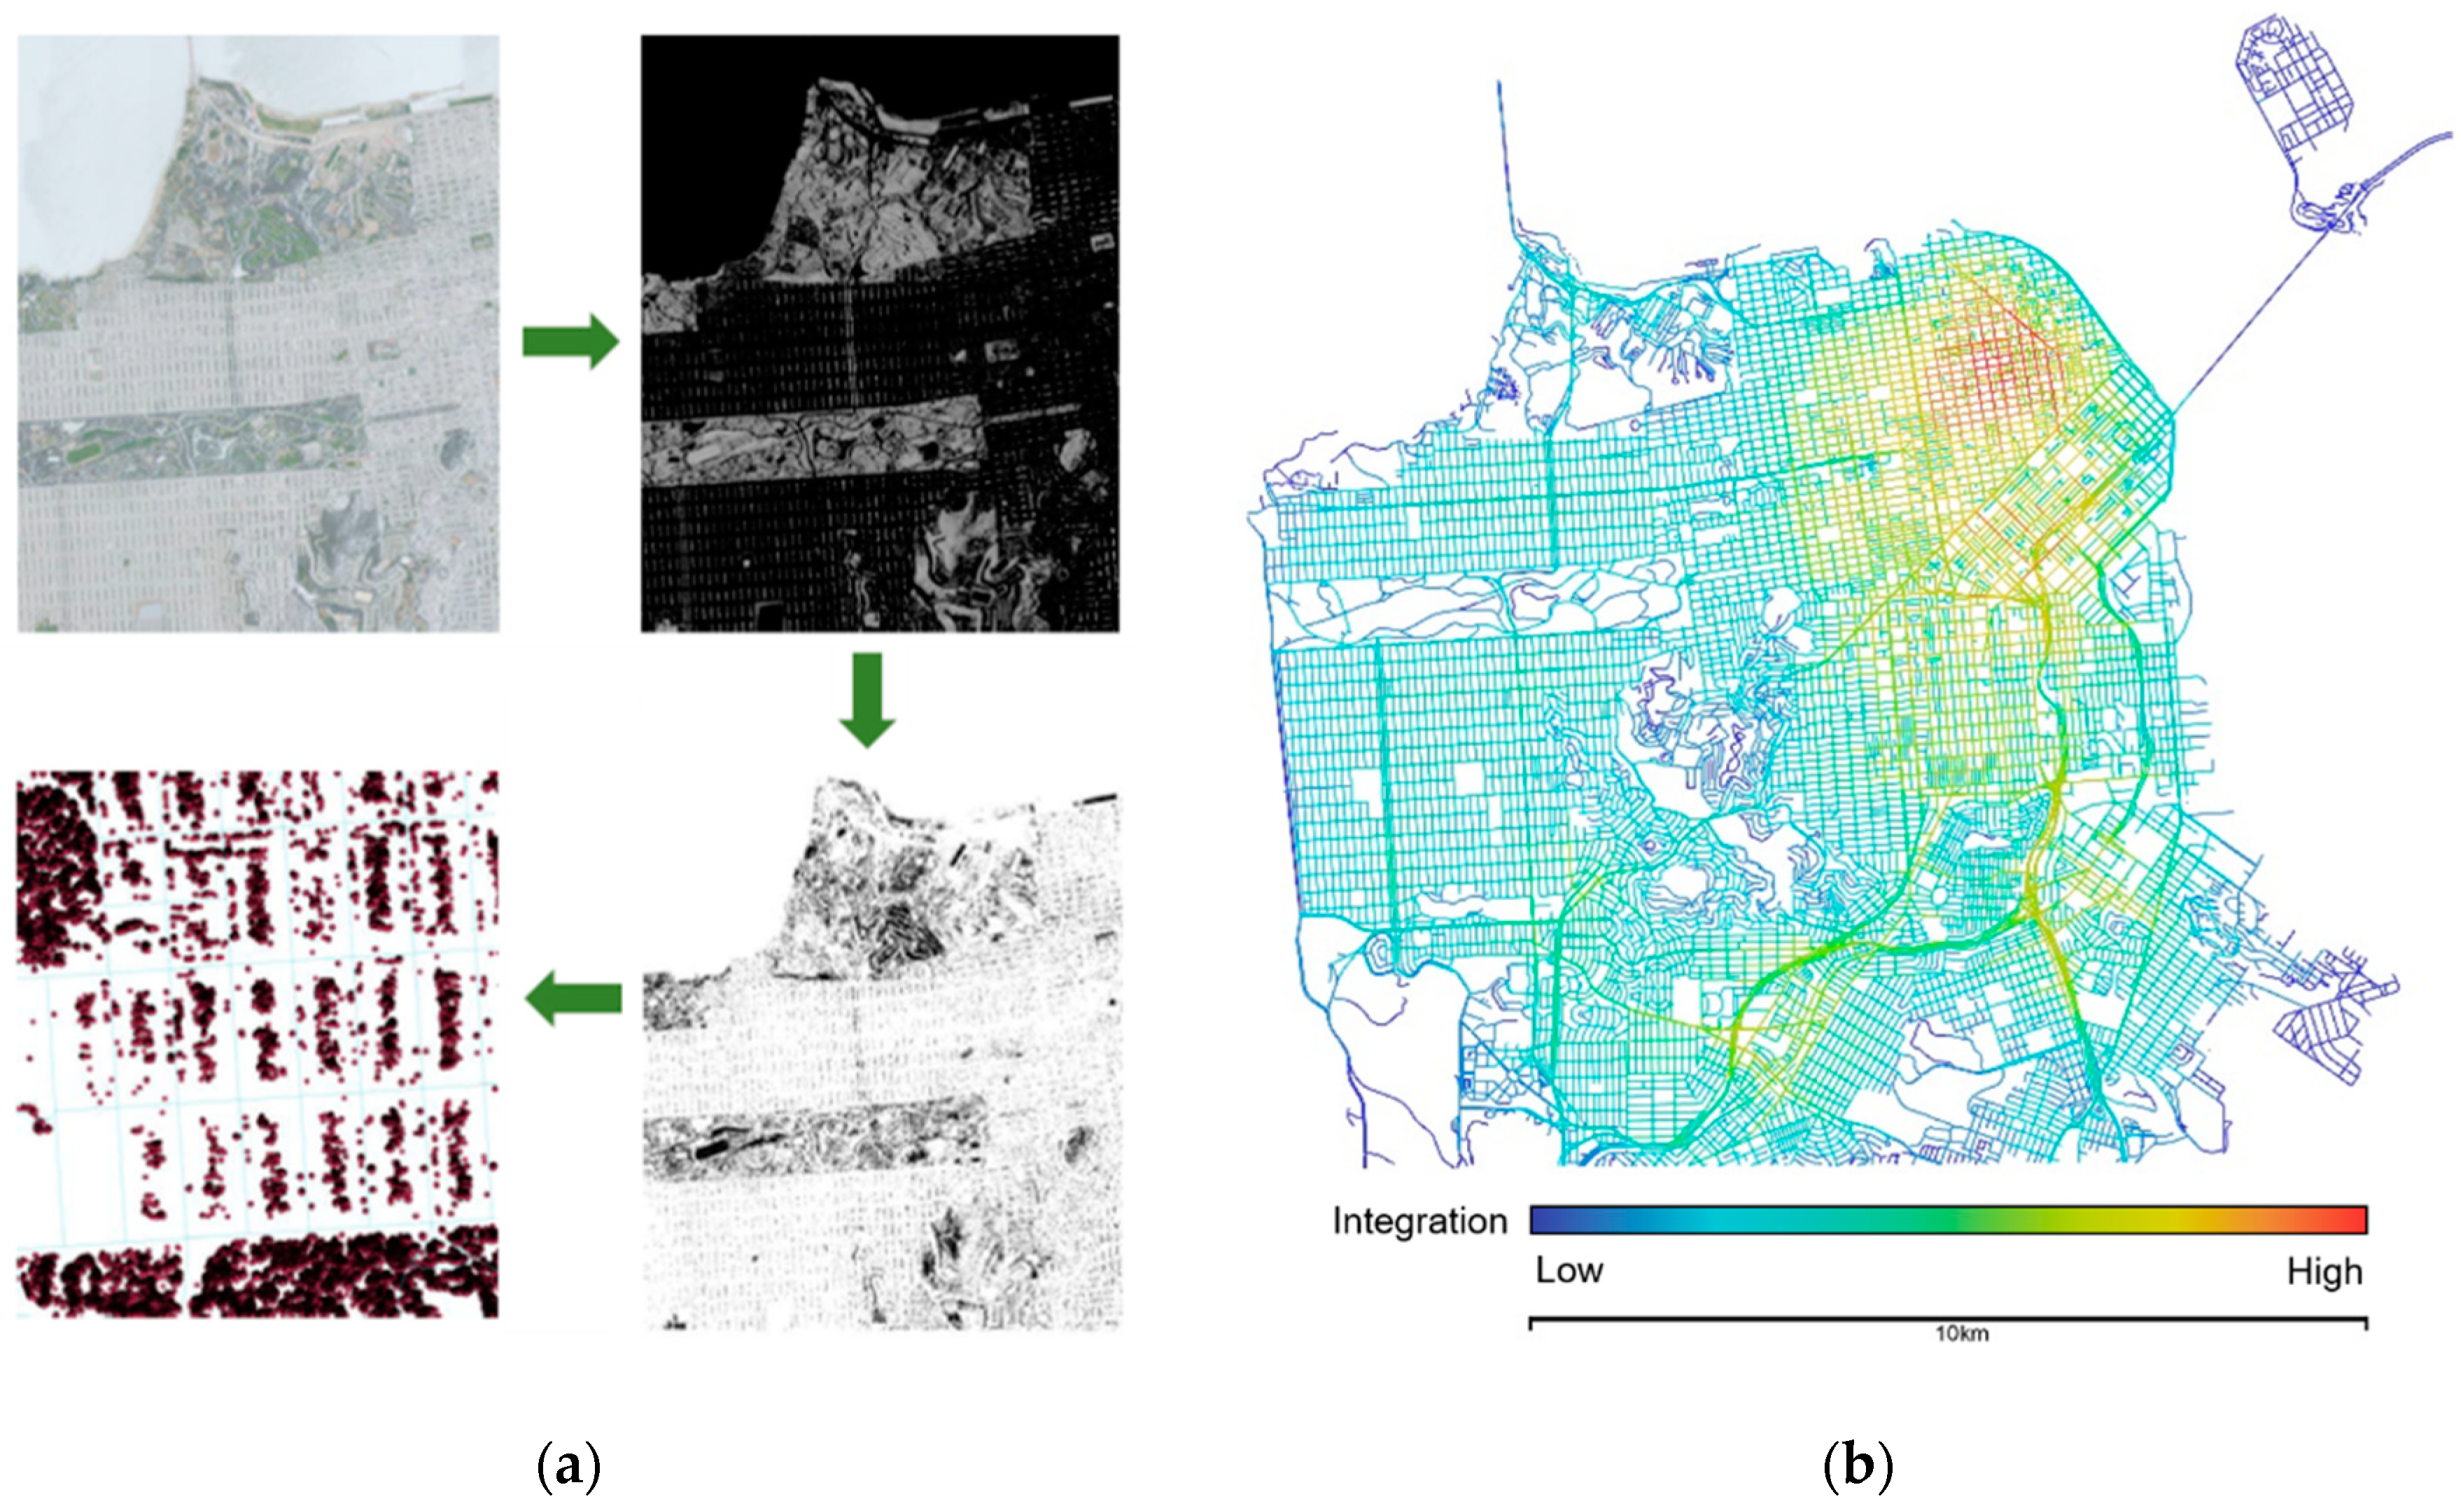
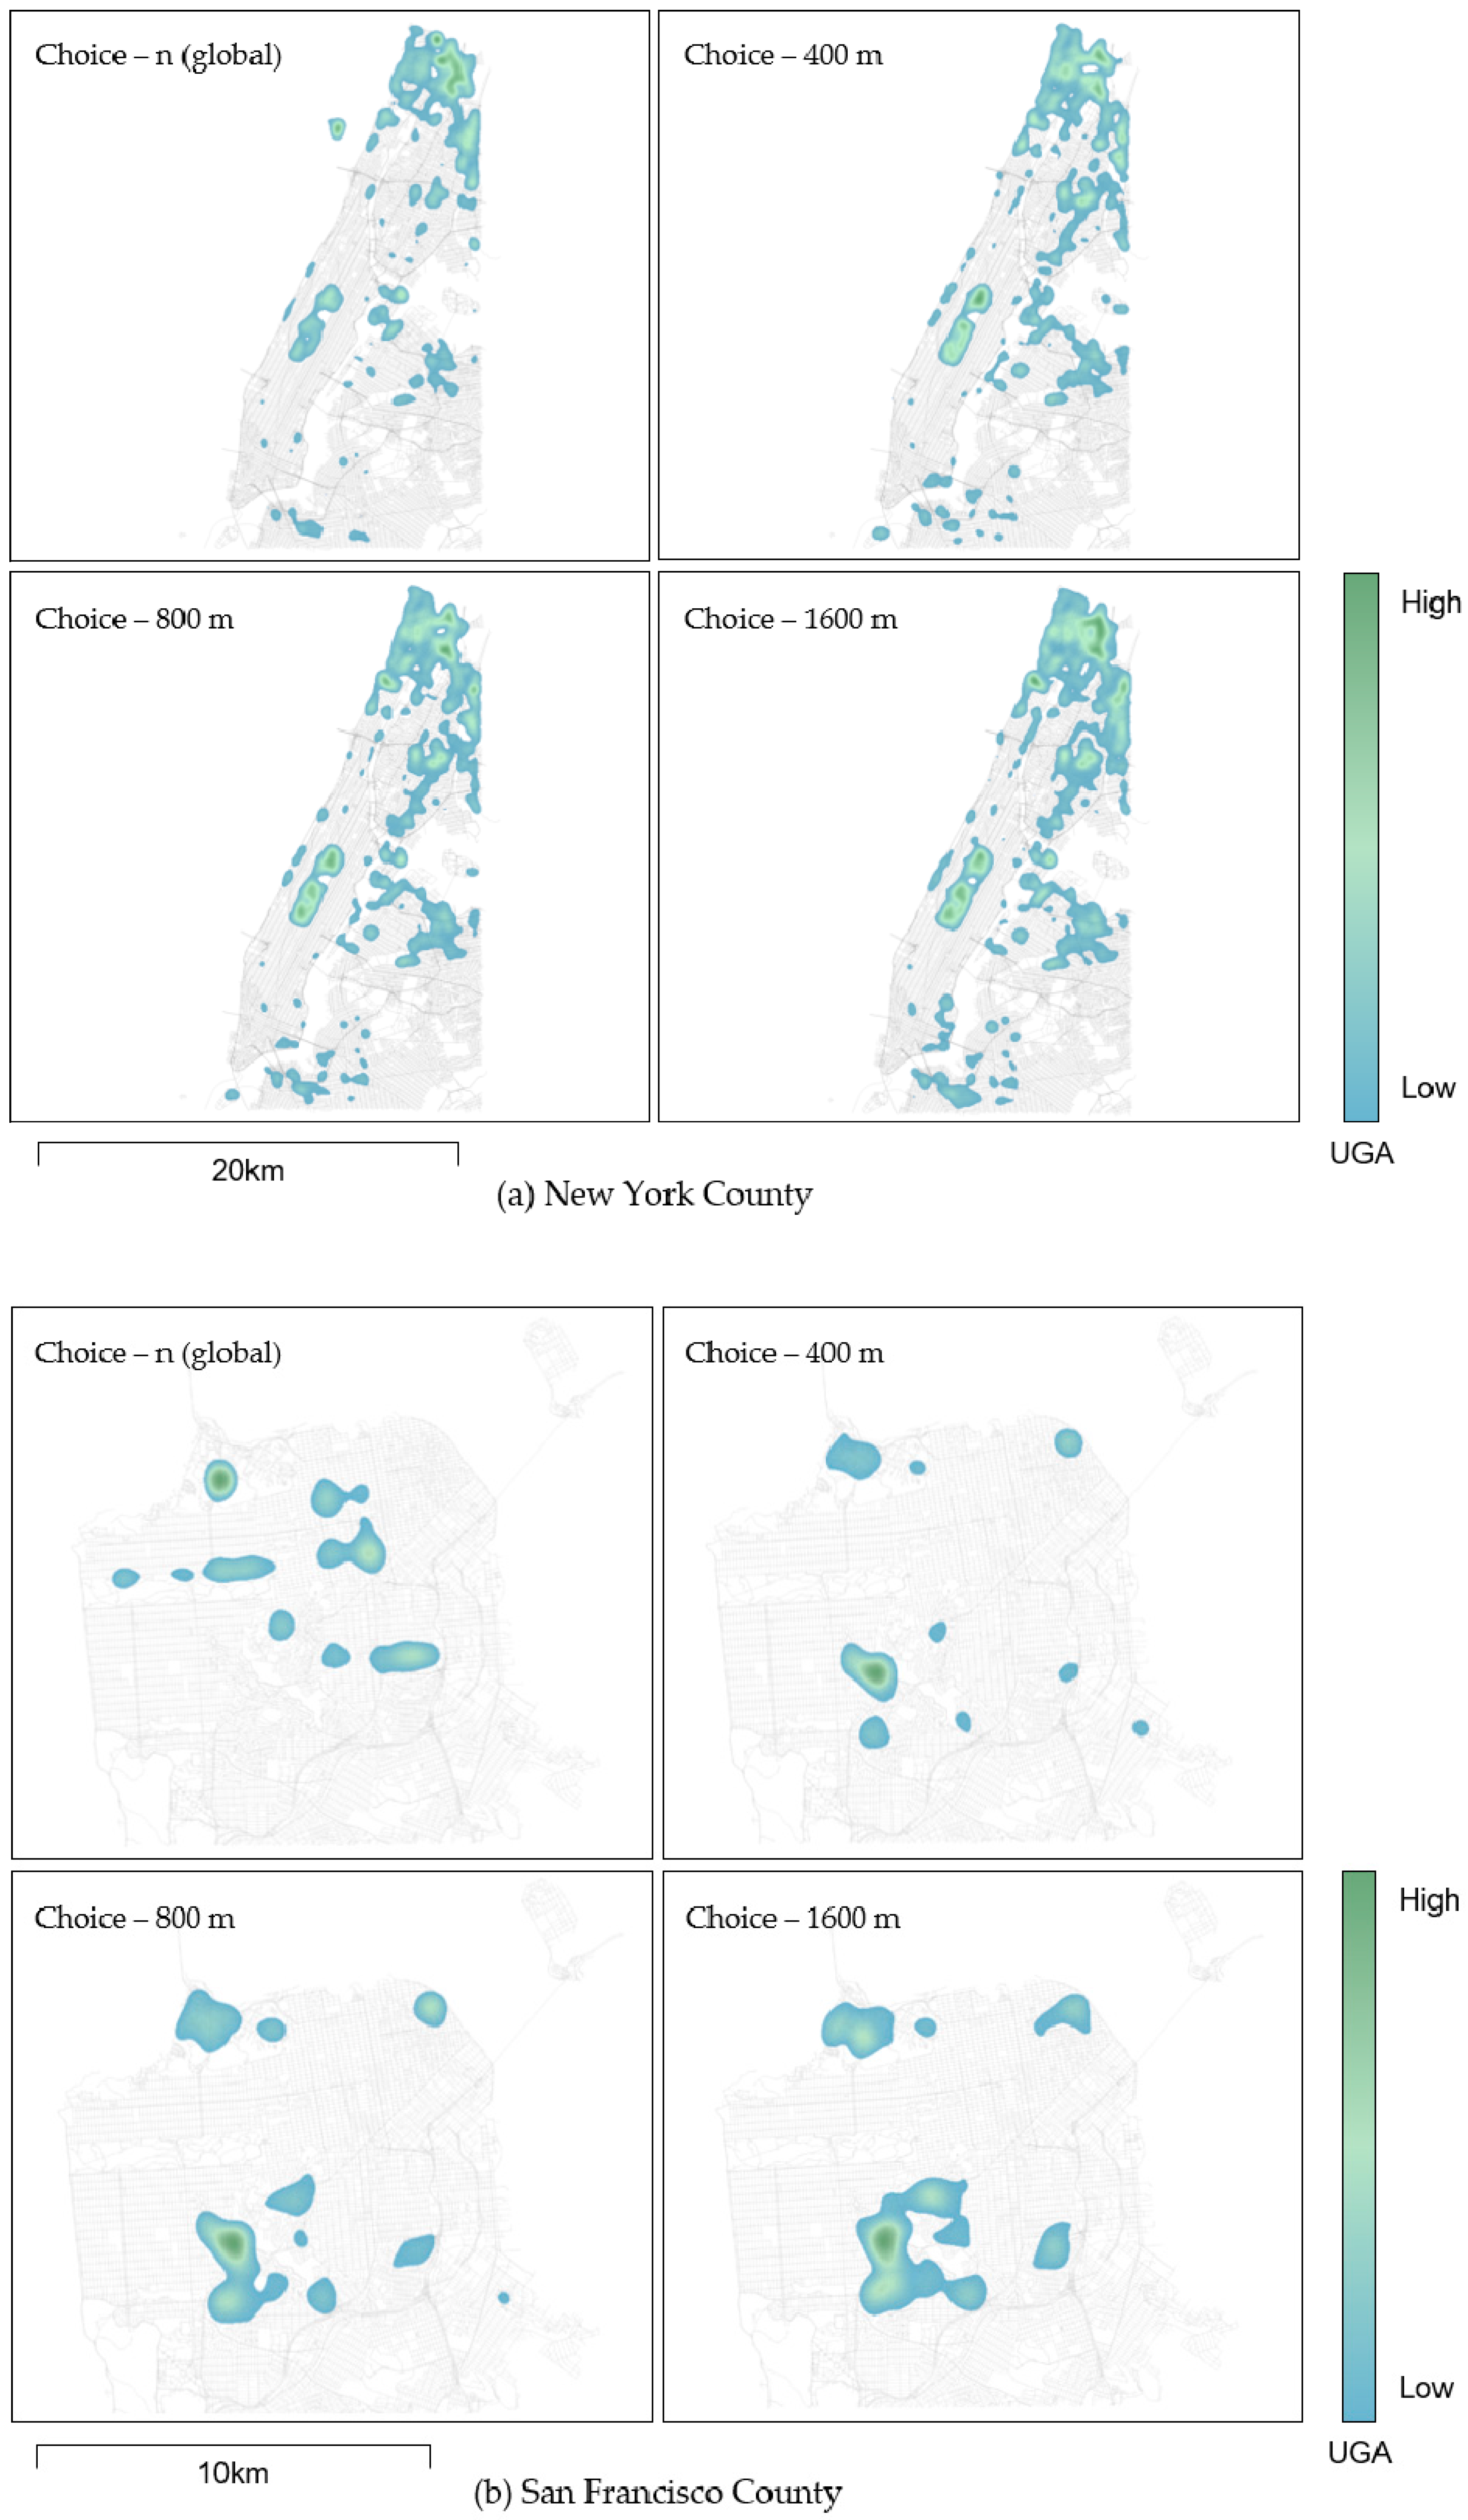
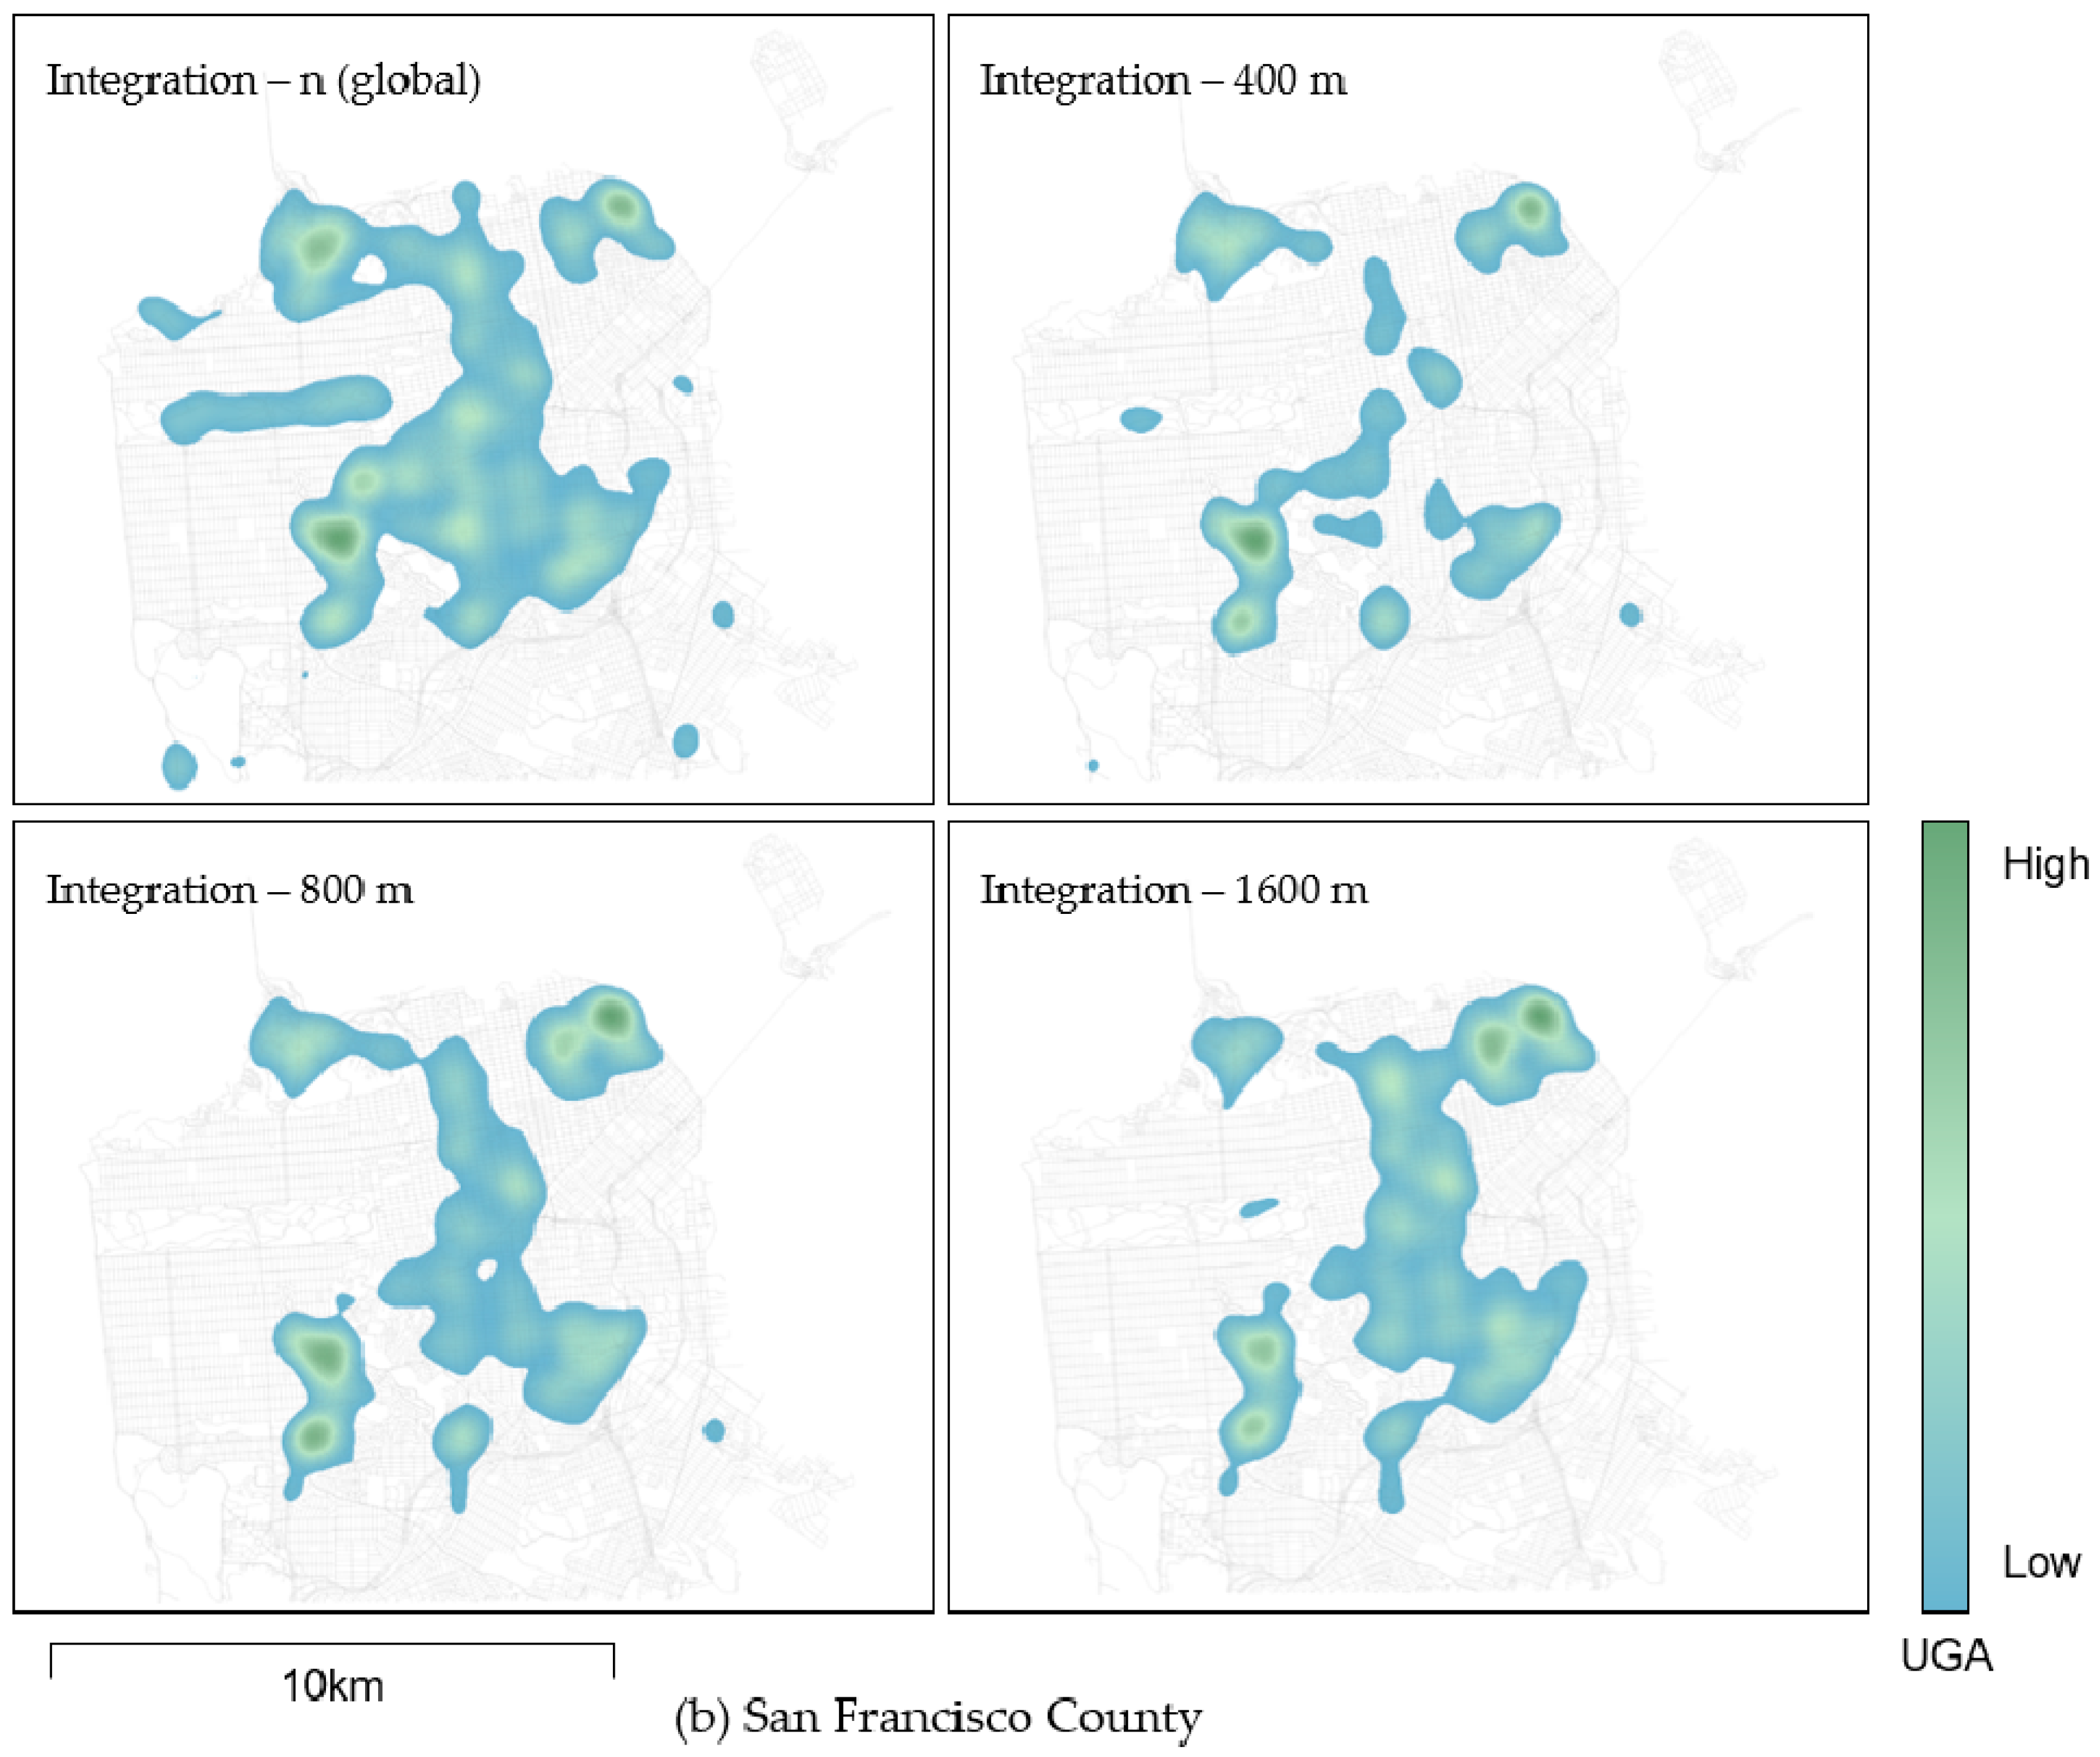
3. Implementation of the Urban Green Accessibility (UGA) Index

For the second step, the application of the urban green accessibility (UGA) index, New York, NY, and San Francisco, CA, both in the US, were selected as case sites because of the ease of collecting multiband aerial photographs and road centerline data of the city that is needed for analysis through open source online platforms. To obtain aerial images of both sites, we utilized the EarthExplorer platform that is in operation for the purpose of releasing aerial image data by the US Geological Survey (USGS). As the platform provides search option in county-level, eight images that cover the region of New York County and San Francisco County, taken on May 22, 2015 and June 25, 2016, respectively, were collected in GeoTIFF format. Each image was provided as 3.75° latitude by 3.75° longitude four-band image tiles at a resolution of 1-meter ground sample distance by the National Agriculture Imagery Program (NAIP). Four-band images contain red, green, blue and near infrared bands of values between 0 and 255, which represent the brightness of each spectral band. The band settings of aerial images were altered in QGIS software to measure the NDVI values for each pixel of the raster data. In total, 110,439,603 pixels in New York County (and its surrounding region) and 42,230,594 pixels in San Francisco County featured NDVI values in the range of 0.3 to 0.8, and were extracted as green points from all pixels in the aerial images. Finally, these raster data were converted into a point vector layer for the data merging required in the following steps. The entire process of the NDVI analysis for San Francisco is shown in Figure 2a.
To construct the road network of each city, road centerline data were collected from different open source platforms. The NYC Street Centerline (CSCL) of June 26, 2015 was downloaded from NYC Open Data (opendata.cityofnewyork.us) as a road-bed representation of New York city. In case of San Francisco, road features of June 2016 were extracted from 2016 TIGER/Line Shapefiles collected from the US Census Bureau (www.census.gov). A total of 36,919 street segments and 34,961 street segments in New York and San Francisco County, respectively, were processed in depthmapX software to calculate the topological hierarchy of the street network. Choice and integration measures were calculated in different metric radii within the city boundaries through angular segment analysis. Figure 2b depicts a sample image of the angular segment analysis result in San Francisco. The calculation results for the topological values of streets were then loaded into the QGIS software. By finding the nearest road segment from each pixel that is identified as a green space, we were able to construct a merged dataset of green points containing information on the NDVI ( G i ), the distance to the nearest road segment ( D i ) and the topological values of the nearest road segment ( T P ). By integrating these values into a single urban green accessibility (UGA) model, we intend to assess pedestrians’ accessibility to vegetation points in a city.

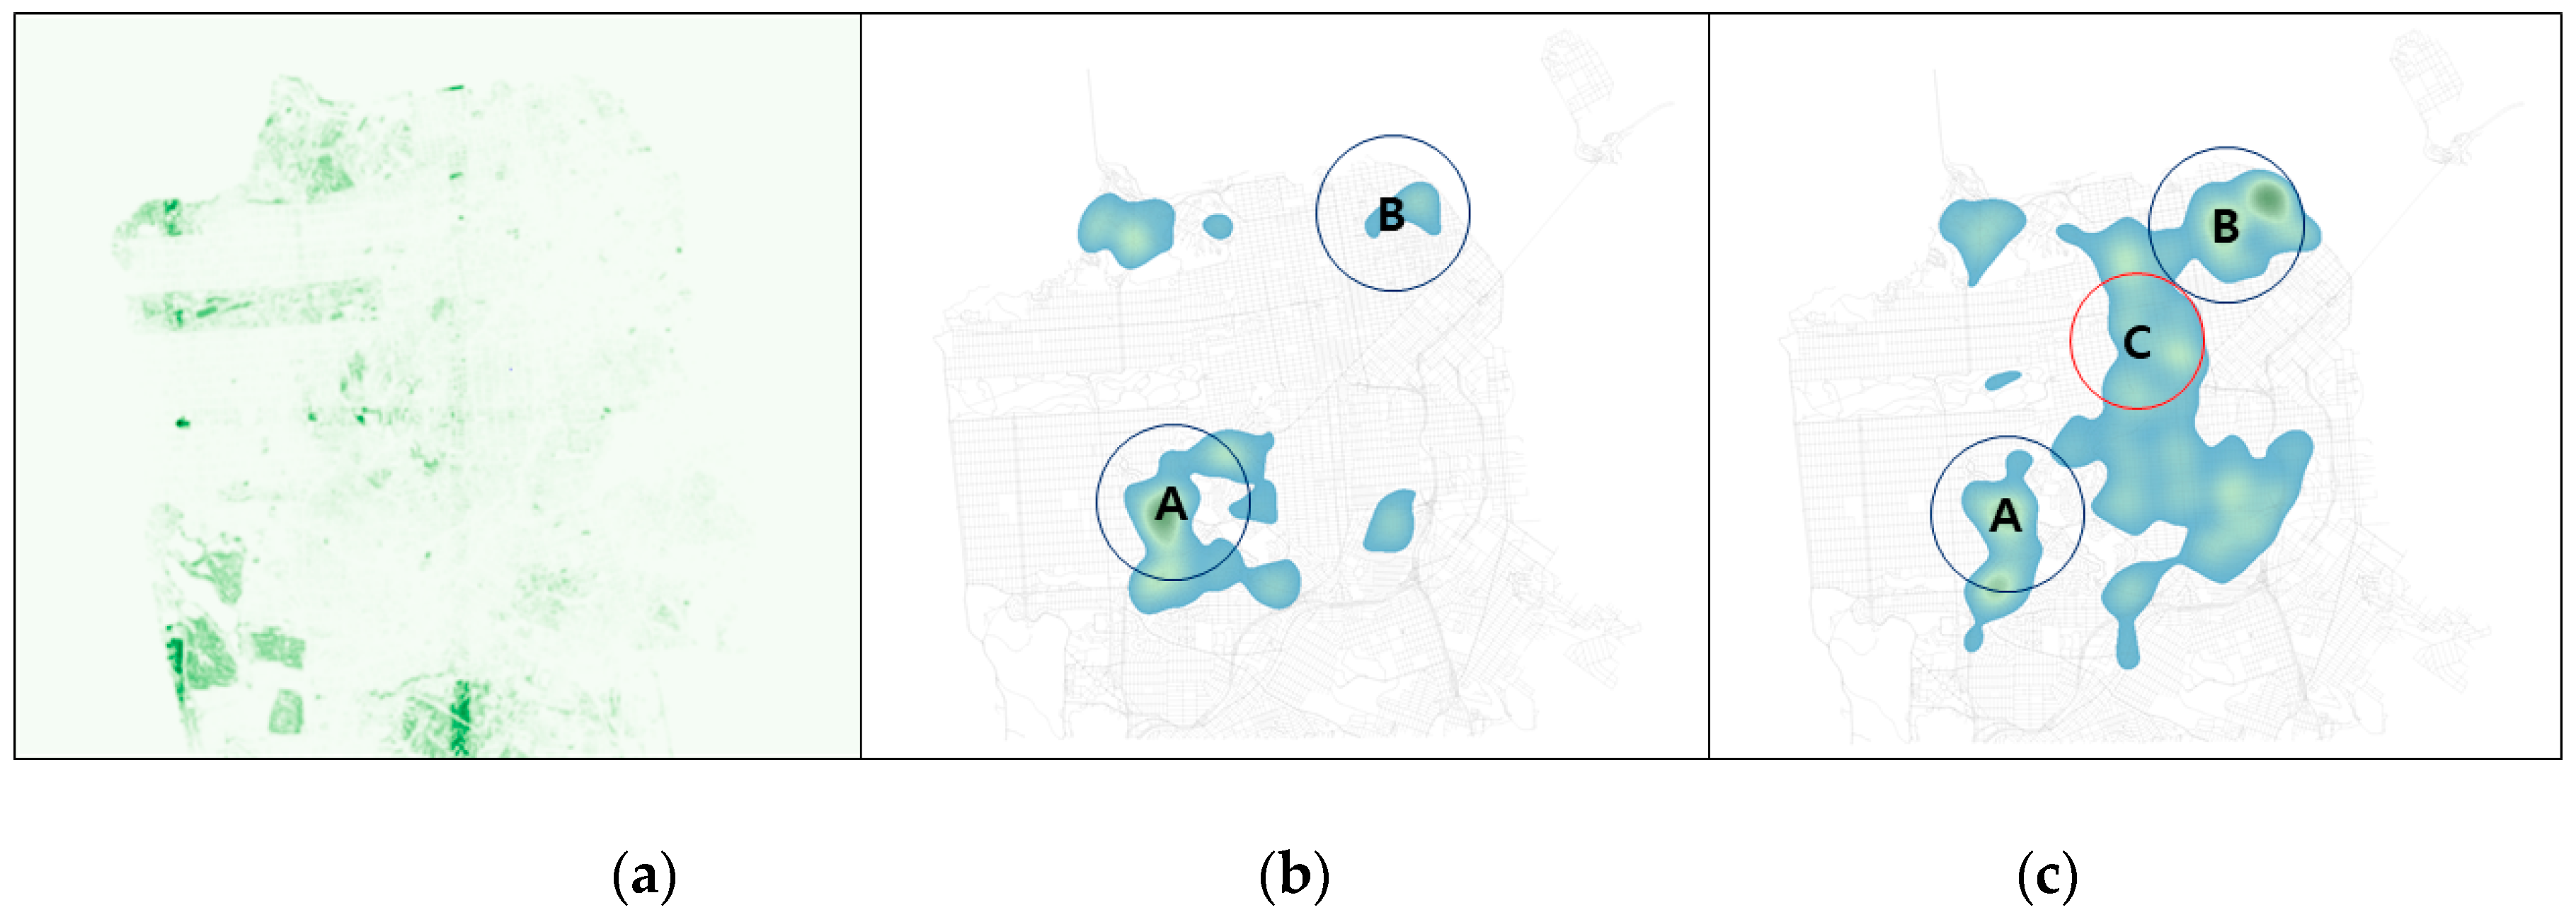
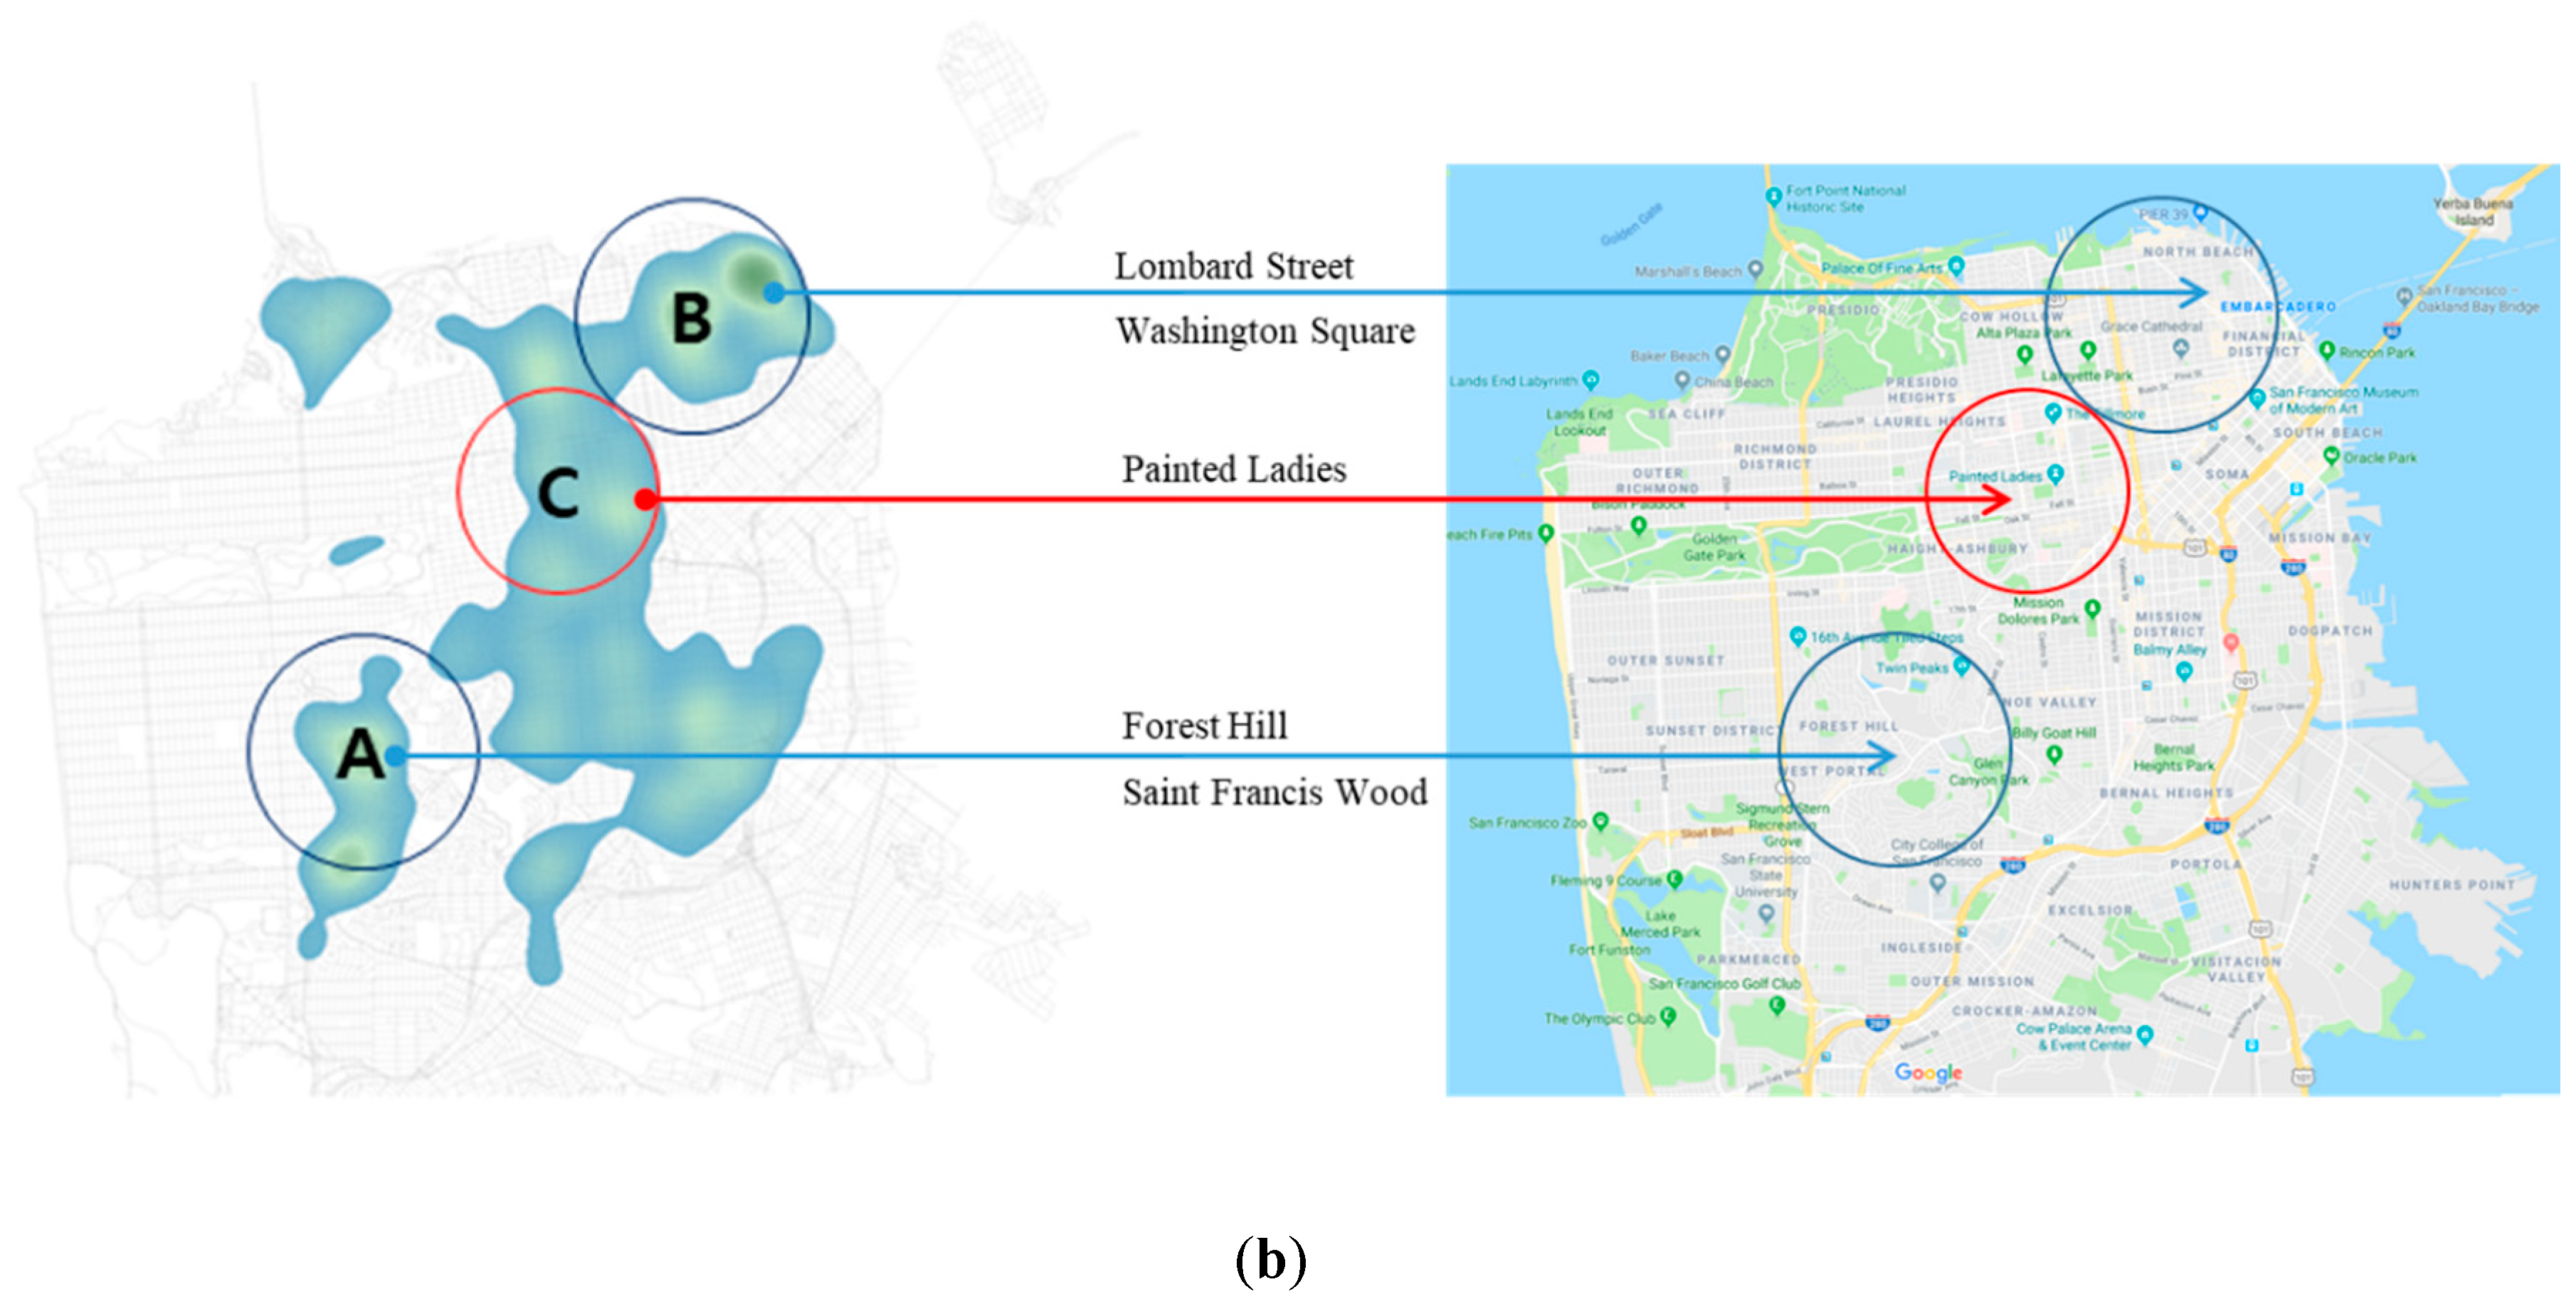
4. Characteristics of Urban Green Accessibility in San Francisco

The aim of this study is to assess pedestrians’ accessibility to vegetation points in a real urban setting by comparing the application results of the urban green accessibility index with the quantitative distribution pattern of green spaces in the county of New York and San Francisco. In particular, the urban green accessibility index proposed in this study includes a variable that implies the topological importance of a street segment to fully measure the accessibility of pedestrians in different ranges from the whole city to walking distance. The test results for both cases are visualized in a heat map by manipulating the layer styles in QGIS software, to easily capture the pattern of relative highs and lows. Calculated UGA values were colored from low to high (blue to green), while the lowest values were intentionally set as transparent to effectively show the underlying road network. Heat maps of the UGA distribution when choice and integration indexes are applied as the T P variable are shown in Figure 3 and Figure 4, respectively. Each figure includes the results for analysis conducted in four different metric radii—n (global), 400 m (1/4 mile), 800 m (1/2 mile) and 1600 m (1 mile)—to compare differences in the accessibility of green points according to the range of access distance.
Choice value measures the number of shortest paths within the network that pass through each street segment, thus showing high results for main roads that penetrate the road network. The results for the distribution of urban green accessibility values when choice index is applied are shown in Figure 3. Inevitably, in Figure 3a, Central Park, the largest and most iconic urban park in Manhattan, presents high UGA regardless of analysis scale. In more detail, accessibility is higher at a local scale than at a global scale, implying that the organized avenues and streets of Manhattan triggers better pedestrian flow than vehicle traffic to Central Park. Other high UGA spots are detected in green areas in the Bronx (the northeast of Manhattan), such as the Van Cortlandt Park, New York Botanical Garden and Bronx Zoo. Interesting is the widespread appearance of smaller local parks in the results of 400 m, 800 m and 1600 m analyses. Especially, riverside parks in Brooklyn that are “Down Under the Manhattan Bridge Overpass (DUMBO)” shows that the popular scenic spot for the Manhattan skyline becomes more accessible in walking distances. In Figure 3b, when the analysis scale includes the entire city (n), Golden Gate Park, which is the largest park in San Francisco, and several pocket parks in Pacific Heights, an expensive residential neighborhood in the northern-central area of the city, are revealed to have high accessibility results. This is mainly because green spaces in these locations are placed adjacent to long streets that pass through the city, such as Fulton Street and U.S. Route 101 near Golden Gate Park and Pacific Heights, respectively. In contrast, when the road network used for measurement is reduced to walking distances, the accessibility results showed different distributions. Green spaces in the central area and the northeastern corner of the city appear to have high accessibility results. Another interesting result is observed in Lake Merced Park located in the southwest corner of San Francisco. Despite being a 614-acre park popular for multiple purposes that is highly visible through NDVI analysis, Lake Merced Park does not appear in Figure 3. Since choice value calculates the number of shortest paths that pass through each segment, Lake Merced Park has been underestimated for being located in the periphery of the constructed road network of San Francisco.
As the integration value measures the total depth (or distance) from each segment to all the other segments within the road network, inner areas that are relatively interpreted as “shallow” normally show high results. Urban green accessibility distribution when integration index was applied for calculation is shown in Figure 4. In Figure 4a, the results of global and local scale analyses do not show any clear distinction, as the grid-like road structure of New York renders the relative depth of street segments similar in both scales. On the contrary, in Figure 4b, Golden Gate Park, which appeared with high accessibility values in a global scale, is either slightly or not included in the visualizations of local scale measurements. This implies that parks that occupy larger areas promote access for people from every corner of the city while lesser-known neighborhood parks can better appeal to people within walking distance. Similarly, Lake Merced Park appears in the global and 400 m cases, and disappears in the other two. The contrast between the result with global integration and results with local integration values explains the difficulty in pedestrian access to large parks. Interesting is the slight appearance in both Golden Gate Park and Lake Merced Park in the 400 m case compared to the other two local scale analyses. This indicates the relative ease in accessing a large park by foot particularly when it is located within 5-min walk.
The contrast between UGA distribution and the quantitative interpretation of green spaces with the NDVI result will be further discussed in the following section.

5. Discussion: Analysis and Effect of Urban Green Accessibility

This study successfully develops an urban green accessibility (UGA) model and verifies its effectiveness in measuring accessibility to green spaces through cases of New York, NY and San Francisco, CA. Accessibility is comprehensively measured by adding two more variables other than distance—greenness of each point and the topological importance of the nearest road segment. The application of the UGA model to multiband aerial imagery of New York and San Francisco revealed differences between accessibility in citywide and pedestrian ranges. While the heat map for citywide UGA has similarities with the quantitative distribution of green space in both cities, unexpected hotspots appear in the heat maps created for 400 m, 800 m and 1600 m. Moreover, such distinctions differ between indexes used for the topological variable. Whether the choice or integration value was used in the calculation resulted in a different heat map pattern, characterized by their theoretical definitions.
Further discussion is possible by applying the results to real-world situations. In Figure 5 and Figure 6, a comparison was made between the NDVI analysis and UGA modeling results of each topological measure in a 1600 m analysis range, in which the typical characteristics of local scale analysis are best confirmed. That is, we marked areas that feature low NDVI and high UGA values at the same time, in order to reveal which areas pedestrians are likely to perceive as intimate green spaces regardless of their size, quantity or greenness. Accordingly, in Figure 5b,c of New York, three spots were identically labeled as A, B and C. The South Bronx area in A are surrounded by two expressways, Cross Bronx Expressway and Bruckner Expressway, that connect it with the adjacent Upper Manhattan and Queens regions. In areas B and C, road networks in the neighborhoods of Queens and Brooklyn are formed in a rectilinear grid pattern with Brooklyn Queens Expressway penetrating the two boroughs. Similarly, in Figure 6b,c of San Francisco, common hot spots were detected in the southwest and northeast areas of the city, marked with points A and B, respectively. The road network near area A is formed with a highway that connects the outskirts with the downtown area and many short road segments. In area B, a diagonal path penetrates the center, and the shorter segments that diverge from that center construct a grid-like road network. Such road structure makes the area both a passageway and a central space in local-scale boundaries, letting it appear with high values in both analyses using choice and integration indexes. However, anomaly is found in the result in area C, whose road network lacks a segment passing through the area but is rather chopped into a small grid pattern. Accordingly, high results for urban green accessibility only appear in Figure 6c. In order to discuss these results in further detail, we confirmed green spaces in each highlighted location through Google Maps (maps.google.com) in Figure 7. In reality, areas A and B in Figure 7a are high-density and low- to middle-income neighborhoods in New York City. Green spaces in this area include neighborhood parks and cemeteries that are mainly used for recreational and memorial purposes by local residents. In contrast, area C is rather a more vibrant location with multiple tourist spots and Downtown Brooklyn. Especially parks located in the riverside are one of the most frequently visited places in New York City to view the Manhattan skyline. In case of San Francisco in Figure 7b, area A is a relatively upscale residential sector, including neighborhoods such as Forest Hill or Saint Francis Wood and consisting of small block sizes and connected to the city’s downtown area via Market Street; area A contains plenty of green spaces, but these are mostly for landscaping purposes. Area B is the functional center of the city, with the financial district and various attractions; the blocks here are cut on the diagonal by Columbus Avenue. The green spaces that appear to be highly accessible in this study include Washington Square, Pioneer Park, Lombard Street and Ina Coolbrith Park.

6. Conclusions

Until now, various studies in the past that attempted to measure accessibility to green spaces have overemphasized the distance between population centers and urban parks that exist in a polygon-shaped data format [10,11]. However, this study complements the conventional research approaches in two ways. First, by analyzing each pixel of aerial imagery, not only were parks in polygon shapes included in the research scope but single trees and bushes were as well. Second, the greenness index of each green element and road network topology was included in the measurement of accessibility, resulting in the discovery that access to green spaces is affected differently in various situations rather than being solely dependent on the quantitative number of green elements. In fact, the green spaces that resulted with high accessibility in the UGA analysis were not major parks of New York and San Francisco but those that were linked to other urban functions such as tourist spots, residential areas and public squares.
In conclusion, this study proposes a new measure to efficiently evaluate the accessibility of green spaces with the use of open-source spatial data. In particular, the study extends the discussion beyond a one-dimensional approach, which simply calls for a quantitative increase and enables the suggestion of qualitative solutions based on people’s accessibility and spatial relation to green spaces. Particularly, this study can provide implications and basic information to governmental planning officials on how to establish better management strategies for urban green spaces in cities. Furthermore, the overall research design and results in this study suggest the prudence of constructing a road centerline and aerial imagery database to enable the widespread application of this model to other cities for comparative analyses in further studies.
However, although this study has made various contributions, limitations should be highlighted for future work as well. In order to better validate the model and elaborate the accessibility to various forms of green space, a correlation analysis between NDVI and UGA calculations can help compare the quantitative and qualitative assessments. There is also potential for improvement in the UGA model by incorporating vehicle-driving factors to further explain the complex mechanisms in people’s access to green spaces. Since the proposed accessibility model was applied to a limited number of cases, it would be necessary to examine the proposed model in more cities. Testing the UGA model with multiple cities and confirming whether it gives consistent results would help generalize the model to be used in future urban green space accessibility studies. For instance, selecting different cities from the US as a comparison group for the results in this study and testing the model in pedestrian-dominant cities from different regions, such as Asia or Europe, are two of the feasible options to be considered for further studies. Additionally, it is necessary to collect data from various cities in a uniform format. However, due to difficulties in widespread application, it is suggested that conducting an interview or questionnaire with residents of a city could help confirm whether the derived result in the related study coincides with the actual perception or behavior of the city residents.

Author Contributions

Conceptualization, Kee Moon Jang and Youngchul Kim; methodology, Kee Moon Jang, Jaeman Kim, Hye-Yeong Lee and Youngchul Kim; software, Kee Moon Jang, Jaeman Kim, Hye-Yeong Lee and Hyemin Cho; validation, Kee Moon Jang and Youngchul Kim; data curation, Kee Moon Jang, Jaeman Kim, Hye-Yeong Lee and Hyemin Cho; writing—original draft preparation, Kee Moon Jang; writing—review and editing, Jaeman Kim, Hye-Yeong Lee, Hyemin Cho and Youngchul Kim All authors have read and agreed to the published version of the manuscript.

Funding

This research was supported by the National Research Foundation of Korea (NRF) Grant funded by the Ministry of Science and ICT for convergent research in EDucation-research Integration through Simulation On the Net (EDISON) (NRF-2017M3C1A6075020), and by the Korea Agency for Infrastructure Technology Advancement (KAIA) grant funded by the Ministry of Land, Infrastructure and Transport (20UMRG-B158194-01), and Innovative Talent Education Program for Smart City.

Conflicts of Interest

The authors declare no conflict of interest. The funders had no role in the design of the study; in the collection, analyses or interpretation of data; in the writing of the manuscript, or in the decision to publish the results.

References

  1. De Ridder, K.; Adamec, V.; Bañuelos, A.; Bruse, M.; Bürger, M.; Damsgaard, O.; Dufek, J.; Hirsch, J.; Lefebre, F.; Pérez-Lacorzana, J.M.; et al. An integrated methodology to assess the benefits of urban green space. Sci. Total Environ. 2004, 334, 489–497. [Google Scholar] [CrossRef] [PubMed]
  2. Kweon, B.S.; Sullivan, W.C.; Wiley, A.R. Green common spaces and the social integration of inner-city older adults. Environ. Behav. 1998, 30, 832–858. [Google Scholar] [CrossRef]
  3. Lee, C.; Moudon, A.V. Neighborhood design and physical activity. Build. Res. Inf. 2008, 36, 395–411. [Google Scholar] [CrossRef]
  4. Stigsdotter, U.K.; Ekholm, O.; Schipperijn, J.; Toftager, M.; Kamper-Jørgensen, F.; Randrup, T.B. Health promoting outdoor environments-Associations between green space, and health, health-related quality of life and stress based on a Danish national representative survey. Scand. J. Public Health 2010, 38, 411–417. [Google Scholar] [CrossRef]
  5. Lee, A.C.; Maheswaran, R. The health benefits of urban green spaces: A review of the evidence. J. Public Health 2011, 33, 212–222. [Google Scholar] [CrossRef]
  6. Harting, T.; Mitchell, R.; De Vries, S.; Frumkin, H. Nature and health. Annu. Rev. Public Health 2014, 35, 207–228. [Google Scholar] [CrossRef] [Green Version]
  7. Triguero-Mas, M.; Dadvand, P.; Cirach, M.; Martínez, D.; Medina, A.; Mompart, A.; Basagaña, X.; Gražulevičienė, R.; Nieuwenhuijsen, M.J. Natural outdoor environments and mental and physical health: Relationships and mechanisms. Environ. Int. 2015, 77, 35–41. [Google Scholar] [CrossRef] [Green Version]
  8. Coombes, E.; Jones, A.P.; Hillsdon, M. The relationship of physical activity and overweight to objectively measured green space accessibility and use. Soc. Sci. Med. 2010, 70, 816–822. [Google Scholar] [CrossRef] [Green Version]
  9. Gidlöf-Gunnarsson, A.; Öhrström, E. Noise and well-being in urban residential environments: The potential role of perceived availability to nearby green areas. Landsc. Urban Plan. 2007, 83, 115–126. [Google Scholar] [CrossRef]
  10. Comber, A.; Brunsdon, C.; Green, E. Using a GIS-based network analysis to determine urban greenspace accessibility for different ethnic and religious groups. Landsc. Urban Plan. 2008, 86, 103–114. [Google Scholar] [CrossRef] [Green Version]
  11. M’Ikiugu, M.M.; Kinoshita, I.; Tashiro, Y. Urban Green space analysis and identification of its potential expansion areas. Procedia Soc. Behav. Sci. 2012, 35, 449–458. [Google Scholar] [CrossRef] [Green Version]
  12. Liang, H.; Chen, D.; Zhang, Q. Walking accessibility of urban parks in a compact megacity. Proc. Inst. Civ. Eng. Urban Des. Plan. 2017, 170, 59–71. [Google Scholar] [CrossRef]
  13. Lwin, K.K.; Murayama, Y. Modelling of urban green space walkability: Eco-friendly walk score calculator. Comput. Environ. Urban Syst. 2011, 35, 408–420. [Google Scholar] [CrossRef]
  14. Abubakar, I.R.; Aina, Y.A. GIS and space syntax: An analysis of accessibility to urban green areas in Doha district of Dammam Metropolitan Area, Saudi Arabia. In Proceedings of the Map Middle East Conference, Dubai, UAE, 26–29 March 2006. [Google Scholar]
  15. Zhang, X.; Lu, H.; Holt, J.B. Modeling spatial accessibility to parks: A national study. Int. J. Health Geogr. 2011, 10, 31. [Google Scholar] [CrossRef] [Green Version]
  16. Zhou, X.; Kim, J. Social disparities in tree canopy and park accessibility: A case study of six cities in Illinois using GIS and remote sensing. Urban For. Urban Green. 2013, 12, 88–97. [Google Scholar] [CrossRef]
  17. La Rosa, D. Accessibility to greenspaces: GIS based indicators for sustainable planning in a dense urban context. Ecol. Indic. 2014, 42, 122–134. [Google Scholar] [CrossRef]
  18. Wendel, H.E.W.; Zarger, R.K.; Mihelcic, J.R. Accessibility and usability: Green space preferences, perceptions, and barriers in a rapidly urbanizing city in Latin America. Landsc. Urban Plan. 2012, 107, 272–282. [Google Scholar] [CrossRef]
  19. Wüstemann, H.; Kalisch, D.; Kolbe, J. Access to urban green space and environmental inequalities in Germany. Landsc. Urban Plan. 2017, 164, 124–131. [Google Scholar] [CrossRef]
  20. Gupta, K.; Kumar, P.; Pathan, S.K.; Sharma, K.P. Urban Neighborhood Green Index–A measure of green spaces in urban areas. Landsc. Urban Plan. 2012, 105, 325–335. [Google Scholar] [CrossRef]
  21. Lowry, J.H.; Baker, M.E.; Ramsey, R.D. Determinants of urban tree canopy in residential neighborhoods: Household characteristics, urban form, and the geophysical landscape. Urban Ecosyst. 2012, 15, 247–266. [Google Scholar] [CrossRef]
  22. Zhou, X.; Wang, Y.C. Spatial–temporal dynamics of urban green space in response to rapid urbanization and greening policies. Landsc. Urban Plan. 2011, 100, 268–277. [Google Scholar] [CrossRef]
  23. Li, X.; Zhang, C.; Li, W.; Ricard, R.; Meng, Q.; Zhang, W. Assessing street-level urban greenery using Google Street View and a modified green view index. Urban For. Urban Green. 2015, 14, 675–685. [Google Scholar] [CrossRef]
  24. Kang, Y.; Zhang, F.; Gao, S.; Lin, H.; Liu, Y. A review of urban physical environment sensing using street view imagery in public health studies. Ann. GIS 2020, 26, 261–275. [Google Scholar] [CrossRef]
  25. Oh, K.; Jeong, S. Assessing the spatial distribution of urban parks using GIS. Landsc. Urban Plan. 2007, 82, 25–32. [Google Scholar] [CrossRef]
  26. Hajrasouliha, A.; Yin, L. The impact of street network connectivity on pedestrian volume. Urban Stud. 2015, 52, 2483–2497. [Google Scholar] [CrossRef]
  27. Hillier, B. Space is the Machine: A Configurational Theory of Architecture; Space Syntax: London, UK, 2007. [Google Scholar]
  28. Hillier, B.; Hanson, J. The Social Logic of Space; Cambridge University Press: Cambridge, UK, 1989. [Google Scholar]
  29. Ståhle, A.; Marcus, L.; Karlström, A. Place Syntax: Geographic accessibility with axial lines in GIS. In Proceedings of the 5th International Space Syntax Symposium, Delft, The Netherlands, 13–17 June 2005; Techne Press: Delft, The Netherlands, 2005; pp. 131–144. [Google Scholar]
  30. Hillier, B.; Penn, A.; Hanson, J.; Grajewski, T.; Xu, J. Natural movement: Or, configuration and attraction in urban pedestrian movement. Environ. Plan. B Plan. Des. 1993, 20, 29–66. [Google Scholar] [CrossRef] [Green Version]
  31. Jiang, B. Ranking spaces for predicting human movement in an urban environment. Int. J. Geogr. Inf. Sci. 2009, 23, 823–837. [Google Scholar] [CrossRef] [Green Version]
  32. Lerman, Y.; Rofè, Y.; Omer, I. Using space syntax to model pedestrian movement in urban transportation planning. Geogr. Anal. 2014, 46, 392–410. [Google Scholar] [CrossRef]
  33. Talav Era, R. Improving pedestrian accessibility to public space through Space Syntax analysis. In Proceedings of the 8th International Space Syntax Symposium, Santiago, Chile, 3–6 January 2012; Paper ref no. 8223. pp. 1–16. [Google Scholar]
  34. Chen, J.; Chang, Z. Rethinking urban green space accessibility: Evaluating and optimizing public transportation system through social network analysis in megacities. Landsc. Urban Plan. 2015, 143, 150–159. [Google Scholar] [CrossRef]
  35. Ye, Y.; Richards, D.; Lu, Y.; Song, X.; Zhuang, Y.; Zeng, W.; Zhong, T. Measuring daily accessed street greenery: A human-scale approach for informing better urban planning practices. Landsc. Urban Plan. 2019, 191, 103434. [Google Scholar] [CrossRef]
  36. Jiang, B.; Claramunt, C.; Batty, M. Geometric accessibility and geographic information: Extending desktop GIS to space syntax. Comput. Environ. Urban Syst. 1999, 23, 127–146. [Google Scholar] [CrossRef]
  37. Lloyd, C.D. Assessing the effect of integrating elevation data into the estimation of monthly precipitation in Great Britain. J. Hydrol. 2005, 308, 128–150. [Google Scholar] [CrossRef]
  38. Lu, G.Y.; Wong, D.W. An adaptive inverse-distance weighting spatial interpolation technique. Comput. Geosci. 2008, 34, 1044–1055. [Google Scholar] [CrossRef]
  39. Pettorelli, N.; Vik, J.O.; Mysterud, A.; Gaillard, J.M.; Tucker, C.J.; Stenseth, N.C. Using the satellite-derived NDVI to assess ecological responses to environmental change. Trends Ecol. Evol. 2005, 20, 503–510. [Google Scholar] [CrossRef] [PubMed]
  40. Hur, M.; Nasar, J.L.; Chun, B. Neighborhood satisfaction, physical and perceived naturalness and openness. J. Environ. Psychol. 2010, 30, 52–59. [Google Scholar] [CrossRef]
  41. Tilt, J.H.; Unfried, T.M.; Roca, B. Using objective and subjective measures of neighborhood greenness and accessible destinations for understanding walking trips and BMI in Seattle, Washington. Am. J. Health Promot. 2007, 21 (Suppl. S4), 371–379. [Google Scholar] [CrossRef]
  42. Rasmussen, M.S. Developing simple, operational, consistent NDVI-vegetation models by applying environmental and climatic information: Part I. Assessment of net primary production. Int. J. Remote Sens. 1998, 19, 97–117. [Google Scholar] [CrossRef]
  43. Gillies, R.R.; Carlson, T.N. Thermal remote sensing of surface soil water content with partial vegetation cover for incorporation into climate models. J. Appl. Meteorol. 1995, 34, 745–756. [Google Scholar] [CrossRef] [Green Version]
  44. Sonwalkar, M.; Fang, L.; Sun, D. Use of NDVI dataset for a GIS based analysis: A sample study of TAR Creek superfund site. Ecol. Inform. 2010, 5, 484–491. [Google Scholar] [CrossRef]
  45. Turner, A. From Axial to Road-Centre Lines: A New Representation for Space Syntax and a New Model of Route Choice for Transport Network Analysis. Environ. Plan. B Plan. Des. 2007, 34, 539–555. [Google Scholar] [CrossRef] [Green Version]
  46. Turner, A. Depthmap 4: A Researcher’s Handbook, Bartlett School of Graduate Studies; University College London: London, UK, 2004. [Google Scholar]
  47. Foltête, J.C.; Piombini, A. Urban layout, landscape features and pedestrian usage. Landsc. Urban Plan. 2007, 81, 225–234. [Google Scholar] [CrossRef]
Figure 1. Access situations to green points near a street in a city.
Ijgi 09 00586 g001
Figure 2. Analyses of collected data from San Francisco. (a) NDVI analysis process (aerial image–band manipulation–vectorization–close-up view); (b) Angular segment analysis result (integration).
Ijgi 09 00586 g002
Figure 3. Urban green accessibility distribution with choice index applied as the topological value. (a) New York County (b) San Francisco County.
Ijgi 09 00586 g003
Figure 4. Urban green accessibility distribution with integration index applied as the topological value. (a) New York County (b) San Francisco County.
Ijgi 09 00586 g004aIjgi 09 00586 g004b
Figure 5. Comparison of significant areas in New York. (a) NDVI analysis result; (b) UGA heat map with choice 1600 m setting; (c) UGA heat map with integration 1600 m setting.
Ijgi 09 00586 g005
Figure 6. Comparison of significant areas in San Francisco. (a) NDVI analysis result; (b) UGA heat map with choice 1600 m setting; (c) UGA heat map with integration 1600 m setting.
Ijgi 09 00586 g006
Figure 7. Locations on the maps of (a) New York and (b) San Francisco at the areas of A, B and C.
Ijgi 09 00586 g007aIjgi 09 00586 g007b
Table 1. Description of values used for Topology and Greenness variables of the urban green accessibility (UGA) index. NDVI: normalized difference vegetation index.
Variables T P G i
Choice
(Turner, 2007)
Integration
(Turner, 2007)
NDVI
(Sonwalkar et al., 2010)
Values B θ ( x ) = i = 1 n j = 1 n σ ( i , x , j ) ( n 1 ) ( n 2 ) / 2

σ ( i , x , j )
= 1, if the shortest path from i j passes through x
= 0, otherwise
C θ ( x ) = n i = 1 n D θ ( x , i )

D θ ( x , i ) :
depth (length) of the shortest path between segments x and i
NDVI = NIR RED NIR + RED

NIR : the spectral reflectance of near-infrared radiation
RED : the spectral reflectance of visible red light

