Simulating Large-Scale 3D Cadastral Dataset Using Procedural Modelling


1
Department of Geodesy, Faculty of Civil and Geodetic Engineering, University of Ljubljana, Jamova cesta 2, SI-1000 Ljubljana, Slovenia
2
ADAI, Department of Mechanical Engineering, University of Coimbra, Rua Luís Reis Santos, Pólo II, 3030-788 Coimbra, Portugal
*
Author to whom correspondence should be addressed.
ISPRS Int. J. Geo-Inf. 2020, 9(10), 598; https://0-doi-org.brum.beds.ac.uk/10.3390/ijgi9100598
Submission received: 1 September 2020
/
Revised: 1 October 2020
/
Accepted: 8 October 2020
/
Published: 11 October 2020
Abstract
:Geospatial data and information within contemporary land administration systems are fundamental to manage the territory adequately. 3D land administration systems, often addressed as 3D cadastre, promise several benefits, particularly in managing today’s complex built environment, but these are currently still non-existent in their full capacity. The development of any complex information and administration system, such as a land administration system, is time-consuming and costly, particularly during the phase of evaluation and testing. In this regard, the process of implementing such systems may benefit from using synthetic data. In this study, the method for simulating the 3D cadastral dataset is presented and discussed. The dataset is generated using a procedural modelling method, referenced to real cadastral data for the Slovenian territory and stored in a spatial database management system (DBMS) that supports storage of 3D spatial data. Spatial queries, related to 3D cadastral data management, are used to evaluate the database performance and storage characteristics, and 3D visualisation options. The results of the study show that the method is feasible for the simulation of large-scale 3D cadastral datasets. Using the developed spatial queries and their performance analysis, we demonstrate the importance of the simulated dataset for developing efficient 3D cadastral data management processes.
1. Introduction
As the built environment is increasingly becoming spatially complex, land administration systems (e.g., cadastral systems) are challenged by an unprecedented demand to support decisions in utilising space above and below the earth’s surface [1]. Consequently, cadastral systems tend to be very complex information systems that require the efficient organisation of data to support their management. Additionally, a cadastral system is usually developed for a whole jurisdiction (e.g., a county or a country) which requires handling of a large amount of data. With the introduction of 3D geospatial models representing 3D real property units in the so-called 3D cadastre or 3D land administration system, this has become a very challenging task [2,3]. The development of 3D cadastre has been the subject of intensive research activity in the past two decades. Generally, the research has been focused on three main aspects of a 3D cadastre: the legal, the institutional and the technical. The legal aspects of 3D cadastre have been studied by Paulsson [4]. The study provides an international overview of legal systems and the analysis of several forms of 3D property rights. Kitsakis and Dimopoulou [5] studied and compared the establishment of multi-surface property in Common and Civil law jurisdictions. Paulsson and Paasch [6] analysed the research on the legal aspects and emphasised the need for additional research in this field. The institutional aspects of 3D cadastres are mainly studied within the research, concerning the developments in specific countries [7,8,9,10,11]. Ho et al. [12] studied the institutional factors in the development of 3D cadastral systems. Stoter [13] provided a comprehensive study of the 3D cadastral topics, with the focus on the technical aspects. Several options for realisation of 3D cadastral systems were investigated, including DBMS data storage and maintenance. The DBMS storage and management of 3D spatial data has been studied in [14,15,16] and its validation in [17,18,19]. The research in the field of 3D cadastre has also been related to the challenges for the visualisation of 3D cadastral data [20,21]. Regarding 3D cadastral data modelling, several data models have been studied and proposed. Aien et al. [22] provide an assessment and comparison of the existing data models for 3D cadastre applications. The authors conclude that none of the discussed models, including the conceptual model provided within the international standard ISO 19152:2012 on the Land Administration Domain Model (LADM) [23], fully supports 3D data modelling. Another study, focusing on linking physical space with legal boundaries, has been conducted by Rajabifard et al. [24] for the case of the jurisdiction of Victoria, Australia. The authors discuss Open Geospatial Consortium standards, namely CityGML [25], IndoorGML [26], and LandInfra [27], and their integration with LADM, together with the 3D cadastral data model (3DCDM), which was designed to support both 3D legal objects and their physical counterparts [28]. According to Kalogianni et al. [1], there is currently no country with a fully operational 3D cadastral system. The authors emphasise that some jurisdictions already support some aspects of 3D cadastre, but this is mainly a part of pilot projects and prototypes (see [29,30,31]). Consequentially, this means that no real large-scale 3D cadastral datasets are available, except for some individual cases that were the subject of existing studies.
While advancements in remote sensing technology enable us to obtain large-scale models of building exteriors [32], this is not enough for cadastral use in case of buildings, as some degree of indoor spatial information is needed for unambiguous delineation of a building into real property units, to which rights, restrictions, and responsibilities refer. Indoor spatial data acquisition and modelling is challenging and requires an individual approach for each building [33]. Studies regarding this issue have also been done related to a 3D cadastre. Kitsakis and Dimopoulou [34] investigate the usability of existing cadastral documentation for 3D modelling. Vučić et al. [8] focus on the Croatian land administration system and investigate the possibilities of upgrading the cadastral system to 3D by linking topographic data. Tekavec and Lisec [35] provide a framework for 3D indoor modelling based on existing cadastral data. All studies deal with a limited number of individual buildings. Consequently, their usability in obtaining a large-scale dataset is limited. To overcome this issue, it is hypothesised that the 3D cadastral system development can benefit from using a synthetic dataset that simulates some aspects of the real data.
In this paper, the method that uses procedural modelling for simulating the synthetic 3D cadastral dataset is developed and discussed. The research is limited to buildings, as they represent the dominant feature in the field of geospatial data modelling within a 3D cadastre. Using the existing cadastral data for the study area, we aimed to obtain a more representative placement and configuration of the simulated buildings. A similar approach, without procedural modelling, was proposed by Ledoux and Meijers [36] and Biljecki et al. [37] aiming to generate 3D city models based on 2D footprints and attribute data. Procedural modelling methods are rooted in computer graphics and refer to several techniques to create 3D models and textures from sets of predefined rules, combined with randomising some of the parameters. We focus on methods that generate whole buildings from indoor space arrangements. In this context, the study of Watson et al. [38] has to be mentioned, who reviewed the applications of procedural modelling in computer graphics. Merrell et al. [39] focus on the automated generation of building layouts based on a Bayesian network trained on real-world data. Smelik et al. [40] provide a survey of the methods for procedural modelling of virtual worlds. Camozzato [41] classifies the approaches to subdivision algorithms [42], tile placement algorithms [43], inside out algorithms [39] and growth-based algorithms [44]. Another classification of automatic approaches for indoor layout generation is provided by Rodrigues et al. [45]. The focus is on the architectural domain, where procedural modelling is divided into area assignment, area partitioning, space allocation, hierarchical construction, conceptual exploration and design adaptation. Procedural modelling is also used in the geoinformation domain. Gröger and Plümer [46] generated building indoor models to derive route graphs. Zhu et al. [47] used procedural modelling to generate virtual scenes. Based on the work of Tsiliakou et al. [48], Kitsakis et al. [49] used ESRI CityEngine to produce 3D building models of a traditional village. CityEngine procedural capabilities have also been studied by Ribeiro et al. [50] to test 3D visualisation of 3D cadastral data and by Neuenschwander et al. [51] to generate and visualise green space patterns in a 3D environment. Biljecki et al. [52] used the procedural modelling approach to simulate the CityGML datasets, which were used to analyse different variants of LODs (level of detail) and their influence on the performance of spatial analyses. The procedural modelling engine Random3DCity was used by Kumar et al. [53] to generate artificial TIN terrain models at different LODs in CityGML format.
In the following chapter, we present the developed approach for simulating the real 3D cadastral dataset by generating a synthetic dataset using a Hybrid Evolution Strategy [54] as a procedural modelling method to create buildings with different geometries and functional programs. The generated buildings are linked to the Slovenian cadastral data. The simulated dataset was stored in a spatial database management system (DBMS), where we illustrate the performance testing for some 3D spatial queries related to data consistency and we evaluate options for 3D visualisation.
2. Materials and Methods
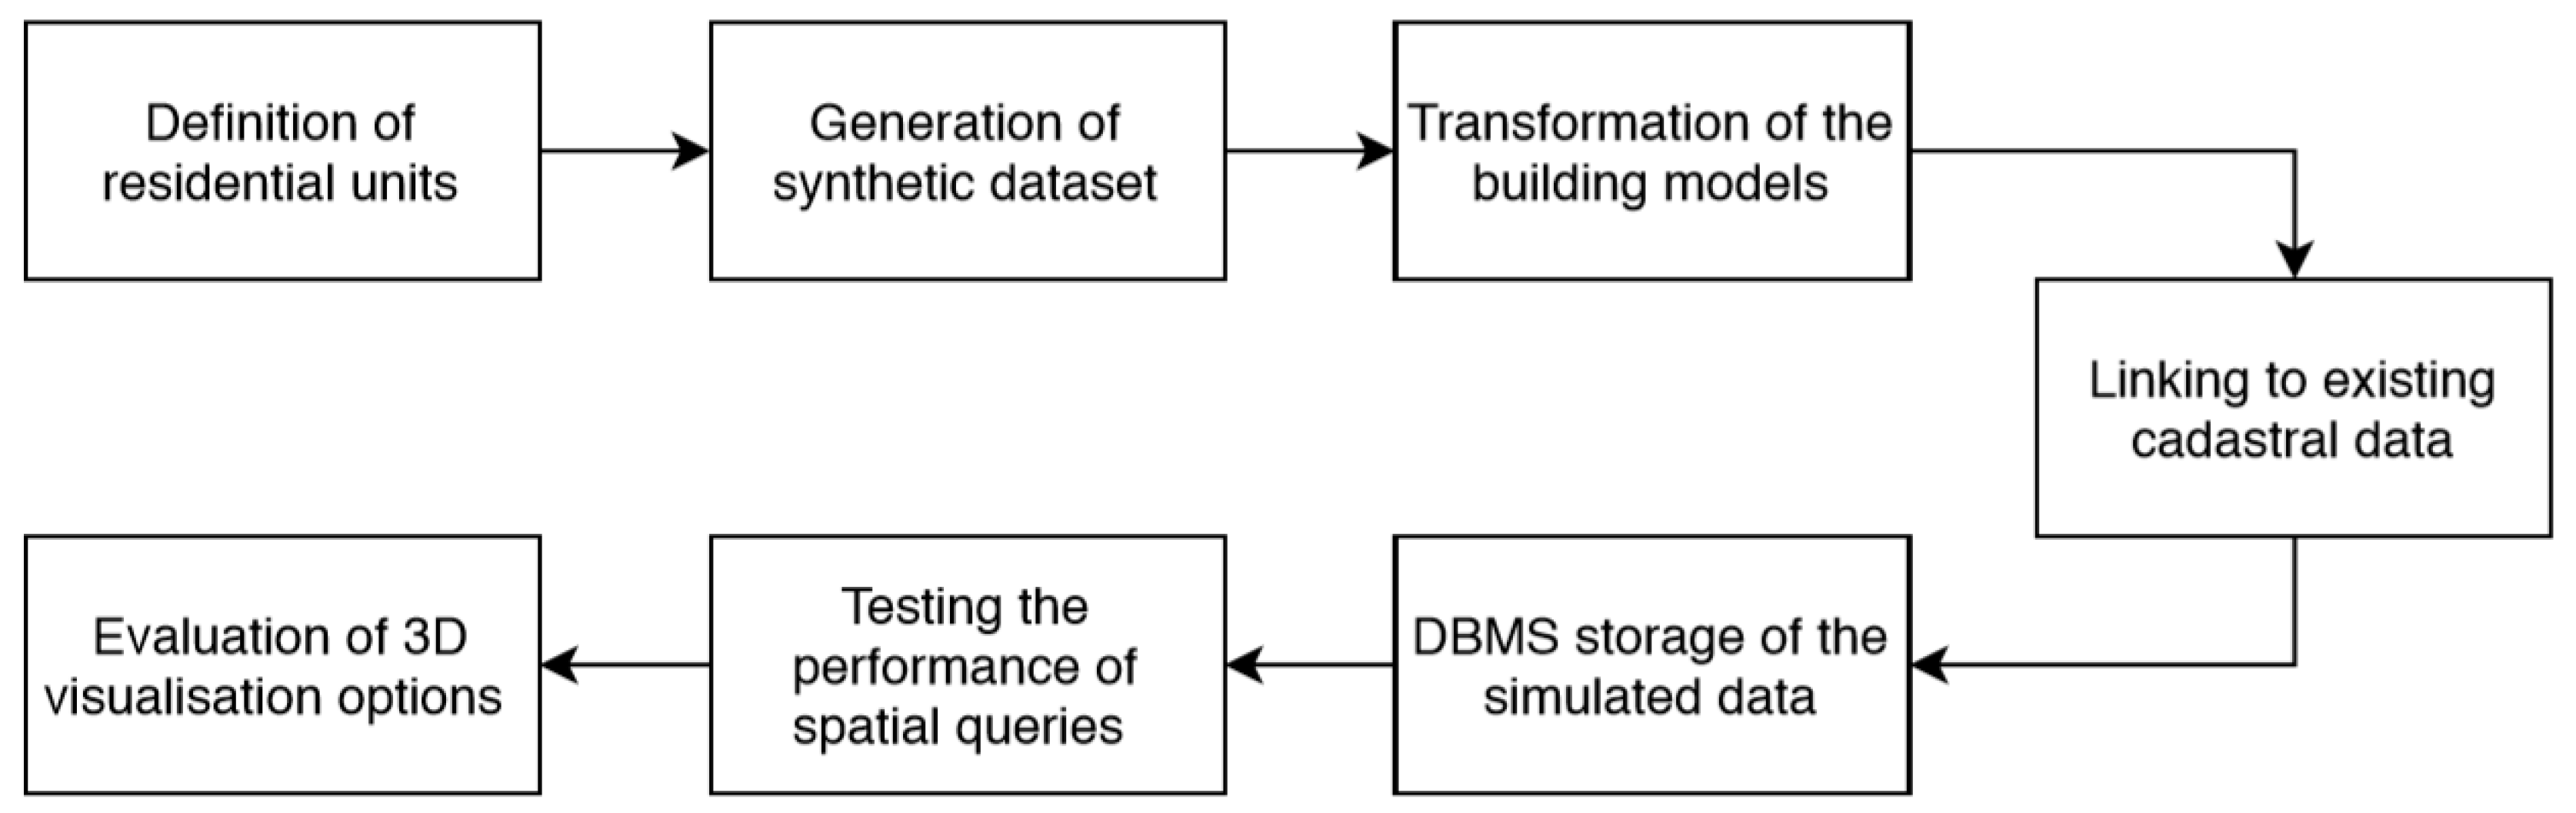
Our study combines reality-based and procedural building modelling. Namely, the simulation of the cadastral dataset is based on available data about existing buildings, acquired from the official records at the National Surveying and Mapping Authority, combined with the simulated data generated by procedural modelling, where randomised 3D building models are constructed based on the predefined rules. The developed approach aims to satisfy the following requirements: (i) the process of generation of the synthetic dataset is guided by the existing cadastral data from the current cadastral database; (ii) the 3D building models in the dataset should be randomised; and (iii) the dataset should be stored in a spatial DBMS, where data storage, access, maintenance, and manipulations can be performed and evaluated. Using the existing cadastral data for the study area, we have tried to obtain more representative placement and configuration of the simulated buildings, where we focus on residential buildings. Figure 1 summarises the framework of our study. The process starts by defining the type of residential units. This information is then used for generating the synthetic dataset using the procedural modelling method [54]. The generated models are then transformed to fit into a GIS environment to be suitable for data storage in the spatial DBMS. The procedurally generated 3D building models are then linked to real cadastral data on buildings by location and the number of storeys. In this study, spatial DBMS is created and run locally. Its structure is focused on the storage of the simulated 3D dataset in the form building models, including their interior spaces, i.e., rooms. Due to different legal frameworks, historical background and other factors, countries have various definitions of real property units as well as various implementations of cadastral databases. The stored simulated data are designed to allow linking data with additional country-specific data.
The study is generic with respect to procedural modelling of 3D building geometries and their transformations. The reality-based part of the study is related to the Slovenian cadastral data with its specific features [55]. For the case study, all residential buildings in Slovenia stored in the Slovenian building cadastre were used. Based on the simulated data, we evaluated the performance of several queries aimed at 3D cadastral database maintenance and data quality control.
2.1. Procedural Modelling of Buildings
For this study, the Evolutionary Program for the Space Allocation Problem (EPSAP) algorithm was used [54]. The EPSAP algorithm consists of a two-stage approach that has an Evolution Strategy (ES) framework, where the mutation operation is replaced by a Stochastic Hill Climbing (SHC) method. Figure 2 depicts the overall generation process. The algorithm starts by creating a set of candidate designs that have their rooms randomly dispersed in the 2D space on each storey. Then, each design is evaluated according to a weighted-sum cost function of eighteen penalty functions that are minimised. At this moment, the second stage starts by iteratively changing each design with random geometric and topologic transformations, such as translation, rotation, stretching, reflection, and swapping. If the transformed design produces an improved solution, the new design is preserved. When the SHC stage is incapable of finding further improvements, the second stage ends and the first stage resumes by selecting solutions that have a fitness lower than the average fitness of all designs. The worst solutions are replaced by new randomised ones, which are also evaluated. This cycle is then repeated until ES stage reaches a maximum number of iterations or is unable to find more improved design solutions (for the complete description of the EPSAP algorithm see [54]). Lastly, the whole 3D building is produced by adding height to each storey (measured from the storey floor to the ceiling), extruding rooms for one or more storeys (e.g., a stair serves a range of storeys), positioning the openings in relation to the room floor (i.e., the distance from the floor to the base of the opening) vertically, and giving height to the opening (i.e., the void height in the wall). In the case when a storey multiplier is present, the storey is repeated.
For our study, six residential building types (two types of detached houses, three types of multi-storey apartment buildings, and a single type of multi-storey apartment building with commerce on the ground floor) were generated. Two of the building types are detached single-family houses of one and two storeys, respectively. The single-storey house comprises bedrooms, bathrooms, living room, kitchen, corridor, and entrance hall. The two-storey buildings have an interior stair that separates the public part of the house from the bedrooms, which are located in the upper storey. Three of the building types are multi-storey apartment buildings of four storeys. These buildings are different in the number of apartments per floor and the number of bedrooms. The last type of building is an eight-storey building that has commerce spaces on the ground floor and access to the roof on the top floor. On the intermediate floors, two three-bedroom apartments are served by a stair and an elevator.
2.2. Transforming the Generated Building Models
The building models comprise enclosed volumes with surfaces for walls, floors, ceilings, doors, and windows (see Figure 3). The adjacent rooms are in a touching relationship, having common interior walls, slabs, and door surfaces.
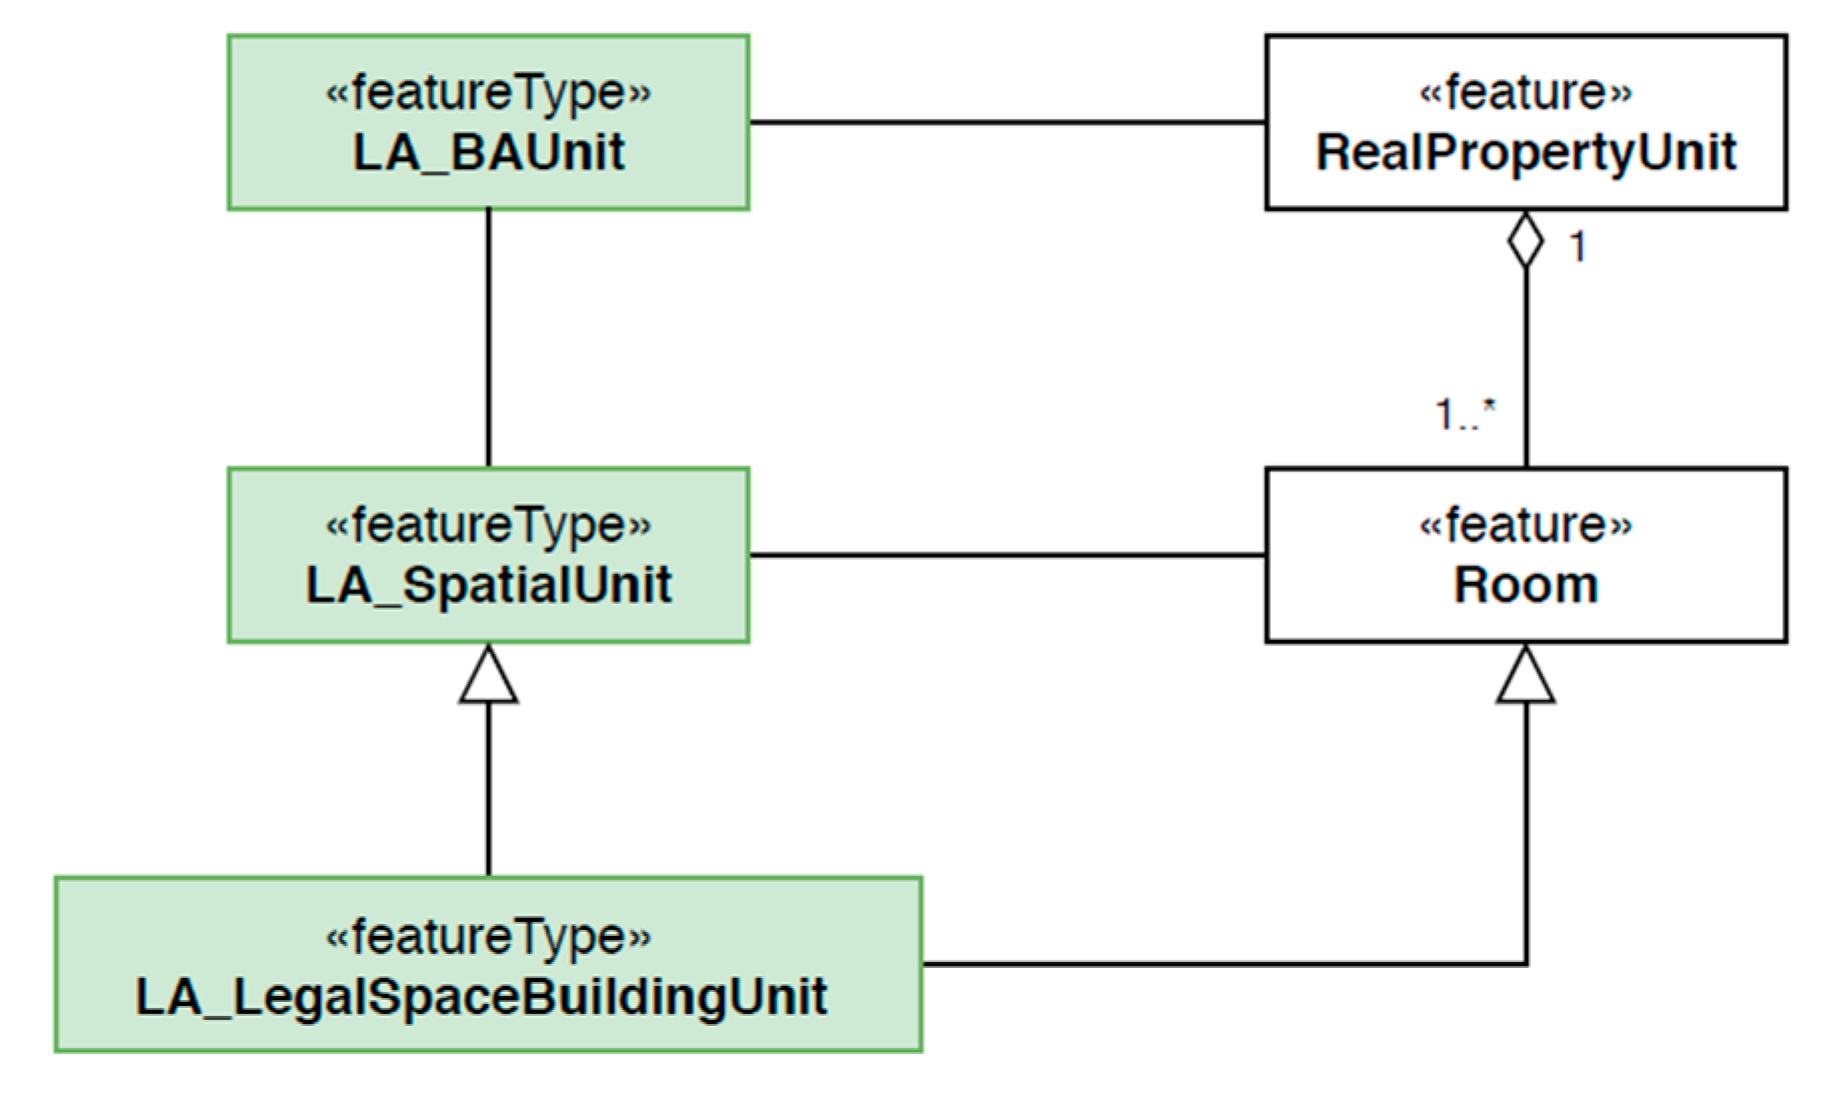
The data model of the simulated buildings can be linked to the LADM data model, as presented in Figure 4. The simulated models of buildings represent their physical components. It must be noted that the boundaries of real property units may not coincide with the physical features of a building [56]. However, in case of buildings, a strong link exists between physical and legal spaces, which has been studied by Aien et al. [28], Li et al. [57] and Knoth et al. [58]. These studies also include the links to the LADM standard data model that are similar to our study. In recent years, many studies investigated the potential of integrating building information models (BIM), which contains physical information on buildings, with 3D cadastre [59,60,61]. In this study, the real property units are realised by the aggregation of rooms that belong to the corresponding real property units. Therefore, the investigation is limited to physically defined 3D boundaries.
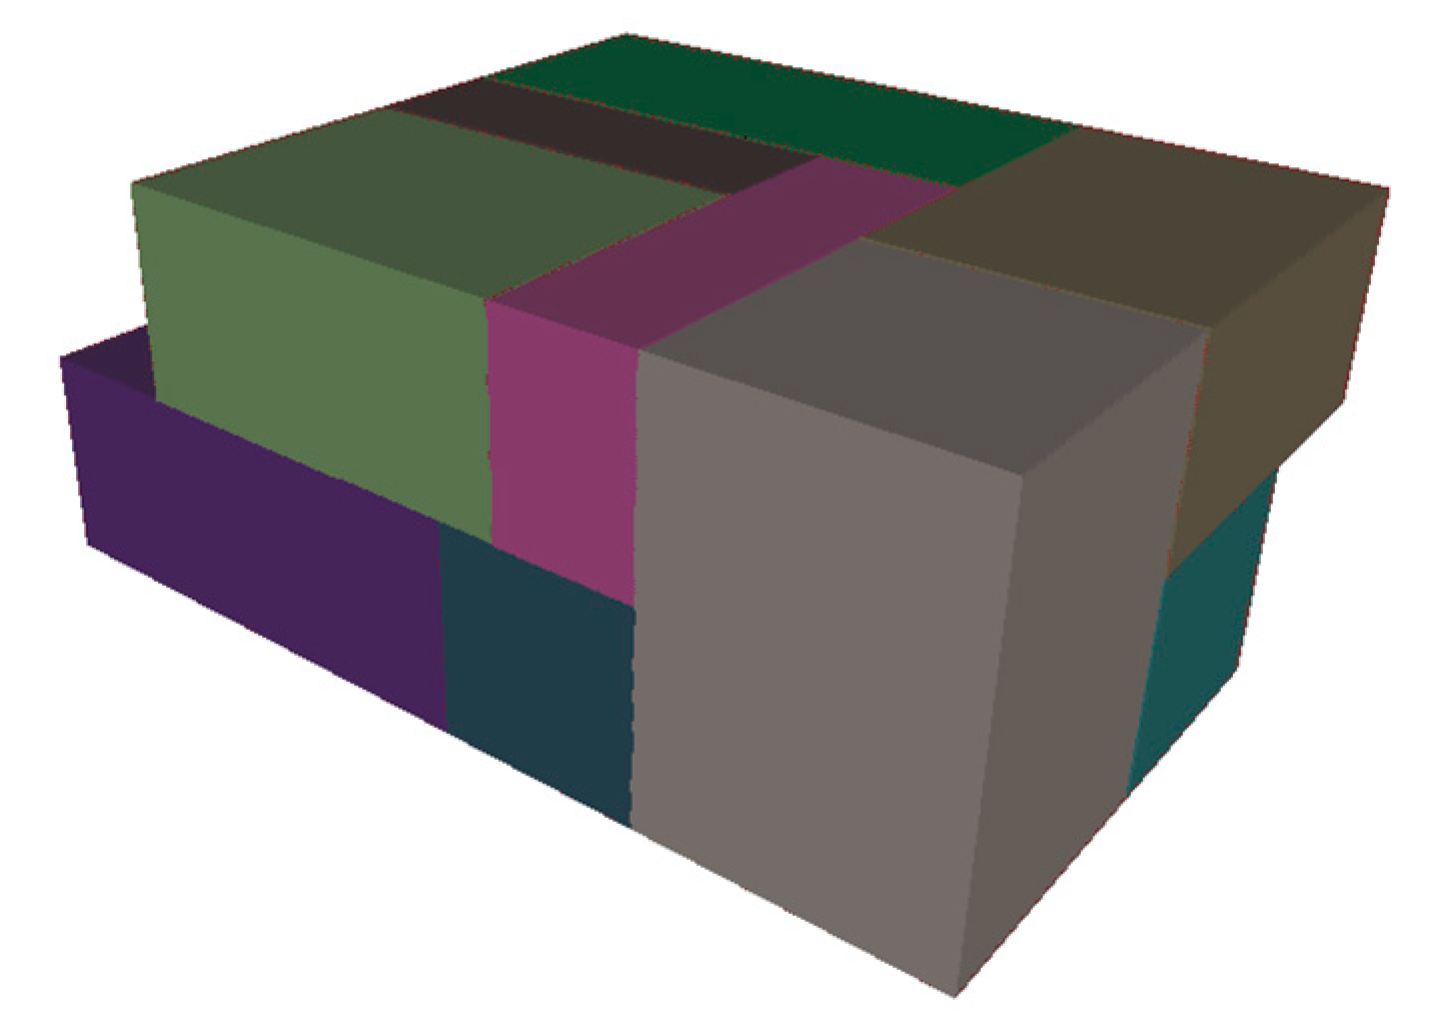
After their generation, the 3D building models are transformed into a data format that is suitable for storage in a spatial DBMS. First, each building needs an assignment of a unique identifier followed by the decomposition of the geometries into individual parts. The decomposed geometries enable the application of the filter that selects only surface type geometries. The selected surfaces are grouped by the room identifier, which enables the modelling of solid geometries for each room (see Figure 5).
The generated 3D building models are placed in a local coordinate system but are not centrally placed. The placement of the models varies relative to coordinate origin, as shown in Figure 6a. Therefore, the central point is calculated for each generated 3D building, based on the room geometries. The Z coordinate of the central point is set to the minimum Z value of the bounding box. The room geometries are then moved using an offset vector connecting the local coordinate system origin and the calculated central point, as shown in Figure 6b.
The 3D building geometries are then inserted in the PostgreSQL DBMS with PostGIS and SFCGAL extensions, which support 3D spatial data storage and maintenance. Before inserting 3D geometries, to avoid issues with geometry conversion from spatial ETL software (FME Desktop Software)-supported geometries to PostGIS, the geometries were triangulated.
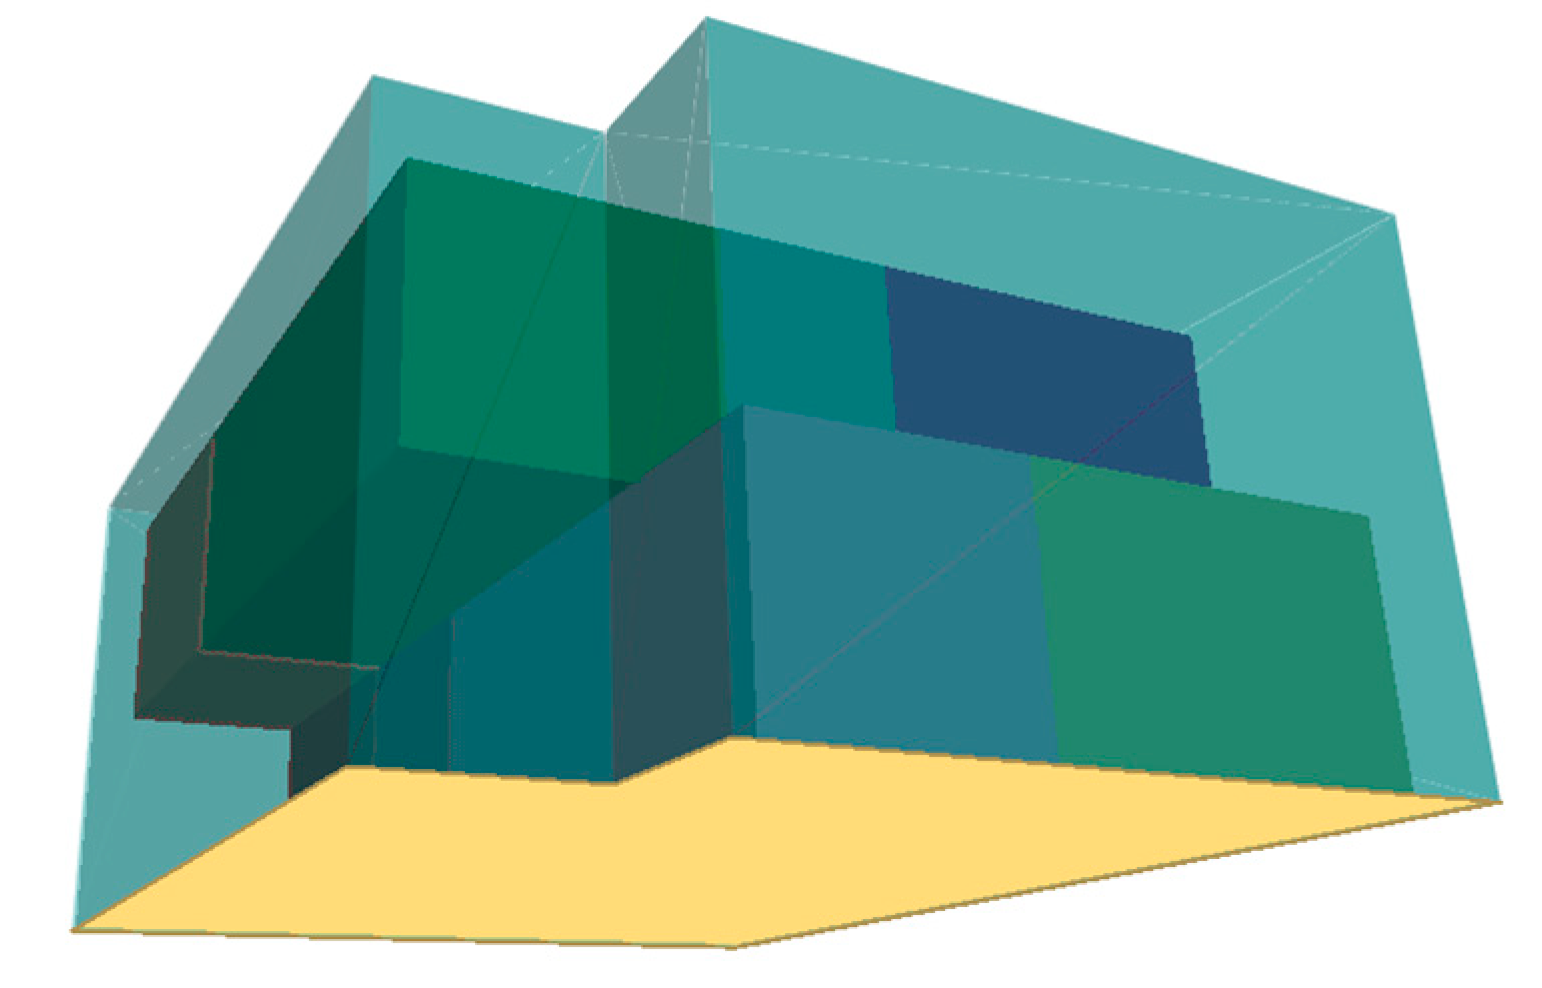
Besides the building interior, a 3D model of the building exterior extents is derived from the generated 3D building models. A (buffered) 3D model of the building in the context of a 3D cadastre can also serve as a representation of a building legal space. First, the 2D outline has to be generated from room geometries. All surfaces of the building model need to be transformed into 2D surfaces. The vertical surfaces transform into line shape and thus need to be filtered out. Our approach has been to calculate 2D surface area and filter all surfaces having zero or very small area (computational error and rounding). The remaining 2D surfaces are dissolved into one 2D surface representing the building 2D outline (Figure 7). The 2D building outline can be buffered to enclose all room geometries. The 3D representation of the building is generated by extruding the 2D building outline. The extrusion vector is calculated from the vertical bounds of the room geometries. If we opt to use buffering, we can place the 2D outline below the minimum vertical bound of room geometries and extrude over the maximum vertical bound. The geometry of each 3D building exterior model should also be moved using the displacement between the central point and coordinate system origin and triangulated before being inserted into spatial DBMS.
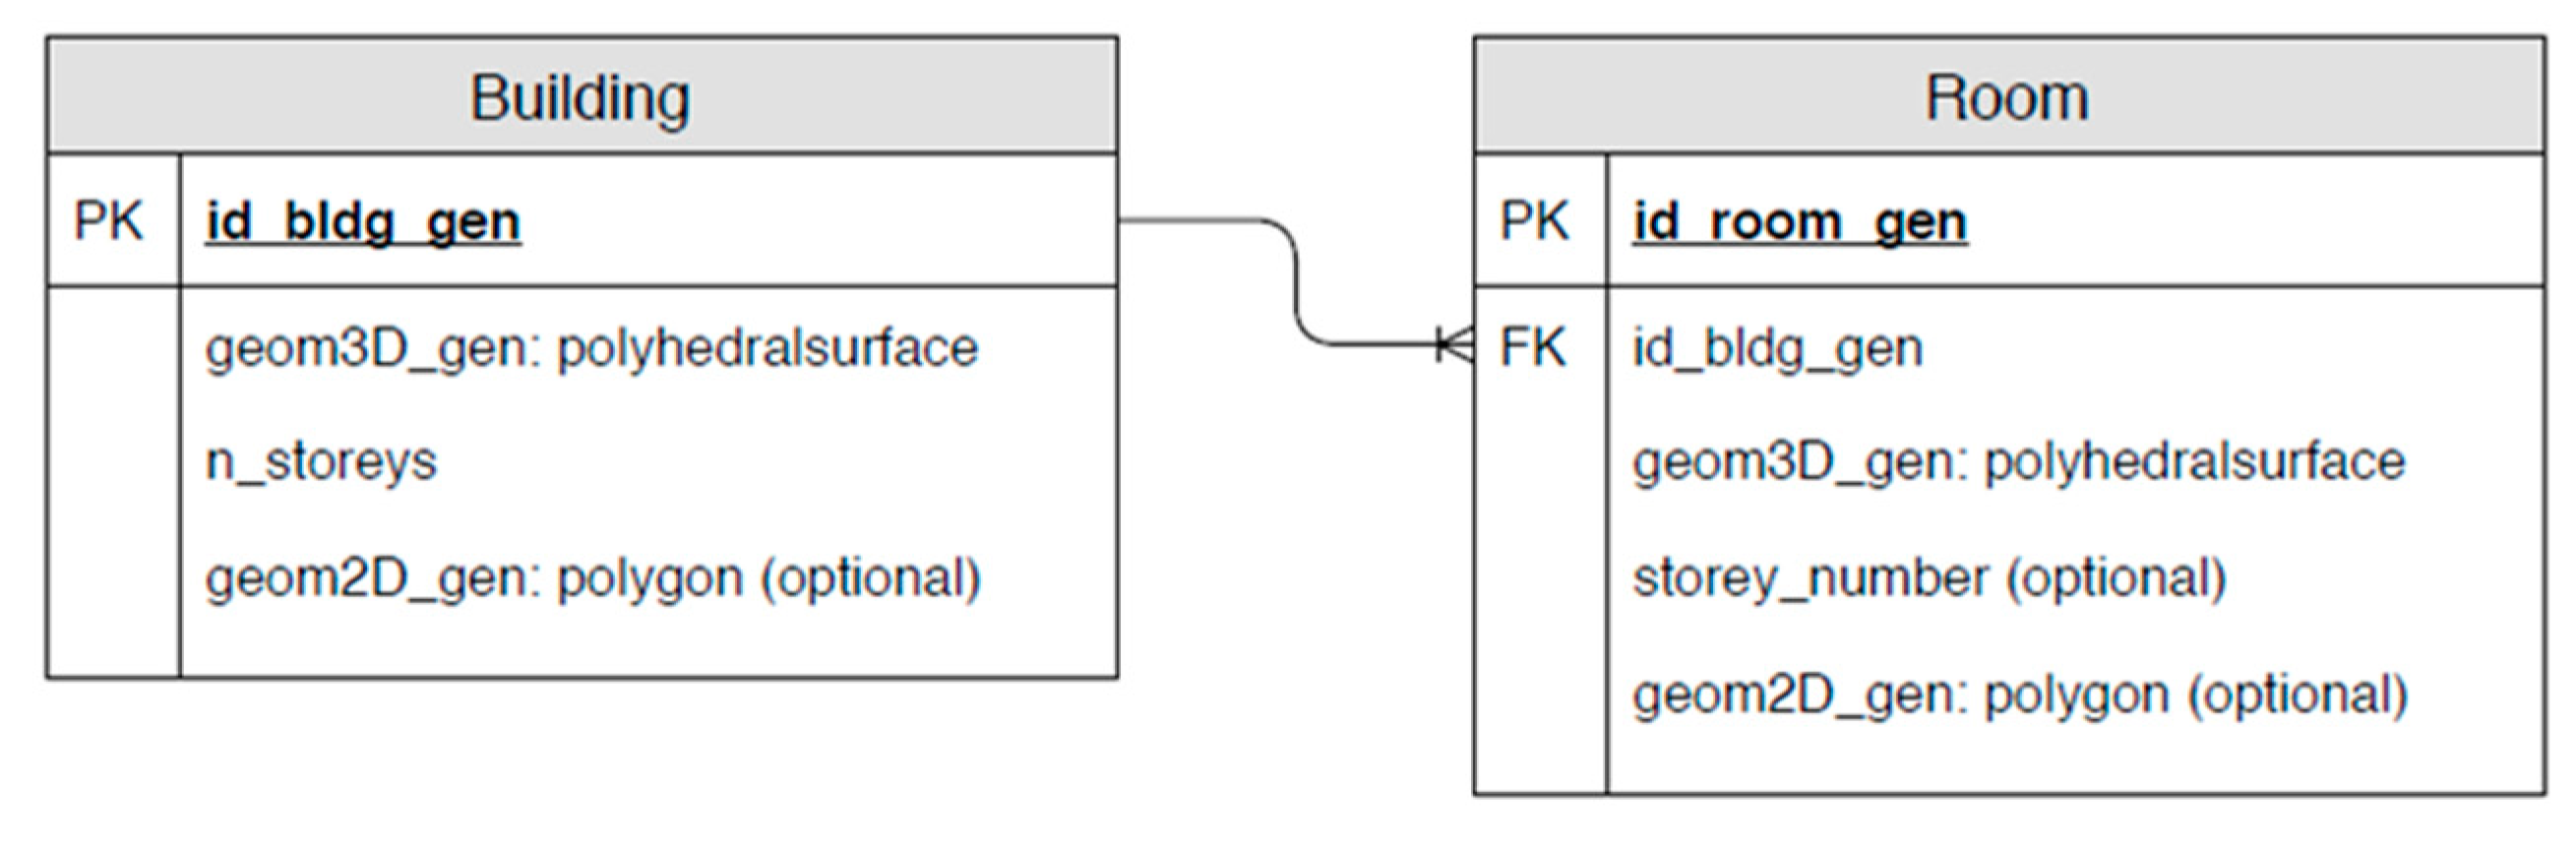
In the spatial DBMS, two tables are created, one for storage of generated 3D models of rooms and one for 3D models of buildings (Figure 8). These two tables are linked by the common building model identifier (id_bldg_gen). The 3D geometries of rooms are stored as polyhedral surfaces, together with the unique room identifier (id_room_gen), the identifier of the corresponding building and optionally the number of the storey in which the room is located (storey_number). For the buildings, the 3D geometry is also stored as a polyhedral surface. Alongside geometry, the attributes containing the unique identifier of the building and the number of storeys are inserted. Optionally, the 2D geometries of rooms and buildings can be stored for applications, where only 2D geometries are needed or supported.
2.3. Georeferencing Using the Link to the Existing Cadastral Data
All the transformed building models are stored in the spatial DBMS in a local coordinate system. However, this is not close to the real case of 3D cadastral data. The generated building models need to be spatially referenced and randomised, as stated in the initial aims of this study. This part is based on the characteristics of Slovenian cadastral data on buildings—the Slovenian building cadastre. There, the buildings are stored in the form of a vector layer with building outline polygons and an attribute database. A common building identifier connects the two datasets. Models are georeferenced by two parameters to the real (Slovenian) data: (i) building location, defined in the national geodetic reference coordinate system D96/TM based on ETRS89; and (ii) the number of storeys. The building location is calculated from a centroid of a building polygon. Those centroids are considered as their reference centre in the local coordinate system origin.
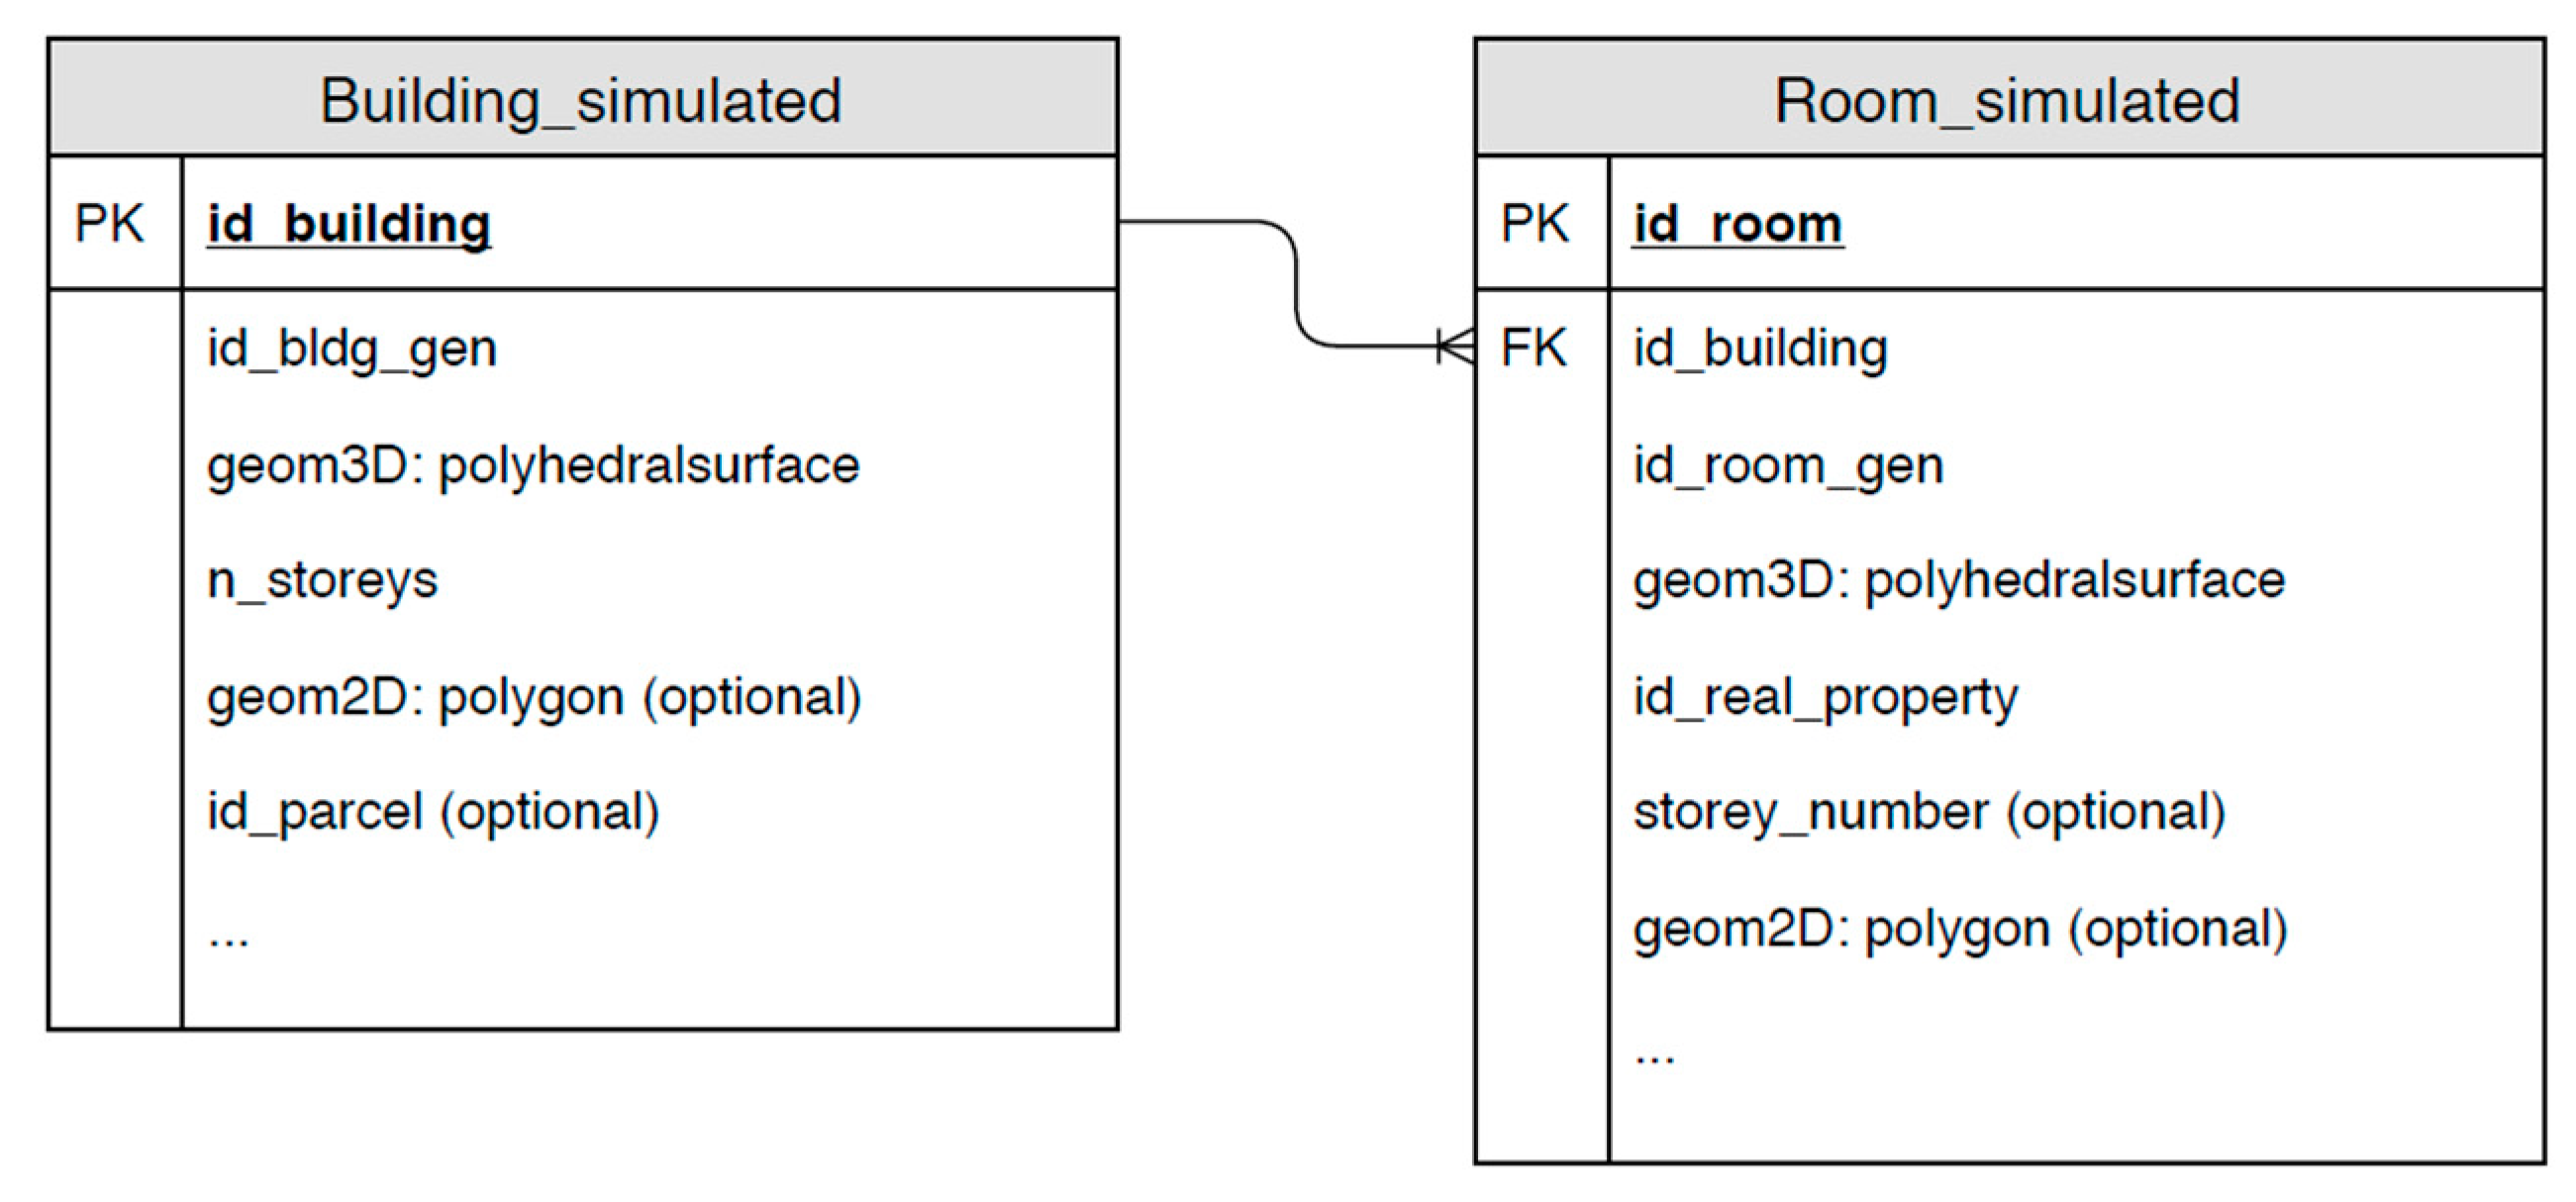
The referencing is performed using SQL queries as all the data (real cadastral data and generated building models) are stored in the DBMS. For the simulated cadastral dataset, we have created two tables, first for data on the building interior (room_simulated) and second for the building exterior (building_simulated) (Figure 9). The two tables are connected by the cadastral building identifier (id_building). Using the id_building, the available cadastral attributes can be added optionally, for instance, the identifier of the parcel to which the building is related. For each building, the corresponding data on building interior (room geometries) is inserted into the room_simulated table. There, the identifier of the real property is stored, which is used to aggregate the rooms into real property units. Optionally, the storey number where the room is located can be stored. Various options for DBMS storage of similar data are discussed in [35].
Each building from real cadastral data (id_building) gets one procedurally generated 3D model assigned (id_bldg_gen), which is moved to the location of the building. There are various approaches to the selection of the corresponding procedurally generated model:
- Generate only one 3D model for each parameter: in our case, one model for each number of storeys. The same 3D model is selected for all buildings with the same number of storeys.
- Generate a given number of 3D models for each parameter (number of storeys). One of the 3D models is randomly selected and referenced to real cadastral data.
- Generate a random 3D model for each real building.
The first approach is the simplest and can be used in cases where the diversity of the models is not a key issue. SQL statements (Appendix A.1 and Appendix A.2) are used to select the data that are to be inserted into the building_simulated and room_simulated tables (the real cadastral data are stored in the table cadastral_building). In both SQL queries, the ST_Translate function is used to move the procedurally generated 3D geometries to the location of the building. The ST_Translate function parameters are the geometry and component of the displacement vector in the X, Y and Z directions. In the SQL queries, the geom_c attribute is a point geometry of the building centroid, and h is a building terrain height attribute. Referencing is performed with the join operation on the number of storeys (one model is available for each storey). The referencing of the rooms is similar to the first query, with the additional join of the room table.
If diversity of the models is required, the second and the third approach can be used. The second approach represents a balance between the first and the third approach, providing a flexible degree of randomness in the simulated dataset. Following the second option, we randomly select a corresponding model for each building. The SQL query that selects data for the building_simulated table is therefore modified to select a random model (Appendix A.3—modifications of Appendix A.1 in bold text). The join operation joins multiple models to each building, which are then grouped and randomly ordered. From each group, the first joined model is selected using row number. The SQL query that selects data for the room_simulated table is also modified (Appendix A.4—modifications of Appendix A.2 in bold text). Instead of joining the building table, the building_simulated table is joined to the cadastral_building table. By doing this, we get information as to which model is assigned to the building. With this information, the room table can be joined.
3. Results
The Slovenian building cadastre classifies buildings based on their usage. In this study, we focus only on buildings that are classified as residential. The reason is that more complex building types such as schools and hospitals require more complex functional programs. They cause the exponential growth of the required computational time due to the combinatorial nature of the problem.
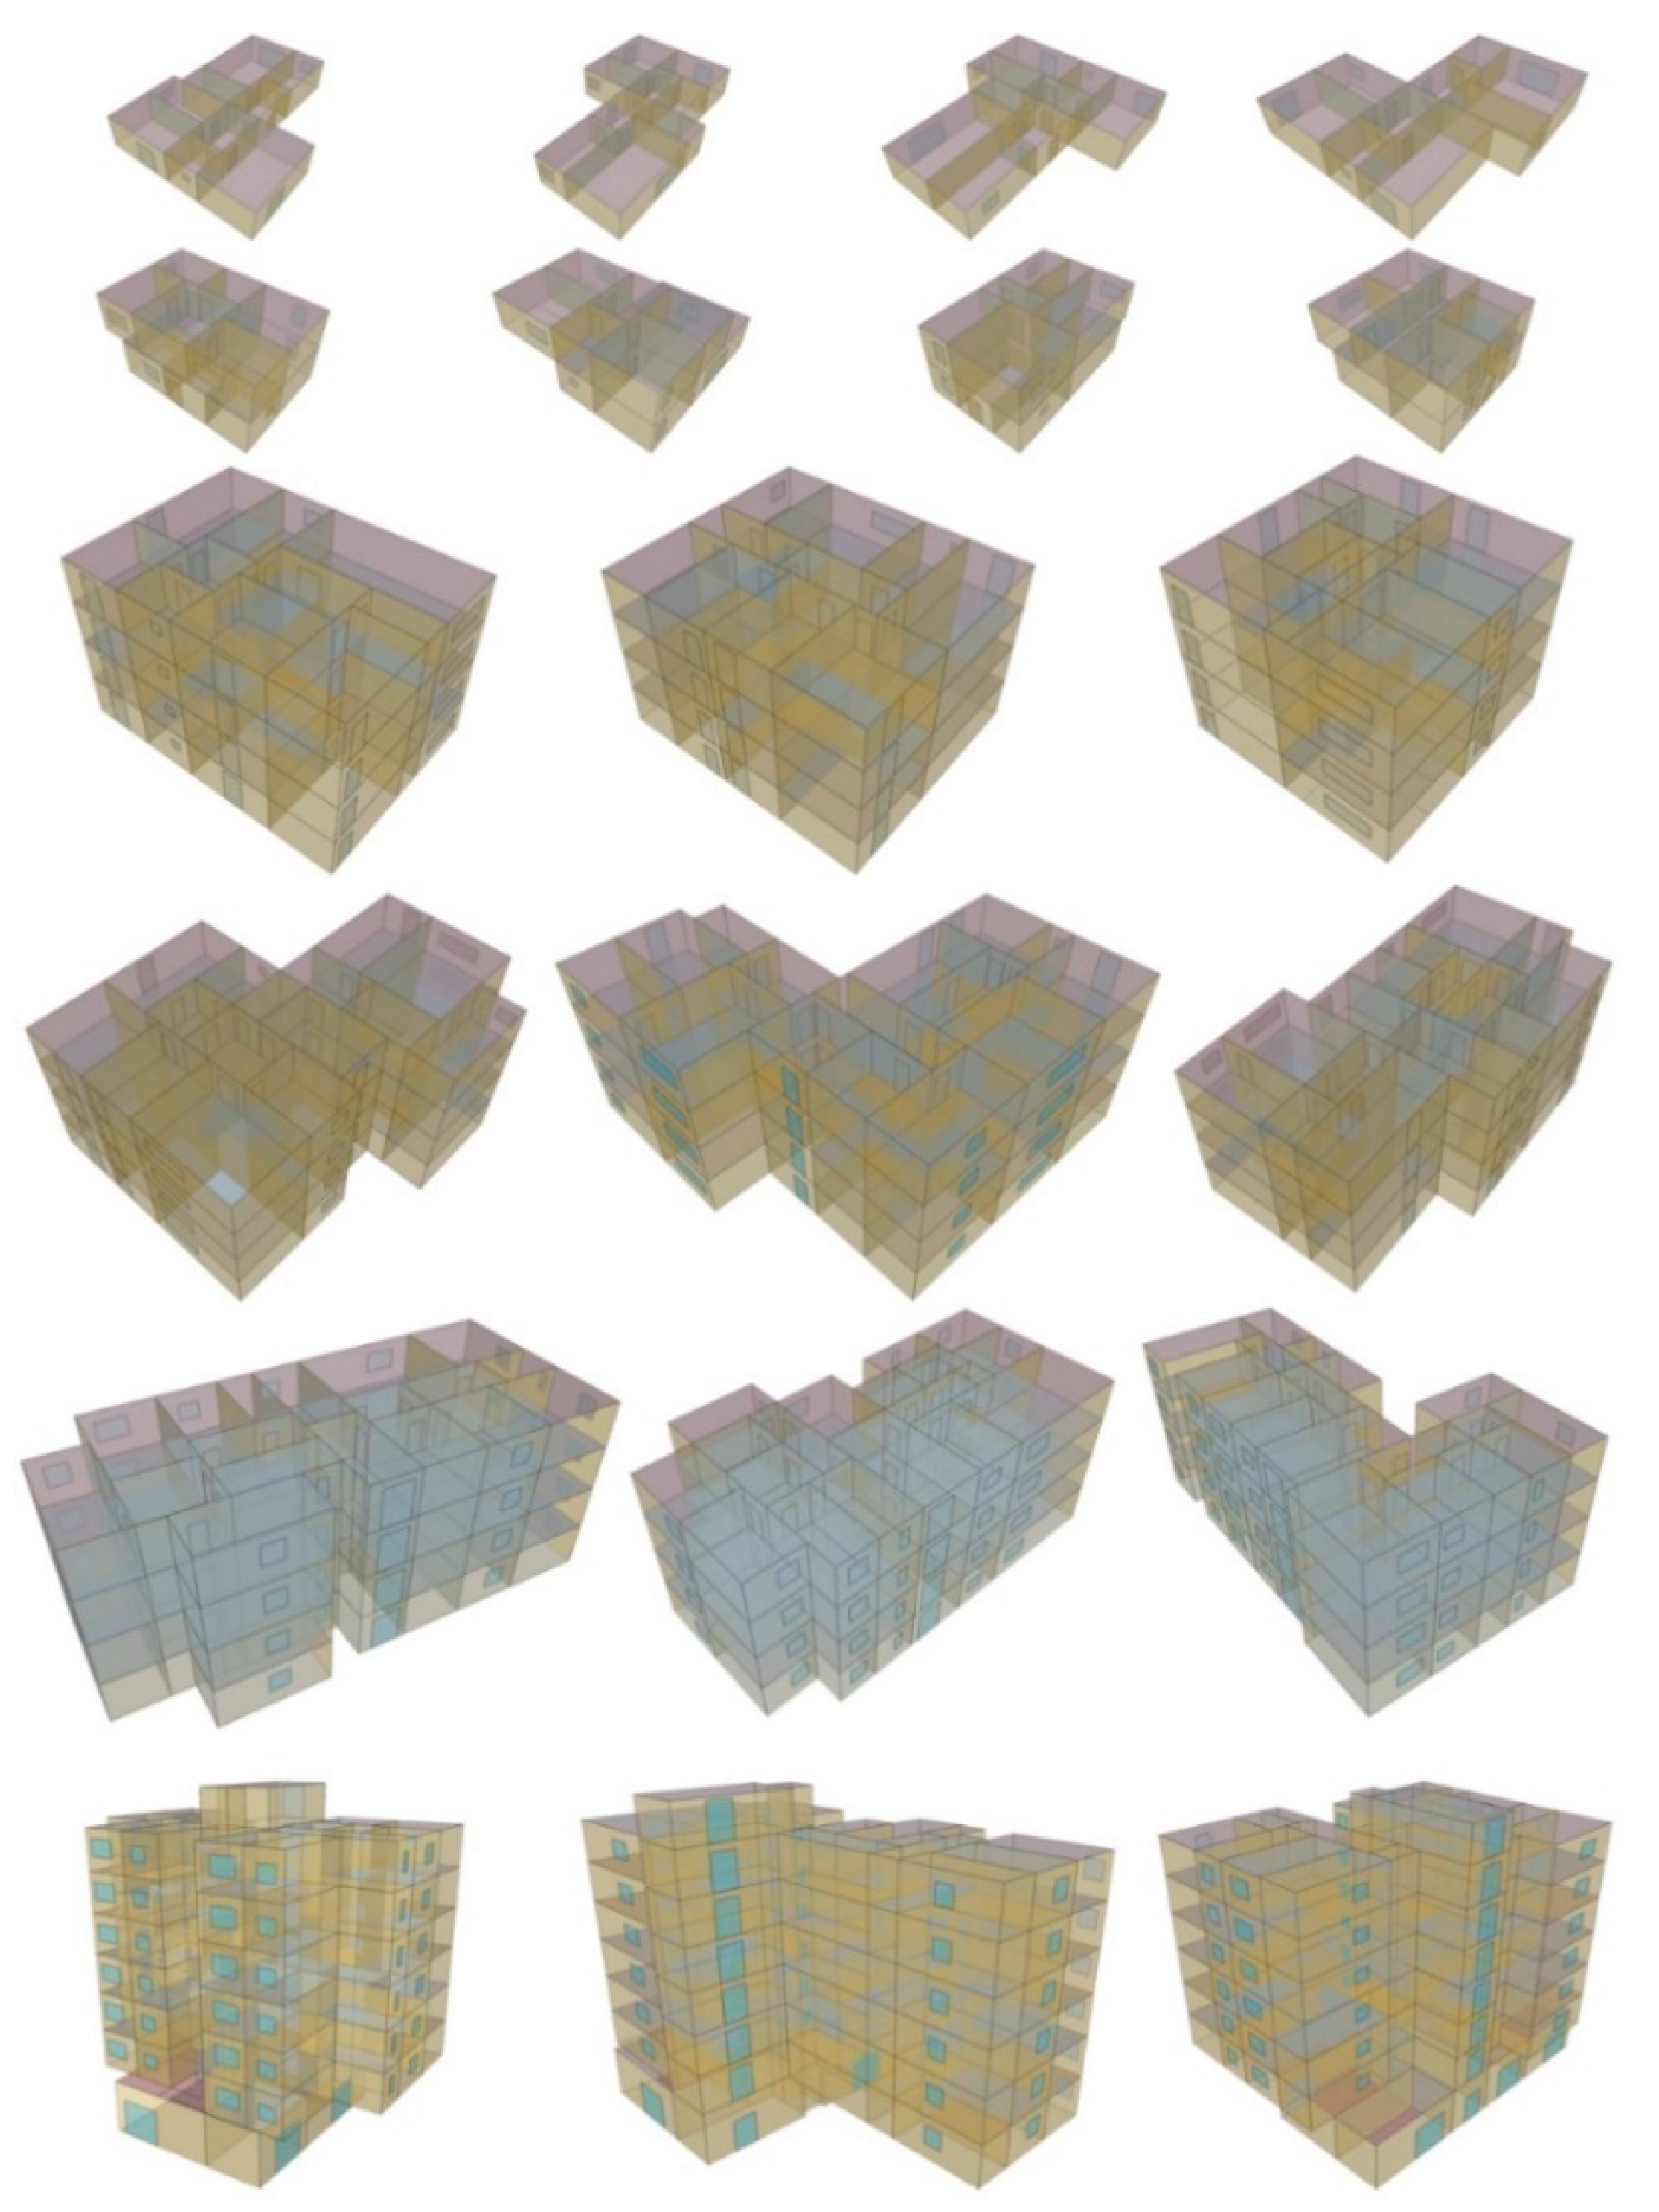
The buildings were generated in four runs, each for a building type, in a 2.8-GHz Dual-Core CPU with 8 GB of RAM. Multi-threading was used. In the generation of each building type, the duration of the processing time ranged from 49 min to 15 h, depending on the complexity of the building requirements. First, the number of storeys in the Slovenian building cadastre was investigated. The test showed that 94% of the residential buildings have four or fewer storeys. Based on this, we decided to use 1, 2, 4 and 8 storey building models for the case study. In total, nine algorithm runs were carried out, producing 282 building models. Figure 10 displays a few examples of the generated buildings (all generated buildings can be accessed from the link provided in the supplementary materials).
The simulation ran in a computer with an i7-8700 CPU, 32 GB of RAM. The PostgreSQL database was running locally on this computer. The building_simulated and room_simulated tables were populated with the transformed procedurally generated 3D models, which were referenced to the data from the Slovenian building cadastre for the whole country (the data can be accessed from the link provided in the supplementary materials). We evaluated the performance of the simulation process and of selected SQL queries, aiming to check the data validity.
We selected the second approach for referencing the generated models to real cadastral data and thus get a degree of randomness in the simulated dataset. The transformation of the generated models was performed using FME Desktop software (the processing routine can be accessed from the link provided in the supplementary materials). The models with a higher number of storeys were more demanding in terms of processing time (a single-storey took 3 min, 2-storey 4 min, 4-storey 14 min, and 8-storey 37 min). The most demanding step in the transformation process is the creation of solid geometries. The referencing of the transformed models was performed in the PostgreSQL database using the SQL queries. The building_simulated table was created using a modified A3 SQL query (Appendix A.5—modifications of Appendix A.3 in bold text). The modification adds the classification of the buildings into four classes by the number of storeys. The SQL query A4 that selects data for room_simulated data was used without modifications. The SQL query execution times for creating building_simulated and room_simulated tables took 2 min 44 s and 12 min 35 s to process 512,191 (table size of 352 MB) and 10,985,775 (9274 MB) rows, respectively. After creating the tables, an index on the geometry column was created, and the VACUUM ANALYZE operation was performed to increase the performance of spatial queries.
With the data in the database, the performance of various processes and applications related to 3D cadastral data can be tested. We tested the performance of 3D queries that are designed to check the data for inconsistencies. For this, 3D functions from the PostGIS SFCGAL extension were used. SFCGAL is a C++ wrapper library that supports ISO 19107:2013, and OGC Simple Features Access 1.2 for 3D operations. The library is built around CGAL (Computational Geometry Algorithms Library), which provides algorithms for geometric computation [62].
The first SQL query checks for the intersection of 3D geometries in building_simulated table (Appendix A.6). The intersection of two building geometries represents an error, whether the geometries represent the physical or legal extent of the building. The placement of the models is performed using the centroids of real buildings. As the extents of real buildings and the procedurally generated models do not coincide, it is likely that some geometries intersect. The function that checks for the intersection is a Boolean-type function ST_3DIntersects. It has two arguments, representing two geometries that are checked for the intersection. A condition is added to exclude checking two identical geometries for the intersection (a.id_building != b.id_building). The function returns a TRUE value when parts of geometries are overlapping or if they touch each other. From the cadastral point of view, these two relationships are different, as touching of legal units is not forbidden, while overlapping is. There is no option to differentiate these two relationships without using additional 3D functions. The function uses the available spatial indexes to increase the performance. It took 2 min to find 128,812 intersections in the building_simulated table.
While the first query checked for the intersection of exterior geometries, the second one focused on identifying the room geometries that intersect each other (Appendix A.7). These intersections need to be checked separately for each building as the first query has checked intersections between exterior geometries of buildings. In our case, the room geometries are used to define the extents of the real property units (see Figure 4). Overlapping room geometries thus represent an error also in 3D cadastral context, as real property units are generally not allowed to spatially intersect each other. All the adjacent room geometries in the simulated dataset are in a touching relationship, which means that the ST_3DIntersects function identifies these as intersecting ones. As stated, there is no straightforward option to differentiate between touching and overlapping geometries when using PostGIS SFCGAL functions. Therefore, in the second query, the ST_3DIntersection function was used, which constructs 3D geometries that represent the intersections. If we calculate the volume of this intersection, it is possible to differentiate between touching and overlapping relationships. However, the ST_3DIntersection function is more demanding to execute than ST_3DIntersects as it returns the geometry of the intersection rather than the Boolean TRUE or FALSE. The query A7 selects the building identifier and identifiers of the pairs of rooms that overlap. The rooms are checked only against other rooms in the same building (a.id_building = b.id_building), excluding checking of the intersection of a room with itself (a.id_room != b.id_room). As the ST_3DIntersection function is computationally very demanding, only one building with four storeys was checked for overlap, which took 10 min to execute. The fact that the neighbouring room geometries are all in a touching relationship results in a large number of pairs of room geometries (389) to be checked with the ST_3DIntersection function.
The third error in the data that was checked was the intersection of room geometries with building exterior geometry. If the intersection is found, it means that the building exterior geometry does not enclose all room geometries. The room geometries can be checked for intersection with the corresponding building exterior geometry in the building_simulated table (Appendix A.8). The query was tested on the dataset for the whole country. The query execution time was 5 h and 18 min.
All 3D spatial queries except those containing the ST_3DIntersection function performed well with the complete dataset. This function validates both input geometries, which uses the majority of the processing time. However, if the input geometries are correct, this validation is not necessary. While the SFCGAL library allows disabling the validity check, the PostGIS SFCGAL implementation does not allow this.
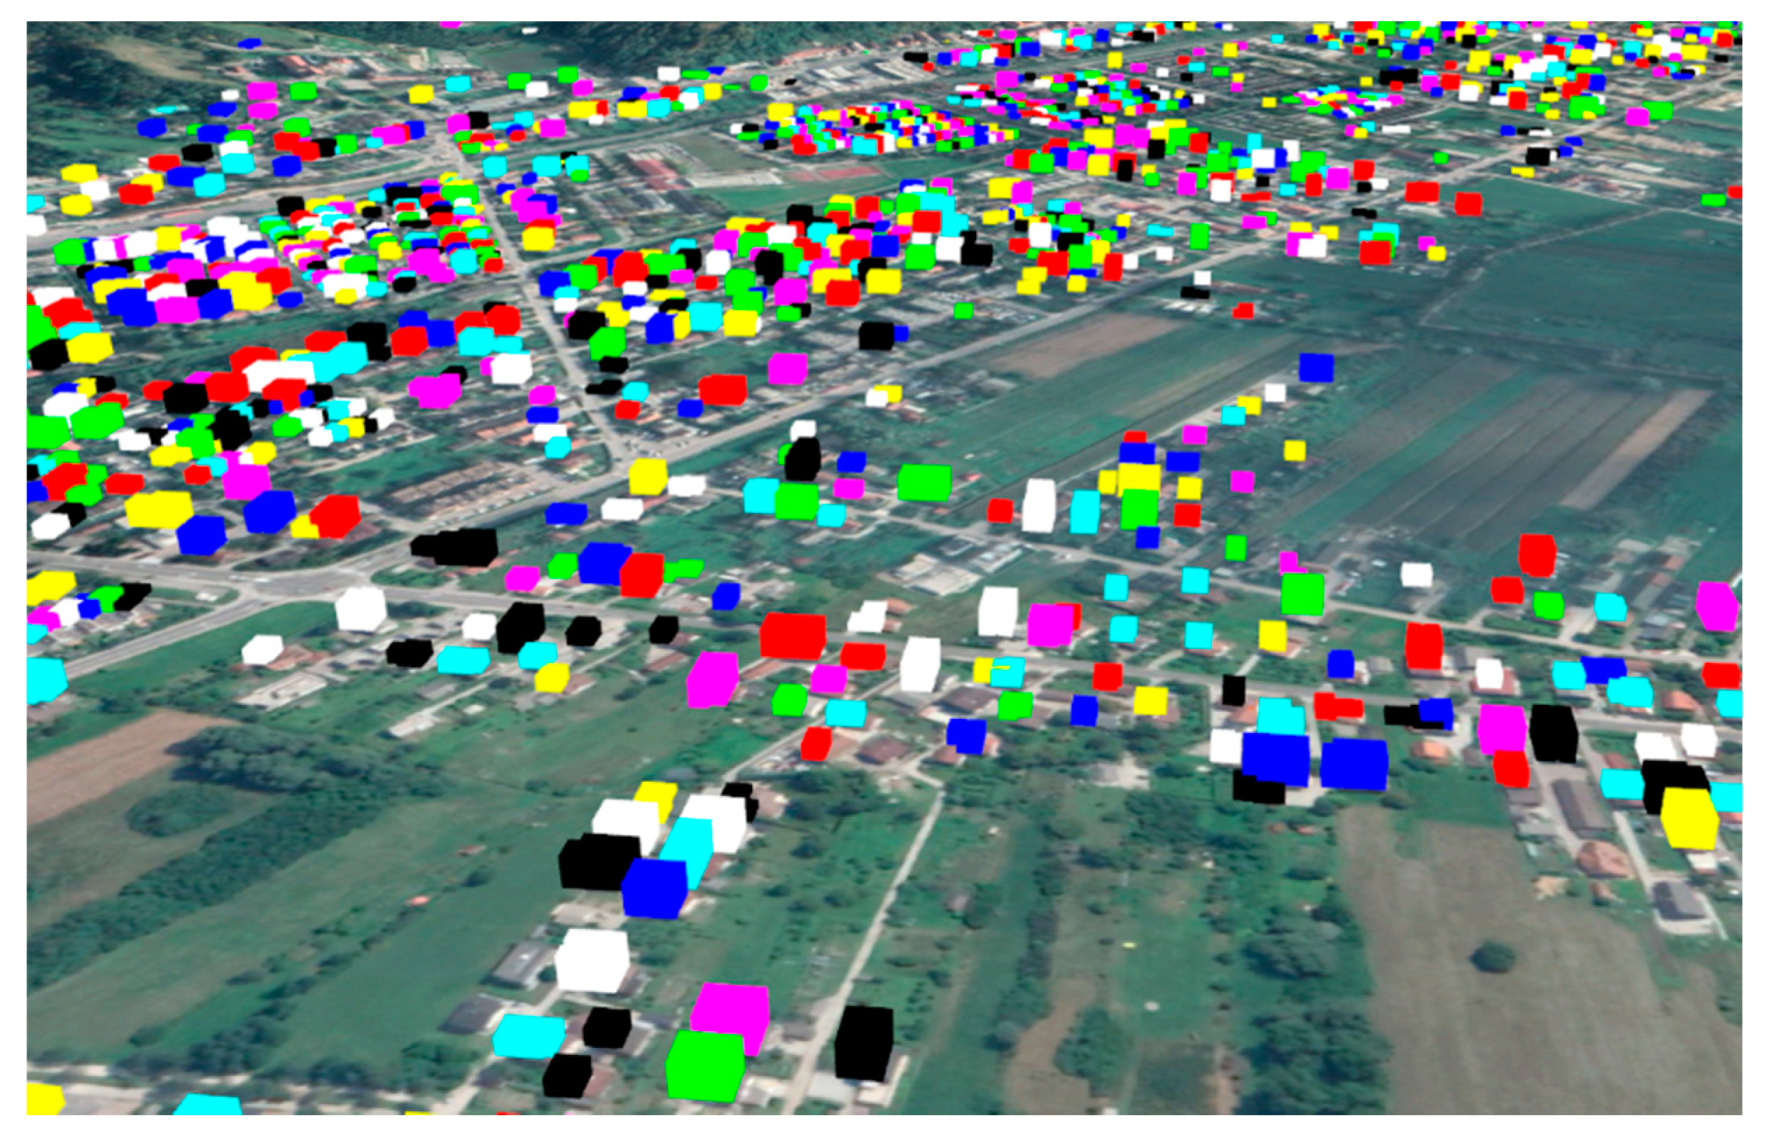
To evaluate the performance of 3D visualisation, the simulated dataset is converted to a KML file for visualisation in Google Earth, and to 3D tiles for visualisation in Cesium. Both conversions were performed using FME Desktop software. As the KML file containing all 512,191 buildings from the building_simulated table failed to load in Google Earth (waiting time of 2 h), multiple KML files that varied in size to test the performance were created. The KML files were created with the feature count limit of 10,000, 5000 and 1000. The performance of KML file generation and loading time are roughly proportional to the feature count: 1000, 5000 and 10,000 took 7 s, 25 s, and 54 s, respectively, for file creation and 12 s, 70 s and 150 s, respectively, for loading into Google Earth. Once the files were loaded, the performance of the 3D visualisation (pan, zoom, rotate) was good in all cases (Figure 11).
For the visualisation in Cesium, 3D tiles of buildings were prepared from the building_simulated table (512,191 records) and rooms in the room_simulated table (10,969,100 records). It took FME 6 min to create 3D tiles for buildings and 4 h 35 min for rooms. For testing purposes, Cesuim was run locally on an Apache Tomcat web server using the same PC that was used for other tests. A simple web application that visualises 3D tiles on the globe was used. Compared to the performance of 3D visualisation in Google Earth, Cesium effectively handled 3D visualisation of buildings and rooms for the whole country.
The proposed approach proved to be efficient for the simulation of large-scale 3D cadastral datasets for buildings referenced to some basic characteristics of the existing cadastral data, such as building location and number of storeys. The execution times of all steps needed to generate the simulated dataset are acceptable, given that we performed the simulation for the whole country, i.e., for the case of all 512,191 residential buildings in Slovenia.
4. Discussion
In this study, the location of the real buildings and the number of storeys are used to make the generated dataset more representative. Although the building generation algorithm allows us to specify other aspects of real buildings (area and dimension limits, height, etc.), the algorithm was left free to generate buildings from interior spatial requirements, such as to satisfy minimum room dimensions and minimum storey areas, in the proposed approach. This led to real buildings with a large footprint being assigned simulated buildings that were too small and vice versa. Consequently, the SQL query A6 identifies the intersections of the building geometries, that do not intersect in reality. Therefore, future developments will require the generated buildings to be produced within the statistical distribution of the real data. For a perfect match scenario, the simulated buildings would have to be generated exactly according to each real building in the country. In addition, there are computational and information limitations to overcome in the future. In the presented approach, the simulation is limited to residential buildings. When the building type information in the real cadastral dataset and higher computational capacity for generation of buildings are available, the approach may be improved to include also other types of buildings, such as schools, hospitals and offices.
Regarding the assignment of real property unit identifiers to rooms, various methods can be used. Using these identifiers, the 3D geometries of rooms can be aggregated to represent the extents of a real property unit. The identifier can be assigned using the storey and/or apartment number. Another option is to obtain the number of real property units from the existing cadastral data or real property registry. In this case, the assignment of identifiers to the simulated building is more challenging to simulate. One option is to assign the identifier to each room randomly. To obtain more representative real property units, the adjacency of rooms would have to be considered. This way, we would generate groups of adjacent rooms, which would get the same identifier assigned. Another option is to combine the apartment units to get the desired number of real property units.
Depending on the data model that we test, the 3D geometries of adjacent rooms that belong to the same real property unit can be joined into one 3D geometry of a real property unit. This removes the internal borders of rooms and preserves only the exterior boundaries of the group of adjacent rooms. This principle, using 2D geometries of the joined rooms representing a real property unit in one storey, is used for registration of buildings in Slovenia, where for new cadastral entries, 2D outlines of real property units are registered separately for each storey.
Besides the simulated buildings, the BIM datasets could also be integrated into the simulation process. In the studies that combine BIM and 3D cadastre, the IfcSpace entity is used for modelling 3D legal spaces [56,59]. The proposed method in this study uses FME Desktop software, which can be used to extract the IfcSpace entities and obtain the 3D building model. The structure of such a model is comparable to the simulated building model, but it is much closer to the real building. However, given the small amount of available BIM data that is available, the current potential of including BIM datasets is limited.
Compared to the approaches of Ledoux and Meijers [36] and Biljecki et al. [37], which also use existing data on buildings for 3D modelling, the proposed method is focused on generating 3D building models from its interior arrangements. Regarding external 3D geometry of buildings, our method underperforms due to external 3D geometry being a consequence of the interior arrangement. Thus, the other two methods are demonstrated to be more representative of reality in this aspect.
The executed queries demonstrate how the simulated 3D cadastral dataset can be used to define 3D cadastral data management strategies. Based on the executed queries, we can see that the queries containing the ST_3DIntersection function are too demanding to be used for regular checks of the whole cadastral database. Instead, these queries can be used to ensure the data validity at the moment of insertion or when some of the geometries are modified. In these cases, the new or modified geometry does not need to be checked against all geometries in the database, but only against a small subset.
5. Conclusions
In this study, a methodology to generate a not yet existing 3D cadastral dataset for buildings has been presented, thus answering the paradox of “how to get a complete dataset of something that is still in the design phase”. The proposed method for simulating the 3D cadastral dataset was successfully applied for the case of Slovenia, thus proving that it can be efficiently applied to large areas. The evaluation of the database performance was illustrated with three spatial SQL queries, designed to check for the errors related to spatial relationships of 3D geometries. The adjacent geometries of the real property units in cadastre are generally in a touching relationship. The ST_3DIntersection function is needed to distinguish between the touching and overlapping relationship of two geometries, of which the first is allowed and the second represents an error. The tests showed poor performance of the queries that contain the ST_3DIntersection function. Therefore, based on the results of the performance tests of SQL queries, we can conclude that it is beneficial to have a representative dataset available in the design phase of 3D cadastral information systems. This allows us to identify problems and critical issues during the early stages of development and develop optimal DBMS storage and data management processes for cadastral data. The evaluation of 3D visualisation options shows that using 3D tiles and Cesium platform is a better option than using KML files and Google Earth, as 3D tiles are designed for visualisation of large 3D datasets. Cesium platform has therefore proved to be suitable for visualisation of large-scale 3D cadastral datasets.
Further enhancements of the presented method can be performed if additional parameters and attributes are provided for the buildings and parts of buildings, such as room types, their number, and area of each room per storey. The presented method needs further investigations to include also other aspects of real buildings into the building generation process, such as footprint area or outline, volume, and height. The developed method can also be used outside of 3D cadastral domain to develop spatial analytical tools for buildings in a 3D environment, which is also an open research area in the geospatial domain.
Supplementary Materials
The dataset of the 282 generated residential 3D buildings is available at the private link: https://0-doi-org.brum.beds.ac.uk/10.6084/m9.figshare.12283805. The dataset of building footprints from Slovenian building cadastre (Geodetska uprava Republike Slovenije, Grafični podatki katastra stavb, 11. 5. 2020) in shapefile format is available at: https://0-doi-org.brum.beds.ac.uk/10.6084/m9.figshare.12283760.v1. The projection is EPSG 3794. The processing routine for transforming each generated building (Section 2.2) is available at: https://0-doi-org.brum.beds.ac.uk/10.6084/m9.figshare.12288368.v1. The script can be run using FME desktop 2020 software.
Author Contributions
Conceptualization, Jernej Tekavec and Anka Lisec; Data curation, Jernej Tekavec and Eugénio Rodrigues; Formal analysis, Jernej Tekavec; Funding acquisition, Anka Lisec; Investigation, Jernej Tekavec, Anka Lisec and Eugénio Rodrigues; Methodology, Jernej Tekavec and Eugénio Rodrigues; Project administration, Anka Lisec; Resources, Jernej Tekavec, Anka Lisec and Eugénio Rodrigues; Software, Jernej Tekavec and Eugénio Rodrigues; Supervision, Anka Lisec; Validation, Jernej Tekavec and Eugénio Rodrigues; Visualization, Jernej Tekavec and Eugénio Rodrigues; Writing—original draft, Jernej Tekavec; Writing—review and editing, Jernej Tekavec, Anka Lisec and Eugénio Rodrigues. All authors have read and agreed to the published version of the manuscript.
Funding
The authors acknowledge the financial support from the Slovenian Research Agency (research core funding No. P2-0406 Earth observation and geoinformatics).
Conflicts of Interest
The authors declare no conflict of interest.
Appendix A
Appendix A.1. SQL Query to Select the Data for the Table Building_Simulated
- SELECT id_building, id_bldg_gen, n_storeys,
- ST_Translate(geom3d, ST_x(ST_GeometryN(geom_c,1)), ST_y(ST_GeometryN(geom_c,1)),h) as geom3d
- -- translation of in the x ynd y direction using ST_Translate function
- -- from 0,0 to the x,y of the centroid of the real building
- FROM cadastral_building
- JOIN building ON building.n_storeys = cadastral_building.n_storeys
- -- To each building from existing cadastral data, join the simulated
- -- building with the appropriate number of storeys
Appendix A.2. SQL Query to Select the Data for the Table Room_Simulated
- SELECT id_building, id_room_gen,
- ST_Translate(room.geom3d, ST_x(ST_GeometryN(geom_c,1)), ST_y(ST_GeometryN(geom_c,1)),h) as geom3d
- -- translation of in the x ynd y direction using ST_Translate function
- -- from 0,0 to the x,y of the centroid of the real building
- FROM cadastral_building
- JOIN building ON building.n_storeys = cadastral_building.n_storeys
- JOIN room ON room.id_bldg_gen = building.id_bldg_gen
- -- To each building from existing cadastral data, join the simulated
- -- building with the appropriate number of storeys and then join all the
- -- rooms that to this building
Appendix A.3. Modified A1 SQL Query (Modifications in Bold Text) to Select the Data for the Table Building_Simulated
- SELECT id_building, id_bldg_gen, n_storeys,
- ST_Translate(geom3d, ST_x(ST_GeometryN(geom_c,1)), ST_y(ST_GeometryN(geom_c,1)),h) as geom3d FROM (SELECT *, row_number() over(PARTITION BY id_building ORDER BY random()) as rn
- -- More than one simulated buildings join to each real building. Randomly
- -- assign row number to those simulated buildings
- FROM cadastral_building
- JOIN building ON building.n_storeys = cadastral_building.n_storeys) a
- WHERE a.rn = 1
- -- Take only the first of all the joined simulated buildings
Appendix A.4. Modified A2 SQL Query (Modifications in Bold Text) to Select the Data for the Table Room_Simulated
- SELECT id_building, id_room_gen,
- ST_Translate(room.geom3d, ST_x(ST_GeometryN(geom_c,1)), ST_y(ST_GeometryN(geom_c,1)),h) as geom3d
- FROM cadastral_building
- JOIN building_simulated ON building_simulated.id_building = cadastral_building.id_building
- -- The simulated building is randomly selected. Instead of joining the
- -- building table, we join building_simulated table
- JOIN room ON room.id_bldg_gen = building_simulated.id_bldg_gen
- -- We can join the corresponding room geometries of the assigned
- -- simulated building
Appendix A.5. Modified A3 SQL Query (Modifications in Bold Text) to Select the Data for the Table Building_Simulated
- SELECT id_building, id_bldg_gen, n_storeys, ST_Translate(geom3d, ST_x(ST_GeometryN(geom_c,1)), ST_y(ST_GeometryN(geom_c,1)),h) as geom3d
- FROM (SELECT *, row_number() over (PARTITION BY id_building ORDER BY random()) as rn
- FROM cadastral_building JOIN building ON
- CASE
- WHEN cadastral_building.n_storeys >= 8
- THEN building.n_storeys = 8
- WHEN cadastral_building.n_storeys >= 3 AND
- cadastral_building.n_storeys < 8
- THEN building.n_storeys = 4
- WHEN cadastral_building.n_storeys < 3
- THEN building.n_storeys = cadastral_building.n_storeys
- END) a WHERE a.rn = 1
- -- We limited the simulated buildings to 1, 2, 4 and 8 storeys. Real
- -- buildings have also other numbers of storeys. The above addition
- -- assigns the appropriate simulated building to the real building.
- -- For example, real building with 5 storeys gets 4 storey simulated
- -- building assigned
Appendix A.6. SQL Query that Checks for the Intersection of 3D Geometries in Building_Simulated Table
- SELECT a.id_building, b.id_building
- FROM building_simulated a, building_simulated b
- WHERE ST_3DIntersects(a.geom3d, b.geom3d)
- -- The contition – The output of the ST_3DIntersects function is boolean
- AND a.id_building != b.id_building
- -- With this condition we exclude the checking of the geometry against
- -- itself
Appendix A.7. SQL Query that Checks for the Overlap of 3D Geometries in Room_Simulated Table
- SELECT a.id_room, b.id_room, a.id_building FROM room_simulated a, room_simulated b
- WHERE ST_3DIntersects(a.geom3d, b.geom3d)
- AND ST_Volume(ST_MakeSolid(ST_3DIntersection(a.geom3d, b.geom3d))) != 0
- -- In addition to the ST_3DIntersects function, which is quick and removes
- -- all pairs that are not intersecting, we use ST_Intersection function
- -- and ST_Volume function to calculate the volume of the intersection. If
- -- the volume of the intersection is 0, then the geometries are in a
- -- touching relationship.
- AND a.id_room != b.id_room
- AND a.id_building = b.id_building
- -- In addition to excluding the checking of the geometry against
- -- itself, we use the condition to check only pairs of rooms in the
- -- same building
Appendix A.8. SQL Query that Checks for the Intersection of Room Geometries with Building Exterior Geometry
- SELECT a.id_room, b.id_building FROM room_simulated a
- JOIN building_simulated b ON a.id_building = b.id_building
- WHERE ST_3DIntersects(a.geom3d, b.geom3d)
- AND a.id_building = b.id_building
- -- This query has similar structure as A6. Instead of checking the pairs
- -- of building geometries, this query checks for the intersection of
- -- building geometry with room geometries that belong to the building.
References
- Kalogianni, E.; van Oosterom, P.; Dimopoulou, E.; Lemmen, C. 3D land administration: A review and a future vision in the context of the spatial development lifecycle. ISPRS Int. J. Geo-Inf. 2020, 9, 107. [Google Scholar] [CrossRef] [Green Version]
- Janečka, K.; Karki, S.; van Oosterom, P.; Zlatanova, S.; Kalantari, M.; Ghawana, T. 3D Spatial DBMS for 3D Cadastres. In 3D Cadastres Best Practices; van Oosterom, P., Ed.; International Federation of Surveyors (FIG): Copenhagen, Denmark, 2018; pp. 133–181. [Google Scholar]
- Jaljolie, R.; van Oosterom, P.; Dalyot, S. Spatial data structure and functionalities for 3d land management system implementation: Israel case study. ISPRS Int. J. Geo-Inf. 2018, 7, 10. [Google Scholar] [CrossRef] [Green Version]
- Paulsson, J. 3D Property Rights—An Analysis of Key Factors Based on International Experience. Ph.D. Thesis, Royal Institute of Technology, Stockholm, Sweden, 2007. [Google Scholar]
- Kitsakis, D.; Dimopoulou, E. 3D cadastres: Legal approaches and necessary reforms. Surv. Rev. 2014, 46, 322–332. [Google Scholar] [CrossRef]
- Paulsson, J.; Paasch, J. 3D property research from a legal perspective. Comput. Environ. Urban Syst. 2013, 40, 7–13. [Google Scholar] [CrossRef]
- Stoter, J.; Ploeger, H.; van Oosterom, P. 3D cadastre in the Netherlands: Developments and international applicability. Comput. Environ. Urban Syst. 2013, 40, 56–67. [Google Scholar] [CrossRef] [Green Version]
- Vučić, N.; Roić, M.; Mađer, M.; Vranić, S.; van Oosterom, P. Overview of the Croatian Land Administration System and the possibilities for its upgrade to 3D by existing data. ISPRS Int. J. Geo-Inf. 2017, 6, 223. [Google Scholar] [CrossRef] [Green Version]
- Shojaei, D.; Olfat, H.; Rajabifard, A.A.; Kalantari, M. Moving Towards a Fully Operational 3D Digital Cadastre: Victoria, Australia. In Proceedings of the 6th International FIG 3D Cadastre Workshop, Delft, The Netherlands, 1–5 October 2018. [Google Scholar]
- Janečka, K.; Souček, P. A Country Profile of the Czech Republic Based on an LADM for the Development of a 3D Cadastre. ISPRS Int. J. Geo-Inf. 2017, 6, 143. [Google Scholar] [CrossRef]
- Alkan, M.; Gürsoy Sürmeneli, H.; Polat, Z.A. Design and development 3D RRR model for Turkish cadastral system using international standards. Surv. Rev. 2020. [Google Scholar] [CrossRef]
- Ho, S.; Rajabifard, A.; Stoter, J.; Kalantari, M. Legal barriers to 3D cadastre implementation: What is the issue? Land Use Policy 2013, 35, 379–387. [Google Scholar] [CrossRef] [Green Version]
- Stoter, J. 3D Cadastre. Ph.D. Thesis, TU Delft, Delft, The Netherlands, 2004. [Google Scholar]
- Khuan, C.T.; Rahman, A.A.; Zlatanova, S. 3D solids and their management in DBMS. In Advances in 3D Geoinformation Systems; van Oosterom, P., Zlatanova, S., Penninga, F., Fendel, E., Eds.; Springer: Berlin/Heidelberg, Germany, 2008; pp. 279–311. [Google Scholar] [CrossRef]
- Višnjevac, N.; Mihajlović, R.; Šoškić, M.; Cvijetinović, Ž.; Bajat, B. Prototype of the 3D cadastral system based on a NoSQL database and a Javascript visualization application. ISPRS Int. J. Geo-Inf. 2019, 8, 227. [Google Scholar] [CrossRef] [Green Version]
- Zulkifli, N.A.; Rahman, A.A.; Siew, C.B. Database Design and Development of 3D Cadastral Registration based on LADM. In Proceedings of the 8th International FIG Workshop on the Land Administration Domain Model, Kuala Lumpur, Malaysia, 1–3 October 2019. [Google Scholar]
- Kazar, B.M.; Kothuri, R.; van Oosterom, P.; Ravada, S. On Valid and Invalid Three-Dimensional Geometries. In Advances in 3D Geoinformation Systems; van Oosterom, P., Zlatanova, S., Penninga, F., Fendel, E., Eds.; Springer: Berlin/Heidelberg, Germany, 2008; pp. 19–46. [Google Scholar] [CrossRef]
- Karki, S.; Thompson, R.; McDougall, K. Development of validation rules to support digital lodgement of 3D cadastral plans. Comput. Environ. Urban Syst. 2013, 40, 34–45. [Google Scholar] [CrossRef]
- Shojaei, D.; Olfat, H.; Ignacio, S.; Faundez, Q.; Kalantari, M.; Rajabifard, A.; Bri, M. Geometrical data validation in 3D digital cadastre—A case study for Victoria, Australia. Land Use Policy 2017, 68. [Google Scholar] [CrossRef]
- Shojaei, D.; Rajabifard, A.A.; Kalantari, M.; Bishop, I.D.; Aien, A. Design and development of a web-based 3D cadastral visualisation prototype. Int. J. Digit. Earth 2015, 8, 538–557. [Google Scholar] [CrossRef]
- Wang, C. 3D Visualization of Cadastre: Assessing the Suitability of Visual Variables and Enhancement Techniques in the 3D Model of Condominium Property Units. Ph.D. Thesis, Université Laval, Quebec City, QC, Canada, 2015. [Google Scholar]
- Aien, A.; Rajabifard, A.; Kalantari, M.; Williamson, I. Review and Assessment of Current Cadastral Data Models for 3D Cadastral Applications. In Advances in 3D Geoinformation, Lecture Notes in Geoinformation and Cartography; Rahman, A.A., Ed.; Springer: Berlin, Germany, 2017; pp. 423–442. [Google Scholar] [CrossRef]
- ISO 19152:2012—Geographic Information—Land Administration Domain Model (LADM); International Standard; International Organization for Standardization: Geneva Switzerland, 2012.
- Rajabifard, A.; Atazadeh, B.; Kalantari, M. A critical evaluation of 3D spatial information models for managing legal arrangements of multi-owned developments in Victoria, Australia. Int. J. Geogr. Inf. Sci. 2018, 32, 2098–2122. [Google Scholar] [CrossRef]
- Open Geospatial Consortium. City Geography Markup Language (CityGML) Encoding Standard, Version 2.0. 2012. Available online: http://www.opengeospatial.org/standards/citygml (accessed on 31 August 2020).
- Open Geospatial Consortium. IndoorGML, Version 1.02. 2014. Available online: http://www.opengeospatial.org/standards/indoorgml (accessed on 31 August 2020).
- Open Geospatial Consortium. Land and Infrastructure Conceptual Model Standard (LandInfra) Encoding Standard, Version 1.0. 2016. Available online: http://www.opengeospatial.org/standards/landinfra (accessed on 31 August 2020).
- Aien, A.; Kalantari, M.; Rajabifard, A.; Williamson, I.; Wallace, J. Towards integration of 3D legal and physical objects in cadastral data models. Land Use Policy 2013, 35, 140–154. [Google Scholar] [CrossRef]
- Stoter, J.; Ploeger, H.; Roes, R.; van der Riet, E.; Biljecki, F.; Ledoux, H.; Kok, D.; Kim, S. Registration of Multi-Level Property Rights in 3D in The Netherlands: Two Cases and Next Steps in Further Implementation. ISPRS Int. J. Geo-Inf. 2017, 6, 158. [Google Scholar] [CrossRef]
- Cemellini, B.; van Oosterom, P.; Thompson, R.; de Vries, M. Design, development and usability testing of an LADM compliant 3D Cadastral prototype system. Land Use Policy 2020, 98, 104418. [Google Scholar] [CrossRef]
- Larsson, K.; Paasch, J.M.; Paulsson, J. Representation of 3D cadastral boundaries—From analogue to digital. Land Use Policy 2020, 98, 104178. [Google Scholar] [CrossRef]
- Remondino, F.; Georgopoulos, A.; Gonzalez-Aguilera, D.; Agrafiotis, P. (Eds.) Latest Developments in Reality-Based 3D Surveying and Modelling; MDPI: Basel, Switzerland, 2018. [Google Scholar] [CrossRef]
- Gunduz, M.; Isikdag, U.; Basaraner, M. A review of recent research in Indoor modelling & mapping. ISPRS Int. Arch. Photogramm. Remote Sens. Spat. Inf. Sci. 2016, XLI-B4, 289–294. [Google Scholar] [CrossRef] [Green Version]
- Kitsakis, D.; Dimopoulou, E. Contribution of Existing Documentation to 3D Cadastre. In Proceedings of the 4th International FIG 3D Cadastre Workshop, Dubai, United Arab Emirates, 9–11 November 2014. [Google Scholar]
- Tekavec, J.; Lisec, A. Cadastral data as a source for 3D indoor modelling. Land Use Policy 2020, 98, 104322. [Google Scholar] [CrossRef]
- Ledoux, H.; Meijers, M. Topologically consistent 3D city models obtained by extrusion. Int. J. Geogr. Inf. Sci. 2011, 25, 557–574. [Google Scholar] [CrossRef] [Green Version]
- Biljecki, F.; Ledoux, H.; Stoter, J. Generating 3D city models without elevation data. Comput. Environ. Urban Syst. 2017, 64, 1–18. [Google Scholar] [CrossRef]
- Watson, B.; Muller, P.; Wonka, P.; Sexton, C.; Veryovka, O.; Fuller, A. Procedural urban modeling in practice. Comput. Graph. Appl. 2018, 28, 18–26. [Google Scholar] [CrossRef]
- Merrell, P.; Schkufza, E.; Koltun, V. Computer-generated residential building layouts. ACM Trans. Graph. 2010, 29, 181. [Google Scholar] [CrossRef]
- Smelik, R.M.; Tutenel, T.; Bidarra, R.; Benes, B. A survey on procedural modelling for virtual worlds. Comput. Graph. Forum 2014, 33, 31–50. [Google Scholar] [CrossRef]
- Camozzato, D. A Method for Growth-Based Procedural Floor Plan Generation. Ph.D. Thesis, Pontifícia Universidade Católica do Rio Grande do Sul, Porto Alegre, Brazil, 2015. [Google Scholar]
- Marson, F.; Musse, S.R. Automatic real-time generation of floor plans based on squarified treemaps algorithm. Int. J. Comput. Games Technol. 2010. [Google Scholar] [CrossRef]
- Peng, C.H.; Yang, Y.L.; Wonka, P. Computing layouts with deformable templates. ACM Trans. Graph. 2014, 33, 99. [Google Scholar] [CrossRef] [Green Version]
- Tutenel, T.; Bidarra, R.; Smelik, R.M.; de Kraker, K.J. Rule-based layout solving and its application to procedural interior generation. In Proceedings of the CASA Workshop on 3D Advanced Media in Gaming and Simulation, Amsterdam, The Netherlands, 17–19 June 2009. [Google Scholar]
- Rodrigues, E.; Gaspar, A.R.; Gomes, Á. An evolutionary strategy enhanced with a local search technique for the space allocation problem in architecture, Part 1: Methodology. Comput. Aided Des. 2013, 45, 887–897. [Google Scholar] [CrossRef]
- Gröger, G.; Plümer, L. Derivation of 3D Indoor Models by Grammars for Route Planning. Photogramm. Fernerkund. Geoinf. 2010, 191–206. [Google Scholar] [CrossRef]
- Zhu, J.; Zhang, H.; Chen, M.; Xu, Z.; Qi, H.; Yin, L.; Wang, J.; Hu, Y. A procedural modelling method for virtual high-speed railway scenes based on model combination and spatial semantic constraint. Int. J. Geogr. Inf. Sci. 2015, 29, 1059–1080. [Google Scholar] [CrossRef]
- Tsiliakou, E.; Labropoulos, T.; Dimopoulou, E. Procedural modelling in 3D GIS environment. Int. J. 3-D Inf. Model. 2014, 3, 17–34. [Google Scholar] [CrossRef] [Green Version]
- Kitsakis, D.; Tsiliakou, E.; Labropoulos, T.; Dimopoulou, E. Procedural 3D modelling for traditional settlements. The case study of central zagori. ISPRS Int. Arch. Photogramm. Remote Sens. Spat. Inf. Sci. 2017, 42, 369–376. [Google Scholar] [CrossRef] [Green Version]
- Ribeiro, A.; de Almeida, J.-P.; Ellul, C. Exploring CityEngine as a Visualisation Tool for 3D Cadastre. In Proceedings of the 4th International FIG 3D Cadastre Workshop, Dubai, United Arab Emirates, 9–11 November 2014. [Google Scholar]
- Neuenschwander, N.; Wissen Hayek, U.; Grêt-Regamey, A. Integrating an urban green space typology into procedural 3D visualization for collaborative planning. Comput. Environ. Urban Syst. 2014, 48. [Google Scholar] [CrossRef]
- Biljecki, F.; Ledoux, H.; Stoter, J. Generation of multi-LOD 3D city models in City GML with the procedural modelling engine Random3Dcity. ISPRS Ann. Photogramm. Remote Sens. Spat. Inf. Sci. 2016, IV-4/W1, 51–59. [Google Scholar] [CrossRef]
- Kumar, K.; Labetski, A.; Ledoux, H.; Stoter, J. An improved LOD framework for the terrains in 3D city models. ISPRS Ann. Photogramm. Remote Sens. Spat. Inf. Sci. 2019, IV-4/W8, 75–82. [Google Scholar] [CrossRef] [Green Version]
- Rodrigues, E.; Fernandes, M.S.; Gomes, Á.; Gaspar, A.R.; Costa, J.J. Performance-based design of multi-story buildings for a sustainable urban environment: A case study. Renew. Sustain. Energy Rev. 2019, 113. [Google Scholar] [CrossRef] [Green Version]
- Drobež, P.; Kosmatin Fras, M.; Ferlan, M.; Lisec, A. Transition from 2D to 3D real property cadastre—The case of the Slovenian cadastre. Comput. Environ. Urban Syst. 2017, 62, 125–135. [Google Scholar] [CrossRef]
- Atazadeh, B.; Kalantari, M.; Rajabifard, A.; Ho, S.; Ngo, T. Building Information Modelling for High-rise Land Administration. Trans. GIS 2017, 21, 91–113. [Google Scholar] [CrossRef]
- Li, L.; Wu, J.; Zhu, H.; Duan, X.; Luo, F. 3D modeling of the ownership structure of condominium units. Comput. Environ. Urban Syst. 2016, 59, 50–63. [Google Scholar] [CrossRef]
- Knoth, L.; Scholz, J.; Strobl, J.; Mittlböck, M.; Vockner, B.; Atzl, C.; Rajabifard, A.; Atazadeh, B. Cross-Domain Building Models—A Step towards Interoperability. ISPRS Int. J. Geo-Inf. 2018, 7, 363. [Google Scholar] [CrossRef] [Green Version]
- Oldfield, J.; van Oosterom, P.; Beetz, J.; Krijnen, T.F. Working with open BIM standards to source legal spaces for a 3D cadastre. ISPRS Int. J. Geo-Inf. 2017, 6, 351. [Google Scholar] [CrossRef] [Green Version]
- Barzegar, M.; Rajabifard, A.; Kalantari, M.; Atazadeh, B. 3D BIM-enabled spatial query for retrieving property boundaries: A case study in Victoria, Australia. Int. J. Geogr. Inf. Sci. 2020, 34, 251–271. [Google Scholar] [CrossRef]
- Rajabifard, A.; Atazadeh, B.; Kalantari, M. BIM and Urban Land Administration, 1st ed.; CRC Press: Boca Raton, FL, USA, 2019. [Google Scholar] [CrossRef]
- SFGGAL, Wrapper around CGAL Library for 2D and 3D Operations Based on OGC Standards. 2019. Available online: http://www.sfcgal.org (accessed on 31 August 2020).
Figure 1.
Study concept framework.

Figure 2.
Evolutionary Program for the Space Allocation Problem (EPSAP) algorithm workflow (adapted from ref. [54]).
Figure 2.
Evolutionary Program for the Space Allocation Problem (EPSAP) algorithm workflow (adapted from ref. [54]).
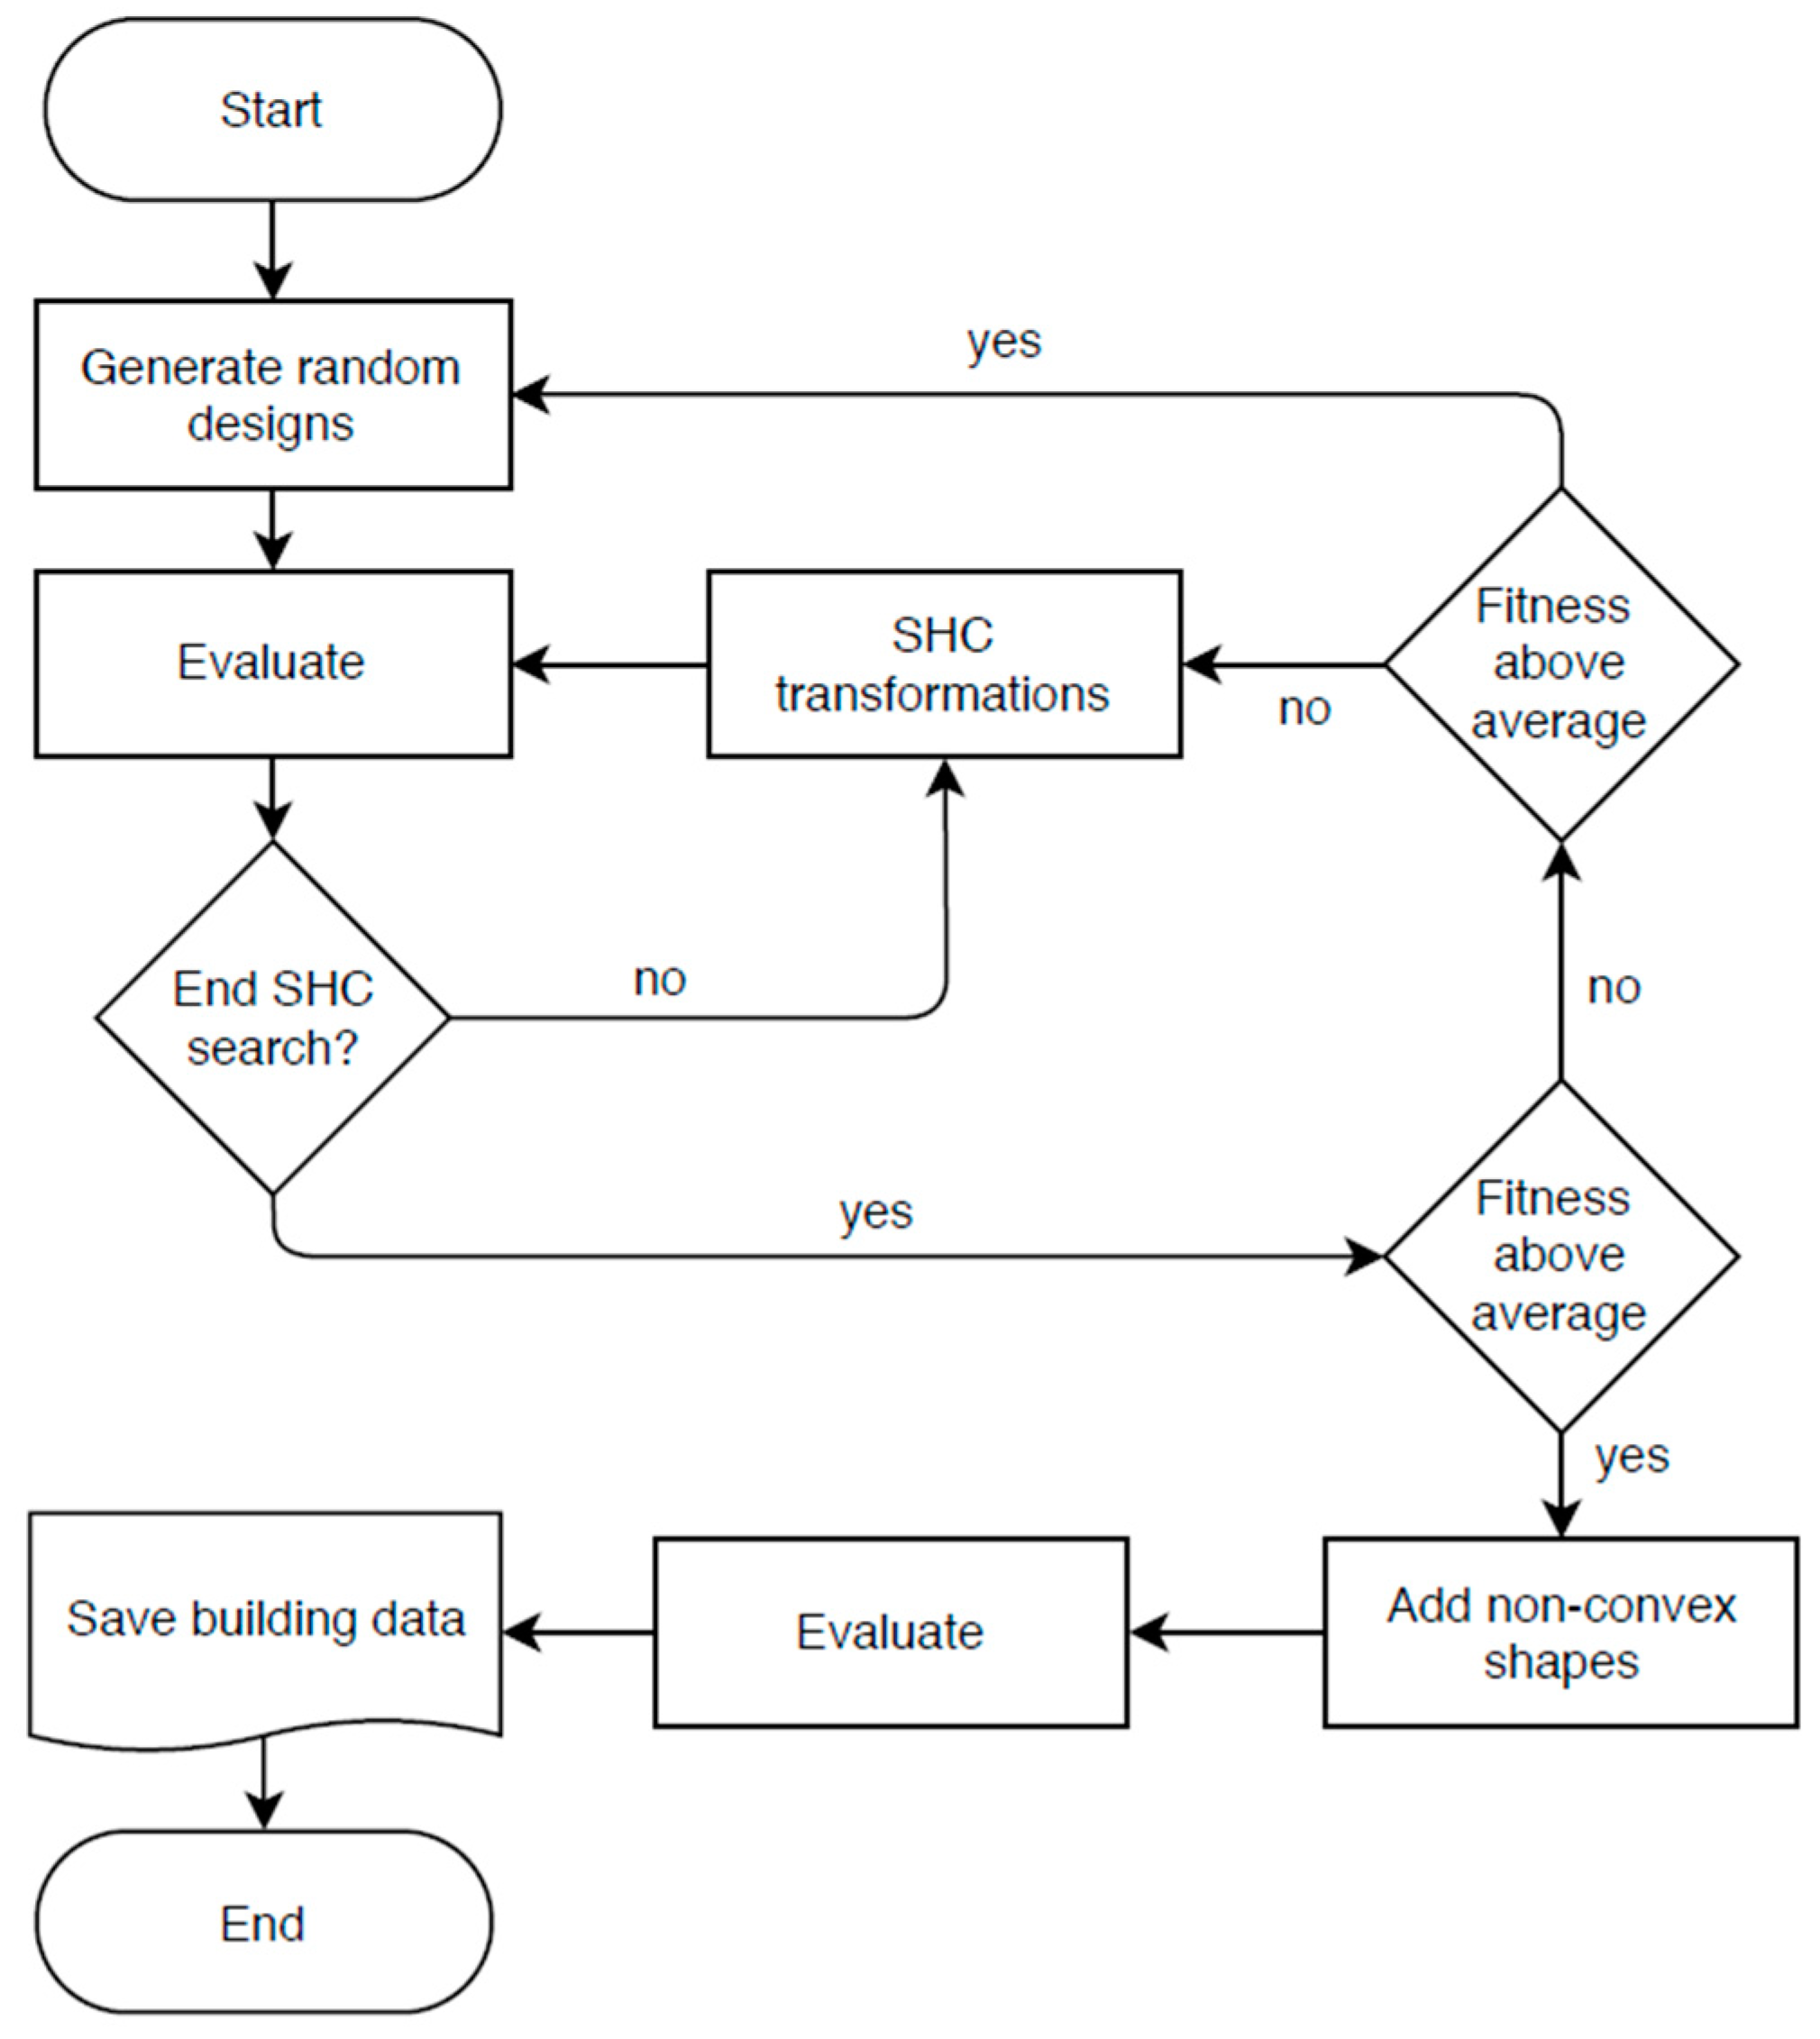
Figure 3.
Simulated two-storey building model comprising of wall, door and window surfaces.
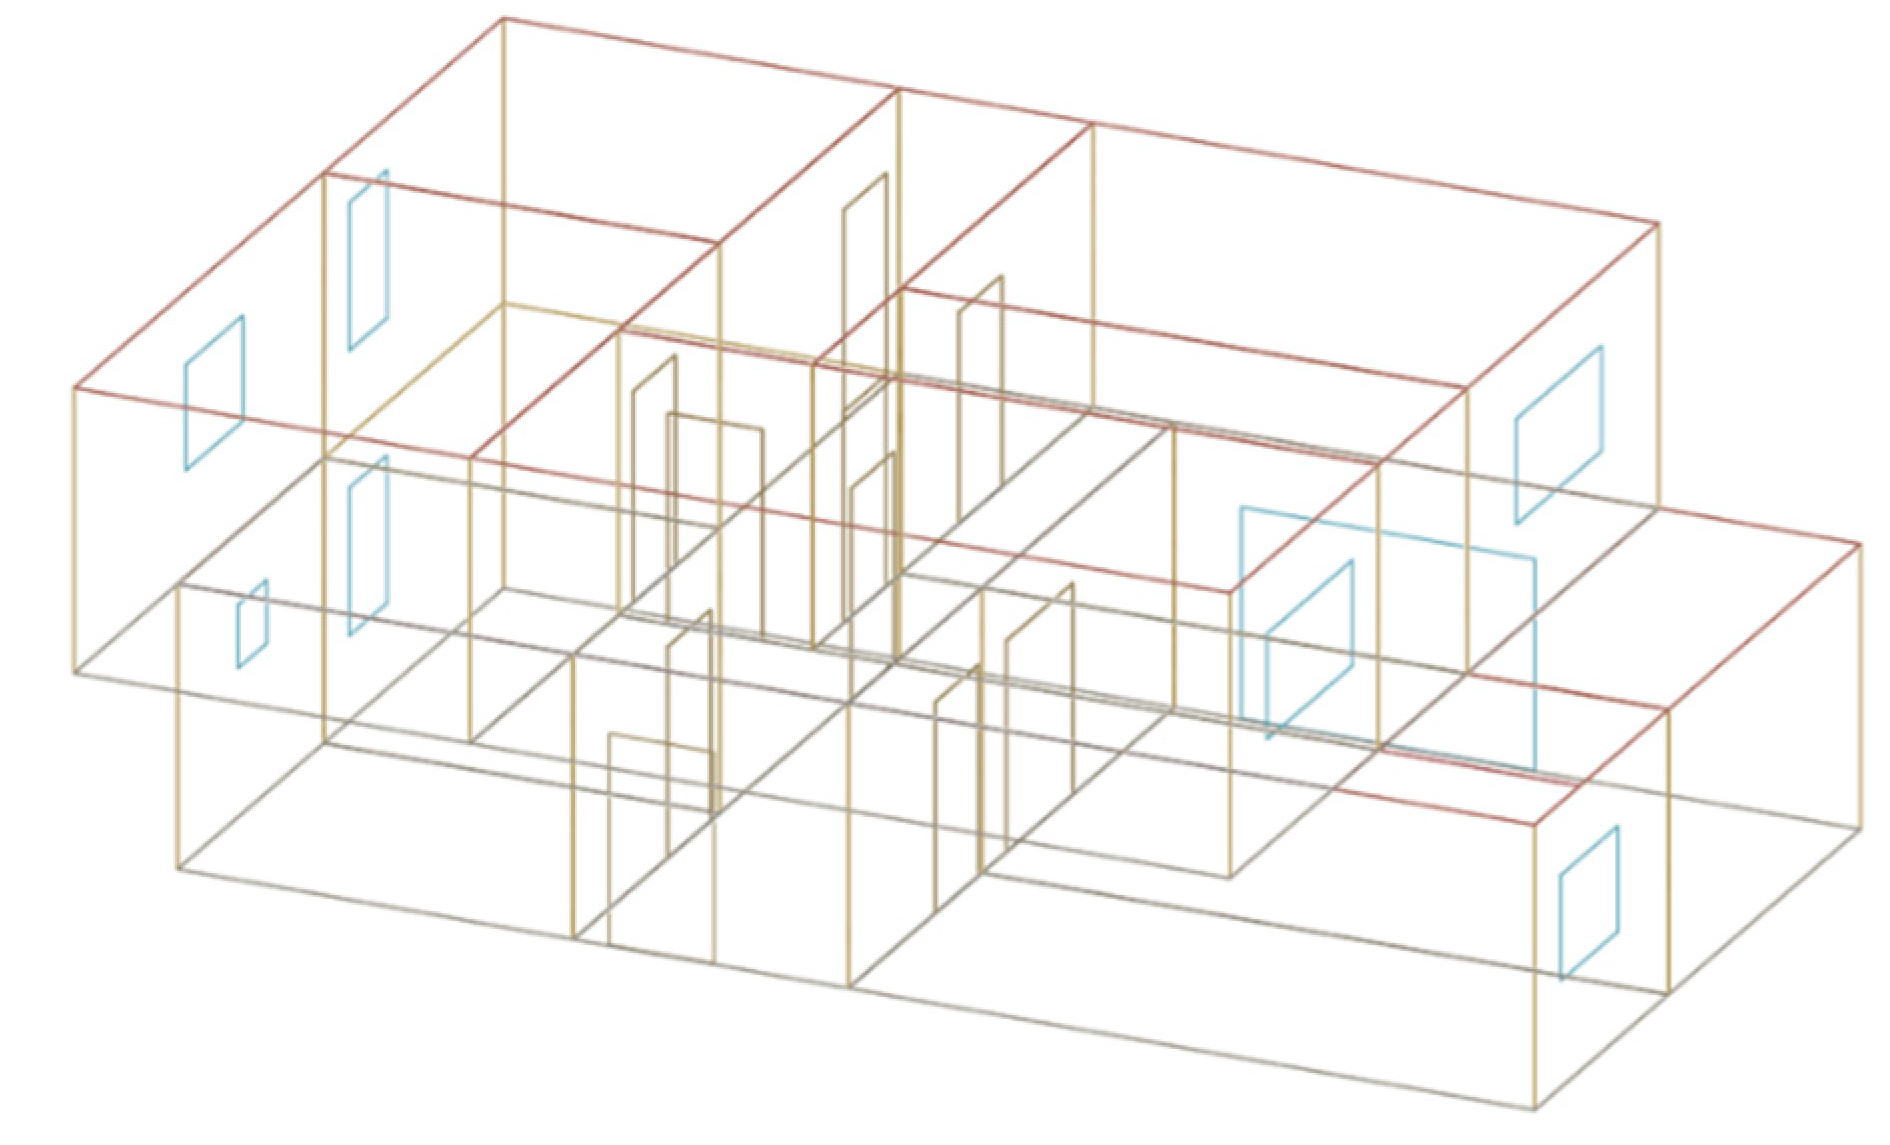
Figure 4.
Linking Land Administration Domain Model (LADM) classes (green) to the data model of simulated buildings (white).
Figure 4.
Linking Land Administration Domain Model (LADM) classes (green) to the data model of simulated buildings (white).

Figure 5.
Solid geometries created from the predefined surfaces.

Figure 6.
(a) Original placement of generated 3D building models; (b) the same models after their placement to the local coordinate system origin.
Figure 6.
(a) Original placement of generated 3D building models; (b) the same models after their placement to the local coordinate system origin.
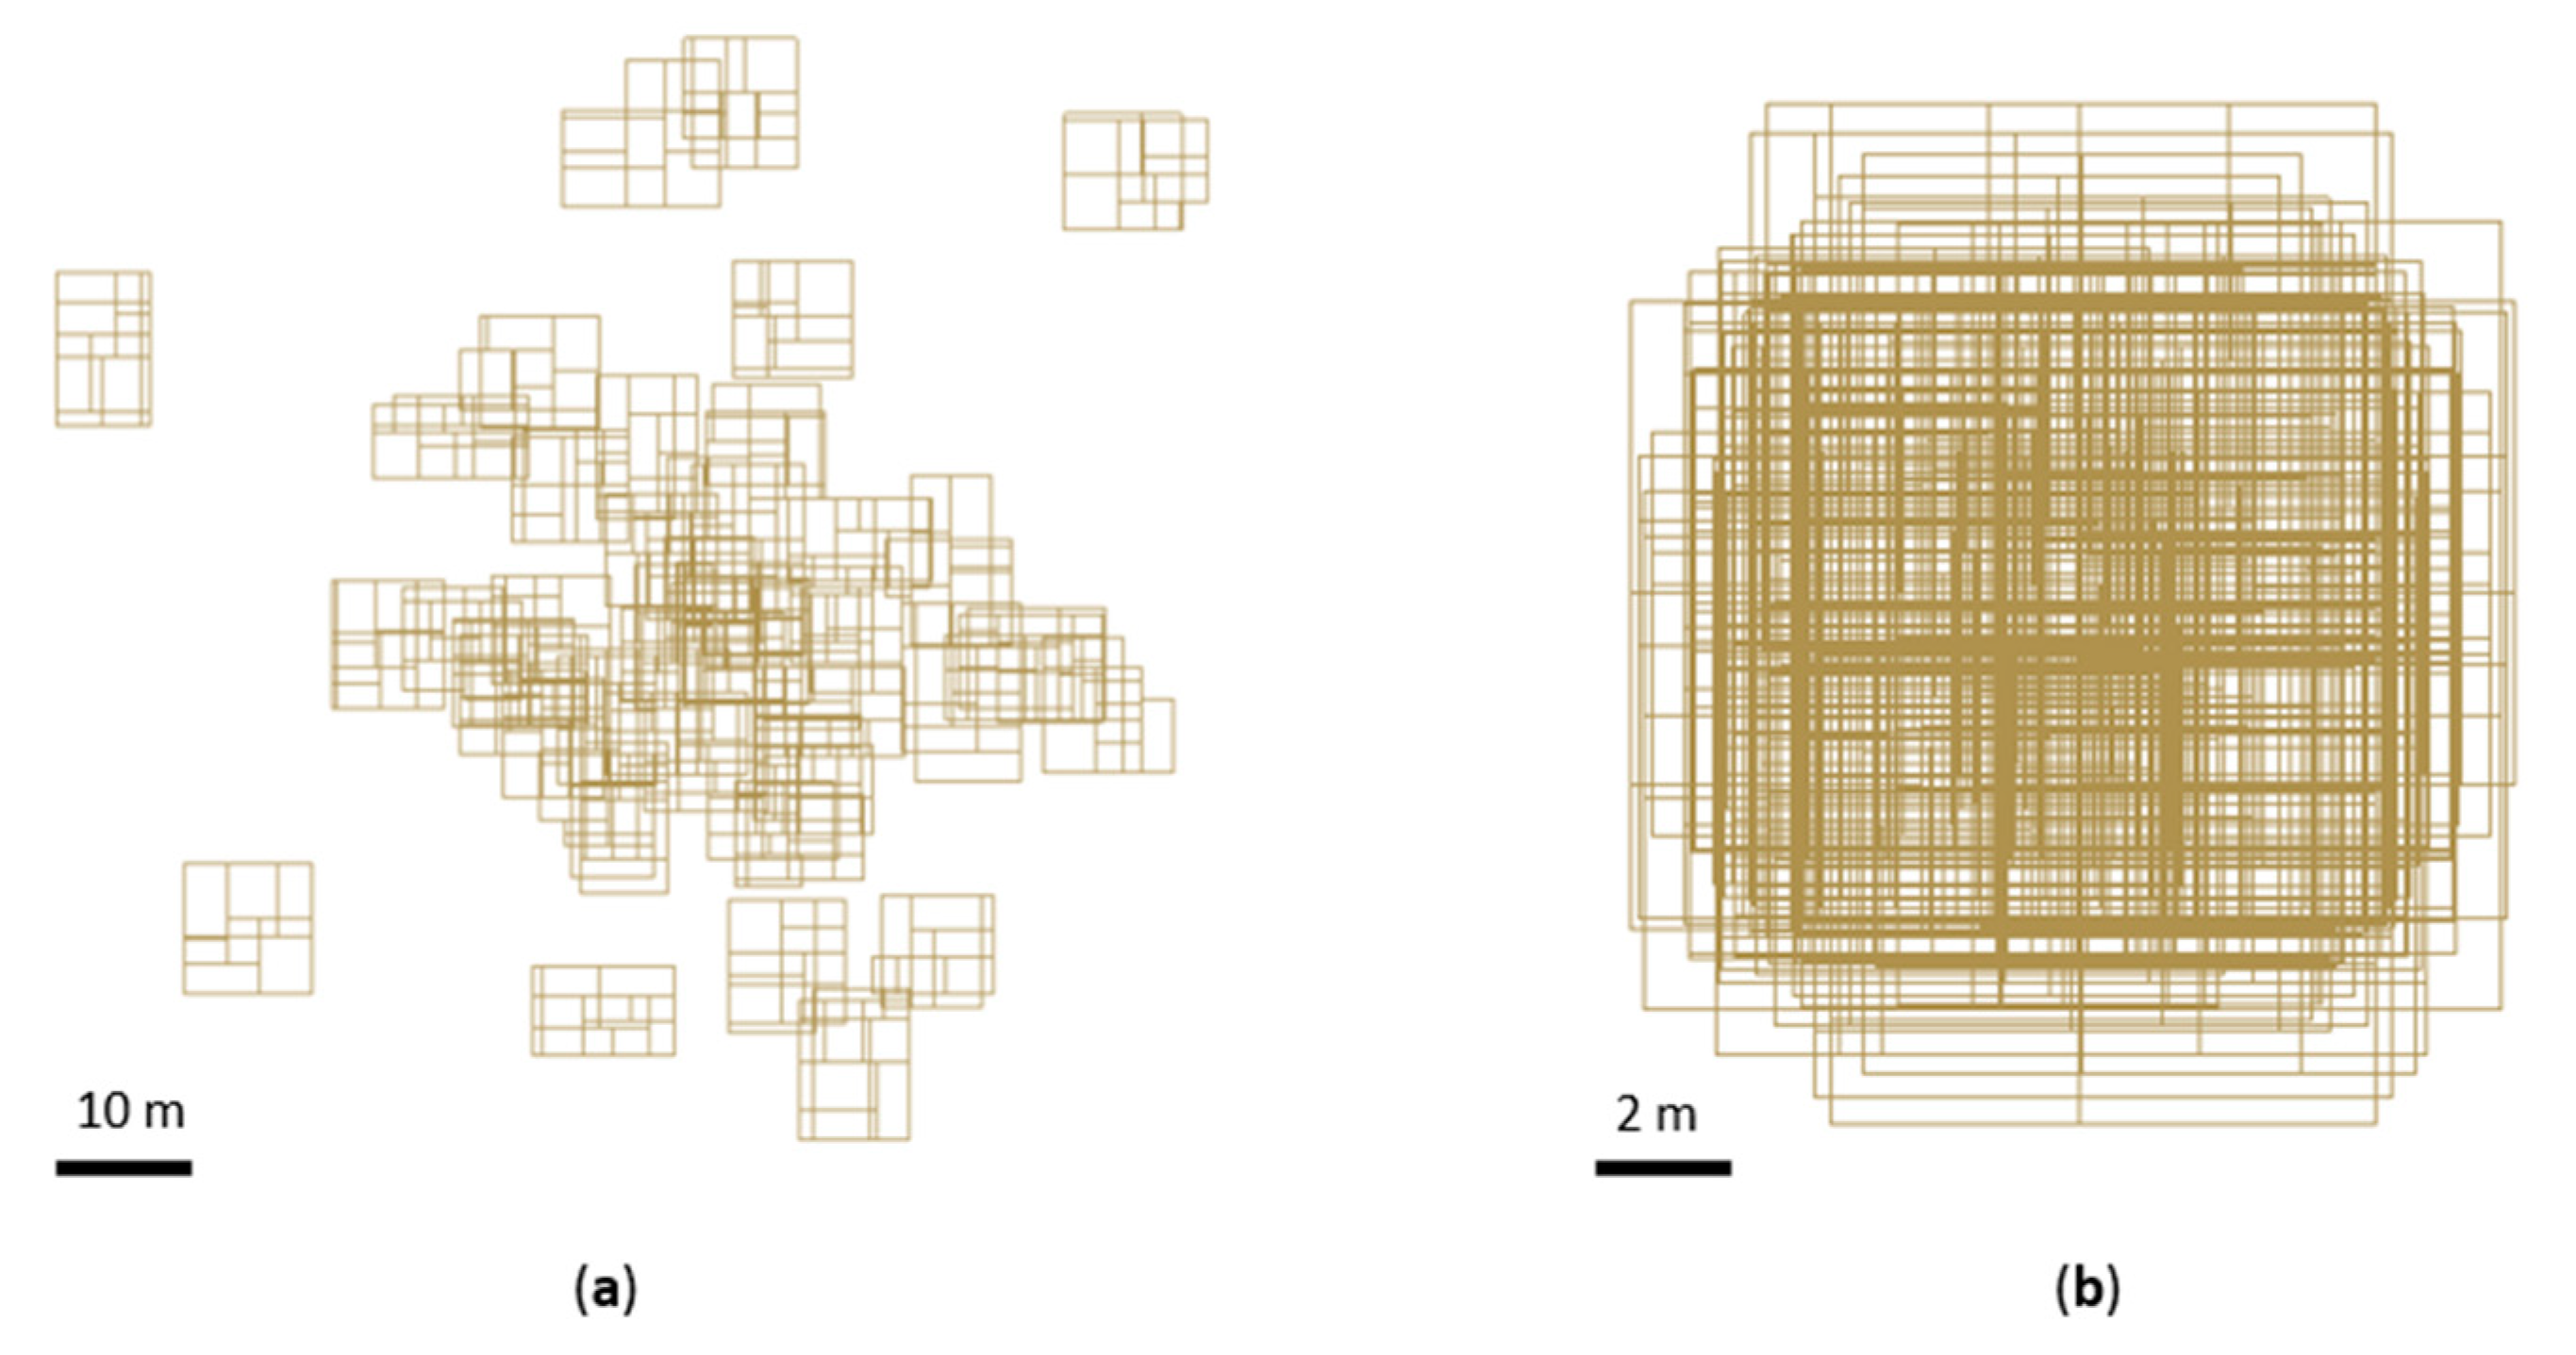
Figure 7.
3D room geometries (random colours), 2D building outline (yellow) and extruded 3D building exterior geometry (transparent blue).
Figure 7.
3D room geometries (random colours), 2D building outline (yellow) and extruded 3D building exterior geometry (transparent blue).

Figure 8.
Database management system (DBMS) storage of the transformed procedurally generated 3D building models.
Figure 8.
Database management system (DBMS) storage of the transformed procedurally generated 3D building models.

Figure 9.
DBMS storage for the simulated 3D cadastral dataset.

Figure 10.
Examples of the generated buildings ranging from the single-storey family house to multi-storey mixed-use apartment buildings.
Figure 10.
Examples of the generated buildings ranging from the single-storey family house to multi-storey mixed-use apartment buildings.

Figure 11.
3D visualisation of 3D visualisation of georeferenced simulated residential 3D building in Google Earth.
Figure 11.
3D visualisation of 3D visualisation of georeferenced simulated residential 3D building in Google Earth.
© 2020 by the authors. Licensee MDPI, Basel, Switzerland. This article is an open access article distributed under the terms and conditions of the Creative Commons Attribution (CC BY) license (http://creativecommons.org/licenses/by/4.0/).
Share and Cite
MDPI and ACS Style
Tekavec, J.; Lisec, A.; Rodrigues, E. Simulating Large-Scale 3D Cadastral Dataset Using Procedural Modelling. ISPRS Int. J. Geo-Inf. 2020, 9, 598. https://0-doi-org.brum.beds.ac.uk/10.3390/ijgi9100598
AMA Style
Tekavec J, Lisec A, Rodrigues E. Simulating Large-Scale 3D Cadastral Dataset Using Procedural Modelling. ISPRS International Journal of Geo-Information. 2020; 9(10):598. https://0-doi-org.brum.beds.ac.uk/10.3390/ijgi9100598
Chicago/Turabian StyleTekavec, Jernej, Anka Lisec, and Eugénio Rodrigues. 2020. "Simulating Large-Scale 3D Cadastral Dataset Using Procedural Modelling" ISPRS International Journal of Geo-Information 9, no. 10: 598. https://0-doi-org.brum.beds.ac.uk/10.3390/ijgi9100598
Note that from the first issue of 2016, this journal uses article numbers instead of page numbers. See further details here.