Article

Privacy-Aware Visualization of Volunteered Geographic Information (VGI) to Analyze Spatial Activity: A Benchmark Implementation

Institute of Cartography, TU Dresden, 01069 Dresden, Germany
*
Author to whom correspondence should be addressed.
ISPRS Int. J. Geo-Inf. 2020, 9(10), 607; https://0-doi-org.brum.beds.ac.uk/10.3390/ijgi9100607
Submission received: 3 September 2020 / Revised: 12 October 2020 / Accepted: 19 October 2020 / Published: 20 October 2020
(This article belongs to the Special Issue Volunteered Geographic Information and Citizen Science)

Abstract

:
Through volunteering data, people can help assess information on various aspects of their surrounding environment. Particularly in natural resource management, Volunteered Geographic Information (VGI) is increasingly recognized as a significant resource, for example, supporting visitation pattern analysis to evaluate collective values and improve natural well-being. In recent years, however, user privacy has become an increasingly important consideration. Potential conflicts often emerge from the fact that VGI can be re-used in contexts not originally considered by volunteers. Addressing these privacy conflicts is particularly problematic in natural resource management, where visualizations are often explorative, with multifaceted and sometimes initially unknown sets of analysis outcomes. In this paper, we present an integrated and component-based approach to privacy-aware visualization of VGI, specifically suited for application to natural resource management. As a key component, HyperLogLog (HLL)—a data abstraction format—is used to allow estimation of results, instead of more accurate measurements. While HLL alone cannot preserve privacy, it can be combined with existing approaches to improve privacy while, at the same time, maintaining some flexibility of analysis. Together, these components make it possible to gradually reduce privacy risks for volunteers at various steps of the analytical process. A specific use case demonstration is provided, based on a global, publicly-available dataset that contains 100 million photos shared by 581,099 users under Creative Commons licenses. Both the data processing pipeline and resulting dataset are made available, allowing transparent benchmarking of the privacy–utility tradeoffs.

Graphical Abstract

1. Introduction

A plethora of terms has emerged to describe User-Generated Content (UGC) that is publicly available and used for different contexts of application and problem-solving, such as Volunteered Geographic Information (VGI), Contributed Geographic Information (CGI) or Ambient Geographic Information (AGI) (see [1]). One of the reasons is that there is a nuanced difference between voluntarily sharing information and volunteering information. For example, for a specific purpose or application such as in VGI [2]. Ghermandi and Sinclair [3], among others, coined the term “passive crowdsourcing” for the specific case of UGC where “[…] information is voluntarily shared by users, albeit not for the purpose for which it is used by the researchers” (p. 37).
From a privacy perspective, however, these difficulties in accurately defining data appear to be of little significance because privacy of volunteers can be compromised regardless of whether data is volunteered or voluntarily shared [2,3]. As a simple, yet useful, definition of privacy, Malhotra et al. [4] use the term Internet Users’ Information Privacy Concerns (IUIPC) to describe “the degree to which a person is concerned about the amount of individual-specific data possessed by others relative to the value of benefits received” (p. 338). Such a definition highlights that any evaluation of privacy and ethical factors is incomplete when seen disconnected from actual applications of data, a conception that is supported by other authors (see [5,6]). Here, natural resource management takes on a special role because applications of data are typically geared towards benefits of individuals or society (see [7]; also note our system model, Figure 1, in Section 3). Consequently, protecting the identity of volunteers, while also sustaining the quality of results, should be of common interest to decision-makers and the public [2,3,5].
Many techniques already exist that help reduce the sensitivity of volunteered or collected datasets, and shared results. These techniques range from basic components, such as pseudo-anonymization or cryptographic hashing, to more complex solutions, such as inducing noise or data aggregation (see [8,9]). On a system model level, these components can be combined by taking into account a wider set of protocols and frameworks of good practice, such as data minimization, the separation of concerns principle, or privacy by design and privacy by default (for definitions of these terms, see [8,10,11,12]). It is commonly accepted that increasing levels of privacy come at several costs, such as limitations in research setup or a reduced utility of outcomes [13]. As a primary consequence of these many considerations, an ongoing and heated debate emerged around questions of where to make compromises, how to best combine components, and which levels of risks are acceptable [14].
In the search for improved and robust mechanisms to protect privacy, it is not surprising that components serving a variety of benefits receive little attention, if they cannot fulfill the highest expectations to privacy [15]. One of these components is HyperLogLog (HLL), a data abstraction format proposed by Flajolet et al. [16] for counting distinct values in a set, called cardinality estimation. HLL may specifically fill in a gap at intermediate stages of analytical processes, where privacy is not an absolute imperative. Such situations frequently occur in multi-criteria decision-making systems [17] and citizen science [18], with a range of needs to gradually tune privacy–utility tradeoffs at various stages of data processing. HLL features several characteristics that make it particularly suited as an intermediate, privacy-aware component for location aware applications such as VGI and crowdsourced geographic information [19]. However, since the HLL algorithm only allows cardinality estimation, its application to the spatial domain requires consideration of addition components, methods and risk mitigation strategies. As the privacy preserving effect of HLL is not guaranteed per se, we use “privacy-aware”, to emphasize the dependence on implementation, user choices and data properties. In addition, processing of spatial data for multi-criteria decision-making includes multiple steps, from data retrieval, to data storage and to the visualization and publication of results. With the goal to gradually reduce the risk of re-identification of individuals, privacy–utility tradeoffs are possible at each of these steps.
In this paper, we demonstrate an integrated example of using HLL for monitoring spatial visitation patterns. We discuss how several risk mitigation techniques can be implemented by considering individual parameters in combination with other components, including integrating concepts of geoprivacy [20]. Taking into account the unique circumstances of both publicly crowdsourced and volunteered geographic data, it is illustrated how HLL may fill a gap of privacy-aware processing of user-generated data in natural resource management. Due to the openness and complexity of the presented research setup, we emphasize that it is not our goal to provide formal proofs of privacy with the techniques demonstrated herein. Mathematical evaluations of the utility to privacy relationship exist and are referenced for individual tools and components used in this work. Rather, our focus is on utility, by illustrating a broader privacy-aware modular scheme that can be adapted based on personal needs and application contexts. There exist different degrees of suitability for specific purposes, and several examples are discussed in this work. As a means to lowering the barrier of practical application, we specifically consider implementation details and obstacles to integrate HLL in existing workflows. Thus, our contributions are multi-faceted but focus on a novel visualization setup and a balanced, application-oriented evaluation of the tradeoffs between privacy and utility. Supporting the wider adoption and a transparent replication of results, we fully publish our tools, processing pipeline and benchmark data alongside this work.

2. Previous Work

Useful definitions that help describe the psychological, social and political dimensions of privacy have existed since the 1960s [21,22]. However, it was not until the first decade of the 21st Century that formal notions of privacy became available, allowing scientists to quantify and measure privacy conflicts in datasets [23]. K-anonymity [24] was one of the first methods proposed, which aims at quantifying and predicting the risk of re-identification in a single dataset. Here, k describes a threshold for how many times attributes may occur in a dataset to be included [25], with e.g., a minimum of five as a rule of thumb [26] (p. 14). A lower k typically means a higher risk of re-identification, for example, through co-relating and combining attributes with external information. Conversely, larger k’s result in a larger loss of information, up to a point where data becomes of no use [23] (p. 2754).
To compensate for the various shortcomings in specific use cases, a large number of sub variants, alternatives and advances have been proposed [25,27,28]. However, while granularity reduction or data suppression can reduce risks, it is difficult to provide exact guarantees [13]. This was one of the reasons Dwork et al. [29] explored a different route, based on carefully calibrated levels of noise added to outputs. Later, this concept became known as Differential Privacy (DP), providing a strict formal notion and mathematical guarantees for privacy-preservation [30].
While k-anonymity, DP, and other approaches already cover a wide range of use cases, several challenges continue to limit their broad application in practice [12,23,31]. For example, while DP solves known vulnerabilities of k-anonymity, a number of factors reduce flexibility and feasibility in practice [23] (p. 2760); [31]. Similar to k-anonymity, some analytical questions will require levels of noise that are detrimental to results [14,27]. For inducing randomness, at least some statistical properties of data must be known, requiring special adaption or imposing limitations to be used in streaming applications, continuous monitoring tools and autonomous visualizations pipelines [12] (p. 71); [32,33]. While exceptions apply, most available approaches also specifically focus on privacy preserving publishing of results (see [28], p. 16), ignoring that any “act of data collection […] is the starting point of various information privacy concerns” [4] (p. 338).
From a privacy perspective, a relatively new component are Probabilistic Data Structures (PDS) such as Bloom Filters, Count–Min Sketches, or HyperLogLog (HLL) (see [19] for an overview). Unlike k-anonymity—founded on principles of aggregation and exclusion in single datasets—and DP—built on random data perturbation with a focus on output sensitivity—, probabilistic algorithms employ a different strategy with a different goal. By systematically removing pieces of information at a more fundamental level of data, precision is traded for astonishing decreases in memory consumption and processing time, while maintaining guaranteed error bounds (ibid., p. 1). Naturally, the original use case of probabilistic computation was big data and streaming applications (ibid.).
More recently, several publications have looked at the utility of PDS to privacy, with ambivalent results. Feyisetan et al. [27] combined Count-Min Sketches with k-anonymity, as a means to improve performance to estimate query frequencies for very large datasets. Bianchi, Bracciale and Loreti [34], exploring the privacy benefits of Bloom Filters, reach a “better than nothing” conclusion. In order to balance accuracy and privacy, Yu and Weber [35] propose HLL for aggregate counts in clinical data, simulating a test with 100 million patients. Desfontaines et al. [36] prove that HLL does not preserve privacy but suggests several risk mitigation strategies. More recently, Wright et al. [37] show that HLL and Bloom Filters can be combined to satisfy even the strict definition of DP. In their outlook, Singh et al. [19] emphasize that the utilization of PDS in location aware applications needs further exploration (ibid., p. 17).
In summary, while privacy is not a primary property of PDS, it is recognized as a side effect. HLL, as the latest PDS developed, has taken on a special role from this privacy perspective. The primary use case of HLL is counting distinct elements in a set, called cardinality estimation. The internal representation of a HLL set is also called a sketch because it only stores a small approximate summary of the original data (see [36]; an example is illustrated in Figure 2, Section 4.3). As a result, a HLL sketch can count 1 billion distinct items with an error rate of 2% using only 1.5 KB of memory [19] (p. 13). HLL sets do not explicitly support membership checking of specific elements (ibid.). Consequently, the removal of items is not possible because, once added, items cannot be unambiguously identified. In this sense, HLL sets behave more like statistic data, whereas the functionality and their practical use is more akin to conventional sets. For instance, several HLL sets can be merged (a union operation), to compute the combined count of distinct elements of both sets, without losing accuracy. This allows parallelized computation or individual storage of many small HLL sets that are only finally combined to a single set. Equally, via the inclusion–exclusion principle [38], relationships between different HLL sets can be quantitatively evaluated, such as is proposed by Baker and Langmead [39] for measuring genomic similarity. In the following, we discuss and demonstrate how HLL sets can be combined with spatial data to approximate typical metrics and relationships used in VGI.

3. Concept

3.1. System Model

As addressed in the introduction, the level of involvement for producing VGI can vary to a large degree. Gómez-Barrón et al. [40] proposed general considerations for the systematic design of VGI projects, taking into account a continuum of possible contribution modes that stretch from passive to more active involvement (p. 11). Our system model, illustrated in Figure 1, is derived from these general considerations. The simplified graphic aims at illustrating the key idea that decision-makers and the public can work together in a cooperative manner to improve overall well-being and ensure a collectively beneficial development of the environment [4,41]. Highlighted in the system model (grey color, Figure 1) are components that have been added for the processing of HLL data, as part of an Analytics Service (AS). Such a service can also be described as the central crowdsourced processing unit [40] or the data curator [23] (p. 2753), which is more precisely described in Section 4.2 (Software architecture).
The fact that different levels of involvement are possible is recognized with two possible communication links between users and the AS. The first, and currently perhaps most widely used approach, utilizes Location-Based Social Media (LBSM) as an intermediate service, typically resulting in more passive modes of contribution [3]. Conversely, a more direct link to users can be established by including key components of the communication service as part of the AS, which represents a more pro-active mode of contribution, in a continuum of possible definitions of VGI [40,42]. While quality and quantity of data may differ significantly between the two approaches, both may be used to produce data of similar structure.
This makes it possible to formulate similar vulnerabilities of collected data, highlighted with the two cases of an internal and external adversary in Figure 1. The internal adversary case illustrates the possibility that the analytics service is compromised by someone with internal information of or direct access to the analytics service, or someone external who gained malicious access. Even though data is publicly available, e.g., through social media, such a scenario appears plausible under certain circumstances. For instance, any data that is aggregated and combined in new ways can produce insights that are not possible with the original data [12]. Conversely, social media users may at any point remove information that was previously shared, challenging timely reflection of this change in subsequent data collections [6]. In the second case of an external adversary, the more commonly discussed situation of someone trying to compromise privacy in published datasets is portrayed. Representative of such a dataset is the benchmark data produced and shared in this work (Section 6). We return to these two adversarial cases in Section 5, with the discussion of two case studies.

3.2. Analytics Service

As a means to narrow down the scope of the following discussion, we specifically consider an analytics service for monitoring spatial visitation patterns, with the ability to use results in a number of decision-making contexts. Chen, Parkins, and Sherren [43], for example, use the number of Instagram photographs to analyze and detect important landscape values around proposed hydroelectric dams in Canada. Kennedy and Naaman [44] use the number of Flickr users that are present in photo location clusters for representative landmark discovery. Wood, Guerry, Silver and Lacayo [45] find that frequency of Flickr users per month correlates with official visitation rates for national parks in the USA and can therefore be used as a sufficient proxy to improve park management. A similar approach is applied by Heikinheimo et al. [46] for national park visitation rates and user frequencies derived from Instagram. Flickr spatial data, similar to the type used herein, is also used in a large project (naturalcapitalproject.stanford.edu) to identify and quantify aesthetic values, as an important basis for assessing ecosystem services [47].
Recurring in these examples is the use of several types of identifiers. To distinguish between items, unique identifiers (UIDs) are an intrinsic requirement of both IT systems and visual analytics. Consider, for example, a national park management that aims to monitor the total number of unique user visits. This could be done on site, as part of collecting an entrance fee, and, if it is possible to assign some ID to visitors, to prevent double counting. Alternatively, publicly available social media data may be considered as a proxy, as in the example discussed by Fisher et al. [48]. Finally, a focused VGI project can be conceived that is built precisely for supporting public park management, comparable to apps that help (e.g.,) assess pandemic spread.
Notwithstanding these good intentions, it has been shown that data can be repurposed through its lifetime. UIDs specifically are a primary cause of privacy conflicts and misuse of data (e.g., [49]). Without being exhaustive, we observe three recurring metrics that build on UIDs in nature resource management: post count (PC), user count (UC) and post (or photo) user days (PUD) (see [3,45,48]). The latter is coined by Wood et al. [45] as a measurement for “the total number of days, across all users, that each person took at least one photograph within each site” (p. 6), and it is increasingly used as a quantitative proxy for aesthetic value (e.g., [47]). As a fourth quasi-UID, coordinates of publicly shared posts or photos are typically used for observation of spatial occurrence. Due to their precision, such coordinates are usually treated with equal sensitivity to UIDs, with special implications for geo-privacy [20]. Just one example is provided by Shi et al. [50], who demonstrate the possibility to extract users’ job and housing locations from public records of a bicycle renting station. In summary, while these metrics appear plausible, they are also disturbing from a privacy perspective, even in proactive collaboration scenarios. While a large collection of solutions to this problem exists (see Section 2), we specifically explore the capabilities of HLL as a component in the following.

4. Material and Methods

4.1. Dataset

We use the Yahoo Flickr Creative Commons 100 Million (YFCC100M) dataset released by Yahoo in 2014 [51] to provide a demonstration example. The dataset is publicly available as a comma-separated values (CSV) file and consists of metadata from 100 million photos and videos shared by 581,099 users. 48,366,323 photos and 103,506 videos in the dataset are geotagged (ibid., p. 66). To simulate a streaming application, the data is first read into a database, called “rawdb” (see Section 4.2), preserving all internal relationships. These relationships, such as user IDs, post IDs, timestamps or coordinates and other references, are typically also available when accessing the Flickr Application Programming Interface (API) directly. The rationale for choosing this dataset is that it features a structure and scope that allows comparison with other data used in various contexts of VGI (see examples in Section 3).

4.2. Software Architecture

To allow transparent evaluation and replication of the system and results presented in this work, we combine several technology components, to illustrate a typical analytics service setup. At the core, four Docker Containers (docker.com) are used as a representation of the different roles in the system model described in Section 3 (Figure 1). Since the majority of work on privacy protection is conducted in the context of databases [23] (p. 2754), a natural choice was to implement these roles with PostgreSQL (postgresql.org). The first container (“rawdb”) simulates a social media service that allows access to original, unfiltered data through an open API; or raw data collected directly from users (i.e., the active contribution mode of VGI, Figure 1). The API functionality is reflected by the PostgreSQL query interface. Similarly, a second PostgreSQL container (“hlldb”) is used to represent a privacy-aware data curator. This data curator is running the Citus implementation of HLL (github.com/citusdata/postgresql-hll). With the goal of illustrating the separation of concerns principle, the Aggregation Service and Sketching Service are implemented with a separate, third container (“hllworker”), which is used for in-memory calculations only. Finally, a fourth container, running Jupyter Notebook (jupyter.org), symbolizes the visualization part of the Analytics Service (AS). The precise steps and code of the visualization pipeline are structured in four notebooks. These notebooks are published alongside this paper in a data repository [52] and HTML versions are included in the Supplementary Materials (S1–S4).
The intention for these notebooks is multifold. Firstly, through performance benchmarking, it is possible to quantify the potential utility–privacy tradeoff that practitioners need to consider when switching workflows. Secondly, each step is transparently documented, providing both reproducibility of research and an “insight view” to the workings of our conceived AS, as is discussed for the internal adversary scenario (Section 5). This makes it possible to identify and discuss strengths and weaknesses in Section 6.3 (Privacy trade-off). Lastly, the notebooks can serve as a basis for evaluating how certain choices and parameter settings, made in earlier stages of the process (see Section 4), may impact later results. The first notebook describes how to import YFCC100M data to the rawdb and hlldb formats. The second and third notebook are used to compare data processing based on raw and HLL data, respectively. In the fourth notebook, it is shown how published benchmark data can be used for further analysis (see Section 6.2). Two additional notebooks contain the code to replicate the remaining figures and statistics shown in this paper (see Supplementary Materials, S5–S6).

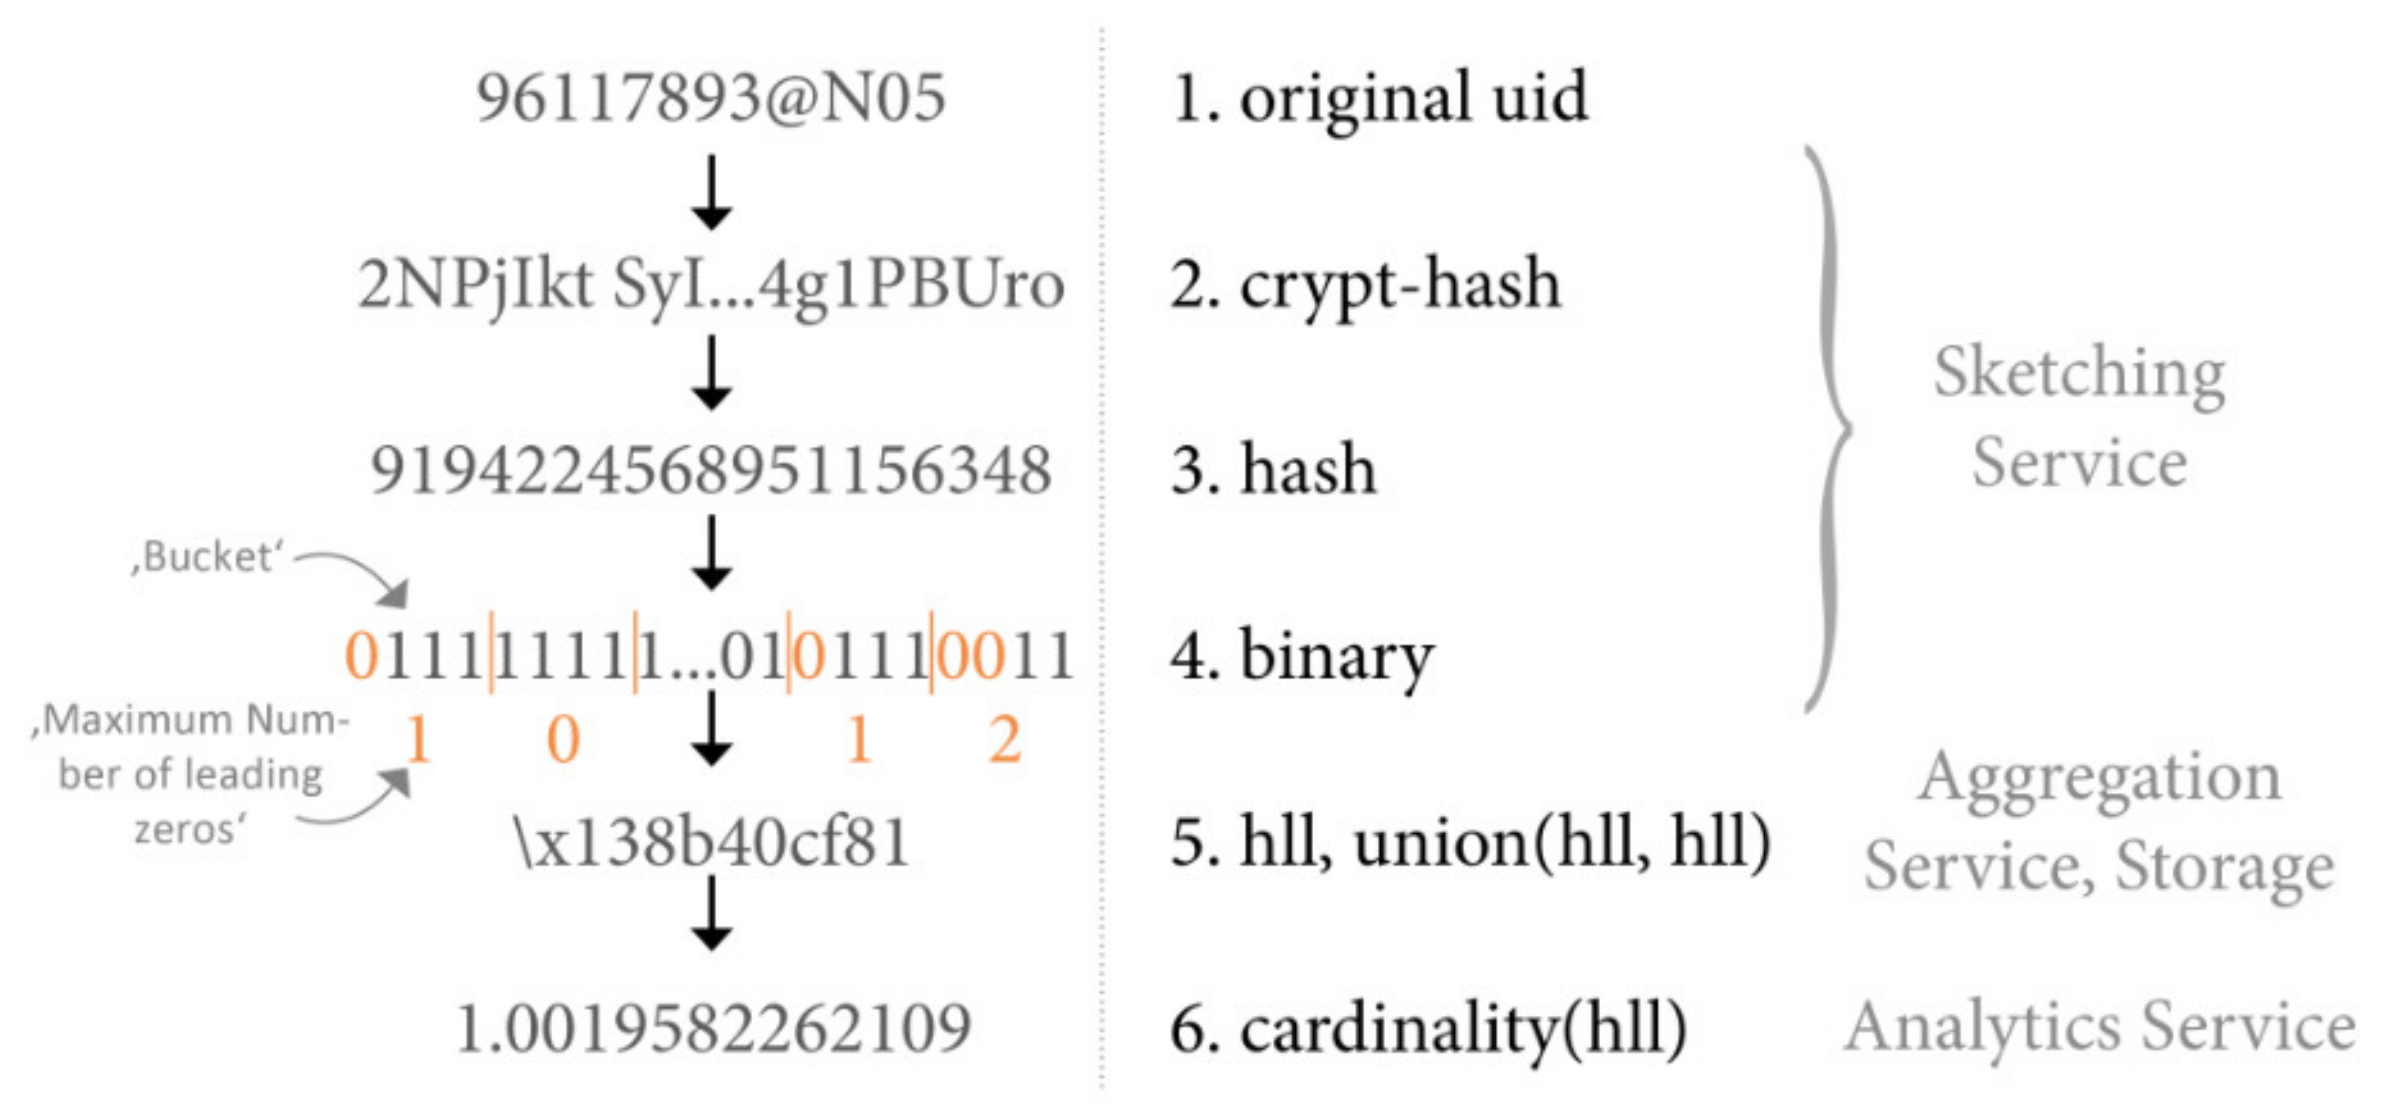
4.3. First Component: HyperLogLog (HLL)

As the first of two components, HLL is used to count distinct items for the three different metrics, PC, UC and PUD, introduced in Section 3.2. Even though different implementations of HLL exist, all share a number of basic steps. At the core, the binary version of any given character string is divided into “buckets” of equal size, such as e.g., 4 (see illustration in Figure 2, step 4). The bucket is also referred to as the register width. For each bucket, the number of leading zeroes is counted. Because any given character string is first randomized (step 3, Figure 2), typically by using a non-cryptographic hash function, it is possible to predict how many distinct items must have been added to a given HLL set, based on the maximum number of leading zeroes observed [16]. In other words, if multiple items are added to a HLL set, only the highest number of leading zeroes per bucket needs to be memorized. As a result, the cardinality estimation (i.e., the count of distinct elements added to the set, step 6, Figure 2) will produce decimal numbers that only approximate exact counts.
As a side effect, it is only limitedly possible to check whether a particular user or ID has been added to a HLL set. In an adversarial situation, Desfontaines et al. [36] refer to such a check as an “intersection attack”. Intersection attacks first require obtaining the hash of a targeted person or ID, and then adding this hash to a HLL set. If the HLL set changes, an adversarial may be able to increase their initial suspicion by a certain degree. Such an increase in posterior knowledge, even by a small degree, is typically incompatible with strict definitions of privacy preservation (see Section 2). Desfontaines et al. [36] show that the privacy preserving effect of HLL directly relates to the size of a set, with smaller sets having a larger vulnerability. The authors conclude that HLL sets with 10,000 elements feature a strong privacy-preserving effect, sets with 1000 elements have a noticeable decrease in privacy preservation, and sets with less than 1000 elements demonstrate a weak privacy preserving effect (ibid., p. 14).
Next to the size of sets, several parameters affect the accuracy of cardinality estimation, and therefore indirectly the privacy preserving effect. For example, the number and width of buckets can be tuned for different needs. With a parameter setting of log2m = 11 (the logarithm to the base 2), the number of used registers would be 2048. In this case, the relative error of estimation will be ±1.04/√(2|log2m) = ±2.30%. In combination with a default register width of 5 (regwidth = 5), the implementation of Citus HLL allows adding a maximum number of 1.6 × 10¹² items to a single set—a number that is difficult to express in non-scientific notation. For comparison, using a regwidth of 4 and a log2m of 10 already reduces the maximum number of items that can be estimated to 12 million, with a relative error of ±3.25% (for references to the above, see the online documentation). From a privacy perspective, it is recommended to use the smallest possible parameter settings, which depend on the expected maximum size of HLL sets. In our case, the Flickr YFCC100M dataset encompasses 100 million total post IDs, which is why we used the default settings of log2m = 11 and regwidth = 5. For many other datasets, smaller parameter settings will be possible.
Entirely unrelated to the function of HLL, but recommended from a privacy perspective, a cryptrographic hashing function can be added in a preceding step (step 2, Figure 2). This effectively prevents typical intersection attacks because an adversary cannot generate the hash for a known original ID, without knowing the secret key. In our implementation, we use Postgres HMAC function, using SHA256 and a secret key with a length of 160 bits. The consequences on privacy and utility in our spatial setting are later evaluated in Section 6.3 (Privacy trade-off). Lastly, and rather implementation specific, is that HLL sets are sequentially promoted to three different “modes” of operation: explicit, sparse, and full. For performance reasons, explicit and sparse mode provide a higher accuracy at lower cardinalities. Since explicit mode stores original hashes fully, it obviously cannot provide any benefits to privacy and should be disabled, which will promote any set directly to sparse (as suggested by Desfontaines et al. [36], p. 15, who use “sparse” to refer to what we mean with explicit mode here).
While storing a single item in a HLL set is not the typical case of application, providing only weak initial benefits to privacy, it helps to mark out some key functionality. For the sake of demonstration, consider that all available user IDs in the YFCC100M dataset can be converted to individual HLL sets. Unlike raw data, which consists of 581,099 unique items (k = 1), a naïve direct count of distinct items of these individual HLL representations yields a number of 17,358 (for reproducing these numbers, see calculations in Supplementary Materials, S5). Thus, it becomes obvious that multiple user IDs are converted to the same HLL representation. This grouping originates from the randomization induced by the hash operation. All of these individual HLL sets can be merged (a union operation), to produce a single HLL set that can be used to estimate a cardinality of 589,475 (see Table 1).
Note that what is counted is entirely left to the analyst. In Table 1, a summary is provided for the metrics used in this paper, with corresponding values collected on the basis of the YFCC100M dataset. For clarity, while post and user count can be applied on a single identifier basis ( i d u s e r , i d p o s t ), distinct coordinates and user days are measured by string concatenation (e.g., l a t i t u d e p o s t l o n g i t u d e p o s t and i d u s e r i d p o s t p u b l i s h d a t e , respectively). Thus, latitude and longitude, or dates, are treated as character strings, which allows combination with other identifiers, such as user IDs, to form composite metrics. This concatenation is applied before the cryptographic hashing and HLL transformation step (for the exact process, see Supplementary Materials, S1).
Since HLL only allows counting distinct values, it is apparent that some information is required as a reference for what is counted. This typically results in a two-component setup, where one part is stored in clear text. In a spatial context, this clear text component will be the location identifier, which is associated with the HLL set. It follows that any evaluation of privacy risks requires looking at both the HLL and the location component.

4.4. Second Component: Location

In a scenario for monitoring spatial visitation patterns, as conceived in Section 3, at some point a decision is made about at which level of granularity spatial information needs to be collected, and at which granularity it should be visualized. Assume, albeit unlikely but illustrative, a goal to monitor worldwide visitation patterns, at a very coarse granularity, such as in a grid of 100 km bins. In an early phase of the project, it may not be possible to accurately predict whether 100 km will be sufficient. Therefore, in a privacy–utility tradeoff, it may be decided to collect data at a slightly higher precision. Frequently, such tradeoffs will not be binary but gradual, and can be evaluated using a number of measures, such as k-nearest neighbor, t-closeness, l-diversity, or p-sensitive [53].
In terms of k-anonymity, a location (e.g., represented by a pair of coordinates latitude and longitude) can be described as relating to any number of k 1 individuals (e.g., [54]). The general idea is that data is found to be k-anonymous if a location refers to at least k 1 other individuals [55]. The predicate of k-anonymity is typically compromised in the presence of (spatial) outliers [56]. To remove outliers, one solution is to decrease the spatial granularity. We use a simple GeoHash function to reduce granularity of coordinates in discrete steps from e.g., 10 to 1, similar to how Ruppel and Küpper [57] combine GeoHashes with Bloom Filters. The GeoHash function is comparable to “snapping” points to a grid, with 10 and 1 resulting in an average error rate stretching from 60 cm to 2500 km, respectively (ibid., p. 420). Based on this function, the global percentage of outlier volume can be evaluated for decreasing spatial precision levels and for the metrics used in this paper (Figure 3).
Reflected in the graphic in Figure 3 is a common property of UGC, which is frequently unevenly distributed, featuring heavy tailed patterns. For example, the total number of user outliers, at the highest precision (10), is almost 100%, meaning that at each coordinate only one user is observed. In contrast, about 80% of coordinates refer to at least 2 posts, meaning that the larger volume of distinct posts is already clustered at the highest level of locational precision (also see [54]). This unequal distribution becomes more noticeable at coarser granularities. At a GeoHash level of 5, referring to an average “snapping distance” of 4 km, almost 80% of coordinates satisfy “k − 1”, that is, at least 2 individuals are present. However, there are many different evaluations of risk. Another method, illustrated with the red line (user-coordinate outliers, Figure 3) is to check the total number of users that could be compromised by having at least one coordinate in the total dataset with k = 1. This curve only reaches 0% at a GeoHash precision of 1, likely representing a strong level of privacy, but also resulting in spatial information that may be of no use anymore. Based on this evaluation, a GeoHash precision of 5 may appear plausible for initially reducing the spatial granularity of input data. Note that this number is entirely context dependent; it is used here for demonstration purposes only.

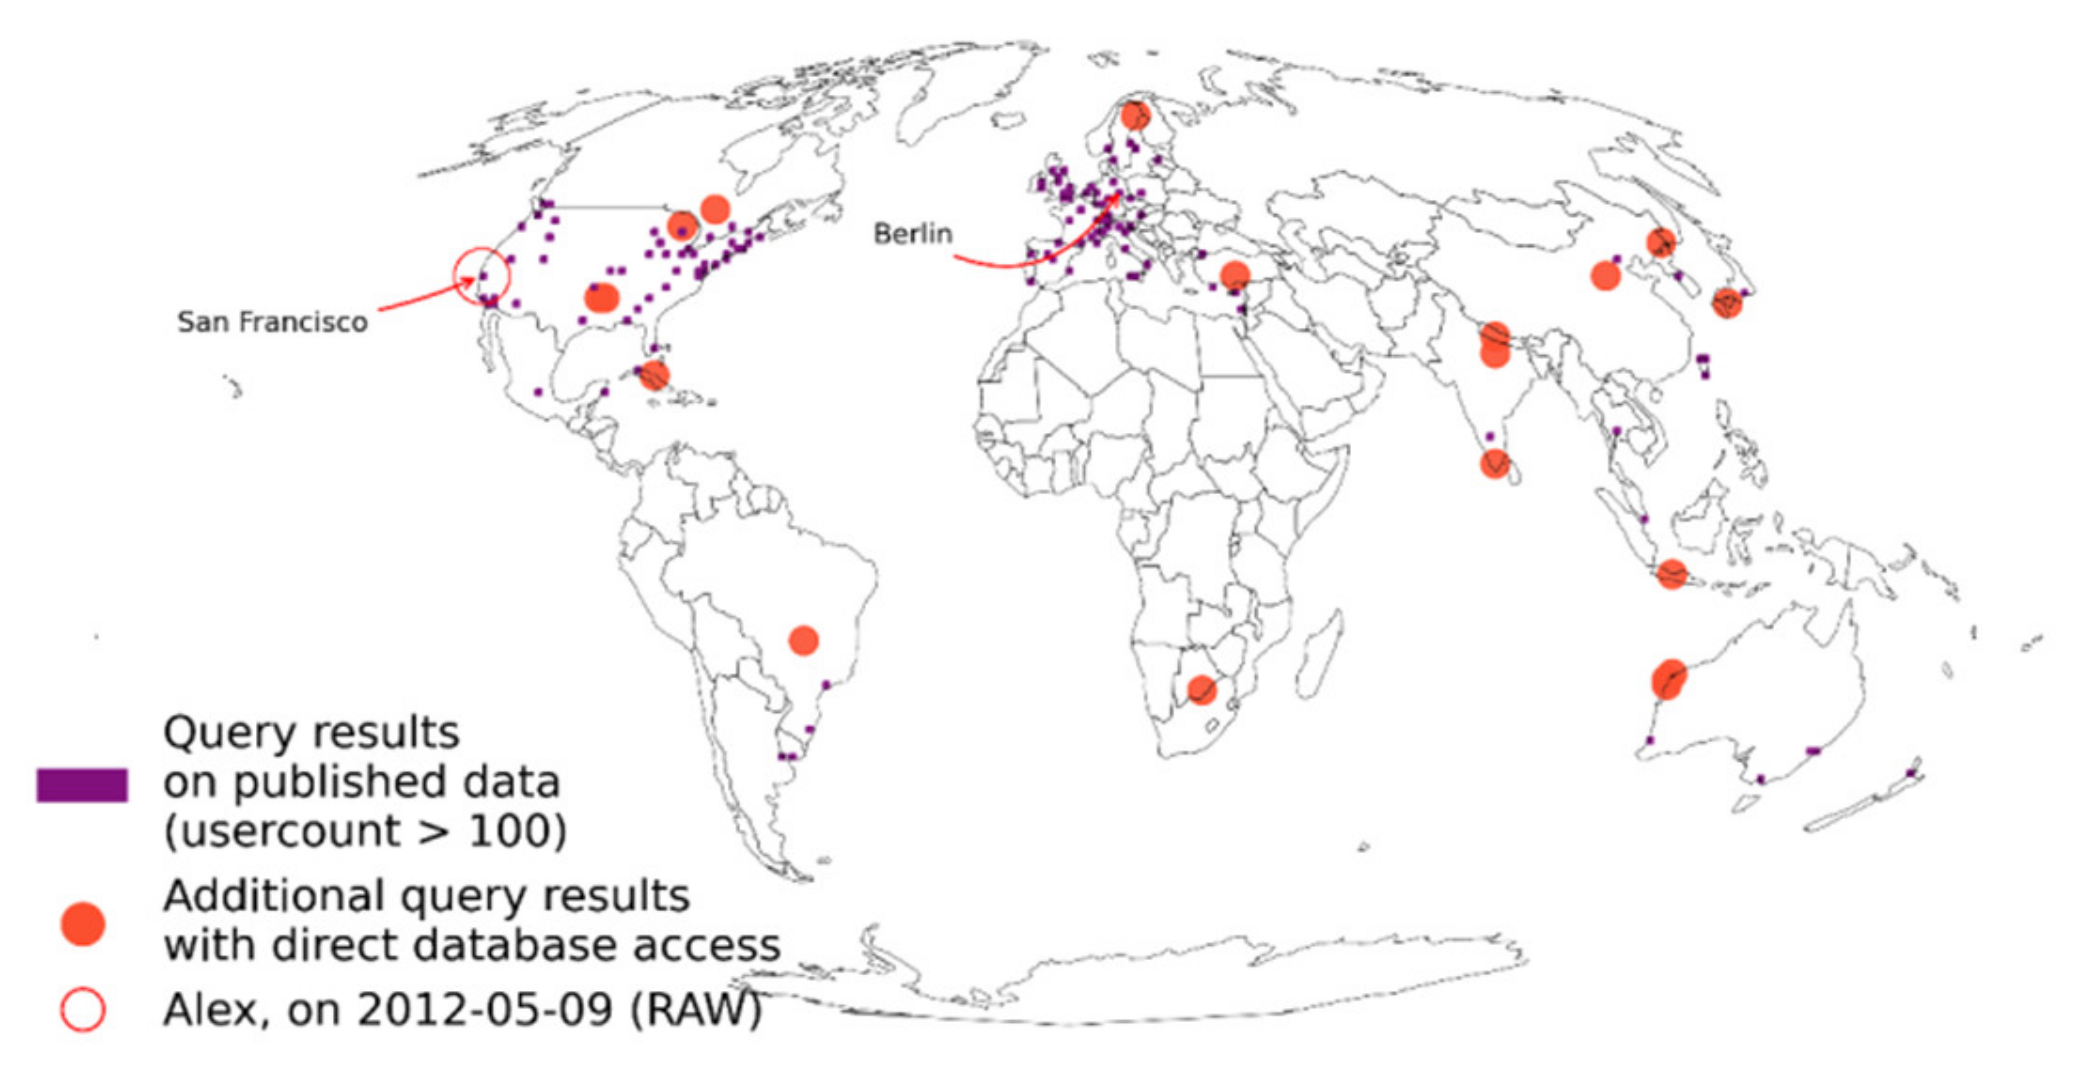
5. Case Study: Alex, “Sandy”, and “Robert”

The only way for an attacker to gain information about the contents of a HLL set is through an intersection attack (Section 4.3). To better illustrate intersection attacks, and how, and under which, circumstances privacy of a user could become compromised in the presented two-component research setup, we briefly introduce two examples. Alex is a real user who is included in the YFCC100M dataset because he published 289 photos under Creative Commons Licenses between 2013 and 2014 on Flickr; 120 of these photos are geotagged. Alex is one of the authors of this paper. Given this information, it will be relatively easy to re-identify Alex. “Sandy” and “Robert”, instead, are fictional persons.
We use Sandy to describe an internal adversary. Sandy could be someone working at the Analytical Service, with full access to the database. In the first example, the privacy of Alex is compromised if Sandy could increase or confirm her suspicion that Alex was not at his workplace in Berlin on 9 May 2012. Robert, on the other hand, is someone representing an external adversary, with access only to the published dataset. In this second example, the privacy of Alex is compromised if Robert could increase or confirm his suspicion that Alex was indeed at least once at a specific location, e.g., contrary to what Alex claims. Finally, Alex could be someone who voluntarily contributed his pictures to the conceived AS, or altruistically published Creative Commons photos on Flickr.
Consider that, at the moment of contribution, Alex may not have thought of the consequences to his privacy, but later realized his mistake. With the use of raw data, even removing any compromising data from Flickr, this change would need to be reflected in any subsequent data collection, such as in our fictional AS or the YFCC100M dataset. This is either impractical or impossible. The question is, therefore, whether it is possible to replace raw data workflows with a privacy-aware visualization pipeline, without significantly reducing utility. In the following, we first discuss and illustrate how parameter choices made so far affect visualizations and the ability to use results, by comparing the visualization process in parallel for raw and HLL data. In Section 6.3, we return to the two examples illustrated here and evaluate, using the privacy-aware HLL data, whether the privacy of Alex could be compromised through an intersection attack.

6. Results

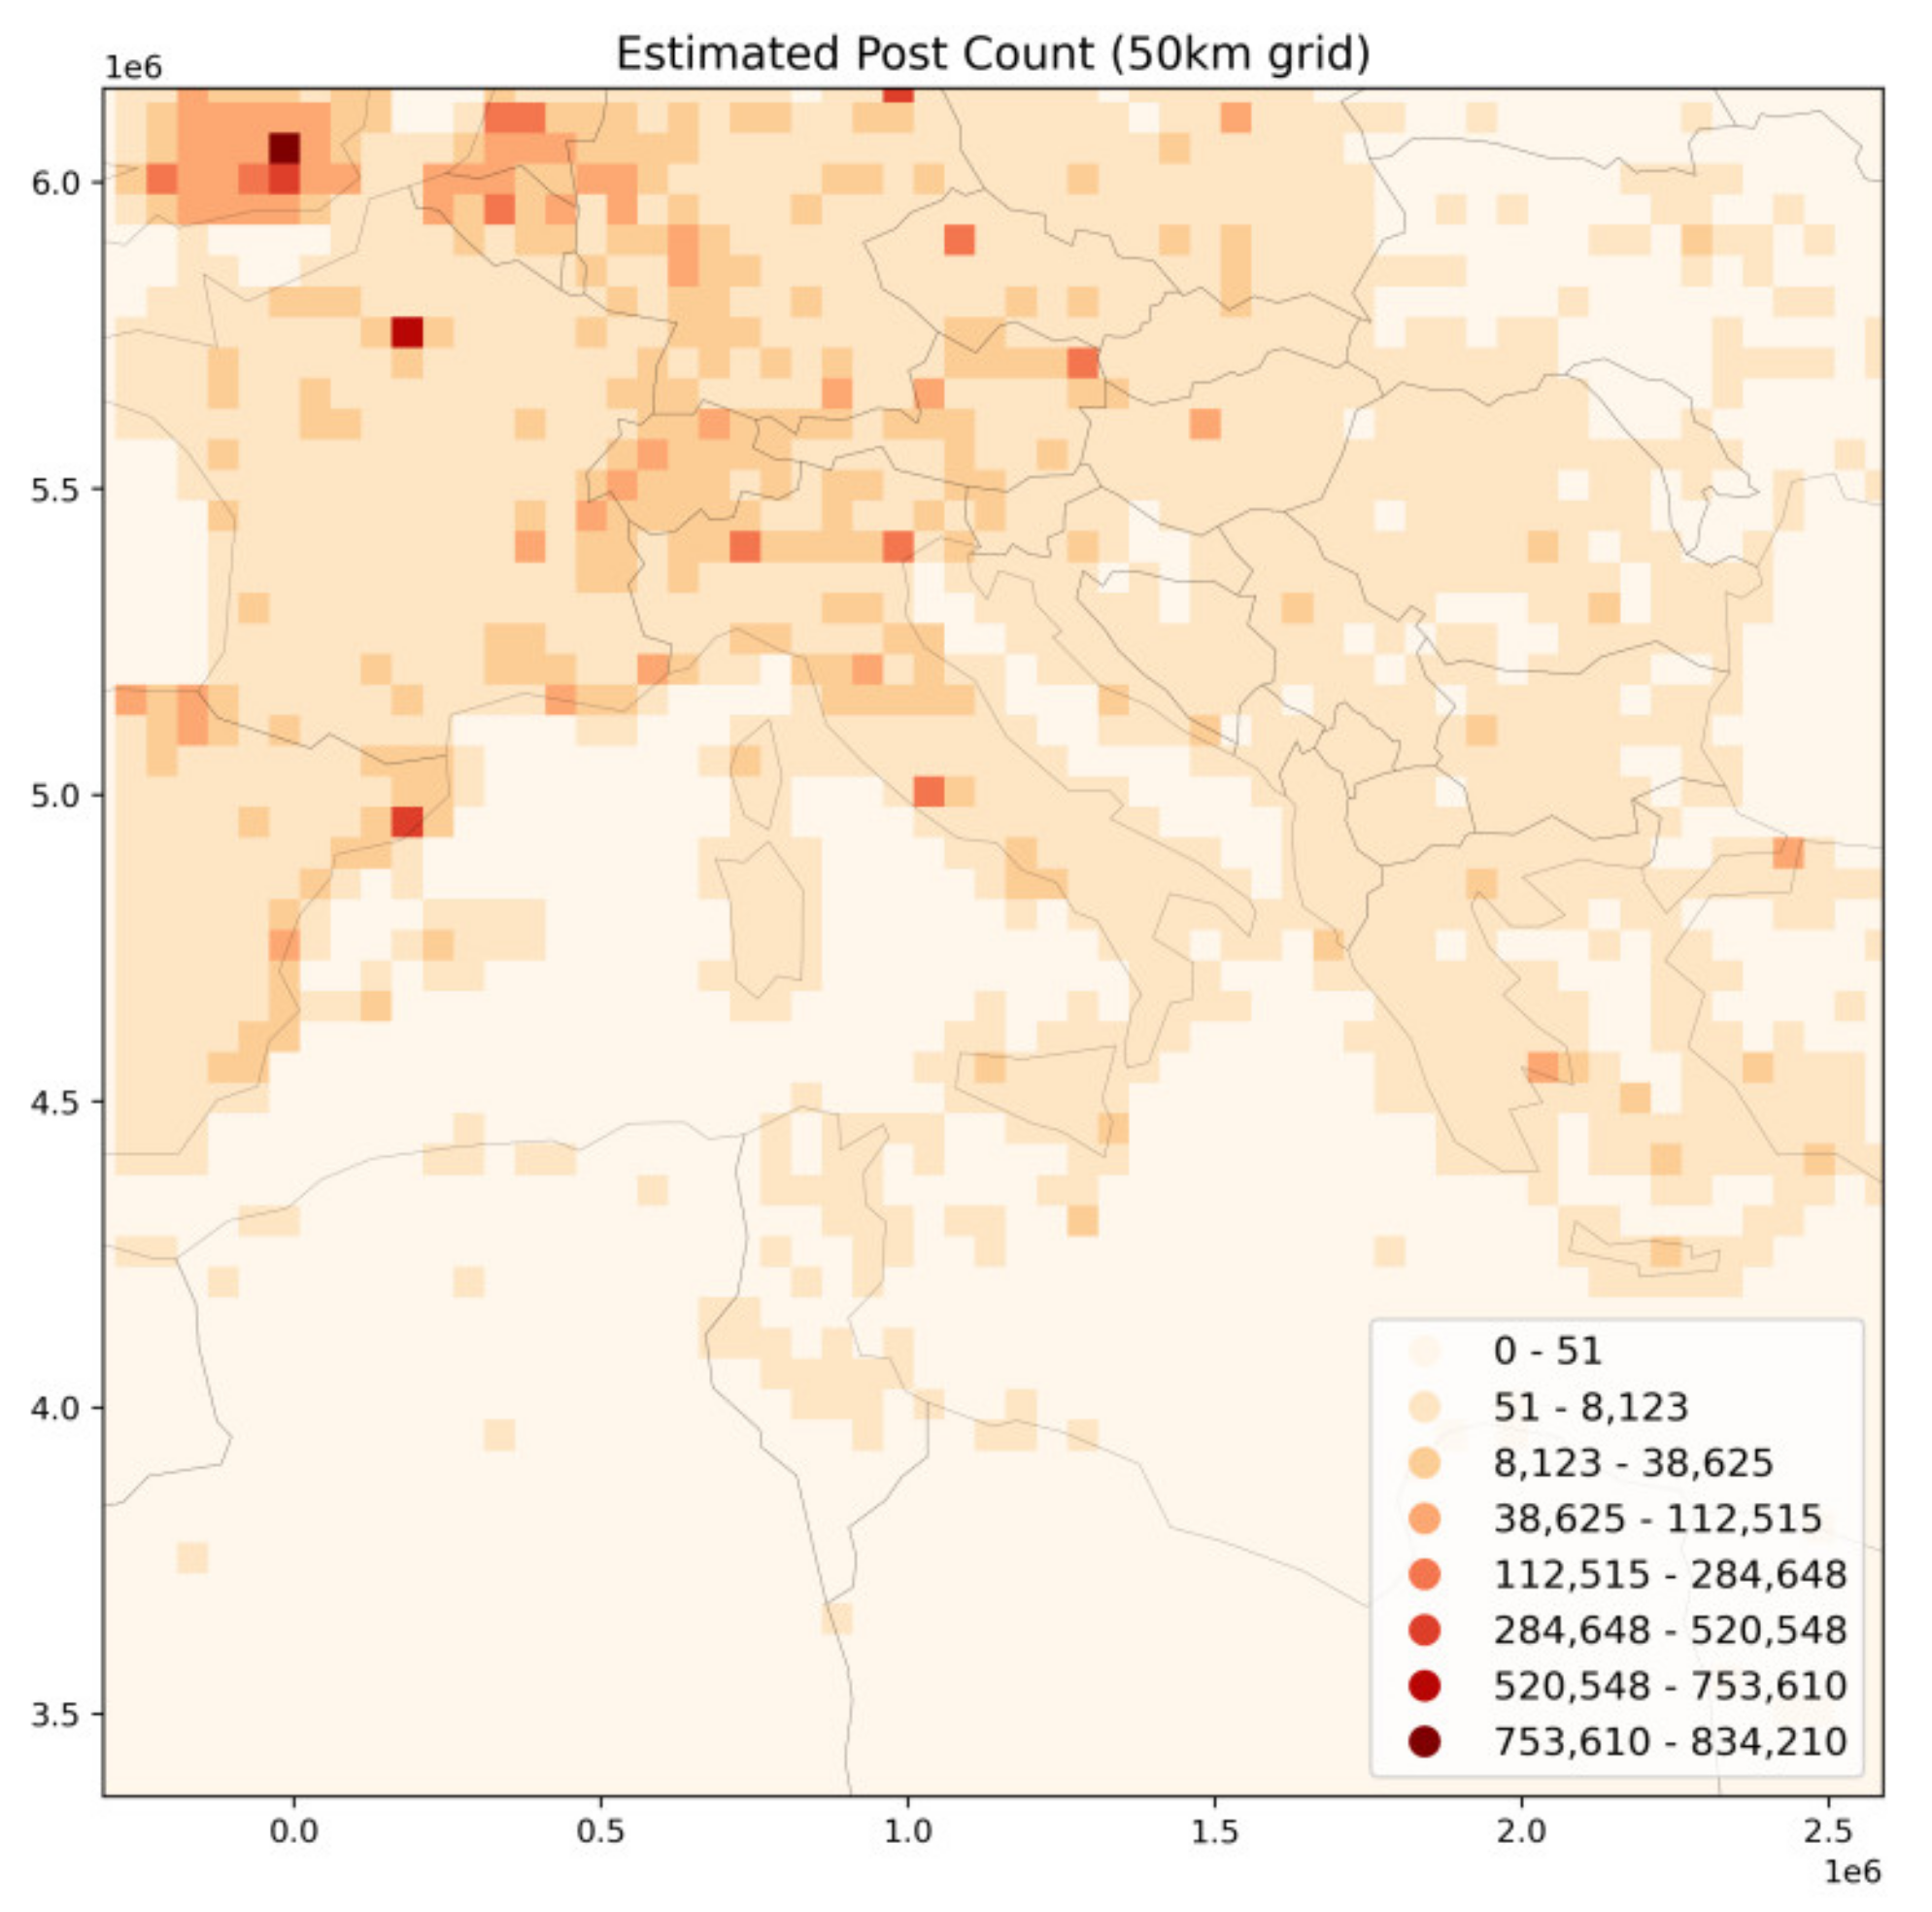
6.1. Worldwide Visitation Patterns

To produce graphics of worldwide spatial visitation patterns, envisaged in a grid of 100 km bins, spatial aggregation of data is required. We use a binary search to assign coordinates to discrete bins. In a raw data setting, all distinct IDs (user ID, post ID, post publish date) must first be collected fully per bin, until all data is available. Only afterwards, the number of distinct elements per bin can be computed. In contrast, in a HLL data setting, all transformation steps (steps 1 to 4, Figure 2, Section 4.3) can be applied on a single piece of information basis. In other words, the HLL transformation can happen immediately, upon any new element arriving, for instance, in streaming contexts. This also means that individual HLL sets for PC, UC and PUC are merged by incremental union per bin, until all data is processed. The Supplementary Materials (S2–S4) include the procedural Python code to produce the following graphics from raw and HLL data, respectively.
Before presenting more concrete results, we briefly summarize apparent differences in visuals and processing workflow. Figure 4 compares graphics generated for exact and estimated user days per 100 km bin for a part of Europe. For classification, the head/tail breaks algorithm is used, which offers a scheme that is specifically suited for data with a heavy-tailed distribution [58]. Head/tail breaks automatically calculates the number of classes. For both raw and HLL data, head/tail breaks produced seven classes. The 3 to 5% error rate of HLL is only noticeable in legend entries. In Figure 4, a total number of two bins switch classes (i.e., change color), due to edge cases in the automatic classification process (for graphics comparison, see Supplementary Materials, S7).
All metrics for all bins can be interactively explored in a map interface (see Figure 5 and Supplementary Materials, S8). Evidently, the values observed are within expected error bounds of the HLL cardinality estimation (Section 4.3). In total, the differences that impact visuals are largely imperceptible. In addition, the effort required to modify the visualization process, for compatibility with the HLL calculation, was found to be rather small, with the exception of some cumbersome support for Python (compare notebooks raw/HLL, Supplementary Materials, S2–S3).
For an additional basis of comparison of tradeoffs between raw and HLL data processing, several performance benchmarks have been collected in notebooks (see summary in Table 2 and code in Supplementary Materials, S2–S3). The total size of data that is initially given to the visualization process is 2.5 GB (raw) and 134 MB (HLL, sparse mode). For the sake of comparability, the difference of size for explicit (281 MB) and full mode (3.3 GB) is given (Table 2). If both explicit and sparse mode are disabled, the total size of HLL data is slightly larger than raw data because many small sets exist. For raw data, the processing time to produce the worldmap differs for different metrics because computation of the count of distinct items becomes more expensive for more complex metrics such as user days. In contrast, HLL processing time for the incremental union of all sets to 100 km bins remains linear. The memory peak observed for raw and HLL aggregation largely depends on parameter settings. For union of HLL sets, any arbitrary chunk_size can be used to parallelize processing. In contrast, for computation of the count of distinct items with raw data, all identifiers per bin must first be fully available, limiting possibilities to reduce memory load.
Lastly, Figure 6 shows the same grid for Europe, for post count and with a changed parameter of grid_size = 50 (km). For such a change to the visualization pipeline to be possible at later time, it is necessary to have a sufficiently accurate initial granularity of spatial information available. While HLL sets can be merged seamlessly in a bottom-up manner, the lower threshold that is defined at data collection time affects the ability to later reduce the grid size parameter. In our demonstration, a GeoHash of 5 (4 km) perhaps illustrates a rather conservative tradeoff, towards more analytical flexibility, but less service – internal geoprivacy.

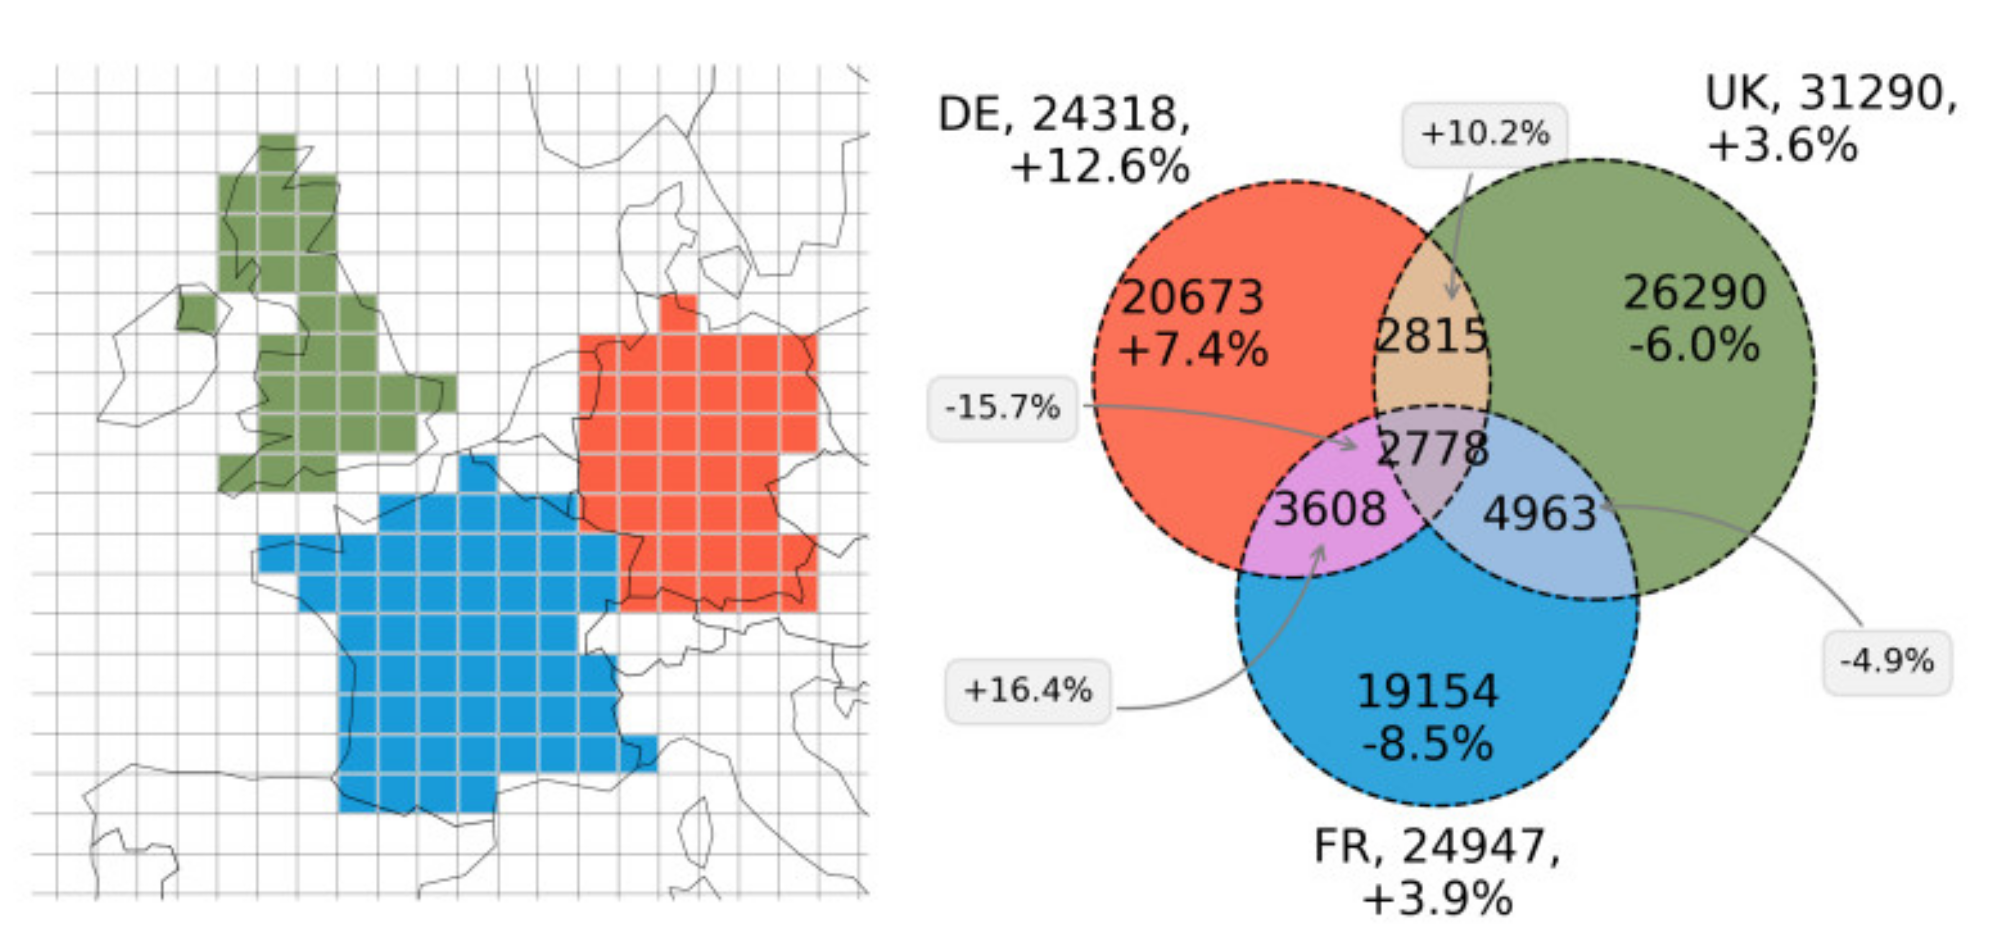
6.2. Utility of Published Benchmark Data

Benchmark data containing all HLL sets for grid bins with user count ≥ 100 are made available as Supplementary Materials (S9), equally reflecting a rather conservative tradeoff, towards more analytical freedom. In our system model (Section 3.1), decision makers could use this data to further study data patterns, in a limited manner, through the union and intersection capability of HLL. To illustrate this further use of the HLL benchmark data released, we briefly illustrate an example here. Firstly, consider that for two sets A and B, the union of the sets refers to the sum of all elements that appear in either one of the two sets. This union operation can be expressed as A B . The intersection, in contrast, is the sum of all elements that appear in both sets and can be expressed as A B . According to set theory [38], unions can be used to calculate intersection. Following the inclusion–exclusion principle (ibid., p. 120), the relation between intersection and union can be formally expressed as A B   =   A   +   B     A     B , which can be transformed to A B   =   A   +   B     A     B . For three sets A, B and C, the formula can be written as A     B     C   =   A     B     C     A     B     C   +   A     B   +   A     C   +   B     C (ibid.). Both union and intersection allow the quantitative evaluation of relationships between different HLL sets such as common user visitation counts between different regions.
In Figure 7, grid cells are first selected based on centroid–country intersection for France, Germany, and the UK, and merged to produce three sets (user count) for the three countries. Based on the inclusion–exclusion principle, common user counts for several different groups are estimated. The relative error rate compared to raw data processing is given in percentage numbers. The quality of the intersection is not very reliable if the sets have very few overlaps or a large difference in size [59]. In our example, all sets are of almost equal size, with a total number of 24,318 (DE), 24,947 (FR), 31,290 (UK) distinct users having shared at least one photo from these countries. Only a small number of 2778 estimated users have shared a photo from all three countries.
Obviously, a limitation factor for the utility of the intersection capability is the relative error rate. In Figure 7, high error rates with up to 16% are observed. These numbers are a combined result of two factors. Firstly, the intersection of HLL sets may significantly amplify error bounds of original HLL sets (ibid.). Secondly, the granularity of benchmark data with a 100 km grid is only limitedly suited to be intersected with exact country borders. This is a consequence of working with pre-aggregated data and is commonly referred to as the Modifiable Areal Unit Problem (MAUP, see [60]). MAUP explains, for example, the large error rate of 12.6% overestimation for Germany, and it is also obvious for France, where no bin was selected for Corsica based on country–centroid intersection. In Figure A2, Figure 7 was generated based on a reduced grid size parameter of 50 km, which significantly reduces error rates from MAUP.

6.3. Privacy Trade-Off

The union –intersection capability of HLL opens up an increased utility of data, but at the same time introduces the possibility of intersection attacks (see Section 4.3). Several factors must coincide for intersection attacks to be successful. Firstly, an adversarial must have access to HLL sets. In our system model, this can either be an internal adversary (“Sandy”), having direct access to the database, or an external adversary (“Robert”), having access only to published benchmark data (see Section 5). Furthermore, an adversary must be able to either compute hashes for a given target user, or somehow gain access to a computed HLL set for the given user. The former is only possible if the secret key is compromised. The latter appears conceivable, in our example, if the adversary has some prior knowledge about other locations visited by a target user, and if the HLL sets of these locations ideally contain only the target user or a few other users. In the following, we explore this worst-case scenario, where both “Sandy” and “Robert” (see case studies, Section 5) somehow got hold of a HLL set that only contains Alex’s computed hashes.
For “Sandy”, this means in order to test whether Alex was not in Berlin on 9 May 2012, she either needs Alex’s original user ID and the secret key to construct the user day–hash, or find another location (e.g., a grid bin) that has only been visited by Alex on this date. In this unlikely scenario, the result of an intersection attack for all grid cells is shown in Figure 8. Visible in the figure is that a large number of other grid cells show false-positives for the intersection test, that is, these HLL sets did not change, even when updated with the particular user day-hash for Alex. Since HLL prevents the occurrence of false negatives, and San Francisco is indeed among these locations, the result does include Alex’s actual location on 9 May 2012. Depending on the size of the targeted HLL set, Sandy may then increase her suspicion by some degree. In case of the grid cell for San Francisco, with 209,581 user days, this increase in posterior knowledge may be found to be negligibly small. In other words, even if there was no post from Alex on 9 May 2012, the intersection attack may have produced the same result, providing a differentially private situation. In conclusion, even in the worst scenario, having direct access to the database and a compromised secret key, Sandy could not gain any further corroboration. Similarly, and rather incidentally, the positive grid cell for Berlin does indeed falsely suggest that Alex was in Berlin. This is not surprising given that larger HLL sets have a higher likeliness of showing false positives, and Berlin is a highly frequented location. In other words, Alex benefits from the privacy-preserving effect of HLL, by “hiding in the crowd” [27] (p. 2).
In the second scenario, consider a situation in which “Robert” may have an a-priori suspicion that Alex went to Cabo Verde. Alex, on the other hand, does not want Robert to know that he went surfing without him. Robert knows that Alex is participating in the conceived AS and, somehow, gains access to a HLL set containing only one hashed user ID from Alex. The results of the intersection attack for all grid cells are shown in Figure 9. Since only 56 users have been to Cabo Verde in the YFCC100M dataset, the particular bin is not included in the published benchmark data, which is limited by a minimum threshold of 100 users. However, with direct access to the database, Robert could observe that Cabo Verde is among the locations revealed. In this case, Robert may gain some corroboration for his suspicion that Alex was in Cabo Verde. At the same time, a definite answer will not be possible, given the irreversible approximation of the HLL structure. For example, for the same intersection attack, for set sizes below 56 users, there are 14 other grid cells that show false positives, down to eight users (for a comparison of these numbers, see Supplementary Materials, S6). In other words, even though these HLL sets do not change when tested, Alex has never been to these locations, adding further noise to the results.
While these two scenarios provide a base to understand how intersection attacks may be executed in a spatial setting, a valid question is how likely successful intersection attacks are overall. To some degree, this depends on questions of security, such as protecting the secret key, or managing database access, which cannot be fully covered in this work. Another part is directly related to the distribution of collected data and the number of outliers that are present at each stage of data processing (see Section 4.4). If data is more clustered, users will generally receive more benefits from the privacy-preserving effects of HLL. This can be quantitatively substantiated with the given dataset. For example, at data collection time, with a Geohash of five, there are 226,025 locations that contain only one user ID. Compared to raw data, this represents only 1.77% of the total distinct locations available in the YFCC100M dataset. Furthermore, only 50,358 users (8.43%) have visited one of these locations at least once, providing an upper bound to the possibility of intersection attacks, based on a fully compromised database. Privacy risks are further mitigated with data aggregated to 100 km bins. A total of 3354 grid bins (26.64% of total grid bins with data) have a user cardinality of one. These grid bins contain only 1833 users, reflecting the small minority of “adventurous” users who have visited at least one bin where no other user has been. In an adversarial situation of a fully compromised database, these adventurers will receive little benefits from the privacy-preserving effects of HLL. However, this group also only represents 0.31% of total users in the YFCC100M dataset and the set of possible conclusions that can be drawn from a successful intersection attack is severely limited. Finally, 41,582,251 of posts are included in HLL sets of bins (100 km) with post count ≥ 10,000, which feature a strong privacy-preserving effect according to [36]. This represents 85.79% of all geotagged posts in the YFCC100M dataset (for calculations of the numbers above, see Supplementary Materials, S5).

7. Discussion

In the puzzle piece of privacy-aware and privacy-preserving components, practical obstacles of implementation and the cost of making existing workflows compatible with privacy continue to impede wider adoption [31]. This is specifically problematic in areas where user privacy, albeit recognized as beneficial, is not a fundamental requirement. Here, HLL may fill in a gap, by featuring ad-hoc capabilities that can generally improve workflows, while still allowing some flexibility of analysis. However, as has been shown by others, the privacy-preserving side effect of HLL can be weak under certain situations. Practitioners could rationally reach opposite conclusions regarding whether the benefits outweigh the costs in particular contexts.
The results in this article provide a range of measures, specifically suited for evaluating the privacy–utility tradeoff connected to the use of HLL in the context of spatial data processing. In the context of streaming applications for VGI and crowdsourced geographic information, a distinct advantage is that raw data can be immediately split into its atomic pieces, upon any new elements arriving. This allows reducing the overall data footprint of visual analytics at data collection time. Equally, direct relations between data, such as user IDs, post IDs, or user days, which are among the most problematic attributes from a privacy perspective, can be dissolved before data is stored. This largely reduces possibilities to re-use data beyond the original context considered. In this paper, this has been demonstrated for the most popular metrics, user count, post count and user days, which are currently used in decision-making to analyze e.g., spatial activity. Unlike with raw data, tracking a single user across several locations is impossible with absolute certainty given the HLL data.
At the same time, some flexibility to further explore data remains open. By using the exclusion–inclusion principle, patterns of data and relationships can be quantitatively evaluated, as demonstrated with the identification of common visitor counts for Germany, France and the UK (Section 6.2). Information like this may be used in decision-making, as a privacy-aware proxy, for analyzing tourism behavior or important cultural connections between groups of different people. Similar information is considered as an important basis to evaluate, for instance, socio-spatial inequality [61]. In natural resource management, particularly highly frequented places may be monitored using the data structure presented here, providing insights into user behavior without compromising user privacy. Just one example application could be to monitor and mitigate the negative impact on vantage points that are overrun by Instagram followers, as a consequence of influencers and the global spread of information [62]. From a broader point of view, the approach presented here could also be applied to other spatial problem solving contexts, for example to Spatial Delphi [63], as a means to seek anonymous expert opinions’ convergence.
We specifically and deliberately refer to the approach illustrated herein as “privacy-aware”, instead of privacy-preserving, because additional considerations and risk mitigation strategies are required to render intersection attacks more difficult and less efficient in practice. Among those discussed, protecting the secret key that is used to create hashes is perhaps most important. Protecting a secret key is simplified by the ability to parallelize and containerize computation of HLL sets and because analysts do not need to know the key to be able to work with the data. For example, a separate Sketching Service can be used to create hashes (see Figure 1, Section 3.1), which can be operated separately from the conceived Analytical Service. In pro-active collaboration scenarios (see Figure 1, Section 3.1), further improvements appear possible, such as signing hashes on user devices, with keys only known to the users themselves. A measure to effectively prevent intersection attacks, as suggested by Desfontaines et al. [36] (p. 15), is to use different keys for different HLL sets. In our case, hashes for each grid bin could be created with a different key, rendering intersection attacks much more difficult. However, this would also remove any ability to use data beyond cardinality estimation. Finally, an important measure to gradually reduce vulnerability, particularly when publishing datasets, is to limit HLL sets by a lower threshold. Higher thresholds will increase the average privacy of users, but also limit application to relatively large data collections.
From this point of view, HLL may be particularly suitable as a first step towards more user privacy, with little or no detrimental effect on the quality and utility of results, including the promise of improved performance. Based on these benefits, HLL offers a largely untapped potential to replace many data processing pipelines that currently still use raw data. The performance benchmarks collected in Section 6 and example code published may underpin this development for spatial visualizations. Finally, all measures described above are complementary. They can be supplemented by more robust solutions, such as adding noise, for satisfying stricter notions of privacy.
Notwithstanding the many ways in which the presented visualization setup could be used and applied, the method described herein constitutes an integrated approach with limited consideration of related spatial visualization methods, and it was only tested on one specific data set. Some spatial visualization techniques, such as the one presented herein, may be more suited to be combined with HLL than others. It would be interesting, for example, to classify visualization techniques based on their ability to be combined with PDS. Another direction could be to use more advanced methods for automatically classifying the sensitivity of HLL sets at various stages, such as that presented by Reviriego et al. [64], or more formally evaluating the privacy–utility tradeoff, such as those presented by Feyisetan et al. [27] or Desfontaines et al. [36]. From an application-oriented perspective, it would be interesting to apply the presented two-component HLL setup to data beyond locations, such as topical and temporal information (e.g., tags, dates), with the ability to study a broader set of relationships through intersection.

8. Conclusions

HLL and other PDS open up a relatively new direction for visual analytics, which is specifically suited to exploration in combination with visualization techniques that focus on identifying patterns of data and contexts where definite answers are not a requirement. This makes HLL particularly suited for large data collections, such as those frequently encountered with VGI and publicly crowdsourced geographic information. As a side effect, HLL allows an increase in the privacy of volunteers at data collection time, with the ability to further and gradually tune risks during multi-step and multi-criteria decision-making processes. In a limited application scenario, this has been shown for spatial activity analysis in the present study. From a utility perspective, the results suggest that little to no compromises are necessary to transition workflows. Furthermore, HLL provides benefits beyond an increase in user privacy such as performance improvements, a reduced storage need, or improved encapsulation of processing pipelines. The results shown in this paper provide a base for evaluating a number of additional utility trade-offs when transitioning workflows, particularly for spatial data processing techniques. The provided notebooks can serve as a basis for adaption to other contexts.
Limitations apply for application contexts that require exact guarantees for privacy preservation. In spatial scenarios, such as the one presented herein, the privacy-preserving effect of HLL can be weak in the presence of outliers. While outliers can be reduced by different techniques, additional risk mitigation strategies are required to make the approach compatible with stricter notions of privacy, such as adding noise or data exclusion. Several of these strategies are discussed in this paper. Whether the benefits outweigh the costs is context-dependent and practitioners are encouraged to consider a combination of techniques, rather than focus on one particular solution, as is presented for purposes of isolation in this paper.

Supplementary Materials

The following are available online at https://0-www-mdpi-com.brum.beds.ac.uk/2220-9964/9/10/607/s1, Jupyter Notebook S1: 01_preparations.html, Jupyter Notebook S2: 02_grid_agg_raw.html, Jupyter Notebook S3: 03_grid_agg_hll.html, Jupyter Notebook S4: 04_interpretation.html, Jupyter Notebook S5: Figure2_outlier_analysis.html, Jupyter Notebook S6: Privacy_test_alex.html, Interactive comparison of graphics (HTML) S7: yfcc_compare_raw_hll.html, Interactive Map S8 (Figure 5): yfcc_usercount_est.html, benchmark data (CSV) S9: yfcc_all_est_benchmark.csv.*.* Note: For Jupyter Notebooks, only HTML conversions are attached to this work. The notebook files (ipynb format) are available in a separate data repository [52].

Author Contributions

Conceptualization, Alexander Dunkel and Marc Löchner; Methodology, Alexander Dunkel; Software (Visualization), Alexander Dunkel; Software (Docker), Marc Löchner; Validation, Alexander Dunkel and Dirk Burghardt; Formal Analysis, Alexander Dunkel; Investigation, Alexander Dunkel; Resources, Dirk Burghardt; Data Curation, Alexander Dunkel; Writing—Original Draft Preparation, Alexander Dunkel; Writing—Review and Editing, Dirk Burghardt; Visualization, Alexander Dunkel; Supervision, Dirk Burghardt; Project Administration, Dirk Burghardt; Funding Acquisition, Dirk Burghardt and Alexander Dunkel. All authors have read and agreed to the published version of the manuscript.

Funding

This work was supported by the German Research Foundation as part of the priority programme “Volunteered Geographic Information: Interpretation, Visualisation and Social Computing” (VGIscience, priority programme 1894).

Conflicts of Interest

The authors declare no conflict of interest.

Appendix A

Figure A1. Worldwide map of estimated user counts (YFCC) per 100 km grid bin.
Ijgi 09 00607 g0a1
Figure A2. Figure 7 generated with 50 km grid size parameter and corresponding error rates.
Ijgi 09 00607 g0a2

References

  1. See, L.; Mooney, P.; Foody, G.; Bastin, L.; Comber, A.; Estima, J.; Rutzinger, M. Crowdsourcing, citizen science or volunteered geographic information? The current state of crowdsourced geographic information. ISPRS Int. J. Geo Inf. 2016, 5, 55. [Google Scholar] [CrossRef]
  2. Harvey, F. To Volunteer or to contribute locational information? Towards truth in labeling for crowdsourced geographic information. In Crowdsourcing Geographic Knowledge: Volunteered Geographic Information (VGI) in Theory and Practice; Sui, D.Z., Elwood, S., Goodchild, M.F., Eds.; Springer: Dordrecht, The Netherlands, 2013; pp. 31–42. [Google Scholar]
  3. Ghermandi, A.; Sinclair, M. Passive crowdsourcing of social media in environmental research: A systematic map. Glob. Environ. Chang. 2019, 55, 36–47. [Google Scholar] [CrossRef]
  4. Malhotra, N.K.; Kim, S.S.; Agarwal, J. Internet users’ information privacy concerns (IUIPC): The construct, the scale, and a causal model. Inf. Syst. Res. 2004, 15, 336–355. [Google Scholar] [CrossRef]
  5. Lane, J.; Stodden, V.; Bender, S.; Nissenbaum, H. Privacy, Big Data, and the Public Good: Frameworks for Engagement; Cambridge University Press: Cambridge, UK, 2015. [Google Scholar] [CrossRef]
  6. Metcalf, J.; Crawford, K. Where are human subjects in Big Data research? The emerging ethics divide. Big Data Soc. 2016, 3, 205395171665021. [Google Scholar] [CrossRef]
  7. De Groot, R.S.; Alkemade, R.; Braat, L.; Hein, L.; Willemen, L. Challenges in integrating the concept of ecosystem services and values in landscape planning, management and decision making. Ecol. Complex. 2010, 7, 260–272. [Google Scholar]
  8. Hon, W.K.; Millard, C.; Walden, I. The problem of “personal data” in cloud computing: What Information is regulated?—The cloud of unknowing. Int. Data Priv. Law 2011, 1, 211–228. [Google Scholar] [CrossRef] [Green Version]
  9. Wang, Q.; Zhang, Y.; Lu, X.; Wang, Z.; Qin, Z.; Ren, K. Real-Time and Spatio-Temporal Crowd-Sourced Social Network Data Publishing with Differential Privacy. IEEE Trans. Dependable Secur. Comput. 2018, 15, 591–606. [Google Scholar] [CrossRef]
  10. Dustdar, S.; Rosenberg, F. A survey on context-aware systems. Inf. Syst. 2007, 2, 263–277. [Google Scholar]
  11. Politou, E.; Alepis, E.; Patsakis, C. Forgetting personal data and revoking consent under the GDPR: Challenges and Proposed Solutions. J. Cybersecur. 2018, 1–20. [Google Scholar] [CrossRef]
  12. Victor, N.; Lopez, D.; Abawajy, J.H. Privacy models for big data: A survey. Int. J. Big Data Intell. 2016, 3, 61. [Google Scholar] [CrossRef]
  13. D’Orazio, V.; Honaker, J.; King, G. Differential Privacy for Social Science Inference. SSRN Electron. J. 2015. [Google Scholar] [CrossRef] [Green Version]
  14. Oberski, D.L.; Kreuter, F. Differential Privacy and Social Science: An Urgent Puzzle. Harv. Data Sci. Rev. 2020, 2, 1–22. [Google Scholar] [CrossRef]
  15. Solove, D.J. Introduction: Privacy self-management and the consent dilemma. Harv. Law Rev. 2013, 126, 1880–1903. [Google Scholar]
  16. Flajolet, P.; Fusy, É.; Gandouet, O. HyperLogLog: The analysis of a near-optimal cardinality estimation algorithm. In Proceedings of the Conference on Analysis of Algorithms, AofA 07, Nice, France, 17–22 June 2007; 2007; Volume 7, pp. 127–146. [Google Scholar]
  17. Ataei, M.; Degbelo, A.; Kray, C.; Santos, V. Complying with privacy legislation: From legal text to implementation of privacy-aware location-based services. ISPRS Int. J. Geo Inf. 2018, 7, 442. [Google Scholar] [CrossRef] [Green Version]
  18. Martinez-Balleste, A.; Perez-Martinez, P.; Solanas, A. The pursuit of citizens’ privacy: A privacy-aware smart city is possible. IEEE Commun. Mag. 2013, 51, 136–141. [Google Scholar] [CrossRef]
  19. Singh, A.; Garg, S.; Kaur, R.; Batra, S.; Kumar, N.; Zomaya, A.Y. Probabilistic data structures for big data analytics: A comprehensive review. Knowl. Based Syst. 2020, 188. [Google Scholar] [CrossRef]
  20. Keßler, C.; McKenzie, G. A geoprivacy manifesto. Trans. GIS 2018, 22, 3–19. [Google Scholar] [CrossRef] [Green Version]
  21. Westin, A.F. Privacy and Freedom; Atheneum: New York, NY, USA, 1967. [Google Scholar]
  22. Altman, I. The Environment and Social Behavior: Privacy, Personal Space, Territory, Crowding; Brooks/Cole Pub. Co.: Monterey, CA, USA, 1975. [Google Scholar]
  23. Yu, S. Big Privacy: Challenges and Opportunities of Privacy Study in the Age of Big Data. IEEE Access 2016, 4, 2751–2763. [Google Scholar] [CrossRef] [Green Version]
  24. Samarati, P.; Sweeney, L. Protecting Privacy when Disclosing Information: K-Anonymity and Its Enforcement through Generalization and Suppression; Technical Report SRI-CSL-98-04; Computer Science Laboratory, SRI International: Menlo Park, CA, USA, 1998. [Google Scholar]
  25. Aggarwal, C.C. On k-anonymity and the curse of dimensionality. In Proceedings of the 31st International Conference on Very Large Data Bases, Trondheim, Norway, 30 August–2 September 2005; pp. 901–909, VLDB Endowment. [Google Scholar]
  26. Kamp, M.; Kopp, C.; Mock, M.; Boley, M.; May, M. Privacy-preserving MOBILITY MONITORING USING sketches of stationary sensor readings. In Machine Learning and Knowledge Discovery in Databases. ECML PKDD 2013. Lecture Notes in Computer Science; Springer: Berlin/Heidelberg, Germany, 2013. [Google Scholar]
  27. Feyisetan, O.; Drake, T.; Balle, B.; Diethe, T. Privacy-preserving active learning on sensitive data for user intent classification. CEUR Workshop Proc. 2019, 2335, 3–12. [Google Scholar]
  28. Jain, P.; Gyanchandani, M.; Khare, N. Big data privacy: A technological perspective and review. J. Big Data 2016, 3. [Google Scholar] [CrossRef] [Green Version]
  29. Dwork, C.; McSherry, F.; Nissim, K.; Smith, A. Calibrating noise to sensitivity in private data analysis. In Theory of Cryptography Conference; Springer: Berlin/Heidelberg, Germany, 2006; pp. 265–284. [Google Scholar]
  30. Dwork, C. Differential privacy: A survey of results. In Theory and Applications of Models of Computation: Proceedings of the Fifth International Conference, TAMC 2008, Xi’an, China, 25–29 April 2008; Springer Lecture Notes in Computer Science; Springer: Berlin/Heidelberg, Germany, 2008; Volume 4978, pp. 1–19. [Google Scholar]
  31. Machanavajjhala, A.; He, X.; Hay, M. Differential privacy in the wild: A tutorial on current practices & open challenges. Part F127746. Proc. ACM SIGMOD Int. Conf. Manag. Data 2017, 1727–1730. [Google Scholar] [CrossRef] [Green Version]
  32. Fan, L.; Xiong, L. Real-time aggregate monitoring with differential privacy. ACM Int. Conf. Proc. Ser. 2012, 2169–2173. [Google Scholar] [CrossRef] [Green Version]
  33. Dwork, C.; Naor, M.; Pitassi, T.; Rothblum, G.N. Differential Privacy Under Continual Observation. In Proceedings of the Forty-Second ACM Symposium on Theory of Computing, STOC’10, Cambridge, MA, USA, 6–8 June 2010; pp. 715–724. [Google Scholar]
  34. Bianchi, G.; Bracciale, L.; Loreti, P. “Better Than Nothing” privacy with bloom filters: To what extent? In Proceedings of the 2012 International Conference on Privacy in Statistical Databases, Palermo, Italy, 26–28 September 2012; Springer: Berlin/Heidelberg, Germany, 2012; pp. 348–363. [Google Scholar] [CrossRef]
  35. Yu, Y.W.; Weber, G.M. Federated queries of clinical data repositories: Balancing accuracy and privacy. BioRxiv 2019, 841072. [Google Scholar] [CrossRef] [Green Version]
  36. Desfontaines, D.; Lochbihler, A.; Basin, D. Cardinality Estimators do not Preserve Privacy. Proc. Priv. Enhancing Technol. 2019, 2, 26–46. [Google Scholar] [CrossRef] [Green Version]
  37. Wright, C.; Skvortsov, E.; Kreuter, B.; Wang, Y. Privacy-Preserving Secure Cardinality and Frequency Estimation; Google LLC: Mountain View, CA, USA, 2020; pp. 1–20. [Google Scholar]
  38. Andreescu, T.; Feng, Z. Inclusion-exclusion principle. In A path to Combinatorics for Undergraduates; Birkhäuser: Boston, MA, USA, 2004. [Google Scholar]
  39. Baker, D.N.; Langmead, B. Dashing: Fast and accurate genomic distances with HyperLogLog. Genome Biol. 2019, 20, 1–12. [Google Scholar] [CrossRef] [PubMed] [Green Version]
  40. Gómez-Barrón, J.P.; Manso-Callejo, M.Á.; Alcarria, R.; Iturrioz, T. Volunteered geographic information system design: Project and participation guidelines. ISPRS Int. J. Geo-Inf. 2016, 5, 108. [Google Scholar] [CrossRef] [Green Version]
  41. Mannix, E.A.; Neale, M.A.; Northcraft, G.B. Equity, Equality, or Need? The Effects of Organizational Culture on the Allocation of Benefits and Burdens. Organ. Behav. Hum. Decis. Process. 1995, 63, 276. [Google Scholar] [CrossRef]
  42. Doan, A.; Ramakrishnan, R.; Halevy, A.Y. Crowdsourcing systems on the World-Wide Web. Commun. ACM 2011, 54, 86. [Google Scholar] [CrossRef]
  43. Chen, Y.; Parkins, J.R.; Sherren, K. Using geo-tagged Instagram posts to reveal landscape values around current and proposed hydroelectric dams and their reservoirs. Landsc. Urban Plan. 2017, 170. [Google Scholar] [CrossRef]
  44. Kennedy, L.; Naaman, M. Generating diverse and representative image search results for landmarks. In Proceedings of the 17th International Conference on World Wide Web, WWW’08, Beijing, China, 21–25 April 2008; ACM: New York, NY, USA, 2008; pp. 297–306. [Google Scholar]
  45. Wood, S.A.; Guerry, A.D.; Silver, J.M.; Lacayo, M. Using social media to quantify nature-based tourism and recreation. Sci. Rep. 2013, 3. [Google Scholar] [CrossRef] [PubMed]
  46. Heikinheimo, V.; Minin EDi Tenkanen, H.; Hausmann, A.; Erkkonen, J.; Toivonen, T. User-Generated Geographic Information for Visitor Monitoring in a National Park: A Comparison of Social Media Data and Visitor Survey. ISPRS Int. J. Geo-Inf. 2017, 6, 85. [Google Scholar] [CrossRef] [Green Version]
  47. Kim, Y.; Kim, C.; Lee, D.K.; Lee, H.; Andrada, R.I.T. Quantifying nature-based tourism in protected areas in developing countries by using social big data. Tour. Manag. 2019, 72, 249–256. [Google Scholar] [CrossRef]
  48. Fisher, D.M.; Wood, S.A.; White, E.M.; Blahna, D.J.; Lange, S.; Weinberg, A.; Lia, E. Recreational use in dispersed public lands measured using social media data and on-site counts. J. Environ. Manag. 2018, 222, 465–474. [Google Scholar] [CrossRef] [PubMed]
  49. Schaffer, M.; Schartner, P.; Rass, S. Universally unique identifiers: How to ensure uniqueness while protecting the issuer’s privacy. In Proceedings of the 2007 International Conference on Security and Management, SAM’07, Las Vegas, NV, USA, 25–28 June 2007; pp. 198–204. [Google Scholar]
  50. Shi, X.; Yu, Z.; Fang, Q.; Zhou, Q. A Visual Analysis Approach for Inferring Personal Job and Housing Locations Based on Public Bicycle Data. ISPRS Int. J. Geo-Inf. 2017, 6, 205. [Google Scholar] [CrossRef] [Green Version]
  51. Thomee, B.; Shamma, D.A.; Friedland, G.; Elizalde, B.; Ni, K.; Poland, D.; Borth, D.; Li, L. YFCC100M: The New Data in Multimedia Research. Commun. ACM 2016, 59, 64–73. [Google Scholar] [CrossRef]
  52. Dunkel, A.; Löchner, M.; Burghardt, D. Supplementary Materials (release v0.1.0) for Privacy-aware visualization of volunteered geographic information (VGI) to analyze spatial activity: A benchmark implementation. Data Repos. 2020. [Google Scholar] [CrossRef]
  53. Priya, V.; Ilavarasi, A.K.; Bhama, S. A Privacy Preserving Data Mining Approach for Handling Data with Outliers. Adv. Nat. Appl. Sci. 2017, 11, 585–591. [Google Scholar]
  54. Zhou, B.; Pei, J. The k-anonymity and l-diversity approaches for privacy preservation in social networks against neighborhood attacks. Knowl. Inf. Syst. 2011, 28, 47–77. [Google Scholar] [CrossRef]
  55. Gruteser, M.; Grunwald, D. Anonymous Usage of Location-Based Services Through Spatial and Temporal Cloaking. In Proceedings of the First International Conference on Mobile Systems, Applications, and Services (MobiSys), San Francisco, CA, USA, 5–8 May 2003. [Google Scholar]
  56. Wang, H.; Liu, R. Hiding outliers into crowd: Privacy-preserving data publishing with outliers. Data Knowl. Eng. 2015, 100, 94–115. [Google Scholar] [CrossRef]
  57. Ruppel, P.; Küpper, A. Geocookie: A space-efficient representation of geographic location sets. J. Inf. Process. 2014, 22, 418–424. [Google Scholar] [CrossRef] [Green Version]
  58. Jiang, B. Head/Tail Breaks: A New Classification Scheme for Data with a Heavy-Tailed Distribution. Prof. Geogr. 2013, 65, 482–494. [Google Scholar] [CrossRef]
  59. Ertl, O. Method and System to Estimate the Cardinality of Sets and Set Operation Results from Single and Multiple HyperLogLog Sketches. U.S. Patent Application No. 15/950,632, 11 April 2018. [Google Scholar]
  60. De Andrade, S.C.; Restrepo-Estrada, C.; Nunes, L.H.; Rodriguez, C.A.M.; Estrella, J.C.; Delbem, A.C.B.; Porto de Albuquerque, J. A multicriteria optimization framework for the definition of the spatial granularity of urban social media analytics. Int. J. Geogr. Inf. Sci. 2020, 1–20. [Google Scholar] [CrossRef]
  61. Shelton, T.; Poorthuis, A.; Zook, M. Social media and the city: Rethinking urban socio-spatial inequality using user-generated geographic information. Landsc. Urban Plan. 2015, 142, 198–211. [Google Scholar] [CrossRef]
  62. Øian, H.; Fredman, P.; Sandell, K.; Sæþórsdóttir, A.D.; Tyrväinen, L.; Jensen, F.S. Tourism, nature and sustainability: A review of policy instruments in the Nordic countries; Nordic Council of Ministers: Copenhagen, Denmark, 2018. [Google Scholar] [CrossRef]
  63. Di Zio, S.; Castillo Rosas, J.D.; Lamelza, L. Real Time Spatial Delphi: Fast convergence of experts’ opinions on the territory. Technol. Forecast. Soc. Change 2017, 115, 143–154. [Google Scholar] [CrossRef]
  64. Reviriego, P.; Ting, D. Security of HyperLogLog (HLL) Cardinality Estimation: Vulnerabilities and Protection. IEEE Commun. Lett. 2020, 1. [Google Scholar] [CrossRef] [Green Version]
Figure 1. Illustration of the system model and the two cases of possible adversaries discussed in this work.
Ijgi 09 00607 g001
Figure 2. Transformation steps applied to a single character string, such as a user ID, for generating a HyperLogLog (HLL) set, and the final estimation of cardinality (Example values were generated with real data, but different values may be produced based on various parameter settings).
Ijgi 09 00607 g002
Figure 3. Percentage of global spatial outlier volume (k = 1) in the Yahoo Flickr Creative Commons 100 Million (YFCC100M) dataset, for decreasing precision levels (GeoHash) and different metrics used in this paper (to reproduce this graphic, see Supplementary Materials, S5).
Ijgi 09 00607 g003
Figure 4. Comparison of automatic classification of raw and HLL user days for Europe (100 km grid).
Ijgi 09 00607 g004
Figure 5. Screenshot of map for user counts per 100 km grid bin, allowing interactive comparison of estimated values (HLL) and exact counts (raw) (see Figure A1 for a static, worldwide view of the map, and Supplementary Materials S8 for the interactive version).
Ijgi 09 00607 g005
Figure 6. Estimated post count with a reduced grid size of 50 km for Europe.
Ijgi 09 00607 g006
Figure 7. Analyzing spatial relationships with HLL intersection, based on incremental union of user sets from benchmark data (100 km-grid) for France, Germany and the United Kingdom (left). The Venn Diagram (right) shows estimation of common user counts for different groups, and the percentage of error compared to raw data. The same graphic, generated for 50 km grid size, is available in Figure A2.
Ijgi 09 00607 g007
Figure 8. Alex case study, evaluation of scenario “Sandy”.
Ijgi 09 00607 g008
Figure 9. Alex case study, evaluation of scenario “Robert”.
Ijgi 09 00607 g009
Table 1. Total counts for different metrics based on raw and HLL data with default parameters (to reproduce these numbers, see Supplementary Materials, S5).
MetricExact (Raw)Estimated (HLL)
Coordinate count12,764,26812,756,691
User count581,099589,475
Post count100,000,00098,553,392
User days17,662,78017,678,373
Table 2. Performance benchmark results for raw and HLL data processing (100 km grid).
ContextRaw DataHLL Data
Input data size of comma-separated values (CSV)2.5 GBExplicit: 281 MB
Sparse: 134 MB
Full: 3.3 GB
Output data size, 100 km grid (CSV)182.46 MB19.80 MB
Processing time (Worldmap)Post count: 7 min 13 s
User count: 8 min 55 s
User days: 12 min 8 s
54.1 s (Post count, user count, user days)
Memory peak (Worldmap)Post count: 15.4 GB
User count: 15.5 GB
User days: 19.3 GB
1.4 GB (Post count, user count, user days)
Benchmark data size (CSV)/10.61 MB (bins with user count ≥ 100)
Publisher’s Note: MDPI stays neutral with regard to jurisdictional claims in published maps and institutional affiliations.

