Articulated Trajectory Mapping for Reviewing Walking Tours

Graduate School of Engineering Science, Akita University, Akita 010-8502, Japan
*
Author to whom correspondence should be addressed.
ISPRS Int. J. Geo-Inf. 2020, 9(10), 610; https://0-doi-org.brum.beds.ac.uk/10.3390/ijgi9100610
Submission received: 8 August 2020
/
Revised: 3 October 2020
/
Accepted: 19 October 2020
/
Published: 21 October 2020
(This article belongs to the Special Issue Recent Trends in Location Based Services and Science)
Abstract
:This paper addresses how to enrich a map-based representation for reviewing walking tours with the features of trajectory mapping and tracing animation. Generally, a trajectory generated by raw GPS data can often be difficult to browse through on a map. To resolve this issue, we first illustrated tangled trajectory lines, inaccurate indoor positioning, and unstable trajectory lines as problems encountered when mapping raw trajectory data. Then, we proposed a new framework that focuses on GPS horizontal accuracy to locate indoor location points and find stopping points on an accelerometer. We also applied a conventional line simplification algorithm to make the trajectory cleaner and then integrated the extracted points with the clean trajectory line. Furthermore, our experiments with some actual logs of walking tours demonstrated that articulated trajectory mapping, which comprises simplification and characterization methods, sufficiently reliable and effective for better reviewing experiences. The paper contributes to the research on cleaning up map-based displays and tracing animations of raw trajectory GPS data by using not only location data but also sensor data that smartphones can collect.
1. Introduction
In recent years, walking tours have attracted many people, including tourists as well as residents. A walking tour is a tourist activity that involves a free walk around a city with a guide’s instructions or a tourist map. According to a report by the World Tourism Organization (2019) [1], various countries have been promoting their historical and natural sites as points of interest (POIs) and suggested routes on walking tours offered through guidebooks and other publications. This has become popular due to the expectation that such tours are not only economically beneficial but also provide opportunities for hands-on learning and preservation of culture.
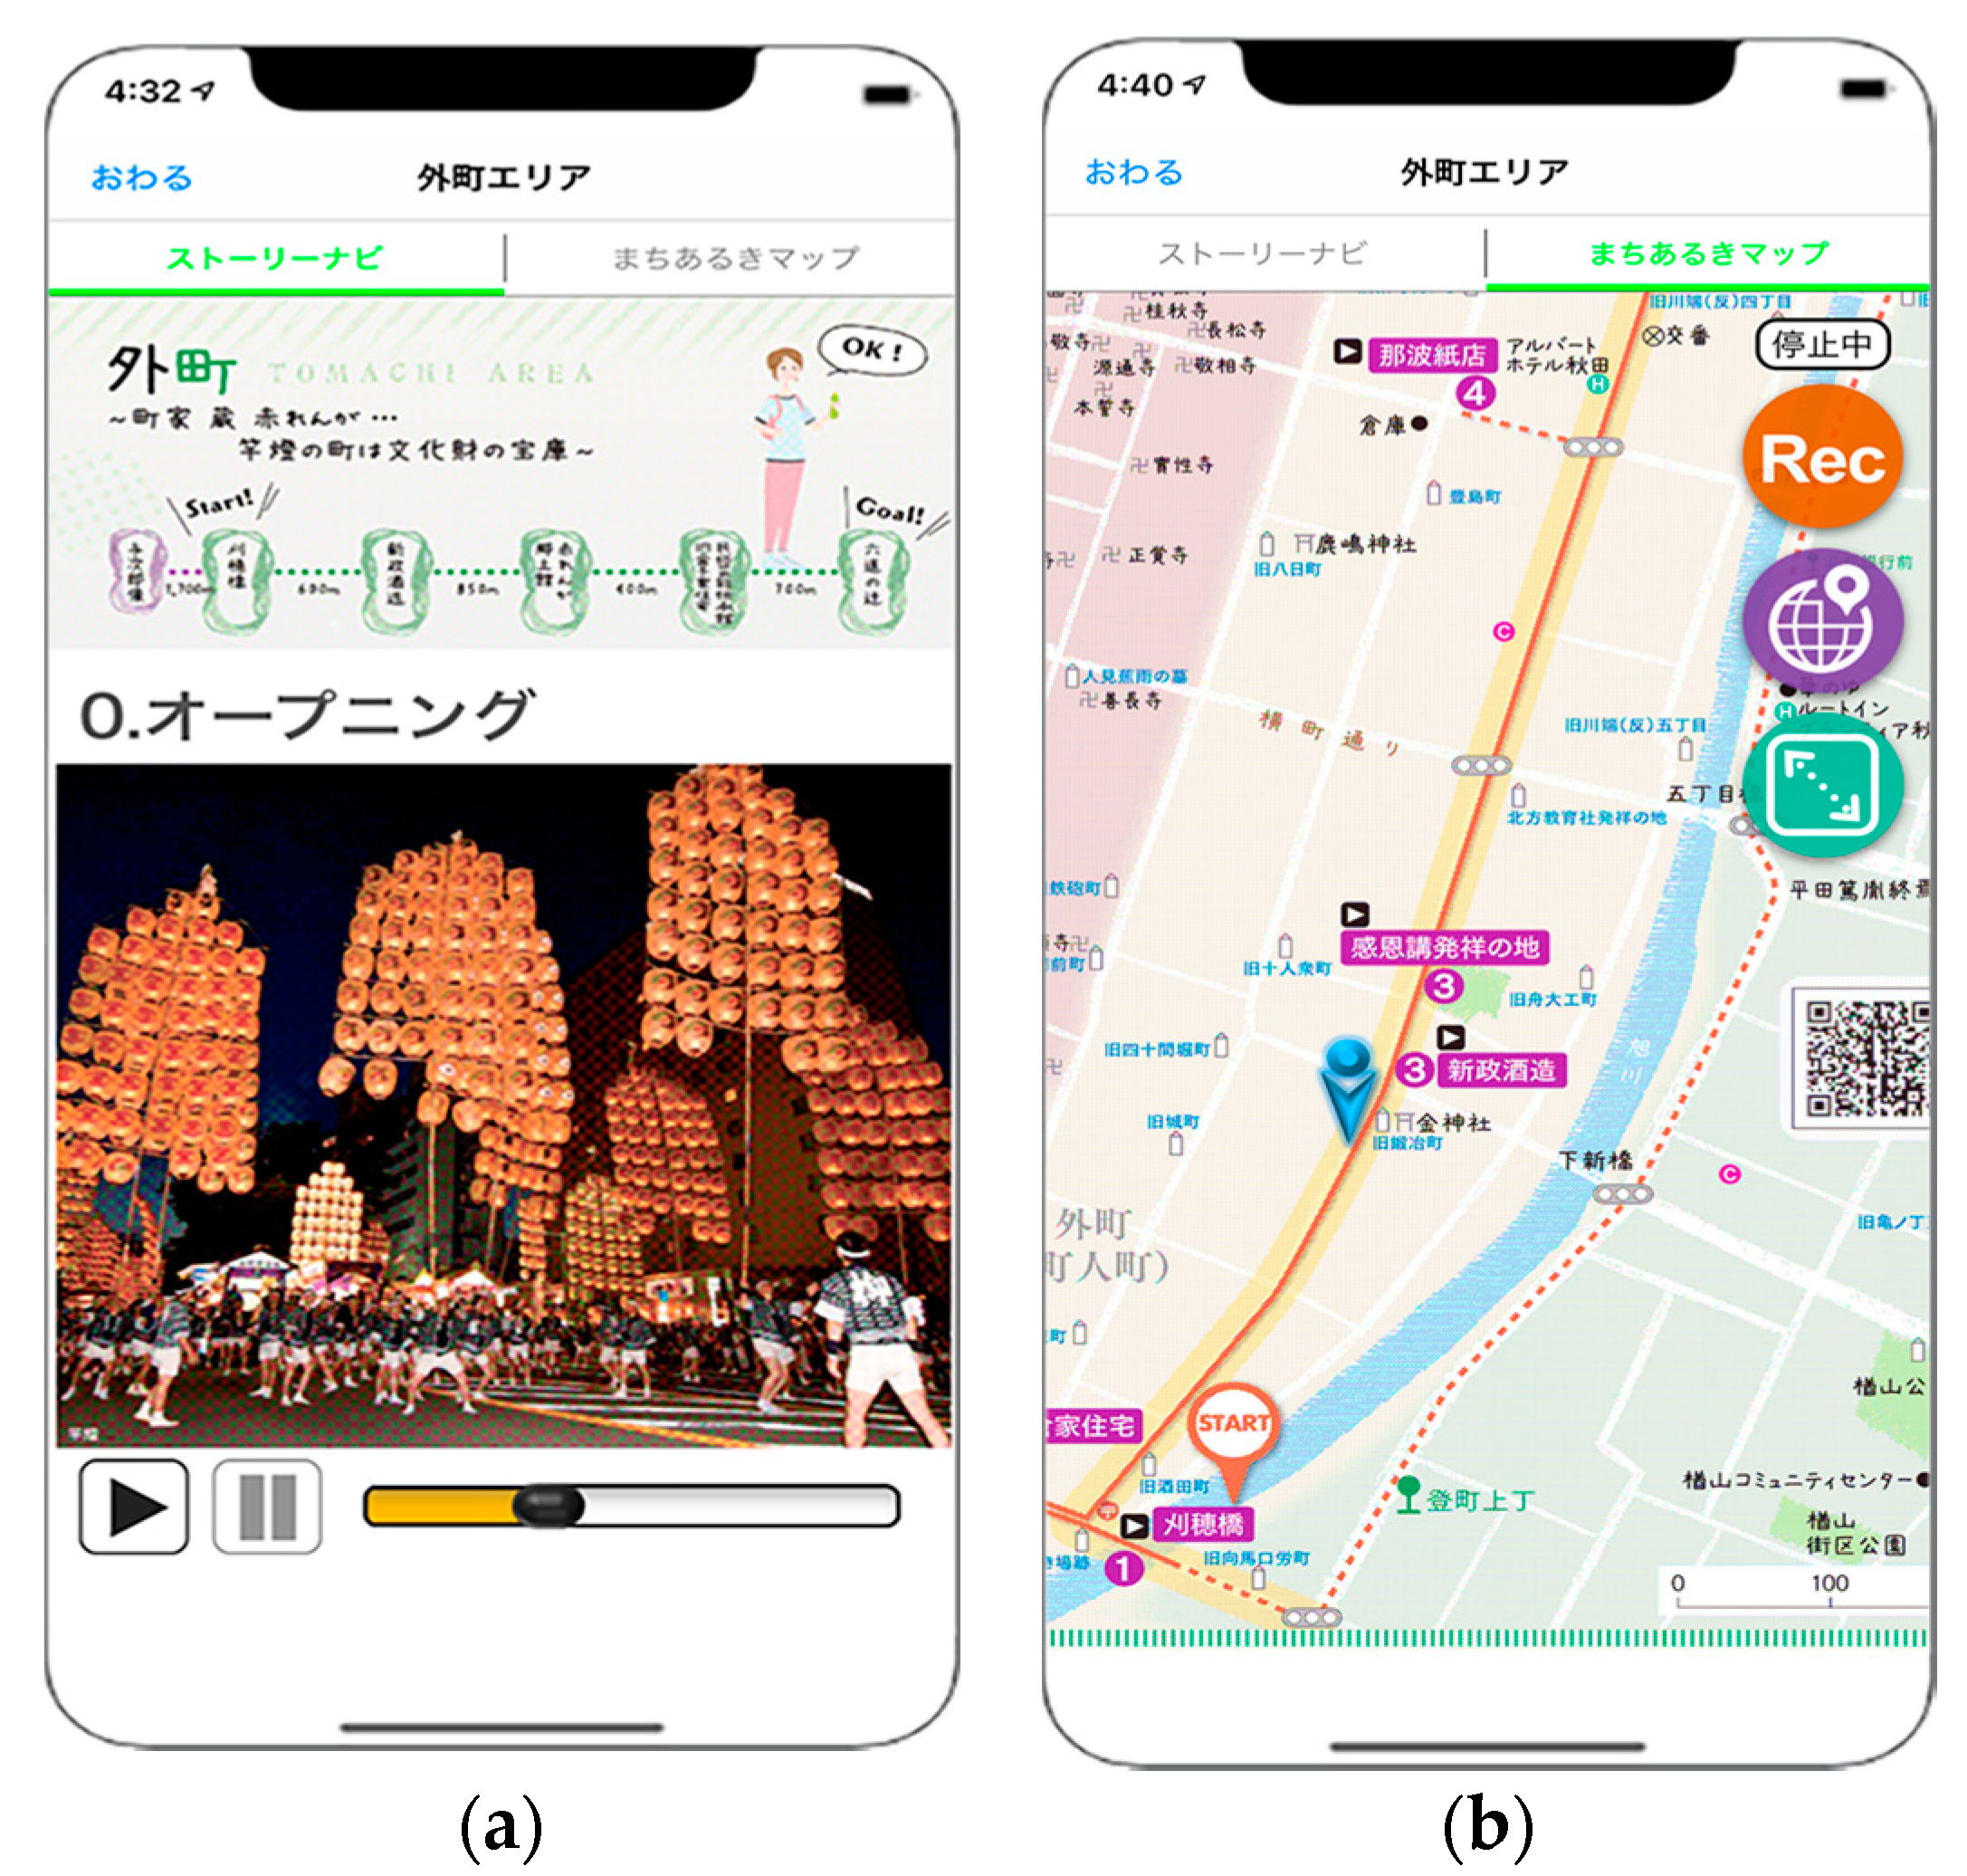
Location-based services (LBSs) have made a huge contribution to the field of tourism so far. Benyon et al. have pointed to the importance of intensifying tourists’ experiences through technology before, during, and after their tours in the era of digital tourism [2]. Within this context, the major theme of our research is the provision of support for the educational and cultural experiences of walking tours. At the present time, we are developing a mobile application for walking tours with a local government and discussing how these activities can be enhanced in terms of two aspects, namely the walking tour itself and the post-tour activities. Figure 1 shows two techniques for enhancing the former: (a) users can use geofencing to find guide content automatically displayed based on their current locations [3], and (b) users can discover where they are on illustrated maps by using geo-referencing [4]. In contrast, the framework for enhancing post-tour activities initially provides map-based representations of walkers’ trajectories that have been recorded by GPS-enabled devices during tours. Users can then review and share what they have experienced in their tours by tracing animations that clearly show which direction they are walking in and the order of their experiences.
In this paper, we will focus on the post-tour activities against the above backdrop. There are many applications that record GPS data to display users’ trajectories on maps. However, in general, many of those map-based displays of raw trajectory data have often encountered a fatal issue: visual complexity. Because of GPS errors and walkers’ redundant motions, a complicated trajectory is sometimes drawn on a map, and this often misleads and confuses users. Furthermore, in the animated presentation, raw trajectory data can cause redundant playback, which may be stressful for users. Therefore, the aim of this paper was to propose an articulated trajectory mapping approach, i.e., a method that makes map-based reviewing easier for tourists and learners to comprehend and navigate, thereby making them more comfortable with the technology in the process.
In Section 2, we illustrate the problems encountered when browsing through raw trajectory data on a map and propose a conceptual approach to resolving them. Then, in Section 3, we make the practical contribution of the paper transparent through our proposal of an articulated trajectory mapping technique comprised of simplification and characterization. In Section 4, we evaluate the proposed framework through user experiments with our walking tour application and assess its reliability and usability. At the end of the paper, we discuss the limitations and prospects of articulated trajectory mapping in relation to some findings obtained from the experiments in Section 5.
2. Problems and Approaches
In order to present a new framework that can allow users to clearly review raw trajectory data, we explore some technical approaches to the visual complexity issue in related work in this section. We first reveal some problems with the map-based representation of raw trajectory data.
2.1. Problems of Raw Trajectory Data Based on Observations
Figure 2 shows an example display of a walking trajectory, , on a map without any data processing. is a spatio-temporal trajectory comprised of a set of data , where is a unique number (0, 1, 2, …), and are geographic coordinates, and is a Boolean value that indicates whether the user has created any content (e.g., textual notes, photos, and/or audio) at the given point. A time interval of 15.0 seconds was set. The absolute time values of each record in the trajectory data can be calculated from both the starting time (timestamp) of the data and the number of counting time intervals (id) in the set of data.
Based on our observations of the example in Figure 2, we can identify three problems that cause some difficulty when interpreting the walker’s recording.
- Problem A: Tangled Trajectory Line
When a walker stops for a while (e.g., waiting for traffic lights to change, drinking water, and so on) or moves around in a small area, a tangled line can emerge. Such parts cause redundant tracing animation and visual complexity for viewers.
- Problem B: Inaccurate Indoor Positioning
When a walker enters inside of a building (e.g., sightseeing facilities such as museums and aquariums), the errors of the GPS data generally become larger because of obstacles such as ceilings and walls (Problem B). This can cause user misunderstanding of the trajectory data. Additionally, it may take more than 30 minutes to look around inside the building. As a result, a significant amount of inaccurate and redundant trajectory data can be generated (Problem B + Problem A).
- Problem C: Unstable Trajectory Line
Trajectory lines are often drawn in unstable ways because of GPS errors and user motion. Such lines are redundant and frustrating for viewers.
2.2. Approaches of Articulated Trajectory Data in Related Work
In order to resolve the above problems and enrich the map-based trajectory presentation of walking tour experiences, we propose a conceptual approach in articulated trajectory mapping. This strategy comprises simplification and characterization. In other words, the approach emphasizes the meaningful parts of a trajectory, minimizes the meaningless parts, and then joins the two sets of parts together. In the field of spatial information, some of the existing literature has mentioned analogous concepts. For example, Spaccapietra et al. divided a trajectory into stops and moves semantically [5]. This provided a good way to recognize and segment important and unimportant locations based on specific criteria for understanding an object’s movement. Another application has been developed that extracts only important events and generates text-based timelines [6]. However, in this paper, it was decided that map-based presentation would be discussed, as it has the advantage that people can explicitly communicate their geographical information, e.g., how users got to the place, and where their experiences happened, in terms of walking tour reviews.
The first element of articulation within map-based presentation is simplification. To make complicated lines cleaner, many studies have focused on line simplification issues, especially in the fields of computer graphics and cartography. For instance, the Douglas–Peucker [7] and the Reumann–Witkam algorithms [8] reduce some reference points of an original trajectory line based on its geometry and distance tolerance. However, it is difficult for them to resolve Problems A and B. Indoor recording often has large errors, and this leads to the loss of correspondence with a base map. Map matching is also one of the most practical techniques for mapping unstable trajectory data onto road networks that were preset beforehand [9,10]. However, in terms of walking tours, we need to take more precise road networks into account because people move around a city more freely than a car does while driving. Additionally, some studies have tried to enable those who are not familiar with computer science and cartography to develop forms of map-based communication [4]. Therefore, our approach is an attempt to avoid presetting a large scale of spatial model data to be map-matched in order to guarantee its versatility.
The second element of articulation is characterization. Many related works have discussed methods that extract an object’s activities and valuable events for trajectory analysis, future prediction, and data compression [11,12]. In the field of trajectory data mining, trajectory clustering is one of the major solutions for identifying spots where users stay [10]. Along these lines, Quannan et al. [13] proposed an algorithm based on time and distance information for the detection of significant places. Other researchers [14,15] have proposed advanced algorithms taking speed and orientation information into account to extract semantic locations. However, these algorithms cannot solve the difference between Problem A and Problem B and might also regard them as a staying issue. Accordingly, we distinguish Problem A from Problem B with our approach because information such as waiting for traffic lights or retying a shoelace is less important in terms of a walker’s experiences. Still, there are some algorithms based on preset regions of interest (ROIs) that are effective at distinguishing the two problems. An example of an ROI-based algorithm is intersection-based stops and moves of trajectories (IB-SMoT), which can detect significant places if the duration of the trajectory’s intersecting ROI is longer than a certain time [16,17]. However, IB-SMoT is not perfect, as ROIs may get no intersections with trajectory data because of Problem B’s GPS data with possible large errors. Even if a walker stays inside of a building for a while, location points may sometimes be recorded outside of it. Therefore, it may be tough to resolve these issues with only spatio-temporal data. For detection of the user situation, some articles have reported that various sensors can be promising solutions [18,19]. Our method explored other spatial information, except for location data, to appropriately extract points of staying.
In terms of characterization, it is also crucial to visualize user-generated content (UGC), such as photos and personal notes. On walking tours, users often and naturally take photos and make personal notes along the way. Hence, those points are the core of users’ walking presentations, i.e., articulated trajectories. At the end of this section, we compiled a correspondence table between issues needing resolution and our conceptual approaches in Table 1.
3. Methodology: Articulated Trajectory Mapping
3.1. Overview
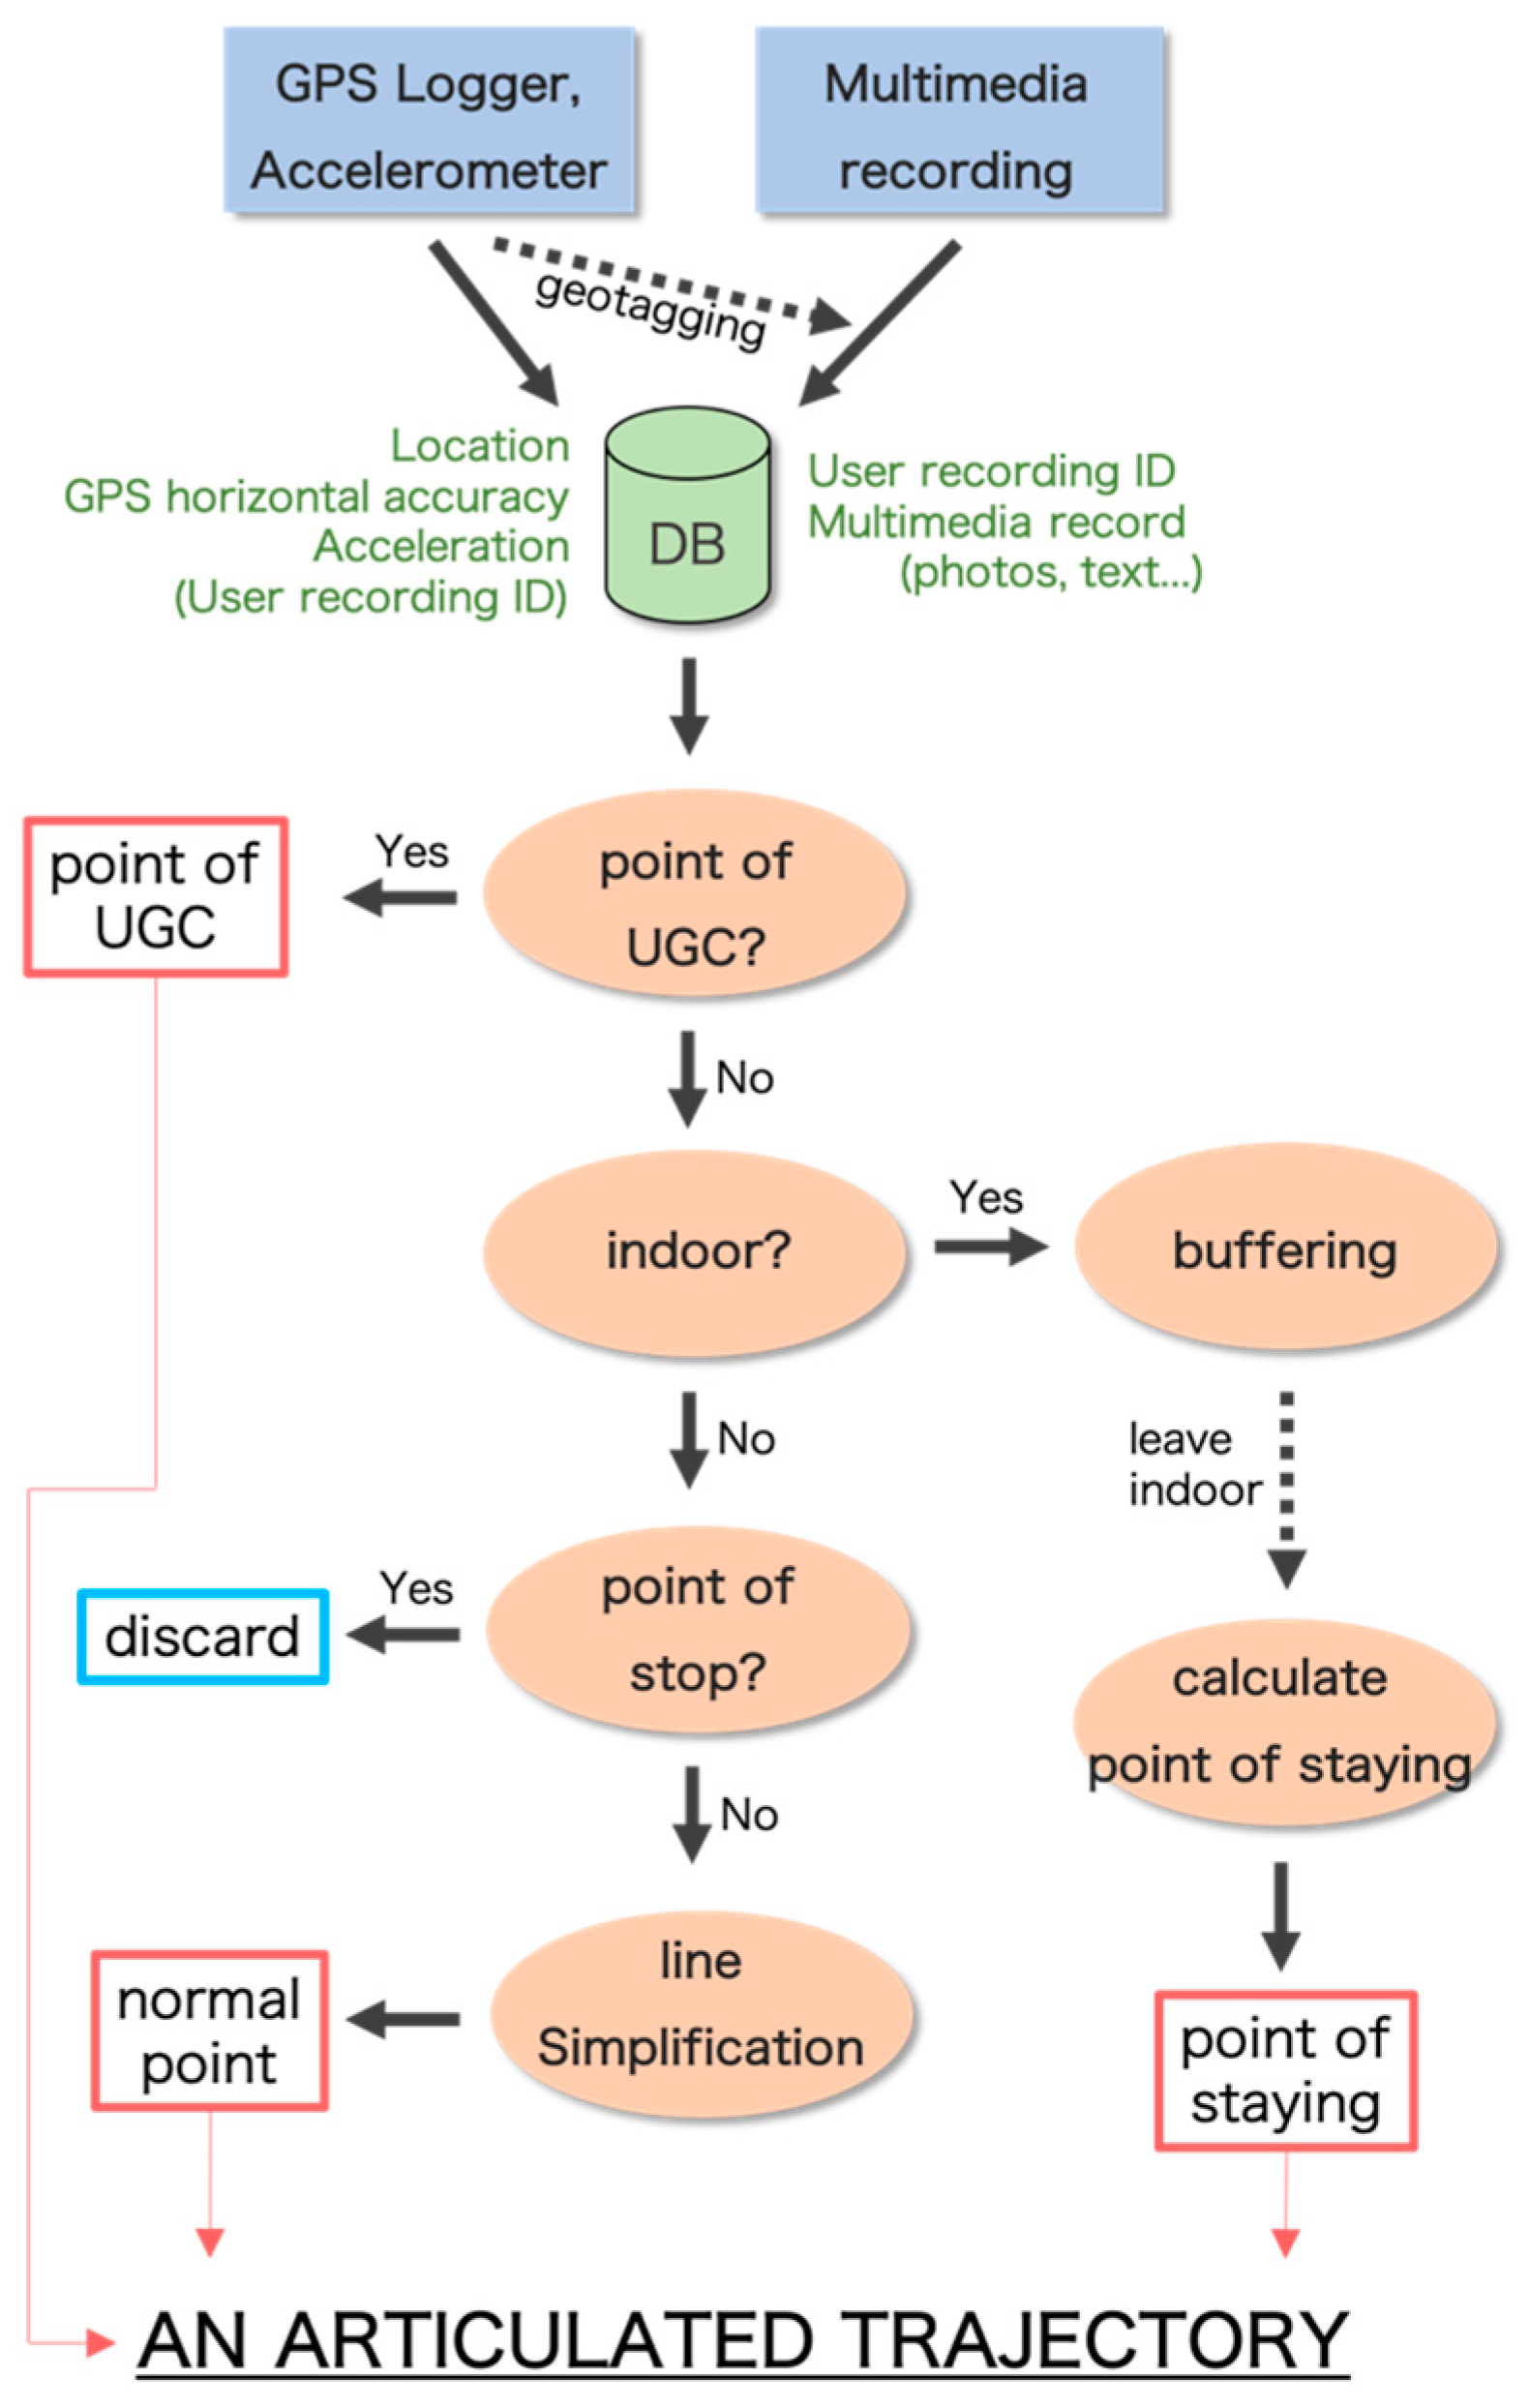
The aim of the proposed method was to facilitate map-based understanding of recording data. We achieved this by abstracting the redundant parts of a trajectory. Figure 3 shows the flow of the proposed system. While on a walking tour, the recording system collects spatial data, including positioning data such as latitude and longitude, GPS horizontal accuracy, and acceleration. At the same time, multimedia records (e.g., photos or text) with positioning data are created by a user. Afterwards, when users are reviewing the data, the proposed system generates an articulated trajectory by: (1) extracting points of UGC; (2) recognizing indoor and outdoor points with GPS horizontal accuracy data and calculating indoor location points (Section 3.2); (3) recognizing walking and stopping with acceleration data and eliminating points at which a user remained stationary (Section 3.3); (4) processing the Douglas–Peucker algorithm (Section 3.4); and (5) integrating the results. Additionally, the framework does not need any spatial model data in advance.
3.2. Indoor and Outdoor Recognitions
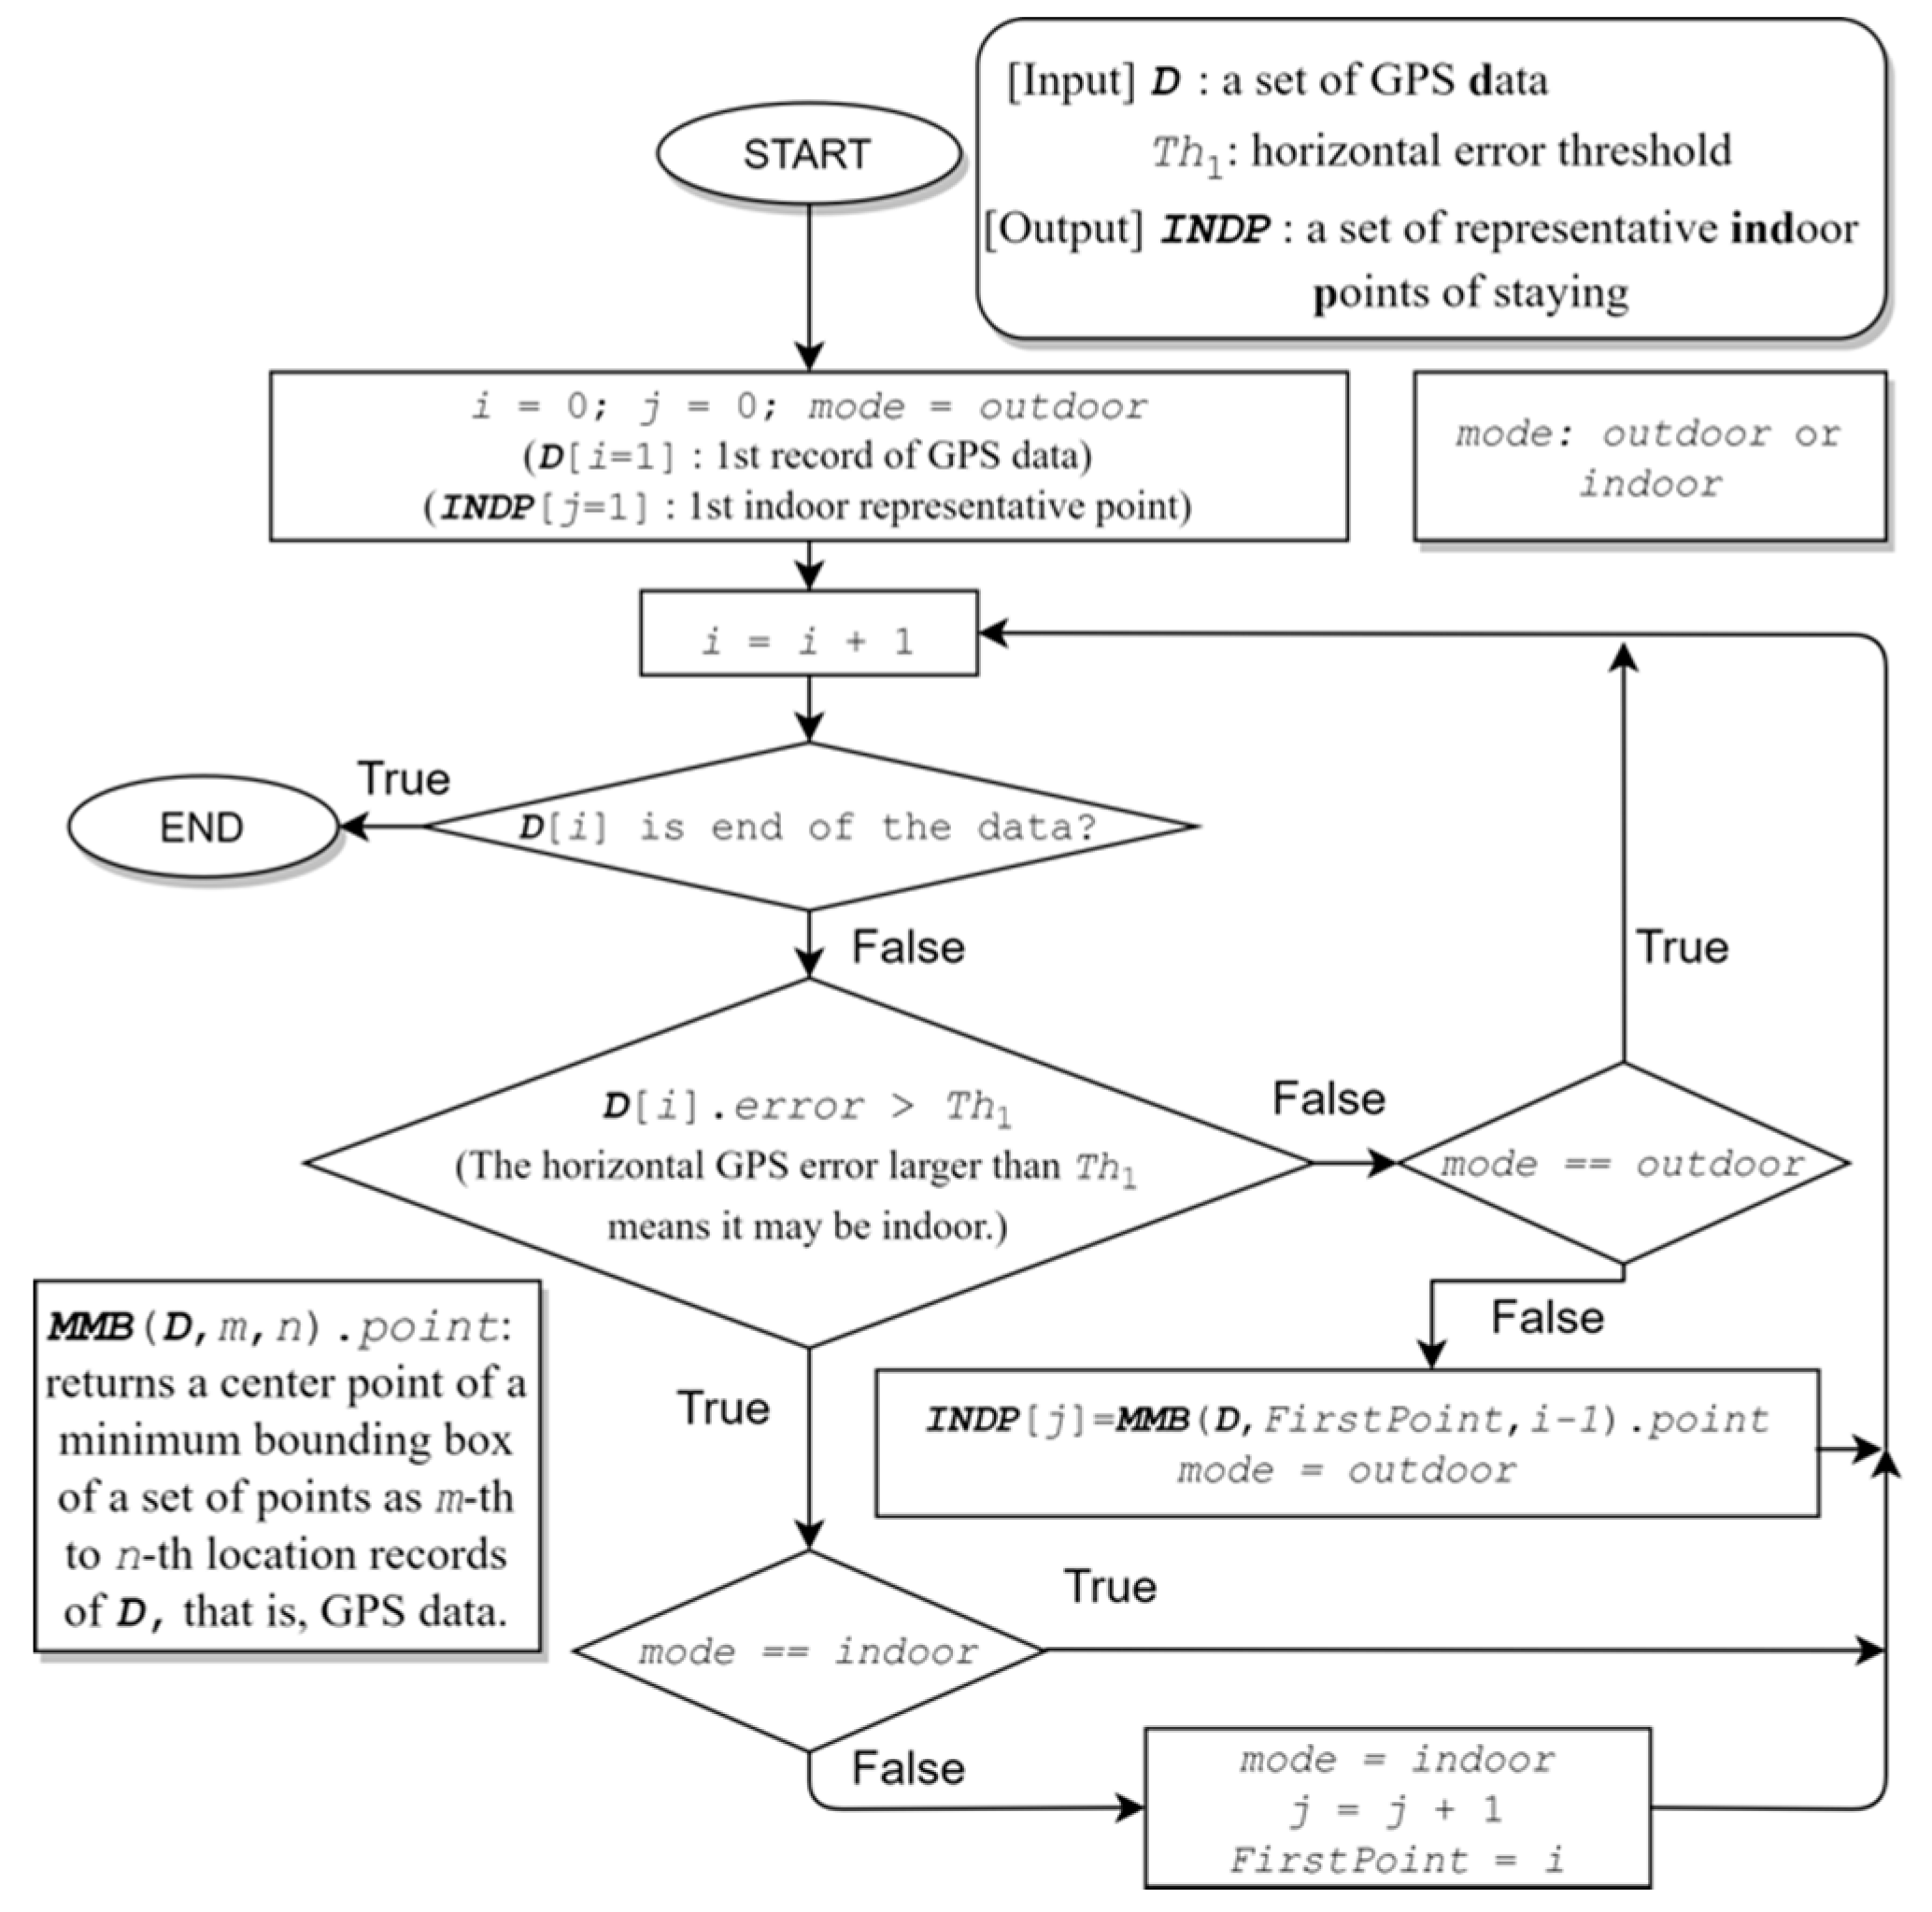
In recognizing indoor and outdoor motion, the proposed system uses GPS horizontal accuracy information calculated on a smartphone. Basically, GPS data are designed for use outdoors based on satellite systems. However, if one is indoors, the accuracy value decreases because of obstacles such as ceilings and walls. These characteristics of the accuracy value are used for the detection points of indoor locations in the proposed system.
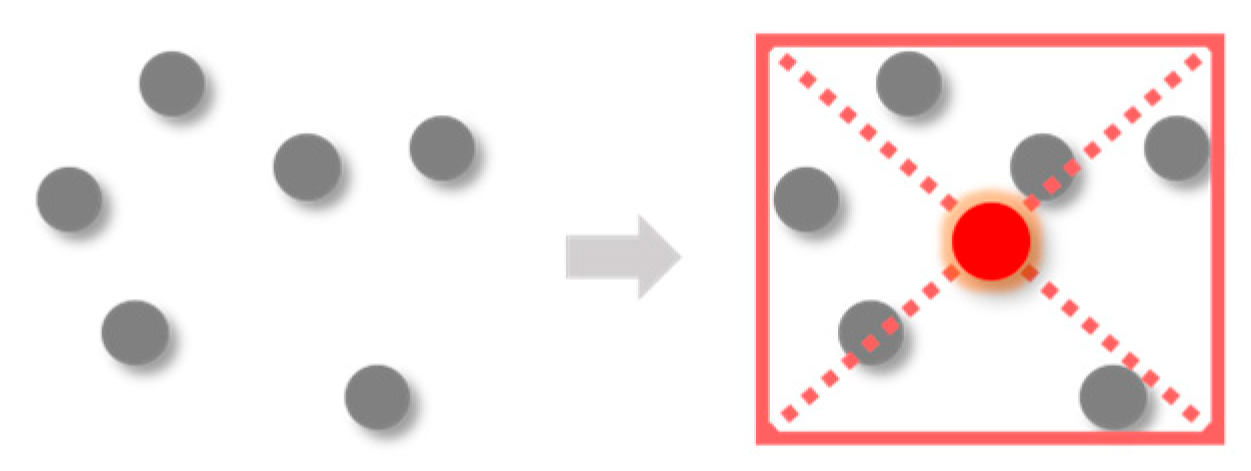
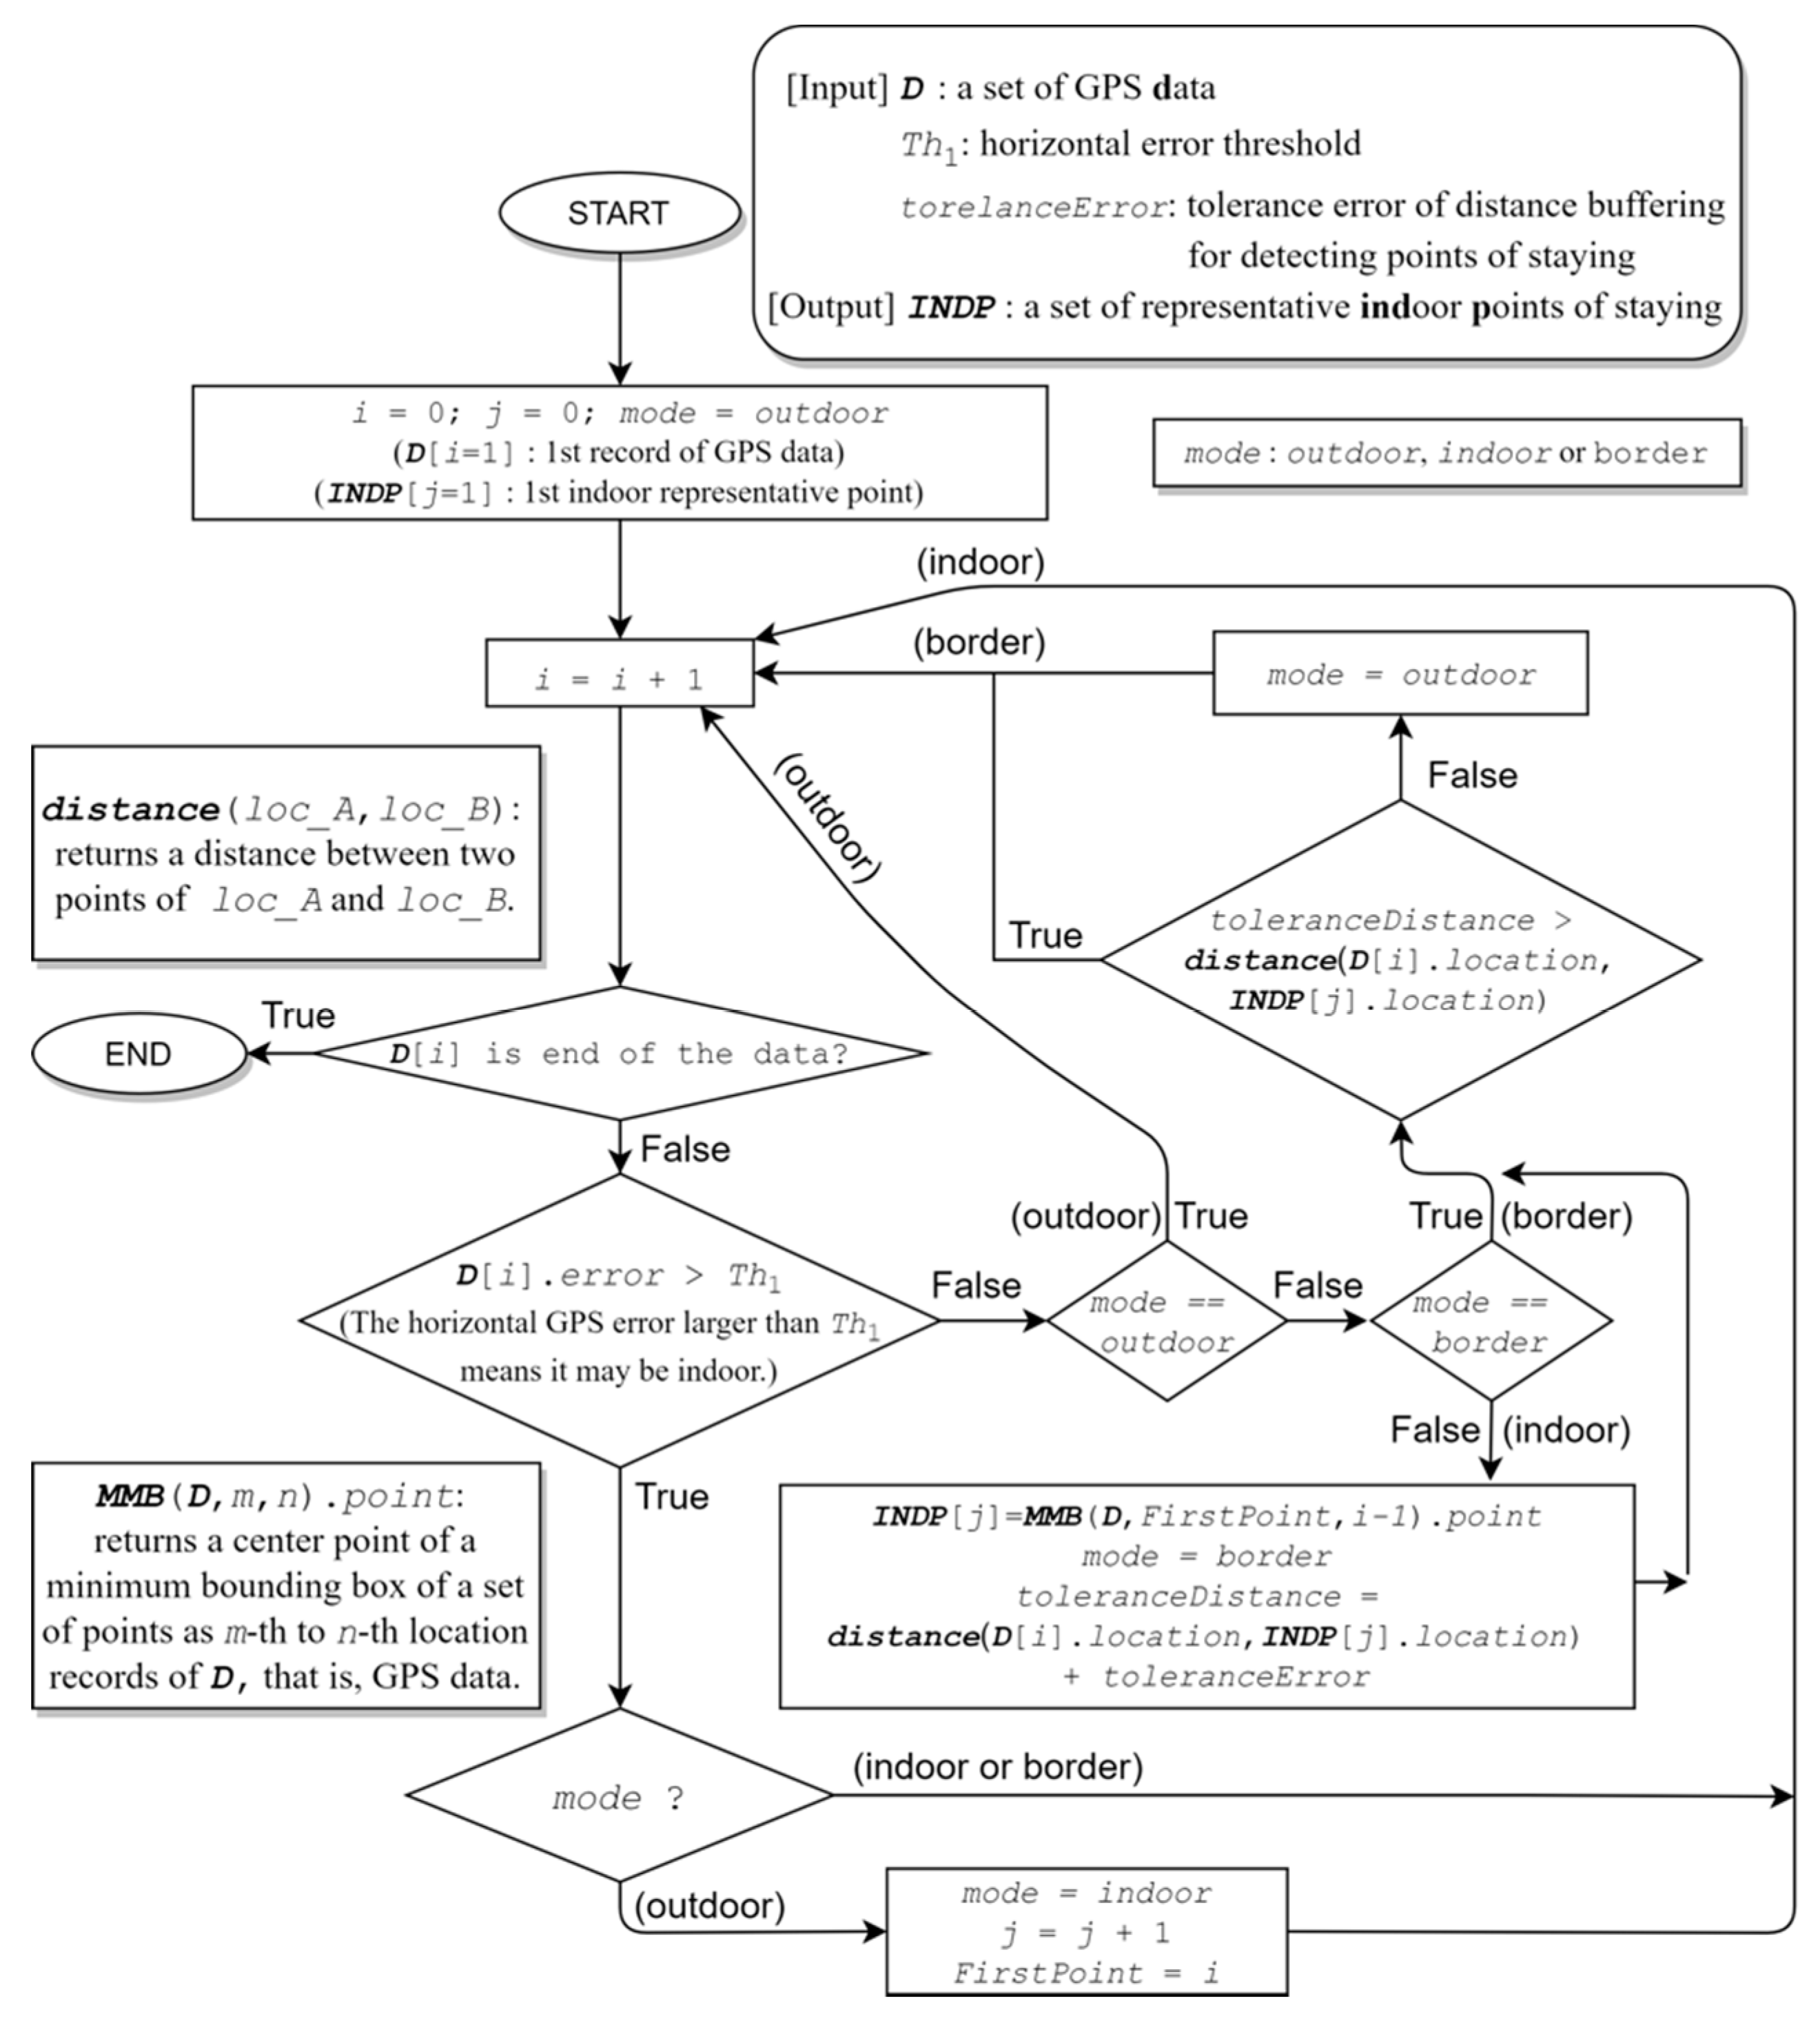
Figure 4 shows an algorithm for detecting indoor location points. Apple’s iPhone can determine “the radius of certainty for the location, measured in meters” [20] as a degree of GPS accuracy, so that each point of a trajectory is judged to be indoors or outdoors by a certain threshold. Generally, several points judged to be indoors are arranged continuously. Therefore, the proposed system could regard them as a set and abstract an indoor location point by calculating the center point of its minimum bounding box (Figure 5).
In some user experiments, it was found that the algorithm proposed above sometimes misjudged if a user was outdoors while the user was still indoors. Figure 6 shows the horizontal accuracy of the GPS data when a user was staying in a building for a certain duration at one time. The duration from the 10th point to the 58th point corresponds to the time when the user was staying in the building. This reveals a general rule that the horizontal error values are less than 10 meters when a user is outdoors, and more than 15 meters when the user is indoors. However, some exceptions arose at around the 49th point, as shown in Figure 6. At around that point, the horizontal accuracy of the indoor reading was good, and the same could be said of the outdoor reading. These exceptions might often occur when a user is situated near windows inside a building. The misjudgments regarding indoor locations might increase the number of staying points associated with the user’s interest, even if the user visits only one place. To solve the problem of misjudging indoor locations, we introduce the concept of tolerant distance buffering into the proposed method to make it more robust (Figure 7). Tolerant distance buffering can ignore accidental high values outside of the horizontal accuracy and keep the status of the user indoors while a user might be located near the outside. The exceptional handling of the holizontal accuracy for judging if the user is indoors is realized by the general rule that the user might be recognized as indoors if the distance between the center point of the indoor area and the current position of the user is almost the same as that of common cases of being indoors.
3.3. Walking and Stopping Recognitions
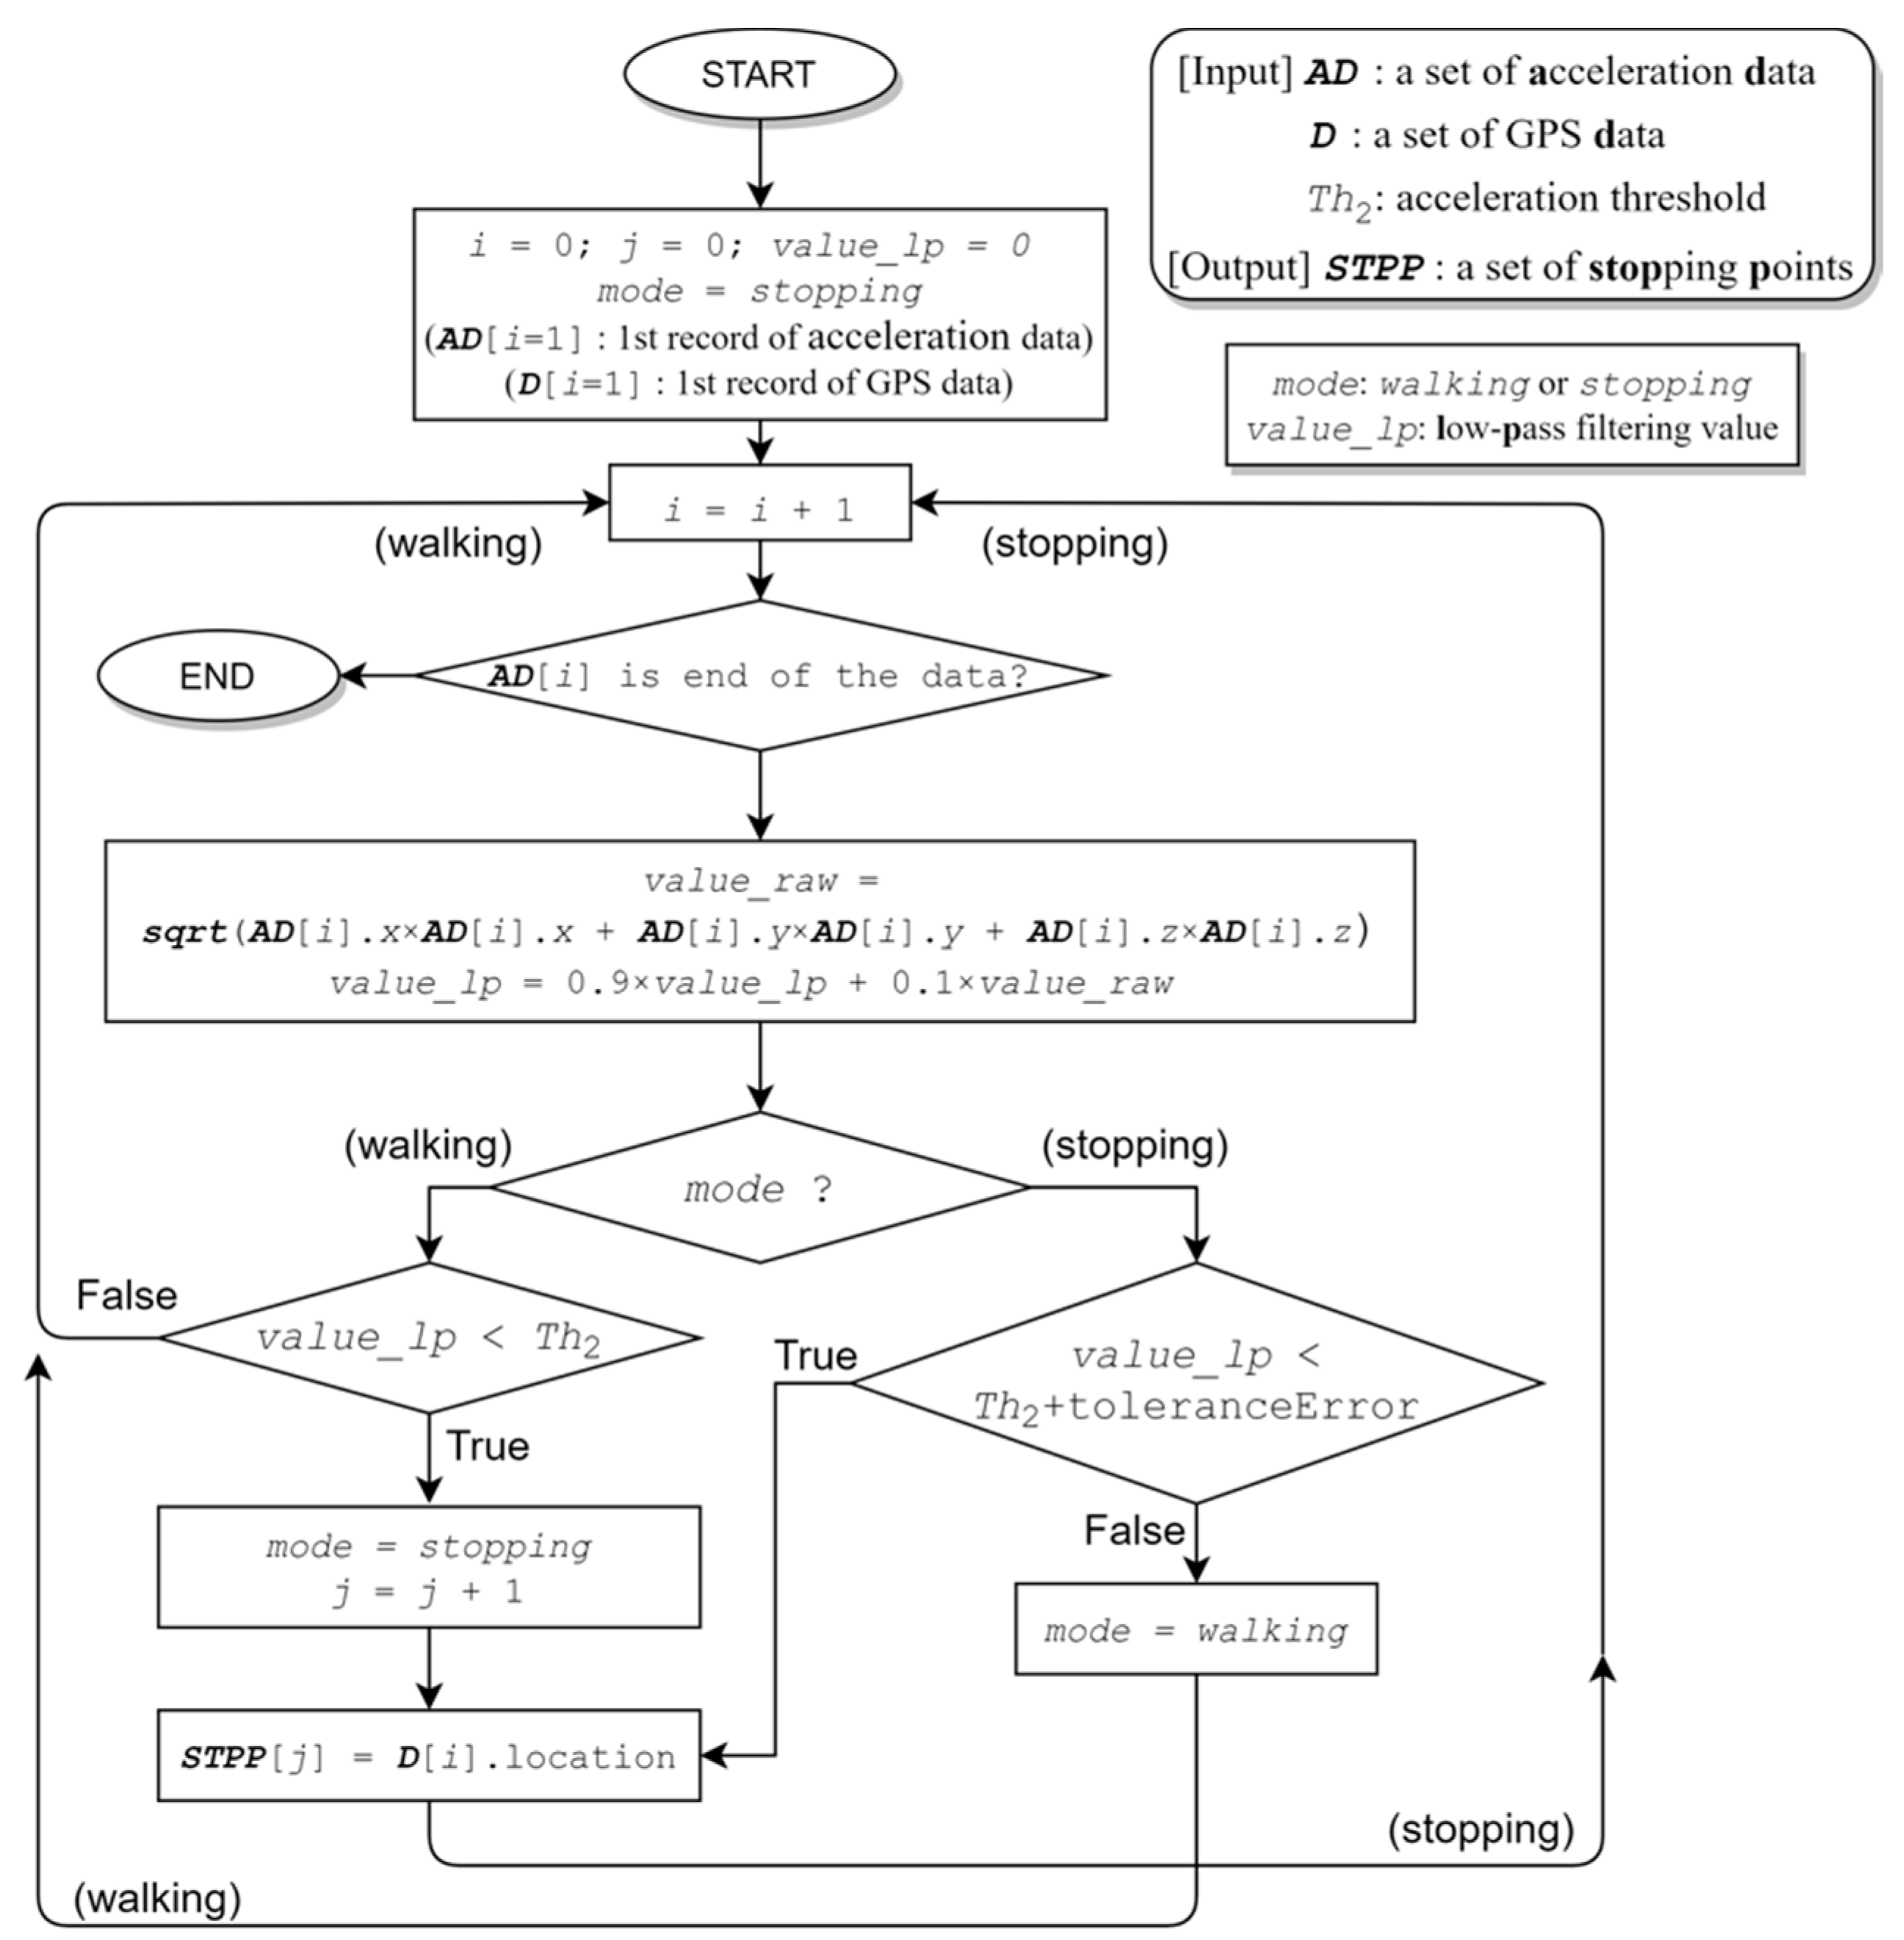
In recognizing the activity conditions of walking and stopping, the proposed system uses acceleration values that are available on smartphones [21]. Figure 8 shows an algorithm for detecting a user’s points of remaining stationary. Apple’s iPhone can provide three-axis acceleration values measured by the accelerometer sensor. Our proposed system uses the acceleration values and calculates a square root of the sum of the squares of the values for the detection. Further, since a raw acceleration value has a high noise level, we applied a low-pass filter to reduce the noise. The formula of the low-pass filter is as follows:
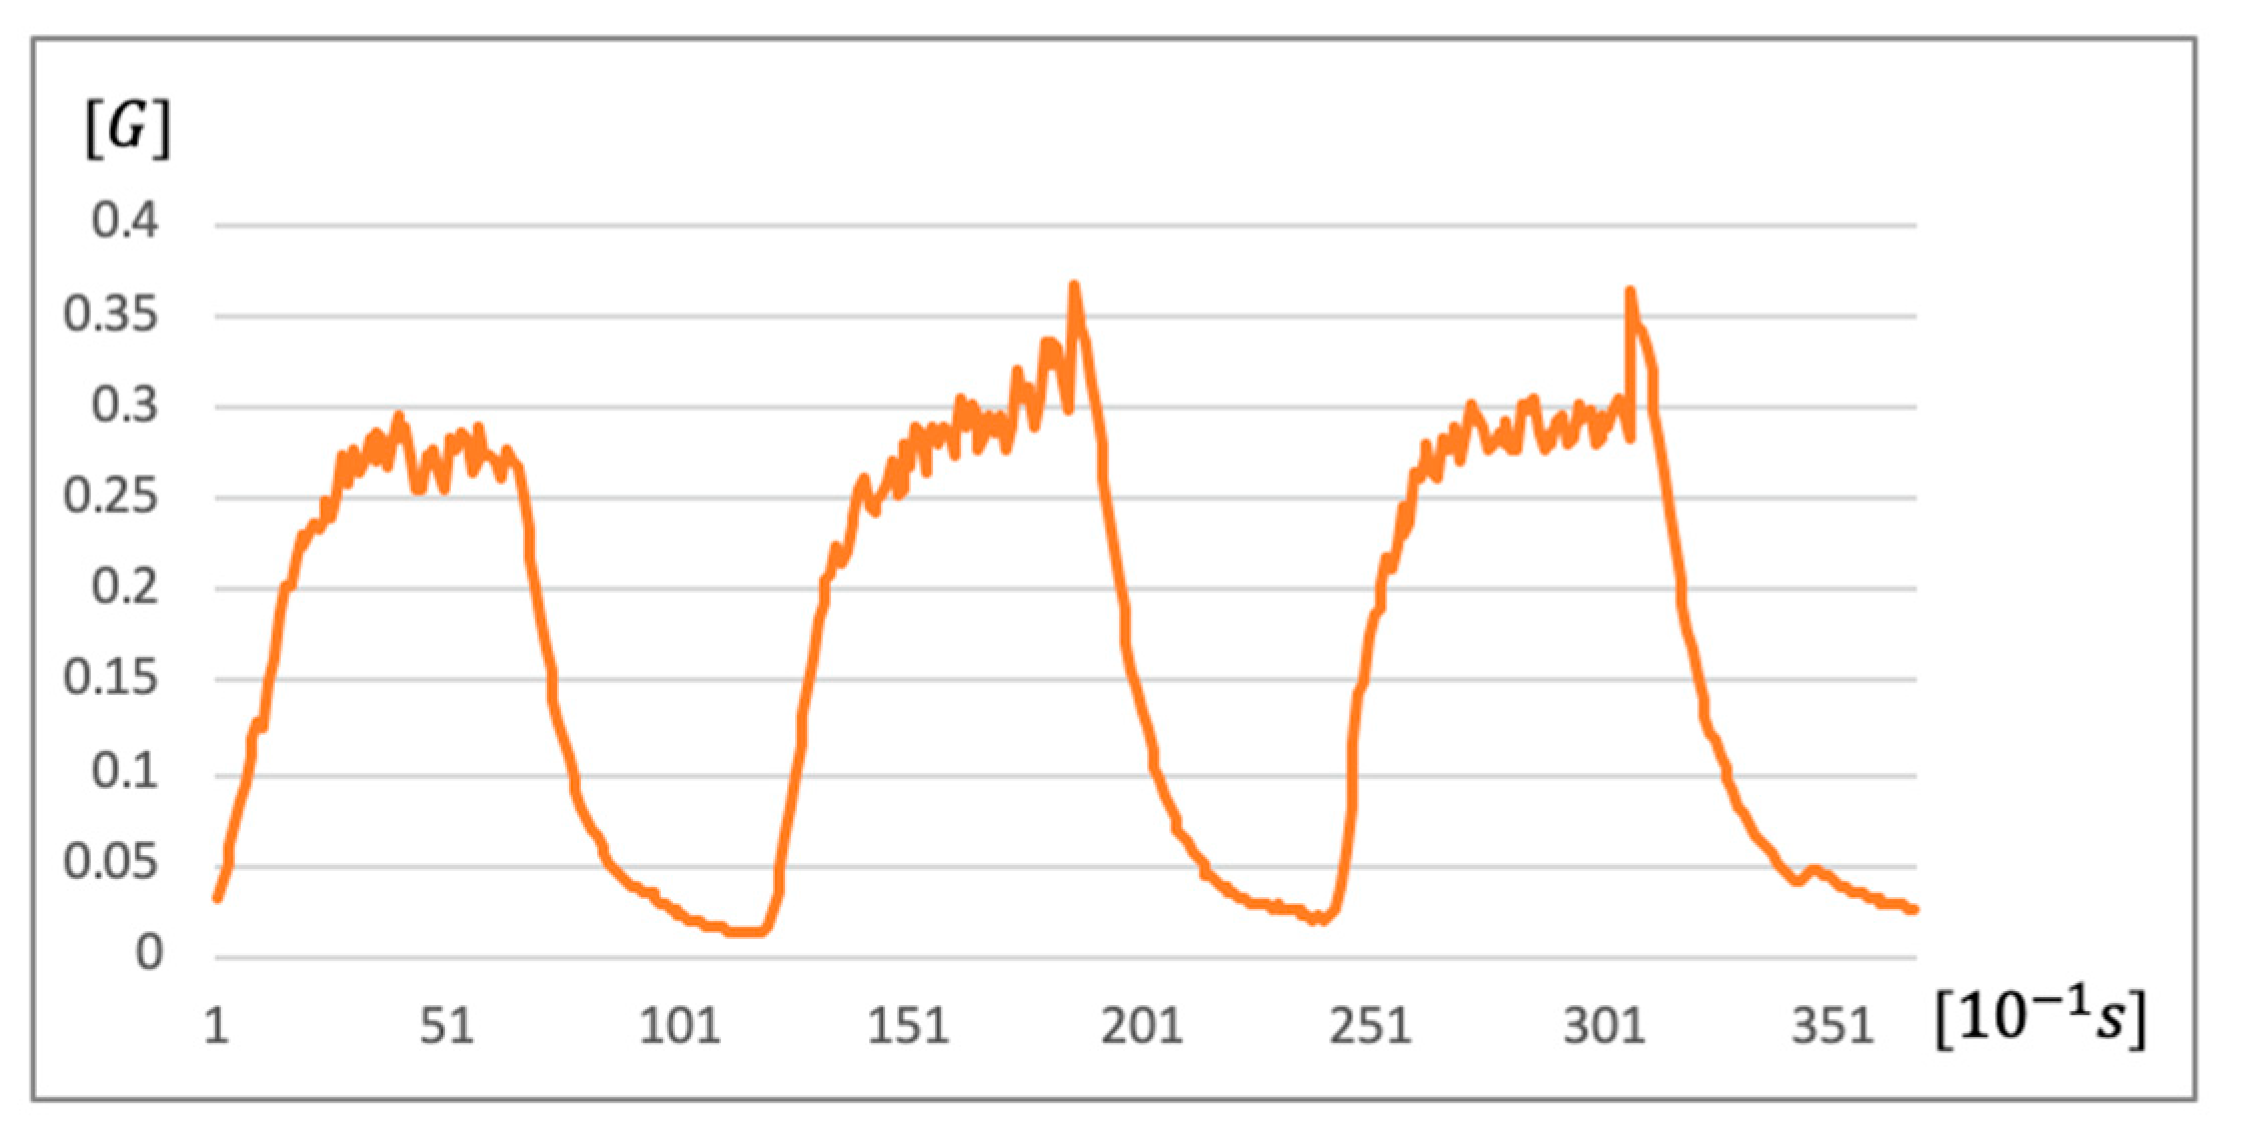
Figure 9 shows an example of changes in acceleration values with the introduction of a low-pass filter (). Generally, acceleration values increase while walking, so the algorithm can differentiate between walking and stopping by the threshold . Moreover, we took additional measures to mitigate two alternative situations. One was walking slowly, and another was momentarily moving. A momentary move often happens when a user lifts up a smartphone to take a photo. Regarding the former, a process that resets the threshold dynamically is effective in resolving this issue (Figure 9). To solve the latter problem, we looked for a walking point between stopping points and changed it into a stopping point after the algorithm was performed.
3.4. Line Simplification
As mentioned in Section 2, there are various effective algorithms for cleaning up complicated lines. In this paper, we applied the Douglas–Peucker algorithm [7] for non-special points then integrated the simplified line with extracted special points as a means of mapping an articulated trajectory. In this section, we introduce the line simplification algorithm used to finalize an articulated trajectory.
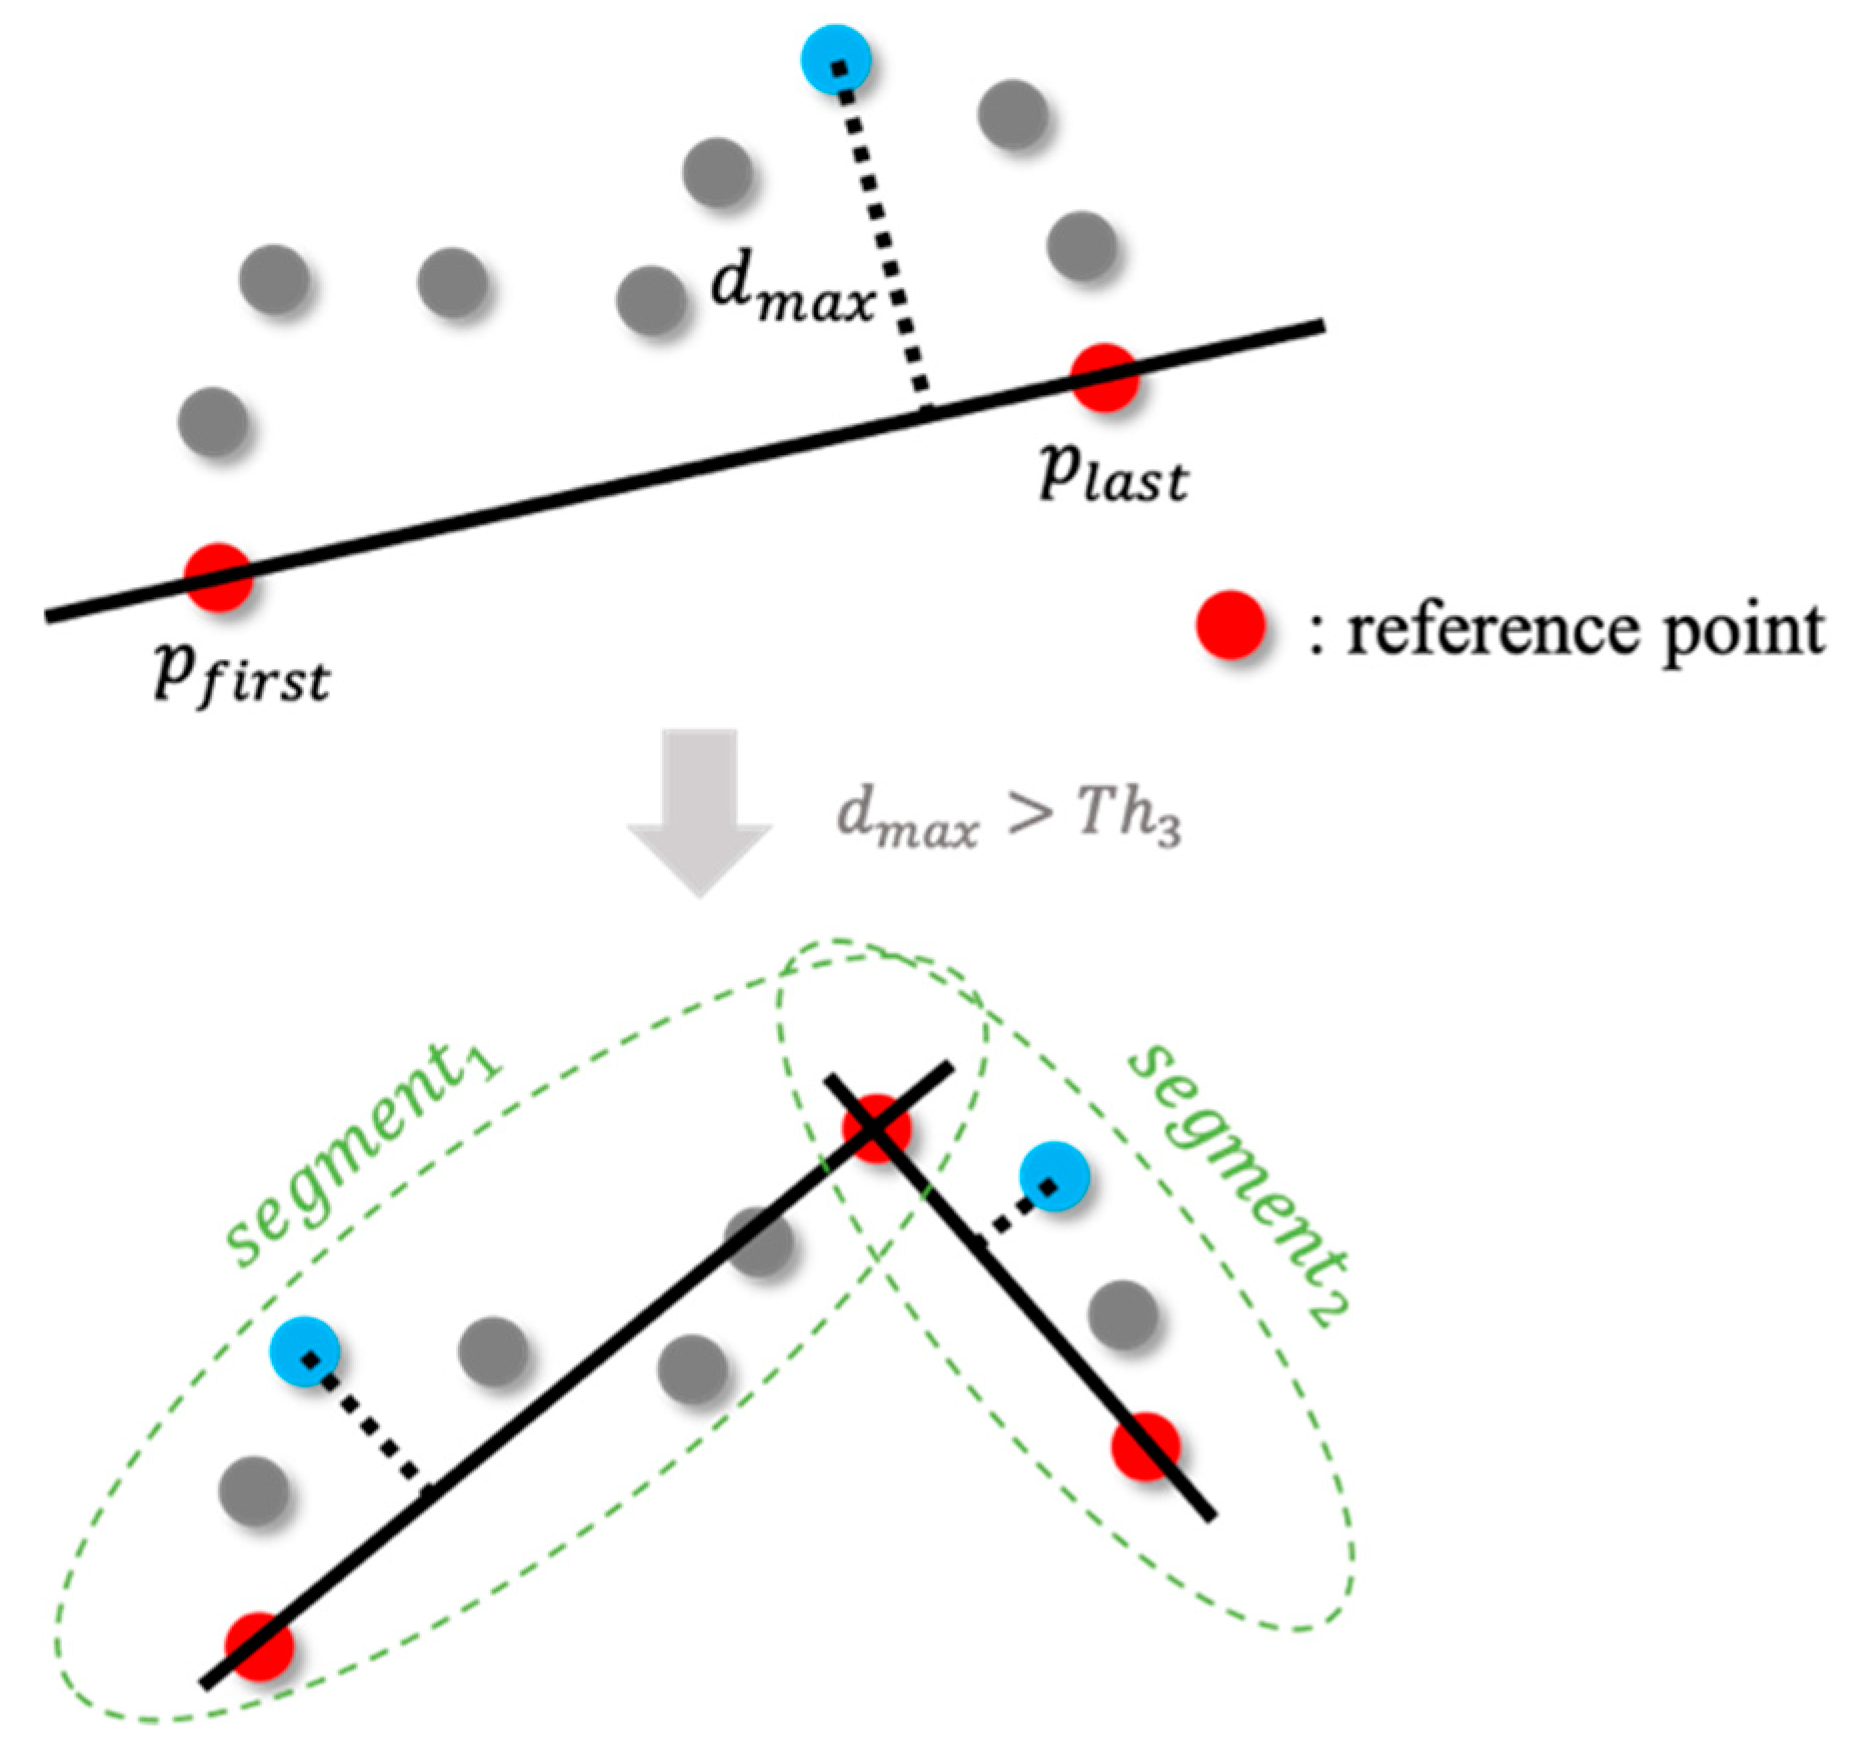
The process of the Douglas–Peucker algorithm is shown in Figure 10. Initially, the first point and the last point of the trajectory were selected. Then, we looked for a point , the largest distance from the straight line . If was greater than the given threshold , the point was kept as a reference point of the new trajectory, and we divided the trajectory into two segments. One segment comprised a set from to the point (), and the other consisted of a set from the point to (). After that, we applied the above process for each segment recursively until was shorter than . Finally, the new trajectory was given by reference points.
4. Experiments and Results
To evaluate the feasibility of the proposed method, we conducted user experiments involving twelve subjects participating in walking tours using a smartphone application developed by the first author of this paper with Akita City. The aim of the experiments was to evaluate the reliability of the proposed method of articulated trajectory mapping. Key factors for ensuring high reliability are two thresholds () for the horizontal GPS errors and the acceleration values. The two thresholds were determined through investigations into the best combinations for decreasing the number of misjudged situations of users. We used video data recording users appreciating walking tours with the smartphone’s application to estimate the correctness of the result from the method of articulated trajectory mapping.
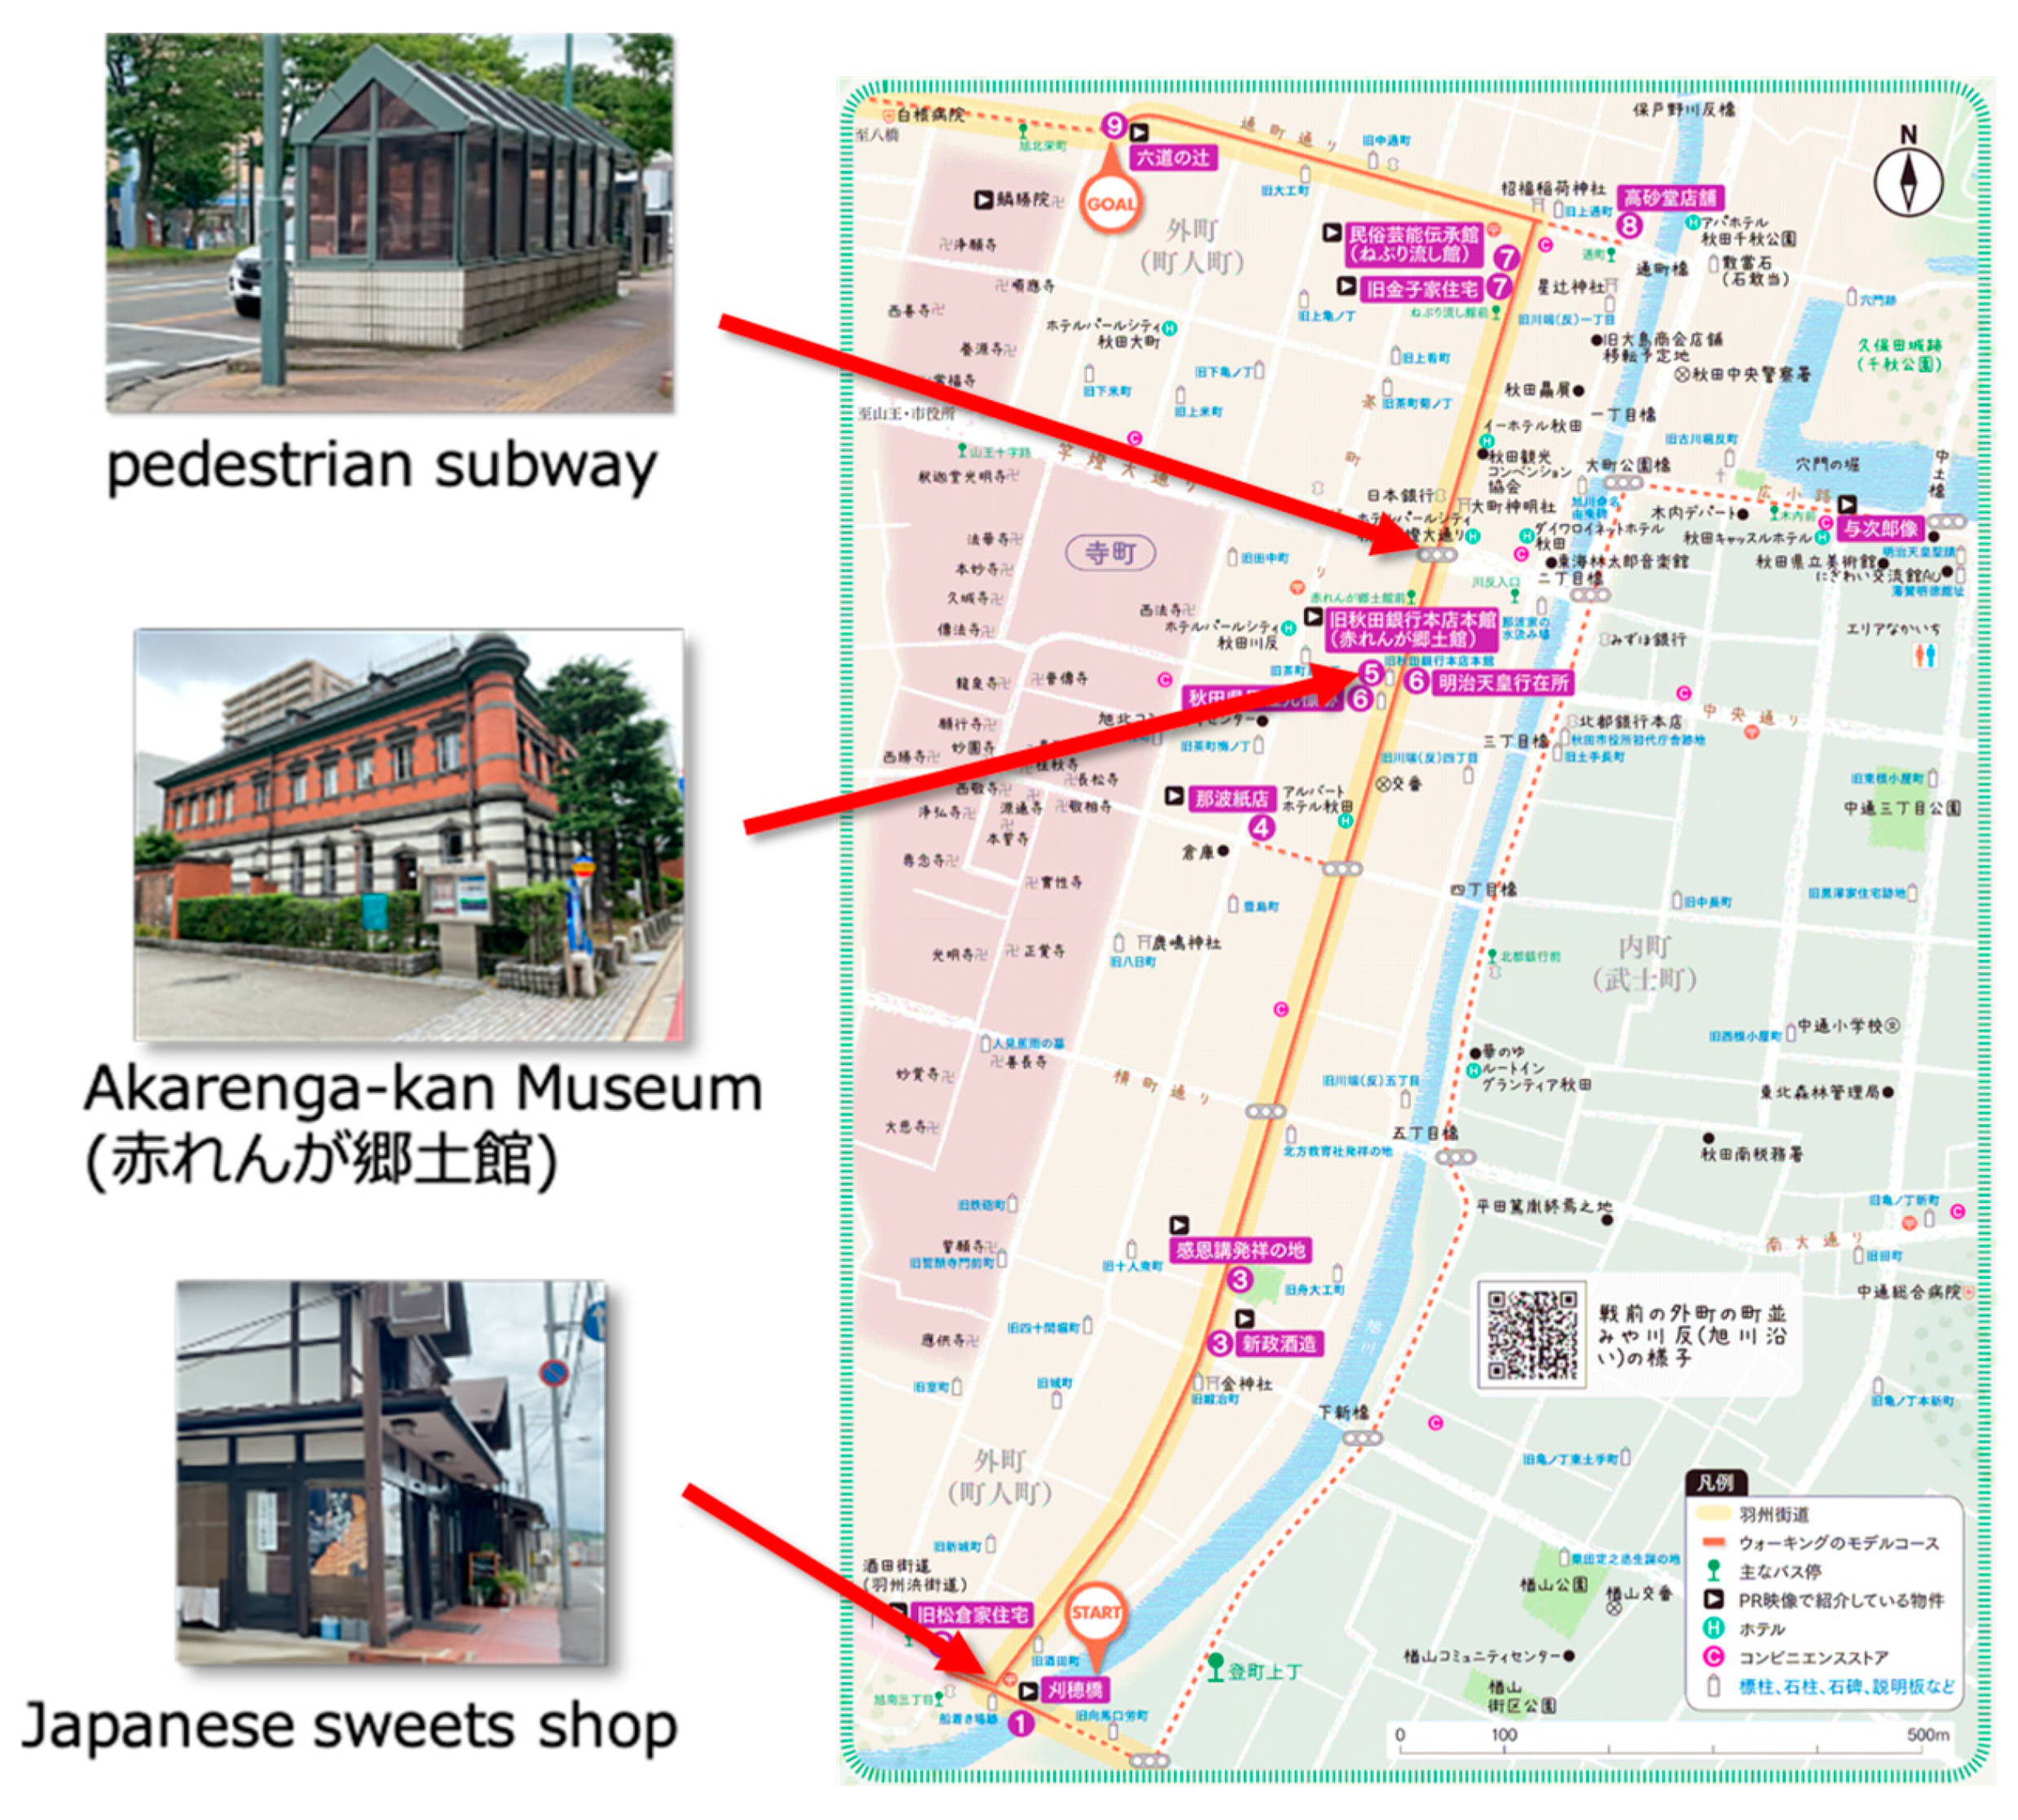
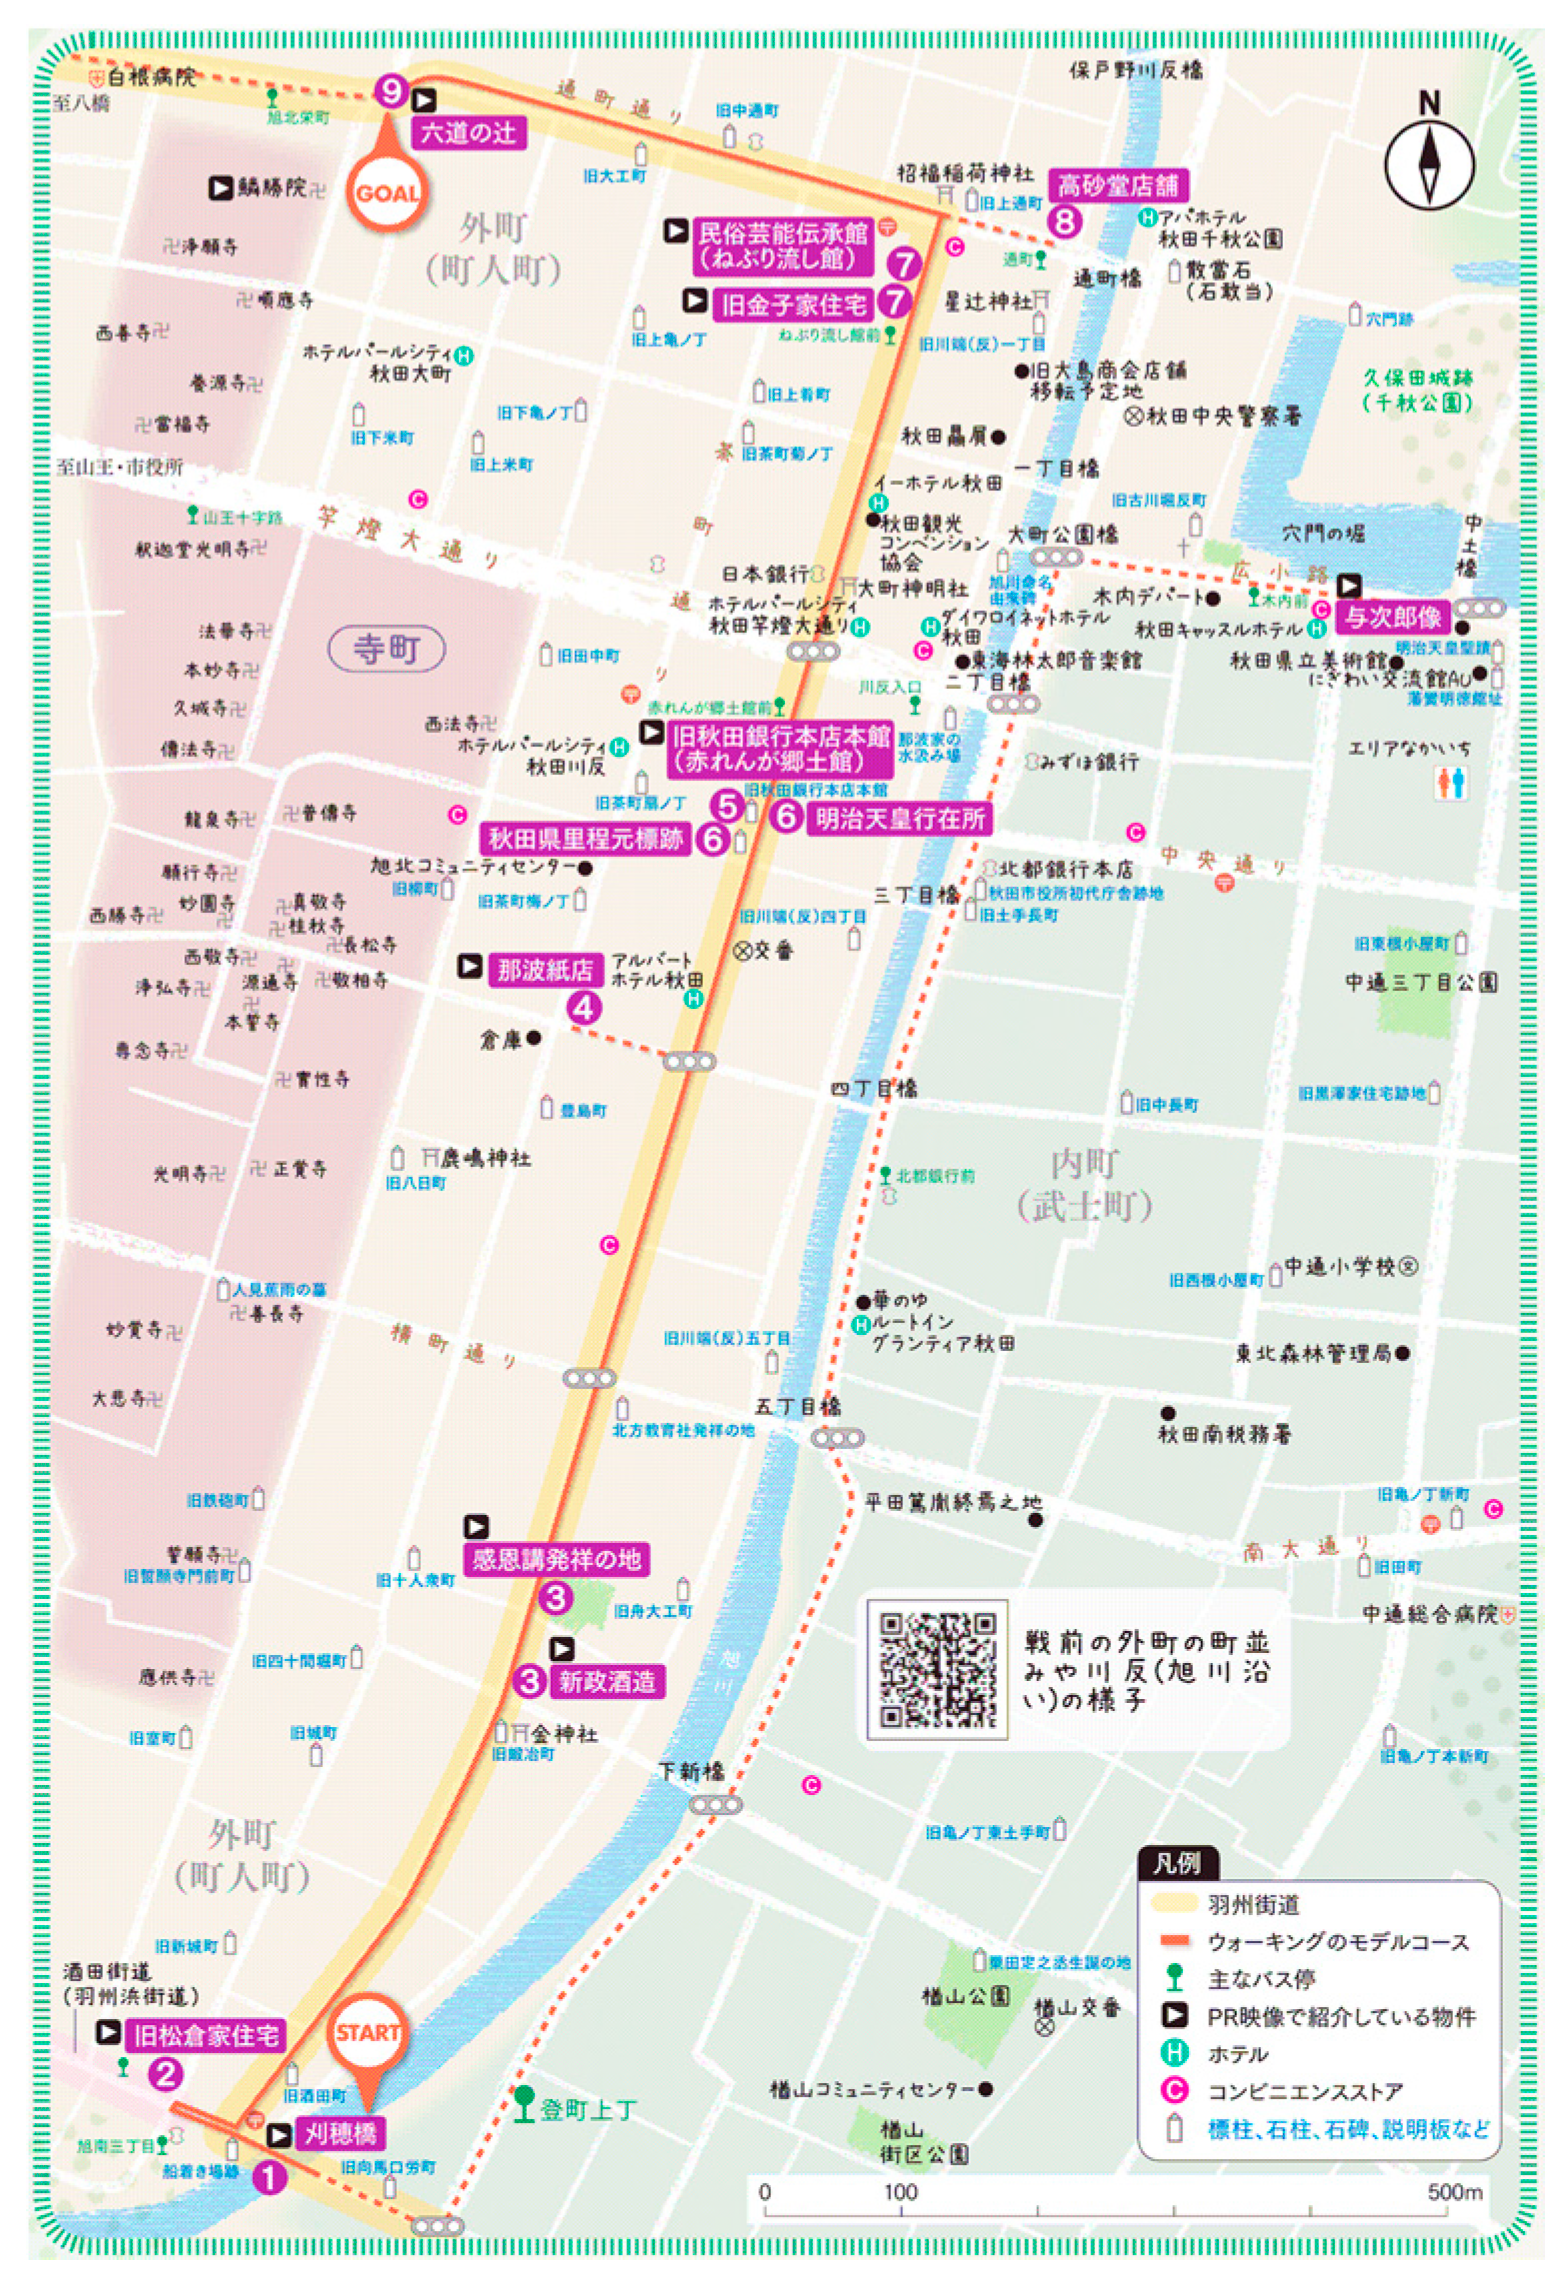
Figure 11 shows an illustrated map that was used in the walking tour application for the user experiments. The map featured the “Ushu-Kaido (羽州街道)” route, which is a submain and historically significant path established in the Edo era (17th to 19th centuries) in Japan connecting from the central area to the north through Akita City, where the authors’ university is located. A recommended route on the map goes through various points of historical and cultural interest, including heritages sites and facilities. The subjects were able to walk around the recommended route freely using the walking tour application.
First, visualization animations of trajectory data showing the two examples of (a) raw trajectory mapping and (b) articulated trajectory mapping can be viewed as YouTube videos (Raw Trajectory Mapping: https://youtu.be/Jcvf-WWPUwA; Articulated Trajectory Mapping: https://youtu.be/cpw1GxZQSHU). Without any processing for simplification, the messy and unstable lines were displayed on a map, as shown in Figure 12a. In contrast, the result of the automatic simplification processing drew clean and stable lines (Figure 12b). Figure 12b shows a good result of articulated trajectory mapping with (indoor and outdoor recognition) set to and (walking and stopping recognition) set to . We will discuss the best combination of different possible parameters for generating fewer inaccurate results in articulated trajectory mapping below.
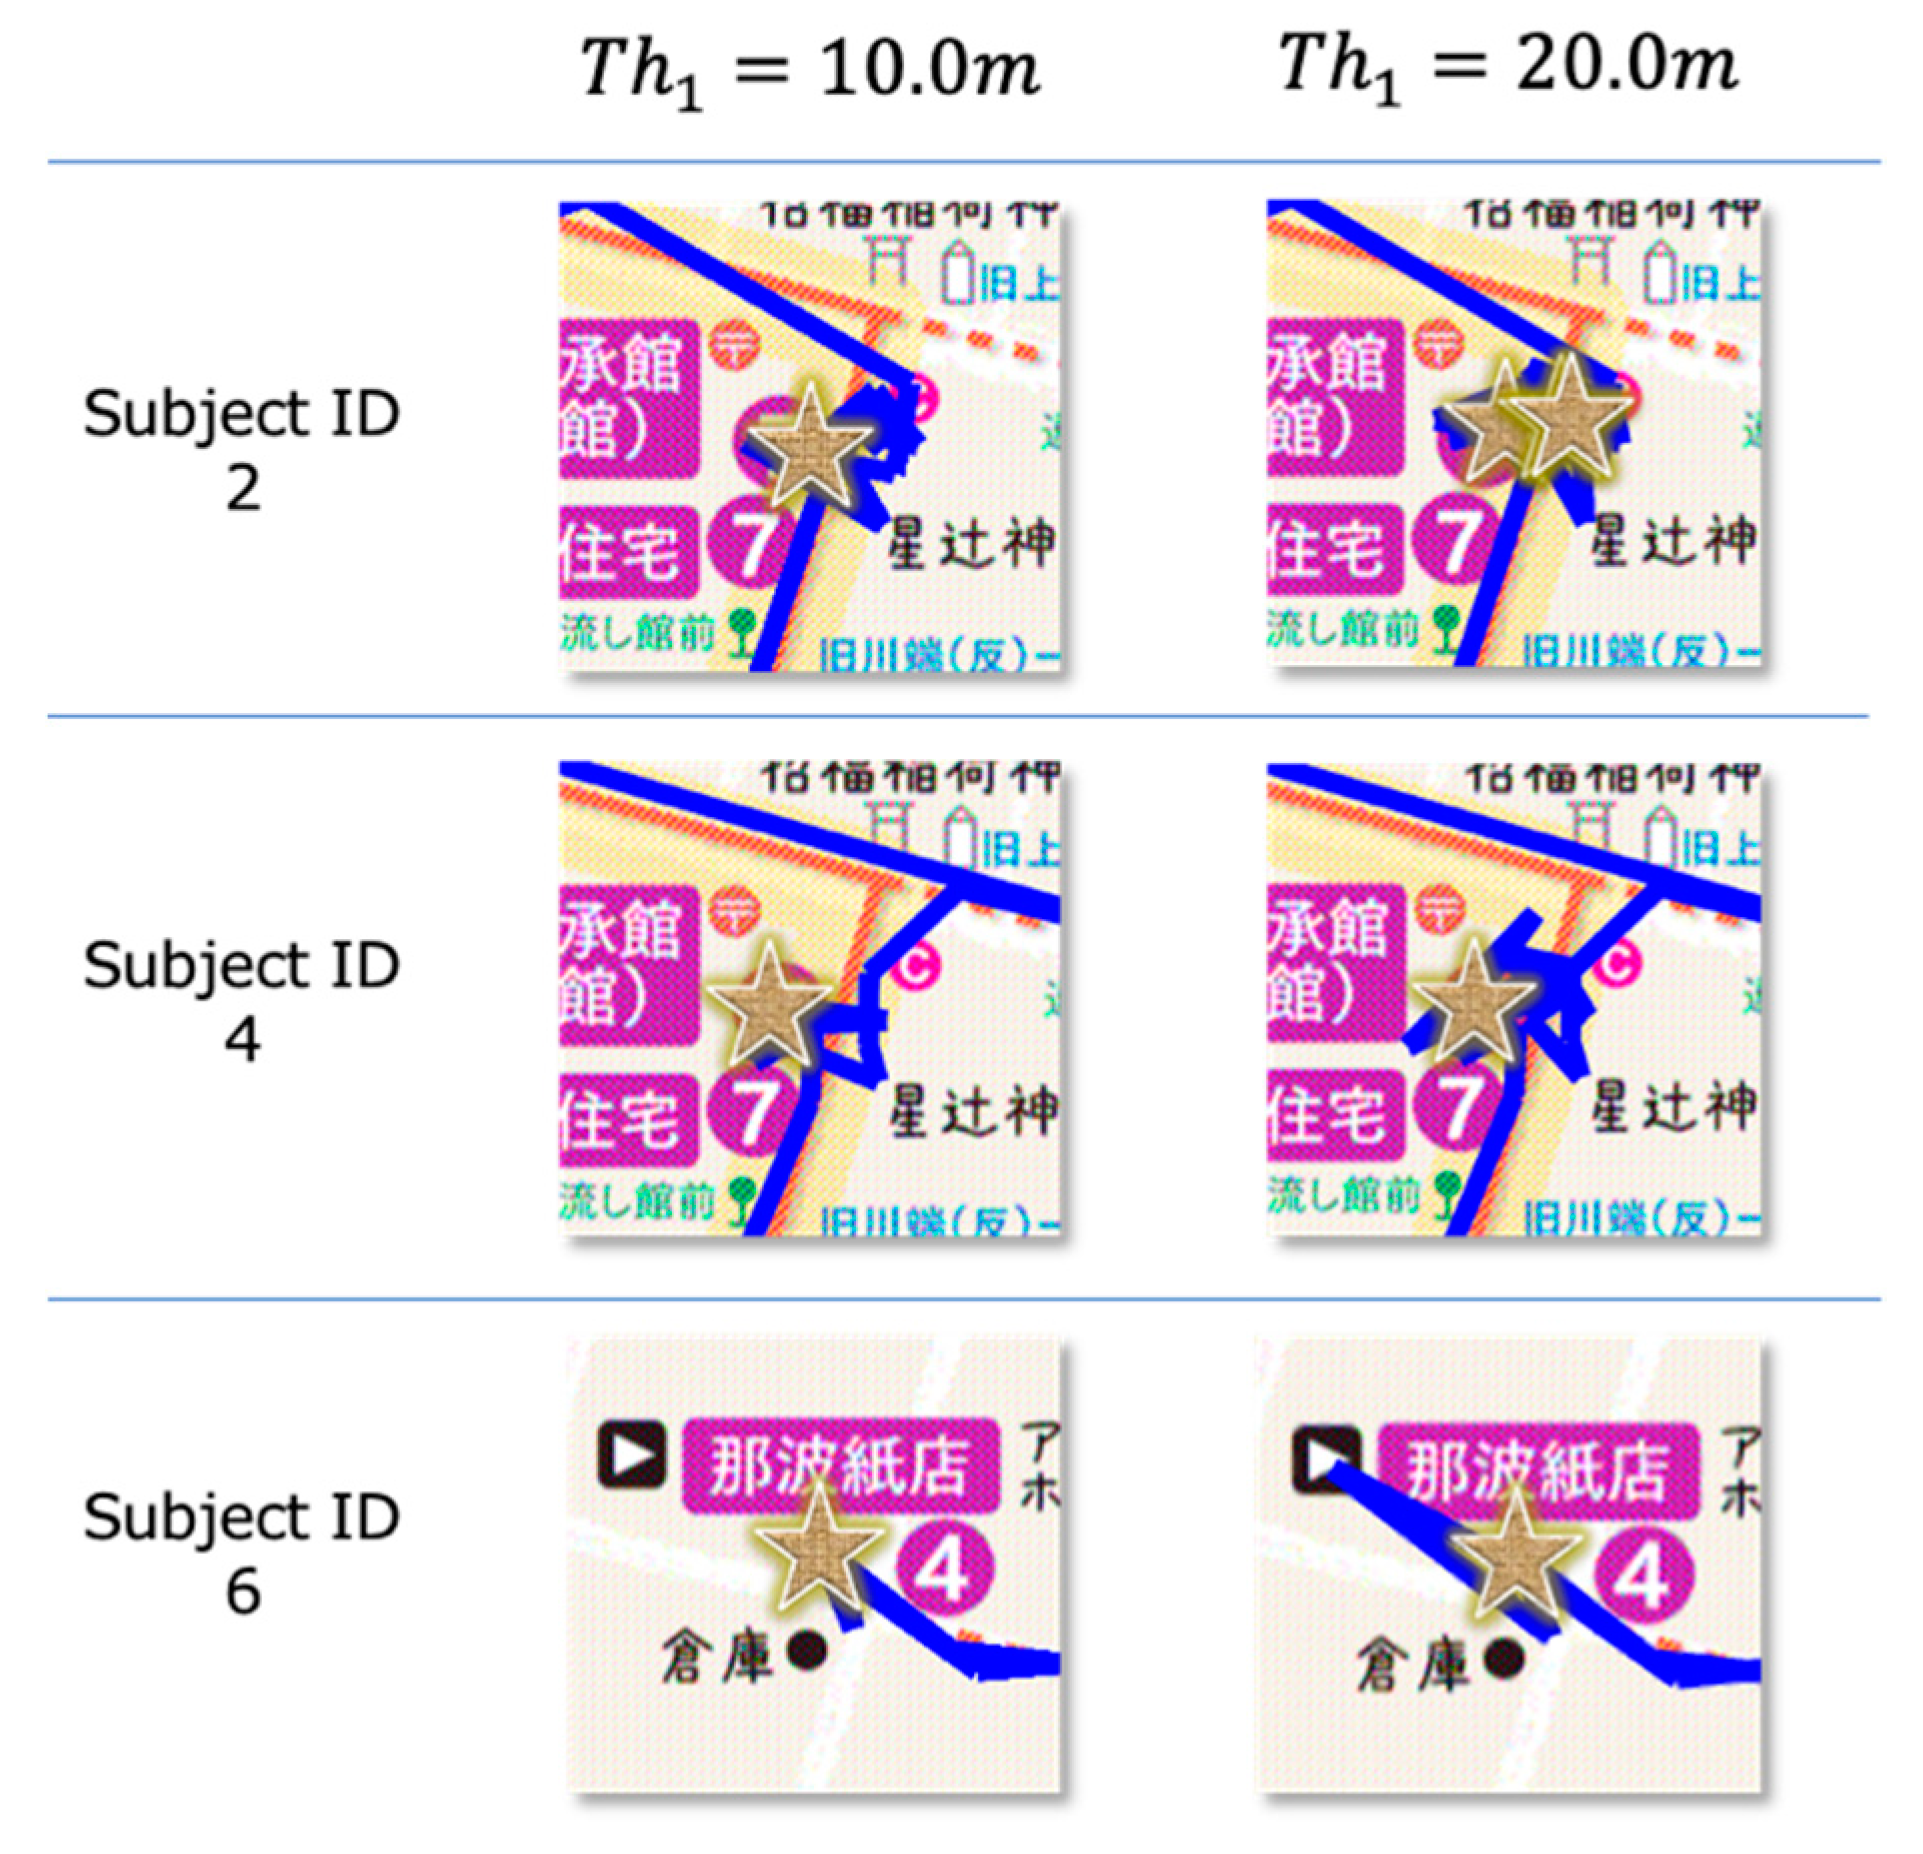
We explain how to choose an appropriate value of the threshold , which judges if a user is indoors or outdoors. Table 2 shows the erroneous judgments in the experiments. means the number of wrong judgements in points of staying while a user is outdoors. refers to the number of erroneous judgments in points of not staying while a user is indoors. If is smaller, the articulation recognition method becomes too sensitive and more inaccurate points of staying are recognized, even if a user is walking outside, because the radius of certainty for the location sometimes becomes larger due to radio disturbance. If is larger, the articulation recognition method becomes too insensitive and more points of not staying, i.e., outdoor points, are recognized even if a user is moving indoors (Figure 13). This kind of phenomenon may happen when a user is moving around close to windows indoors. As a result, multiple points of staying could be visualized for one indoor place even if a user is still moving inside a building. In addition, it could keep a complicated trajectory line as they are and not simplify it.
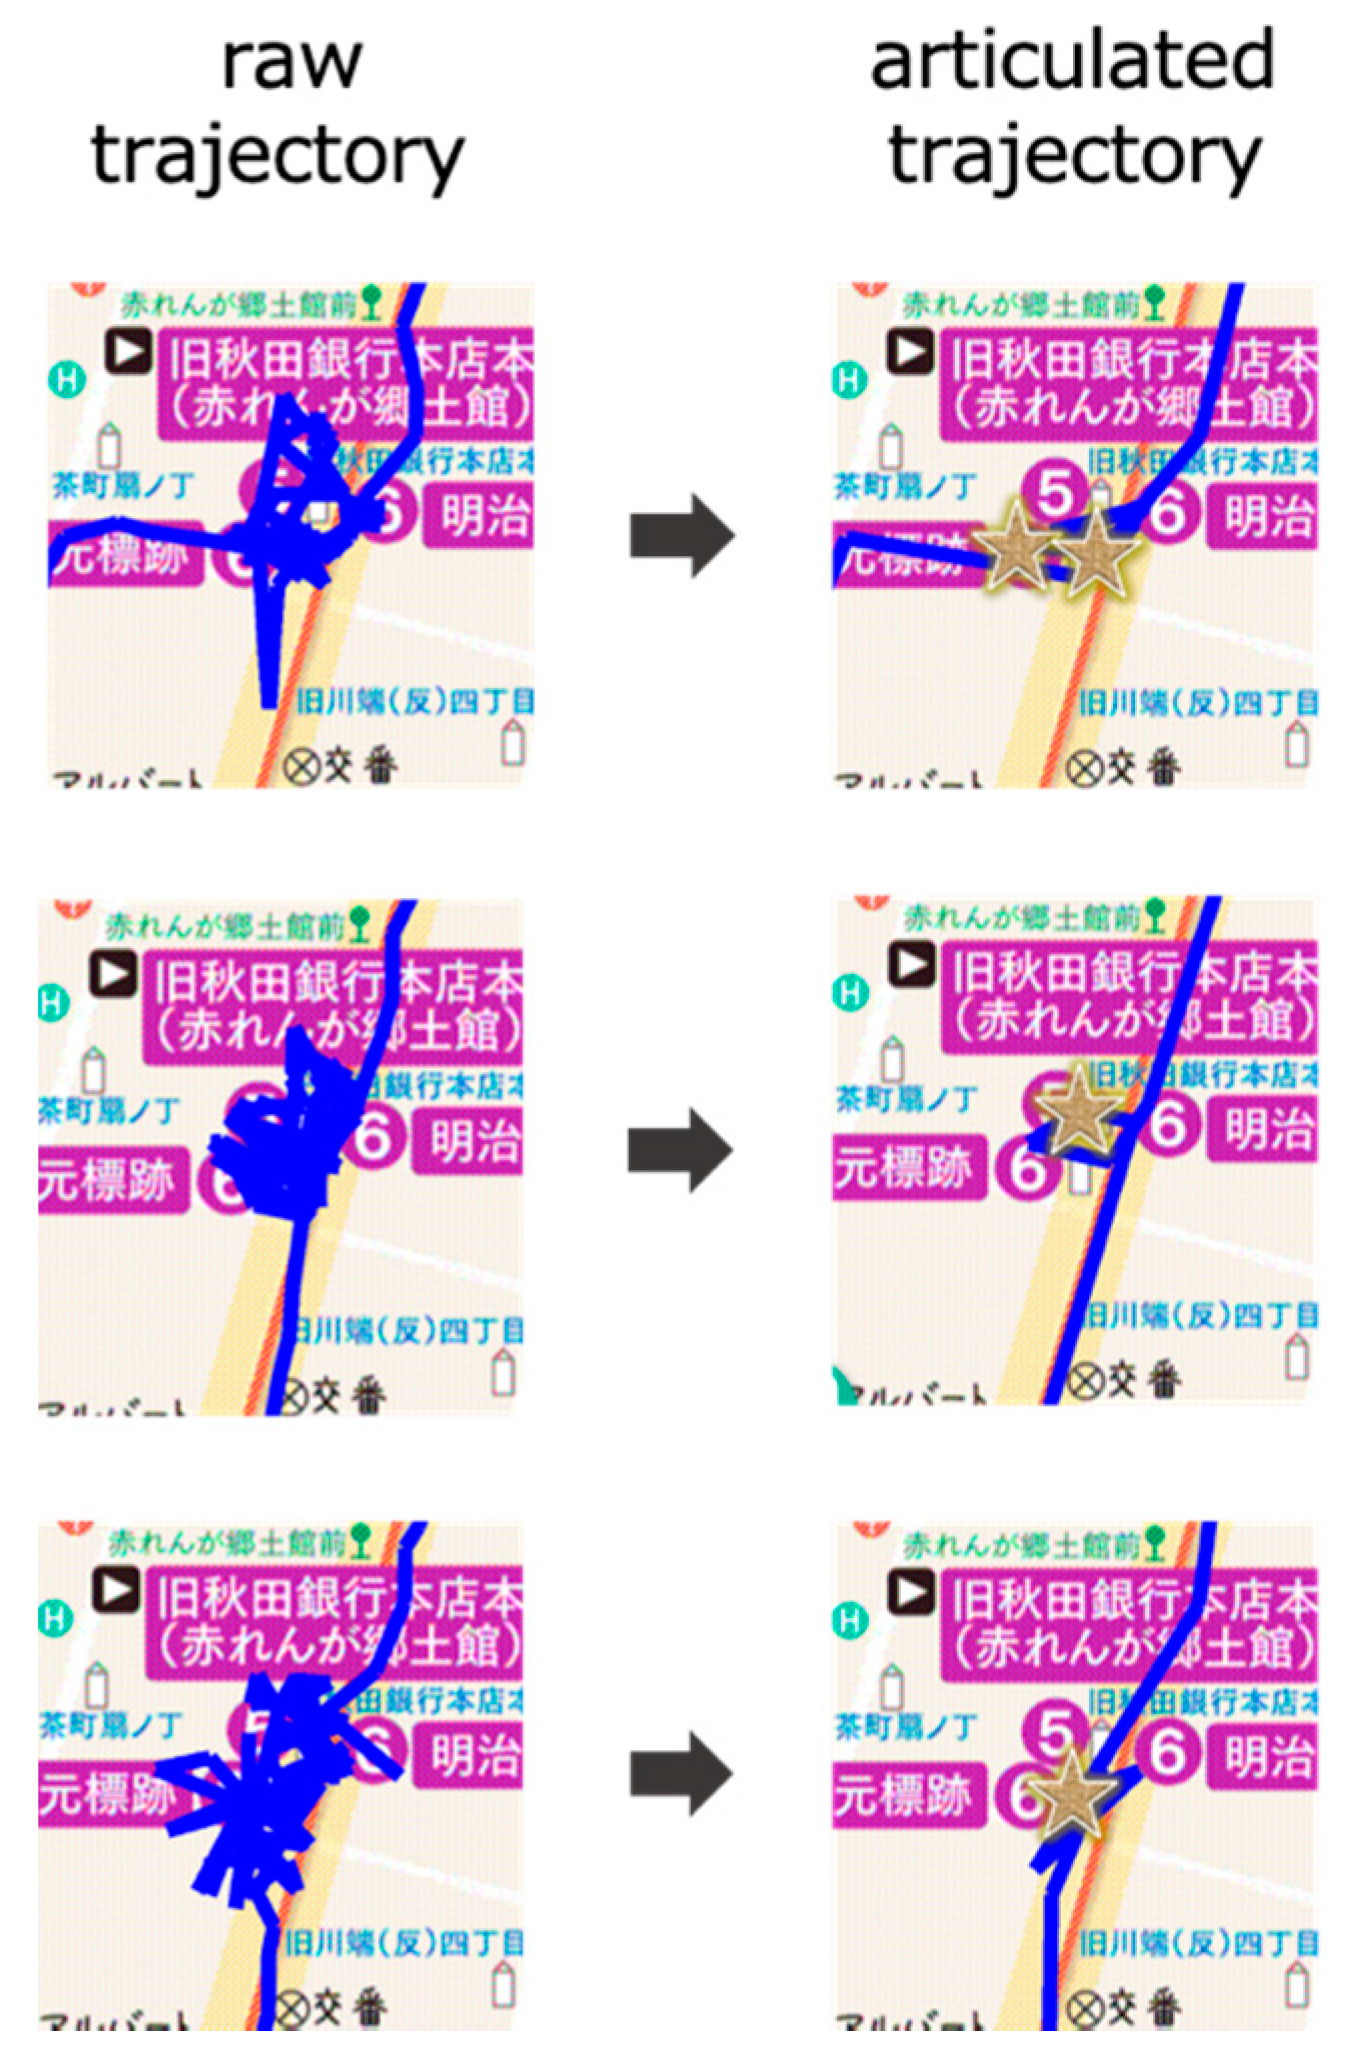
Due to the user experiments, was found to be an appropriate value to generate the right points of staying. Figure 14 shows examples of variations in the radius of certainty for the location as the horizontal GPS error while a user is staying indoors. Several parts shift below the threshold even if a user is moving indoors; however, the wrong recognitions could be avoided by using improved methods of tolerant distance buffering, discussed in Section 3.2. Figure 15 shows how effective the articulated mapping method is. In this case, it made a complicated and tangled line into a simple one and generated the right number of places indoors with set to .
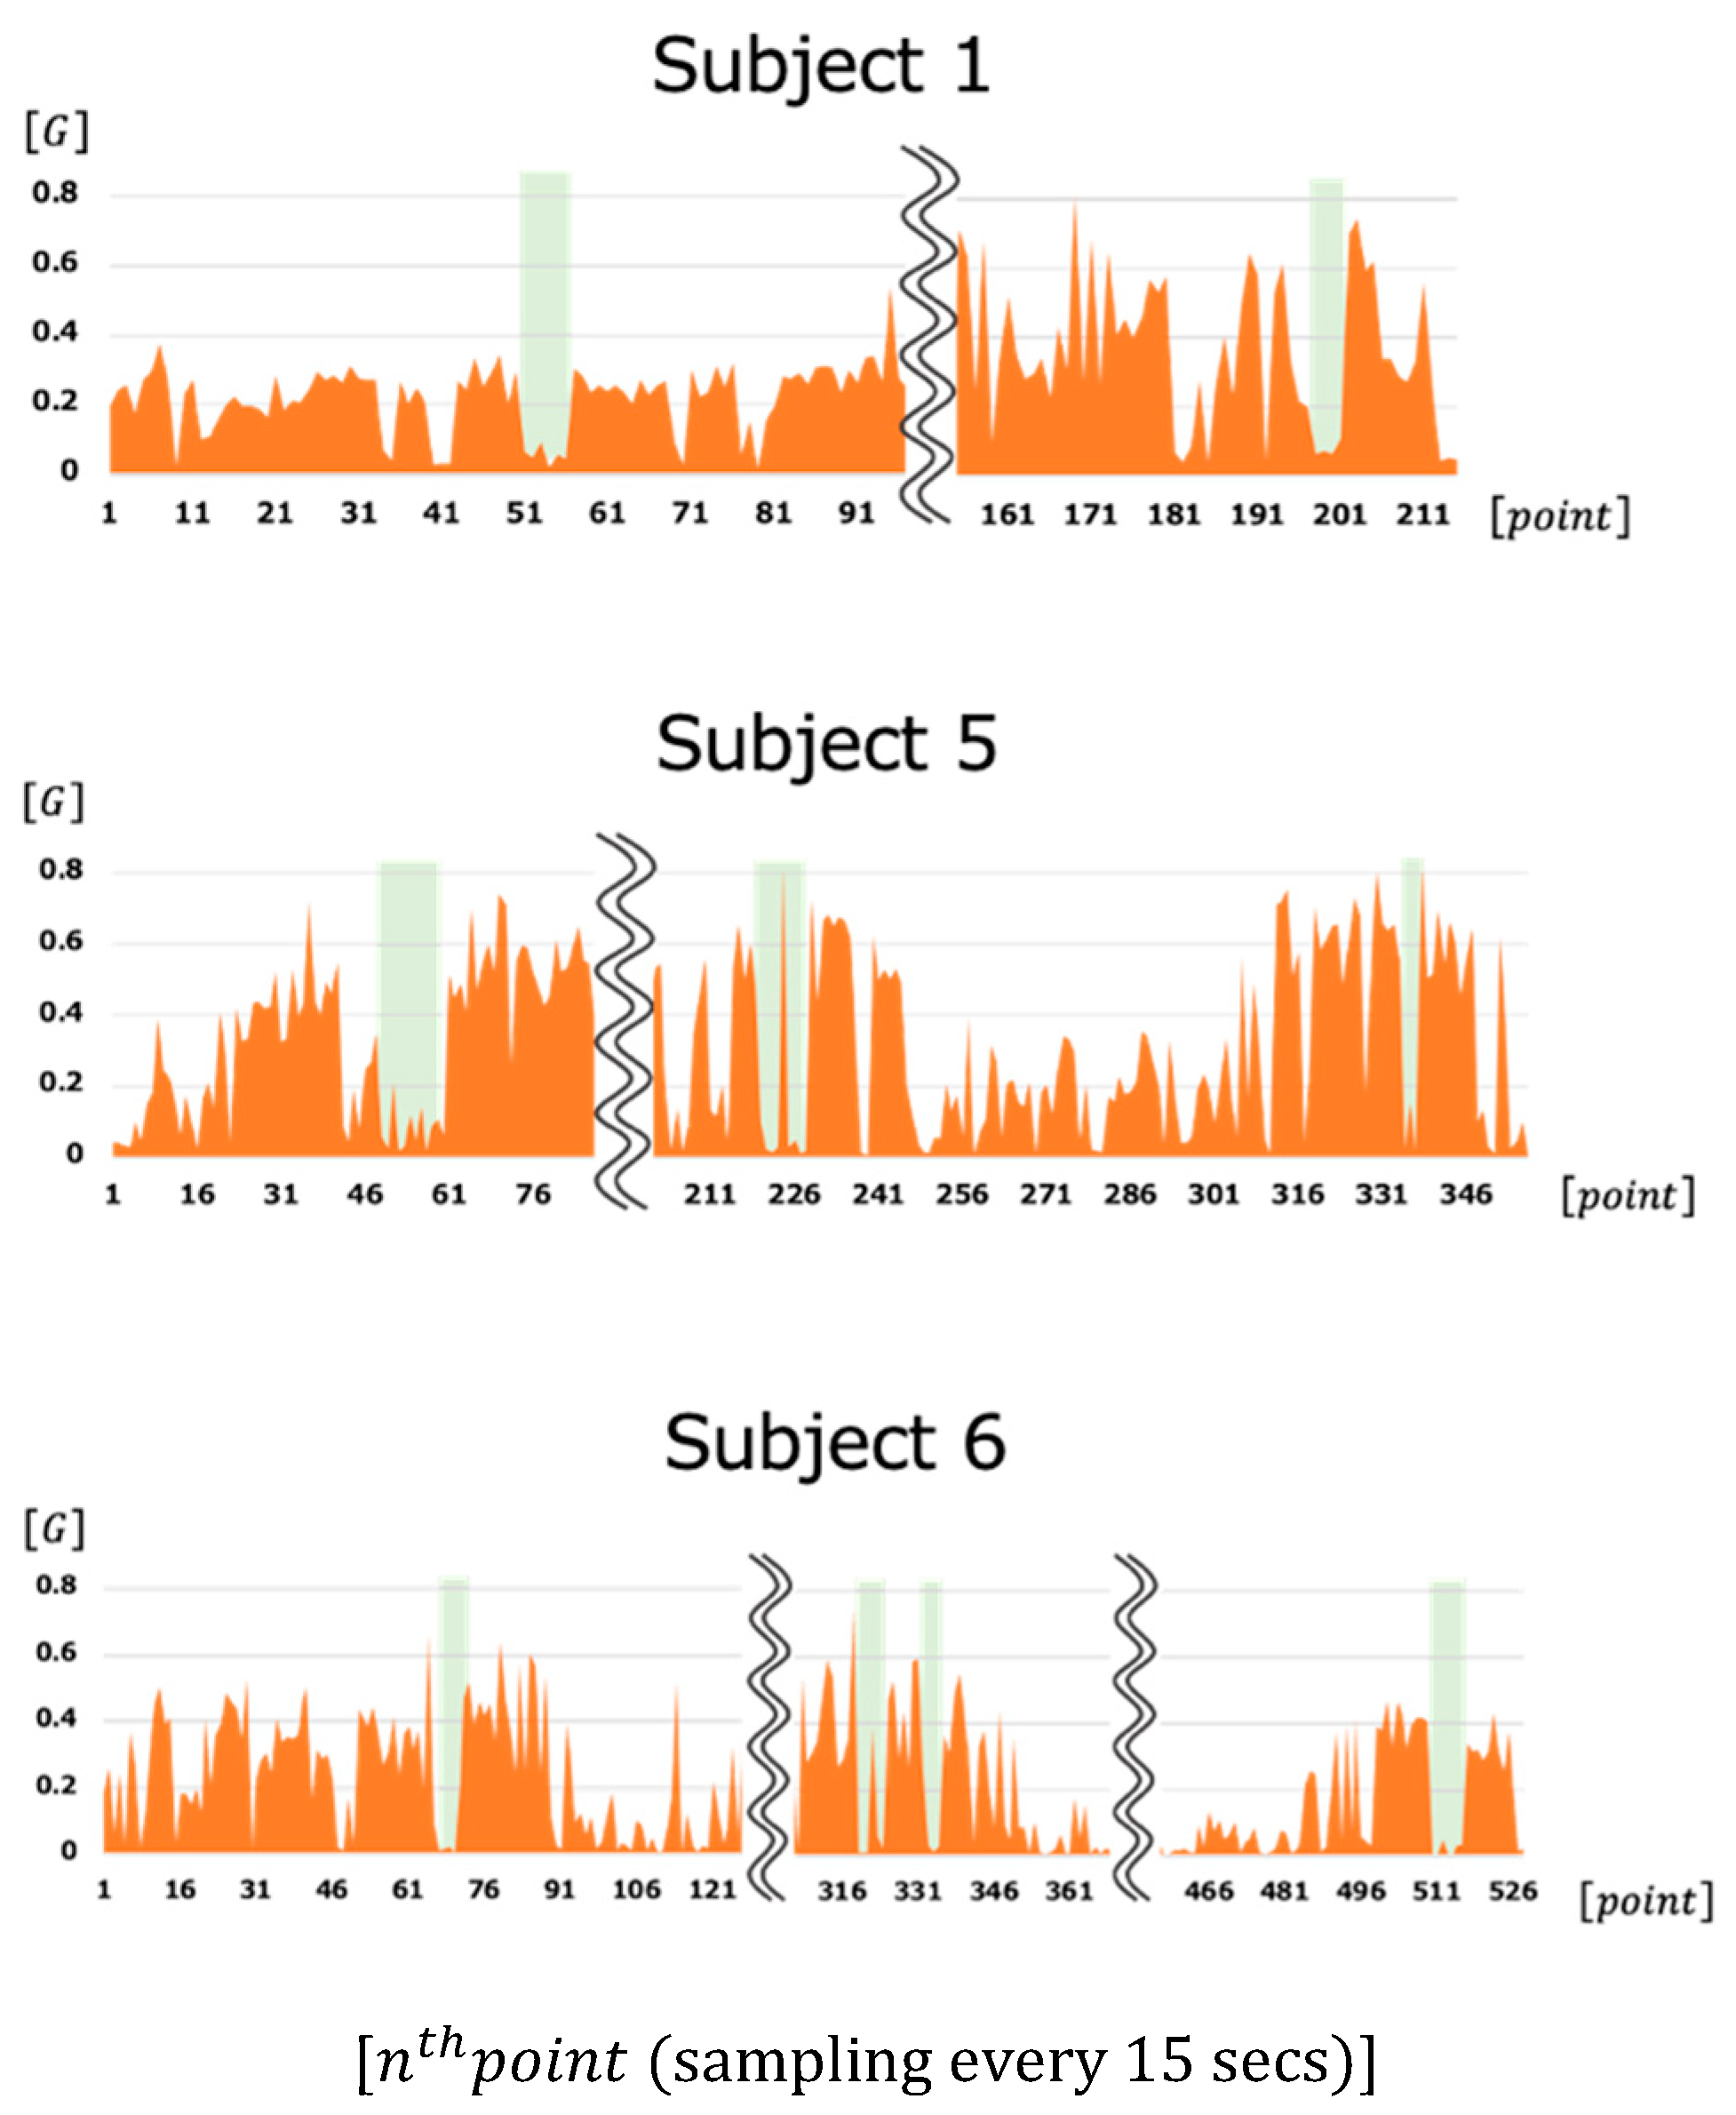
Next, we discuss the method for recognizing walking or stopping. Figure 16 shows three examples in the experiment data of variations of acceleration values when users were experiencing walking tours. Light green areas indicate the durations corresponding to tangled trajectory lines when users were stopping outdoors, e.g., waiting for traffic signals. According to the results of the user experiments, the threshold of acceleration () may be appropriate for judging if a user is stopping or walking. Actually, as the variations in acceleration values depend on individual characteristics and the passing time, it is not easy to decide what the most appropriate threshold value is. In contrast, the case of generating tangled trajectory lines becomes apparent according to the experiments. These lines could sometimes happen when the acceleration values were kept between 0.0 and 0.1G. Thus, set to the interval between 0.1G and 0.2G for the stopping mode could have good results for removing tangled trajectory lines and making it easier for users to review simplified trajectory lines. Figure 17 shows the results of simplifying the tangled trajectory lines with the setting
5. Discussion
Most location-based services are required to capture the complex and diverse contexts of humans operating in real space through digital data [12,13]. Thus, it is necessary to understand a variety of external environments (e.g., weather, surrounding buildings, and terrain) and the unexpected behaviors caused by them. In this section, we discuss some cases discovered in our experiment in the actual environments of walking tours and discuss the prospects of our research and development.
- Pedestrian subway (Figure 18)
In Japan, pedestrian subways are usually installed on busy roads to help walkers cross them. Our experiments showed that the proposed method judged these spots as one point of staying (six out of six cases). However, it could be controversial whether they should be visualized on maps. Moreover, six out of twelve examinees made use of pedestrian subways. This suggested that many walkers are likely to use them in walking tours.
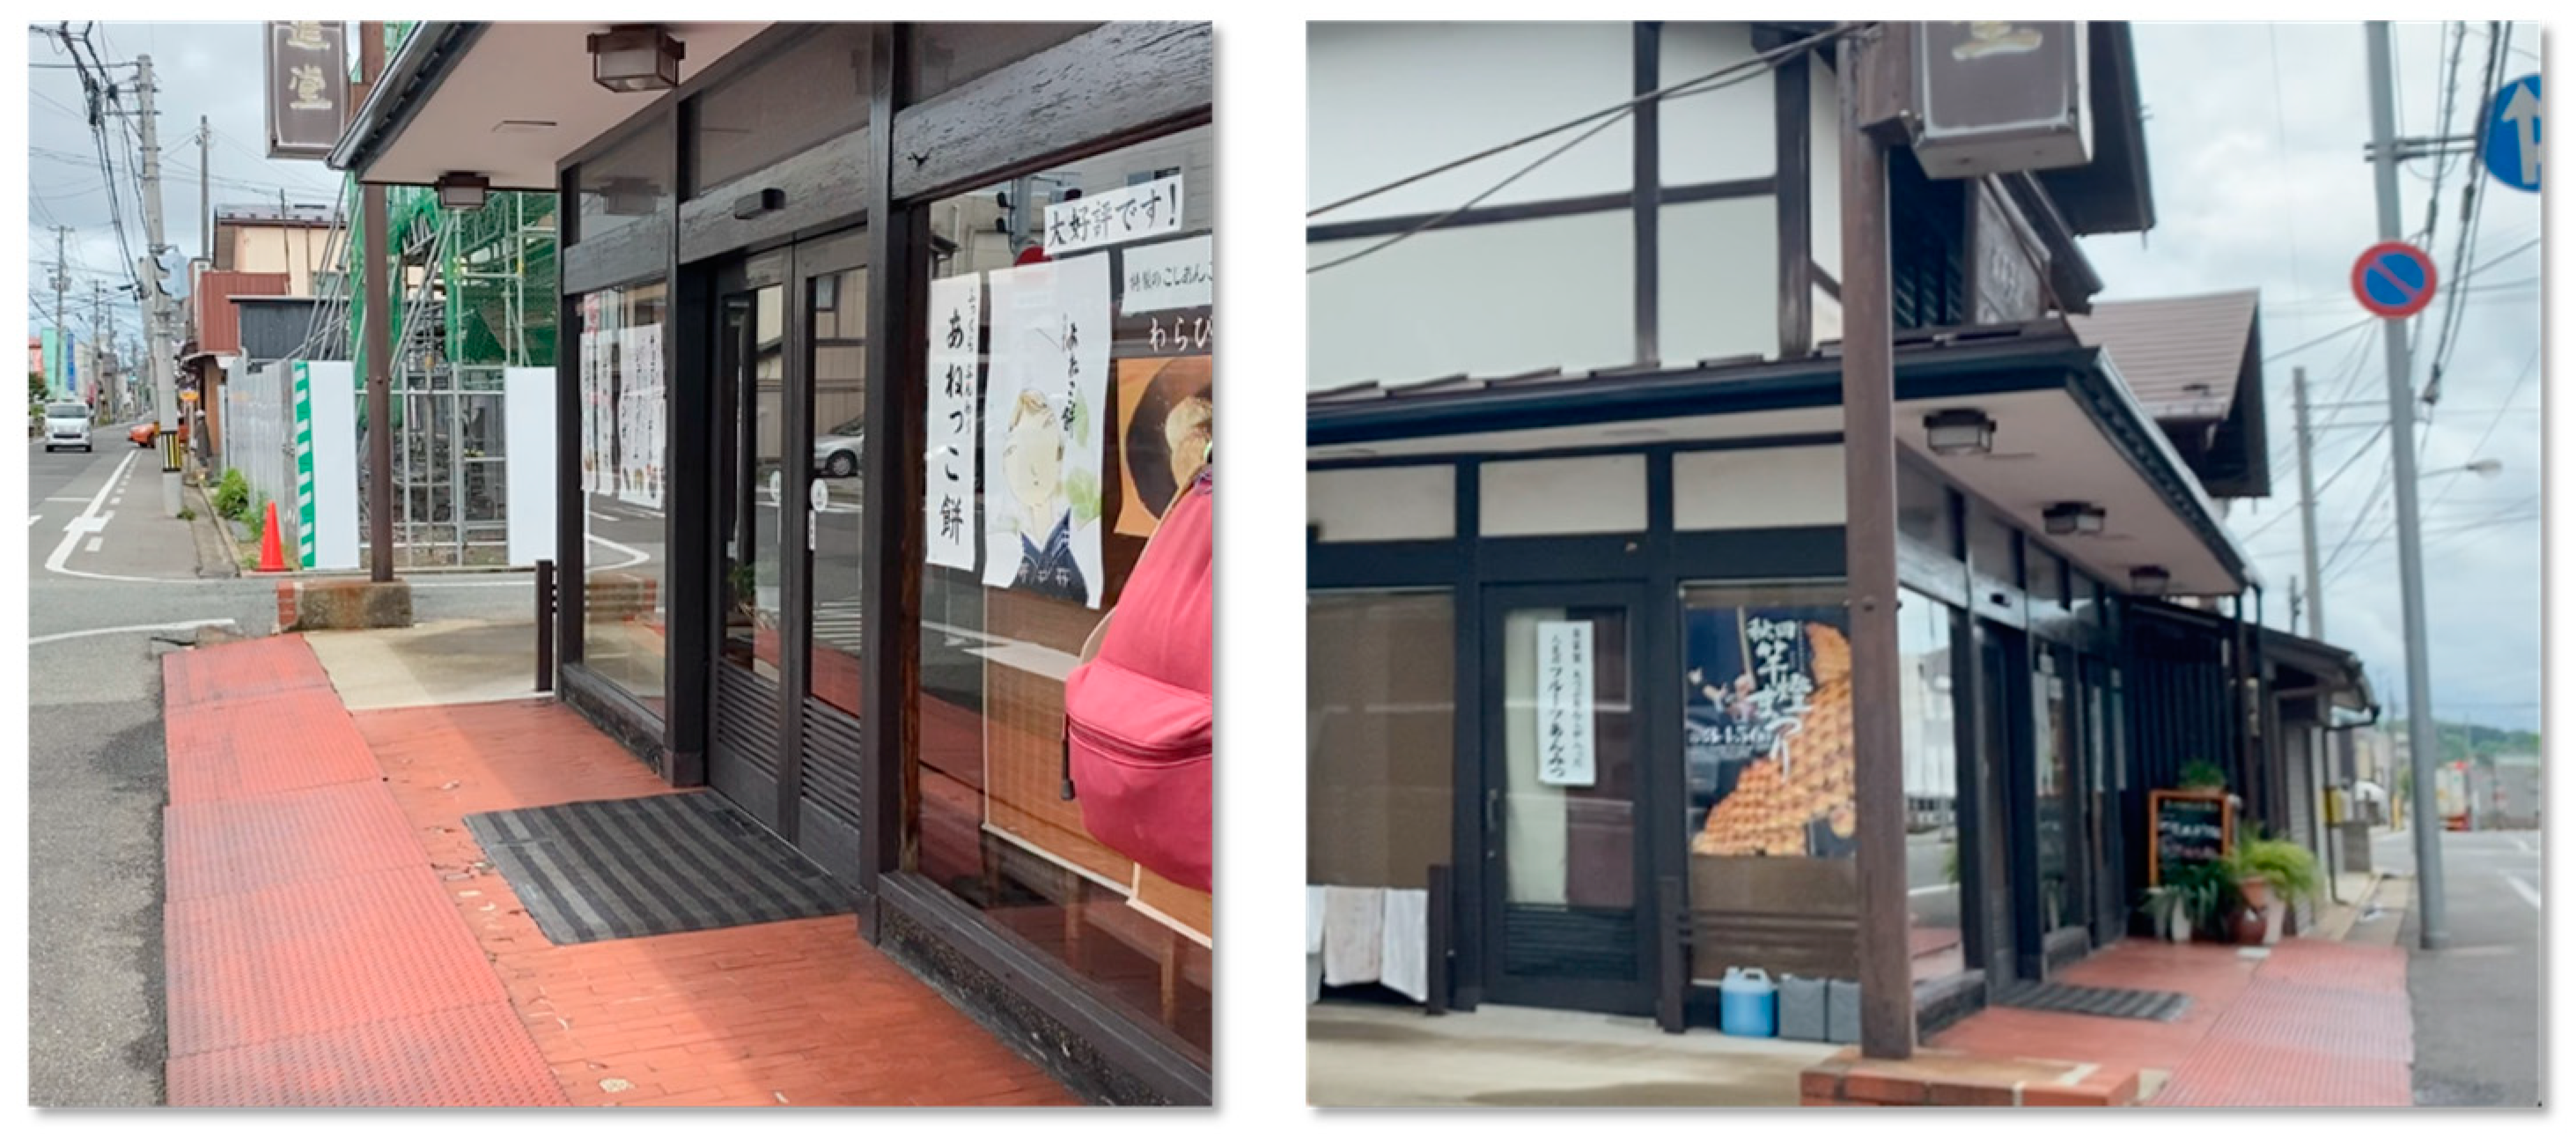
- Japanese sweets shop (Figure 19)
In Japan, there are some semi-indoor shops that have glassed-in entrances, and items are displayed there. In our experiments, even if walkers stopped by such shops, their points of staying were not visualized there. In other words, the proposed system does not judge the individual to be indoors in cases where they are close to a window or a glass door. One examinee who visited a Japanese sweets shop (Figure 19) thought that it should be visualized as a point of staying. Thus, we counted the number of cases misjudged as indoors (e.g., the cell in of in Table 2).
In this paper, we proposed a method for judging indoor and outdoor locations through GPS signal strength. However, in some cases, it seems that judging whether a point is indoors or outdoors and whether it is a meaningful indoor point or a meaningless one is different from person to person. Therefore, it is debatable whether our framework should visualize the above examples as points of staying. In future work, we need further user surveys on the visualization of points of staying and services that allow users to edit their review. At the end of this paper, the locations of the POIs that appear in the experiments are shown in Figure 20.
6. Conclusions
People enjoy learning about culture and history through walking tours in the real world. To enhance the value of this activity, we developed a location-based application for supporting not only walking tours themselves but also post-tour review of tourists’ experiences. In this paper, we discussed mechanisms of support for the latter that feature map-based trajectory displays and tracing animations. First, we identified some problems with the map-based representation of raw trajectory data. Then, we proposed articulated trajectory mapping for user-centered reviewing. To eliminate the problems that could arise, the proposed framework focused not only on simplification but also on characterization by using various spatial information sources. It needs no spatial model data that were preset beforehand as map matching methods, thus it would be simple to implement and cost-effective. The real-world experiments conducted with our developed mobile application on a smartphone revealed the practical reliability and effectiveness of the proposed framework for actual walking tours using feasible threshold values derived from testing GPS and acceleration sensors. Therefore, the main contribution of this paper is the provision of new, better human-centered mobile environments with the articulated trajectory mapping for end users to easily and actively share their trajectories and past spatial experiences with their future selves and others. Ultimately, this project is a part of a wider body of research that, insofar as it attempts to enrich post-tour activities, must encourage people around the world to understand and share the value of where we live.
Supplementary Materials
The following are available online at https://0-www-mdpi-com.brum.beds.ac.uk/2220-9964/9/10/610/s1. Examples of visualization animations of trajectory data can be found in the following YouTube videos: Raw Trajectory Mapping (https://youtu.be/Jcvf-WWPUwA); Articulated Trajectory Mapping (https://youtu.be/cpw1GxZQSHU).
Author Contributions
Conceptualization, Iori Sasaki, Masatoshi Arikawa, and Akinori Takahashi; data curation, Iori Sasaki; formal analysis, Iori Sasaki; methodology, Iori Sasaki, Masatoshi Arikawa, and Akinori Takahashi; software, Iori Sasaki; validation, Iori Sasaki; visualization, Iori Sasaki; writing—original draft, Iori Sasaki and Masatoshi Arikawa. All authors have read and agreed to the published version of the manuscript.
Funding
JSPS KAKENHI Grant Numbers JP19H04120, JP17H00839, JP16H01830.
Acknowledgments
The authors would like to thank Akita City for providing the fascinating illustrated maps and content of the walking tours. We are also grateful to the subjects that participated in our user experiments.
Conflicts of Interest
The authors declare no conflict of interest.
References
- World Tourism Organization. Walking Tourism—Promoting Regional Development. 2019. Available online: https://www.e-unwto.org/doi/book/10.18111/9789284420346 (accessed on 8 August 2020).
- Benyon, D.; Quigley, A.; O’Keefe, B.; Riva, G. Presence and digital tourism. AI Soc. 2014, 29, 521–529. [Google Scholar] [CrossRef]
- Statler, S. Geofencing: Everything you need to know. In Beacon Technologies; Apress: Berkeley, CA, USA, 2016; pp. 307–316. [Google Scholar]
- Lu, M.; Arikawa, M. Map-based storytelling tool for real-world walking tour. J. Locat. Based Serv. 2013, 435–451. [Google Scholar]
- Spaccapietra, S.; Parent, C.; Damiani, M.L.; Macedo, J.A.; Porto, F.; Vangenot, C. A conceptual view on trajectories. Data Knowl. Eng. 2008, 65, 126–146. [Google Scholar] [CrossRef] [Green Version]
- myTracks The GPS solution for iOS and macOS. Available online: https://www.mytracks4mac.info/index.php/en/ (accessed on 15 September 2020).
- Douglas, H.D.; Peucker, T.K. Algorithms for the reduction of the number of points required to represent a digitized line or its caricature. Cartogr. Int. J. Geogr. Inf. Geovisualization 1973, 10, 112–122. [Google Scholar] [CrossRef] [Green Version]
- Reumann, K.; Witkam, A.P. Optimizing curve segmentation in computer graphics. In Proceedings of the International Computing Symposium, Davos, Switzerland, 4–7 September 1973; pp. 467–472. [Google Scholar]
- Quddus, M.A.; Ochieng, W.Y.; Noland, R.B. Current map-matching algorithms for transport applications: State-of-the art and future research directions. Transp. Res. C 2007, 15, 312–328. [Google Scholar] [CrossRef] [Green Version]
- Zheng, Y. Trajectory data mining: An overview. ACM Trans. Intell. Syst. Technol. 2015, 6, 29. [Google Scholar] [CrossRef]
- Katsikouli, P.; Sarkar, R.; Gao, J. Persistence based online signal and trajectory simplification for mobile devices. In Proceedings of the 22th ACM SIGSPATIAL International Conference on Advances in Geographic Information Systems, Dallas, TX, USA, 4–7 November 2014; pp. 371–380. [Google Scholar]
- Li, Z.; Ding, B.; Han, J.; Kays, R.; Nye, P. Mining periodic behaviors for moving objects. In Proceedings of the 16th ACM SIGKDD International Conference on Knowledge Discovery and Data Mining, Washington, DC, USA, 24–28 July 2010; pp. 1099–1108. [Google Scholar]
- Li, Q.; Zheng, Y.; Xie, X.; Chen, Y.; Liu, W.; Ma, W. Mining user similarity based on location history. In Proceedings of the 16th ACM SIGSPATIAL Conference on Advance in Geographical Information Systems, Irvine, CA, USA, 5–7 November 2008; pp. 1–10. [Google Scholar]
- Palma, A.T.; Bogorny, V.; Kuijpers, B.; Alvares, L.O. A clustering-based approach for discovering interesting places in trajectories. In Proceedings of the 2008 ACM Symposium on Applied Computing, Fortaleza Ceara, Brazil, 16–20 March 2008; pp. 863–868. [Google Scholar]
- Boukhechba, M.; Bouzouane, A.; Bouchard, B.; Vallerand, C.G.; Giroux, S. Online recognition of people’s activities from raw GPS data: Semantic trajectory data analysis. In Proceedings of the 8th ACM International Conference on PErvasive Technologies Related to Assistive Environments, Corfu, Greece, 1–3 July 2015; pp. 1–8. [Google Scholar]
- Alvares, L.O.; Bogorny, V.; Kuijpers, B.; Macedo, J.A.F.; Moelans, B.; Vaisman, A. A model for enriching trajectories with semantic geographical information. In Proceedings of the 15th Annual ACM International Symposium on Advances in Geographic Information Systems, Seattle, WA, USA, 7–9 November 2007; pp. 1–8. [Google Scholar]
- Bogorny, V.; Avancini, H.; Paula, B.C.; Kuplich, C.R.; Alvares, L.O. Weka-STPM: A software architecture and prototype for semantic trajectory data mining and visualization. Trans. GIS 2011, 15, 227–248. [Google Scholar] [CrossRef]
- Huang, H.; Gartner, G.; Krisp, J.M.; Raubal, M.; Weghe, N.V. Location based services: Ongoing evolution and research agenda. J. Locat. Based Serv. 2018, 12, 63–93. [Google Scholar] [CrossRef]
- Grifoni, P.; D’Ulizia, A.; Ferri, F. Context-awareness in location based services in the big data era. In Mobile Big Data; Skourletopoulos, G., Mastorakis, G., Mavromoustakis, C.X., Dobre, C., Eds.; Springer: Berlin/Heidelberg, Germany, 2017; Volume 10, pp. 85–127. [Google Scholar]
- horizontalAccuracy | Apple Developer Documentation. Available online: https://developer.apple.com/documentation/corelocation/cllocation/1423599-horizontalaccuracy/ (accessed on 19 September 2020).
- Xia, H.; Qiao, Y.; Jian, J.; Chang, Y. Using smart phone sensors to detect transportation modes. Sensors 2014, 14, 20843–20865. [Google Scholar] [CrossRef] [Green Version]
Figure 1.
Example displays of our mobile application during walking tours: (a) guide content is automatically displayed based on the user’s current location, and (b) users can find where they are on the illustrated maps.
Figure 1.
Example displays of our mobile application during walking tours: (a) guide content is automatically displayed based on the user’s current location, and (b) users can find where they are on the illustrated maps.

Figure 2.
Example display of trajectory log data in the map-based reviewing mode of our application (without any data processing), which illustrates three kinds of problems (A, B, and C). The blue line is a GPS trajectory.
Figure 2.
Example display of trajectory log data in the map-based reviewing mode of our application (without any data processing), which illustrates three kinds of problems (A, B, and C). The blue line is a GPS trajectory.
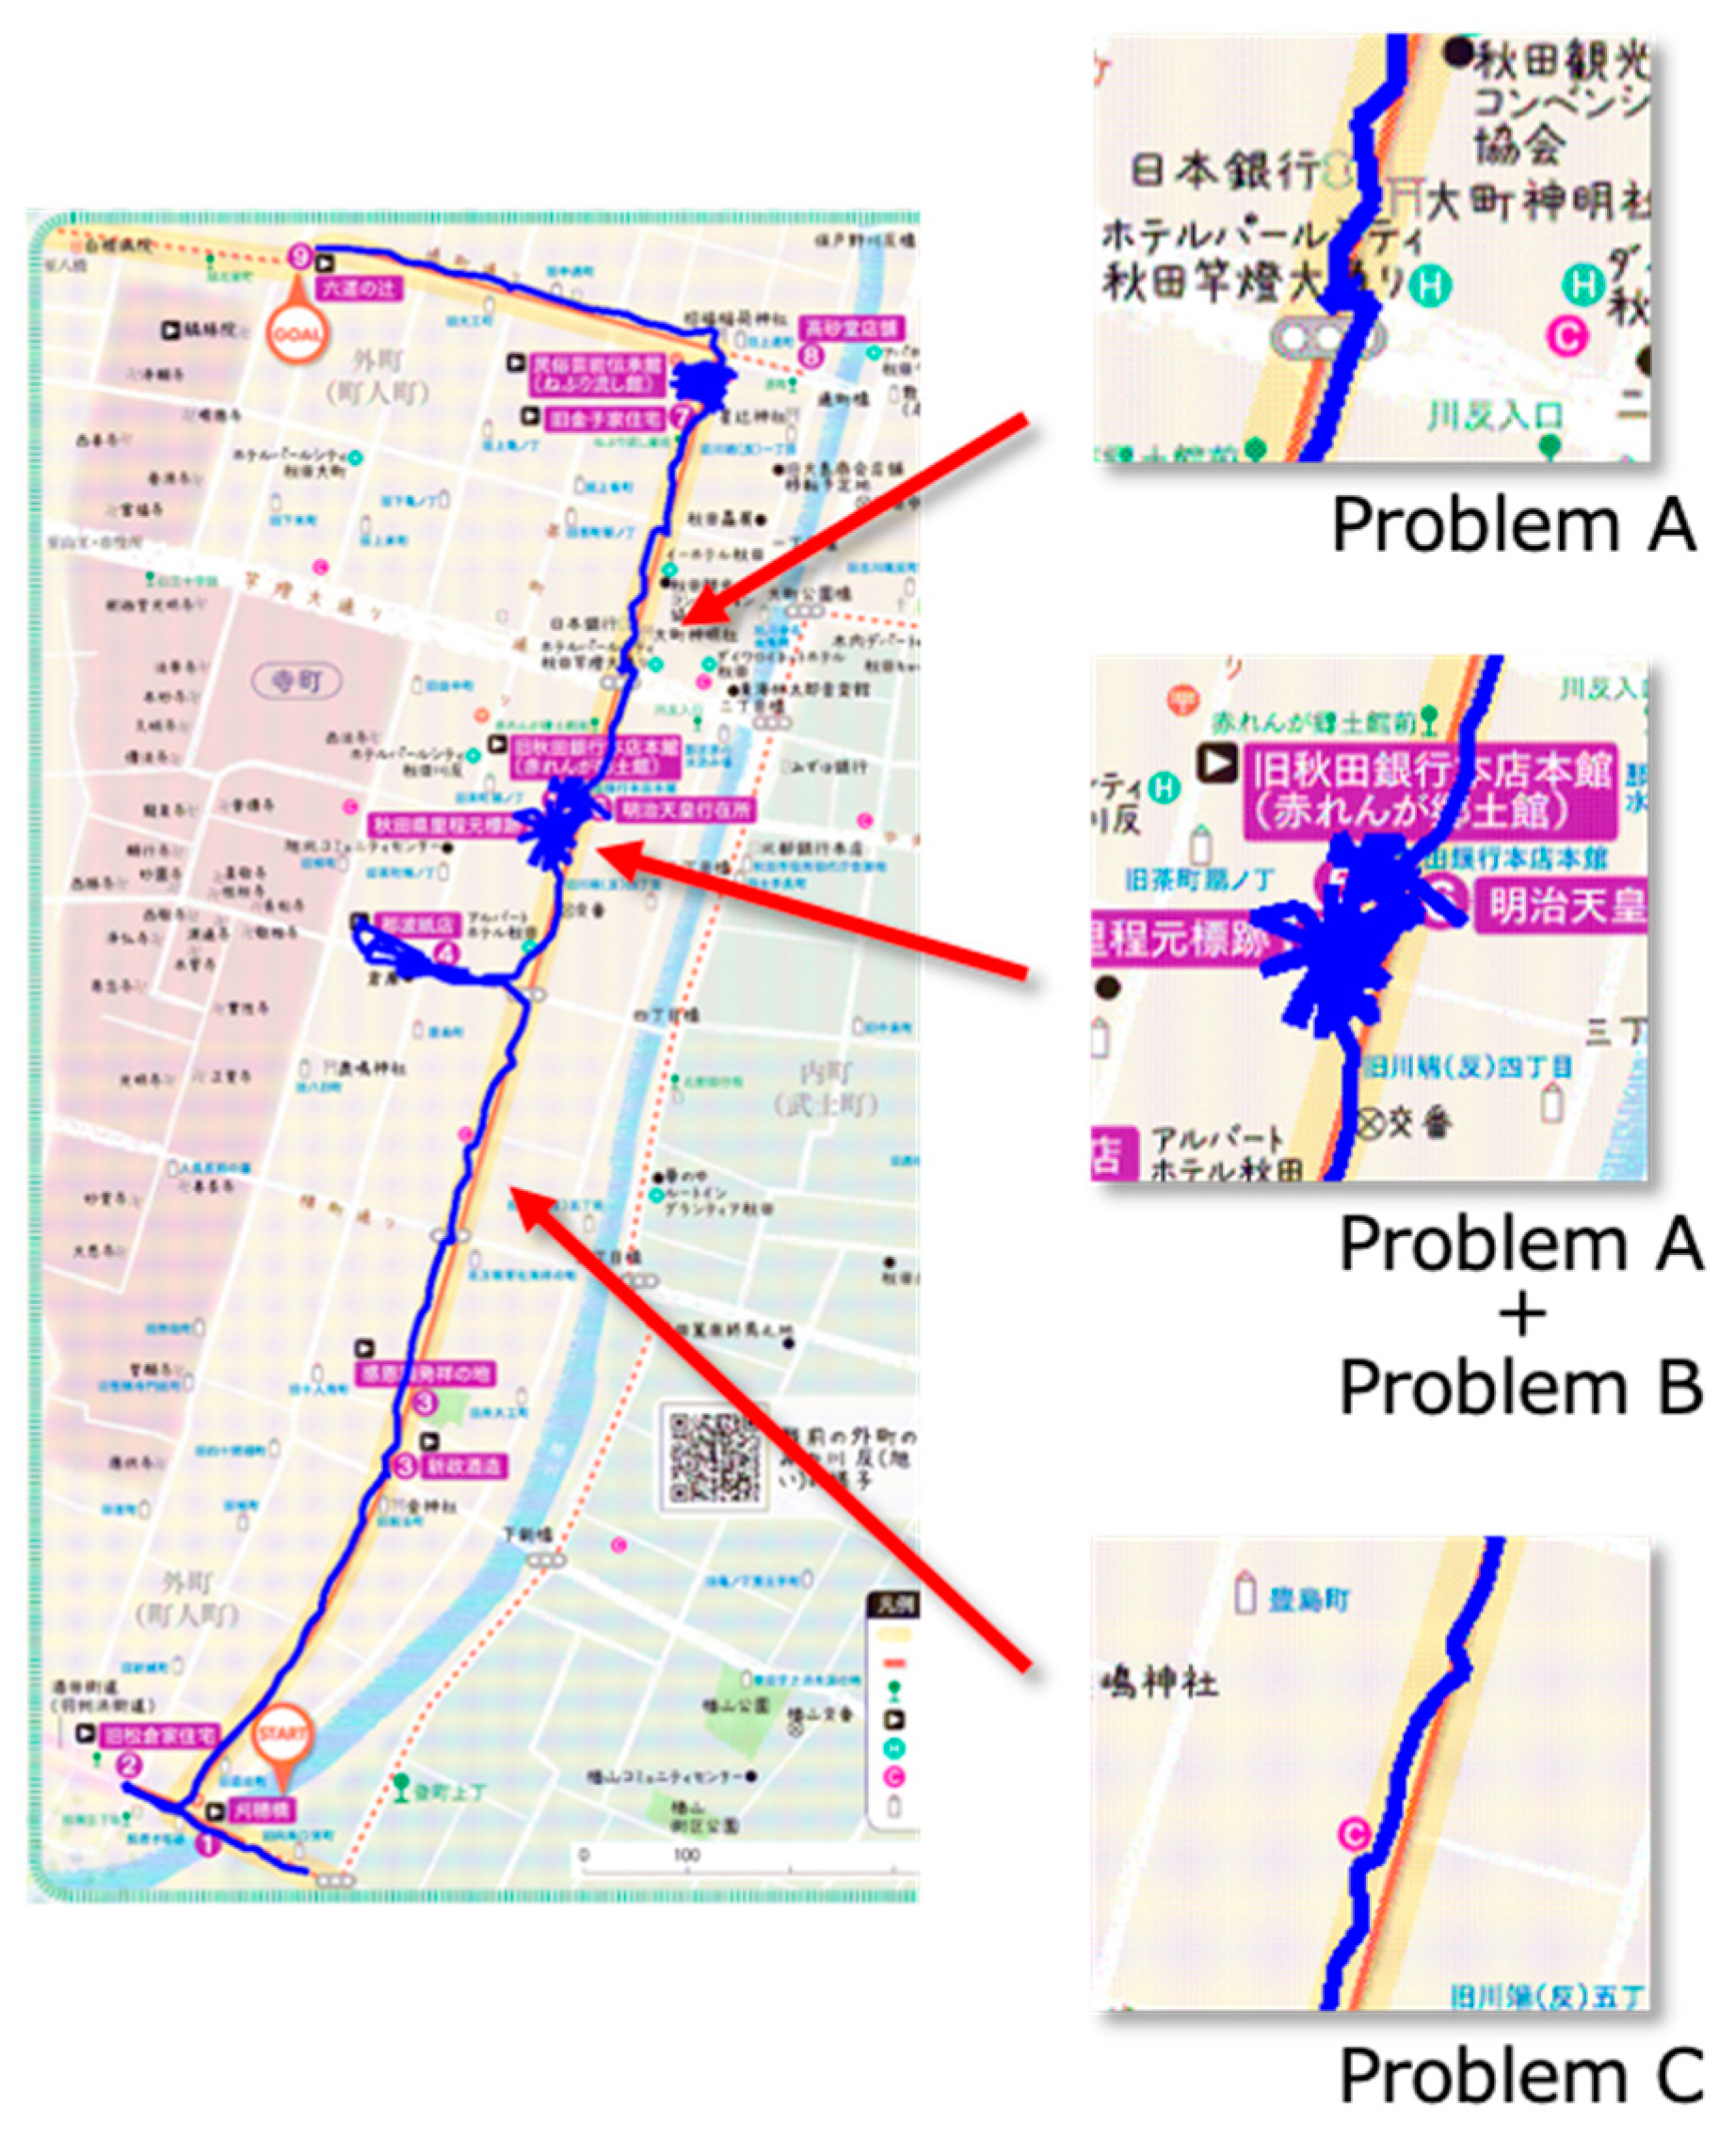
Figure 3.
Flow of generating articulated trajectory data from raw trajectory data as human-centered readable spatial content.
Figure 3.
Flow of generating articulated trajectory data from raw trajectory data as human-centered readable spatial content.

Figure 4.
Algorithm for extracting a set of indoor location points from the trajectory data using GPS horizontal accuracy values.
Figure 4.
Algorithm for extracting a set of indoor location points from the trajectory data using GPS horizontal accuracy values.

Figure 5.
Generating a center point representing an indoor location from multiple indoor points using a minimum bounding box.
Figure 5.
Generating a center point representing an indoor location from multiple indoor points using a minimum bounding box.

Figure 6.
Examples of horizontal GPS errors while walking. The duration from the 10th point to the 58th point shows that a user had remained indoors.
Figure 6.
Examples of horizontal GPS errors while walking. The duration from the 10th point to the 58th point shows that a user had remained indoors.
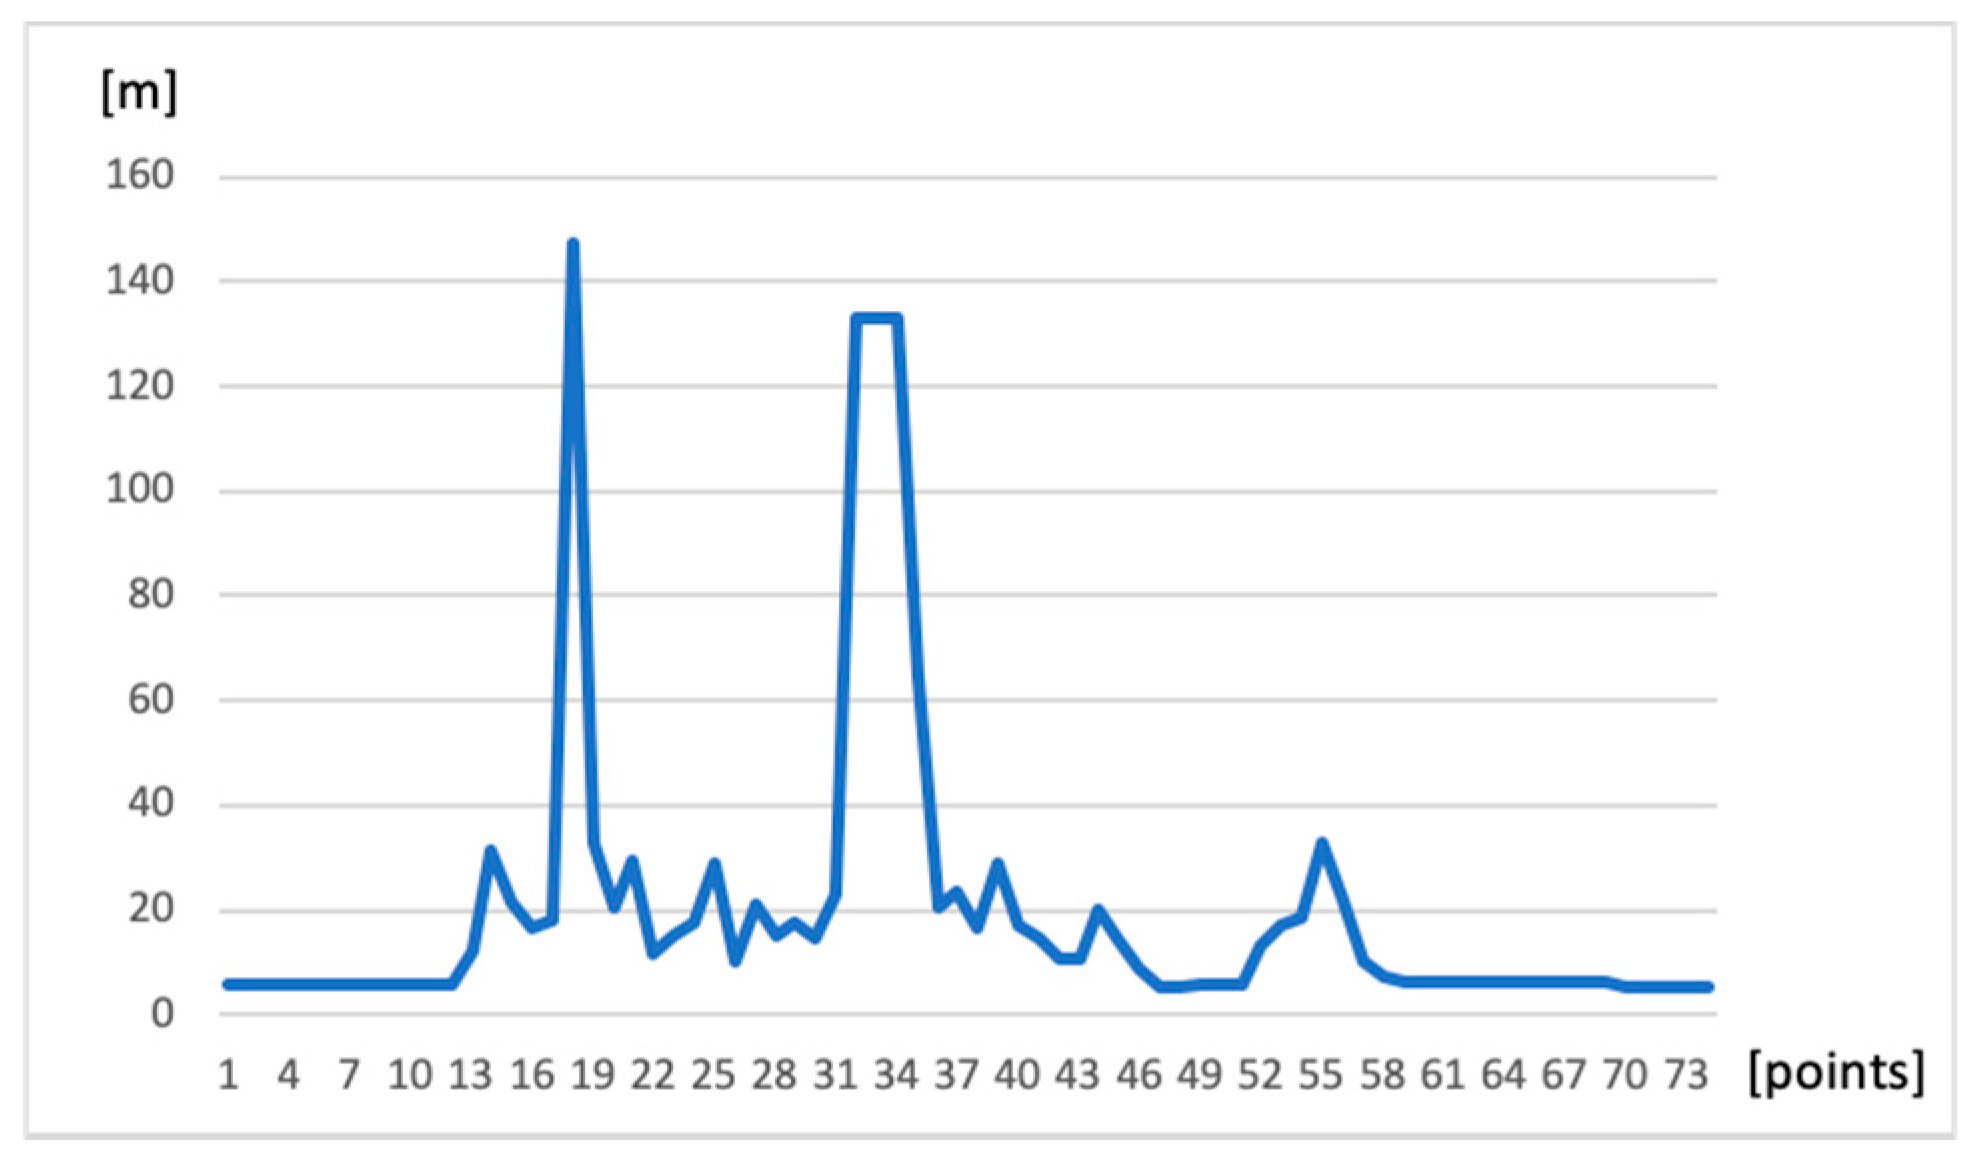
Figure 7.
Improved algorithm for extracting a set of points of staying from trajectory data using GPS horizontal accuracy values (including tolerant distance buffering).
Figure 7.
Improved algorithm for extracting a set of points of staying from trajectory data using GPS horizontal accuracy values (including tolerant distance buffering).

Figure 8.
Algorithm for extracting a set of stopping points from trajectory data using an acceleration sensor.
Figure 8.
Algorithm for extracting a set of stopping points from trajectory data using an acceleration sensor.

Figure 9.
Example of changes in acceleration values with a low-pass filter (a tester repeated ten walking steps and then stopped for five seconds three times. This test suggested that can be set to around 0.15 [G]).
Figure 9.
Example of changes in acceleration values with a low-pass filter (a tester repeated ten walking steps and then stopped for five seconds three times. This test suggested that can be set to around 0.15 [G]).

Figure 10.
The process of the Douglas–Peucker algorithm.

Figure 11.
Illustrated map that examinees used in this experiment (Tomachi Area (traditional downtown area), Akita City, Japan).
Figure 11.
Illustrated map that examinees used in this experiment (Tomachi Area (traditional downtown area), Akita City, Japan).

Figure 12.
(a) Raw trajectory mapping, (b) articulated trajectory mapping (blue line: trajectory; blue round label with emoji: point of UGC, e.g., photos and textual notes; star label: point of staying).
Figure 12.
(a) Raw trajectory mapping, (b) articulated trajectory mapping (blue line: trajectory; blue round label with emoji: point of UGC, e.g., photos and textual notes; star label: point of staying).
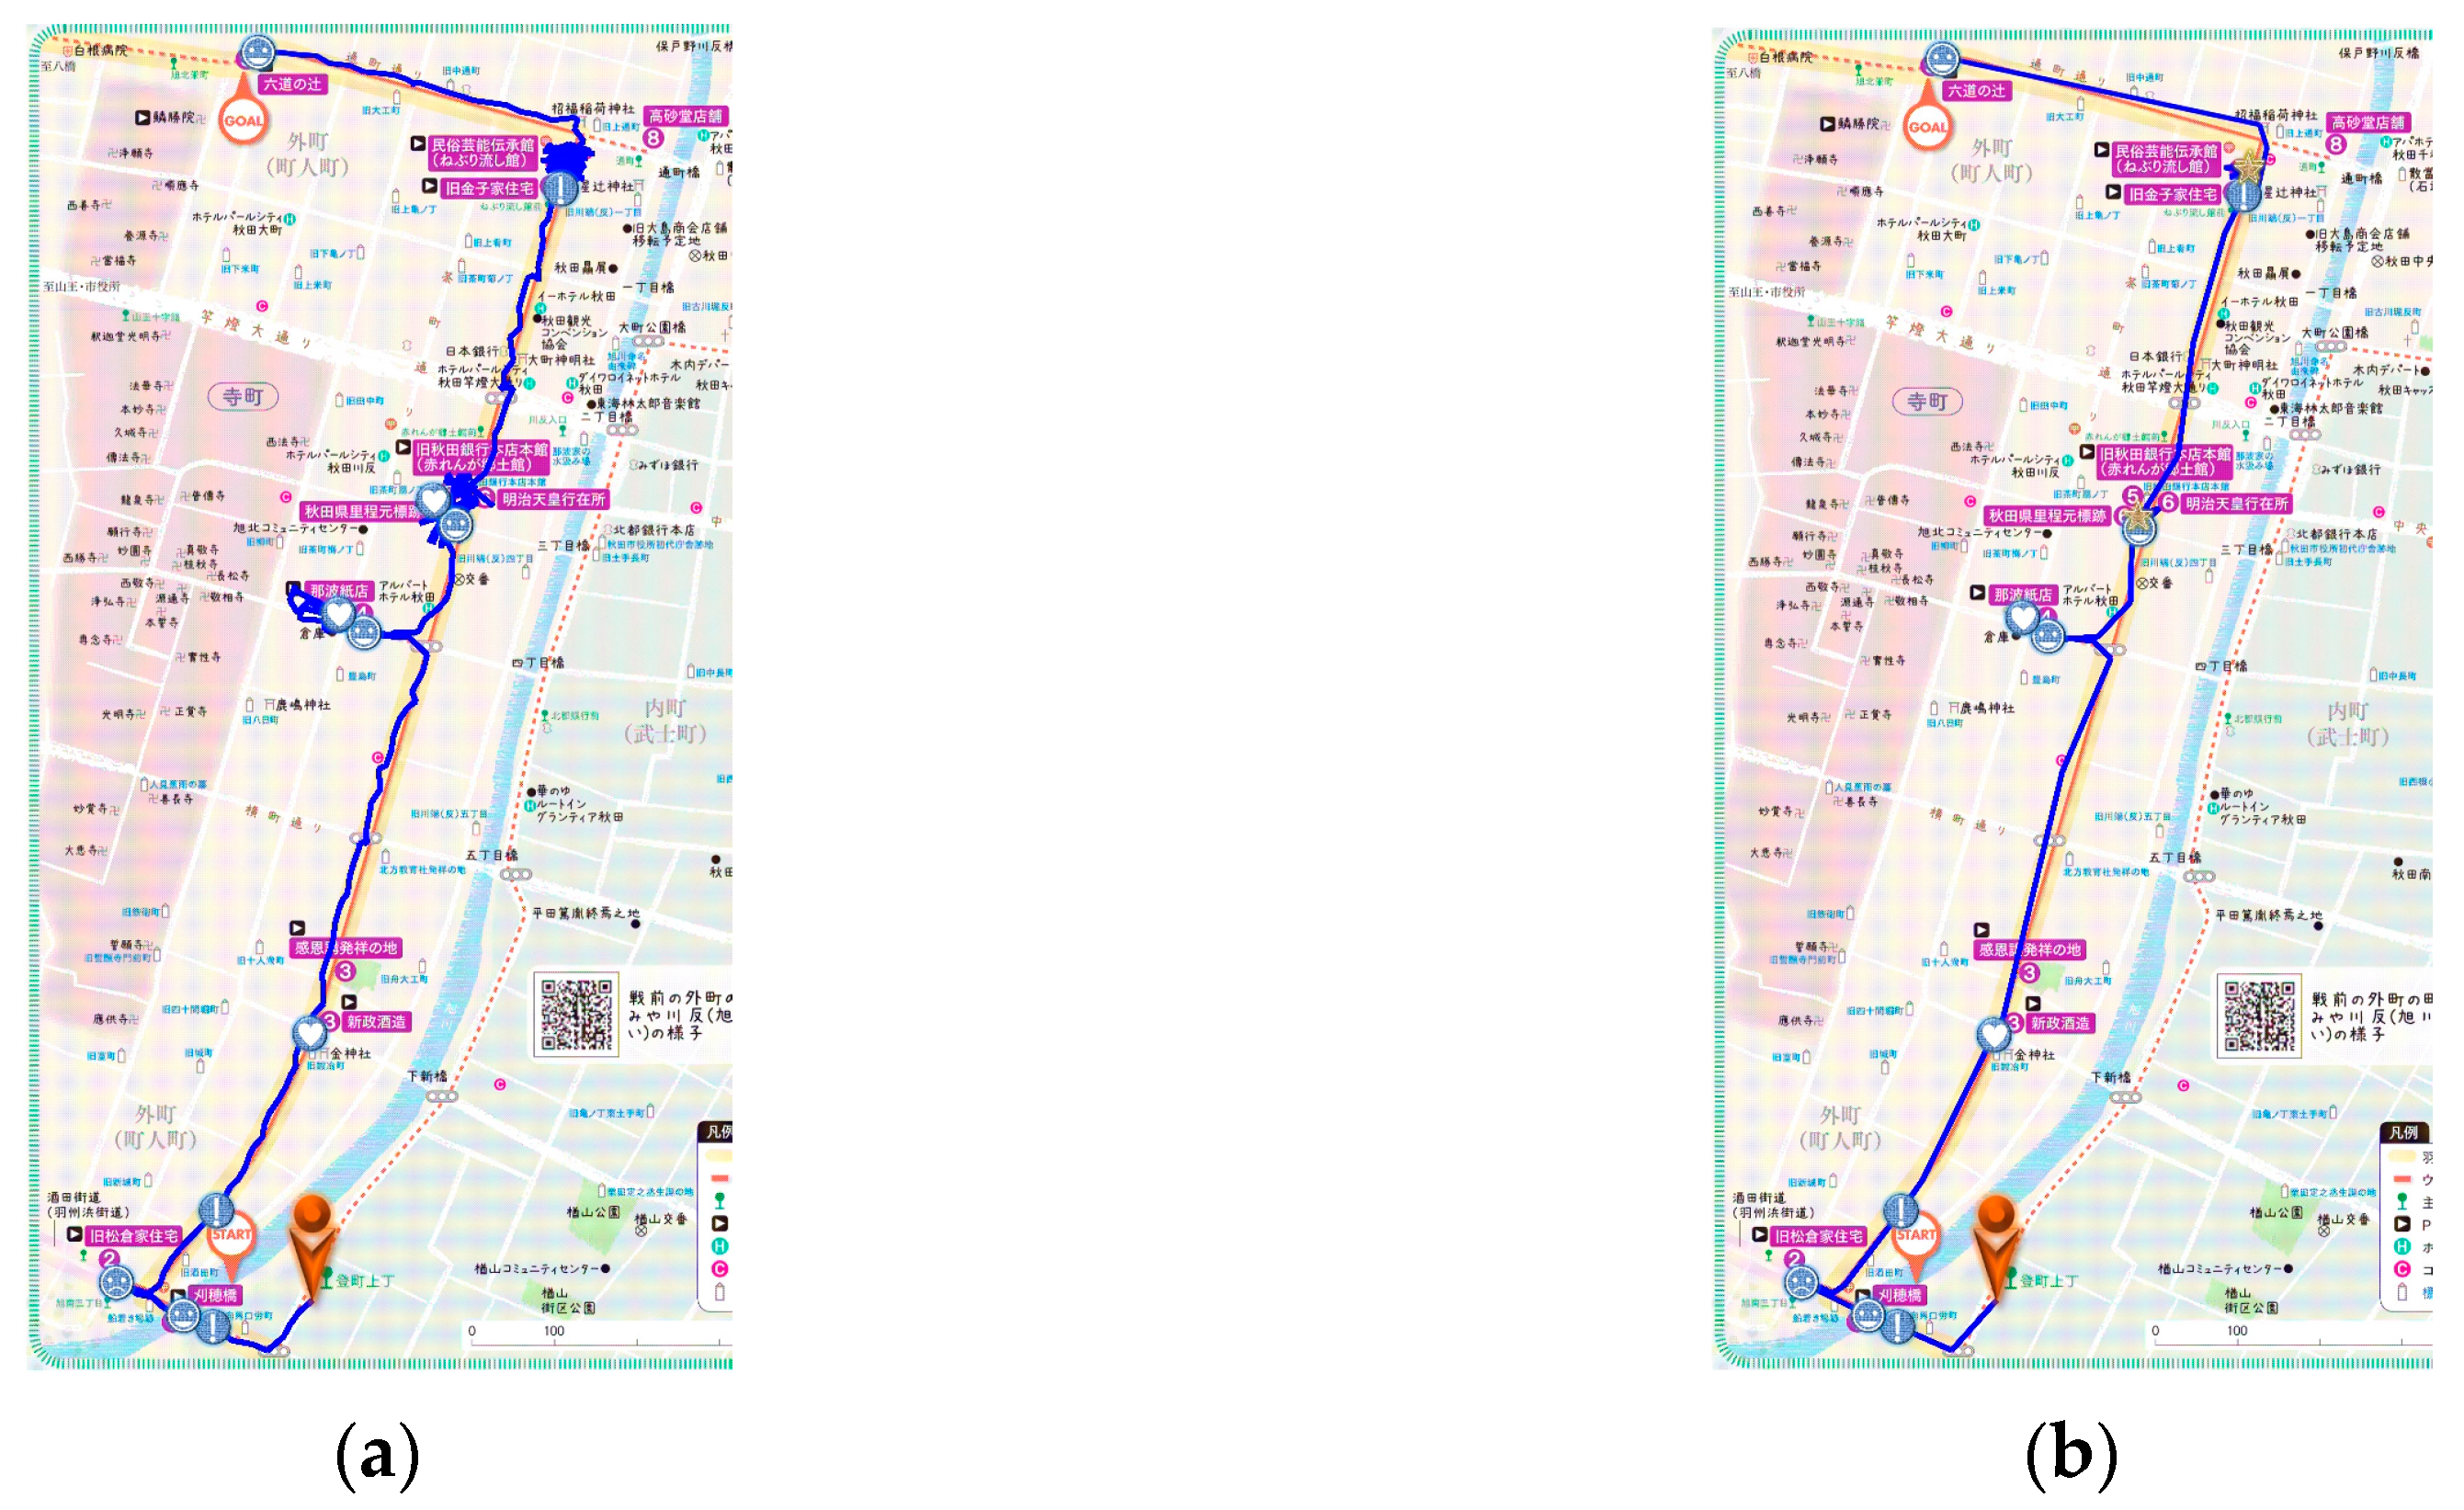
Figure 13.
Results at which points of staying indoors were recognized with two different threshold settings, i.e., (left) and (right).
Figure 13.
Results at which points of staying indoors were recognized with two different threshold settings, i.e., (left) and (right).

Figure 14.
Examples of variations in the radius of certainty for the location as the horizontal GPS error while a user is staying indoors. is set as the threshold, and the graph does not display values higher than . The duration from the 151st to the 313rd point actually represents the situation of a user being indoors. However, several parts shift below the threshold even if a user is moving indoors.
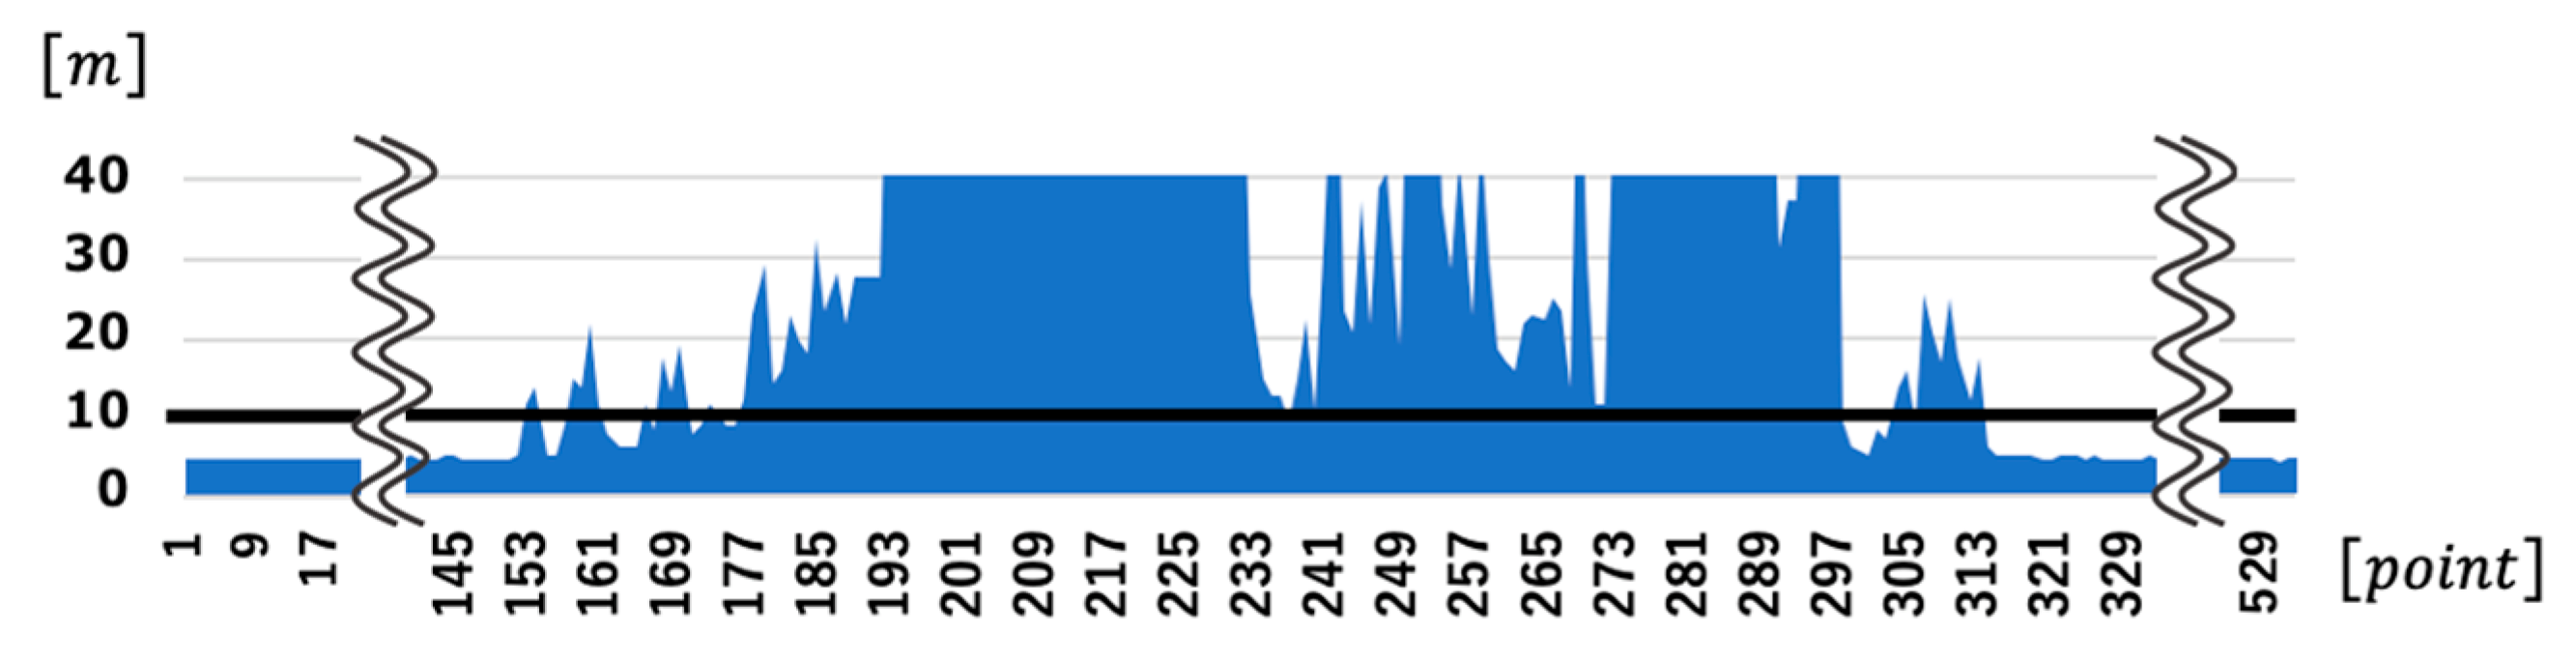
Figure 15.
Examples of effectiveness in articulated trajectory mapping. User experiments for testing articulated trajectory mapping reveal its ability to be reviewed and played back after walking tours.
Figure 15.
Examples of effectiveness in articulated trajectory mapping. User experiments for testing articulated trajectory mapping reveal its ability to be reviewed and played back after walking tours.

Figure 16.
Experimental data of three cases with variations of acceleration sensors’ values. Light green areas indicate the durations corresponding to tangled trajectory lines when users were stopping outdoors, e.g., waiting for traffic signals.
Figure 16.
Experimental data of three cases with variations of acceleration sensors’ values. Light green areas indicate the durations corresponding to tangled trajectory lines when users were stopping outdoors, e.g., waiting for traffic signals.

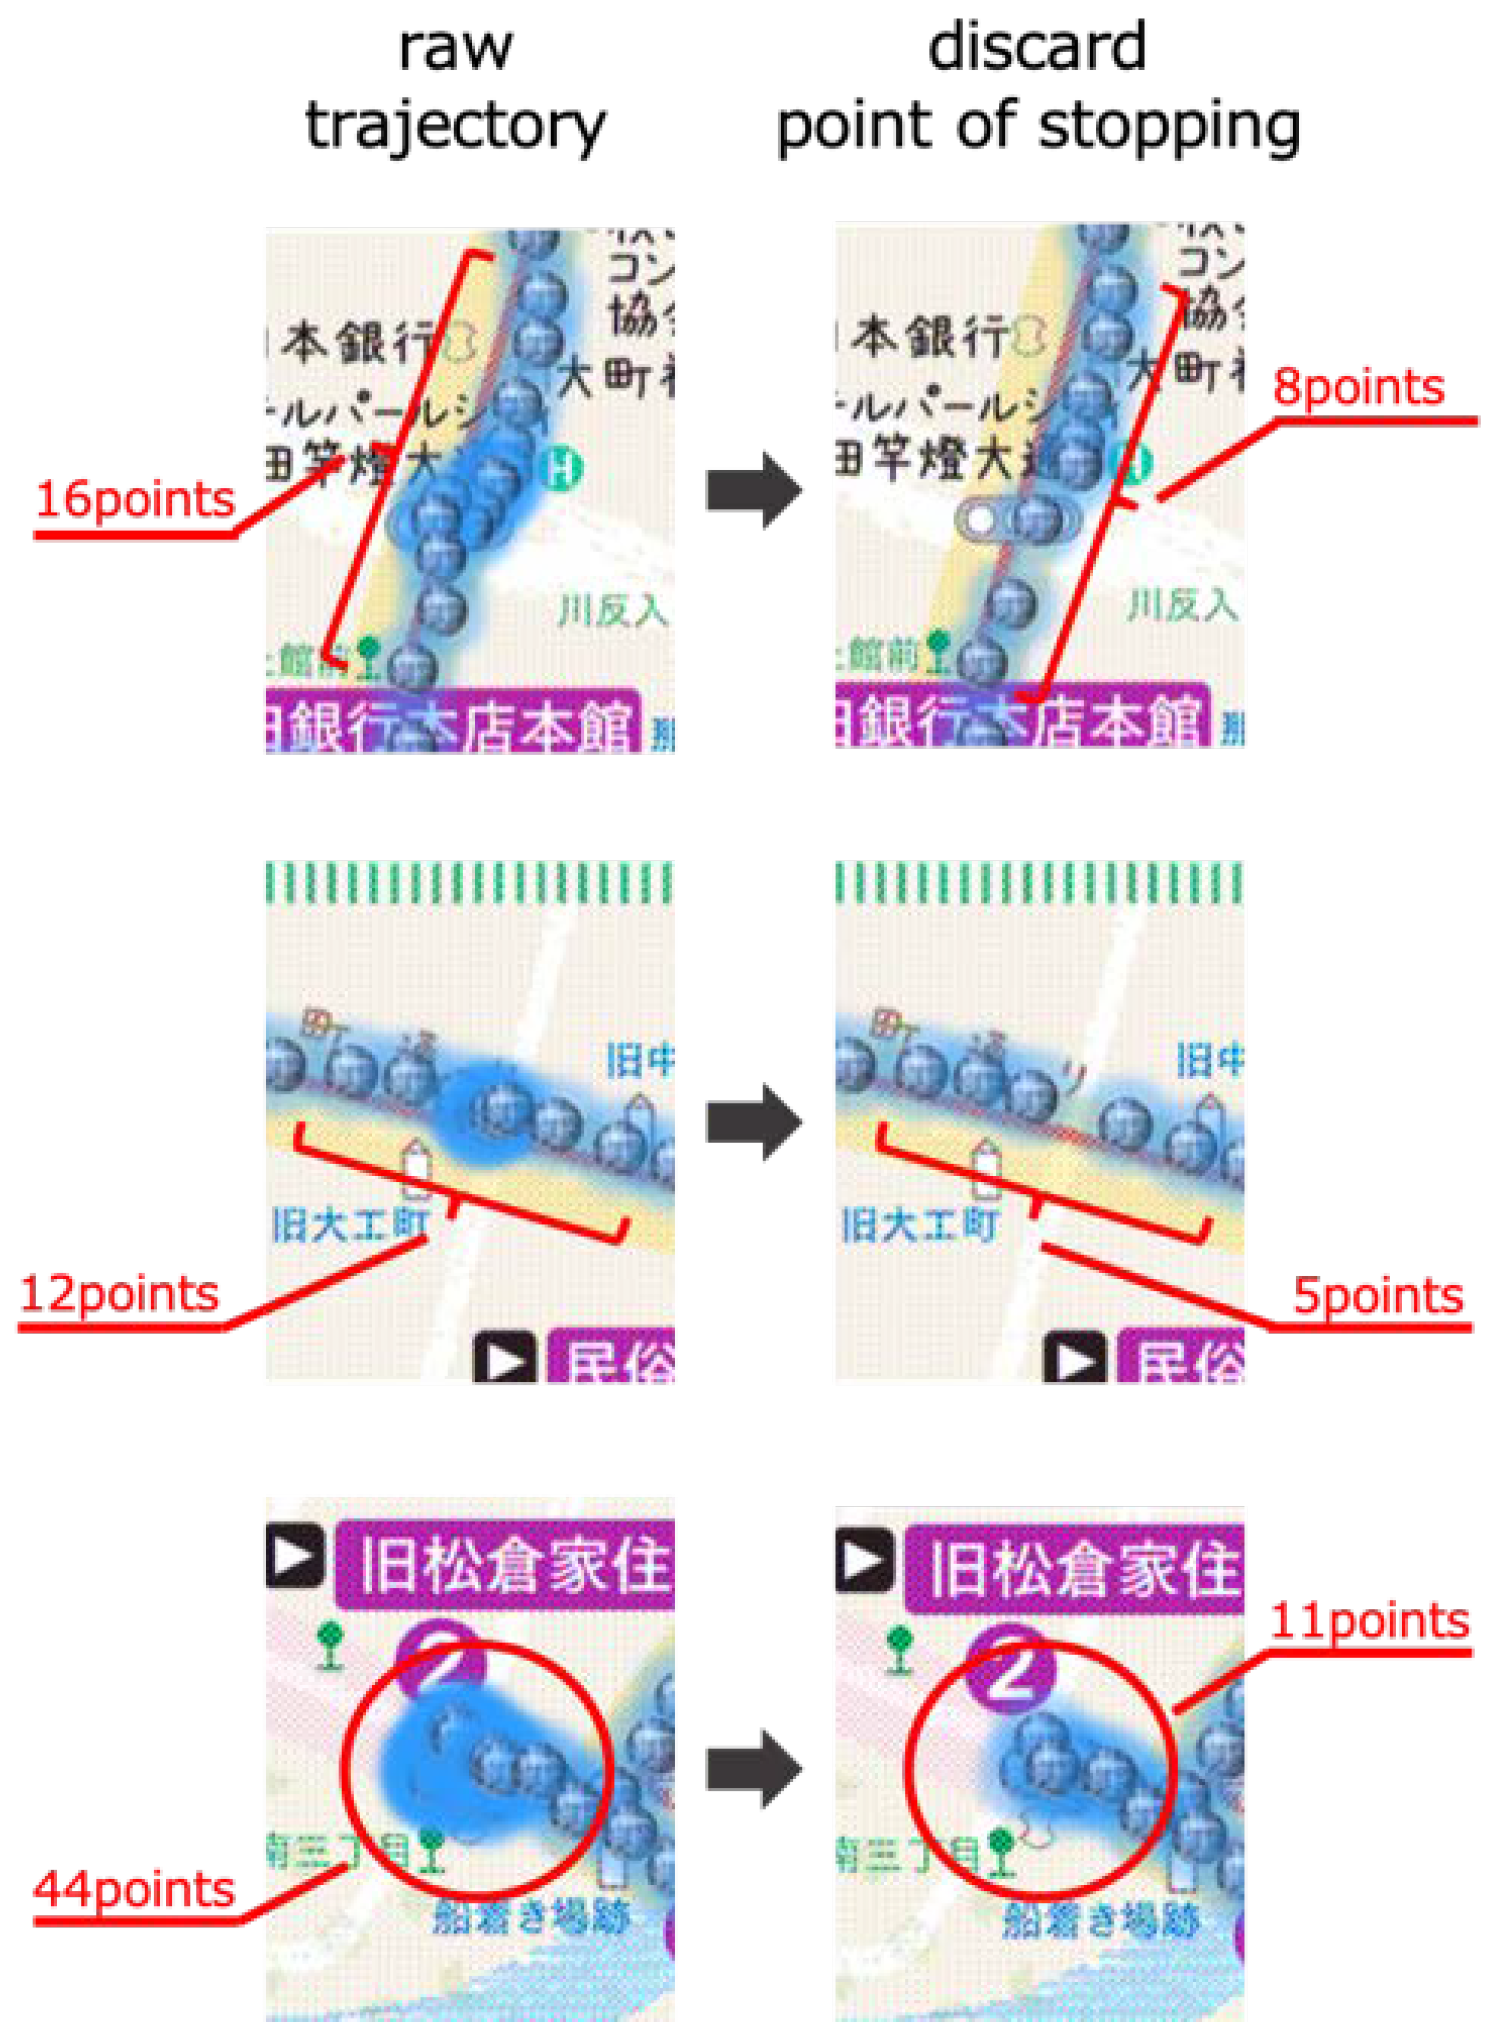
Figure 17.
Examples of recognizing walking and stopping with the acceleration sensors’ threshold value set at . Blue dots show every 15-second point of a user’s trajectory data. Simplified trajectory data are effective in reviewing and playing back a user’s trajectory on the screen.
Figure 17.
Examples of recognizing walking and stopping with the acceleration sensors’ threshold value set at . Blue dots show every 15-second point of a user’s trajectory data. Simplified trajectory data are effective in reviewing and playing back a user’s trajectory on the screen.

Figure 18.
Pedestrian subway.

Figure 19.
Typical architectural style of a Japanese sweets shop.

Figure 20.
Locations of the points of interest (POIs) that appears in this paper.

Table 1.
Correspondence table between issues needing resolution and our conceptual approaches.
| Issue | Approaches |
|---|---|
| Problem A: Tangled Trajectory Line | [simplification] Discard from trajectory. |
| Problem B: Inaccurate Indoor Positioning | [characterization] Abstract a point of staying. |
| Problem C: Unstable Trajectory Line | [simplification] Conventional algorithms [7,8] are possible solutions. |
| Points of UGC (e.g., photos, text) | [characterization] Visualize on a map by a geotag. |
Table 2.
Examinations of , i.e., threshold for judging indoor or outdoor locations using the radius of certainty for the location as the horizontal GPS error according to user experiments. refers to the number of wrong recognitions in points of staying indoors while a user was outdoors. In contrast, represents the number of wrong recognitions in points of not staying indoors, i.e., staying outdoors while a user is still inside but near the outdoors, for example around windows.
Users | 5.0 m | 7.5 m | 10.0 m | 12.5 m | 15.0 m |
|---|---|---|---|---|---|
Publisher’s Note: MDPI stays neutral with regard to jurisdictional claims in published maps and institutional affiliations. |
© 2020 by the authors. Licensee MDPI, Basel, Switzerland. This article is an open access article distributed under the terms and conditions of the Creative Commons Attribution (CC BY) license (http://creativecommons.org/licenses/by/4.0/).
Share and Cite
MDPI and ACS Style
Sasaki, I.; Arikawa, M.; Takahashi, A. Articulated Trajectory Mapping for Reviewing Walking Tours. ISPRS Int. J. Geo-Inf. 2020, 9, 610. https://0-doi-org.brum.beds.ac.uk/10.3390/ijgi9100610
AMA Style
Sasaki I, Arikawa M, Takahashi A. Articulated Trajectory Mapping for Reviewing Walking Tours. ISPRS International Journal of Geo-Information. 2020; 9(10):610. https://0-doi-org.brum.beds.ac.uk/10.3390/ijgi9100610
Chicago/Turabian StyleSasaki, Iori, Masatoshi Arikawa, and Akinori Takahashi. 2020. "Articulated Trajectory Mapping for Reviewing Walking Tours" ISPRS International Journal of Geo-Information 9, no. 10: 610. https://0-doi-org.brum.beds.ac.uk/10.3390/ijgi9100610
Note that from the first issue of 2016, this journal uses article numbers instead of page numbers. See further details here.