Indoor Positioning Method Using WiFi RTT Based on LOS Identification and Range Calibration


Abstract
:1. Introduction
- (1)
- We propose a NLOS and LOS identification method based on scenario recognition. In the proposed NLOS and LOS identification approach, the current positioning scenario needs to be recognized, and then the LOS measuring distance will be obtained by the recognized scenario, which avoids the impact of NLOS distances on positioning accuracy.
- (2)
- A scenario recognition method based on GPR is proposed to recognize the positioning scene, which has no need to collect training data and uses the real distances between smartphones and access points (APs) as the training data.
- (3)
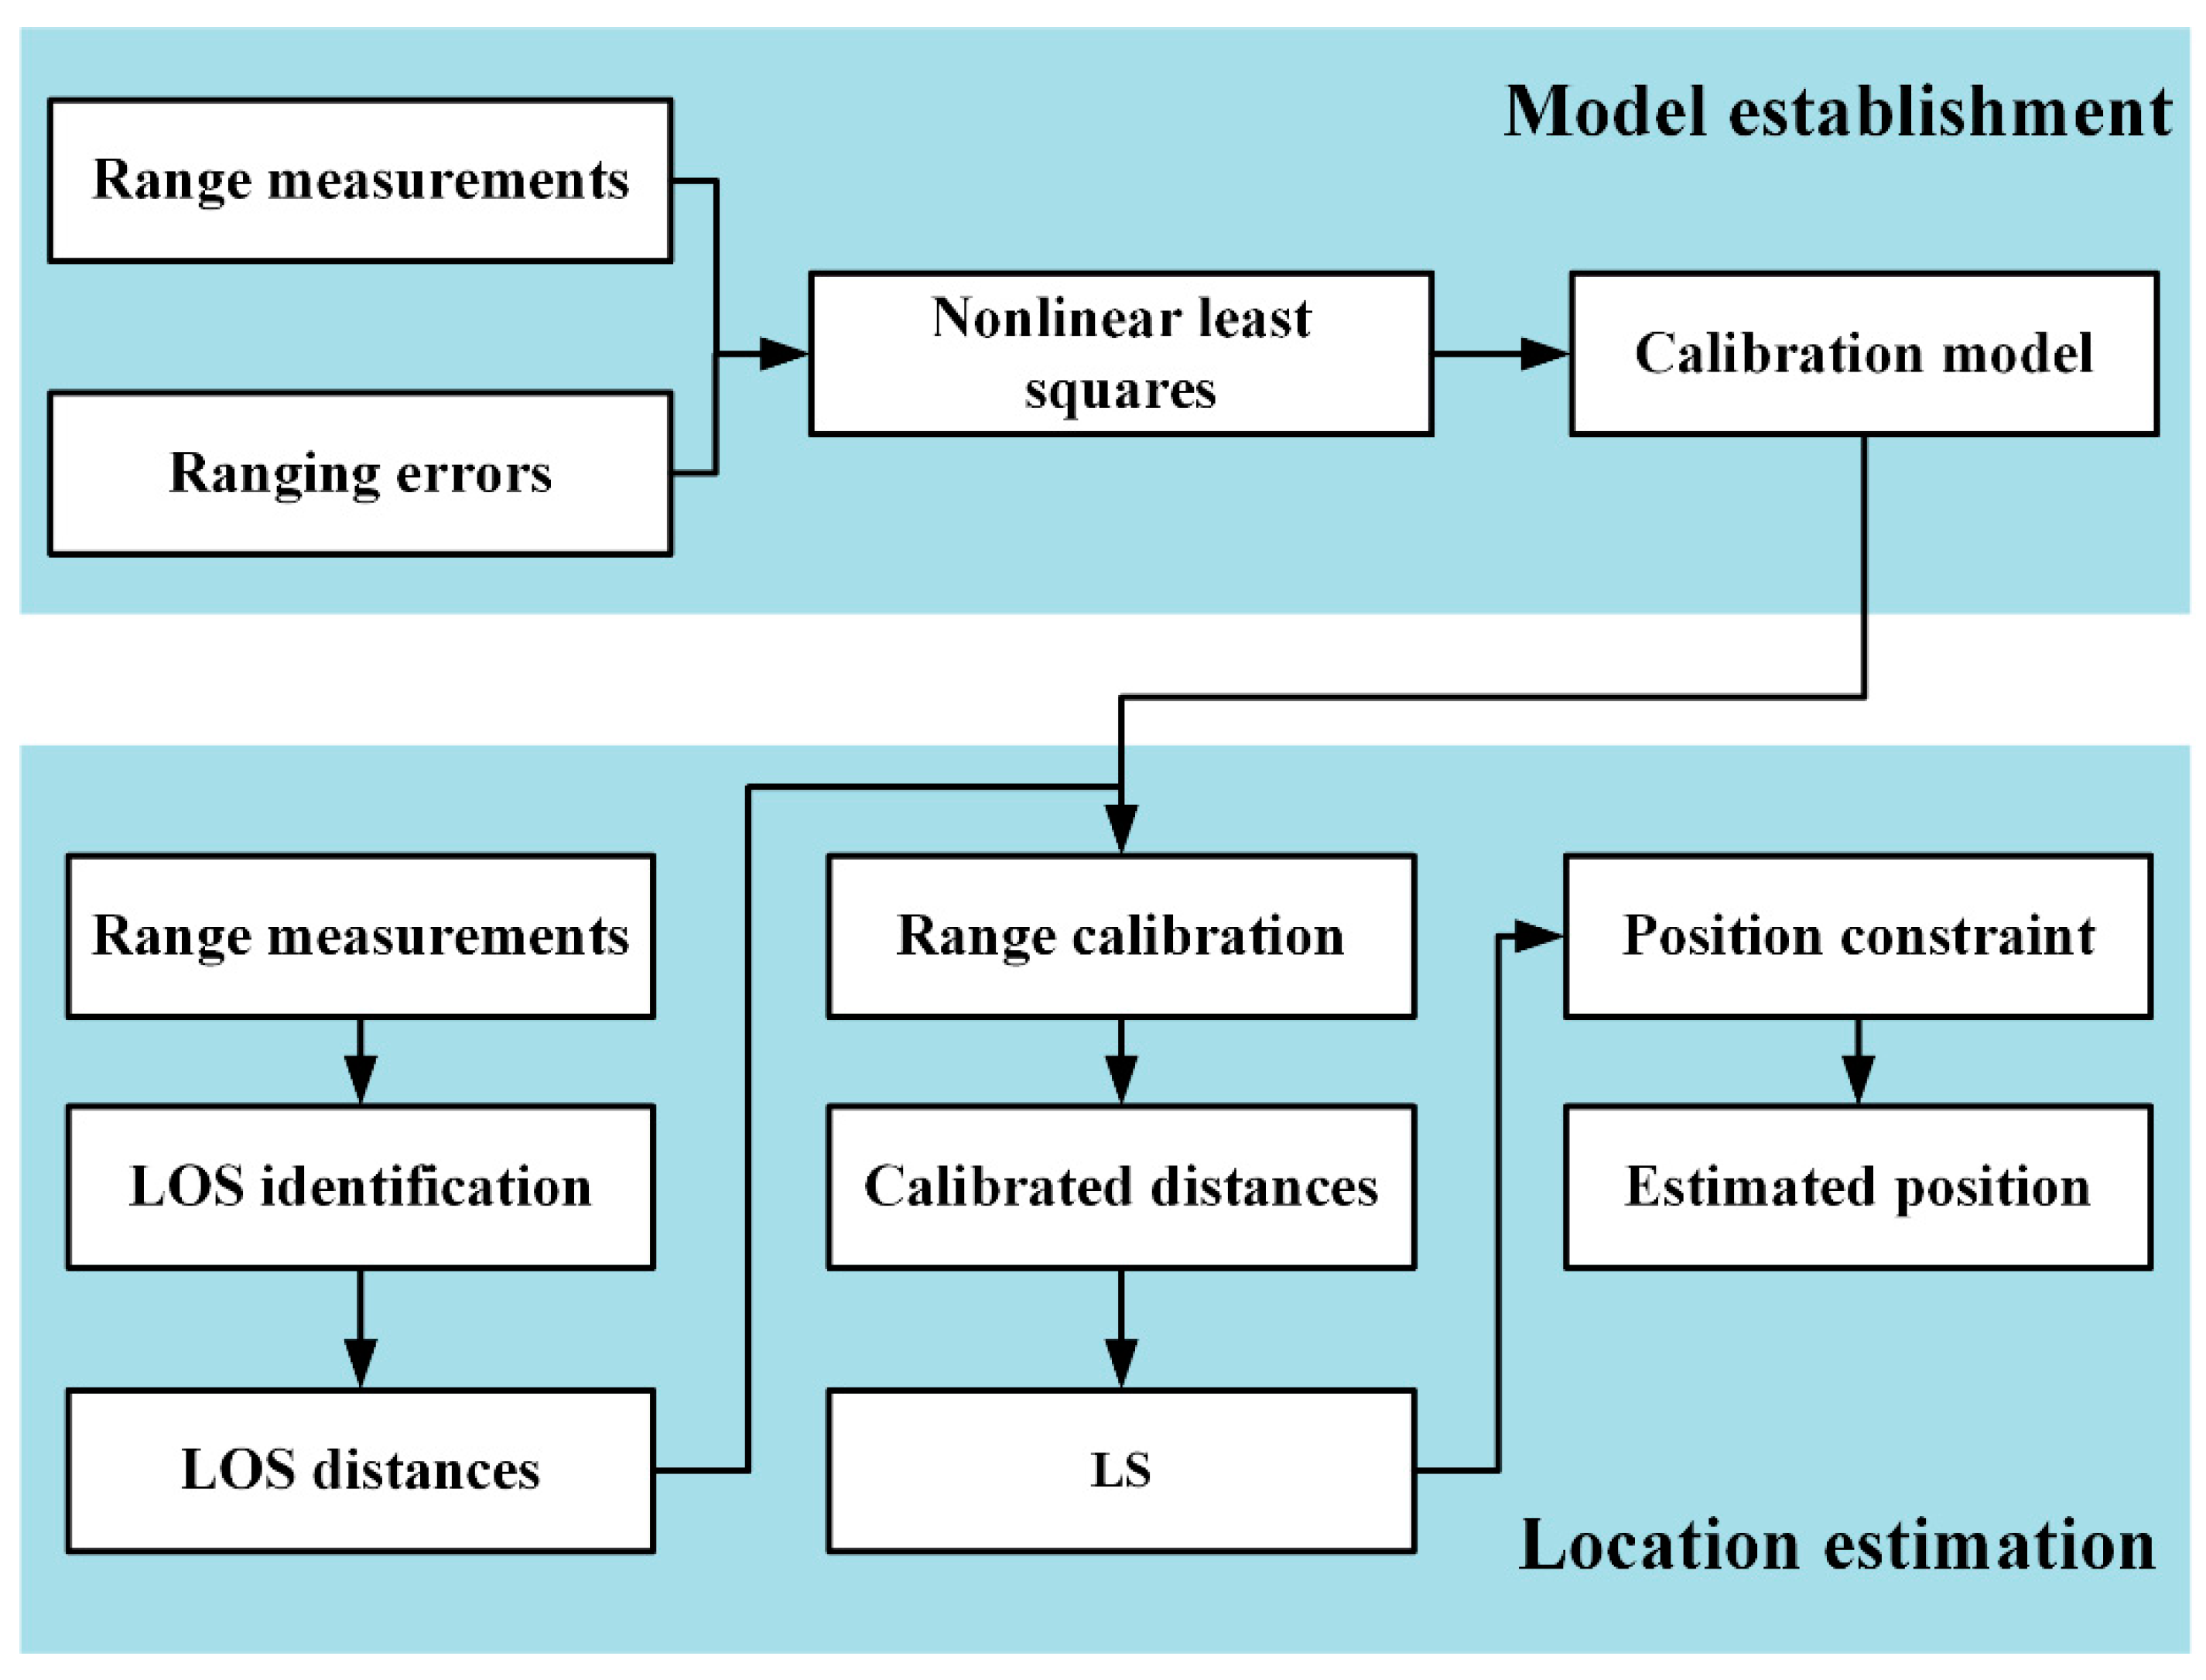
- An easy range calibration model is established to correct the range measurement in the LOS condition, and the position of the smartphone is estimated by these calibrated distances. Then, with the position information of the positioning scenario, the estimated position beyond the scenario is restrained to ensure that it is located in the positioning scene.
2. Related Work
3. Methods
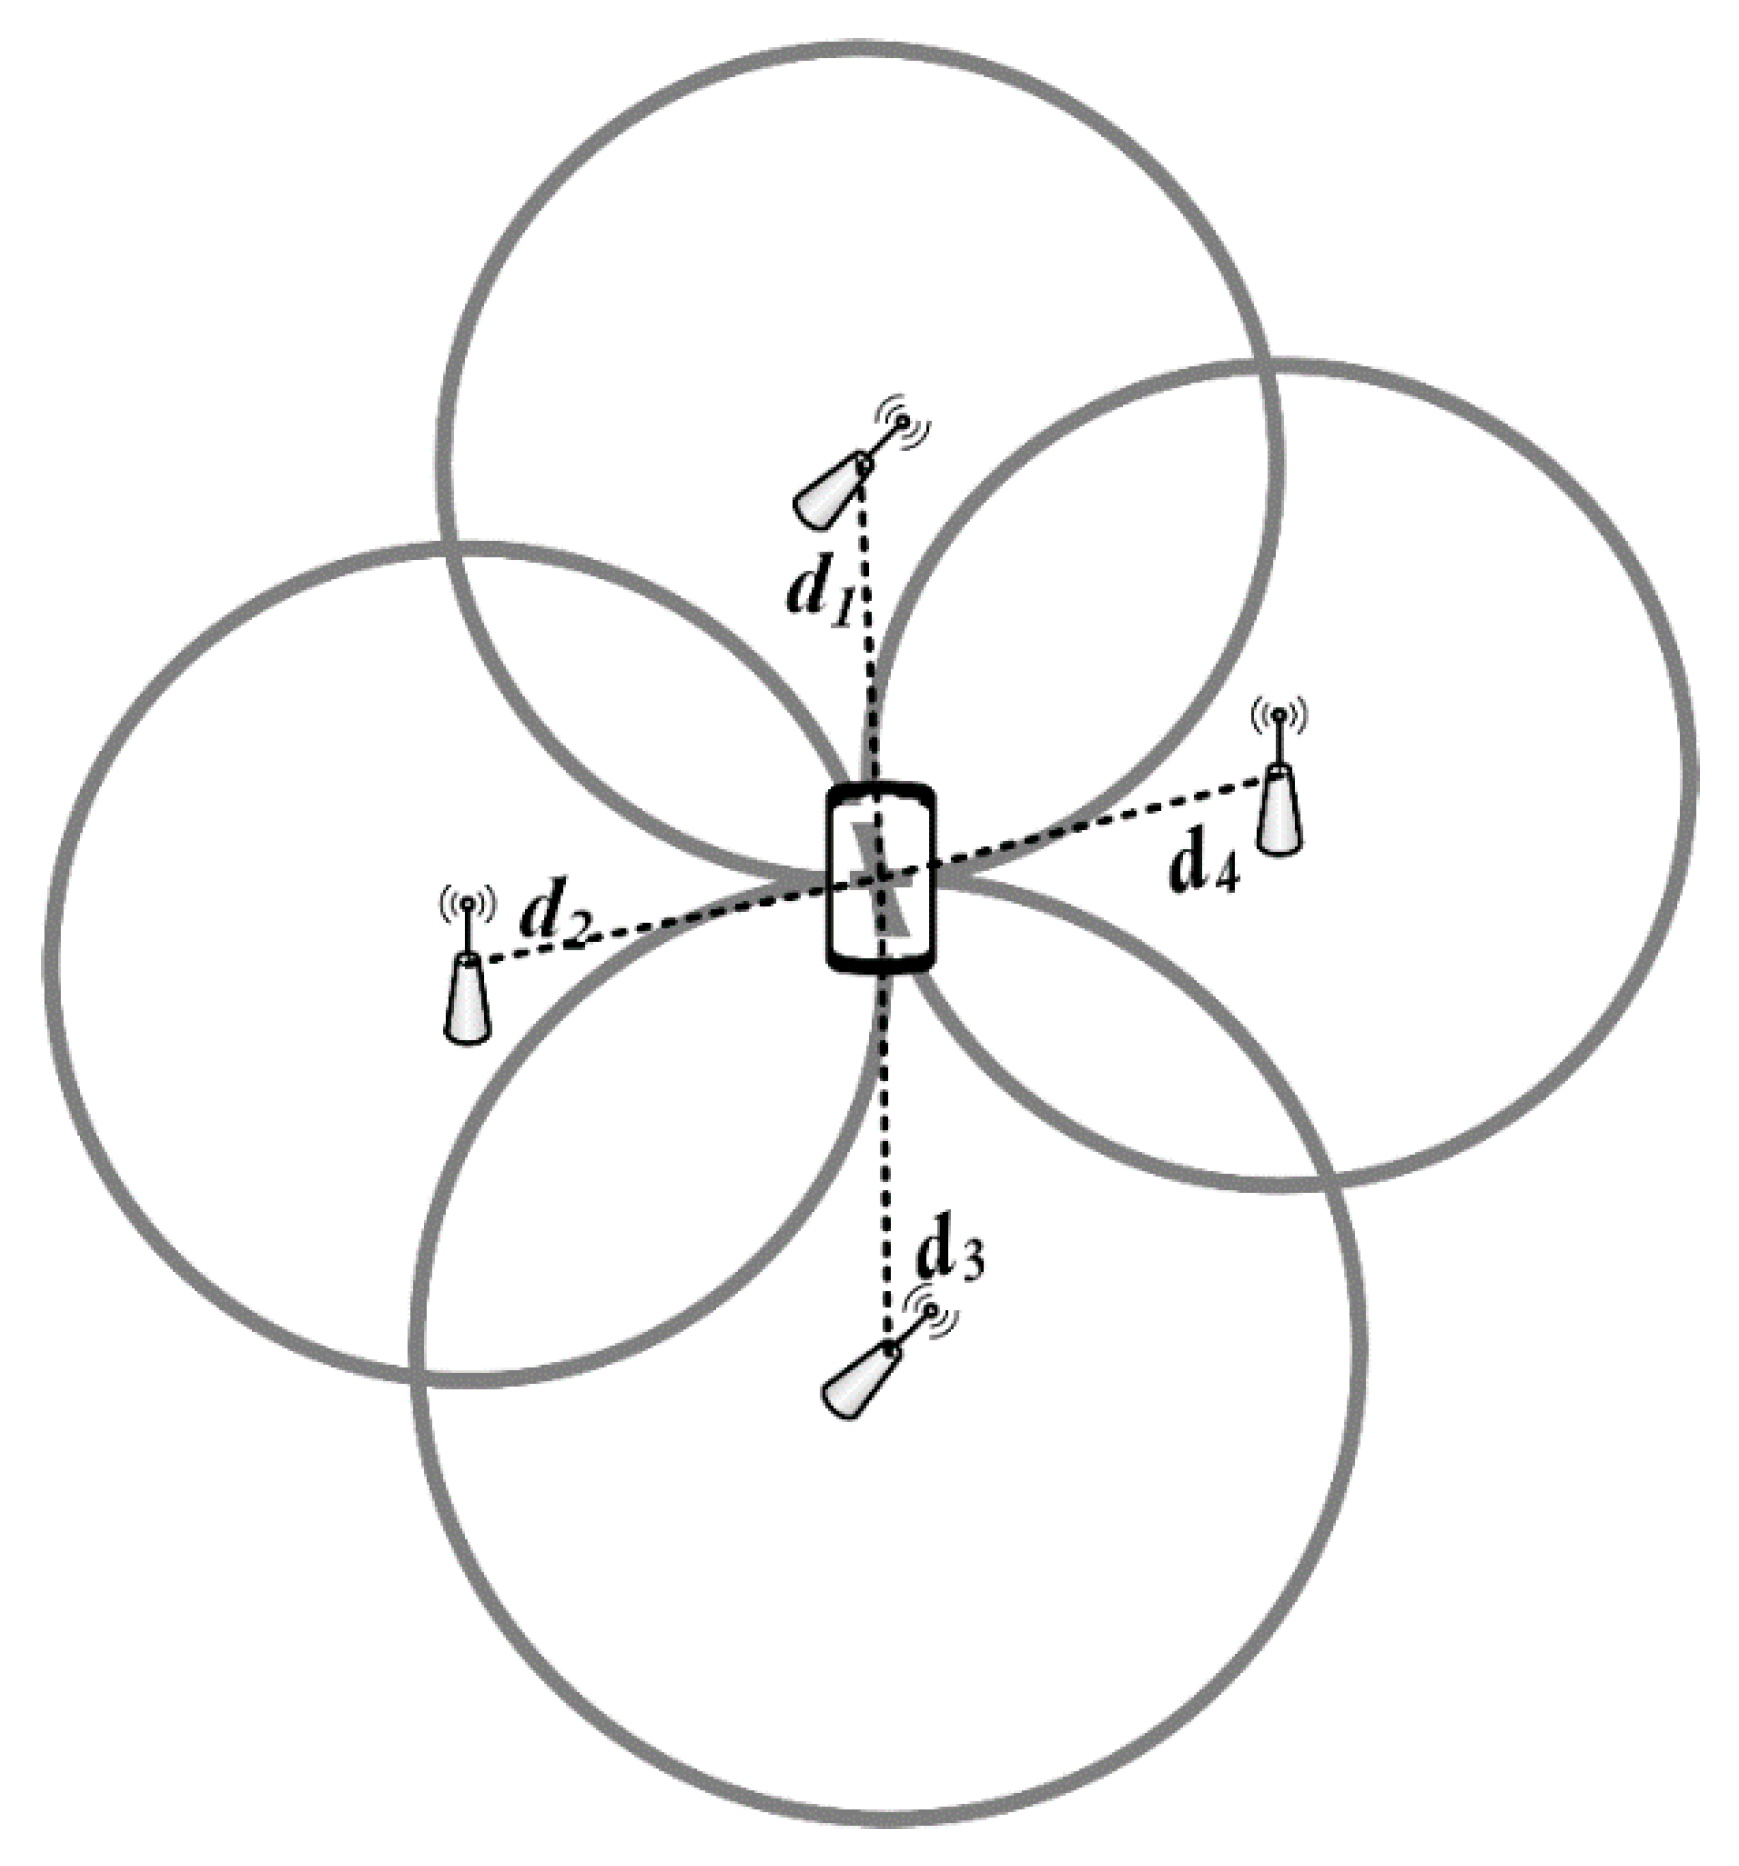
3.1. WiFi RTT
3.2. Least Square Algorithm
4. NLOS and LOS Identification Method
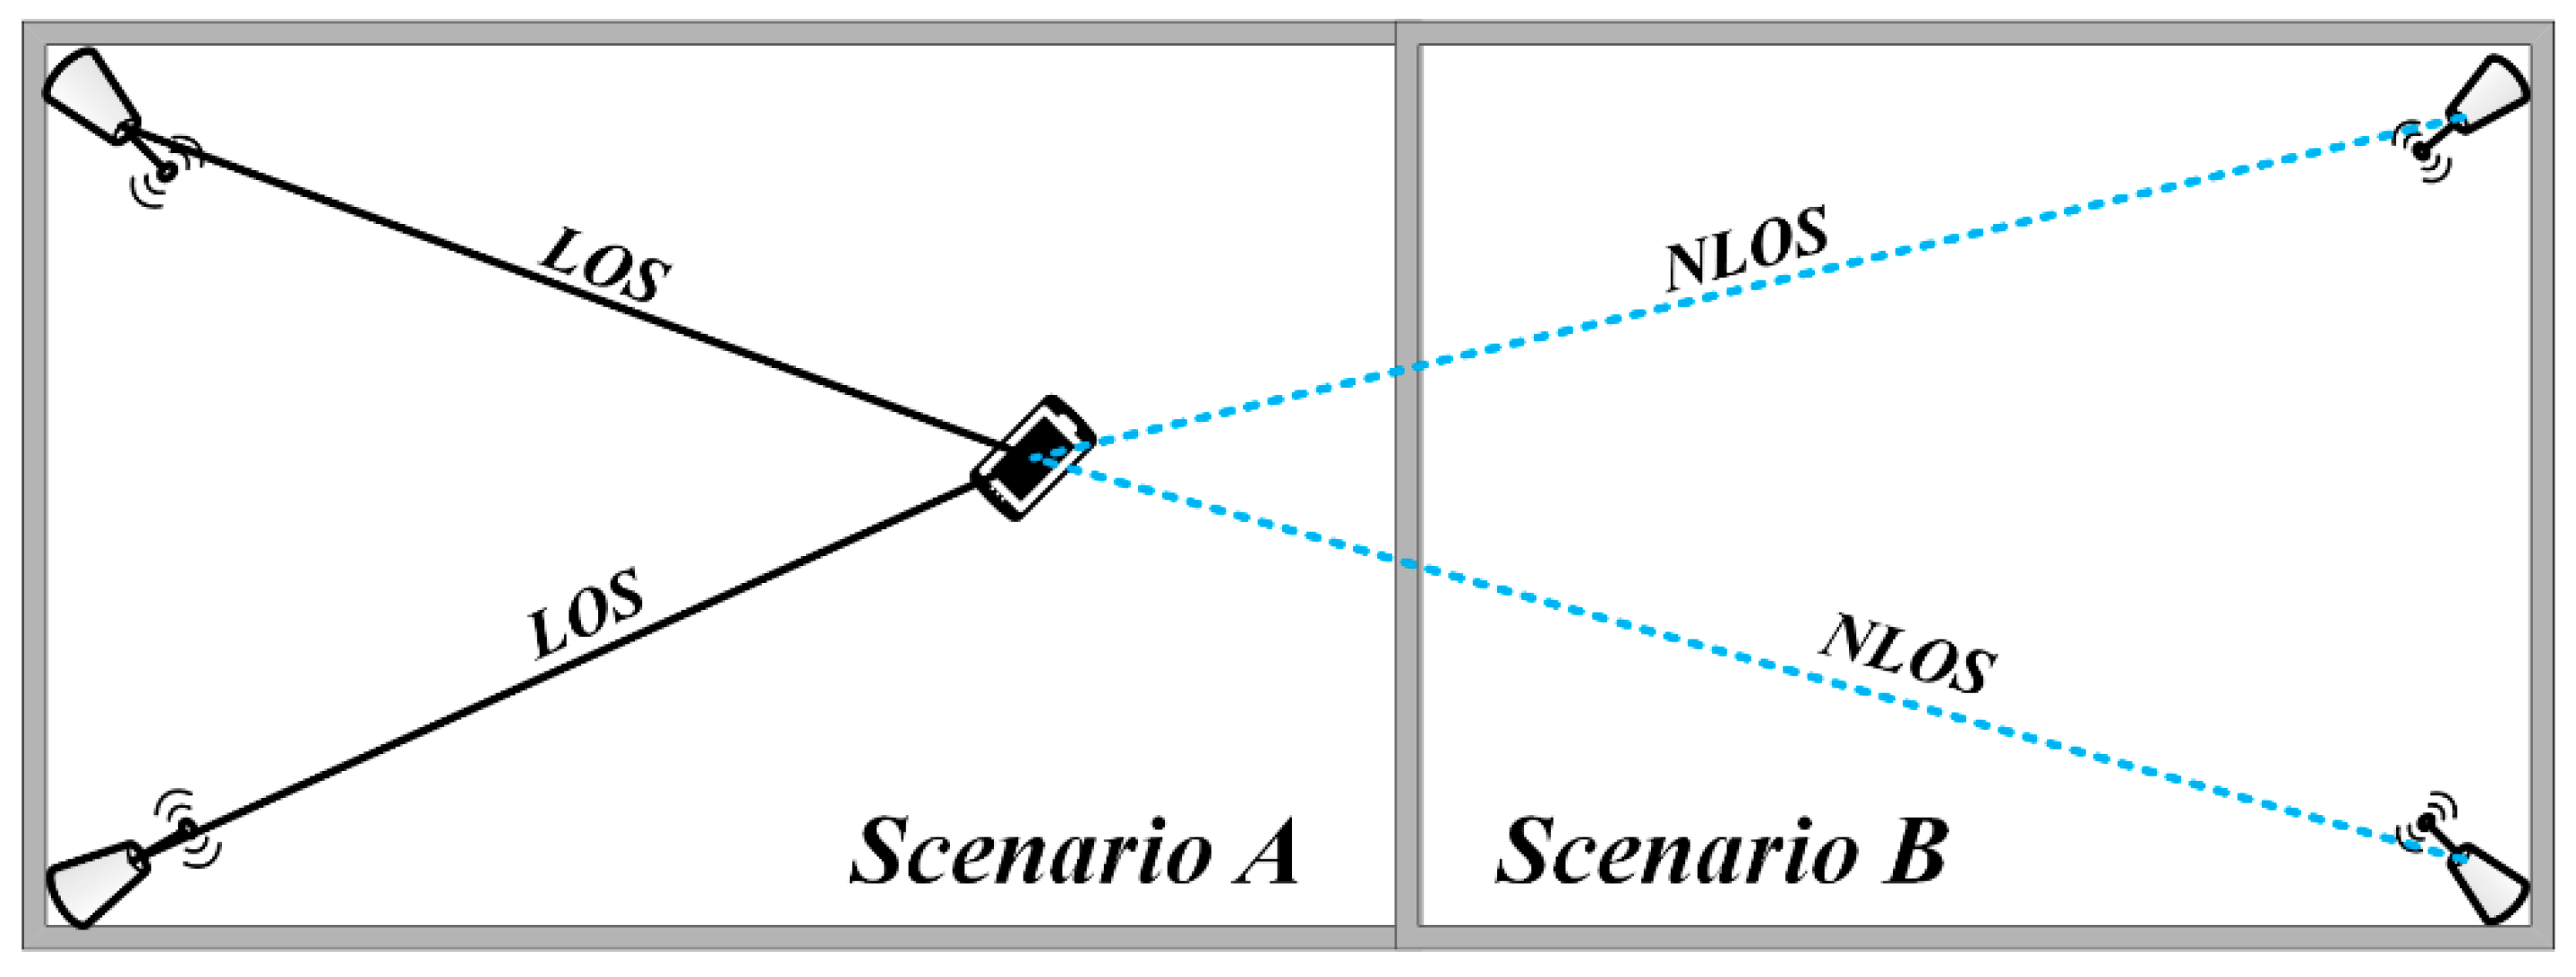
4.1. Scenario, NLOS and LOS Definition
4.2. NLOS and LOS Identification Method Based on Scenario Recognition
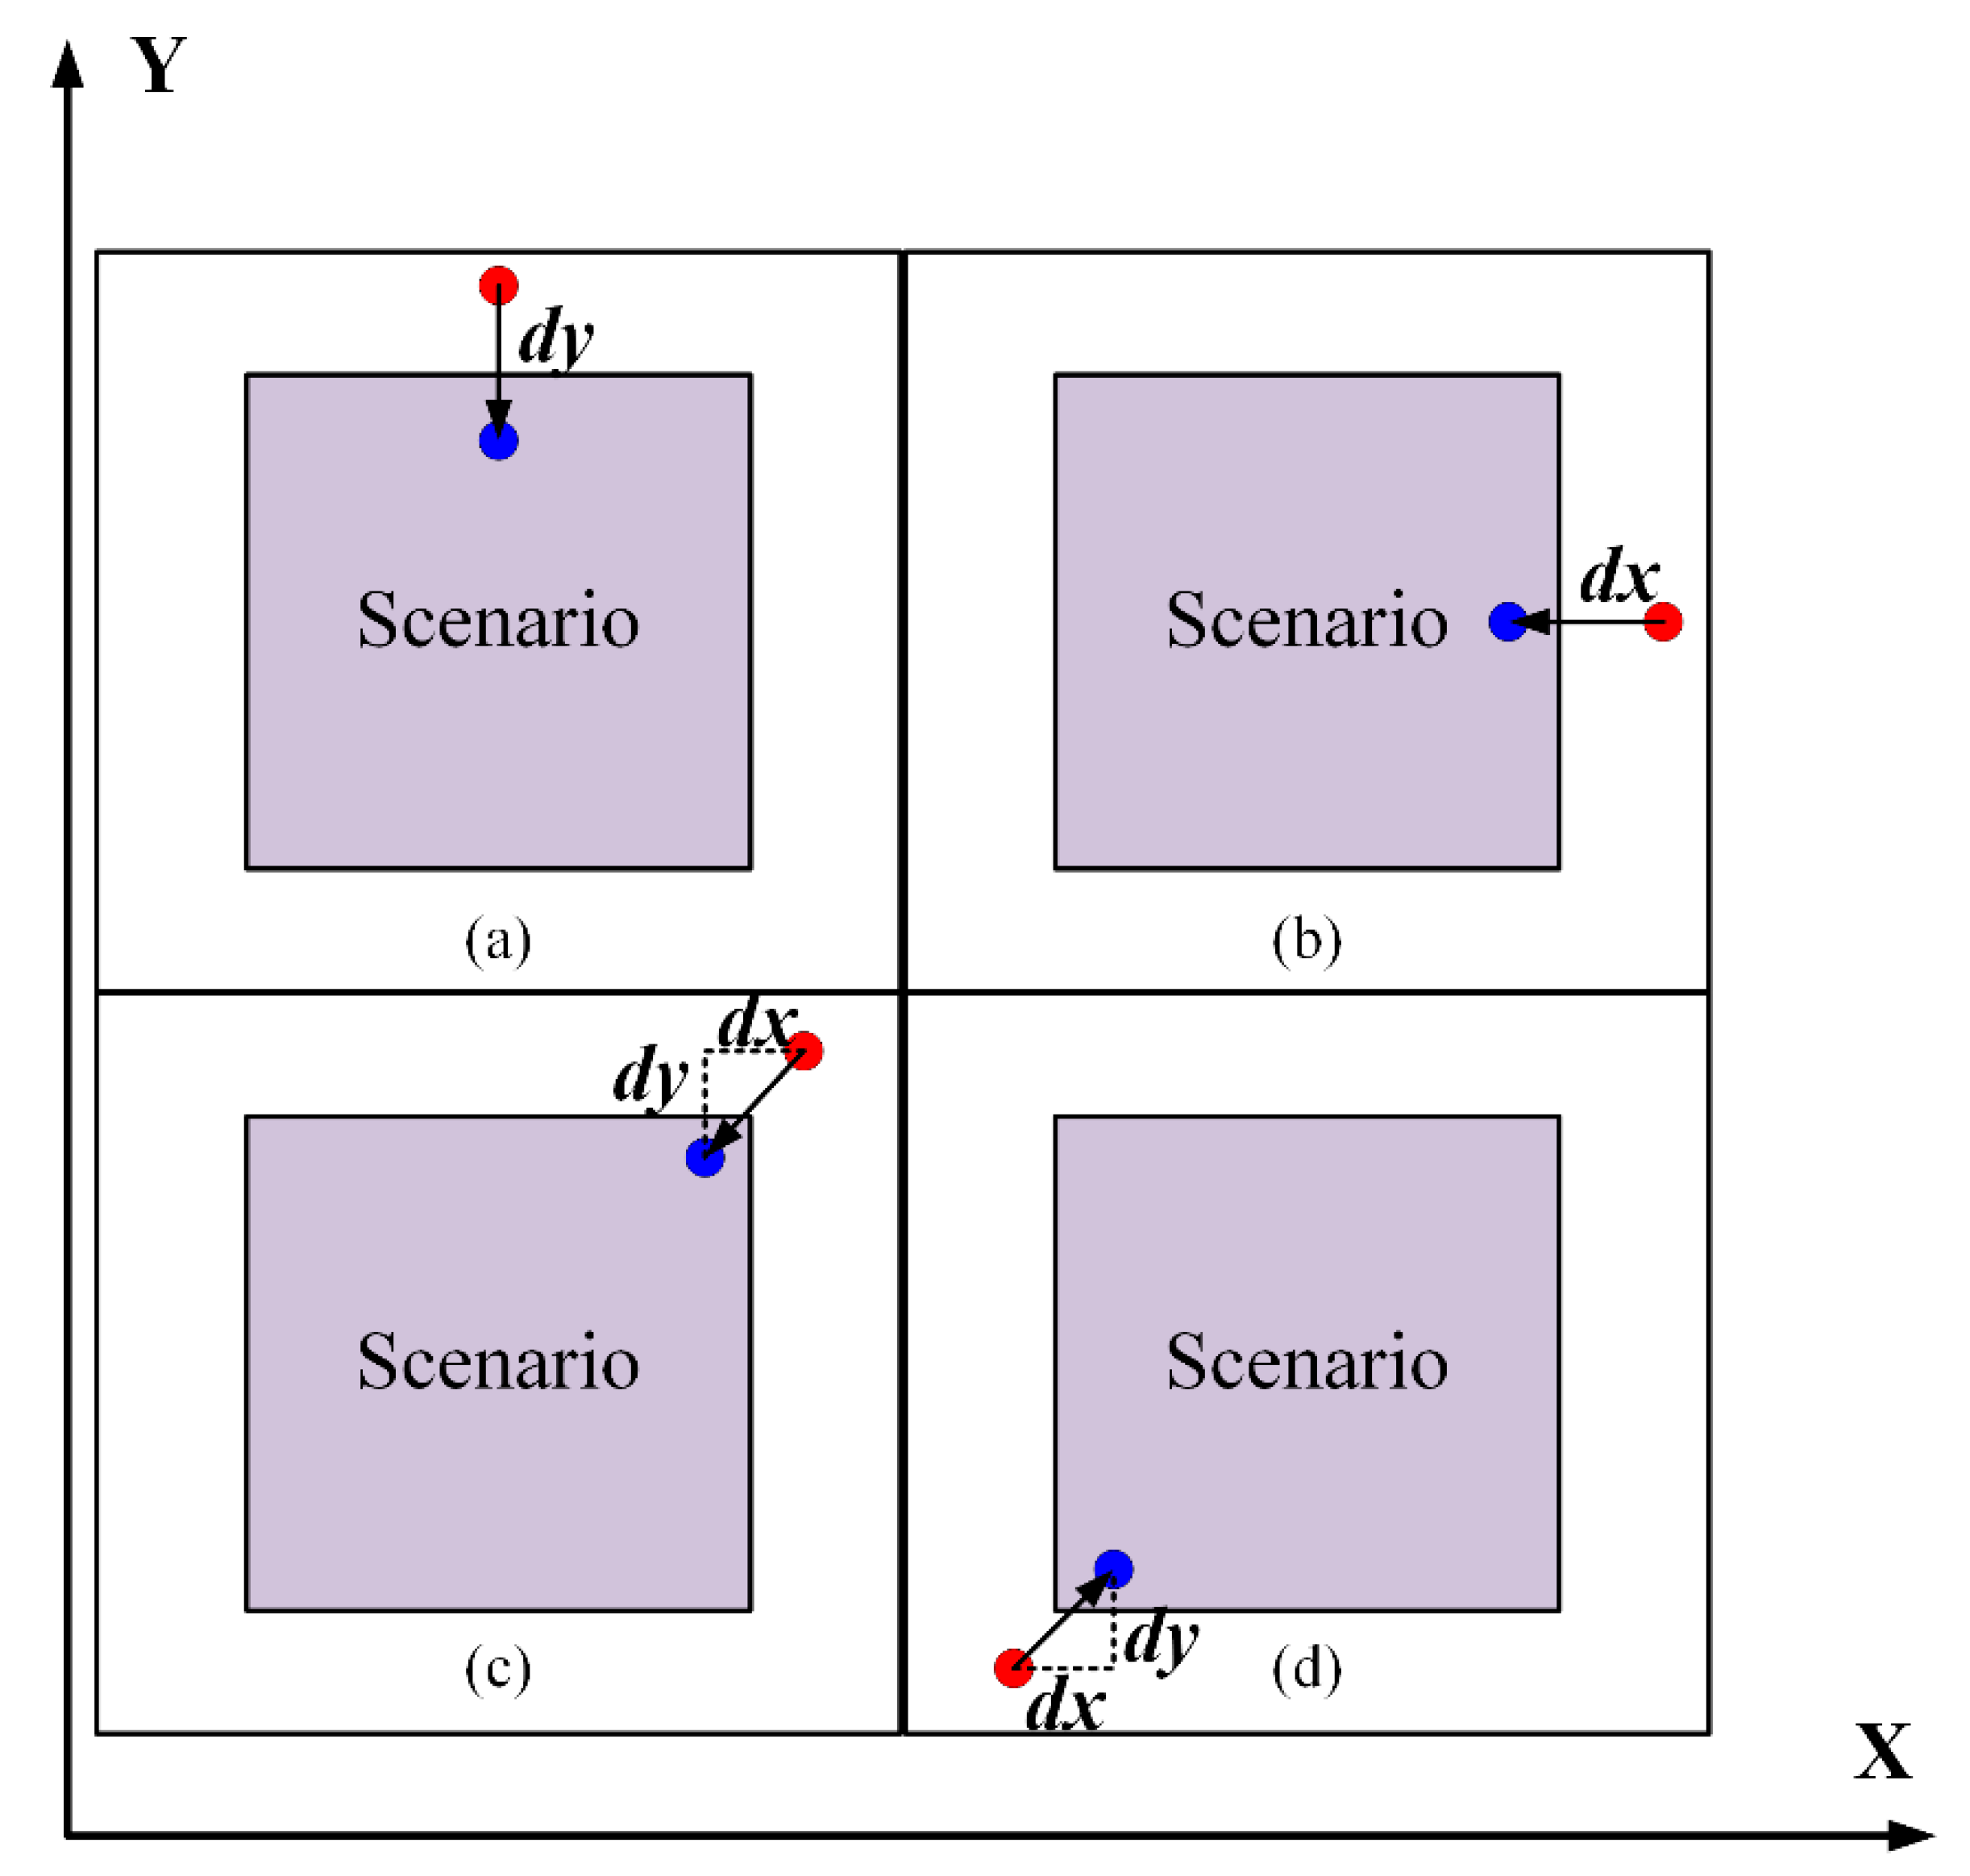
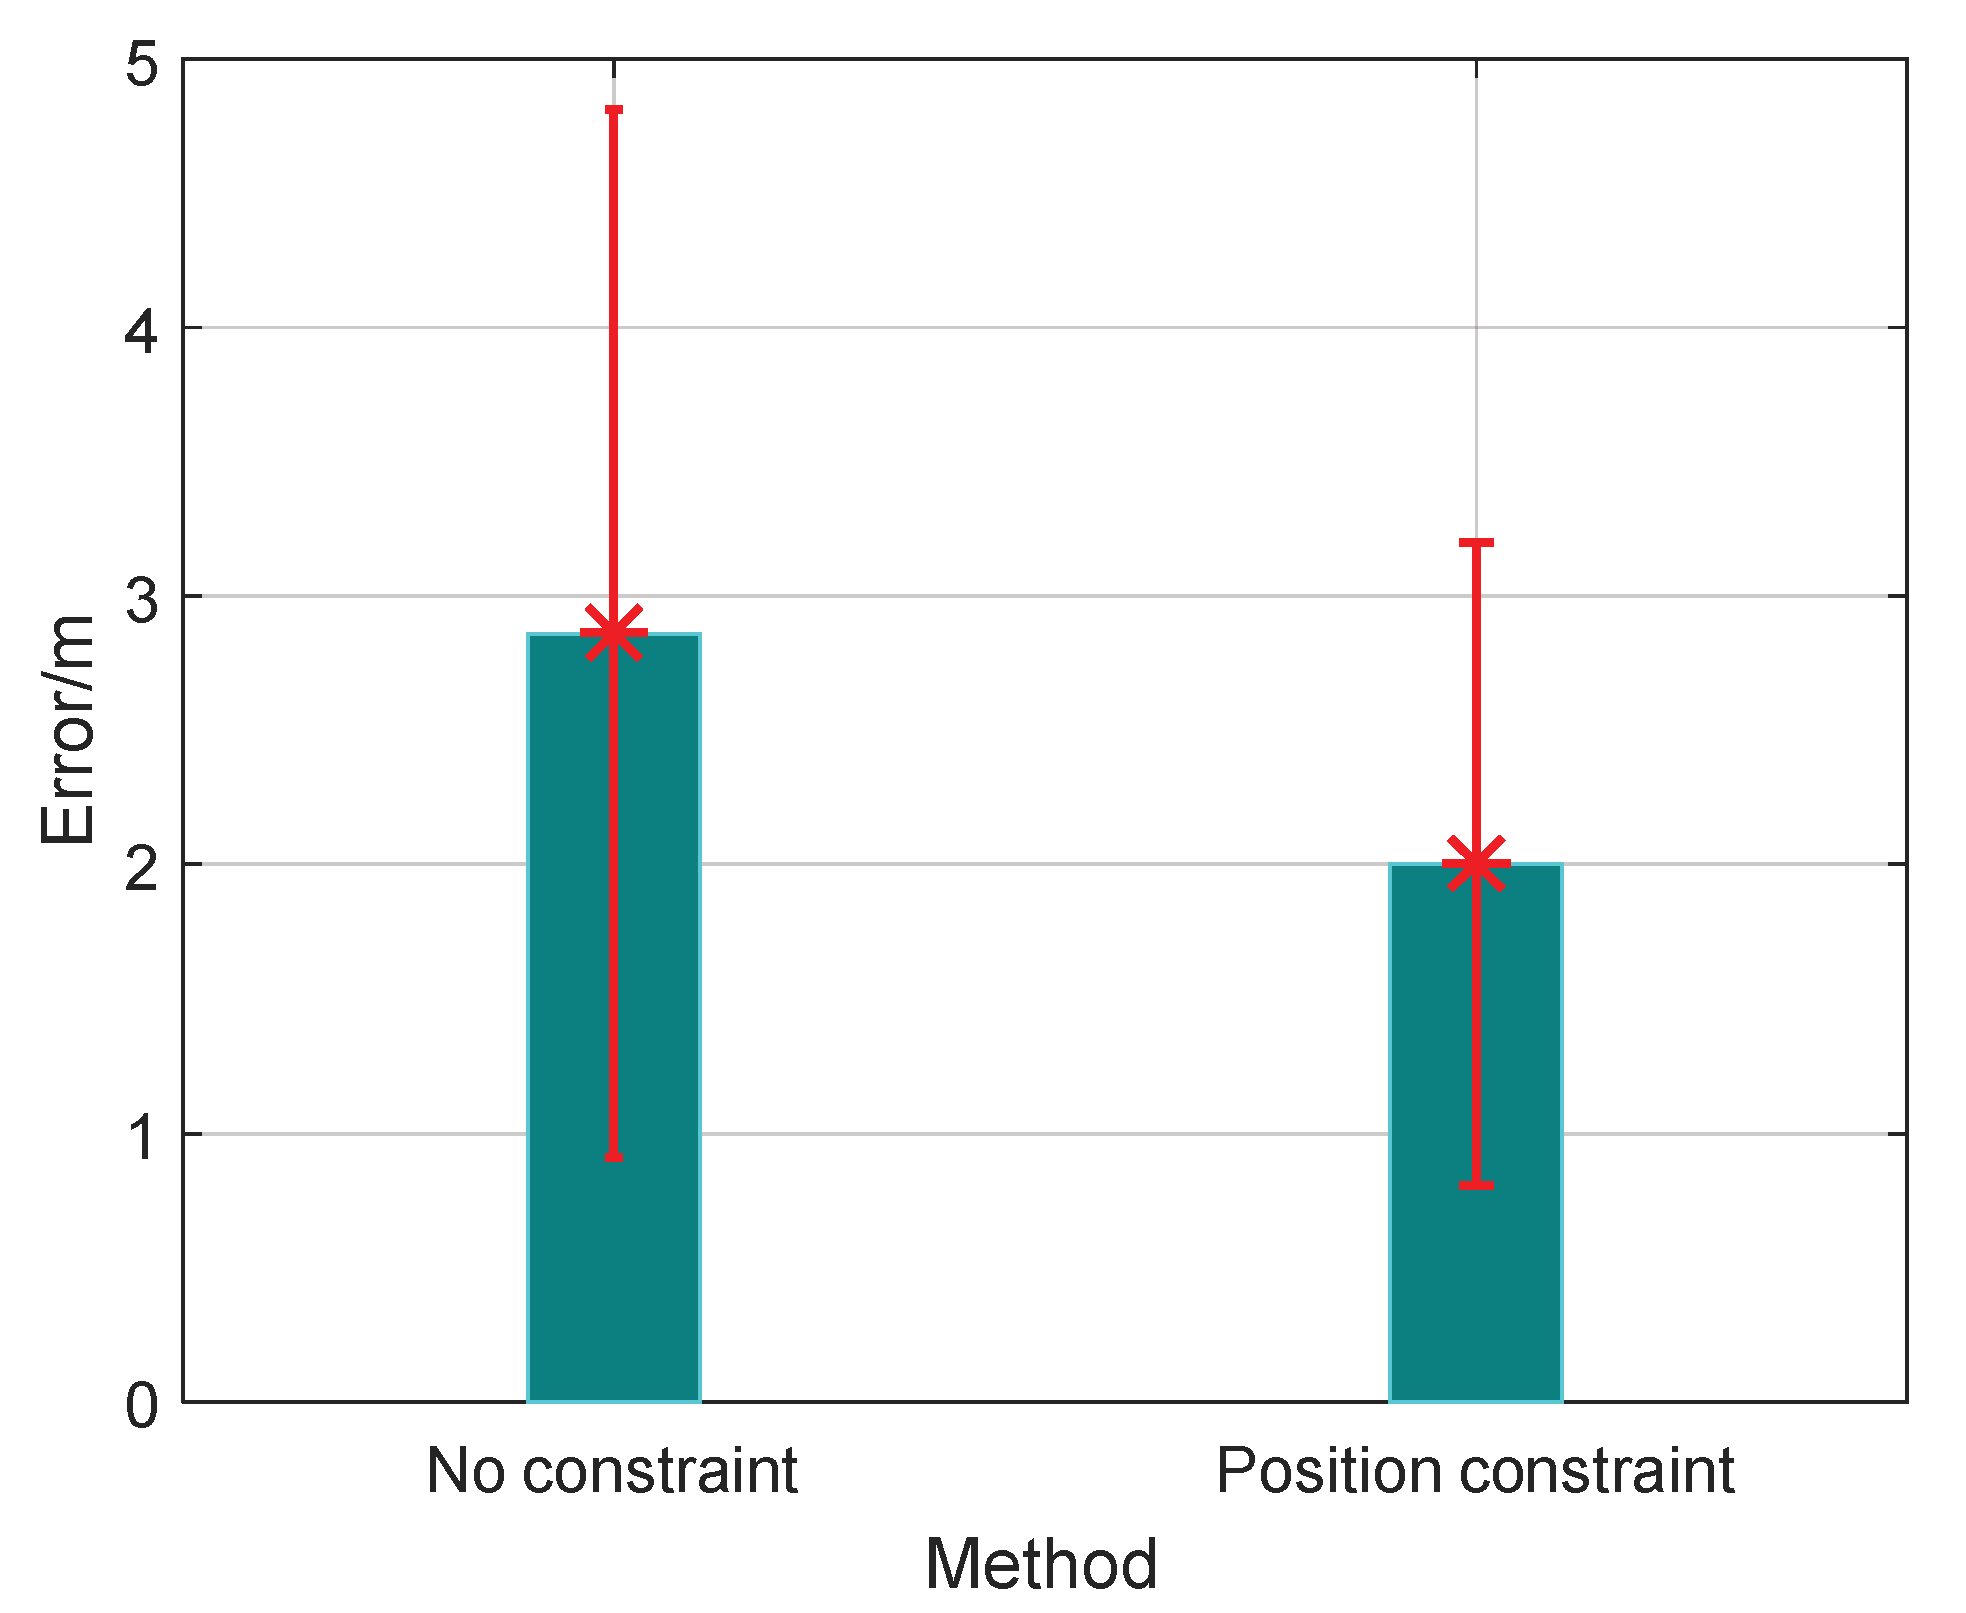
4.3. Position Constraint Based on Scenario Recognition
5. Indoor Localization Algorithm
5.1. The Range Calibration Model for LOS Distance
5.2. Indoor Localization Algorithm Based on LOS Identification and Range Calibration
6. Experiment
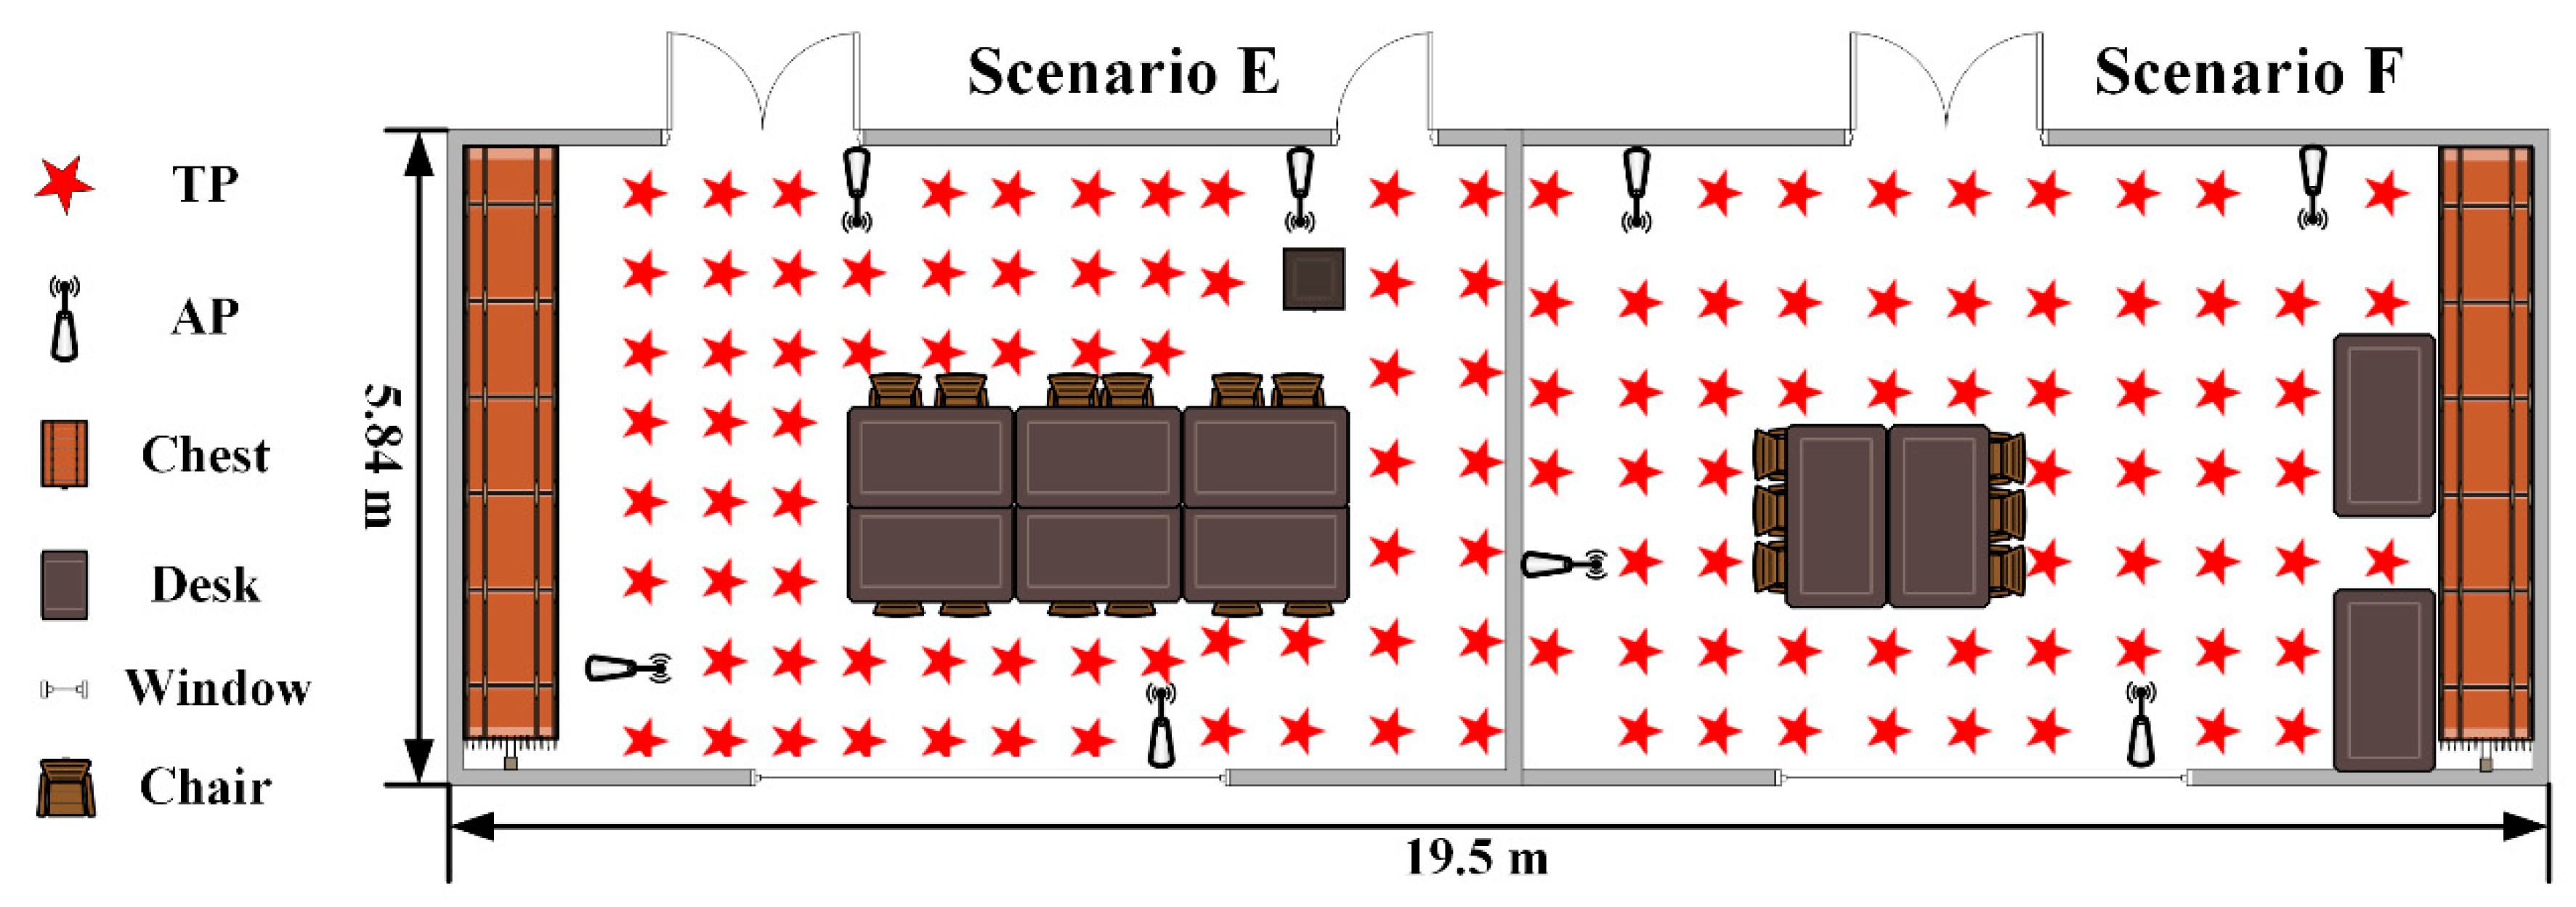
6.1. Experimental Environment
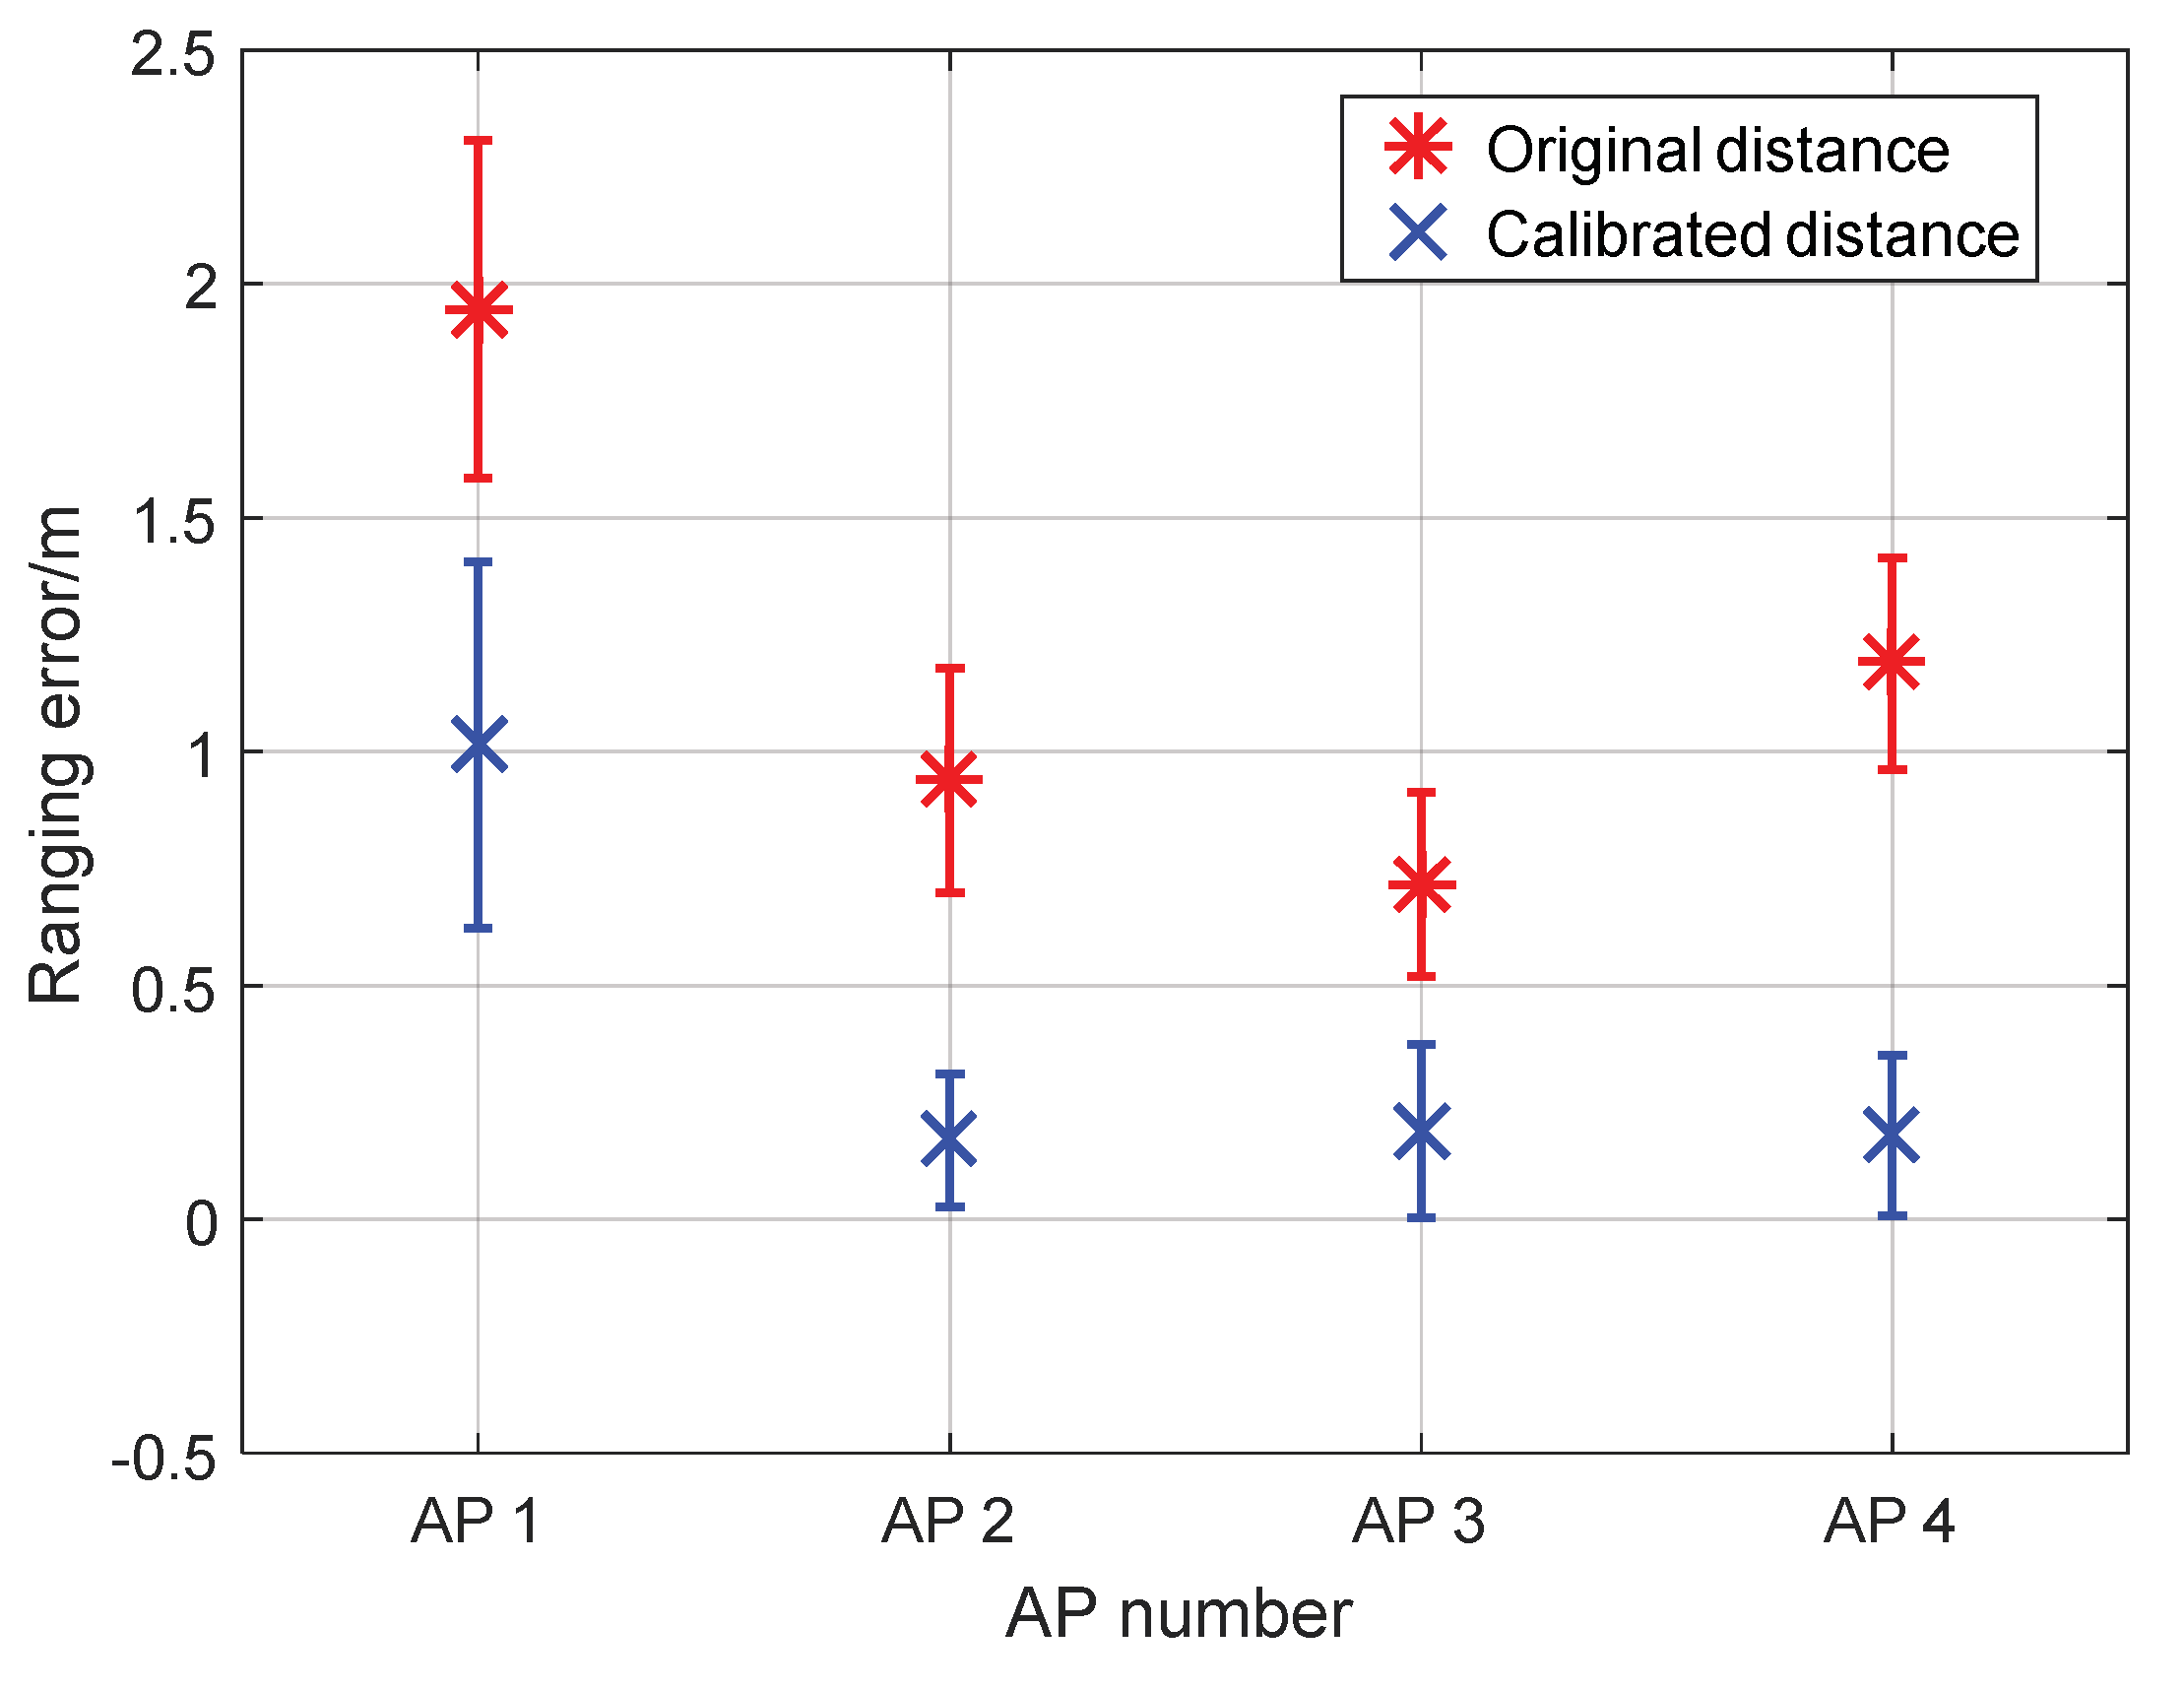
6.2. Range Calibration Model Construction
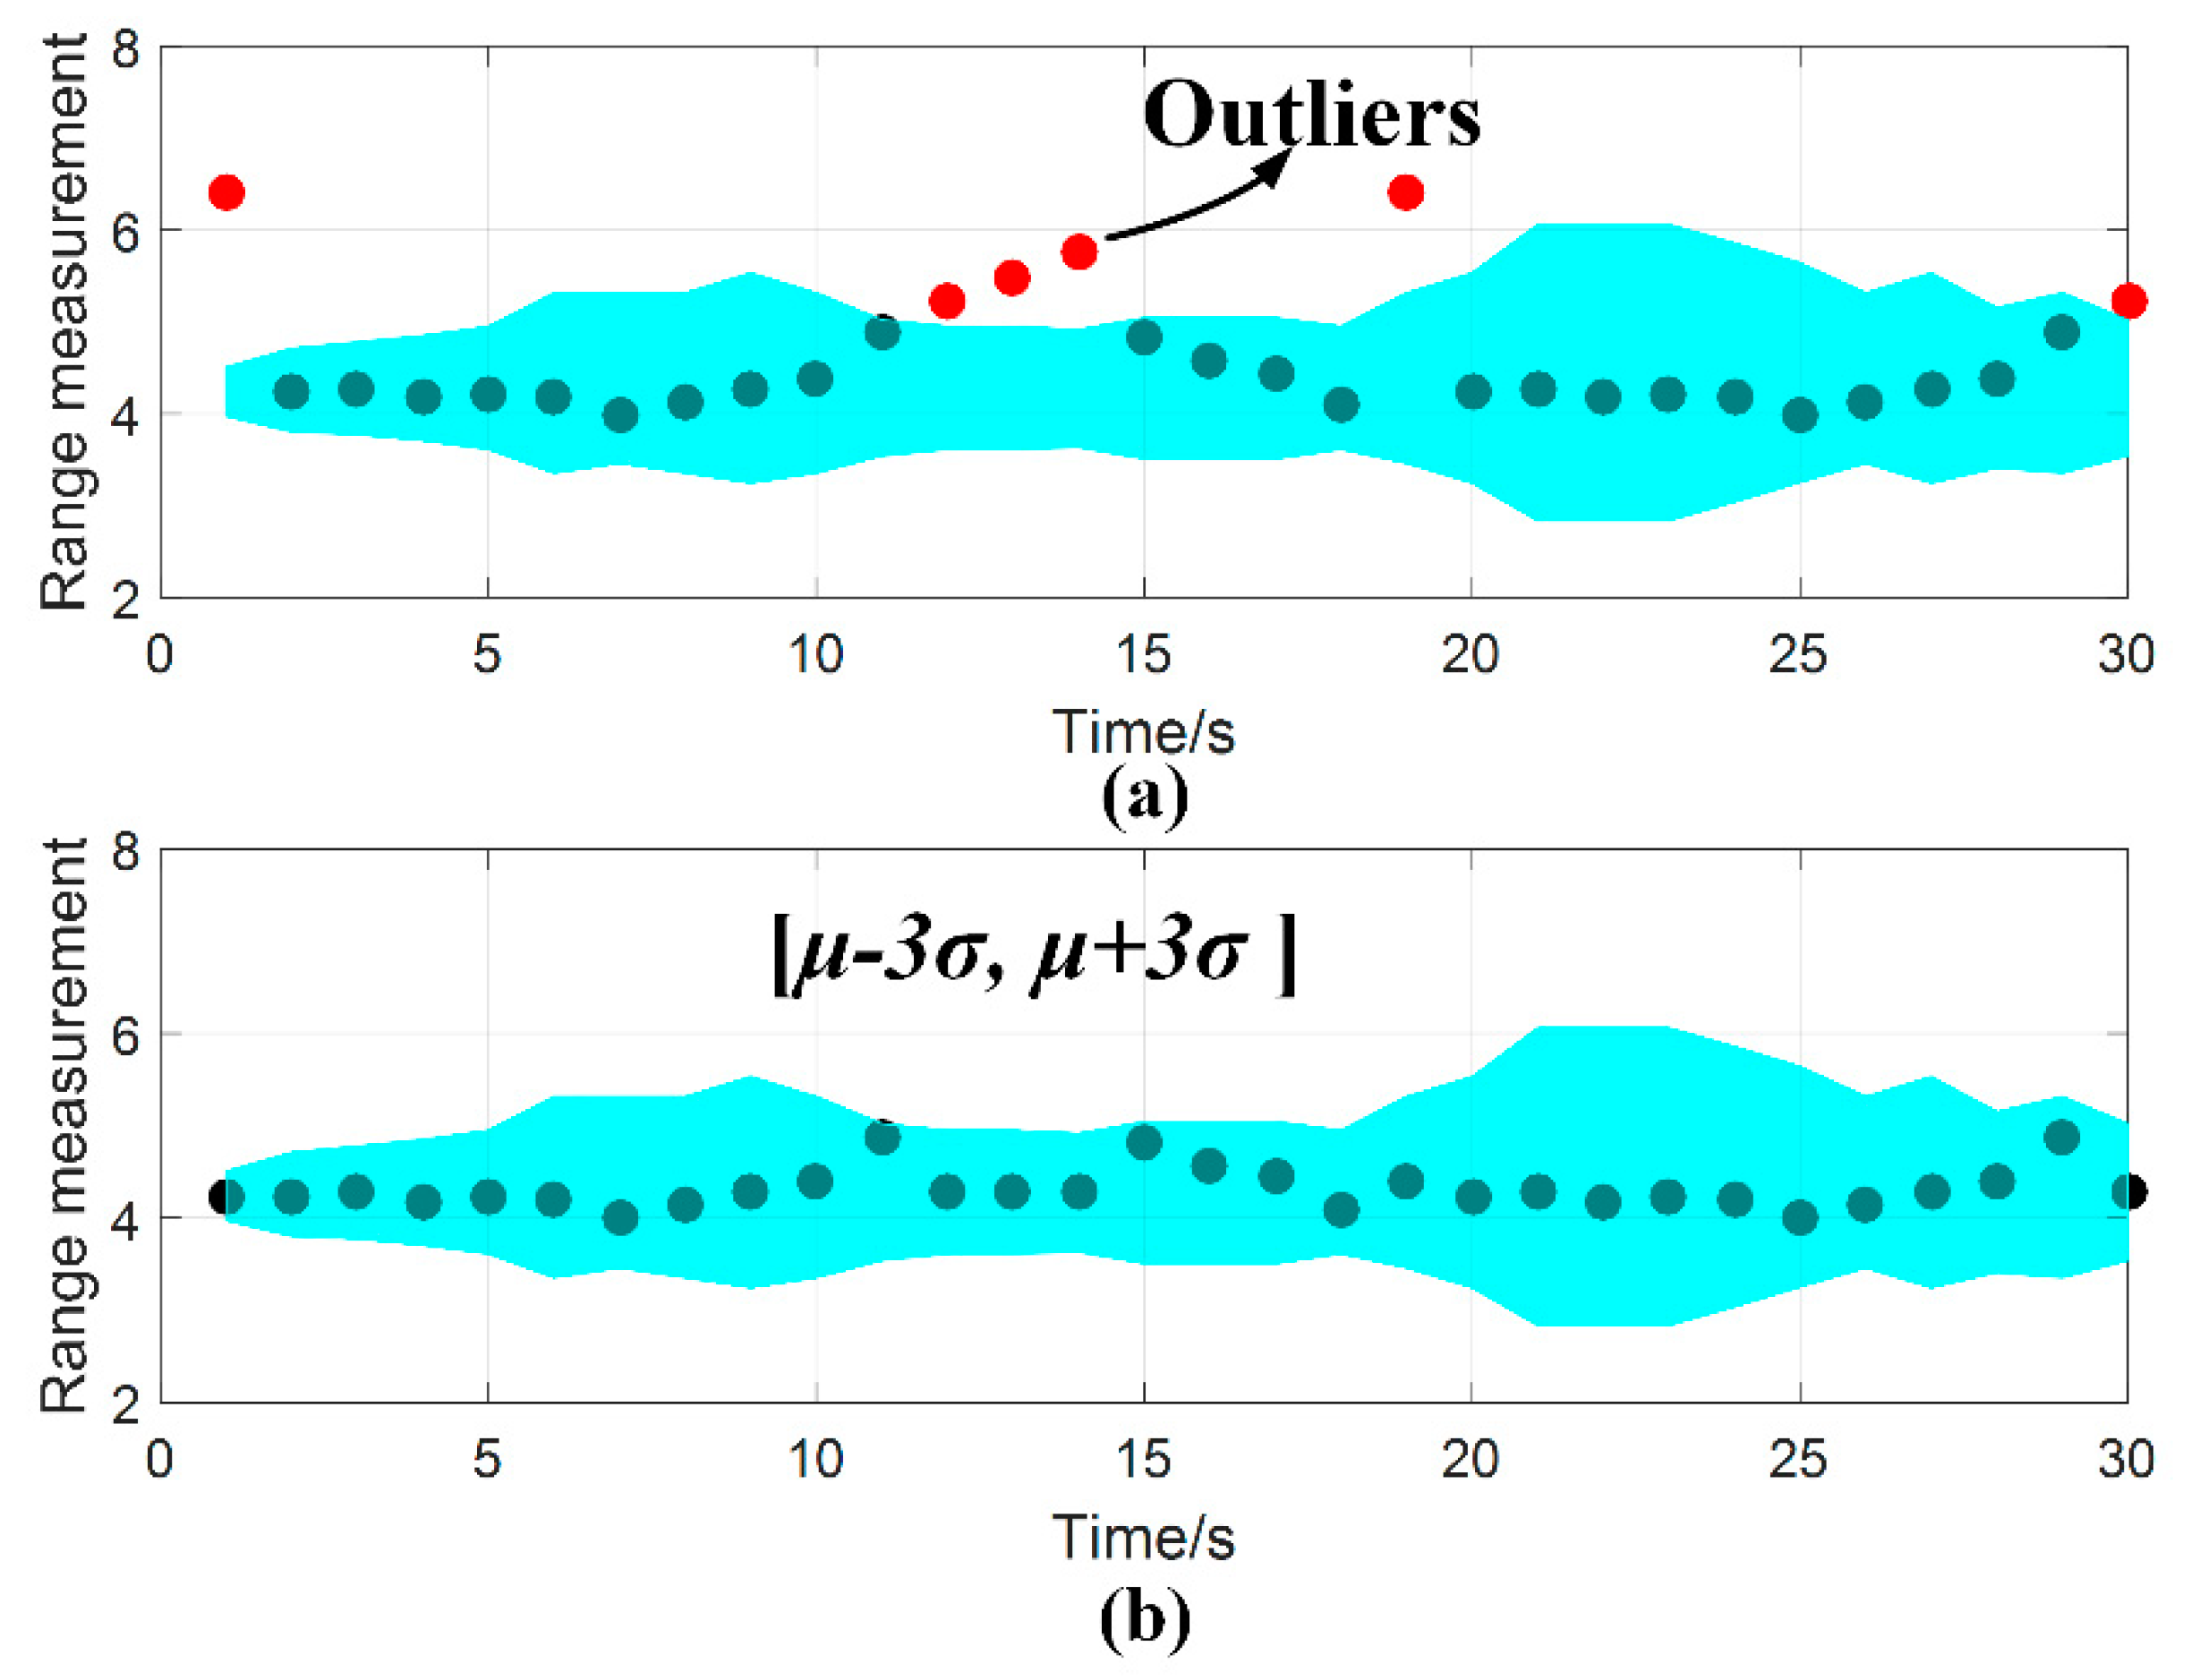
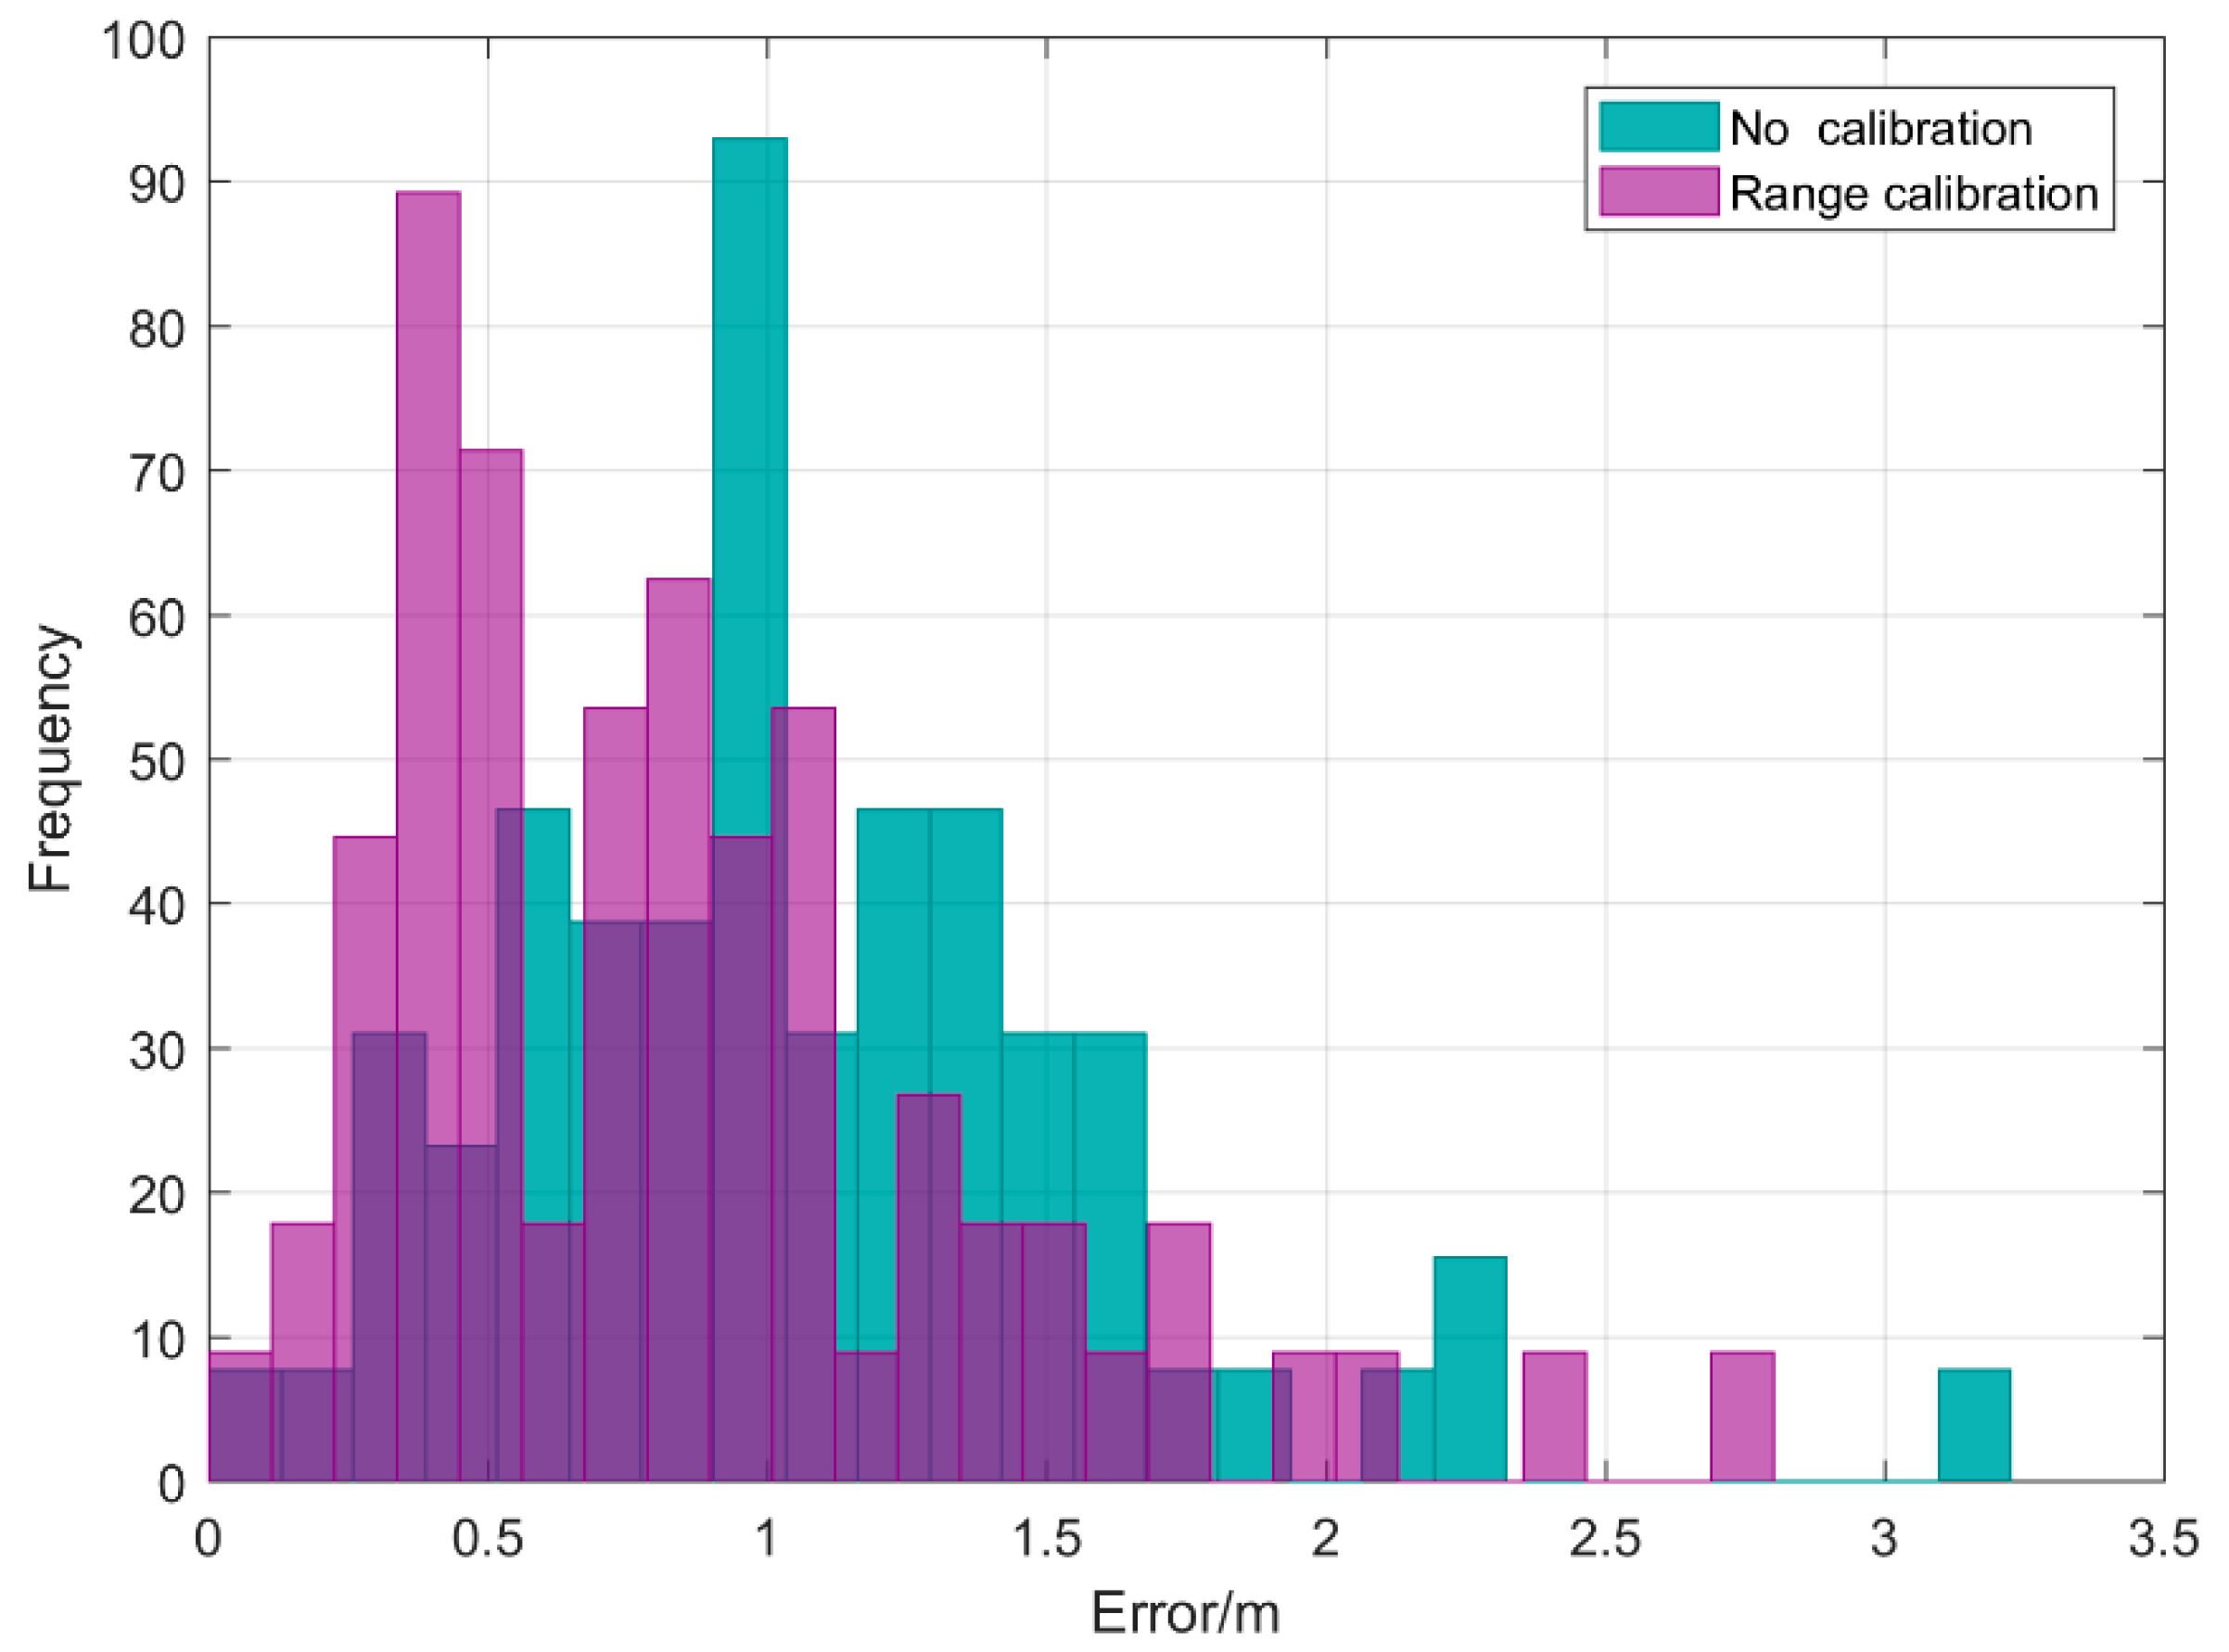
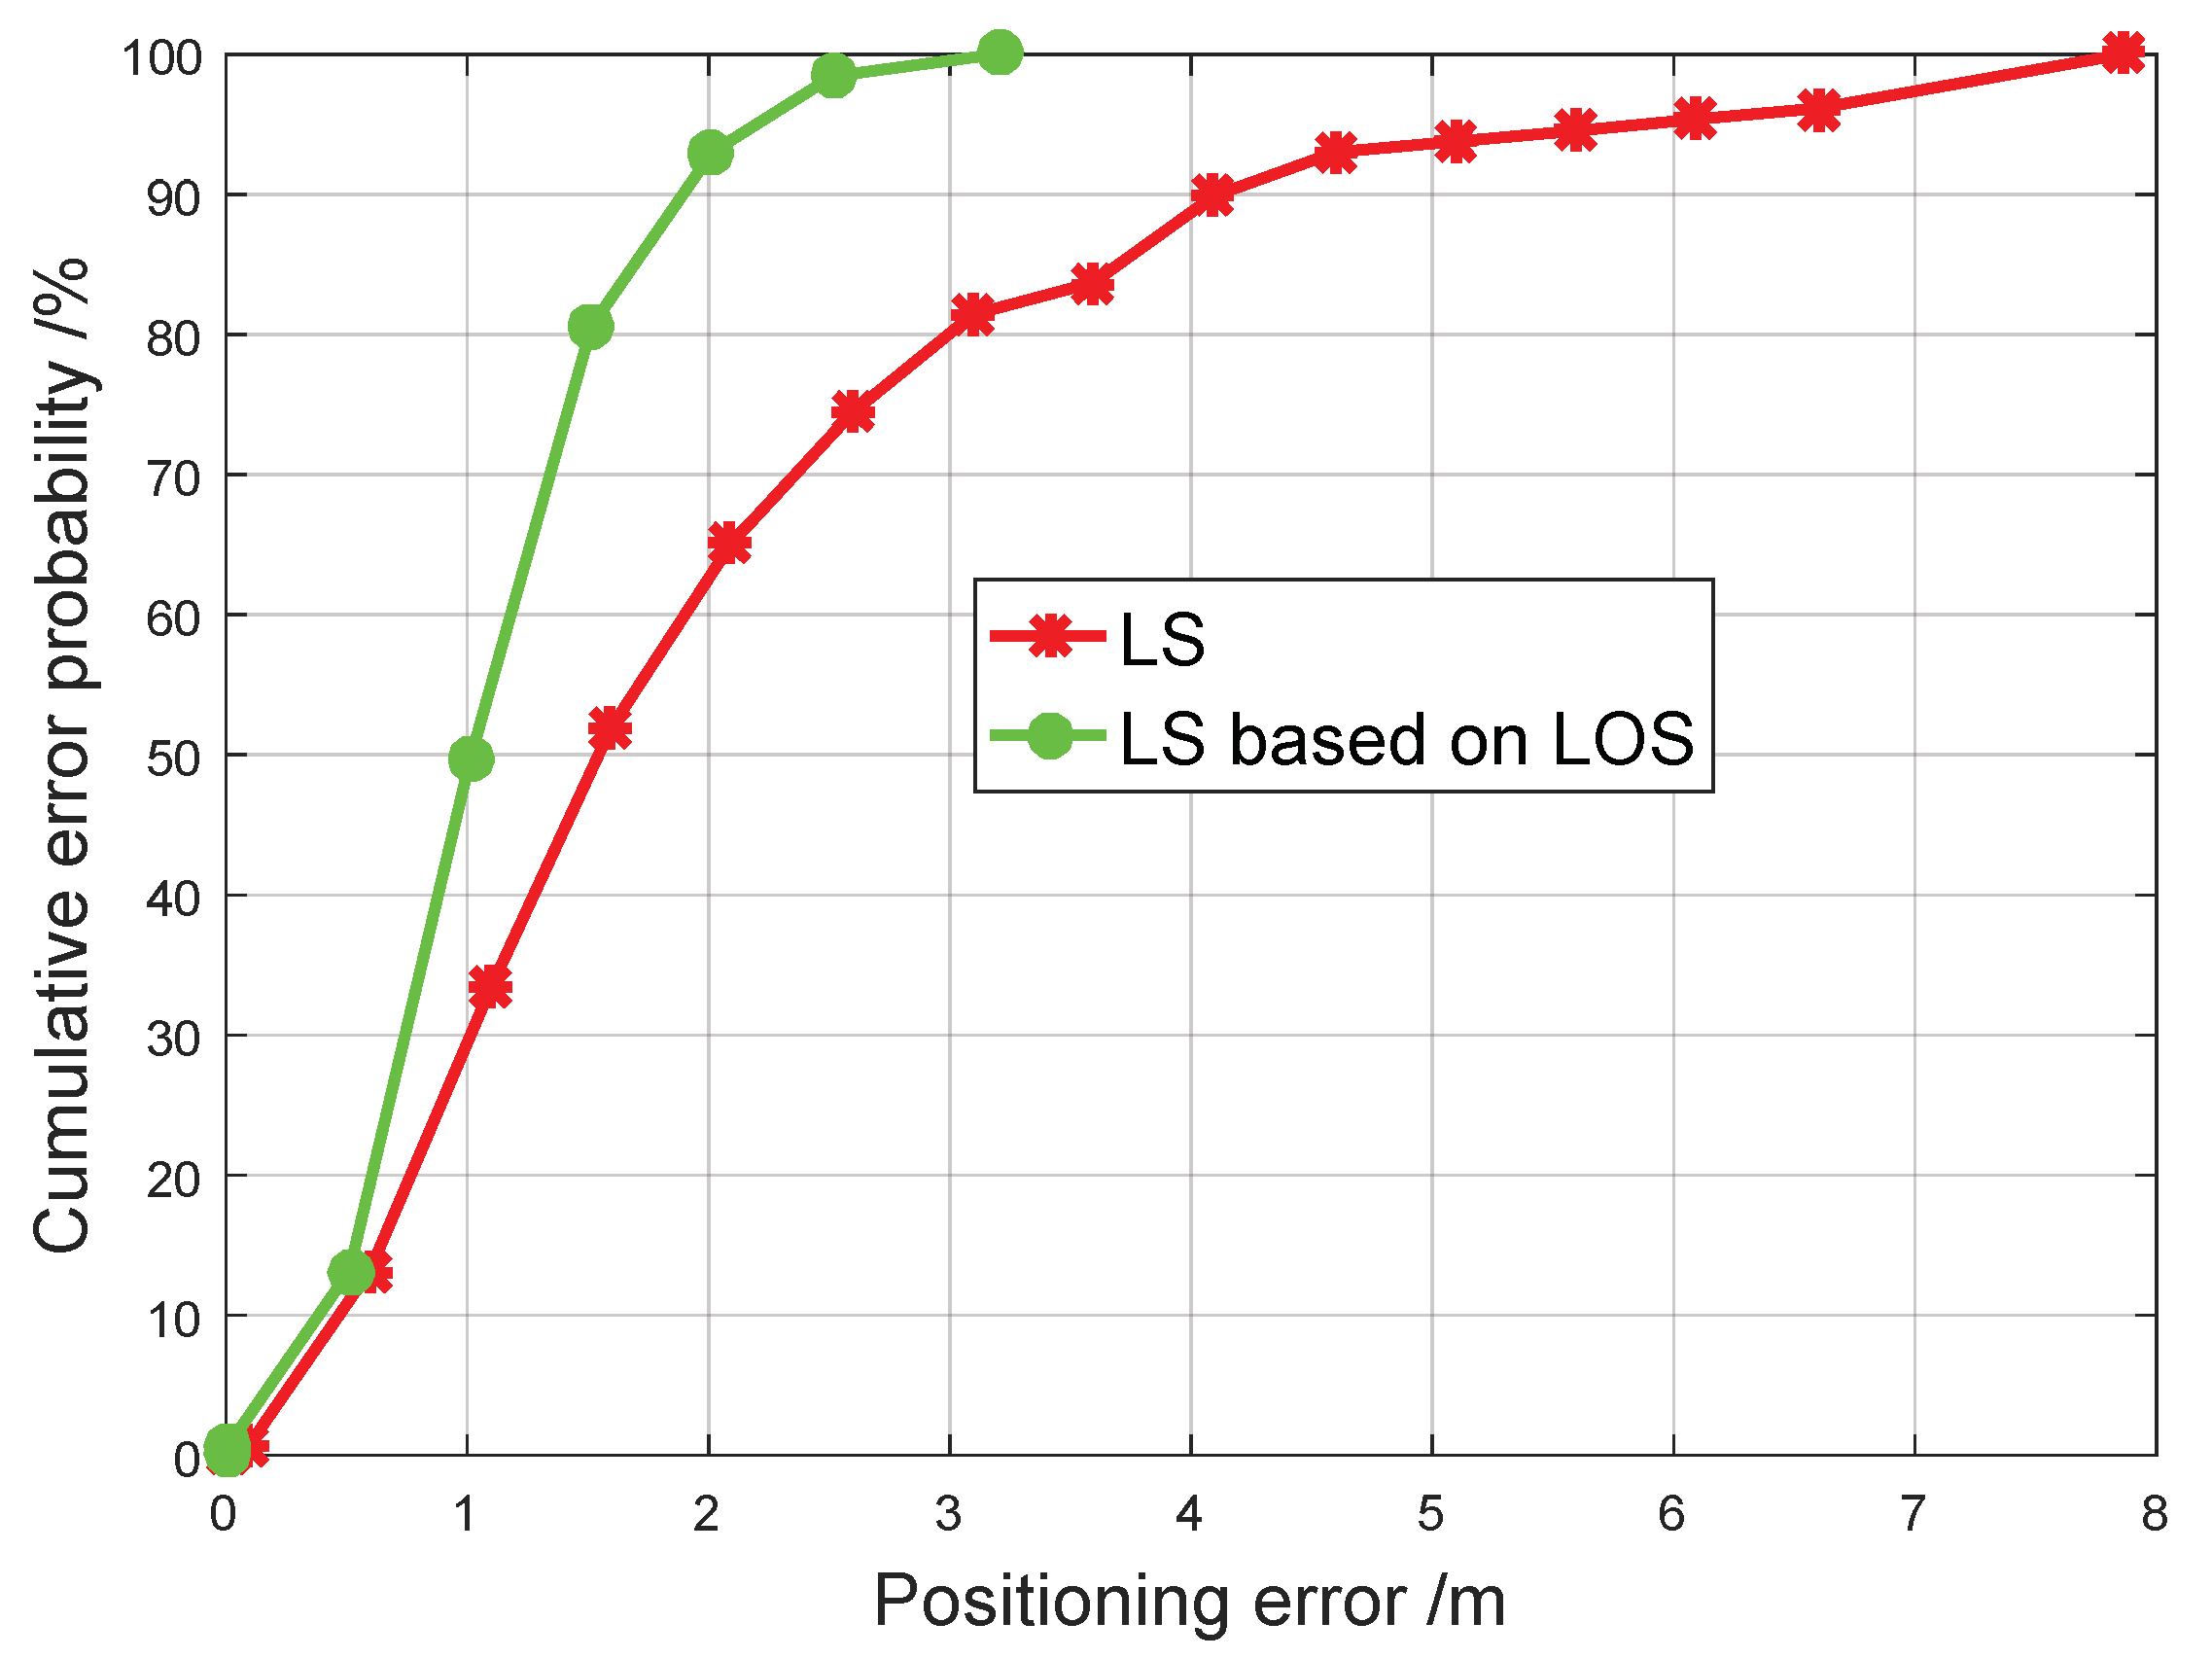
6.3. The Effect of the Range Calibration Model
6.4. The Effect of Position Constraint
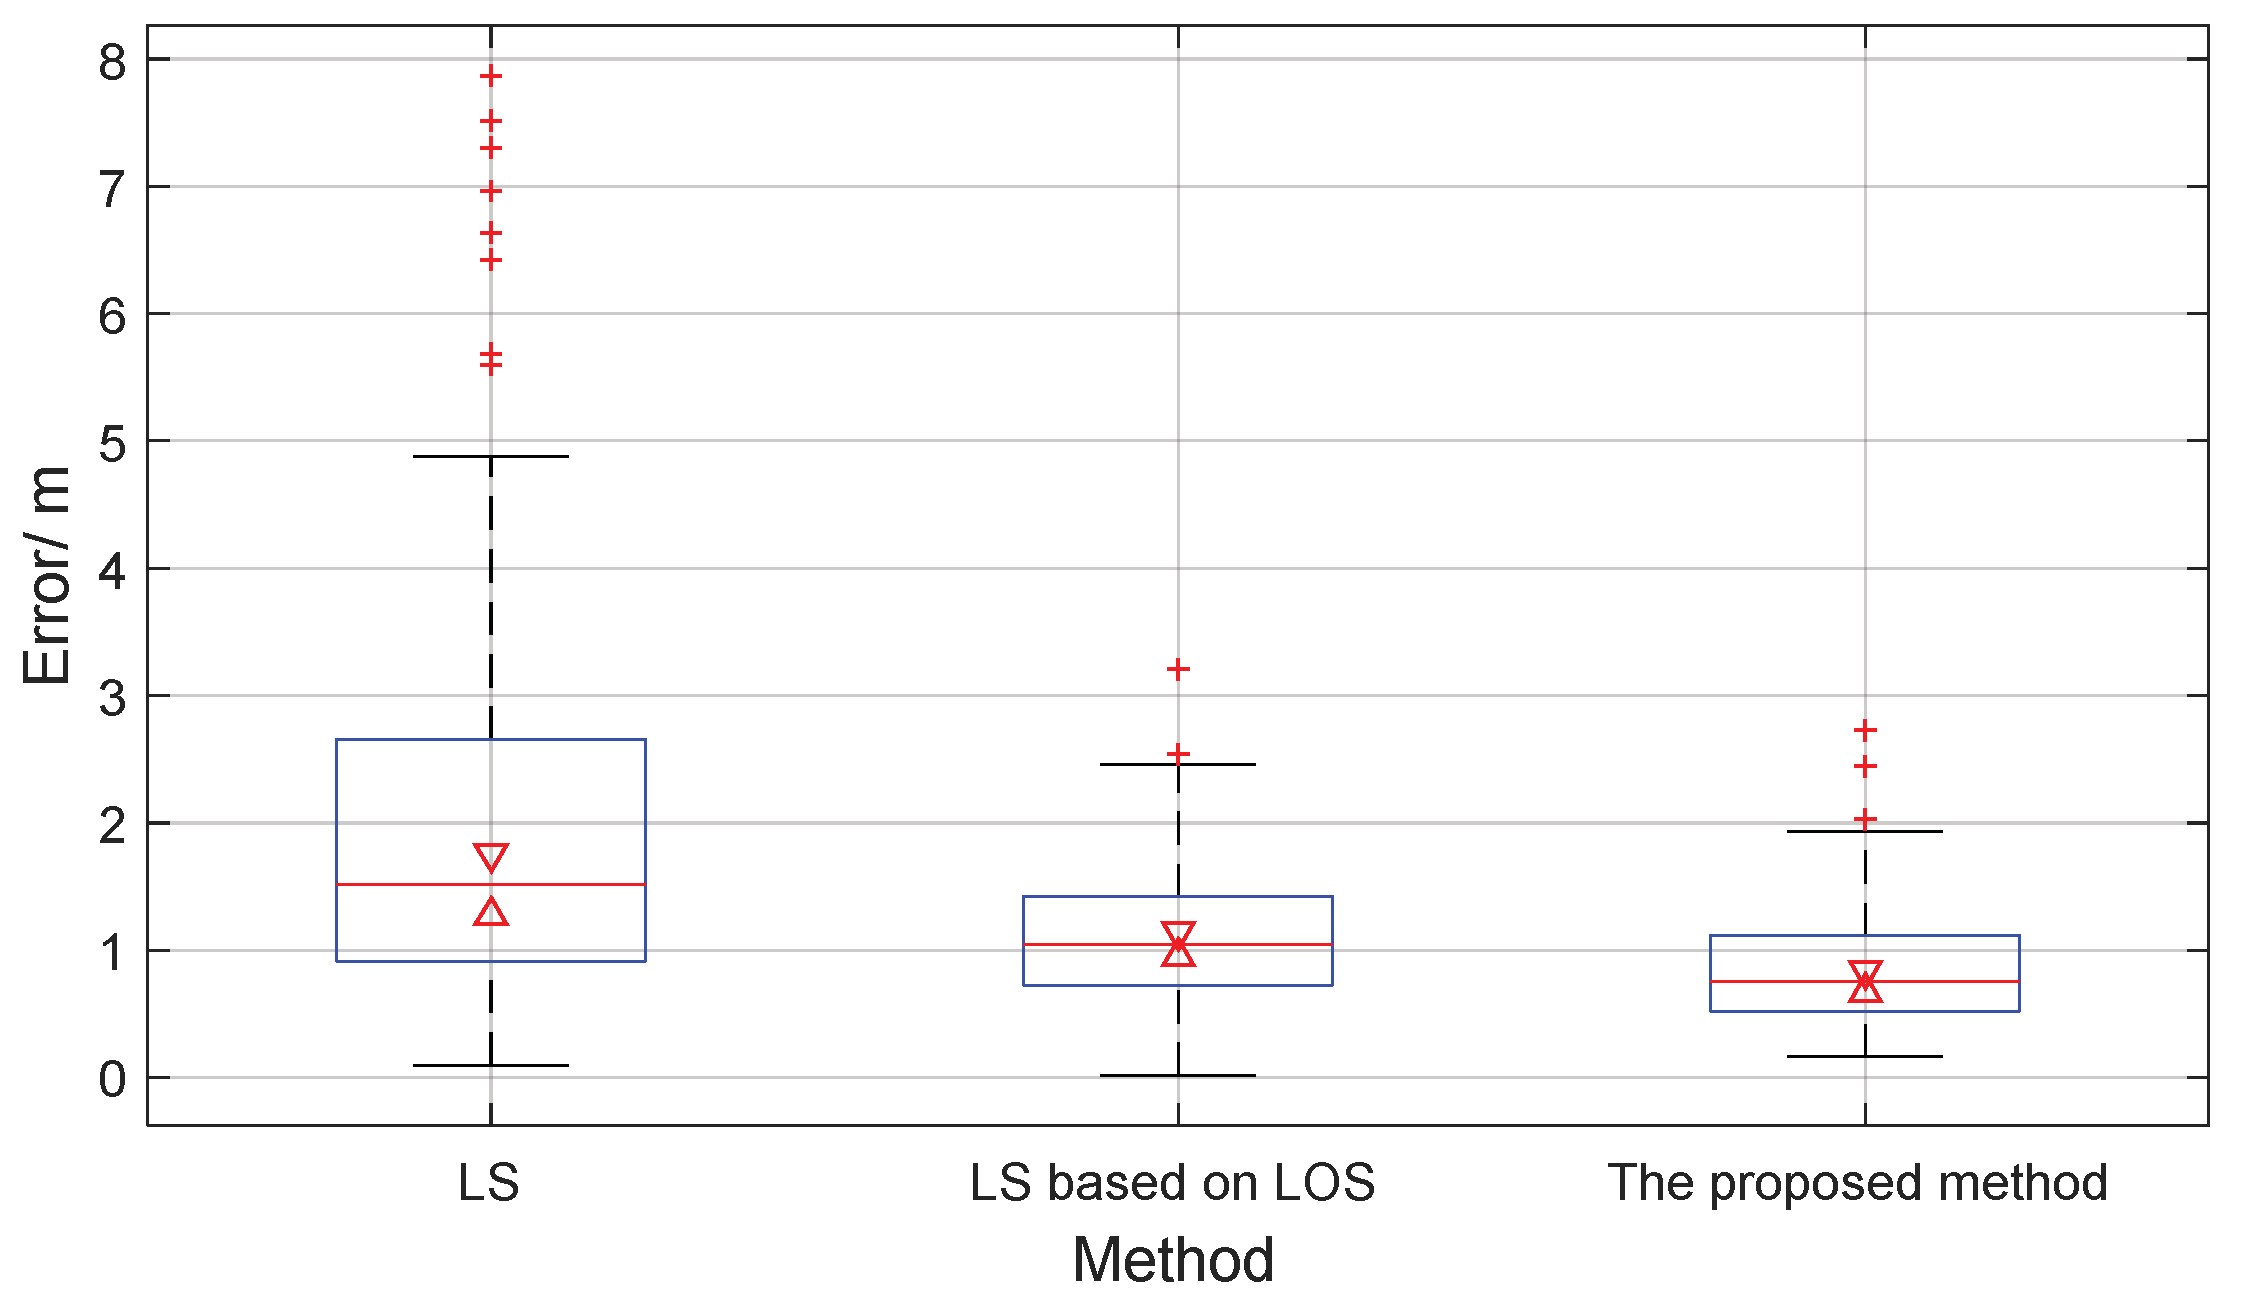
6.5. Indoor Localization Algorithm Based on LOS Identification and Range Calibration
7. Conclusions
Author Contributions
Funding
Acknowledgments
Conflicts of Interest
References
- Mehmood, H.; Tripathi, N.; Tipdecho, T. Seamless switching between GNSS and WLAN based indoor positioning system for ubiquitous positioning. Earth Sci. Inform. 2014, 8, 221–231. [Google Scholar] [CrossRef]
- Olesen, D.M. Evaluation of GPS/BDS indoor positioning performance and enhancement. Adv. Space Res. 2017, 59, 870–876. [Google Scholar]
- Musa, A.; Nugraha, G.D.; Han, H.; Choi, D.; Seo, S.; Kim, J. A decision tree-based NLOS detection method for the UWB indoor location tracking accuracy improvement. Int. J. Commun. Syst. 2019, 32. [Google Scholar] [CrossRef]
- Yu, K.; Wen, K.; Li, Y.; Zhang, S.; Zhang, K. A Novel NLOS Mitigation Algorithm for UWB Localization in Harsh Indoor Environments. IEEE Trans. Veh. Technol. 2019, 68, 686–699. [Google Scholar] [CrossRef]
- Chen, L.; Pei, L.; Kuusniemi, H.; Chen, Y.; KröGer, T.; Chen, R. Bayesian Fusion for Indoor Positioning Using Bluetooth Fingerprints. Wirel. Pers. Commun. 2013, 70, 1735–1745. [Google Scholar] [CrossRef]
- Topak, F.; Pekericli, M.K.; Tanyer, A.M. Technological Viability Assessment of Bluetooth Low Energy Technology for Indoor Localization. J. Comput. Civ. Eng. 2018, 32. [Google Scholar] [CrossRef]
- Zhang, J.; Lyu, Y.; Patton, J.; Periaswamy, S.C.G.; Roppel, T. BFVP: A Probabilistic UHF RFID Tag Localization Algorithm Using Bayesian Filter and a Variable Power RFID Model. IEEE Trans. Ind. Electron. 2018, 65, 8250–8259. [Google Scholar] [CrossRef]
- Sun, W.; Xue, M.; Yu, H.; Tang, H.; Lin, A. Augmentation of fingerprints for indoor WiFi localization based on Gaussian process regression. IEEE Trans. Veh. Technol. 2018, 67, 10896–10905. [Google Scholar] [CrossRef]
- Song, X.; Fan, X.; Xiang, C.; Ye, Q.; Liu, L.; Wang, Z.; He, X.; Yang, N.; Fang, G. A novel convolutional neural network based indoor localization framework with WiFi fingerprinting. IEEE Access 2019, 7, 110698–110709. [Google Scholar] [CrossRef]
- Zhang, D.; Yang, L.T.; Min, C.; Zhao, S.; Guo, M.; Yin, Z. Real-Time Locating Systems Using Active RFID for Internet of Things. IEEE Syst. J. 2017, 10, 1226–1235. [Google Scholar] [CrossRef]
- Xu, H.; Ding, Y.; Li, P.; Wang, R.; Li, Y. An RFID indoor positioning algorithm based on Bayesian probability and K-nearest neighbor. Sensors 2017, 17, 1806. [Google Scholar] [CrossRef] [Green Version]
- Xiao, A.; Ruizhi, C.; Deren, L.; Yujin, C.; Dewen, W. An Indoor Positioning System Based on Static Objects in Large Indoor Scenes by Using Smartphone Cameras. Sensors 2018, 18, 2229. [Google Scholar] [CrossRef] [Green Version]
- Khyam, M.O.; Noor-A-Rahim, M.; Li, X.; Ritz, C.; Guan, Y.L.; Ge, S.S. Design of Chirp Waveforms for Multiple-Access Ultrasonic Indoor Positioning. IEEE Sens. J. 2018, 18, 6375–6390. [Google Scholar] [CrossRef]
- Chen, J.; Ou, G.; Peng, A.; Zheng, L.; Shi, J. An INS/WiFi Indoor Localization System Based on the Weighted Least Squares. Sensors 2018, 18, 1458. [Google Scholar] [CrossRef] [PubMed] [Green Version]
- Rizos, C. An integer ambiguity resolution procedure for GPS/pseudolite/INS integration. J. Geod. 2005, 79, 242–255. [Google Scholar]
- Li, X.; Zhang, P.; Huang, G.; Zhang, Q.; Zhao, Q. Performance analysis of indoor pseudolite positioning based on the unscented Kalman filter. GPS Solut. 2019, 23. [Google Scholar] [CrossRef]
- Jun, H. Precise calibration method of pseudolite positions in indoor navigation systems. Comput. Math. Appl. 2003, 46, 1711–1724. [Google Scholar]
- Ma, Y.; Dou, Z.; Jiang, Q.; Hou, Z. Basmag: An Optimized HMM-Based Localization System Using Backward Sequences Matching Algorithm Exploiting Geomagnetic Information. IEEE Sens. J. 2016, 16, 7472–7482. [Google Scholar] [CrossRef]
- Zhou, Z. Indoor positioning algorithm using light-emitting diode visible light communications. Opt. Eng. 2012, 51, 5009. [Google Scholar] [CrossRef] [Green Version]
- Filonenko, V.; Cullen, C.; Carswell, J. Investigating ultrasonic positioning on mobile phones. In Proceedings of the 2010 International Conference on Indoor Positioning and Indoor Navigation, Zurich, Switzerland, 15–17 September 2010. [Google Scholar]
- Tan, K.G. Objects tracking in a dense reader environment utilising grids of RFID antenna positioning. Int. J. Electron. 2009, 96, 1281–1307. [Google Scholar]
- Peterson, G.D. Compressive sensing based sub-mm accuracy UWB positioning systems: A space–time approach. Digit. Signal Process. 2013, 23, 340–354. [Google Scholar]
- Han, S.K. An Indoor Visible Light Communication Positioning System Using a RF Carrier Allocation Technique. J. Lightwave Technol. 2013, 31, 134–144. [Google Scholar]
- Liu, Y.Q. Indoor pseudolite relative localization algorithm with kalman filter. Acta Phys. Sin. 2014, 63, 228402. [Google Scholar]
- Ho, C.C.; Lee, R. Real-Time Indoor Positioning System Based on RFID Heron-Bilateration Location Estimation and IMU Inertial-Navigation Location Estimation. In Proceedings of the 2015 IEEE 39th Annual Computer Software and Applications Conference, Taichung, Taiwan, 1–5 July 2015; pp. 481–486. [Google Scholar]
- Liu, D. Research on Extended Kalman Filter and Particle Filter Combinational Algorithm in UWB and Foot-Mounted IMU Fusion Positioning. Mob. Inf. Syst. 2018, 2018. [Google Scholar] [CrossRef]
- Schmalstieg, D. Indoor Positioning and Navigation with Camera Phones. IEEE Pervasive Comput. 2009, 8, 22–31. [Google Scholar]
- Striegel, A. Face-to-Face Proximity EstimationUsing Bluetooth On Smartphones. IEEE Trans. Mob. Comput. 2014, 13, 811–823. [Google Scholar]
- Gao, Y. An Improved Particle Filter Algorithm for Geomagnetic Indoor Positioning. J. Sens. 2018, 2018, 1–9. [Google Scholar]
- Zhuang, Y.; Syed, Z.; Li, Y.; El-Sheimy, N. Evaluation of Two WiFi Positioning Systems Based on Autonomous Crowdsourcing of Handheld Devices for Indoor Navigation. IEEE Trans. Mob. Comput. 2016, 15, 1982–1995. [Google Scholar] [CrossRef]
- Wang, P.; Luo, Y. Research on WiFi Indoor Location Algorithm Based on RSSI Ranging. In Proceedings of the 2017 4th International Conference on Information Science and Control Engineering (ICISCE), Changsha, China, 21–23 July 2017; pp. 1694–1698. [Google Scholar]
- Xie, Y.; Wang, Y.; Nallanathan, A.; Wang, L. An Improved K-Nearest-Neighbor Indoor Localization Method Based on Spearman Distance. IEEE Signal Process. Lett. 2016, 23, 351–355. [Google Scholar] [CrossRef] [Green Version]
- Karlsson, F.; Karlsson, M.; Bernhardsson, B.; Tufvesson, F.; Persson, M. Sensor fused indoor positioning using dual band WiFi signal measurements. In Proceedings of the 2015 European Control Conference (ECC), Linz, Astralia, 15–17 July 2015; pp. 1669–1672. [Google Scholar]
- Yu, F.; Jiang, M.; Liang, J.; Qin, X.; Hu, M.; Peng, T.; Hu, X. Expansion RSS-based Indoor Localization Using 5G WiFi Signal. In Proceedings of the 2014 International Conference on Computational Intelligence and Communication Networks, Bhopal, India, 14–16 November 2014; pp. 510–514. [Google Scholar]
- Tewolde, G.S.; Kwon, J. Efficient WiFi-Based Indoor Localization Using Particle Swarm Optimization. In Proceedings of the Advances in Swarm Intelligence, Chongqing, China, 12–15 June 2011; Springer: Berlin/Heidelberg, Germany, 2011; pp. 203–211. [Google Scholar]
- Wu, G.; Tseng, P. A Deep Neural Network-Based Indoor Positioning Method using Channel State Information. In Proceedings of the 2018 International Conference on Computing, Networking and Communications (ICNC), Maui, HI, USA, 5–8 March 2018; pp. 290–294. [Google Scholar]
- Liu, W.; Cheng, Q.; Deng, Z.; Chen, H.; Fu, X.; Zheng, X.; Zheng, S.; Chen, C.; Wang, S. Survey on CSI-based Indoor Positioning Systems and Recent Advances. In Proceedings of the 2019 International Conference on Indoor Positioning and Indoor Navigation (IPIN), Pisa, Italy, 30 September–3 October 2019; pp. 1–8. [Google Scholar]
- Zhang, Y.; Li, D.; Wang, Y. An Indoor Passive Positioning Method Using CSI Fingerprint Based on Adaboost. IEEE Sens. J. 2019, 19, 5792–5800. [Google Scholar] [CrossRef]
- Karegar, P.A. Wireless fingerprinting indoor positioning using affinity propagation clustering methods. Wirel. Netw. 2018, 24, 2825–2833. [Google Scholar] [CrossRef]
- Amizur, Y.; Schatzberg, U.; Banin, L. Next Generation Indoor Positioning System Based on WiFi Time of Flight. In Proceedings of the 26th International Technical Meeting of The Satellite Division of the Institute of Navigation (ION GNSS+ 2013), Nashville, TN, USA, 16–20 September 2013. [Google Scholar]
- Banin, L.; Schatzberg, U.; Amizur, Y. WiFi FTM and Map Information Fusion for Accurate Positioning. In Proceedings of the 2016 International Conference on Indoor Positioning and Indoor Navigation (IPIN), Alcalá de Henares, Spain, 4–7 October 2016. [Google Scholar]
- Wang, K.; Nirmalathas, A.; Lim, C.; Alameh, K.; Li, H.; Skafidas, E. Indoor infrared optical wireless localization system with background light power estimation capability. Opt. Express 2017, 25, 22923–22931. [Google Scholar] [CrossRef] [PubMed]
- Guo, G.; Chen, R.; Ye, F.; Peng, X.; Liu, Z.; Pan, Y. Indoor Smartphone Localization: A Hybrid WiFi RTT-RSS Ranging Approach. IEEE Access 2019, 7, 176767–176781. [Google Scholar] [CrossRef]
- Ibrahim, M.; Liu, H.; Jawahar, A.; Nguyen, V.; Gruteser, M.; Howard, R.; Yu, B.; Bai, F. Verification: Accuracy Evaluation of WiFi Fine Time Measurements on an Open Platform. In Proceedings of the 24th Annual International Conference on Mobile Computing and Networking, New Delhi, India, 29–31 October 2018; pp. 417–427. [Google Scholar]
- Hashem, O.; Youssef, M.; Harras, K.A. WiNar: RTT-based Sub-meter Indoor Localization using Commercial Devices. In Proceedings of the 2020 IEEE International Conference on Pervasive Computing and Communications (PerCom), Austin, TX, USA, 23–27 March 2020; pp. 1–10. [Google Scholar]
- Dvorecki, N.; Bar-Shalom, O.; Banin, L.; Amizur, Y. A Machine Learning Approach for Wi-Fi RTT Ranging. In Proceedings of the International Technical Meeting of The Institute of Navigation ION ITM 2019, Reston, VA, USA, 28–31 January 2019. [Google Scholar]
- Gentner, C.; Ulmschneider, M.; Kuehner, I.; Dammann, A. WiFi-RTT Indoor Positioning. In Proceedings of the 2020 IEEE/ION Position, Location and Navigation Symposium (PLANS), Portland, OR, USA, 20–23 April 2020; pp. 1029–1035. [Google Scholar]
- Yu, Y.; Chen, R.; Chen, L.; Guo, G.; Ye, F.; Liu, Z. A robust dead reckoning algorithm based on Wi-Fi FTM and multiple sensors. Remote Sens. 2019, 11, 504. [Google Scholar] [CrossRef] [Green Version]
- Han, K.; Yu, S.M.; Kim, S. Smartphone-based Indoor Localization Using Wi-Fi Fine Timing Measurement. In Proceedings of the 2019 International Conference on Indoor Positioning and Indoor Navigation (IPIN), Pisa, Italy, 30 September–3 October 2019; pp. 1–5. [Google Scholar]
- IEEE Draft Standard for Information Technology—Telecommunications and Information Exchange between Systems Local and Metropolitan Area Networks—Specific Requirements Part 11: Wireless LAN Medium Access Control (MAC) and Physical Layer (PHY) Specifications. In IEEE P802.11-REVmc/D2.0, October 2013; IEEE: New York, NY, USA, 2013; pp. 1–3237.
- Sharp, I.; Yu, K. Enhanced Least-Squares Positioning Algorithm for Indoor Positioning. IEEE Trans. Mob. Comput. 2013, 12, 1640–1650. [Google Scholar] [CrossRef]
- Li, L.; Shi, J.; Kang, Y.; Duan, J.; Sun, P. An Indoor Positioning Research Based On The Least Square Method Of Monte Carlo. In Proceedings of the 2018 Ubiquitous Positioning, Indoor Navigation and Location-Based Services (UPINLBS), Wuhan, China, 22–23 March 2018; pp. 1–6. [Google Scholar]


| Method | ME | RMSE |
|---|---|---|
| Range calibration | 0.864 | 1.020 |
| No range calibration | 1.067 | 1.200 |
| Method | 50% | 70% | 90% | ME | RMSE |
|---|---|---|---|---|---|
| LS | 1.461 | 2.29 | 4.063 | 2.031 | 2.606 |
| LS based on LOS | 1.012 | 1.339 | 1.848 | 1.110 | 1.245 |
| The proposed method | 0.748 | 1.010 | 1.554 | 0.862 | 0.989 |
Publisher’s Note: MDPI stays neutral with regard to jurisdictional claims in published maps and institutional affiliations. |
© 2020 by the authors. Licensee MDPI, Basel, Switzerland. This article is an open access article distributed under the terms and conditions of the Creative Commons Attribution (CC BY) license (http://creativecommons.org/licenses/by/4.0/).
Share and Cite
Cao, H.; Wang, Y.; Bi, J.; Xu, S.; Si, M.; Qi, H. Indoor Positioning Method Using WiFi RTT Based on LOS Identification and Range Calibration. ISPRS Int. J. Geo-Inf. 2020, 9, 627. https://0-doi-org.brum.beds.ac.uk/10.3390/ijgi9110627
Cao H, Wang Y, Bi J, Xu S, Si M, Qi H. Indoor Positioning Method Using WiFi RTT Based on LOS Identification and Range Calibration. ISPRS International Journal of Geo-Information. 2020; 9(11):627. https://0-doi-org.brum.beds.ac.uk/10.3390/ijgi9110627
Chicago/Turabian StyleCao, Hongji, Yunjia Wang, Jingxue Bi, Shenglei Xu, Minghao Si, and Hongxia Qi. 2020. "Indoor Positioning Method Using WiFi RTT Based on LOS Identification and Range Calibration" ISPRS International Journal of Geo-Information 9, no. 11: 627. https://0-doi-org.brum.beds.ac.uk/10.3390/ijgi9110627