Article

Research Progress and Development Trend of Social Media Big Data (SMBD): Knowledge Mapping Analysis Based on CiteSpace

1
School of Architecture and Urban Planning, Nanjing University, Nanjing 210093, China
2
School of Geography, Geomatics and Planning, Jiangsu Normal University, Xuzhou 221116, China
3
Faculty of Urban Construction, Beijing University of Technology, Beijing 100124, China
4
Institute of Geographic Sciences and Natural Resources Research, Chinese Academy of Science, Beijing 100101, China
*
Author to whom correspondence should be addressed.
ISPRS Int. J. Geo-Inf. 2020, 9(11), 632; https://doi.org/10.3390/ijgi9110632
Submission received: 21 September 2020 / Revised: 15 October 2020 / Accepted: 22 October 2020 / Published: 26 October 2020
(This article belongs to the Special Issue Geovisualization and Social Media)

Abstract

:
Social Media Big Data (SMBD) is widely used to serve the economic and social development of human beings. However, as a young research and practice field, the understanding of SMBD in academia is not enough and needs to be supplemented. This paper took Web of Science (WoS) core collection as the data source, and used traditional statistical methods and CiteSpace software to carry out the scientometrics analysis of SMBD, which showed the research status, hotspots and trends in this field. The results showed that: (1) More and more attention has been paid to SMBD research in academia, and the number of journals published has been increased in recent years, mainly in subjects such as Computer Science Engineering and Telecommunications. The results were published primarily in IEEE Access Sustainability and Future Generation Computer Systems the International Journal of eScience and so on; (2) In terms of contributions, China, the United States, the United Kingdom and other countries (regions) have published the most papers in SMBD, high-yield institutions also mainly from these countries (regions). There were already some excellent teams in the field, such as the Wanggen Wan team at Shanghai University and Haoran Xie team from City University of Hong Kong; (3) we studied the hotspots of SMBD in recent years, and realized the summary of the frontier of SMBD based on the keywords and co-citation literature, including the deep excavation and construction of social media technology, the reflection and concerns about the rapid development of social media, and the role of SMBD in solving human social development problems. These studies could provide values and references for SMBD researchers to understand the research status, hotspots and trends in this field.

1. Introduction

Social Media (SM) is an internet application program with online interactive characteristics, which is one of the primary mediums for people to use the Internet. It is characterized by an interactive social network where users participate, reshape, and share information, connecting to the users ultimately [1]. People could send relevant events, comments, opinions, and insights to the world by social media anytime, anywhere [2]. Social media has already become an important part of life [3]. With the spread of social media, people’s use of social media has generated a lot of structured/unstructured data [4]. In particular, the emergence of typical social media such as Facebook, Twitter, TikTok, Weibo and so on has made it possible for the public to access and post information and data more quickly and efficiently through the Internet [5]. Social Media Big Data (SMBD) has absolutely aroused the general concern of the academy.
A review of previous studies on SMBD covered a wide range of topics, including the definition of SMBD [6], application [7], algorithm [8], model [9], classification [10], analysis method [11], etc. Capsella [12] argued that the convergence of big data, computing, and social media reshaped human interaction and the impact of social norms. This was a cross-cutting area of study for internet science, marketing, and computer science. Jiang et al. [13] made an affective identification of news events in Social Media Big Data, which was based on the two steps: affective word calculation and standard affective word library extraction. Sibulela et al. [14] developed an analytical framework for dealing with the complex correlation between social media and medical big data, which could be used to guide community health care institutions to integrate with medical big data through social media. Zhang, Daniel [15] developed the Scalable and Robust Truth Discovery (SRTD) scheme that took into account the credibility of the data collection to identify real information about the research. At the same time, SMBD was also widely used in economic and social development, urban and rural construction, production safety, disaster prevention and control and other fields. For example, during the 2020 COVID-19 outbreak in China, Weibo’s “pneumonia help-seeking” mega-topic brought care to neglected groups. Tencent’s “big data on population migration” facilitated forecasting of the route and intensity of the virus transmission. Baidu’s “real-time big data report of the epidemic situation” and “platform for refuting rumors of epidemic situation” played an important role in the timely understanding of the epidemic situation and reduced the panic of the epidemic situation [16,17].
However, as a relatively young research and practice area, the academic community’s understanding of Social Media Big Data is still not enough. Especially in the research status, there is still a gap in the research hot spots trends. At the same time, different researchers interpreted and applied SMBD from different professional standpoints, which made the research focus on the SMBD field keep increasing [18], and the research has become more and more complex. To help scholars and relevant practitioners understand the current situation and future trends of SMBD research, it was necessary to systematically analyze the existing research results.
Therefore, this paper made a scientometrics analysis of the research achievements in SMBD in the past 10 years (2010–2020) and displayed the development of SMBD in this field in the form of knowledge mapping, which provided reliable information for relevant researchers, basic knowledge structure, and the basic direction of advanced research. The rest of this article was arranged as follows: Firstly, we introduced the detailed process of data collection and the specific information of the supporting platform. Then we analyzed the data, including the number of publications, authors, areas of study, countries/regions, and institutional networks. Next, we implemented a co-citation analysis of SMBD, hot spot analysis, and research frontier analysis. Finally, we summarized the main findings and pointed out the limitations of current research.

2. Data and Methods

2.1. Data Sources

WoS (Web of Science) is an information retrieval platform developed by Thomson Reuters that includes databases such as SCIE, SSCI, and A&HCI [19]. WoS keeps a detailed record of all aspects of the publication of the paper. Many scholars and researchers used the WoS database as the data source of bibliometrics and analysis of the literature [20,21]. Therefore, to ensure the accuracy and reliability of the data, this paper used publications in the Web of Science core collection database as the sample data source to analyze the field of SMBD. The retrieval strategy was as follows: set the retrieval Table topic = “Social media big data” or “Social media visualization” or “Social network big data” or “Social network visualization”, set the language to “English”, selected the document type to “Article”, set the period time span of the article to “2010–2020”. A total of 2493 effective publications were retrieved, and the retrieval results were saved and output in text format, each document contained authors, institutions, keywords, abstract, date and other information.

2.2. Analysis Tools

To achieve an objective and comprehensive survey of the publication in the field of study, we combined the traditional statistical method and scientific knowledge mapping tool CiteSpace to describe the research status, hotspots and trends of SMBD in detail (Figure 1). CiteSpace is a data visualization software developed by the team of Chen Chaomei, which is widely used in many fields such as science, information and bibliometrics. It could visualize the location and size of nodes in the knowledge network. In this paper, the software was used to analyze the knowledge base, research hotspots and development context by using the modules of country, institution, author, keyword and reference. The software was used to analyze the SMBD research field visually and draw the corresponding knowledge map. The parameters were as follows: Node Type: Selection based on analysis; Time Period: 2010–2020; Time Slice Length = 1; Threshold Selection Criteria: Top 25 per slice; others were default settings. Detailed parameters were listed in the upper left corner of each knowledge map. N, E and Density represented the number of nodes, connection, and the network density respectively. In the cluster graph, the silhouette value was used to measure the homogeneity of the network. The closer to 1, the higher homogeneity of the network was, and the value above 0.5 indicates that the cluster result was reasonable. Meanwhile, the color and size of each node represented different years and the number of citations, which were used to represent the citation history of the literature since its publication.

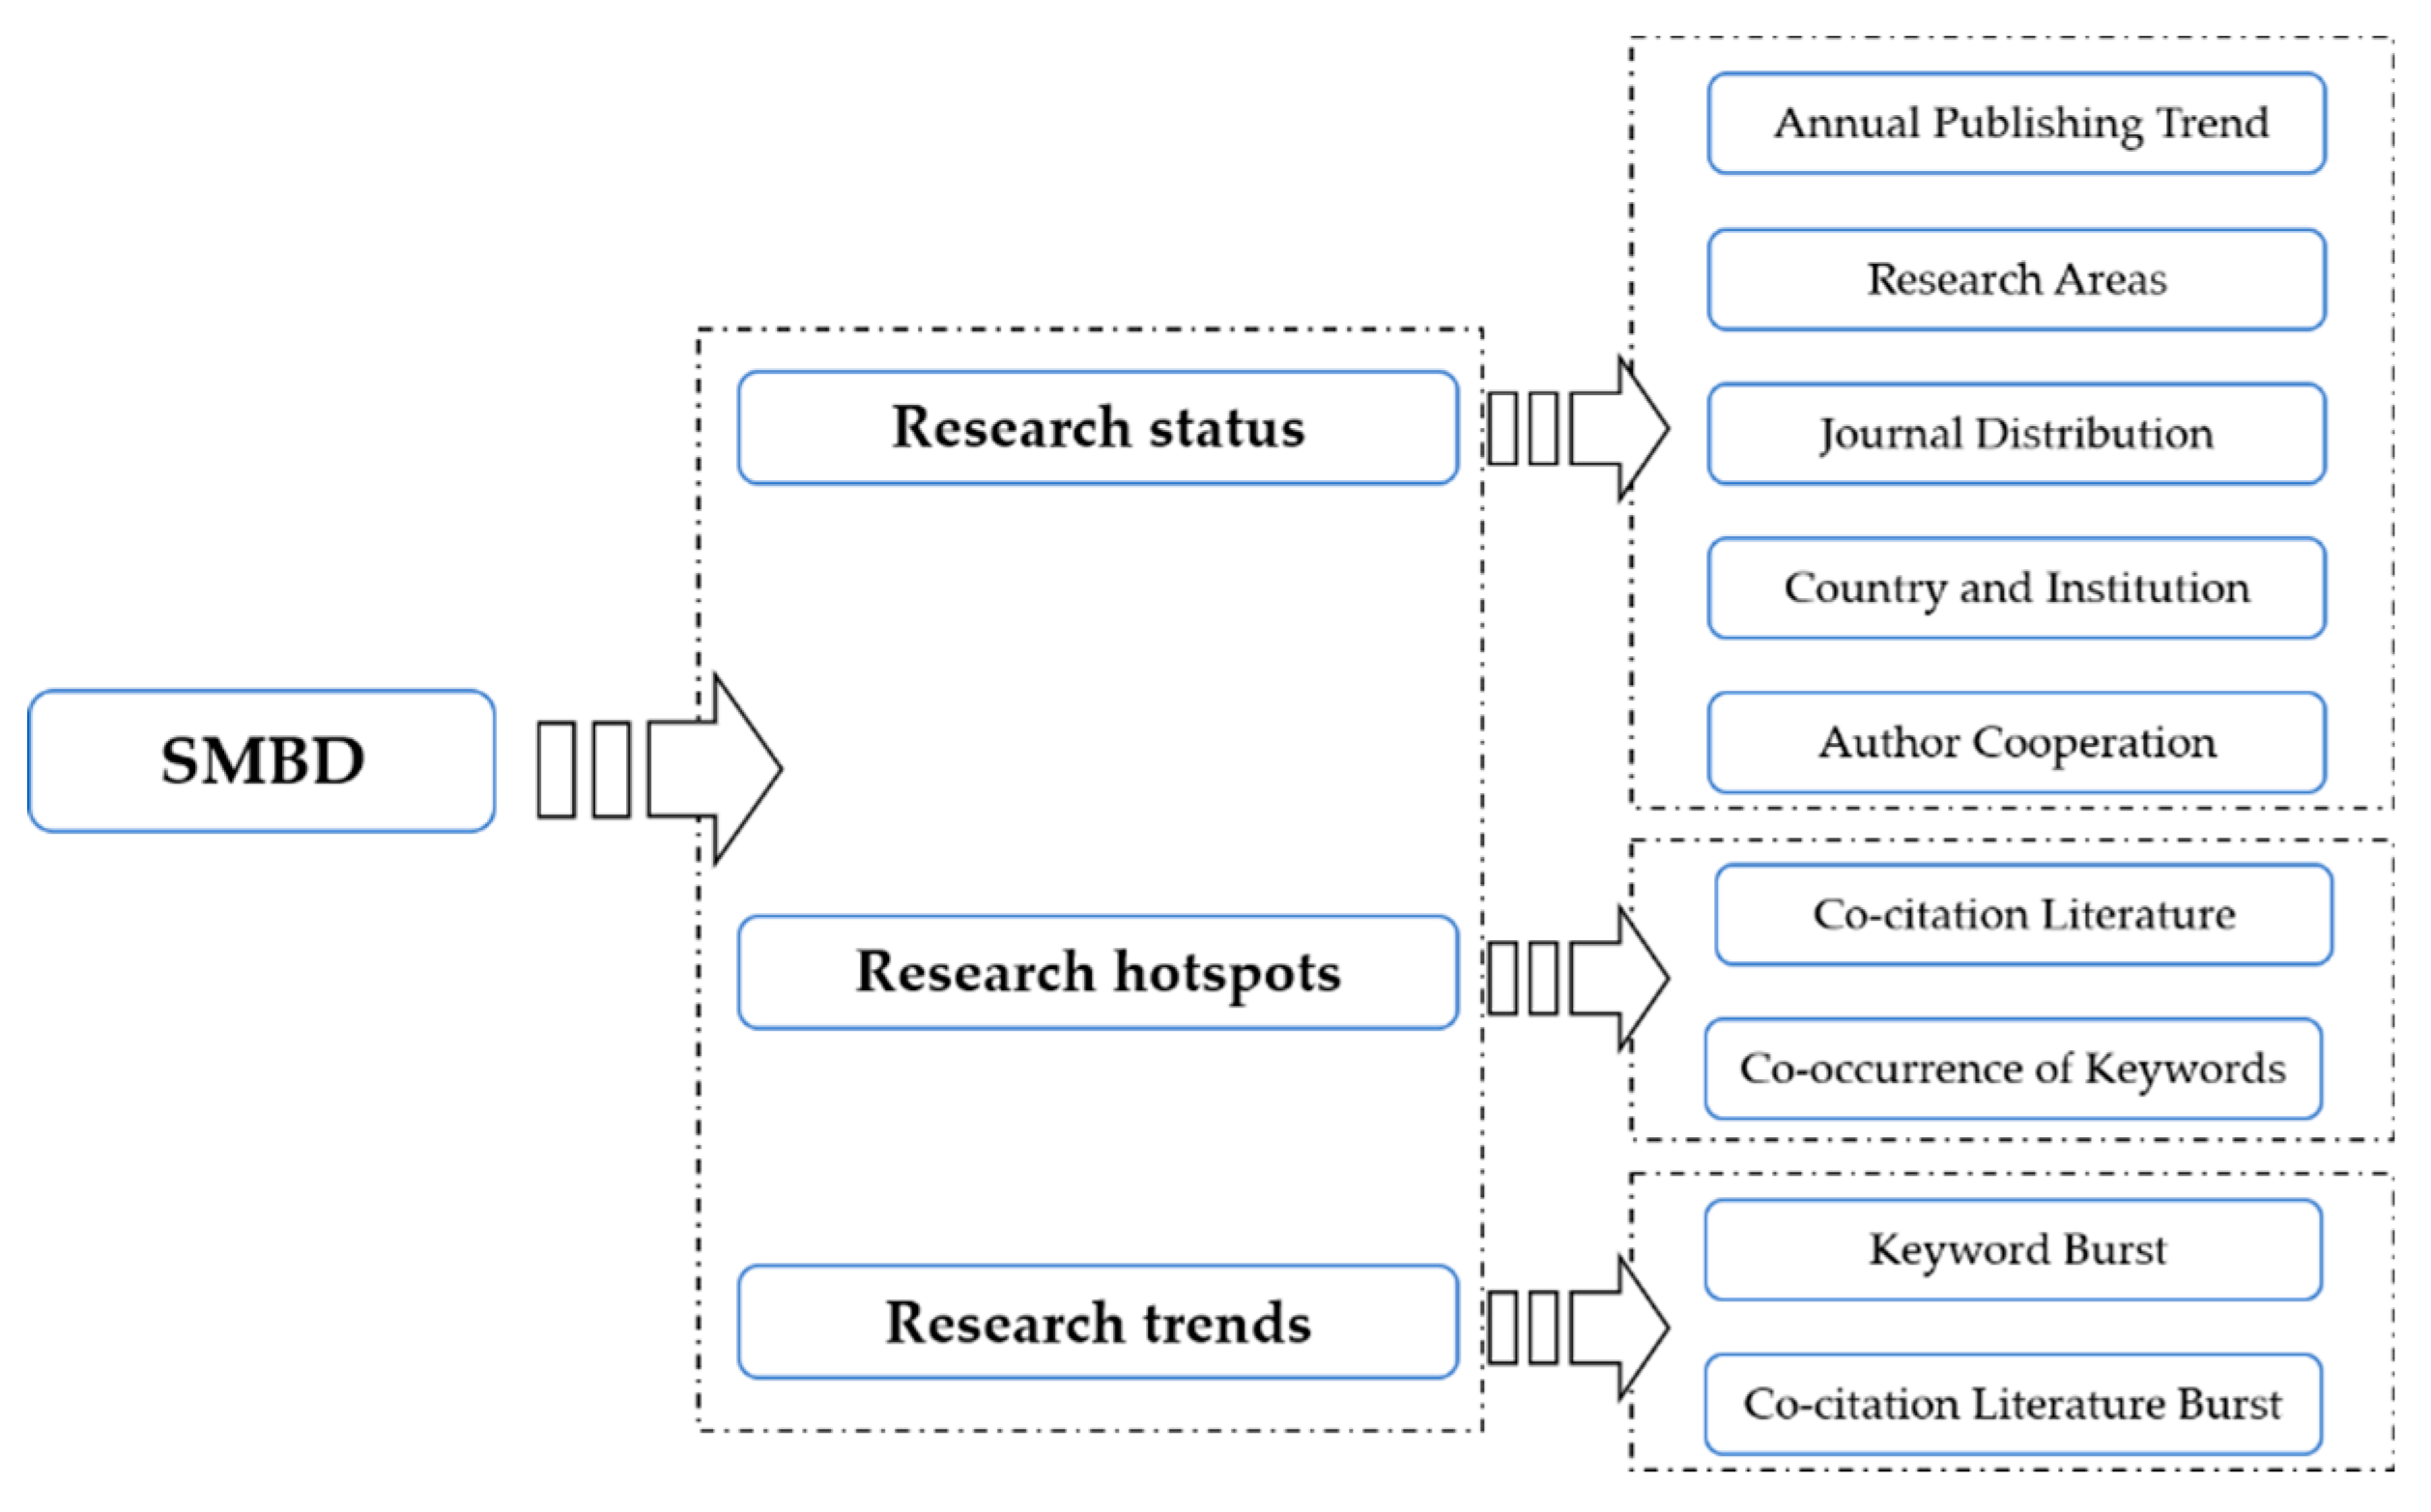
3. Analysis and Discussion of Results

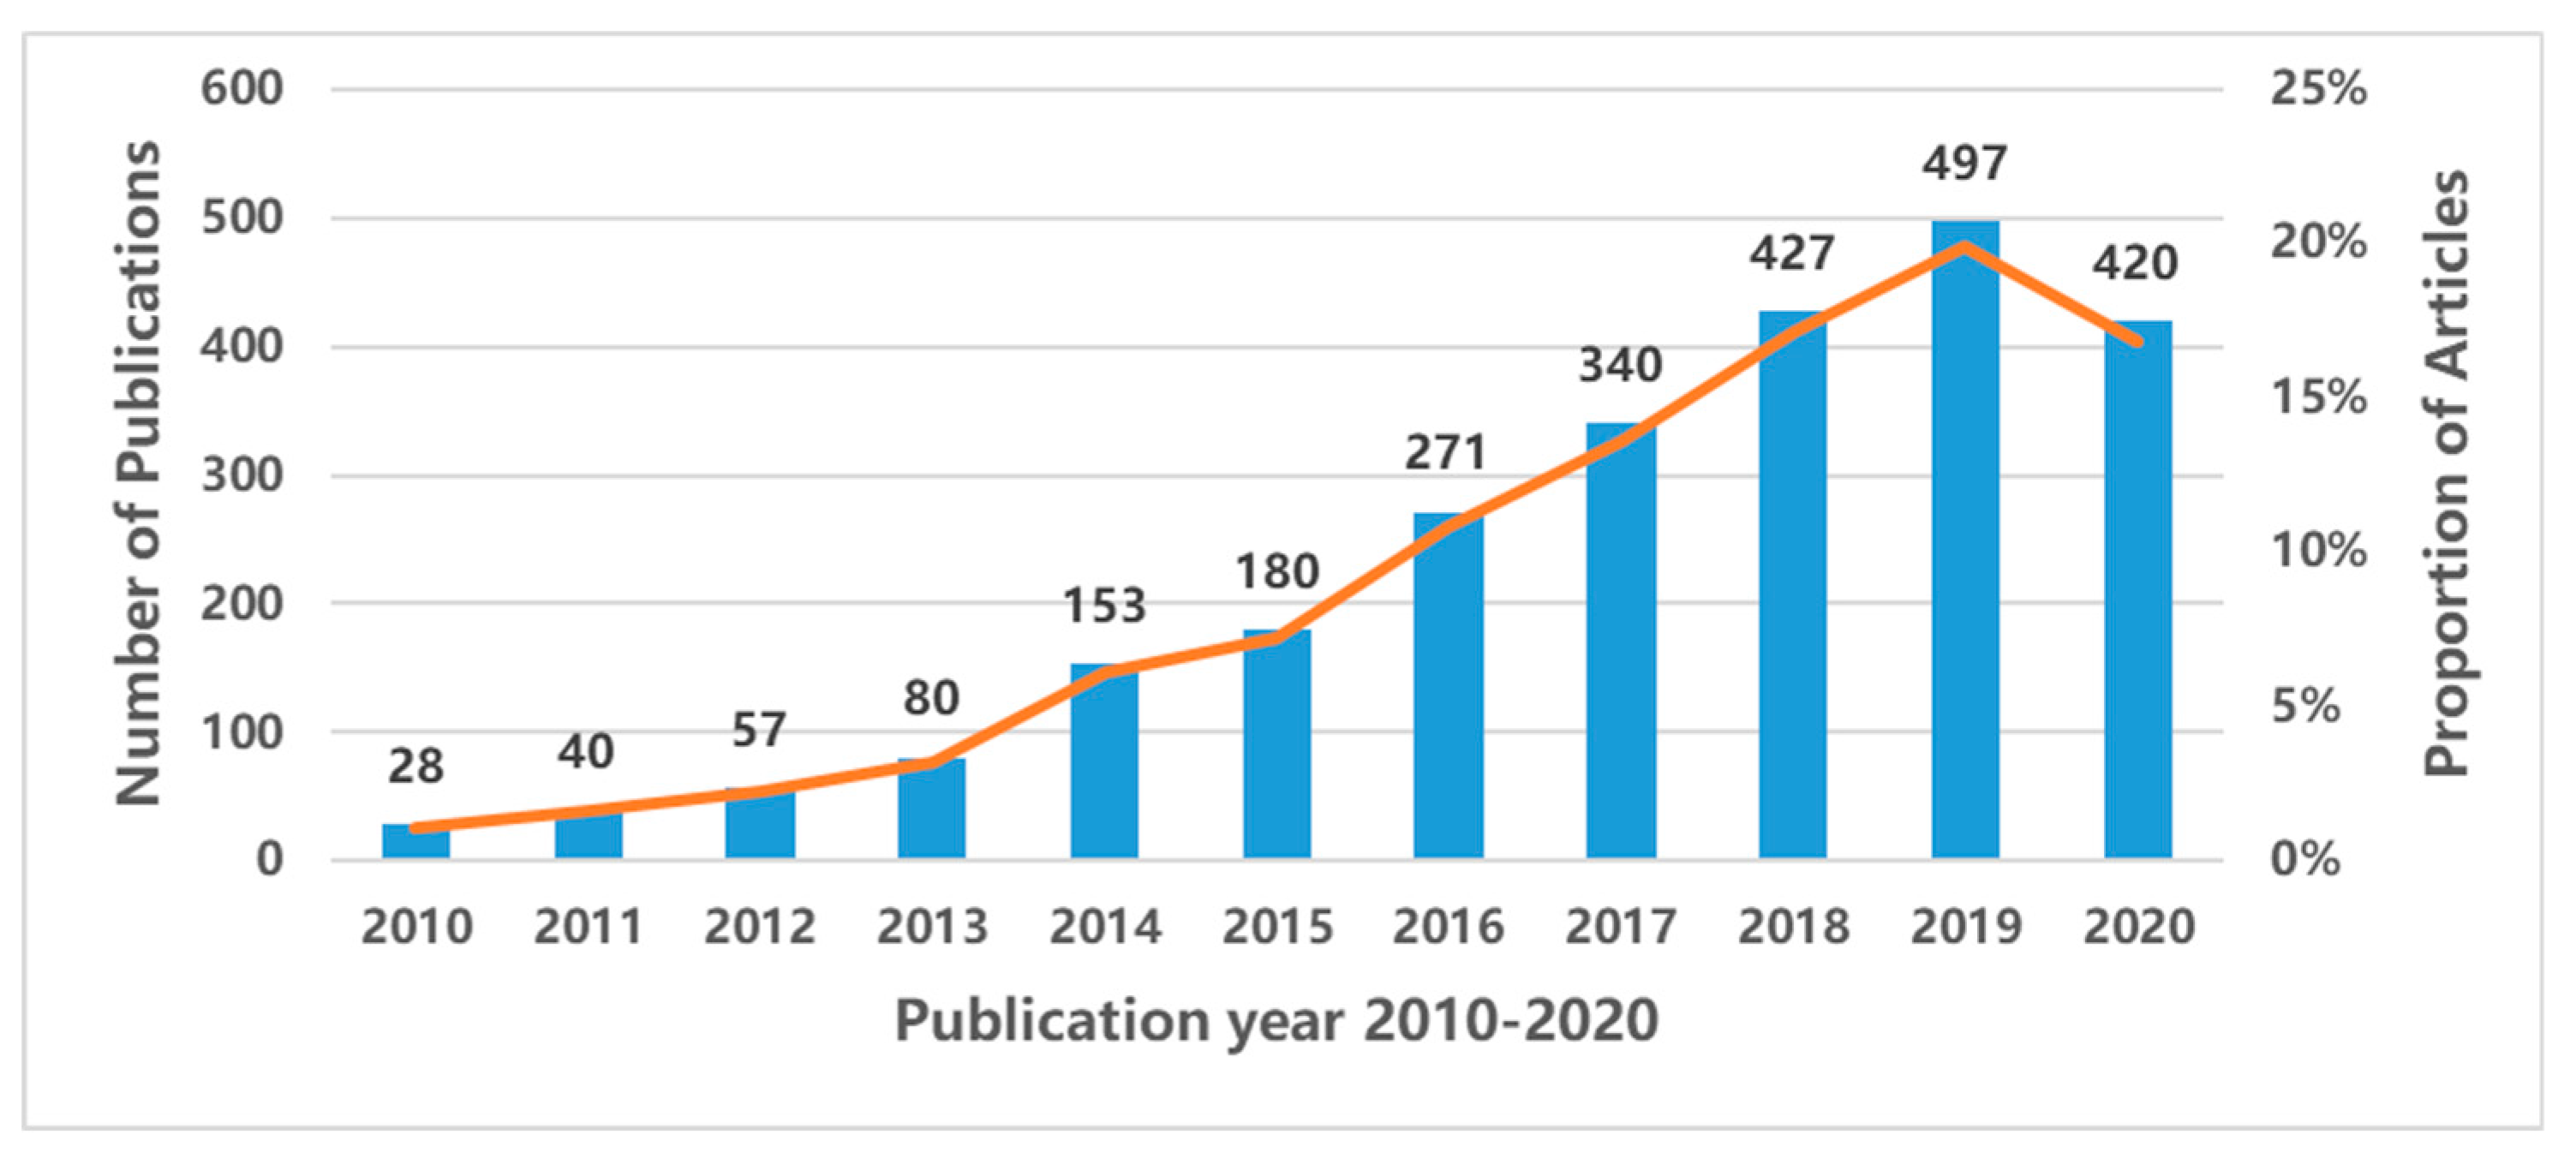
3.1. Annual Publishing Trend

In order to make an in-depth analysis of SMBD trends, we collected the number of publications from the WoS core collection from 2010 to 2020 (Figure 2). We found that the number of publications in SMBD increased slowly from 2010 to 2013, and did not show a significant growth trend until 2014. From 2010 to 2013, the average annual output was 51; while from 2014 to 2016, the average annual output was 201. In addition, in the last five years (2016–2020), 78.42% of the articles (1955 out of 2493) were published. This showed that research in SMBD was novel, and the research heat has been increased in the past five years. It should be noted that we do not have complete data for 2020 because the date of data collection for these publications ended in September 2020.

3.2. Web of Science Categories

Through the analysis of SMBD literature, we could accurately understand the focus of scientific research in this field. According to the discipline system of WoS, 2493 articles in SMBD could be divided into 110 research areas/directions. Moreover, one article might cover one or more fields of research, which made the number of articles corresponding to the research field more, and it also reflected the interdisciplinary character of the SMBD field. Table 1 shows the top 10 research areas with more than 85 articles. As a whole, SMBD was mainly studied in the field of Computer and Engineering, and Computer Science was the top research field, with a total of 1338 articles, accounting for 53.67% of the total. Next, Engineering (568), Telecommunications (298), Science Technology Other Topics (243), Environmental Sciences Ecology (215) and so on were the key fields of research in SMBD. Finally, Information Science Library Science (5.93%), Operations Research Management Science (3.57%), Physical Geography (3.45%) were potential areas of SMBD research. In other words, SMBD has been paid attention to by many subjects, and SMBD reflected the characteristics of interdisciplinary, multi-domain co-construction and multi-direction integration.

3.3. Journal Analysis

By analyzing the distribution of journals in this field, we could accurately identify the main part of the academic research, and papers published in such journals could be supported by academic research [22]. In general, the greater the journal Total Publications (TP), the greater the contribution to the field, the greater the journal Impact Factor (IF), and the higher the H-index, the greater the academic impact of the journal [23]. Table 2 lists the top 10 journals that published in SMBD research articles. The number of publications in these journals was about 22.42% of the total number of publications in this field. The number of articles published in IEEE Access was the largest, with 137 articles, accounting for 5.495% of total, and the comprehensive Impact Factor was 3.745 in 2019. Second was Sustainability, with 93 articles (3.73%), Future Generation Computer Systems the International Journal of eScience, with 62 articles (2.487%). In terms of the journal’s Impact Factor and H-index, Future Generation Computer Systems and the International Journal of eScience had the highest IF. The Journal PLoS One had the highest H-index, but the IF was only 2.74. IF and H-index of journals IEEE Transactions on Visualization and Computer Graphics, Journal of Medical Internet Research, Information Sciences were higher, but the quantity of articles was less.

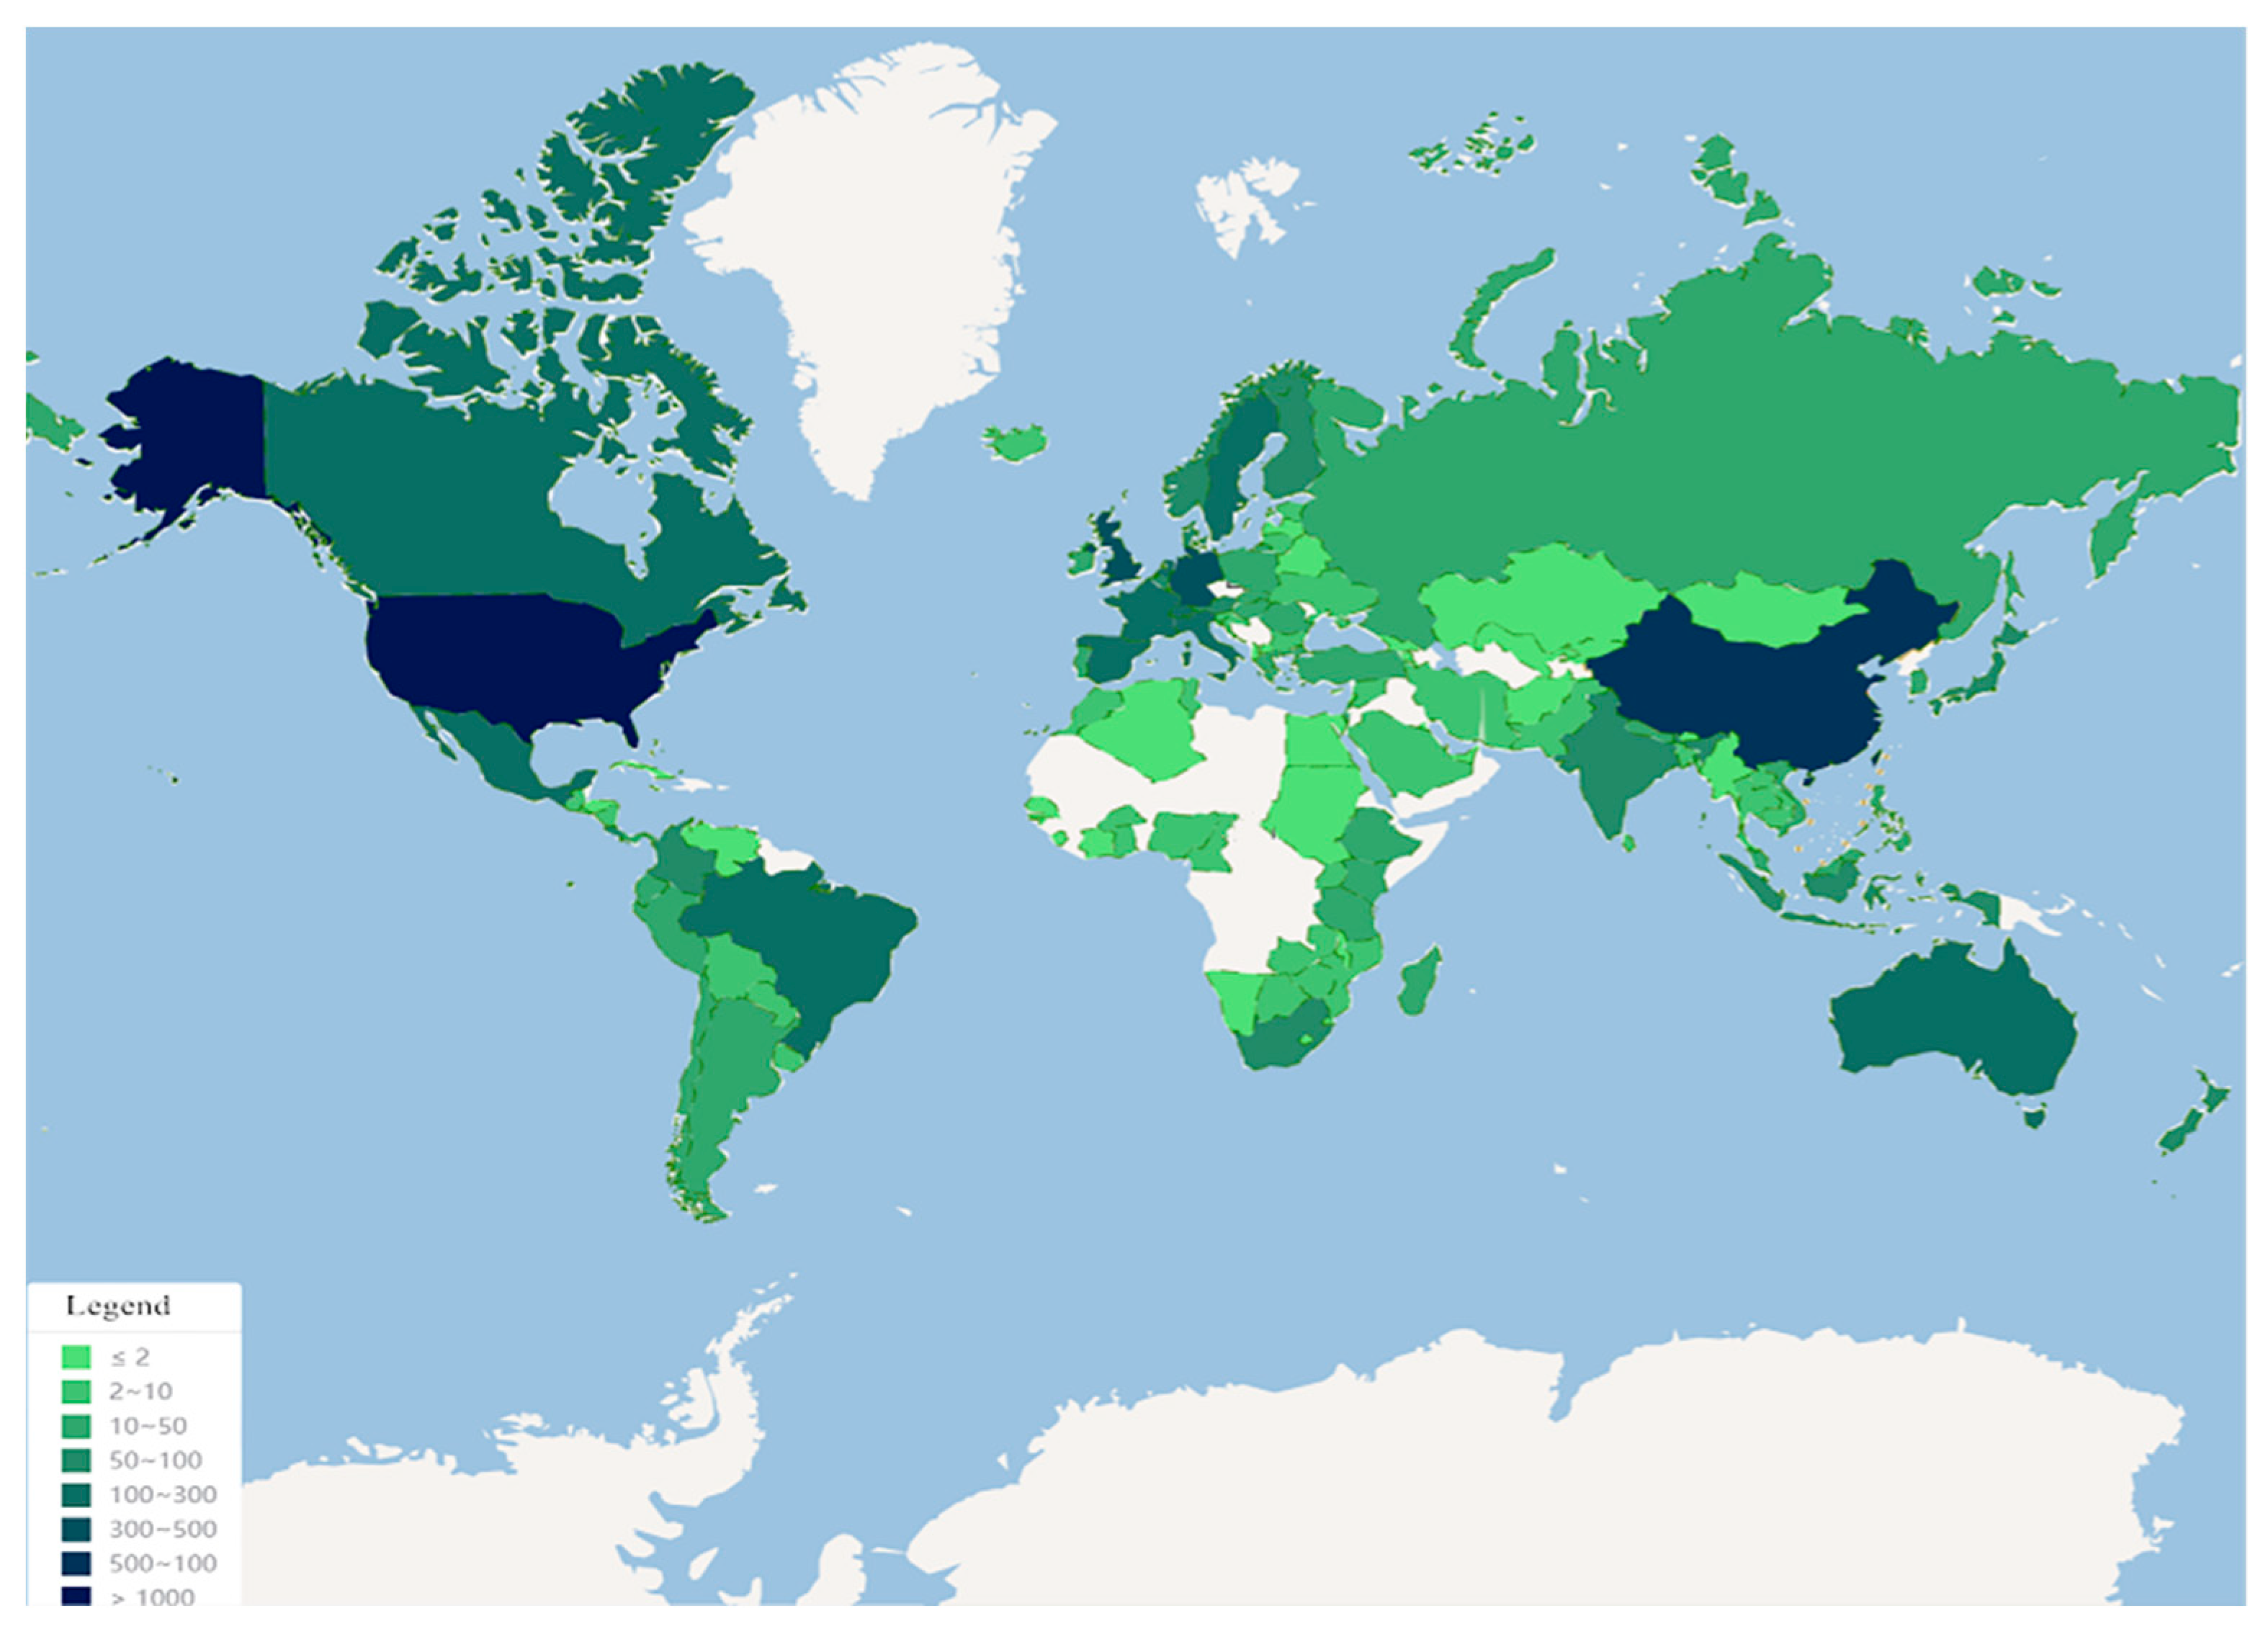
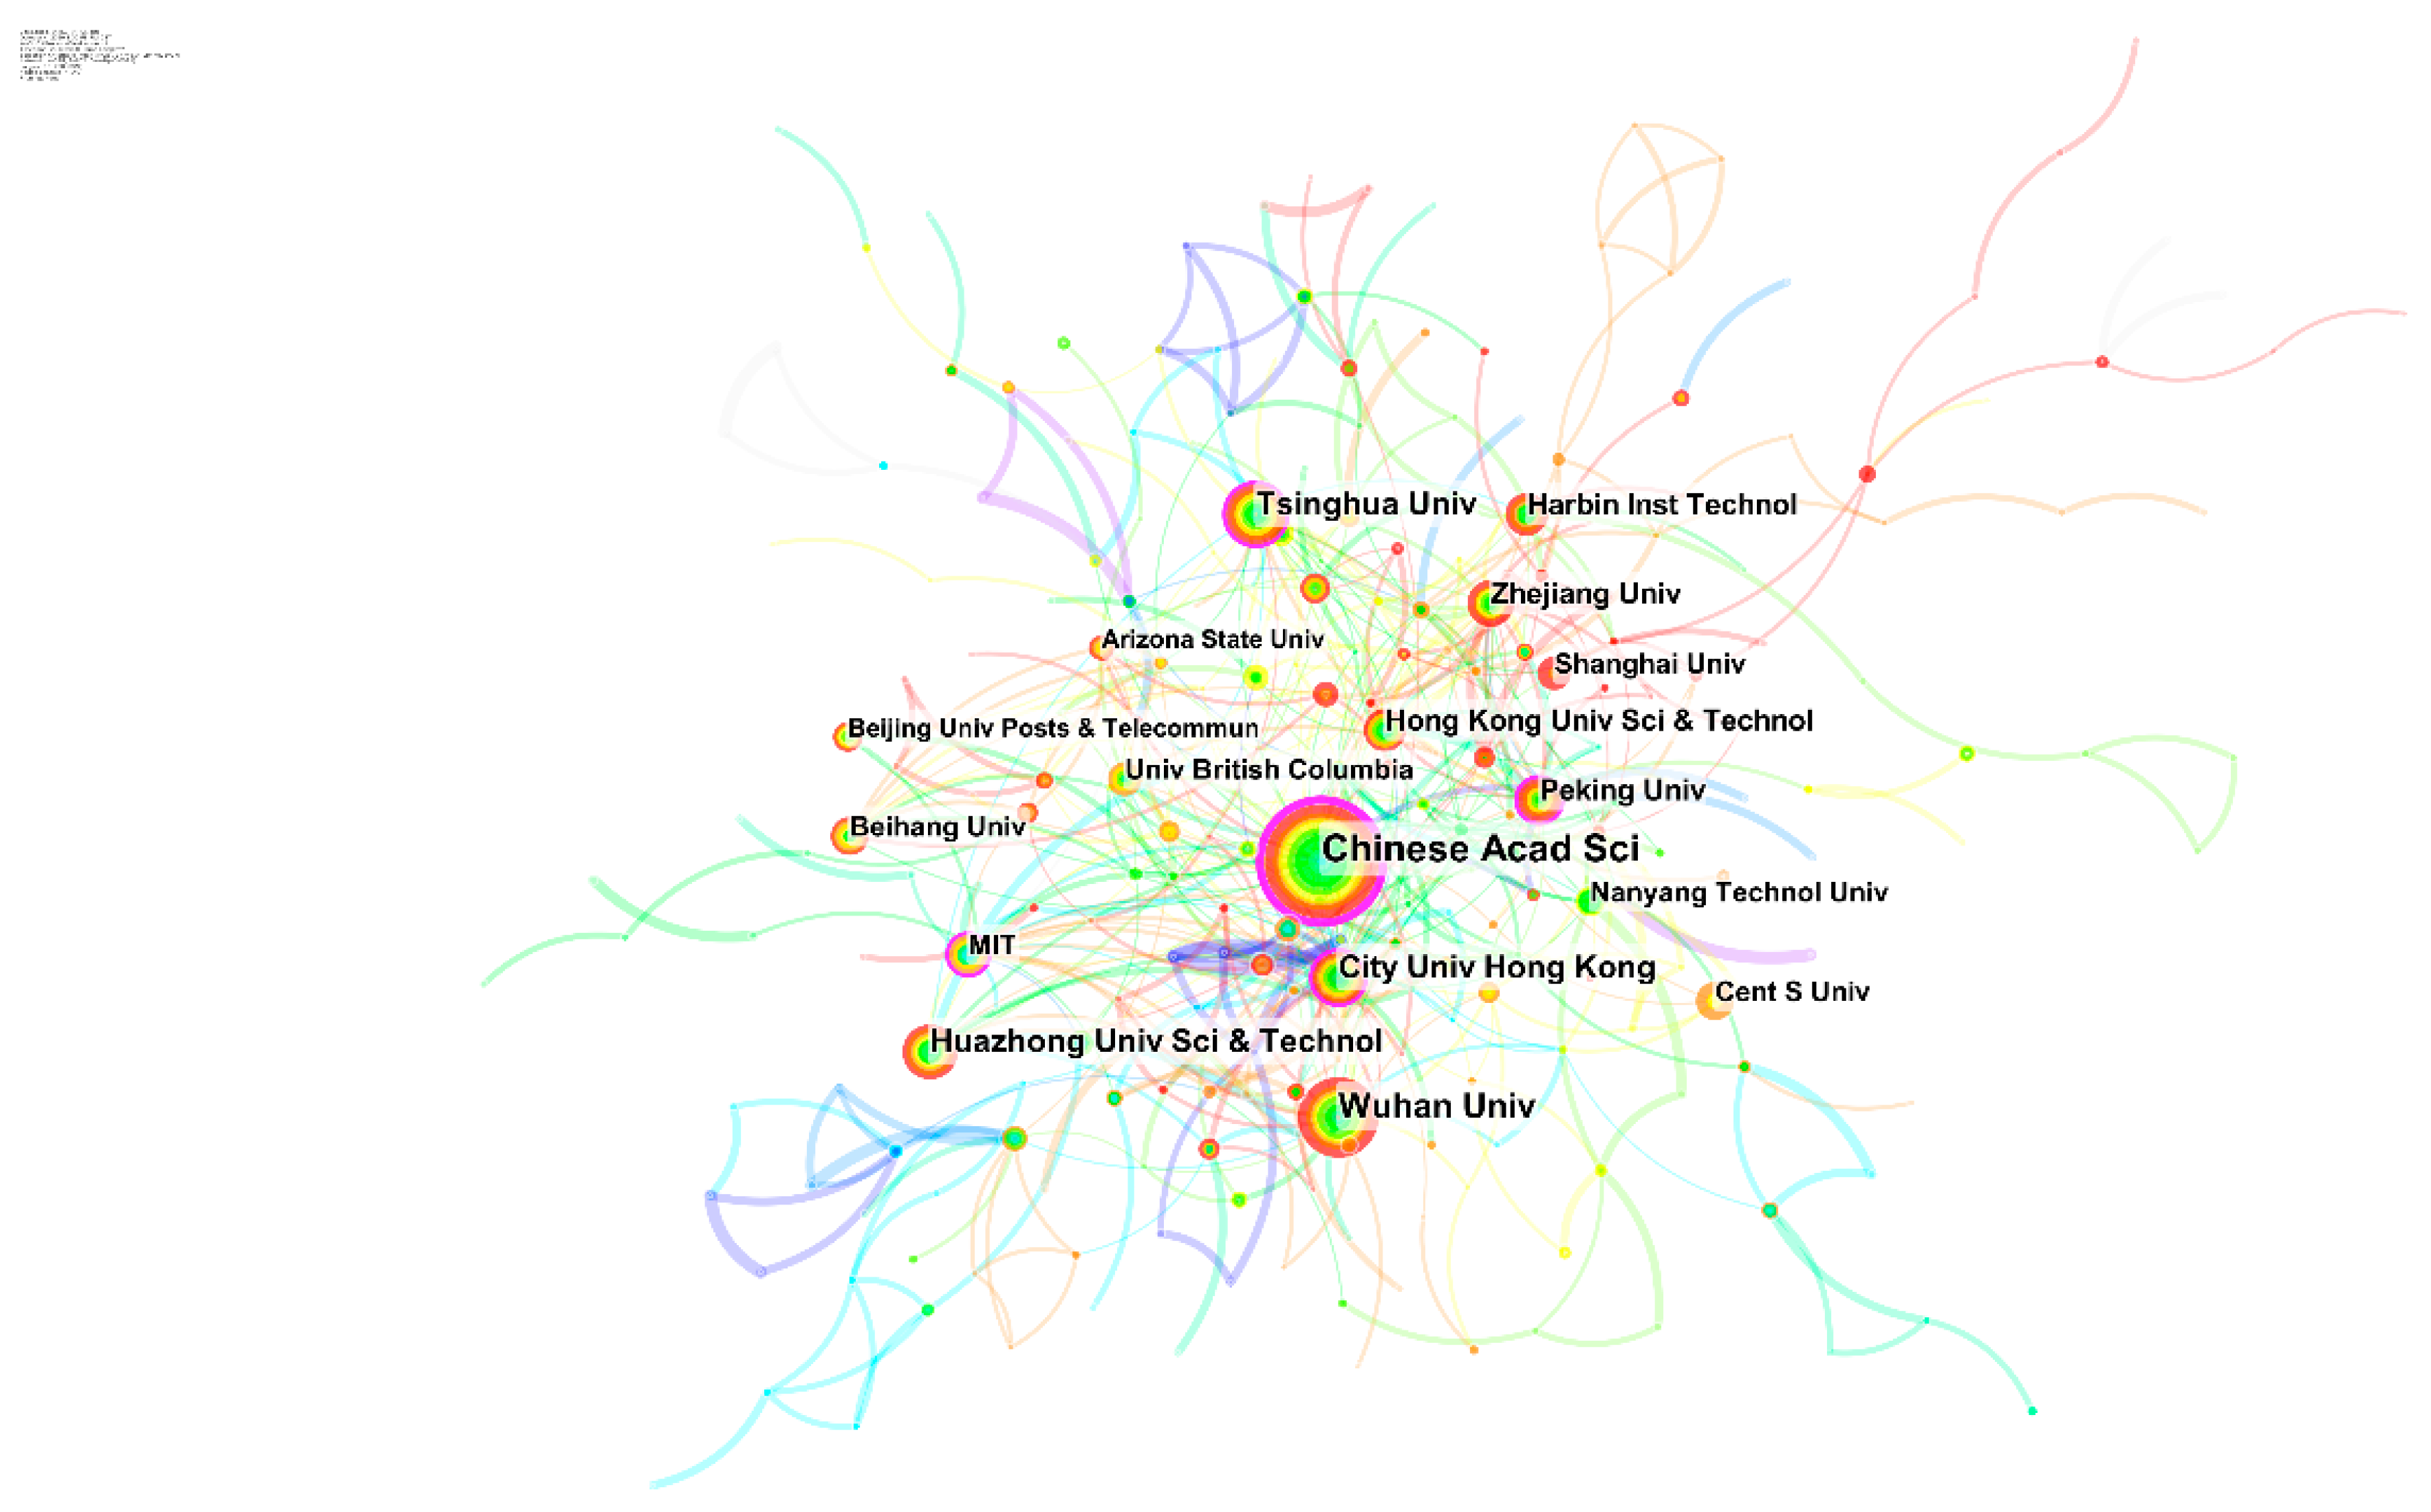
3.4. Country and Institutional Analysis

Number of national/regional publications reflects the degree of the country/region’s contribution to the research in this field. Based on the data of literature published by countries with SMBD in the WoS core collection, the top 10 countries were sorted according to the number of publications published. As shown in Figure 3, China ranked first (739 articles), accounting for 29.643% of the total data collected. Then came the United States (722 articles), the United Kingdom (240 articles) and South Korea (159 articles), which covered 44.966% of all publications in the dataset. Centrality is an indicator that measures the importance of nodes in the network, and it is used to measure the importance of specific pieces of nodes in CiteSpace. The centrality of country reflected the international recognition of a country in the field of SMBD development research. According to Table 3, the United Kingdom had the highest degree of centrality (centrality = 0.2), the second was the United States (centrality = 0.19). Although China was ranked first in the number of publications published, the centrality was less than other countries. From this part, it reflected the weak international influence of China’s research results in the SMBD despite its large number of publications.
CiteSpace was used to establish an institutional cooperation network to reflect the contribution and cooperation degree of each institution in the SMBD research field. Figure 4 shows the Institution Collaboration Network, which consists of 385 institutional nodes with 602 connections. The thicker connection line indicates the closer cooperation between institutions, and each link between two different institutions is represented by a spectrum of colors corresponding to the years of occurrence. Higher central synthesis values were Chinese Academy of Science, Wuhan University, Tsinghua University, City University of Hong Kong, Huazhong University Science and Technology, Zhejiang University and Peking University, which played intermediary and leading roles. The close cooperation between these institutions could be seen clearly from the connection. In addition, global distribution of SMBD research institutions was uneven. The top 15 institutions with the largest number of papers published are mainly located in China and the USA.

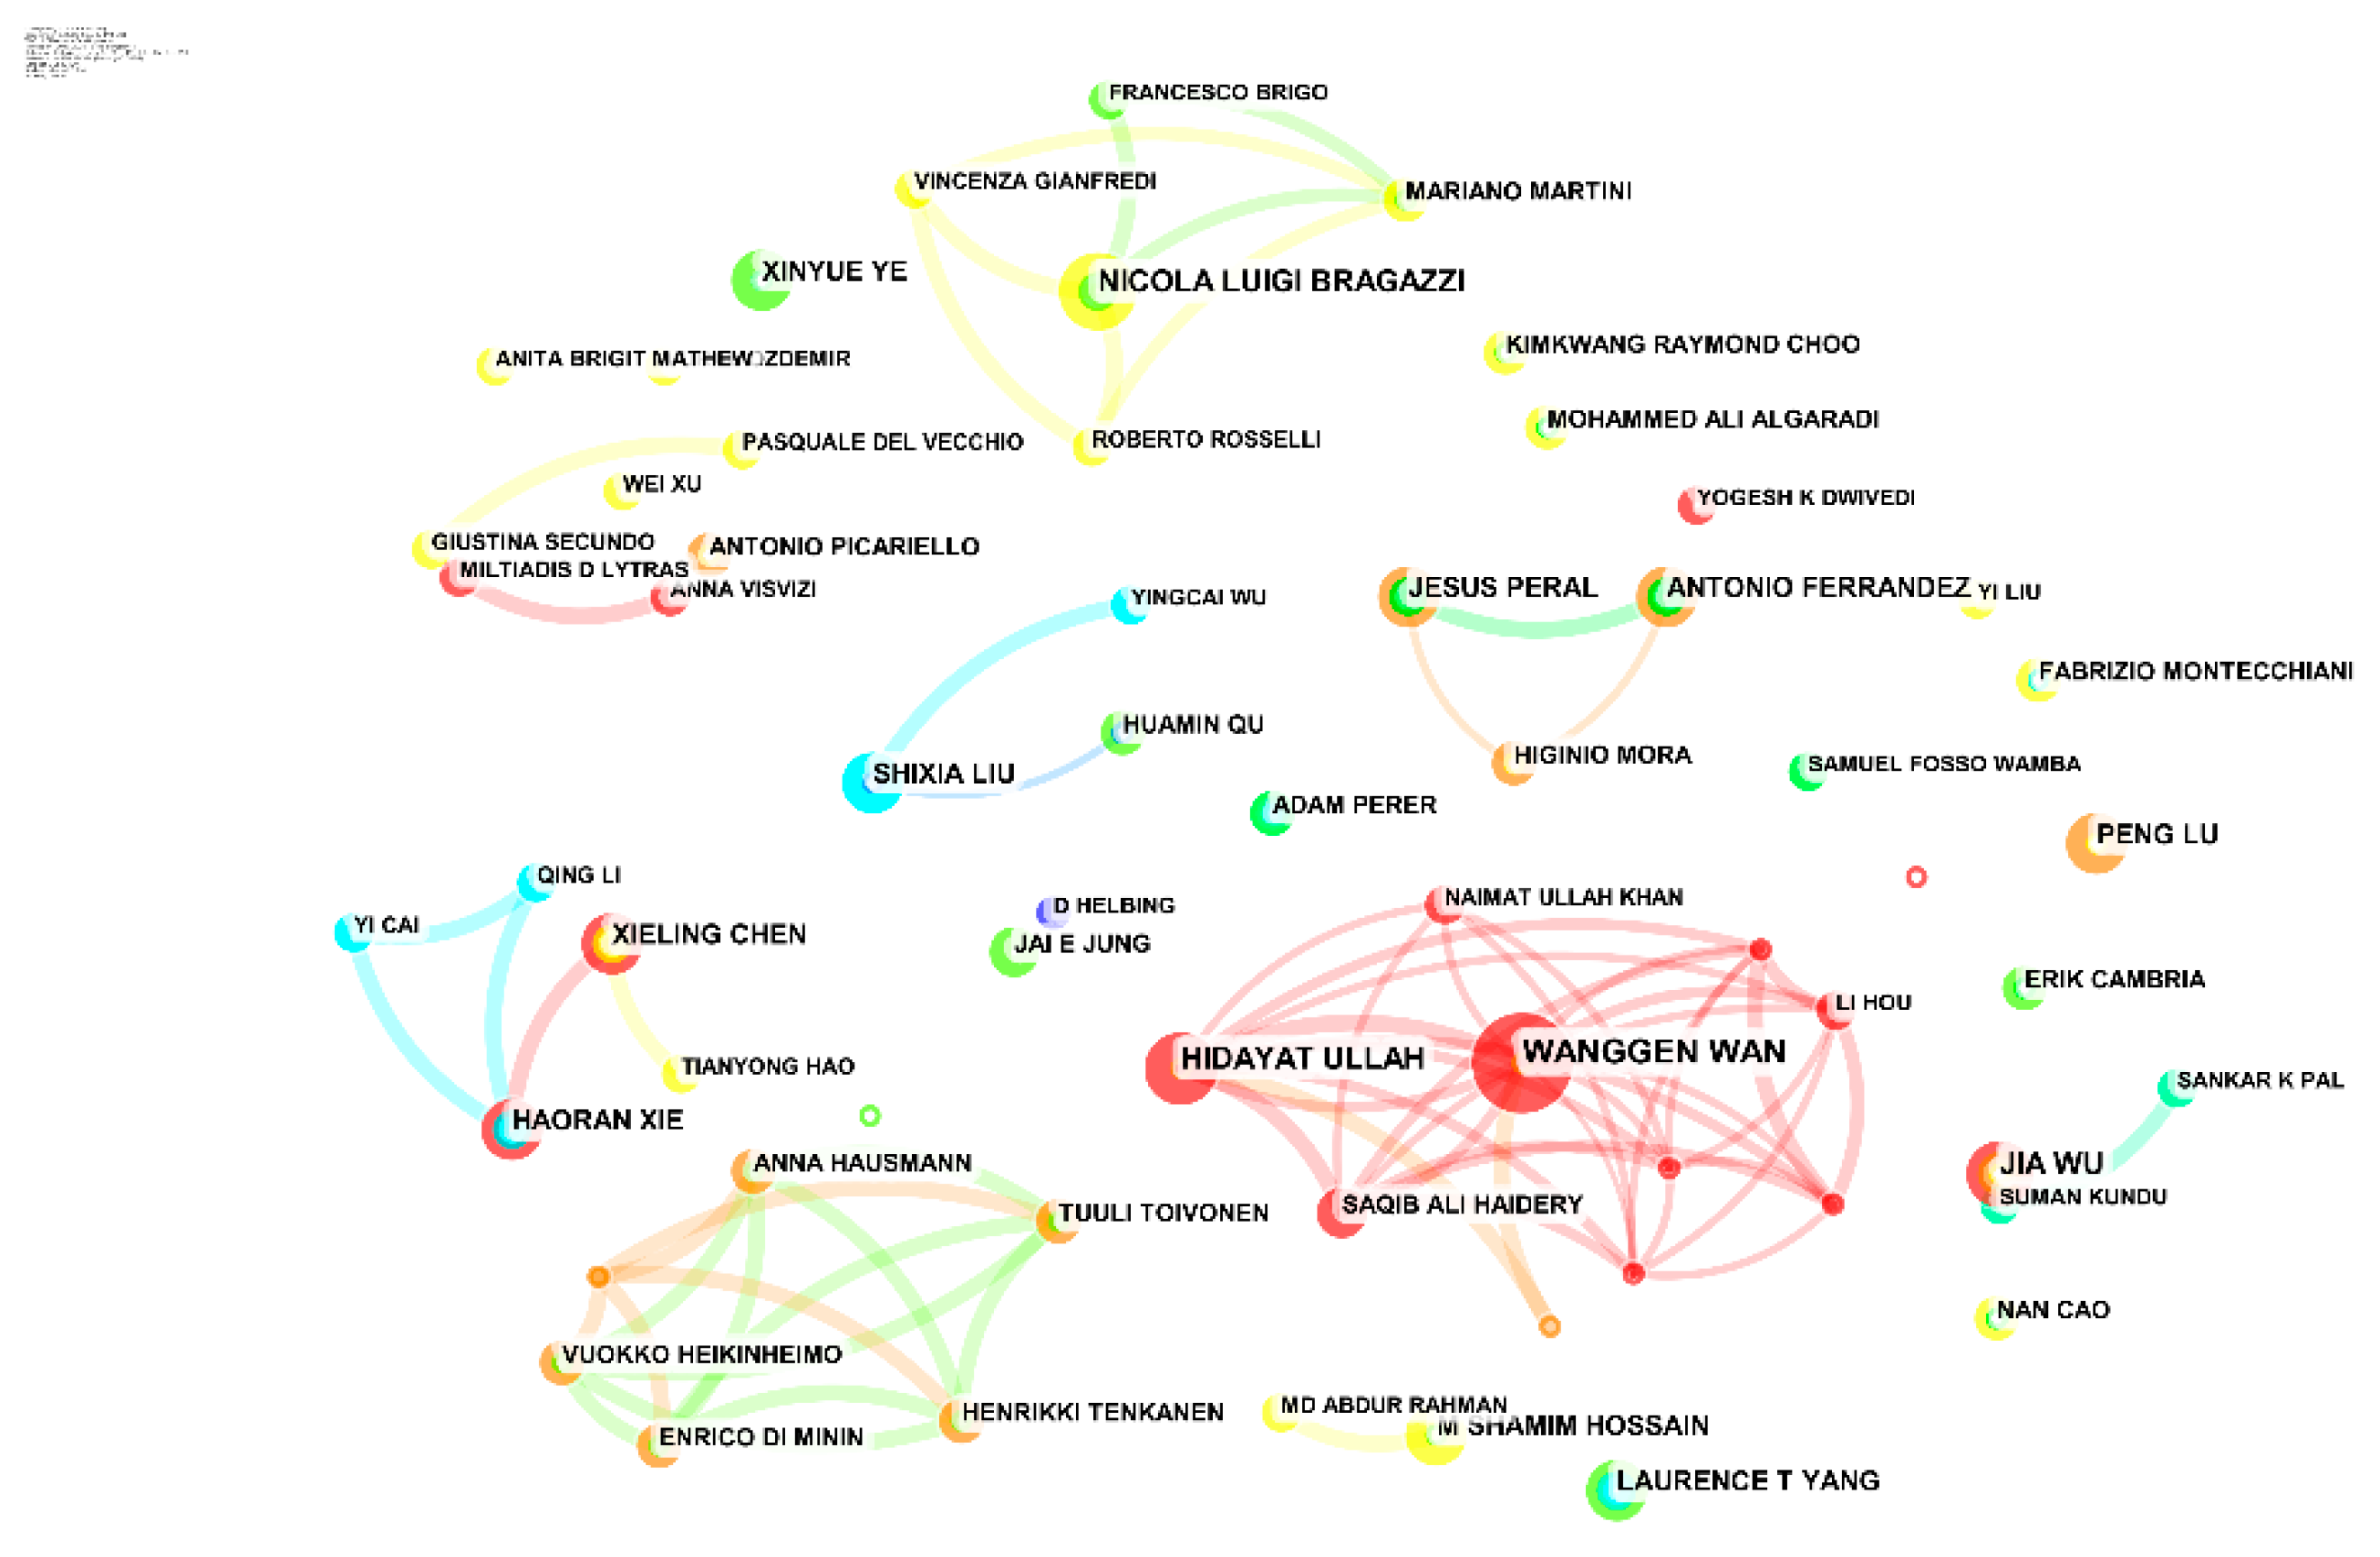
3.5. Author Analysis

Authors’ Cooperative Network analysis could reflect the core authors, authors’ cooperative intensity and mutual citation in a certain field, and explore the important influence of team cooperation on academic research in this field [24]. Table 4 lists the 10 most productive authors. The results showed that Liu Y was the one with the most publications. Other relevant authors included Zhang Y (18 articles), Chen Y (14 articles), Wang Y (14 articles), Liu YH (13 articles), and Wang H (13 articles). Most of the top 10 authors were from China and belonged to nine research institutions.
In Figure 5, each node in the author collaboration network represents the author, the number of papers published by the author is represented by the size of the nodes, and the connections between the nodes represent the cooperative relationship between the authors. The author collaboration network in the SMBD field consisted of 995 authors and 479 collaborative links. Different scholars formed different research teams based on the collaborative relationship between authors: (1) The Wanggen Wan team from the Shanghai University analyzed the application of SMBD to social development, including a study of the spatial and temporal distribution of urban green spaces [25], as well as video, spatial, temporal, and social media analysis of urban populations [26]. (2) Nicola Luigi Bragazzi’s team from the University of Genoa in Italy focused on the application of SMBD in medicine, and the team’s two most cited papers focused on the immunological and rheumatology value of the use of SMBD [27] and the digital behavior of using Behavior Informatics to analyze the entire spread of epidemic [28]. (3) Haoran Xie’s team from the City University of Hong Kong mainly studied the user’s personalized profile and information needs in order to realize personalized searches [29], and proposed a kind of potential user group identification based on folklore [30]. (4) In addition, there were some other outstanding teams, such as Antonio Ferrandezu’s team from the University of Alicante in Spain, and Henrikki Tenkanen’s team from the University of Helsinki in Finland.

3.6. Hot Research Topics on SMBD

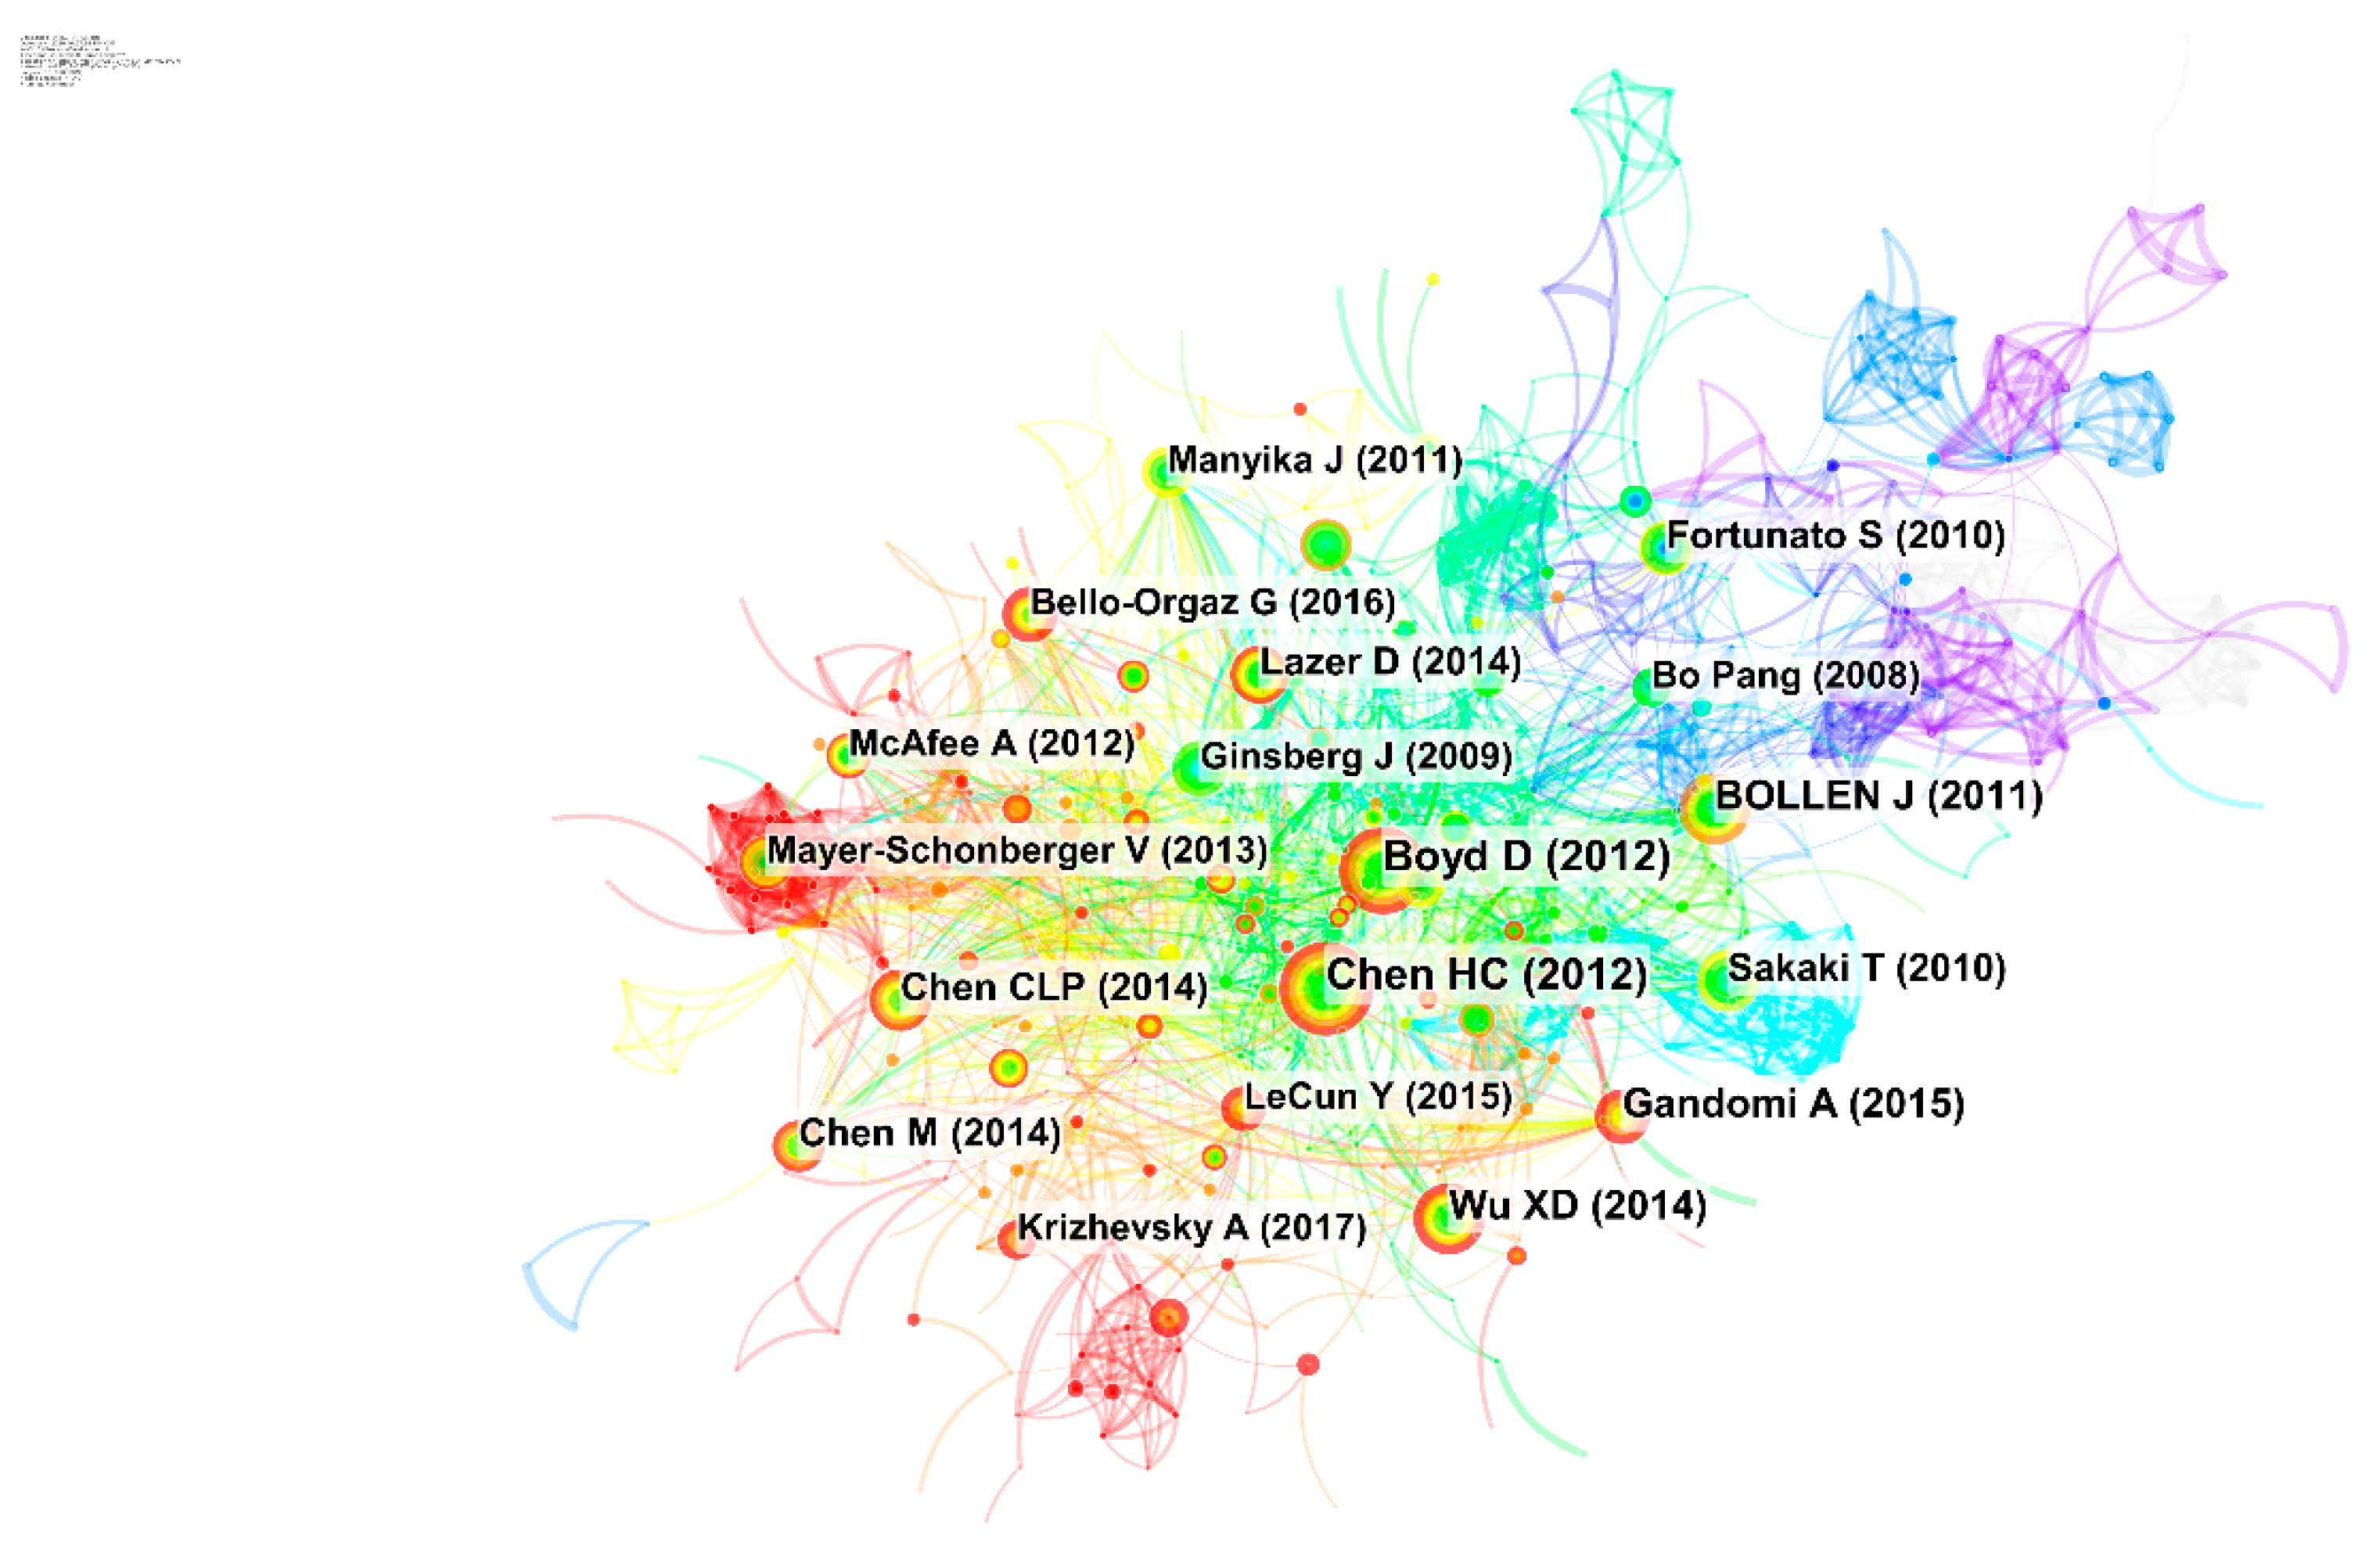
3.6.1. Co-Citation Literature Analysis

Co-citation deeply reflects the theoretical knowledge foundation of relevant research, and the high frequency co-citation literature shows the fundamental research achievements in different periods and plays an important role in the academic development of this field. The co-citation network in the SMBD field was composed of 778 nodes and 975 connections (Figure 6). The node represented the cited literature, and the importance of the literature was expressed by its size. The label on the node was the first author and publication year of the article. Fifteen key literature nodes with important academic influence were selected in this paper, as shown in Table 5.
Bollen et al. [31] extracted seven aspects of public sentiment from the text of Twitter and correlated them with economic indicators. This was a representative literature on the use of SMBD in economic research. Chen et al. [32] systematically discussed the opportunities and challenges, technical principles and future research trends for data-intensive applications. Lazer et al. [33] used Google Flu Trends (GFT) as an argument to raise questions about big data as an alternative to traditional statistical methods and theories, and proposed two contradictions of Google Flu Trends: Hubris and Dynamics Algorithm. As big data became more widely available, critical discussion was on the rise. Boyd et al. [34] argued that reasonable critical questioning and assumptions were necessary for big data, as an emerging analytical technique. He has proposed six critical points, including (1) the changes in the whole theory of social theory, which was caused by big data, (2) the inevitable problems with big data in terms of objectivity and accuracy, (3) the quality of the research was determined by the degree of which big data fits the problem and the representativeness of the data, (4) the graphical representation of the relationship between people did not mean the equivalent information, (5) the ethical issues of big data, (6) the digital divide caused by the availability and accessibility of big data. Ginsberg J designed a model for epidemic disease surveillance based on Google search engine and used to accurately estimate the weekly influenza activity level in each region of the United States [35]. In general, SMBD was interdisciplinary, covering areas such as data mining, deep learning, data visualization, and natural language processing [36,37]. The growth of the field will lead to the evolution of business, web, and scientific applications [38].

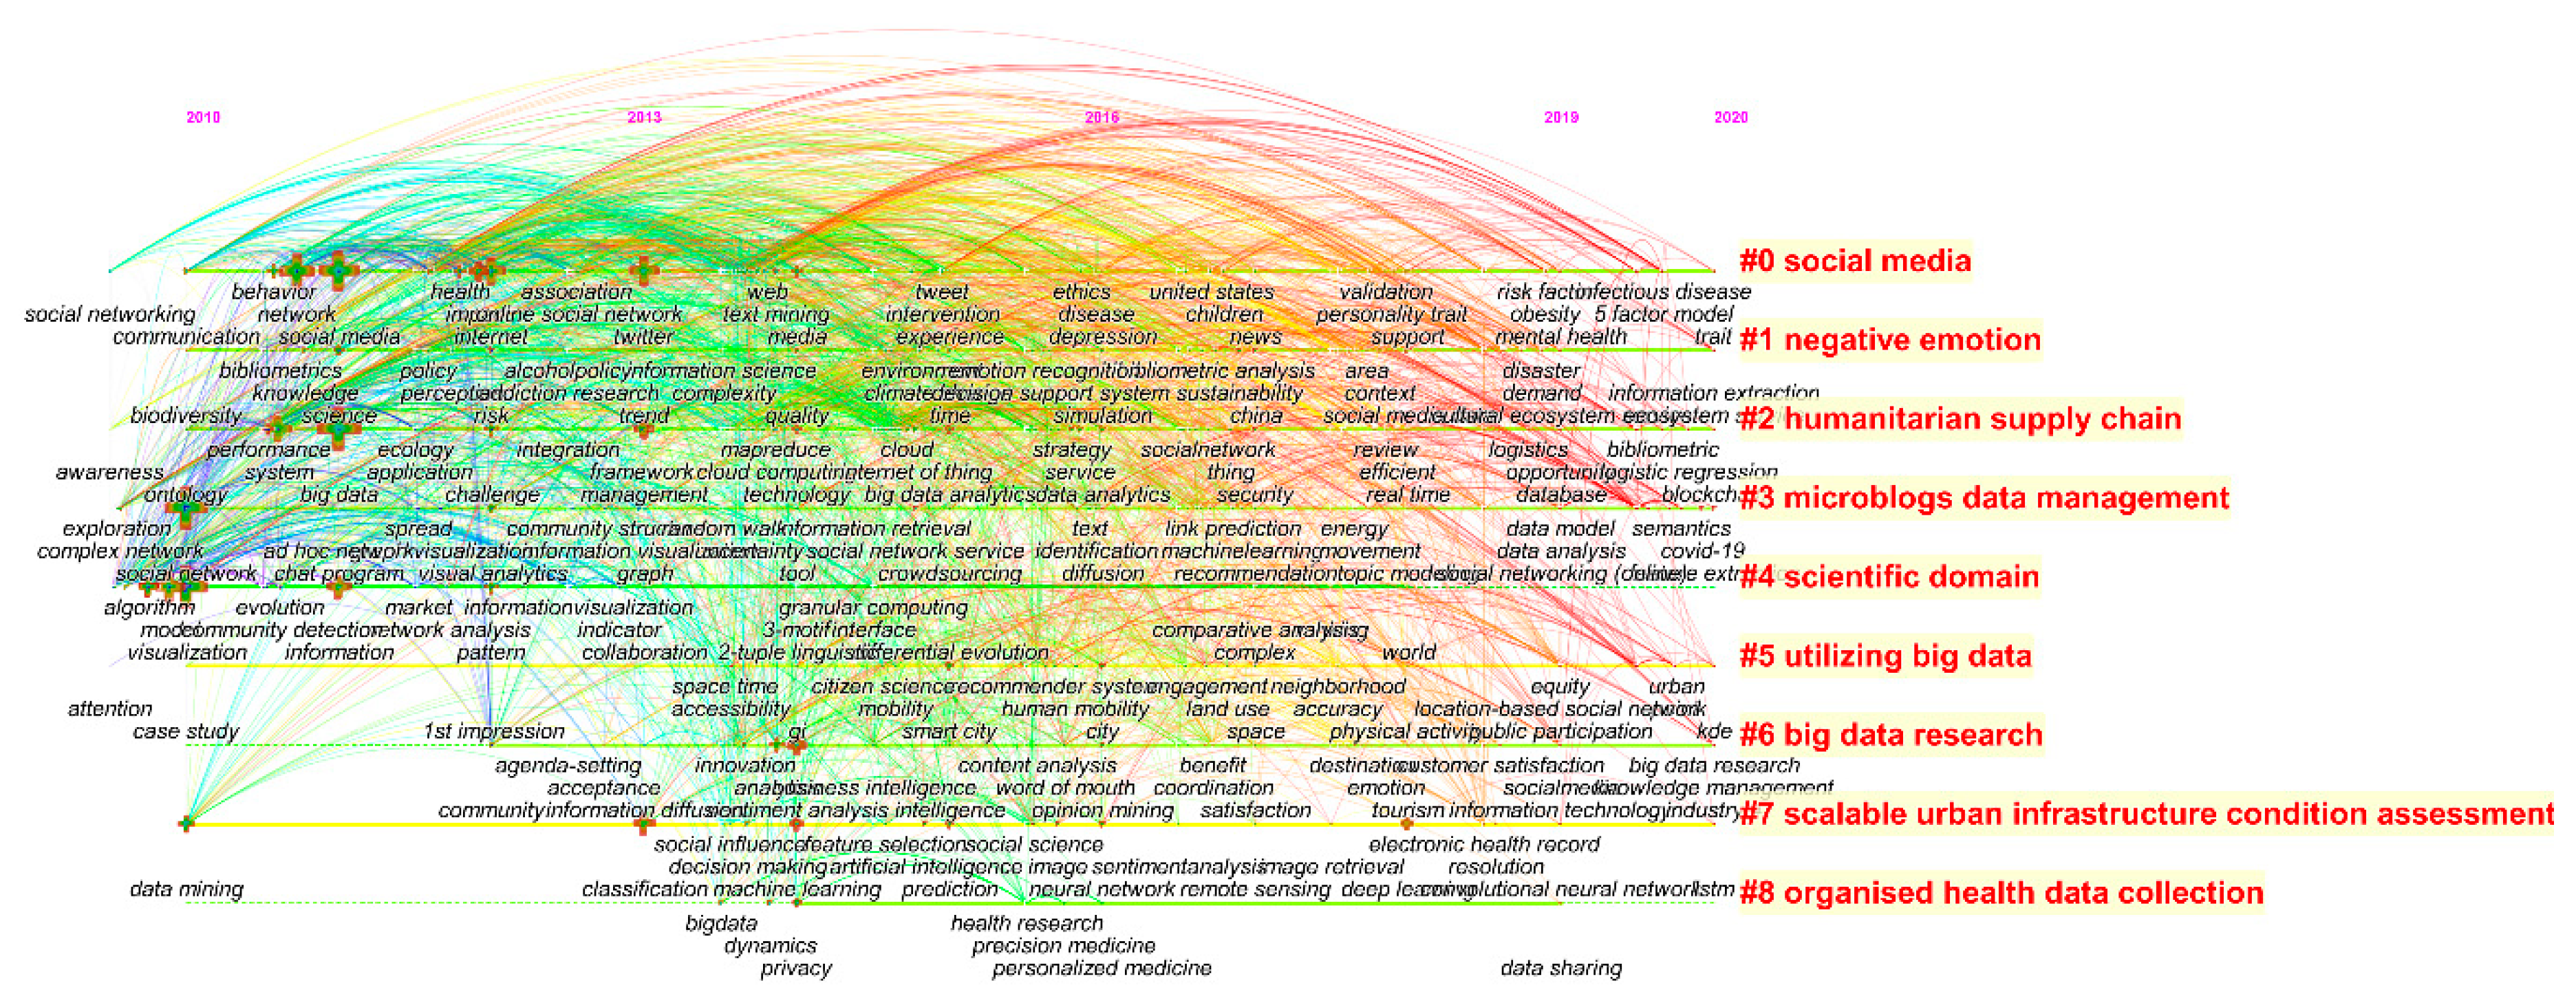
3.6.2. Co-Occurrence of Keywords

Keywords are the condensation and reaction to the main content of the article, which can reflect the hot topic and the development trend related to the research field. We ran the “Keyword” module of CiteSpaceⅤ, merged some semantic repetitions, and generated a graph of the keyword co-occurrence network in SMBD research, with 547 nodes and 3631 connections (Figure 7). The top 10 keywords for co-occurrence and centrality are shown in Table 6. The keywords “big data” and “social media” from Table 6 displayed the highest frequency of 696 and 408, respectively. Followed by the keywords “social network” (226), “visualization” (189), “network” (186) and “twitter” (181). From the analysis of the centrality, the keyword “social network” showed the highest central value, followed by “visualization”, “centrality”, “pattern”, “design”, “social network analysis” and so on, indicating that these keywords has been the focus of the researchers and created certain influences.
CiteSpace provides automatic tagging of clustering networks, allowing noun phrases to be extracted from titles, keywords or abstracts through three algorithms (LSI, LLR and MI). Log-like ratio (LLR) tests tend to reflect a unique aspect of a cluster, which is more suitable for generating high-quality clustering with intra class similarity and inter class similarity. We clustered the keyword map according to the LLR algorithm in the CiteSpace software to get the Timeline view of the nine clusters shown in Figure 7, with the cluster label on the right and time at the top. The keywords of the same cluster are on the same horizontal line, and each node represents a keyword, the keywords are fixed in the year when they first appear, connected by lines. Through the timeline, we could observe the time span of the co-occurrence keywords and the rise and fall of specific research content of clusters. Table 7 shows more details of these clusters.
As shown in Table 7, an internal uniformity (profile) value from 0.57 to 1 indicated that the top terms in the cluster match well and the cluster was reliable [39]. # 0 and # 6 were “social media” and “big data research”, which focused on the importance of Social Media Big Data [40,41,42], and explored the risk and future of Social Media Big Data [43]. The study focused on key fields such as big data, association rules, cultural communication, double-layer coupling, social network, social media, social media usage characteristics, users, effect, airline and so on. # 1 was “negative emotion”, and the cluster contained case study, data, role, coastal resilience assessments, floods and other keywords. This cluster mainly used disaster cases to show that research of SMBD had a negative impact on people’s emotions [44,45]. # 2 was “humanitarian supply chain”; the cluster contained artificial intelligence, industry, social gains, principles, dam operations, and the cluster focused on the important value of Social Media Big Data combined with blockchain technology [46,47]. # 3 was “microblogs data management”, this cluster was a study of technologies, models, and frameworks for Social Media Big Data [48,49], the main keywords were review, classification techniques, cetacean vocalization, automatic detection, exploiting academic factor. # 4, # 5, # 7 and # 8 were “scientific domain”, “utilizing big data”, “scalable urban infrastructure condition assessment”, they were all specific applications of SMBD in human production and life. For example, Vargas-Quesada et al. [50] used the performance of category synergy and its social network to visually predict or label developments in the field of science. Liu et al. [51] used SMBD to categorize green space and smart city buildings. Alipour et al. [52] provided a framework for the development and extensibility of visual surveillance of urban infrastructure and built environments based on SMBD. O’Doherty et al. [53] explored the use of big data for health.

4. Research Trends Analysis

The trends of research in a field could reflect the future development direction of research. By using the burst detection function in CitespaceⅤ, sudden increases or decreases in the number of citations of specific keywords or papers could be revealed [54]. A keyword or literature with a strong number of citations that have increased or decreased in a short period of time may cause mutation rate changes, and we could better understand the trends and future directions of a field through keywords and changing trends in the literature.

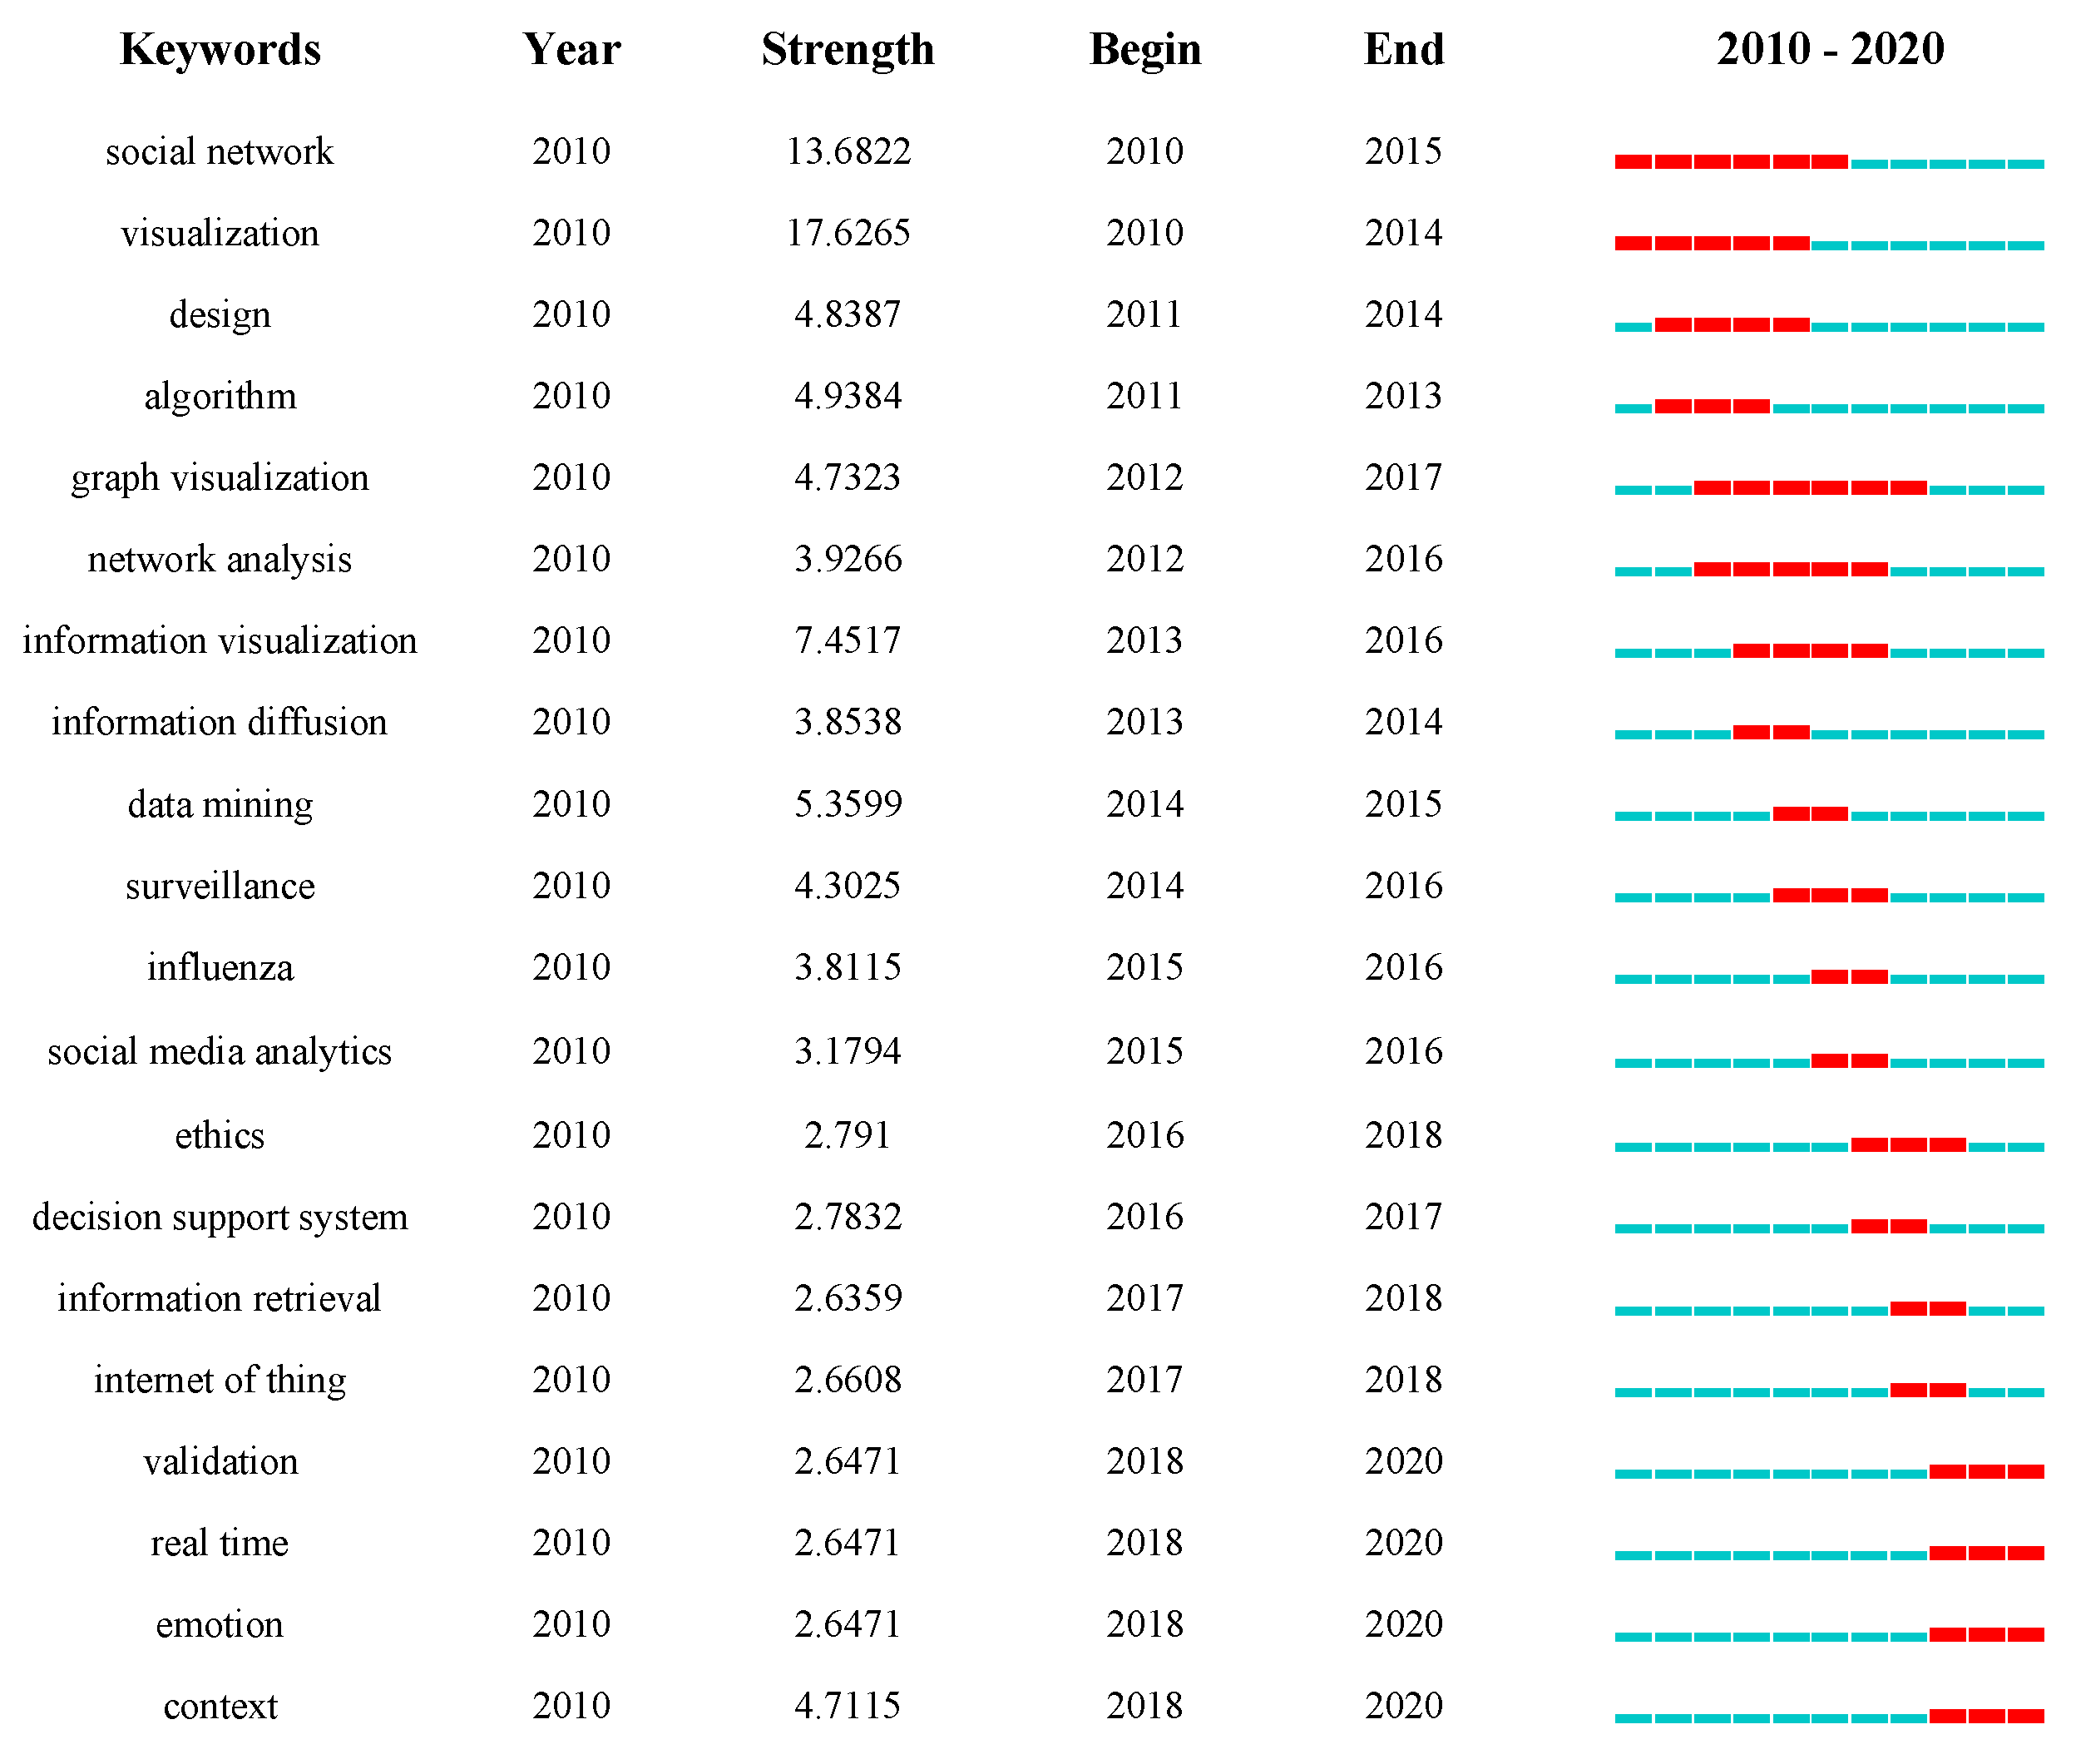
4.1. Keyword Burst Analysis

The burst of keywords could reflect the changes of research topics and hotspots in one field. As shown in Figure 8, we selected 20 emergent words in SMBD research according to the two indicators of starting year and strength. The results showed that the research frontier of SMBD in the past decades has changed with time, and the strongest burst word is Visualization. Among the keywords with longer burst cycles were Social Network (2010–2015) and Graph Visualization (2012–2017), and research related to these terms had a more sustained impact on the SMBD field. The latest burst words, Validation, Real Time, Emotion, Context, represented some of the hottest topics in 2018 so far, and will continue to be followed.

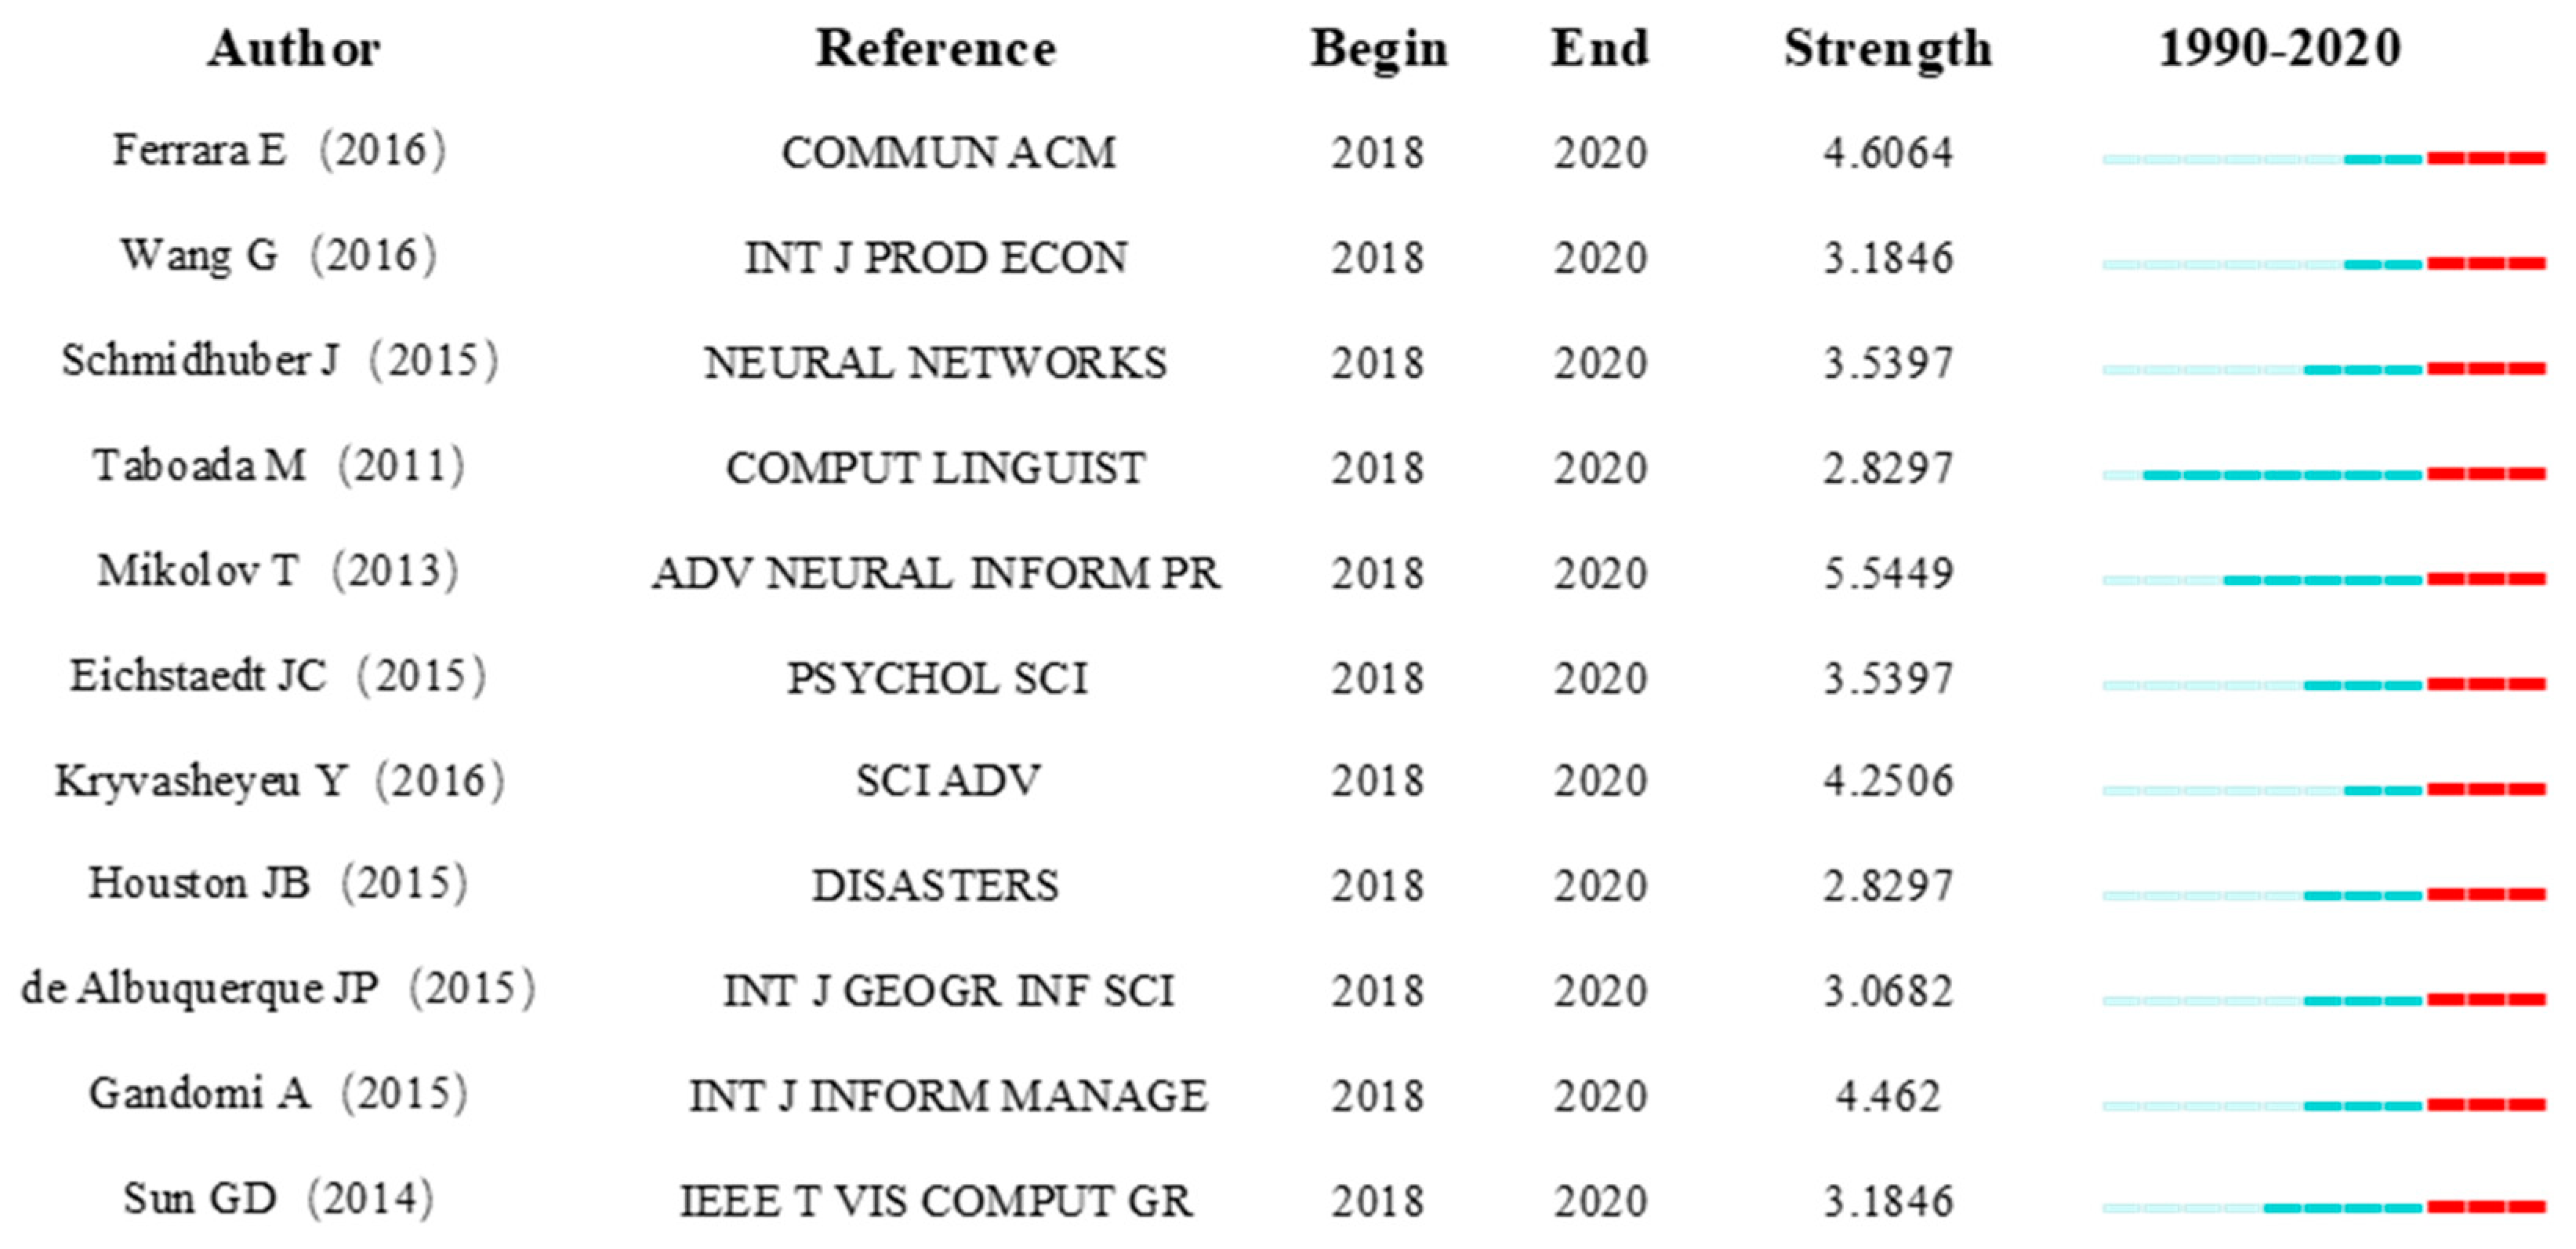
4.2. Co-Citation Literature Burst

The above analysis of keywords showed that SMBD was the research frontier in different periods from 2010 to 2020. In addition, a burst test was also an indicator of the research frontier for co-citation literature. The higher burst of articles, the higher the degree of attention in a certain period of time, the research content of the article represented the hot spot and frontier of the field in a certain period of time. The red parts in Figure 9 represent the time range in which the literature burst appeared. We listed the literature with burst characteristics and no “cooling”, so as to analyze the research frontier of SMBD in recent years. As for the strongest burst co-citation shown in Figure 7, there were 11 highly cited articles in 2018-2020. It could mainly be divided into three aspects:
(1) Deep excavation and construction of social media technology. Mikolov [55] proposed the skip-gram model, which could capture a large number of precise syntactic and semantic relations and make vectors express millions of phrases well. This model provided a methodological foundation for the prediction and analysis of Social Media Big Data. Meanwhile, Schmidhuber [56] explored deep learning in Neural Networks (NNS). This research promoted evolutionary computation of SMBD, the application of Computational Intelligence Algorithms, and the advancement of visualization. Gandomi et al. [57] described social media in detail on the basis of previous research and stressed the need to develop appropriate and effective analytical methods. They pointed out that the key feature of modern social media analysis was its data-centric nature and it could be divided into content-based analysis and structure-based analysis.
(2) Rethinking and worrying about the rapid growth of social media. Ferrara et al. [58] examined the behavior of social robots that abounded in the social media ecosystem, such as the social bots on Twitter, in their imitation of features associated with the temporal patterns of content, network, emotion and activity, these robots had produced the characteristic of engineering social manipulation, which led to the conclusion that there were good robots and bad robots. Their emergence may pose a threat to the Internet ecology and human society. In addition, Boshmaf et al. [59] pointed out that with the widespread use of online social media and the growing number of users, online social media could be used to steal user data and damage the Internet ecosystem if it was not properly handled, so had to build a prototype of a socialbot network to run tests on Facebook in response to mass infiltration. Cao et al. [60] analyzed the massive amount of aggressive social media activity that existed nowadays, and used a synchronous trap as an incremental processing system to efficiently handle big data in large online social networks by deploying applications on Facebook and Instagram to expose malicious accounts and attacks in a short period of time.
(3) The role of SMBD in solving human social development problems. Eichstaedt et al. [61] used the language of Twitter to predict heart disease mortality well at the county level and demonstrated the importance of SMBD in the field of disease. Kryvasheyeu et al. [62] used big data on Twitter to demonstrate that large scale online social networks could quickly assess the damage caused by large scale disasters. In addition, by building a disaster social media framework, Houston et al. [63] facilitated the creation of disaster social media tools, the development of implementation processes, and the scientific study of their effects. Albuquerque et al. [64] used social media as a potential resource to improve the management of crisis situations. He proposed a geographic approach and used it to examine tweets generated by the Twitter platform (Twitter) during the June 2013 floods in Elbe, Germany, and considered social media messages to be reliable quantitative indicators. Disaster management in crisis response and preventive monitoring was of great value.

5. Conclusions and Deficiencies

Based on the analysis of SMBD research in the previous part of this paper, the following conclusions could be drawn:
(1) As far as the number of published papers was concerned, the research of SMBD has shown an obvious increasing trend in the last ten years, especially the number of papers published in the past five years accounted for 78.42% of the total number of published papers, which has indicated that the research on SMBD is novel. The current research involved Computer Science, Engineering, Telecommunications and other disciplines (fields), reflecting the characteristics of SMBD are interdisciplinary, multi field co-construction and multi-direction mutual integration. IEEE Access, Sustainability, IEEE Transactions on Visualization and Computer Graphics, PLoS One and other journals have collected a lot of research in this field. As far as the main strength of SMBD research was concerned, the most productive authors in SMBD field were mainly from China, the academic teams led by Wanggen Wan, Haoran Xie and others have made significant contributions in this field. China, the USA, the UK and other countries had the largest number of publications, and the main research institutions were the Chinese Academy of Sciences, Wuhan University, Tsinghua University, City University of Hong Kong, etc. However, although the number of papers published by China ranked first, the centrality remained at a low level, which indicated that the international influence of China’s research results in SMBD was weak. It is necessary to improve the innovation and comprehensiveness of research results in the future.
(2) We used co-citation analysis to identify the knowledge base of SMBD, and the results showed that the research of SMBD was interdisciplinary, covered fields such as data mining, deep learning, data visualization, and natural language processing. It can be seen that the knowledge structure of SMBD has begun to take shape. We further divided the keywords into nine clusters and found that the hot research focuses on the significance of SMBD research, the combination with cutting-edge technology, and the specific application in production and life. Big data, social media, social network and visualization appeared more frequently, and social network, visualization, centrality, pattern, design had a higher degree of centrality, which represented the research hotspots of the past decade.
(3) We used two modules, keyword burst and co-citation literature burst to analyze the research frontiers of SMBD. We found that the strongest keyword was Visualization, the longest ones were Social Network and Graph Visualization, and the most recent ones were Validation, Real time, Emotion, Context. We can find that Visualization, Social Network and other topics represent the academic frontier in the brewing stage. With the maturity of theory and the development of technology, SMBD is turning from theoretical research to practical application. We detected the burst of co-citation literature and found that the frontier of SMBD included the in-depth exploration and construction of social media technologies, reflections and concerns about the rapid development of social media, and the role of SMBD in solving human social development problems. These findings provided valuable information for SMBD researchers to understand the research status and trends in this field.
Although we conducted an effective econometric analysis of the SMBD field, there were still some limitations in the current research. First, the analysis in this article was limited by using the WoS database, and there existed data incompleteness at the time node, so data from other databases or collected at different times may have different results and conclusions. Secondly, although bibliometrics provided an effective tool and means for the development of the research field, with the further improvement of bibliometrics software and tools in function and methods, future research will come to more detailed and valuable conclusions, so the conclusion of this paper is worth further study to be tested and improved.

Author Contributions

Conceptualization, Ziyi Wang and Dongqi Sun; formal analysis, Debin Ma; investigation, Debin Ma; methodology, Ziyi Wang; supervision, Ziyi Wang, Ru Pang and Dongqi Sun; visualization, Fan Xie; writing—original draft, Ziyi Wang; writing—review & editing, Jingxiang Zhang and Dongqi Sun. All authors have read and agreed to the published version of the manuscript.

Funding

This research was funded by National Natural Science Foundation of China (NO. 41971162).

Conflicts of Interest

The authors declare no conflict of interest.

References

  1. Hansen, D.L.; Shneiderman, B.; Smith, M.A. Twitter: Information flows, influencers, and organic communities. In Analyzing Social Media Networks with NodeXL; Morgan Kaufmann: San Mateo, CA, USA, 2020; pp. 161–178. [Google Scholar]
  2. Abdul, G.N.; Suraya, H.; Abaker, T.H.I. Social media big data analytics: A survey. Comput. Hum. Behav. 2018, 101, 417–428. [Google Scholar]
  3. Sivarajah, U.; Irani, Z.; Gupta, S. Role of big data and social media analytics for business to business sustainability: A participatory web context. Ind. Market. Manag. 2020, 86, 163–179. [Google Scholar] [CrossRef] [Green Version]
  4. Jimenez-Marquez, J.L.; Gonzalez-Carrasco, I.; Lopez-Cuadrado, J.L. Towards a big data framework for analyzing social media content. Int. J. Inform. Manag. 2019, 44, 1–12. [Google Scholar] [CrossRef] [Green Version]
  5. Yang, C.C.; Mao, W. Privacy-preserving social network integration, analysis, and mining. In Intelligent Systems for Security Informatics; Academic Press: Cambridge, MA, USA, 2013; pp. 51–67. [Google Scholar]
  6. Gilbert, E.; Karahalios, K. Predicting Tie Strength with Social Media. In Proceedings of the 27th International Conference on Human Factors in Computing Systems, Boston, MA, USA, 4–9 April 2009. [Google Scholar]
  7. Hashem, I.A.T.; Yaqoob, I.; Anuar, N.B. The rise of “big data” on cloud computing: Review and open research issues. Inform. Syst. 2015, 47, 98–115. [Google Scholar] [CrossRef]
  8. Deepamala, N. Computational analysis and understanding of natural languages: Principles, methods and applications. In Handbook of Statistics; Gudivada, V.N., Rao, C.R., Eds.; Elsevier Science Ltd.: Amsterdam, The Netherlands, 2018; Volume 38, pp. 429–462. [Google Scholar]
  9. Friedenthal, S.; Moore, A.; Steiner, R. Integrating SysML into a Systems Development Environment. Pract. Guide SysML 2008, 39, 270–290. [Google Scholar]
  10. Ahmed, E.; Yaqoob, I.; Hashem, I.A.T. The role of big data analytics in Internet of Things. Comput. Netw. 2017, 129, 459–471. [Google Scholar] [CrossRef]
  11. Cambria, E.; Rajagopal, D.; Olsher, D. Big social data analysis. In Big Data Computing; Akerkar, R., Ed.; Chapman and Hall/CRC: New York, NY, USA, 2013; pp. 401–414. [Google Scholar]
  12. Cappella, J.N. Vectors into the future of mass and interpersonal communication research: Big data, social media, and computational social science. Hum. Commun. Res. 2017, 43, 545–558. [Google Scholar] [CrossRef] [PubMed]
  13. Jiang, D.; Luo, X.; Xuan, J. Sentiment computing for the news event based on the Big Social Media Data. IEEE Access 2017, 99, 2373–2382. [Google Scholar] [CrossRef]
  14. Sibulela, M.; Tiko, I. Integration of social media with healthcare big data for improved service delivery. S. Afr. J. Ind. Eng. 2018, 20, 1–8. [Google Scholar]
  15. Zhang, D.; Wang, D.; Vance, N. On scalable and robust truth discovery in big data social media sensing applications. IEEE Trans. Big Data 2019, 5, 195–208. [Google Scholar] [CrossRef]
  16. Han, X.; Wang, J.; Zhang, M. Using social media to mine and analyze public opinion related to COVID-19 in China. Int. J. Env. Res. Pub. Health 2020, 17, 2788. [Google Scholar] [CrossRef] [Green Version]
  17. Zhang, Y.; Li, Y.B.; Yang, B. Risk Assessment of COVID-19 based on multisource data from a geographical viewpoint. IEEE Access 2020, 8, 125702–125713. [Google Scholar] [CrossRef]
  18. Bharati, P.; Chaudhury, A. Assimilation of big data innovation: Investigating the roles of IT, social media, and relational capital. Inform. Syst. Front. 2019, 21, 1357–1368. [Google Scholar] [CrossRef]
  19. Wang, X.L.; Zhao, H.Q. Statistical analysis of WOS citation of journal ‘Northern Horticulture’. North. Hortic. 2016, 10, 198–201. [Google Scholar]
  20. Huang, L.; Zhou, M.; Lv, J. Trends in global research in forest carbon sequestration: A bibliometric analysis. J. Clean. Prod. 2019, 252, 119908. [Google Scholar] [CrossRef]
  21. Si, H.; Shi, J.G.; Wu, G. Mapping the bike sharing research published from 2010 to 2018: A scientometric review. J. Clean. Prod. 2019, 213, 415–427. [Google Scholar] [CrossRef]
  22. Liu, Z.; Yin, Y.; Liu, W. Visualizing the intellectual structure and evolution of innovation systems research: A bibliometric analysis. Scientometrics 2015, 103, 135–158. [Google Scholar] [CrossRef]
  23. Hirsch, J.E. An index to quantify an individual’s scientific research output. Proc. Natl. Acad. Sci. USA 2005, 102, 16569–16572. [Google Scholar] [CrossRef] [Green Version]
  24. Chen, C. CiteSpace II: Detecting and visualizing emerging trends and transient patterns in scientific literature. J. Am. Soc. Inf. Sci. Technol. 2006, 57, 359–377. [Google Scholar] [CrossRef] [Green Version]
  25. Ullah, H.; Wan, W.; Haidery, S.A. Analyzing the spatiotemporal patterns in green spaces for urban studies using location-based social media data. ISPRS Int. J. Geo-Inf. 2019, 8, 506. [Google Scholar] [CrossRef] [Green Version]
  26. Ebrahimpour, Z.; Wan, W.G.; Cervantes, O. Comparison of main approaches for extracting behavior features from crowd flow analysis. ISPRS Int. J. Geo-Inf. 2019, 8, 440. [Google Scholar] [CrossRef] [Green Version]
  27. Bragazzi, N.L.; Watad, A.; Brigo, F. Public health awareness of autoimmune diseases after the death of a celebrity. Clin. Rheumatol. 2017, 36, 1911–1917. [Google Scholar] [CrossRef] [PubMed]
  28. Bragazzi, N.L.; Alicino, C.; Trucchi, C. Global reaction to the recent outbreaks of Zika virus: Insights from a Big Data analysis. PLoS ONE 2017, 12, e0185263. [Google Scholar] [CrossRef] [PubMed] [Green Version]
  29. Cai, Y.; Li, Q.; Xie, H. Exploring personalized searches using tag-based user profiles and resource profiles in folksonomy. Neural. Netw. 2014, 58, 98–110. [Google Scholar] [CrossRef]
  30. Xie, H.; Li, Q.; Mao, X. Community-aware user profile enrichment in folksonomy. Neural. Netw. 2014, 58, 111–121. [Google Scholar] [CrossRef]
  31. Bollen, J.; Mao, H.; Zeng, X.J. Twitter mood predicts the stock market. J. Comput. Sci.-Neth. 2010, 2, 1–8. [Google Scholar] [CrossRef] [Green Version]
  32. Chen, C.L.P.; Zhang, C.Y. Data-intensive applications, challenges, techniques and technologies: A survey on Big Data. Inform. Sci. 2014, 275, 314–347. [Google Scholar] [CrossRef]
  33. Lazer, D.; Kennedy, R.; King, G. The parable of google flu: Traps in big data analysis. Science 2014, 343, 1203. [Google Scholar] [CrossRef]
  34. Boyd, D.; Crawford, K. Critical questions for big data. Nform. Commun. Soc. 2012, 15, 662–679. [Google Scholar] [CrossRef]
  35. Ginsberg, J.; Mohebbi, M.H.; Patel, R.S. Detecting influenza epidemics using search engine query data. Nature 2009, 457, 1012-U4. [Google Scholar] [CrossRef]
  36. Manovich, L. Trending: The Promises and the Challenges of Big Social Data. In Debates in the Digital Humanities. Available online: http://www.manovich.net/DOCS/Manovich_trending_paper.pdf (accessed on 15 July 2011).
  37. Bello-Orgaz, G.; Jung, J.J.; Camacho, D. Social big data: Recent achievements and new challenges. Inform. Fusion 2016, 28, 45–59. [Google Scholar] [CrossRef]
  38. Chen, M.; Mao, S.; Liu, Y. Big data: A survey. Mob. Netw. Appl. 2014, 19, 171–209. [Google Scholar] [CrossRef]
  39. Ye, N.; Kueh, T.B.; Hou, L. A bibliometric analysis of corporate social responsibility in sustainable development. J. Clean. Prod. 2020, 272, 122679. [Google Scholar] [CrossRef]
  40. Kankanamge, N.; Yigitcanlar, T.; Goonetilleke, A. Determining disaster severity through social media analysis: Testing the methodology with South East Queensland Flood tweets. Int. J. Disast. Risk Reduct. 2020, 42, 101360. [Google Scholar] [CrossRef]
  41. Marengo, D.; Poletti, I.; Settanni, M. The interplay between neuroticism, extraversion, and social media addiction in young adult Facebook users: Testing the mediating role of online activity using objective data. Addict. Behav. 2019, 102, 106150. [Google Scholar] [CrossRef]
  42. Seo, E.J.; Park, J.W.; Choi, Y.J. The effect of social media usage characteristics on e-WOM, trust, and brand equity: Focusing on users of airline social media. Sustainability 2020, 12, 1691. [Google Scholar] [CrossRef] [Green Version]
  43. Grover, V.; Lindberg, A.; Benbasat, I. The perils and promises of big data research in information systems. J. Assoc. Inf. Syst. 2020, 21, 9. [Google Scholar]
  44. Karmegam, D.; Mappillairaju, B. Spatio-temporal distribution of negative emotions on Twitter during floods in Chennai, India, in 2015: A post hoc analysis. Int. J. Health Geogr. 2020, 19, 19. [Google Scholar] [CrossRef]
  45. Wang, H.W.; Peng, Z.R.; Wang, D.S. Evaluation and prediction of transportation resilience under extreme weather events: A diffusion graph convolutional approach. Transp. Res. Part C Emerg. Technol. 2020, 115, 102619. [Google Scholar] [CrossRef]
  46. Tsan-Ming, C. When blockchain meets social-media: Will the result benefit social media analytics for supply chain operations management? Transp. Res. Part E Logist. Transp. Rev. 2020, 135, 101860. [Google Scholar]
  47. Rodriguez-Espindola, O.; Chowdhury, S.; Beltagui, A. The potential of emergent disruptive technologies for humanitarian supply chains: The integration of blockchain, artificial intelligence and 3D printing. Int. J. Prod. Res. 2020, 58, 4610–4630. [Google Scholar] [CrossRef]
  48. Magdy, A.; Abdelhafeez, L.; Kang, Y. Microblogs data management: A survey. VLDB J. 2020, 29, 177–216. [Google Scholar] [CrossRef]
  49. Amalina, F.; Hashem, I.A.T.; Azizul, Z.H. Blending big data analytics: Review on challenges and a recent study. IEEE Access 2019, 8, 3629–3645. [Google Scholar] [CrossRef]
  50. Vargas-Quesada, B.; Moya-Anegon, F.D.; Chinchilla-Rodrfguez, Z. Showing the essential science structure of a scientific domain and its evolution. Inform. Visual. 2010, 9, 288–300. [Google Scholar] [CrossRef]
  51. Liu, Q.; Ullah, H.; Wan, W. Categorization of green spaces for a sustainable environment and smart city architecture by utilizing big data. Electronics 2020, 9, 1028. [Google Scholar] [CrossRef]
  52. Alipour, M.; Harris, D.K. A big data analytics strategy for scalable urban infrastructure condition assessment using semi-supervised multi-transform self-training. J. Civ. Struct. Health 2020, 10, 313–332. [Google Scholar] [CrossRef]
  53. O’Doherty, K.C.; Christofides, E.; Yen, J. If you build it, they will come: Unintended future uses of organised health data collections. BMC Med. Ethics 2016, 17, 1–16. [Google Scholar] [CrossRef] [Green Version]
  54. Kleinberg, J. Bursty and hierarchical structure in streams. Data Min. Knowl. Disc. 2003, 7, 373–397. [Google Scholar] [CrossRef]
  55. Mikolov, T. Distributed representations of words and phrases and their compositionality. Neural Inf. Process. Syst. 2013, 26, 3111–3119. [Google Scholar]
  56. Schmidhuber, J. Deep learning in neural networks: An overview. Neural. Netw. 2015, 61, 85–117. [Google Scholar] [CrossRef] [Green Version]
  57. Gandomi, A.; Haider, M. Beyond the hype: Big data concepts, methods, and analytics. Int. J. Inform. Manag. 2015, 35, 137–144. [Google Scholar] [CrossRef] [Green Version]
  58. Ferrara, E.; Varol, O.; Davis, C. The rise of social bots. Commun. Acm. 2014, 59, 96–104. [Google Scholar] [CrossRef] [Green Version]
  59. Boshmaf, Y.; Muslukhov, I.; Beznosov, K. Design and analysis of a social botnet. Comput. Netw. 2013, 57, 556–578. [Google Scholar] [CrossRef] [Green Version]
  60. Cao, Q.; Yang, X.; Yu, J. Uncovering large groups of active malicious accounts in online social networks. In Proceedings of the 2014 ACM SIGSAC Conference on Computer and Communications Security (CCS 2014), Scottsdale, AZ, USA, 3–7 November 2014. [Google Scholar]
  61. Eichstaedt, J.C.; Schwartz, H.A.; Kern, M.L. Psychological language on twitter predicts county-level heart disease mortality. Psychol. Sci. 2015, 26, 159. [Google Scholar] [CrossRef] [Green Version]
  62. Kryvasheyeu, Y.; Chen, H.H.; Obradovich, N. Rapid assessment of disaster damage using social media activity. Sci. Adv. 2016, 2, e1500779. [Google Scholar] [CrossRef] [PubMed] [Green Version]
  63. Houston, J.B.; Hawthorne, J.; Perreault, M.F. Social media and disasters: A functional framework for social media use in disaster planning, response, and research. Disasters 2015, 39, 1–22. [Google Scholar] [CrossRef] [PubMed]
  64. Albuquerque, J.P.; Herfort, B.; Brenning, A. A geographic approach for combining social media and authoritative data towards identifying useful information for disaster management. Int. J. Geogr. Inf. Sci. 2015, 29, 667–689. [Google Scholar] [CrossRef] [Green Version]
Figure 1. Research framework.
Ijgi 09 00632 g001
Figure 2. Trend of publication in Social Media Big Data (SMBD).
Ijgi 09 00632 g002
Figure 3. Global distribution of SMBD publications.
Ijgi 09 00632 g003
Figure 4. Knowledge map of institution collaboration in SMBD.
Ijgi 09 00632 g004
Figure 5. Knowledge map of author collaboration in SMBD.
Ijgi 09 00632 g005
Figure 6. Knowledge map of co-citation literature in SMBD.
Ijgi 09 00632 g006
Figure 7. Knowledge map of keyword cluster in SMBD.
Ijgi 09 00632 g007
Figure 8. Keywords with the strongest citation burst in SMBD.
Ijgi 09 00632 g008
Figure 9. Co-citation articles burst in SMBD.
Ijgi 09 00632 g009
Table 1. Top 10 research areas by number of articles.
Research AreasNumber of Articles%
Computer Science133853.67
Engineering56822.78
Telecommunications29811.95
Science Technology Other Topics2439.74
Environmental Sciences Ecology2158.62
Information Science Library Science1485.93
Operations Research Management Science893.57
Physical Geography863.45
Public Environmental Occupational Health863.45
Mathematics853.41
Table 2. Top 10 journals by number of publications.
JournalTP a% bIF cH-Index
IEEE Access1375.4953.74556
Sustainability933.7302.85053
Future Generation Computer Systems the International Journal of eScience622.4876.12593
PLoS One512.0462.740268
IEEE Transactions on Visualization and Computer Graphics441.7654.558118
ISPRS International Journal of Geo Information401.6042.23925
Journal of Medical Internet Research381.5245.034116
Multimedia Tools and Applications351.4042.31352
Scientometrics341.3642.86795
Information Sciences251.0035.910154
a TP: The total publications of one journal during 2010–2020. b The percentage of the total publications of the journal. c The journal’s impact factor is from Journal Citation Reports in 2019.
Table 3. Top 10 countries by number of articles.
Country/RegionCentralityNumber of Articles%
China0.1073929.643
USA0.1972228.961
England0.202409.627
South Korea0.051596.378
Australia0.091415.656
Spain0.141345.375
Italy0.141335.335
Germany0.041154.613
Canada0.041104.412
India0.031024.091
Table 4. Top 10 authors based on frequency.
AuthorFrequencyInstitution
Liu Y23Hong Kong University of Science and Technology
Zhang Y18Zhong nan University of Economics and Law
Chen Y14Shanghai Normal University
Wang Y14National University of Defense Technology
Liu YH13University of Science and Technology of China
Wang H13School of Economics and Management, Southeast University
Cao N10Tongji University
Lee S10Soongsil University
Li J9Southwest China University
Wan WG9Shanghai University
Table 5. The first 15 pieces of co-citation literature in SMBD.
AuthorFrequencyYearThe Title of Articles
Chen HC632012Business Intelligence and Analytics: From Big Data to Big Impact
Boyd D582012Critical Questions for Big Data
Wu XD452014Data mining with big data
Bollen J432011Twitter Mood Predicts the Stock Market
Gandomi A402015Beyond the hype: Big data concepts, methods, and analytics
Chen CLP392014Data-intensive applications, challenges, techniques and technologies: A survey on Big Data
Fortunato S392010Community detection in graphs
Lazer D392014The Parable of Google Flu: Traps in Big Data Analysis
Sakaki T382010Earthquake shakes Twitter users: real-time event detection by social sensors
Chen M342014Big Data: A Survey
LeCun Y332015Deep learning
Ginsberg J312009Detecting influenza epidemics using search engine query data
Manyika J312011Big data: The Next Frontier for Innovation, Competition, and Productivity
Bello-Orgaz G302016Social big data: Recent achievements and new challenges
Bo Pang292008Opinion mining and sentiment analysis
Table 6. Frequency and centrality of keywords in SMBD.
KeywordsFrequencyKeywordsCentrality
big data696social network0.11
social media408visualization0.08
social network226centrality0.07
visualization189pattern0.07
network186science0.07
twitter181design0.06
system150social network analysis0.06
model149evolution0.06
information125communication0.05
internet112system0.04
Table 7. The details of keywords in clusters.
#SizeSilhouette ValueMean YearTop Term in LLR
01110.6092015Big data, association rules, cultural communication, double-layer coupling, social network
1930.572016Case study, data, role, coastal resilience assessments, floods
2910.6312015Artificial intelligence, industry, social gains, principles, dam operations
3850.6172016Review, classification techniques, cetacean vocalization, automatic detection, exploiting academic factors
4780.792012Analysis, visualization, Arab universities, influence, web structure
5500.6652017Case study, china, exploring temporal activity patterns, urban areas
6490.722016Social media, social media usage characteristics, users, effect, airline
7350.7682015Review, focus, physics, machine, data
8120.9512015Healthcare, introduction, social implications’, translation, article collection
Publisher’s Note: MDPI stays neutral with regard to jurisdictional claims in published maps and institutional affiliations.

