Methodology of Sub-Catchment Division Considering Land Uses and Flow Directions

Abstract
:1. Introduction
2. Related Catchment Division Methods
2.1. Current Catchment Partitioning Methods
2.1.1. Conventional Catchment Division Methods
2.1.2. Hybrid Catchment Division Method
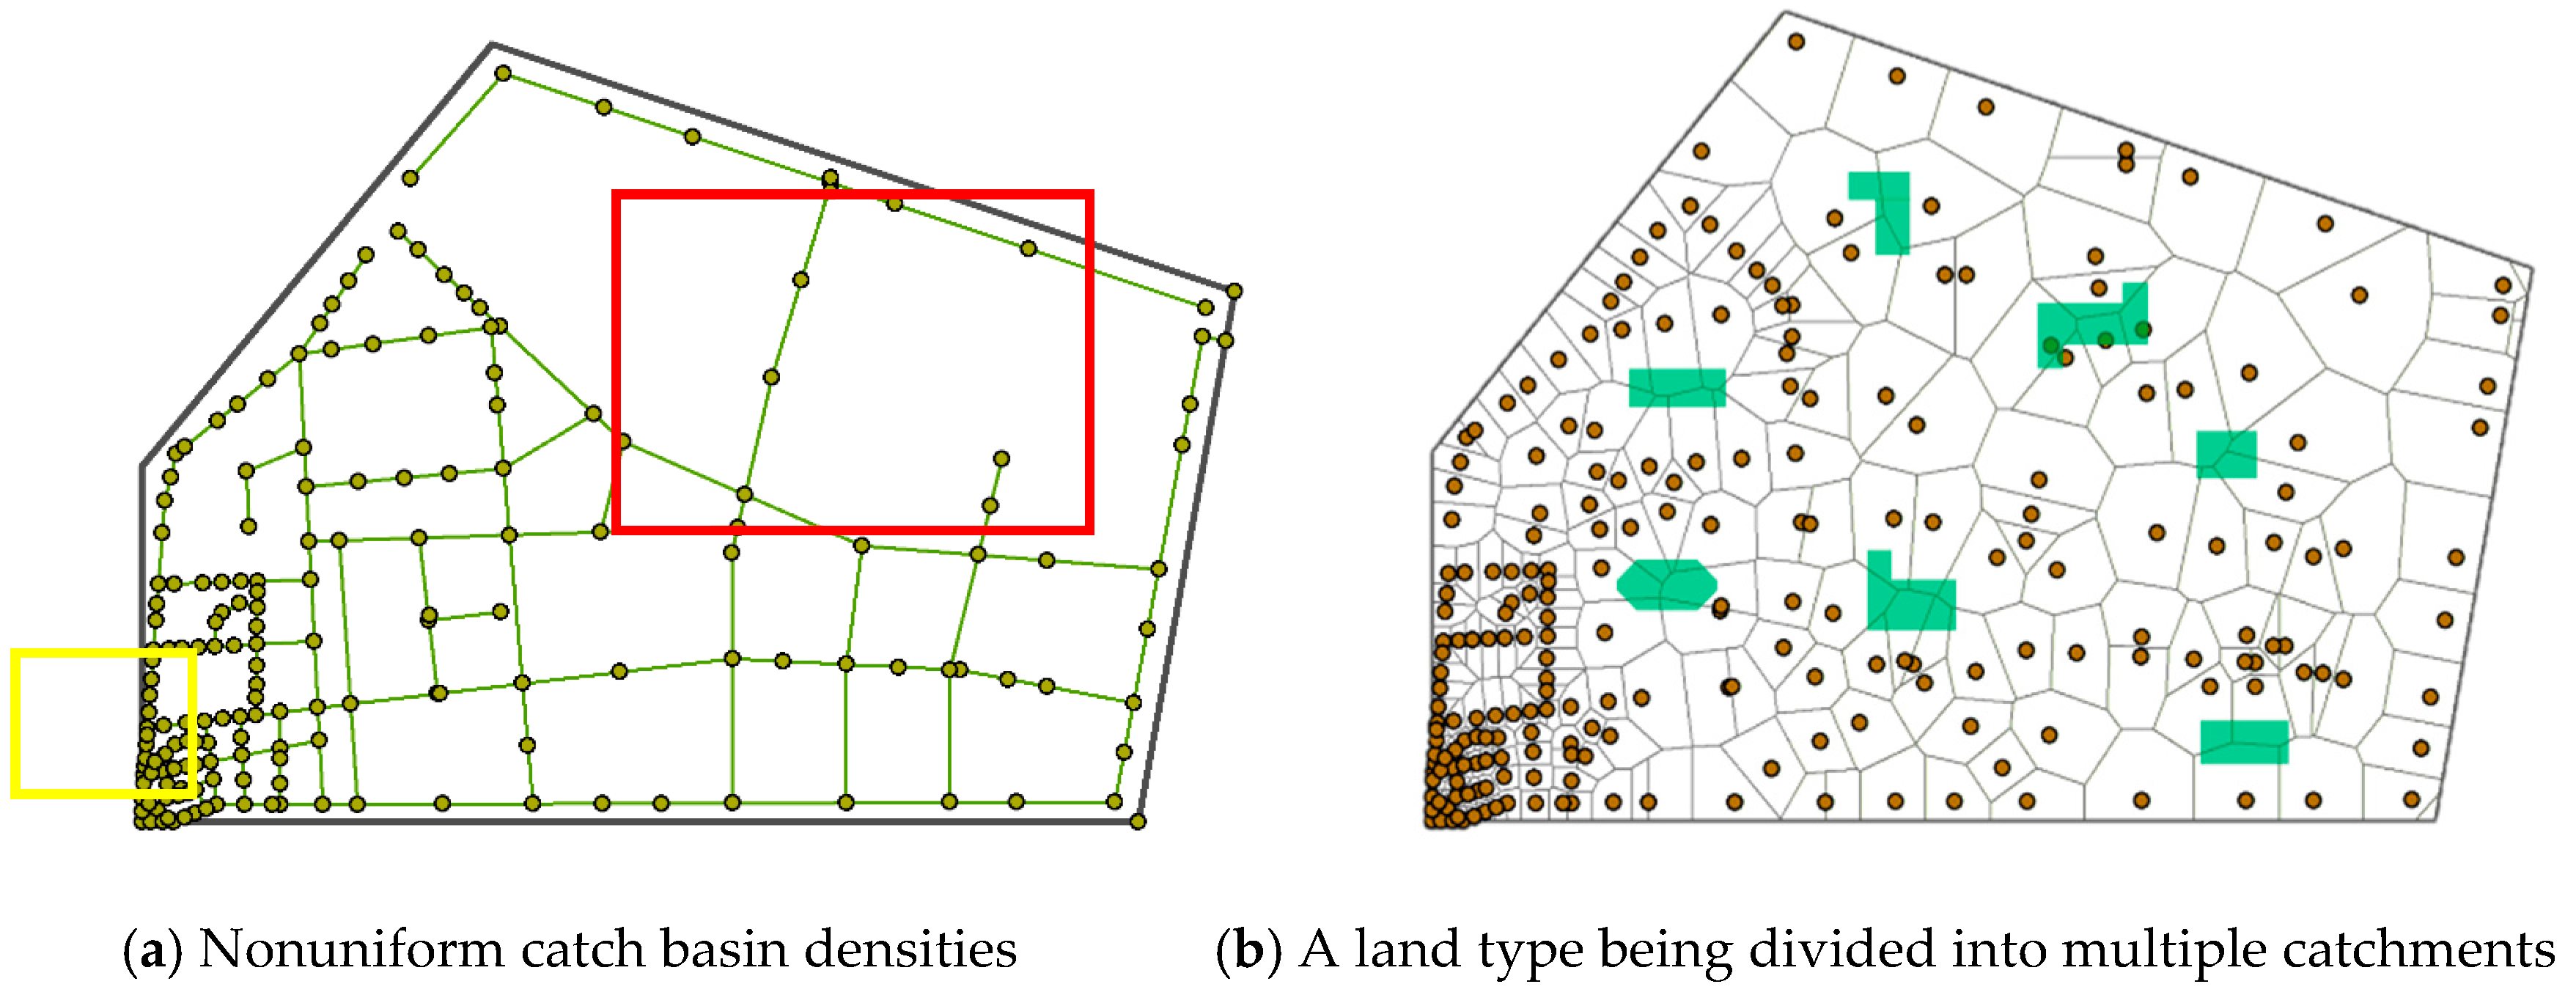
2.2. Limitations of Current Catchment Division Methods
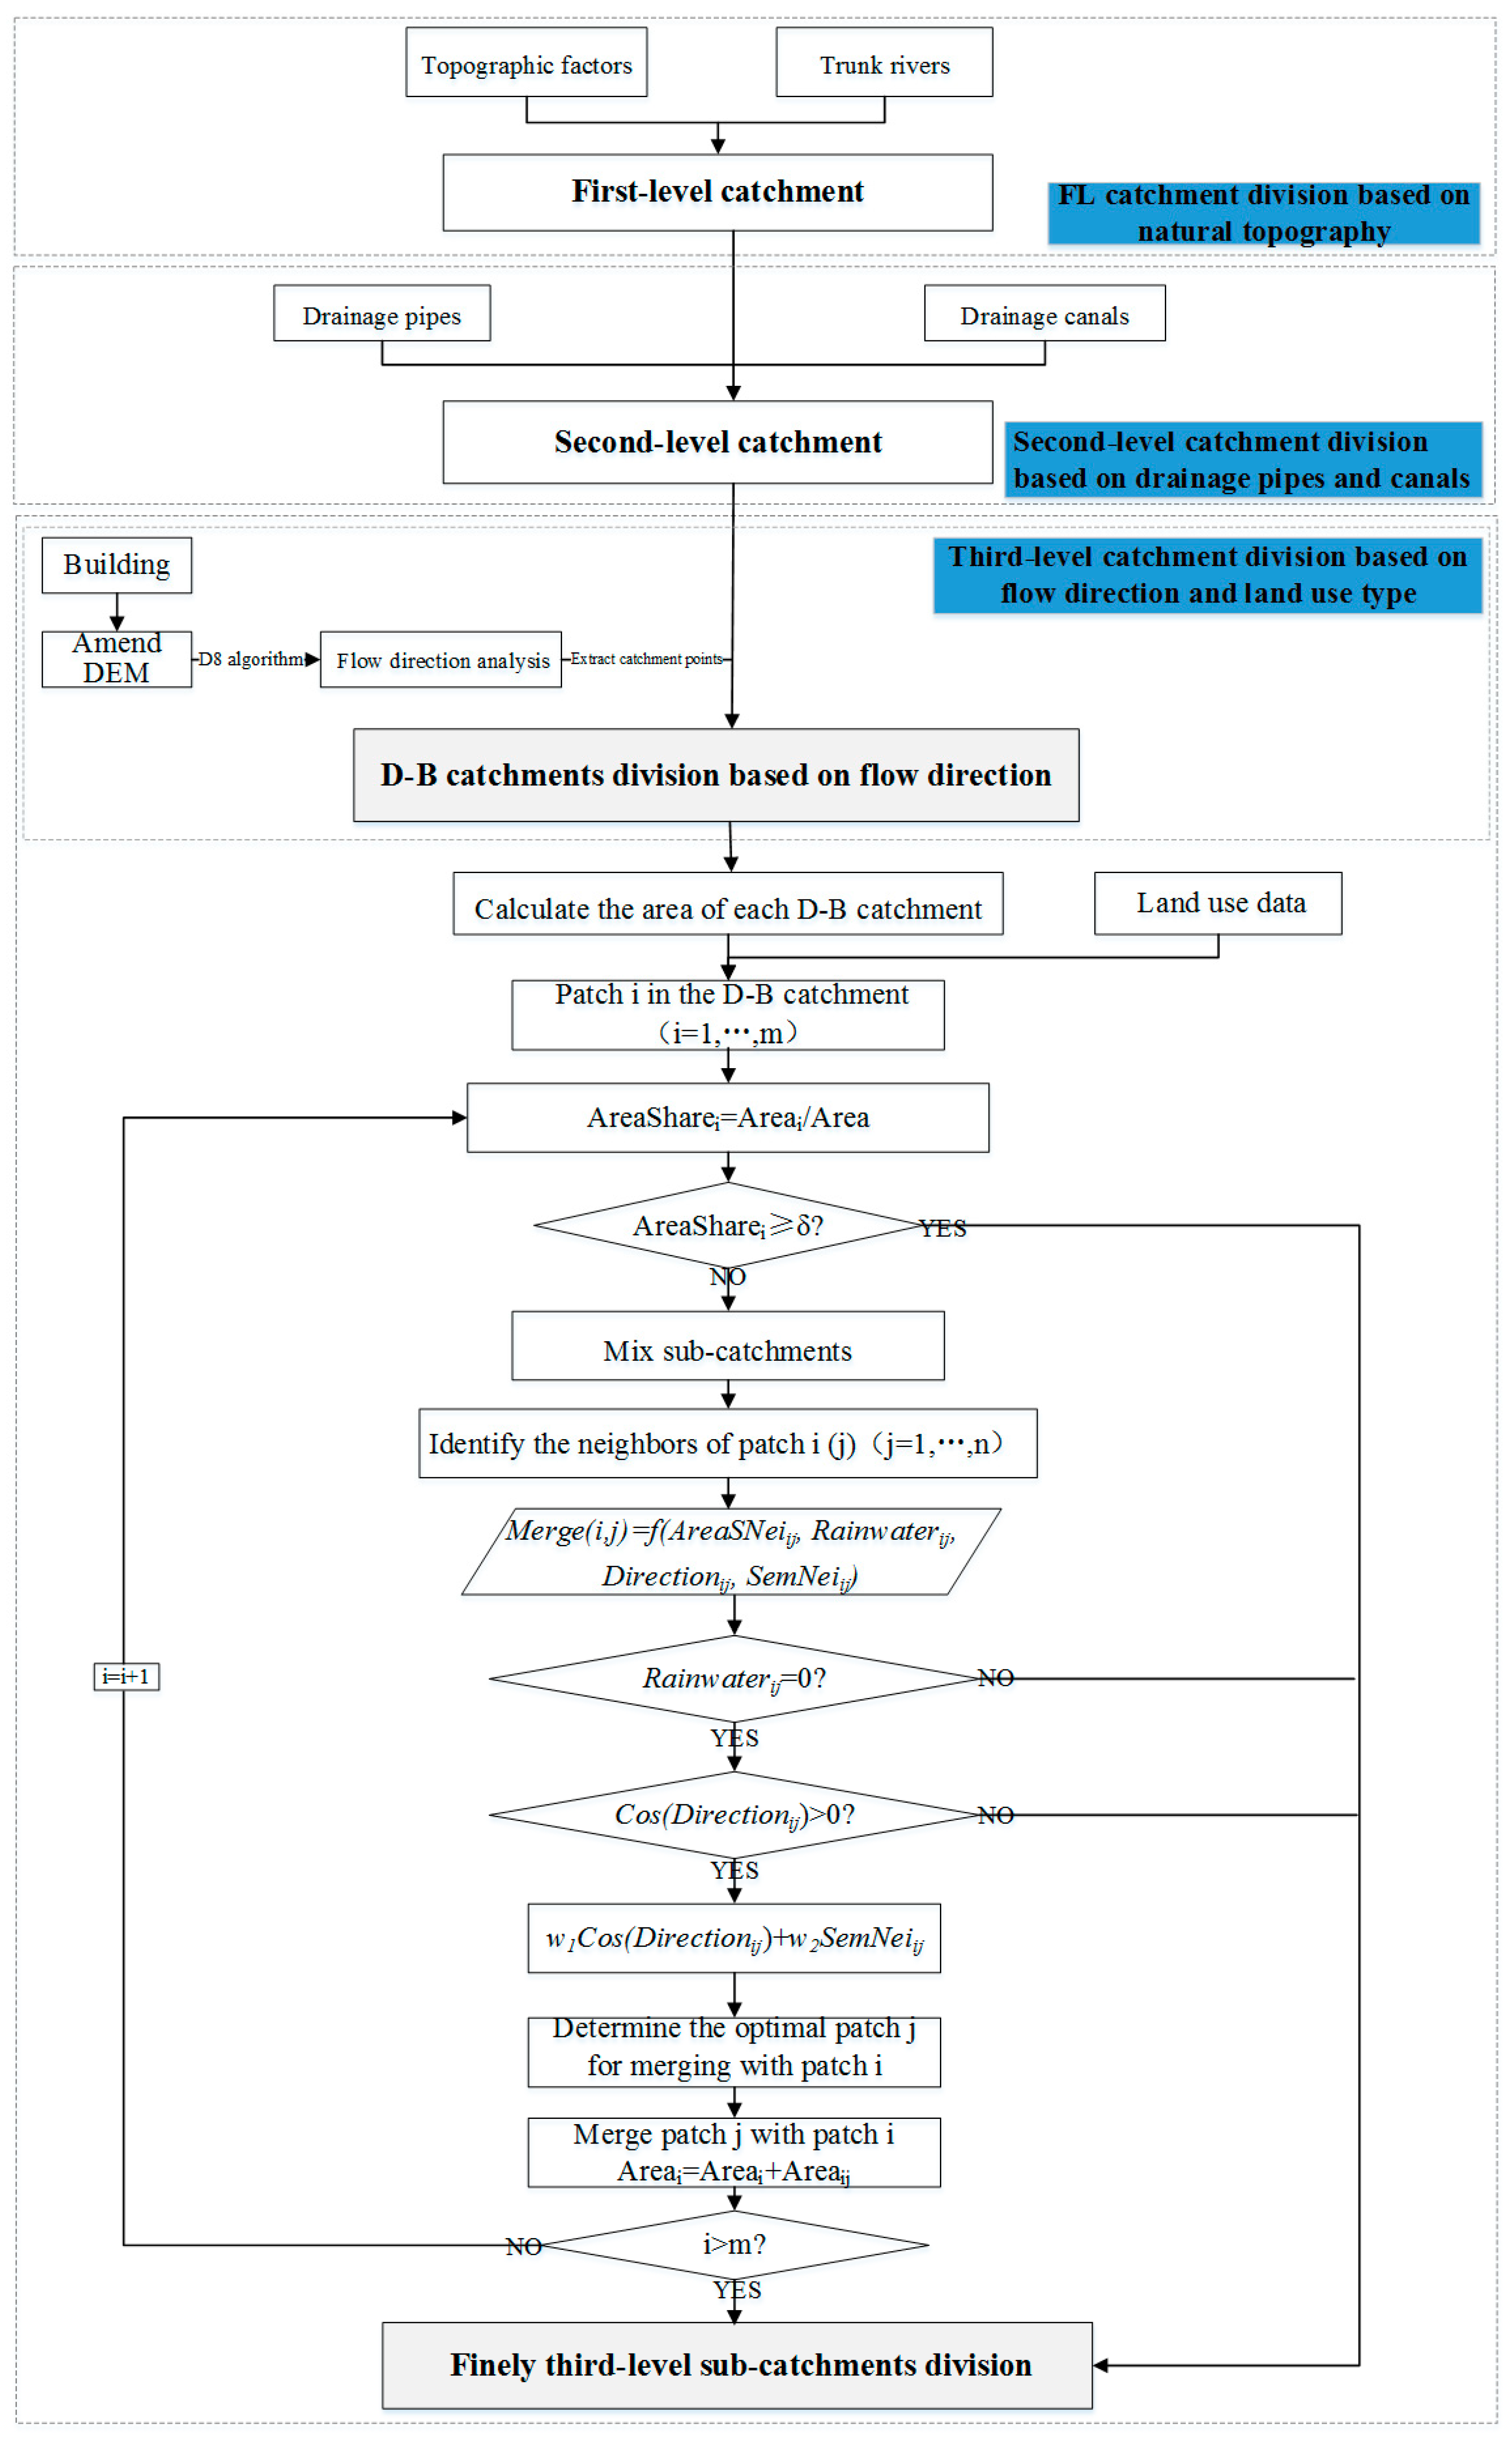
3. Catchment Division Method That Accounts for Land Type and Flow Direction
3.1. First-Level Catchment Division Based on the Natural Topography
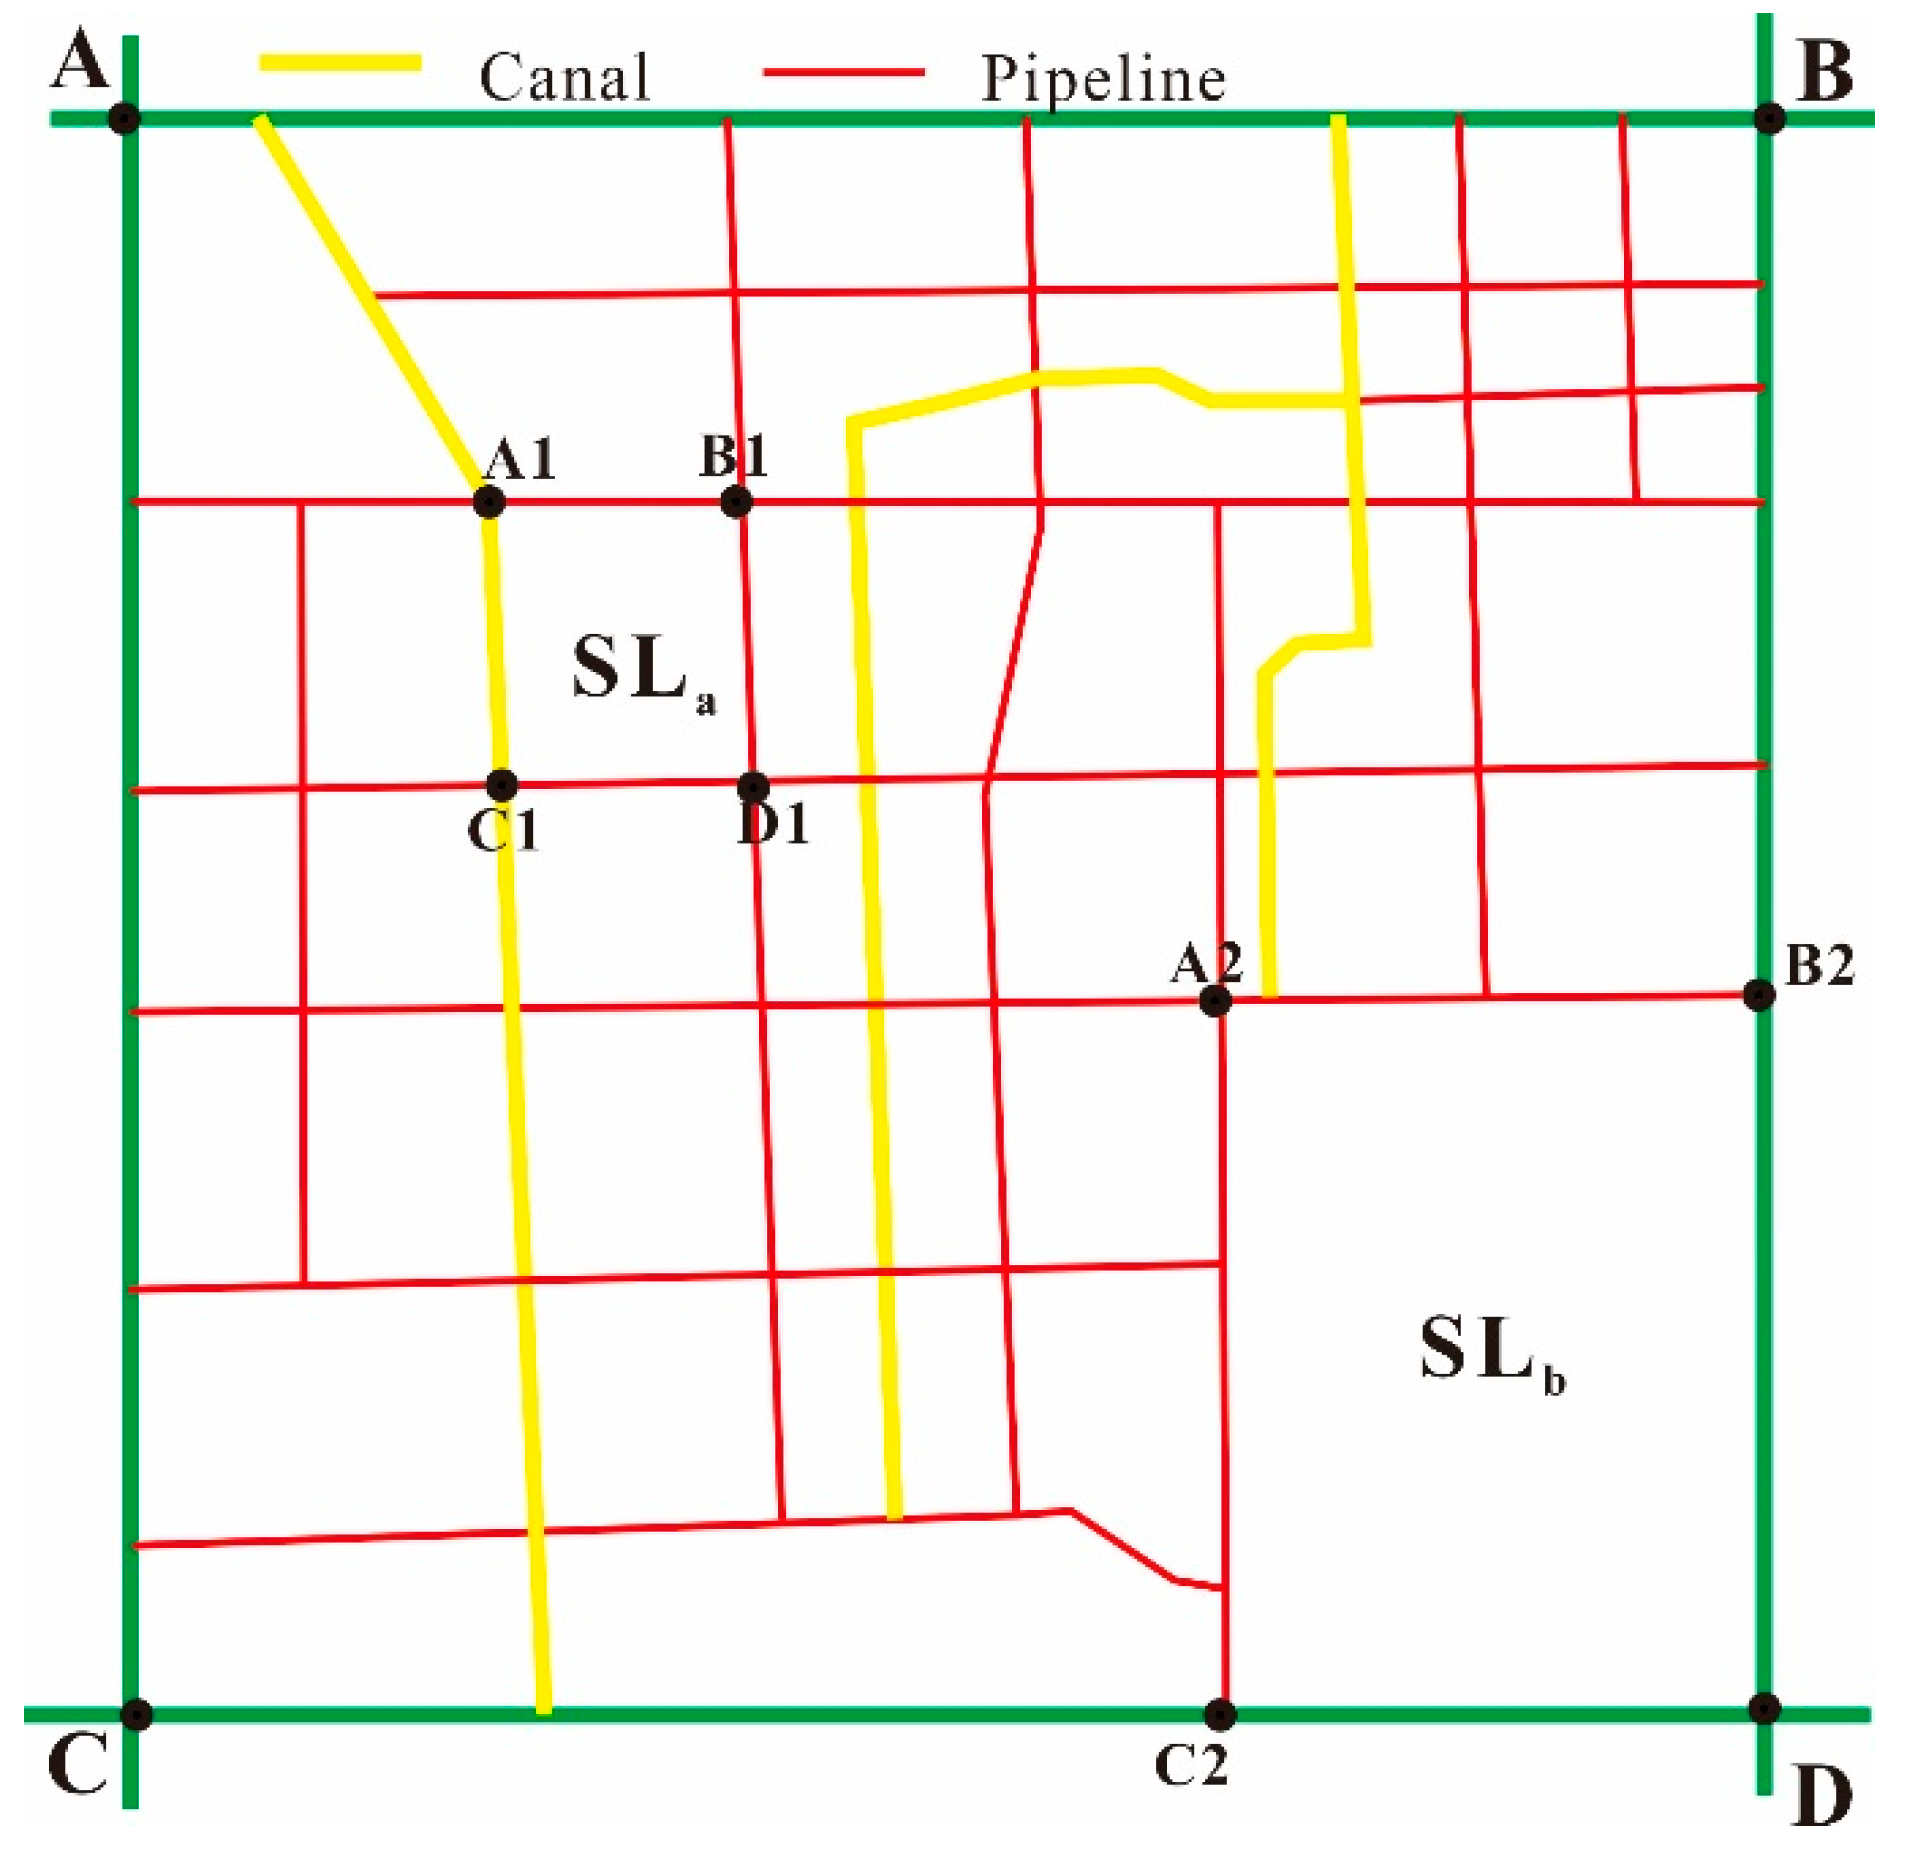
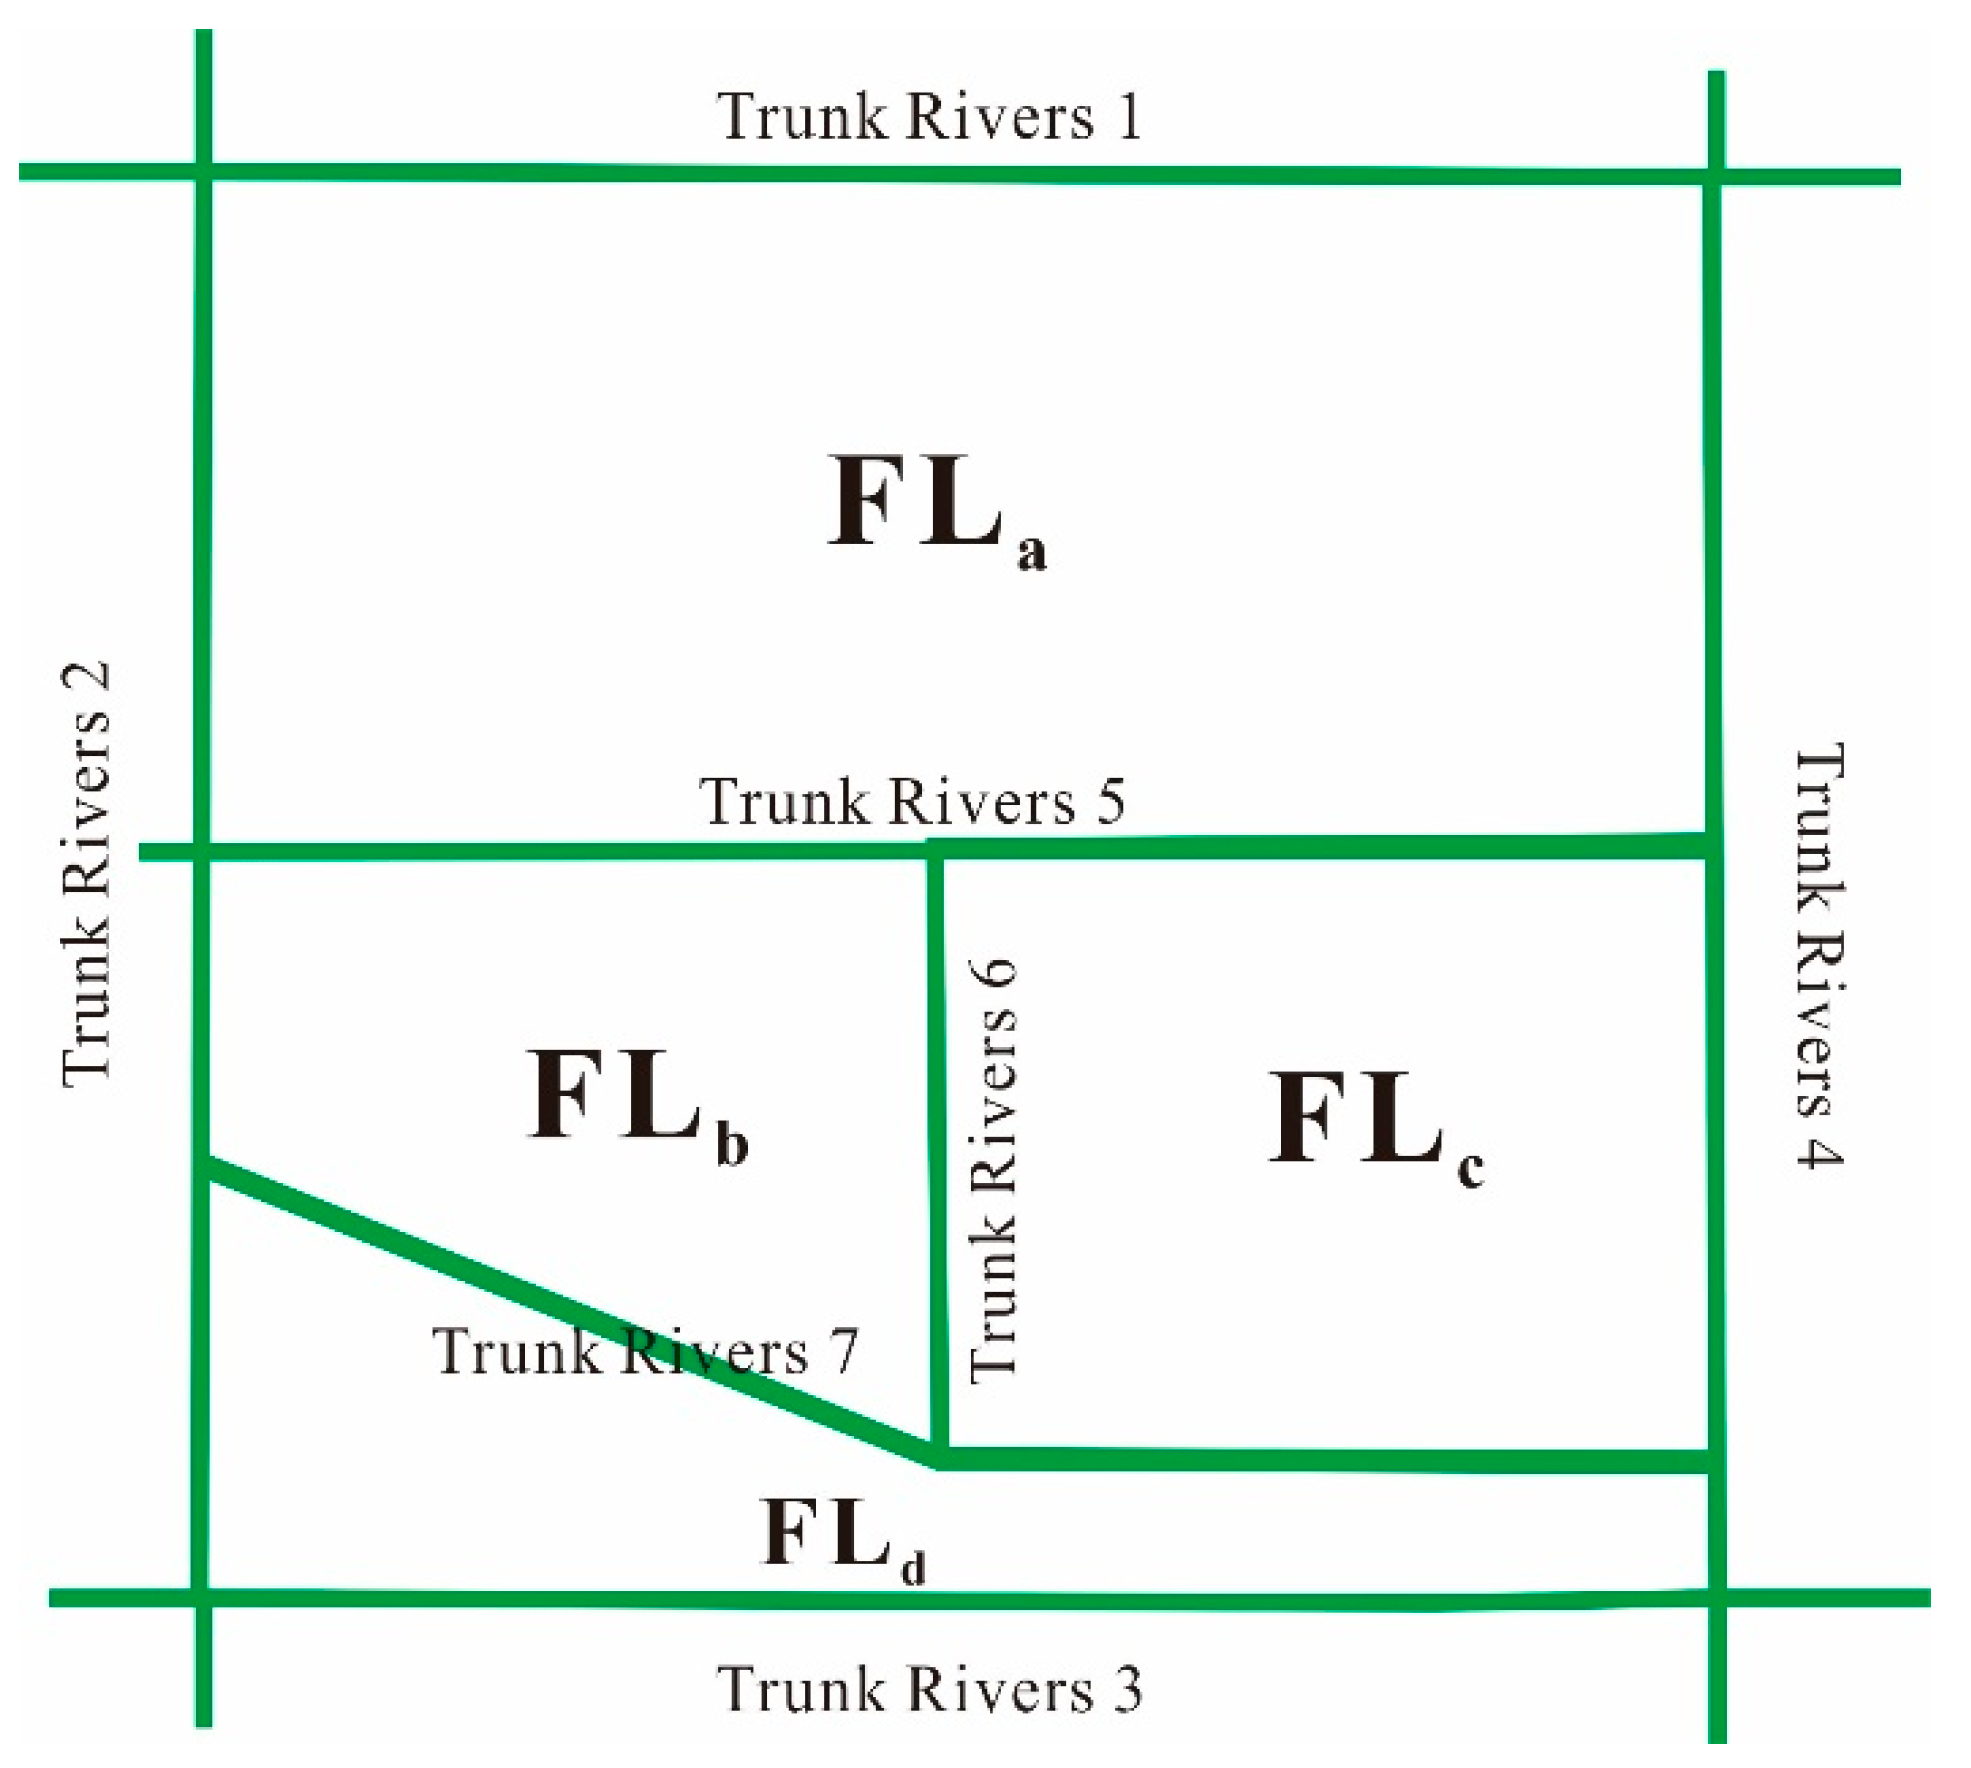
3.2. Second-Level Catchment Division Based on Canals and Pipe Network
3.3. Third-Level Catchment Division Based on Land Types and Flow Directions
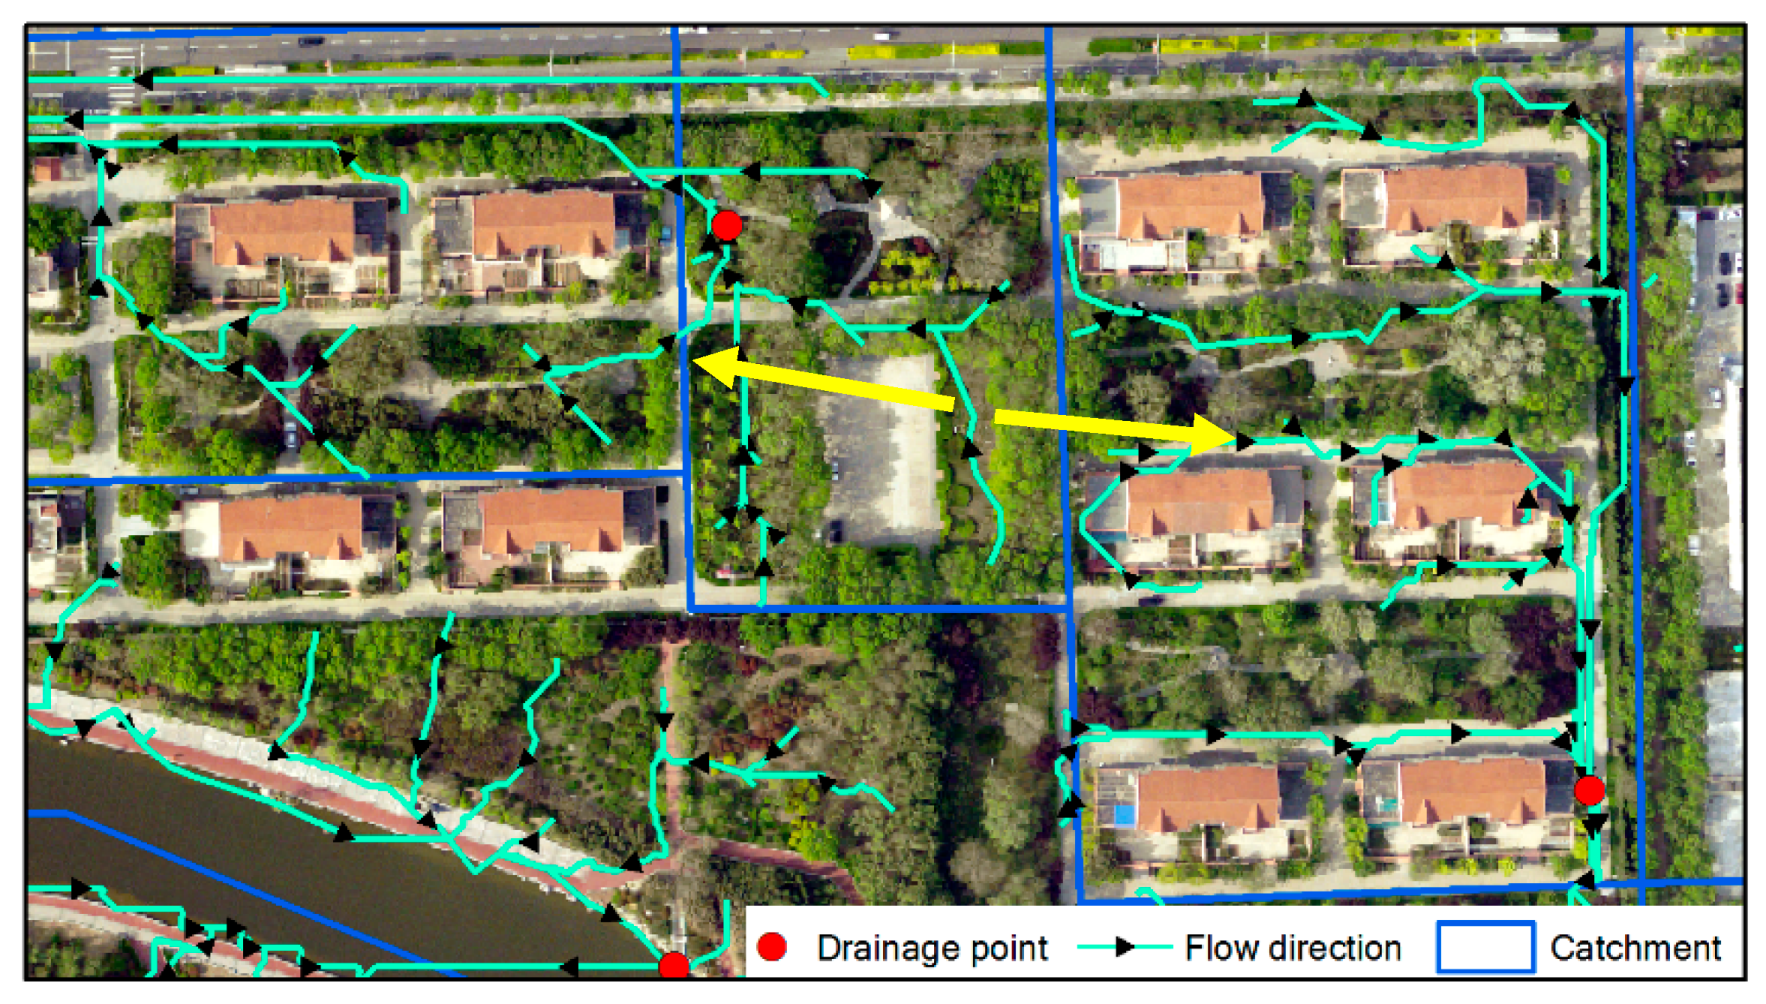
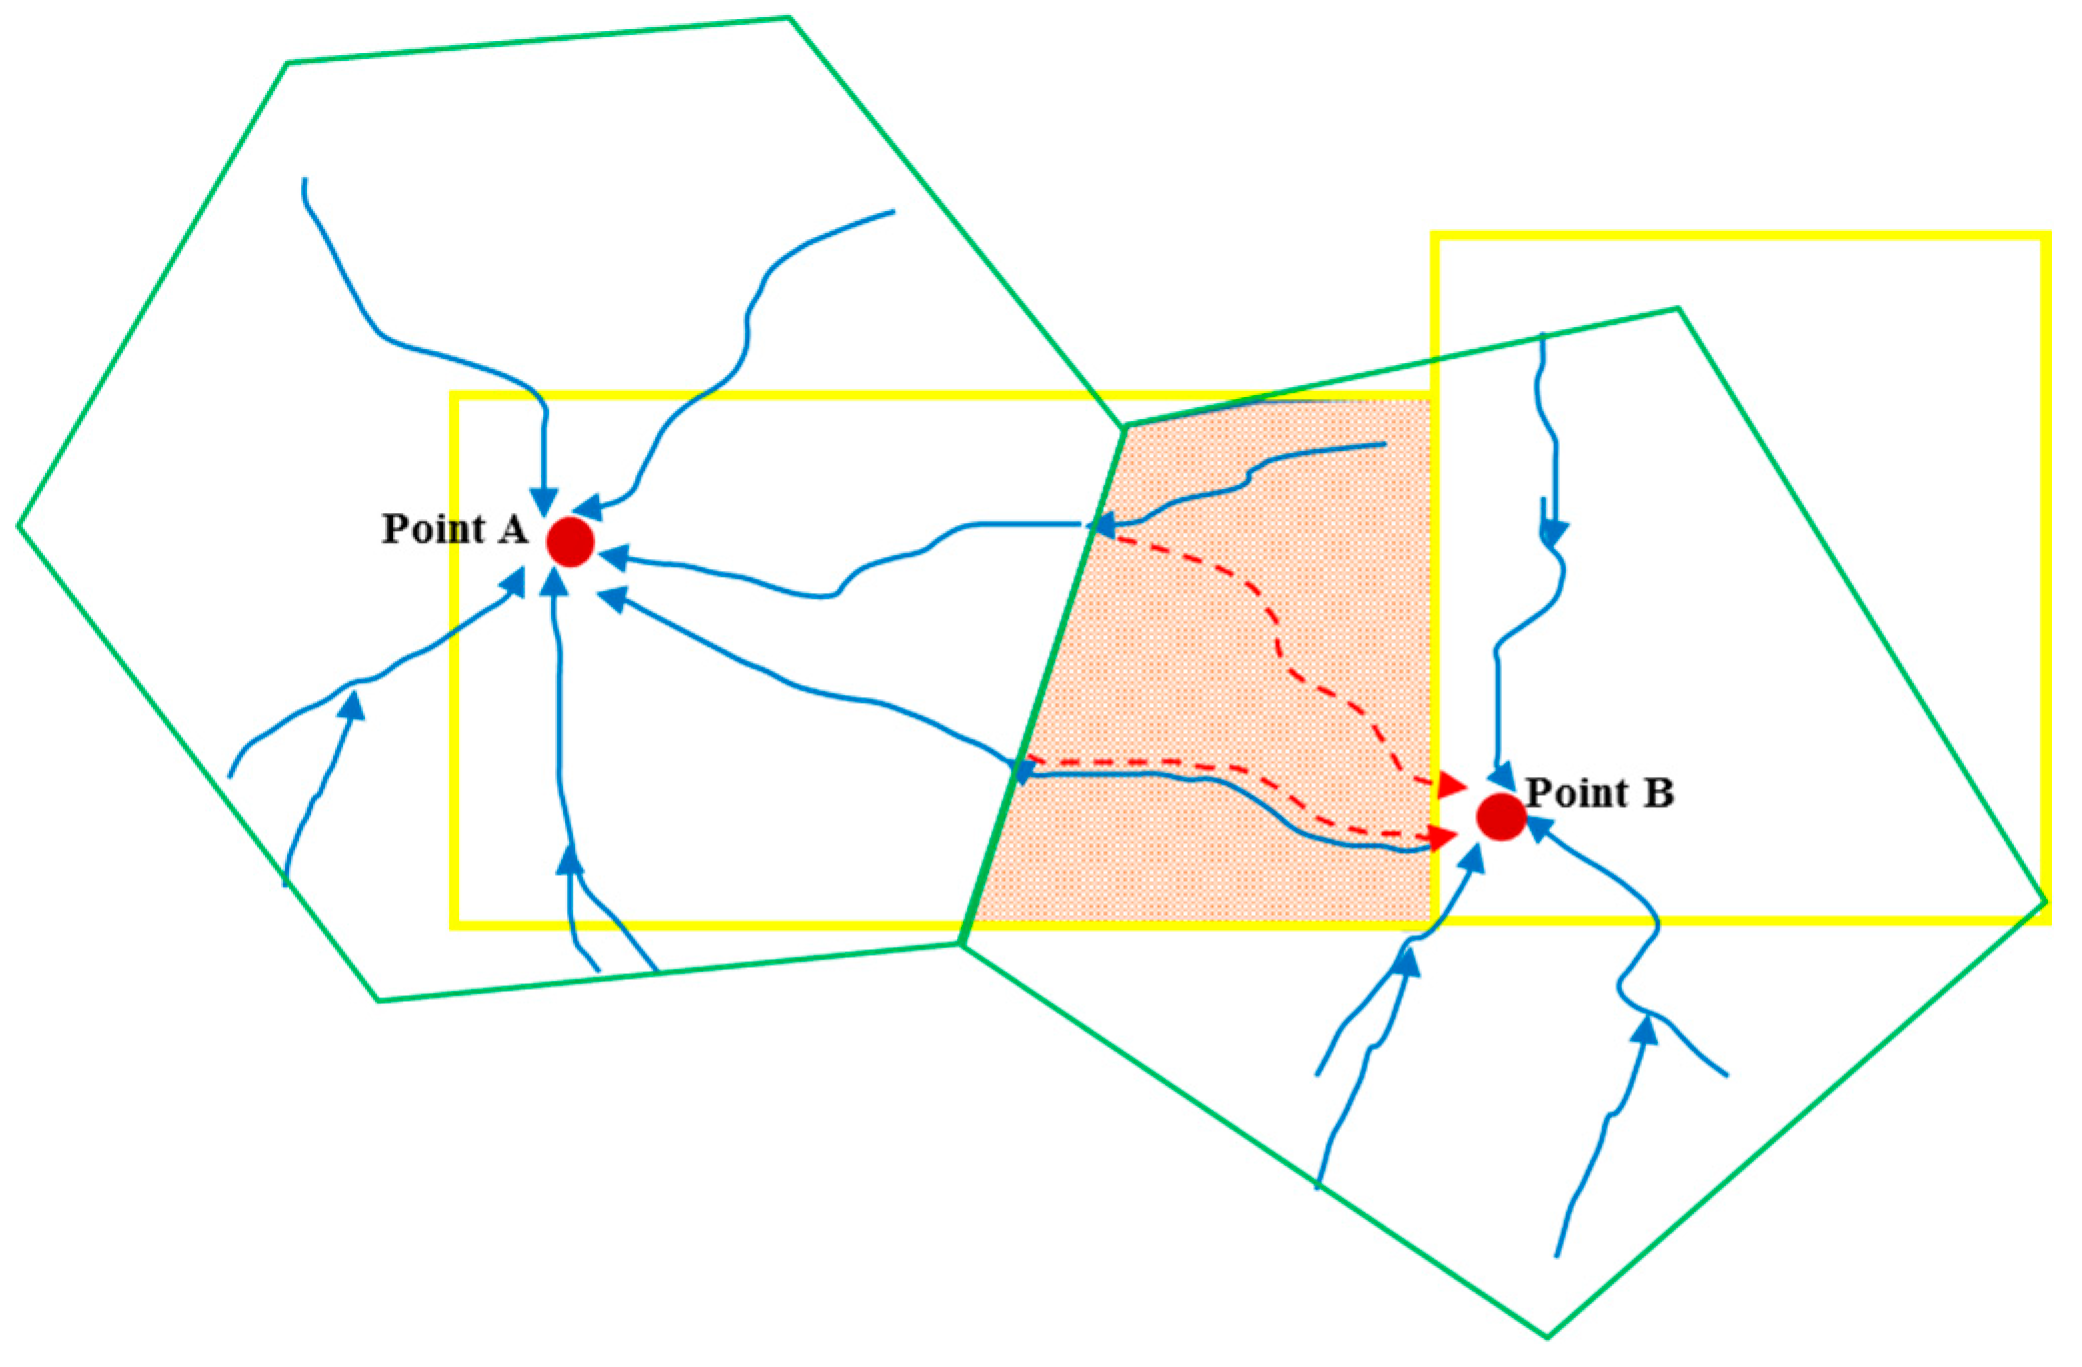
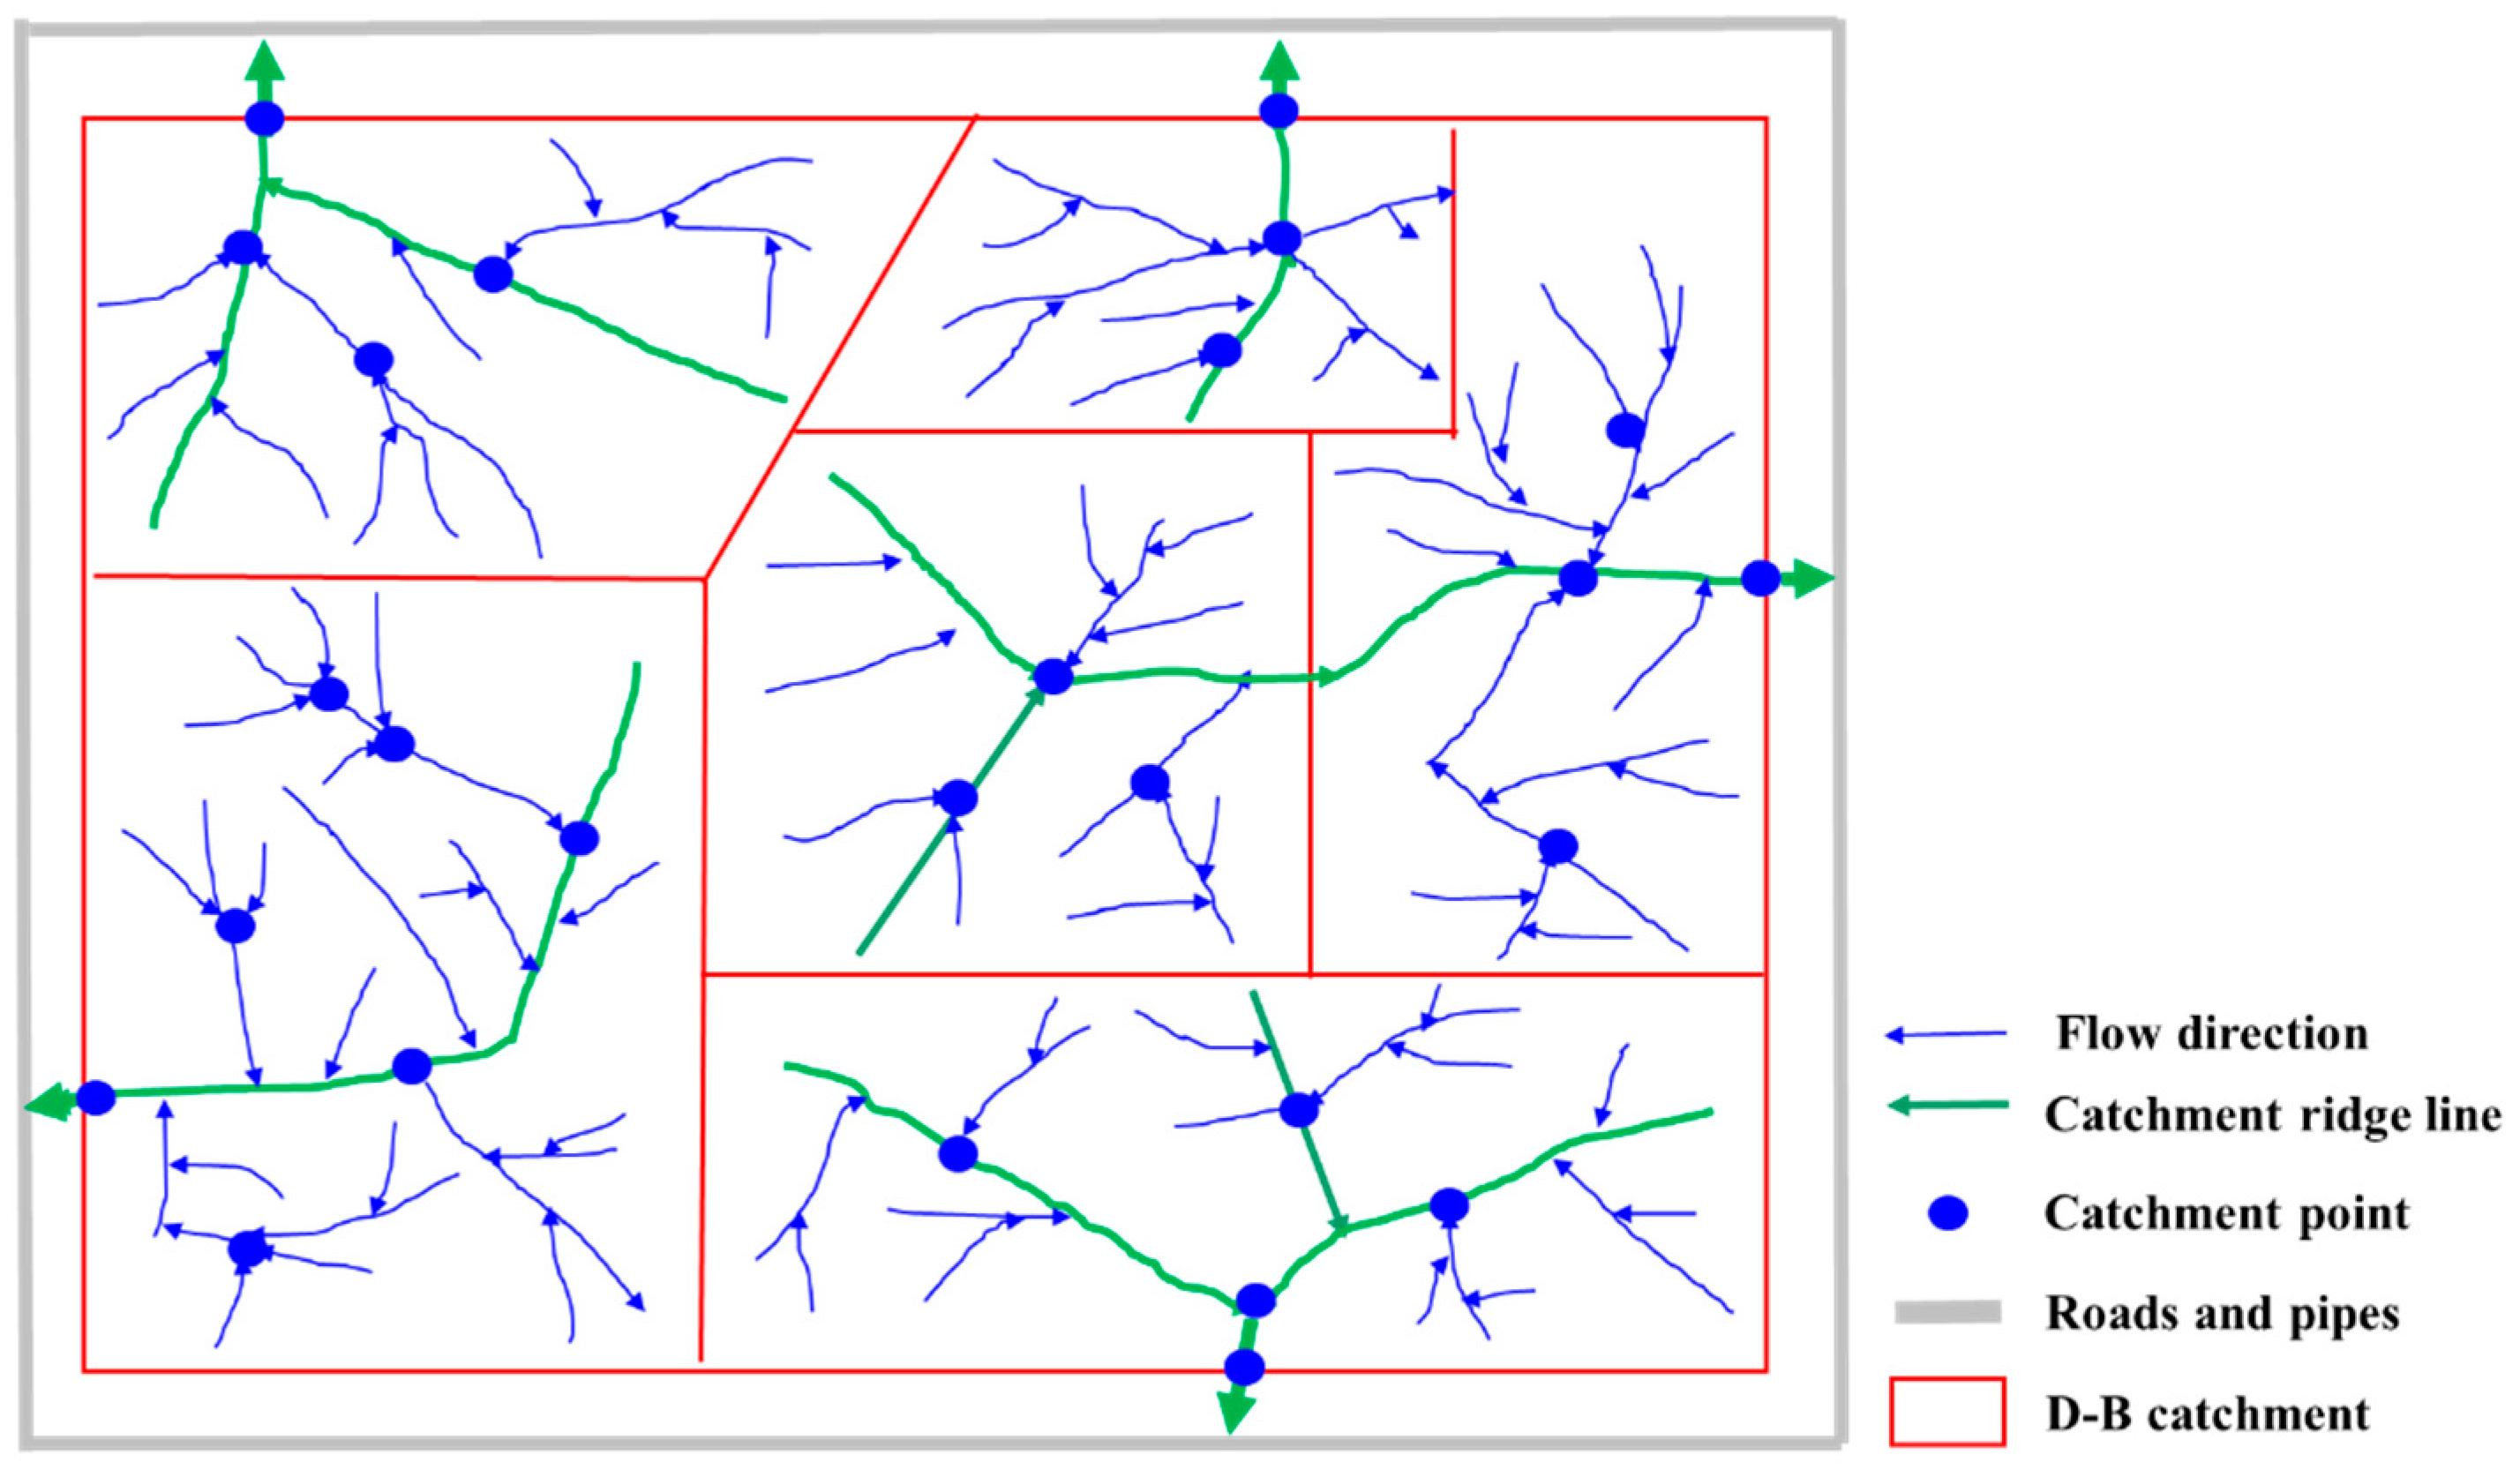
3.3.1. Partitioning of D-B Catchments Based on Flow Directions
- (1)
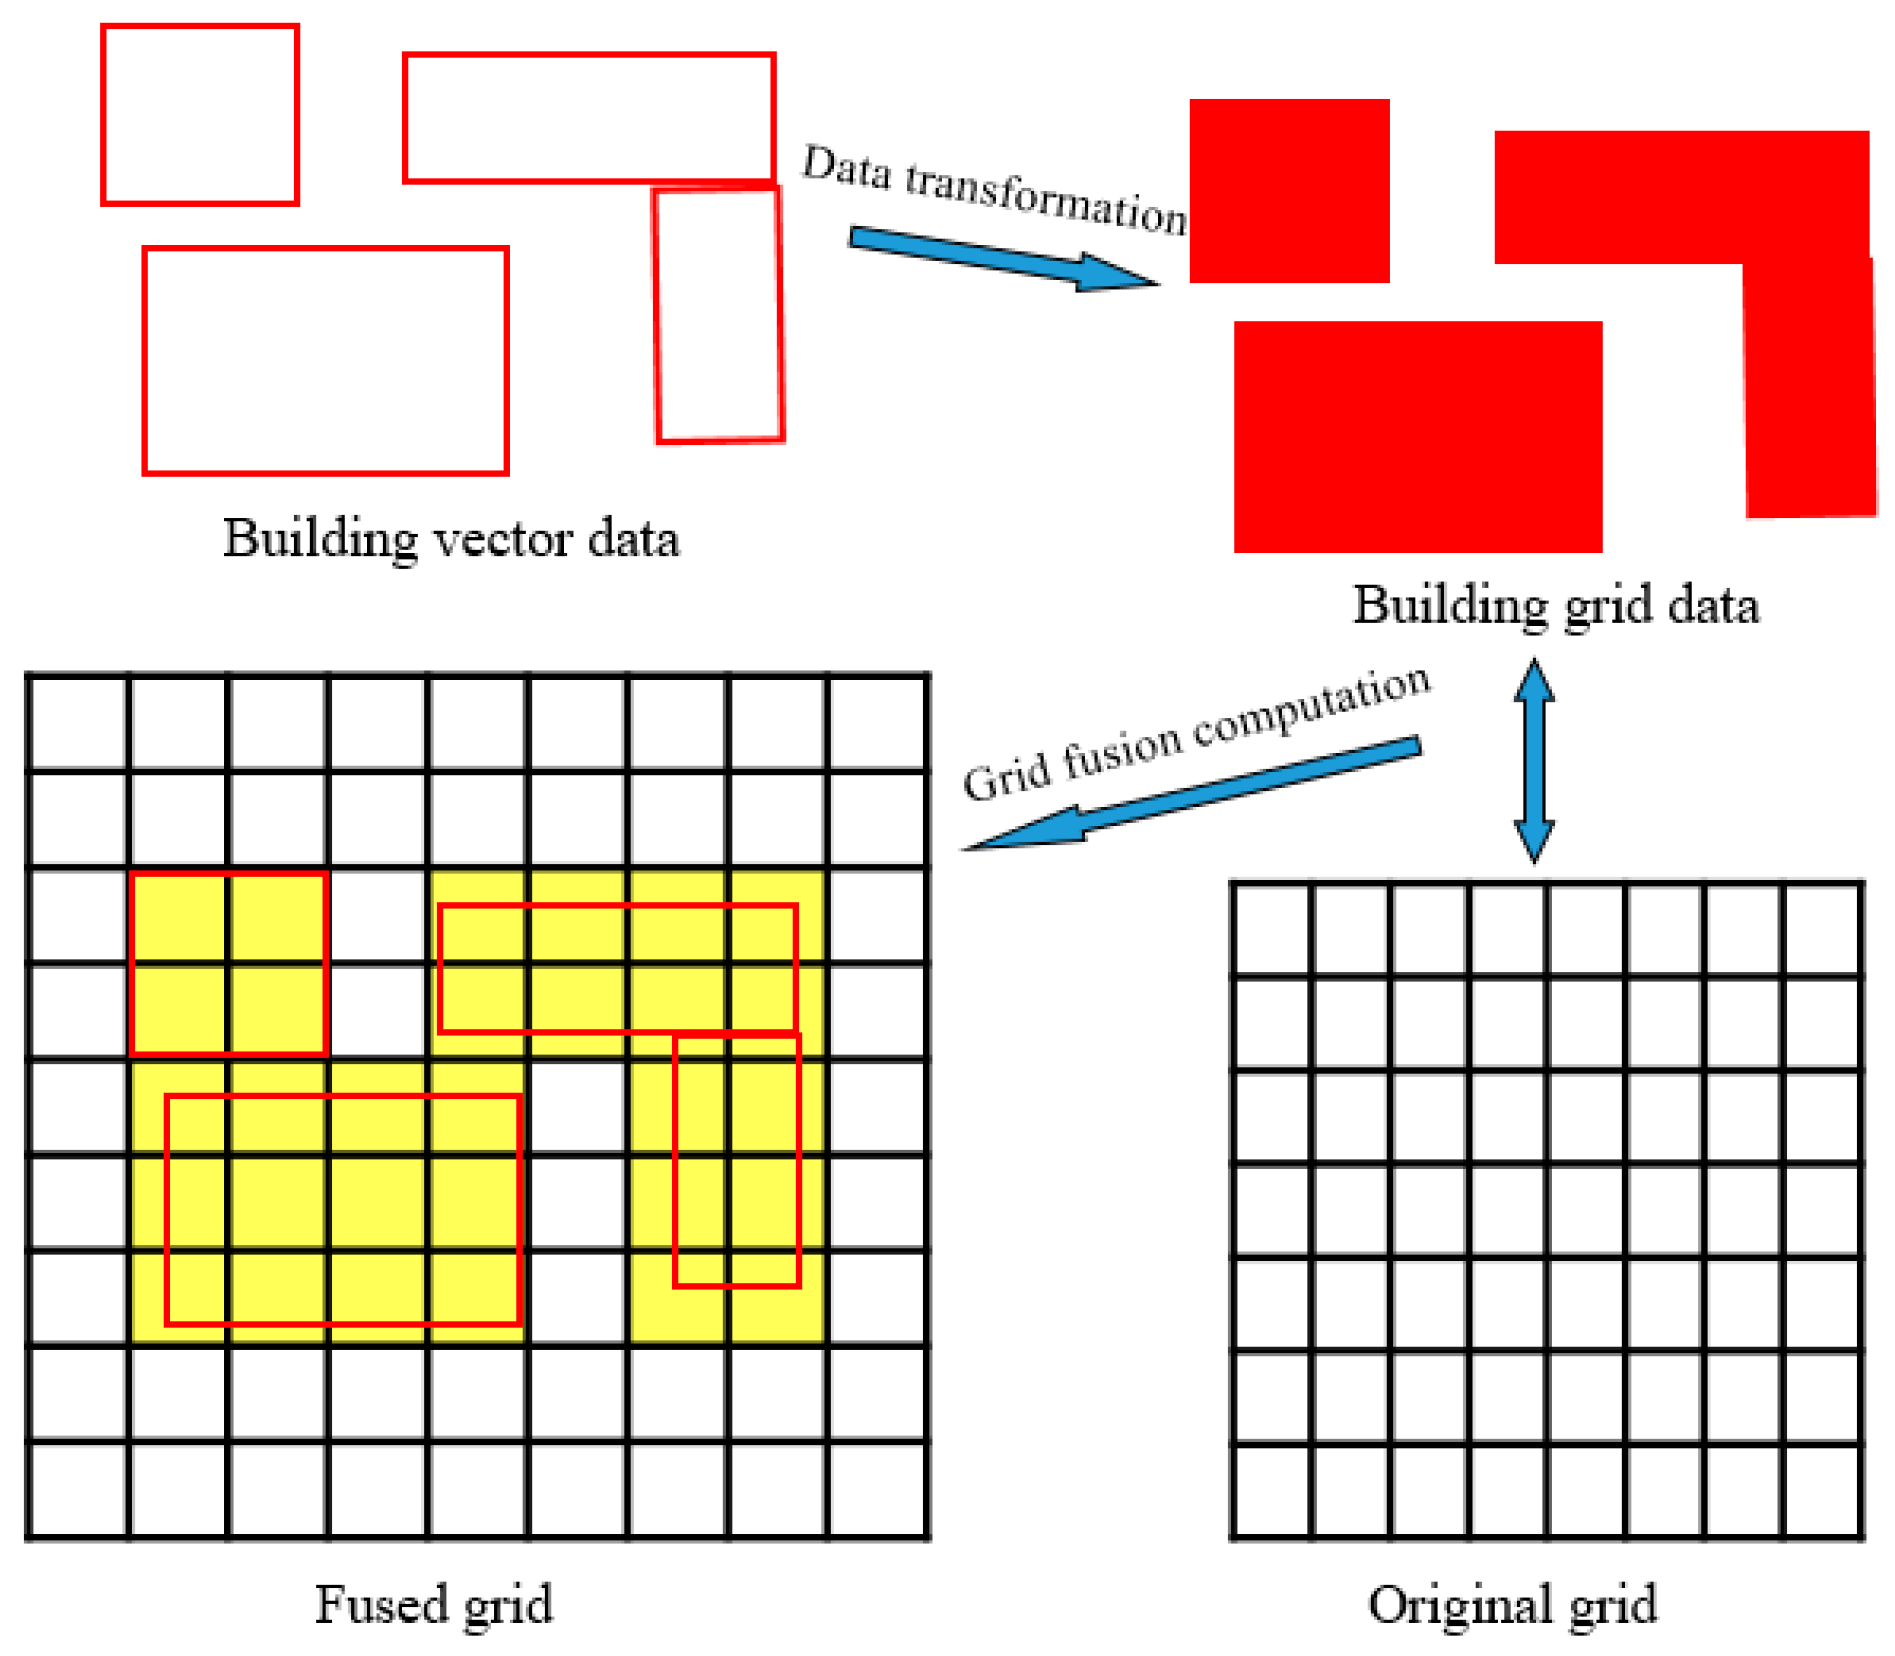
- DEM Amendment
- (2)
- D-B Catchment Division Based on Flow Directions
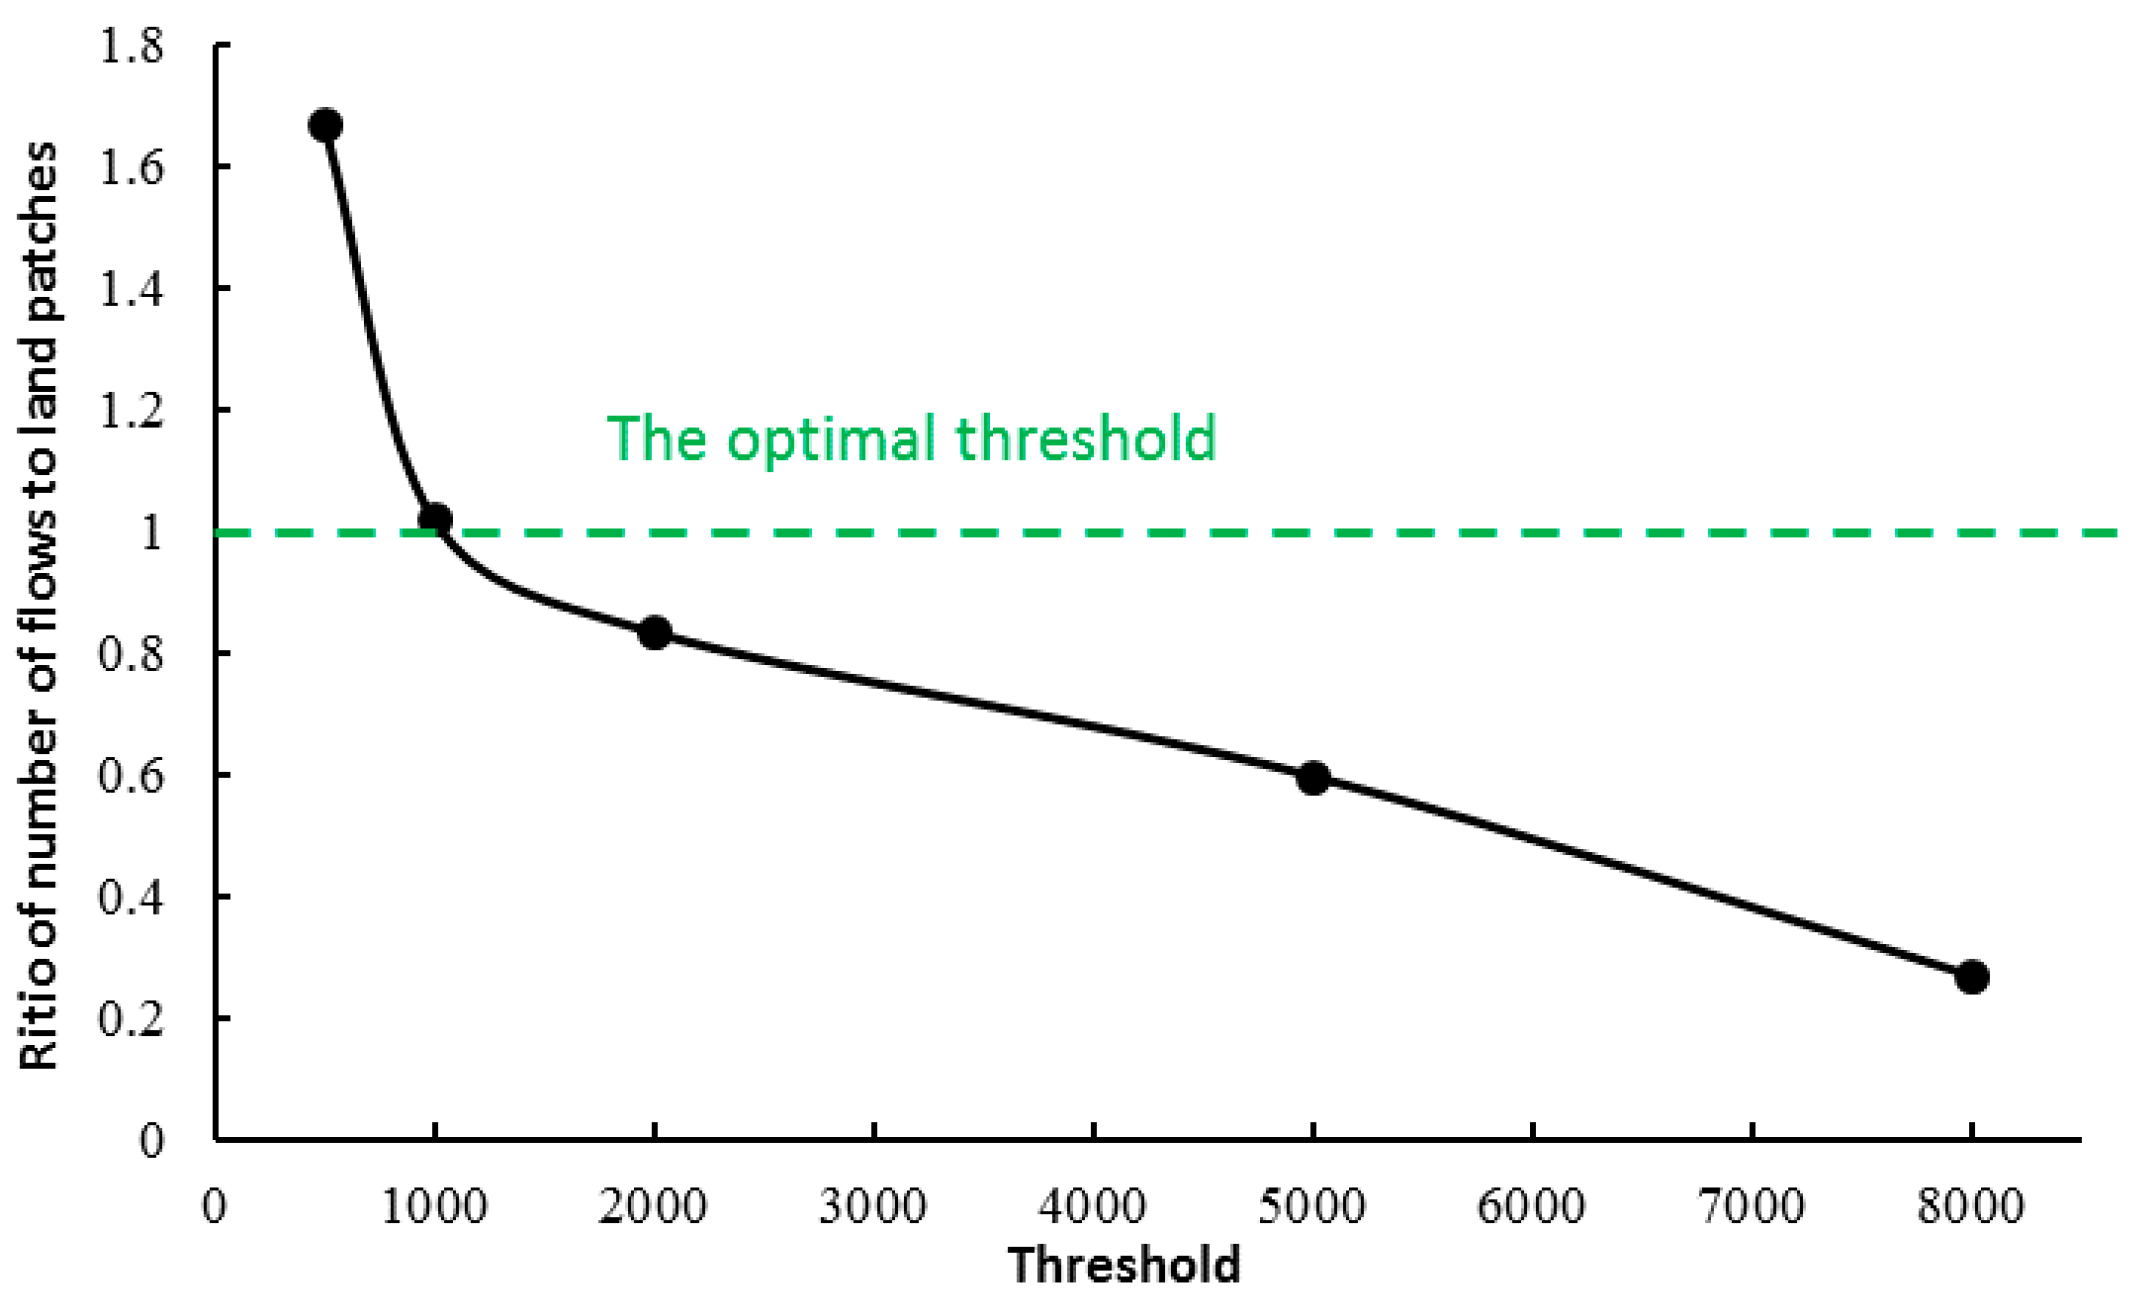
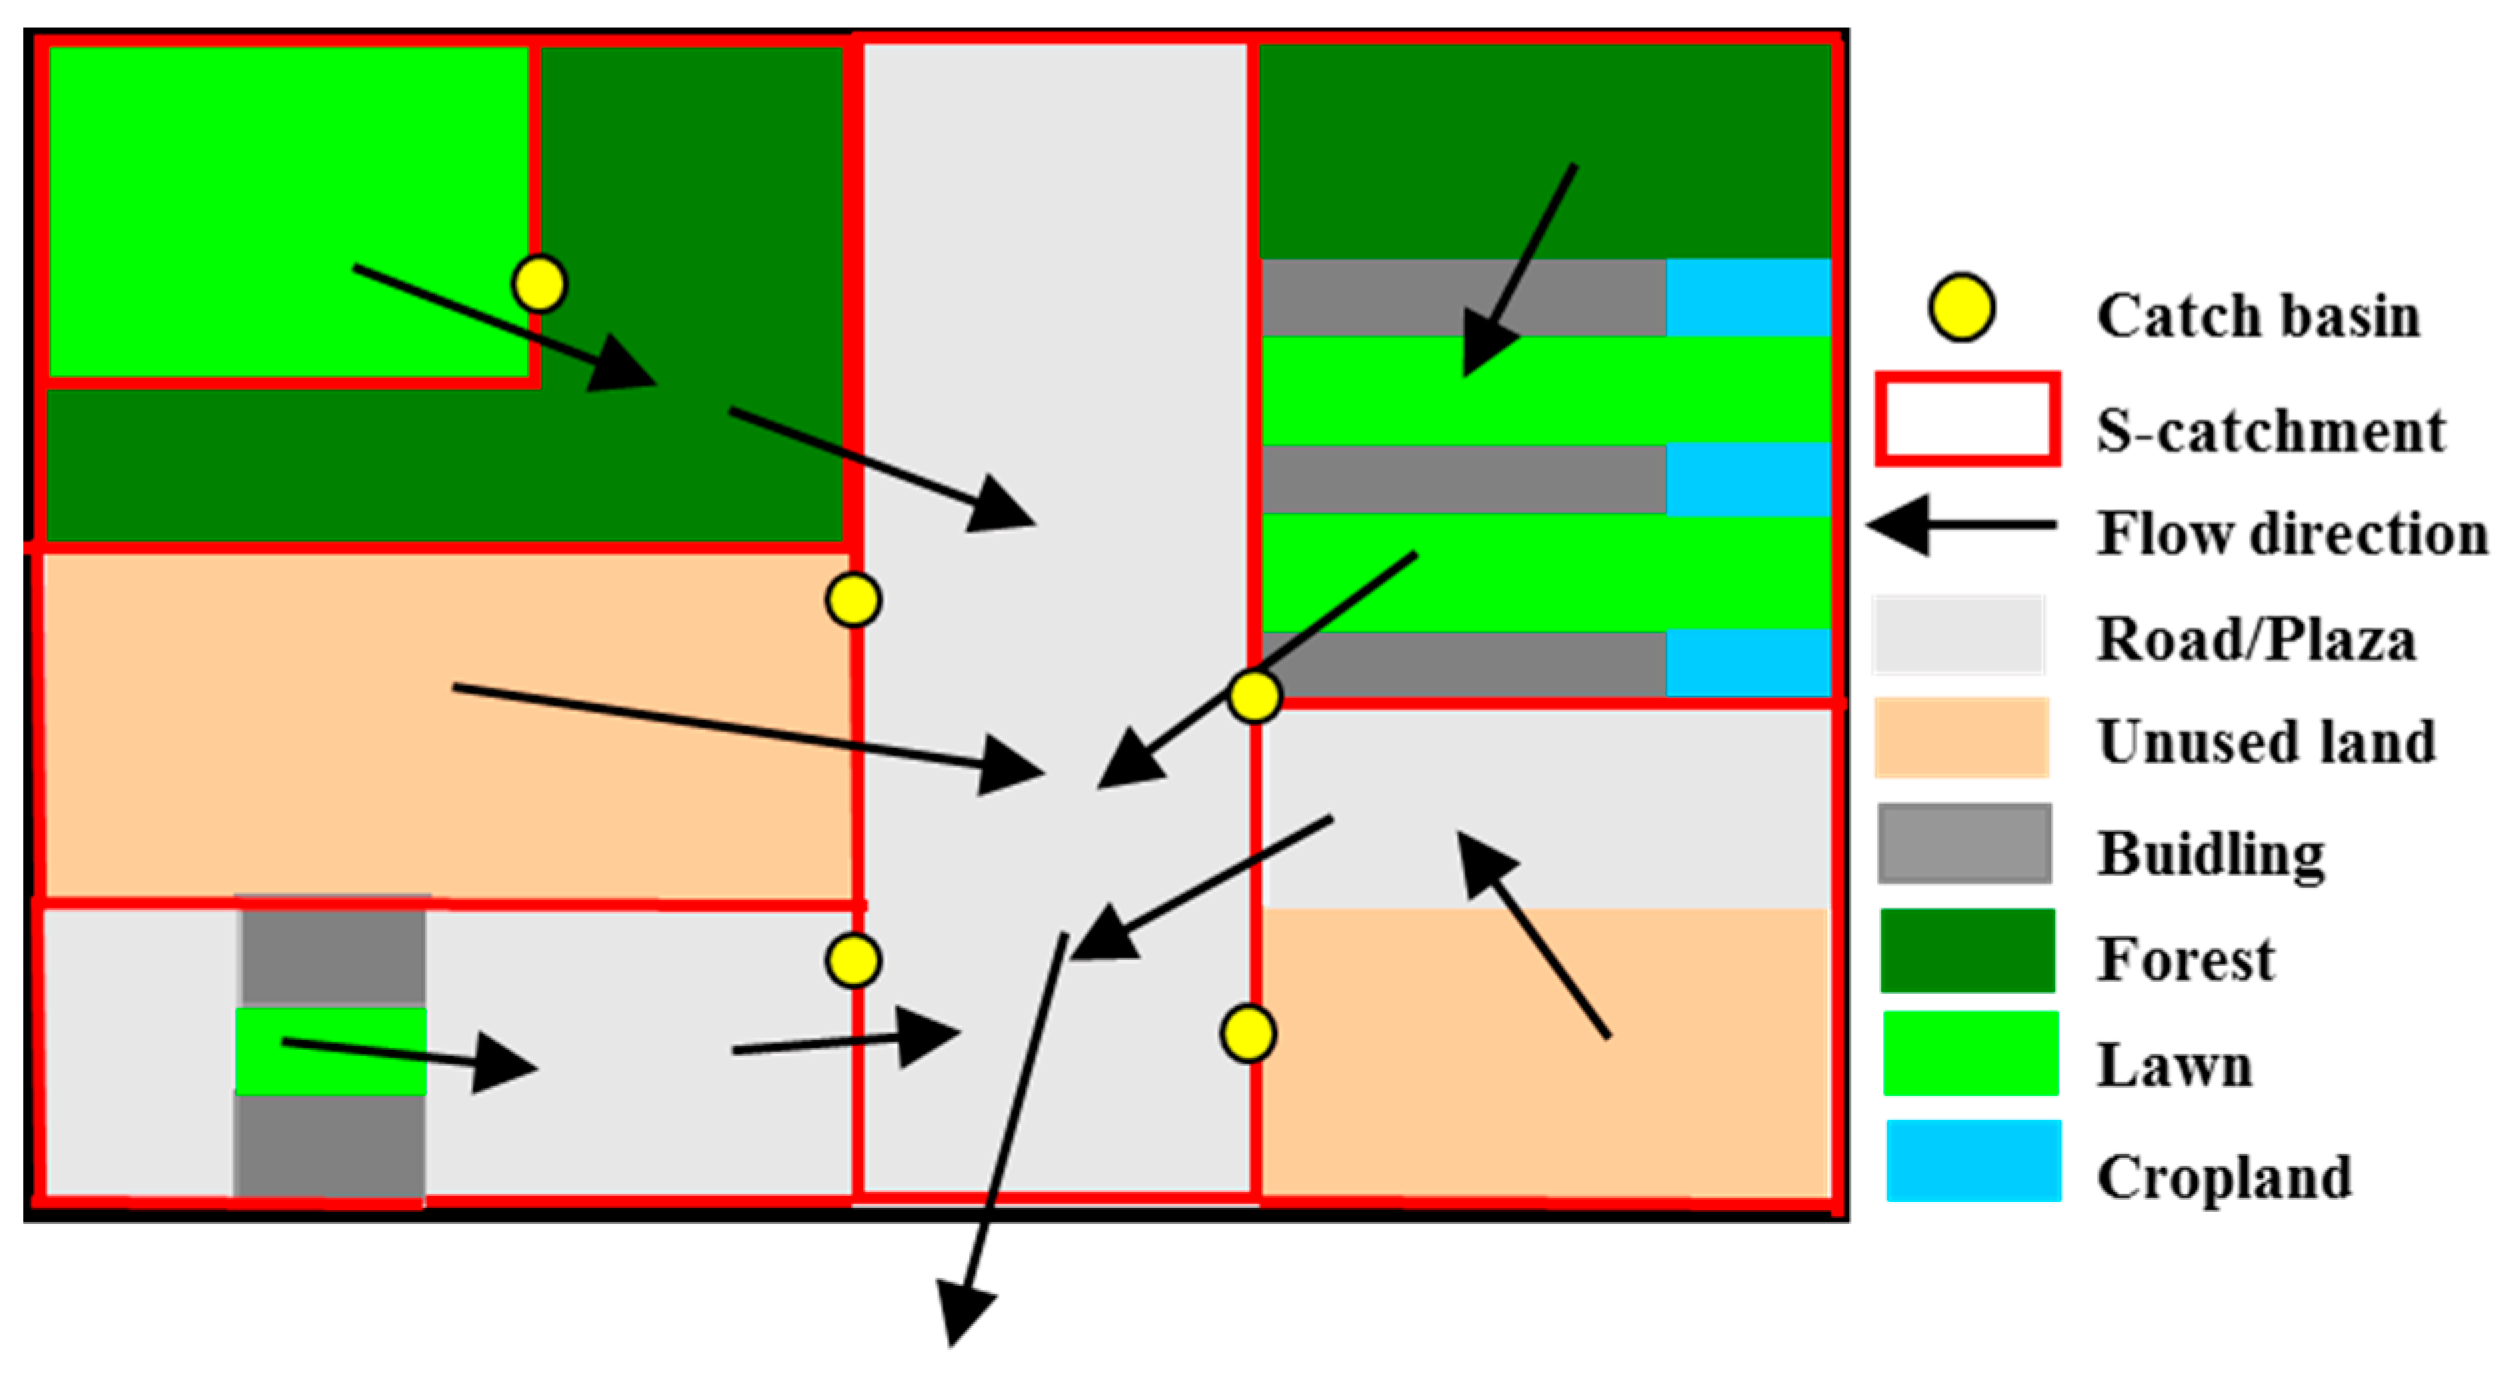
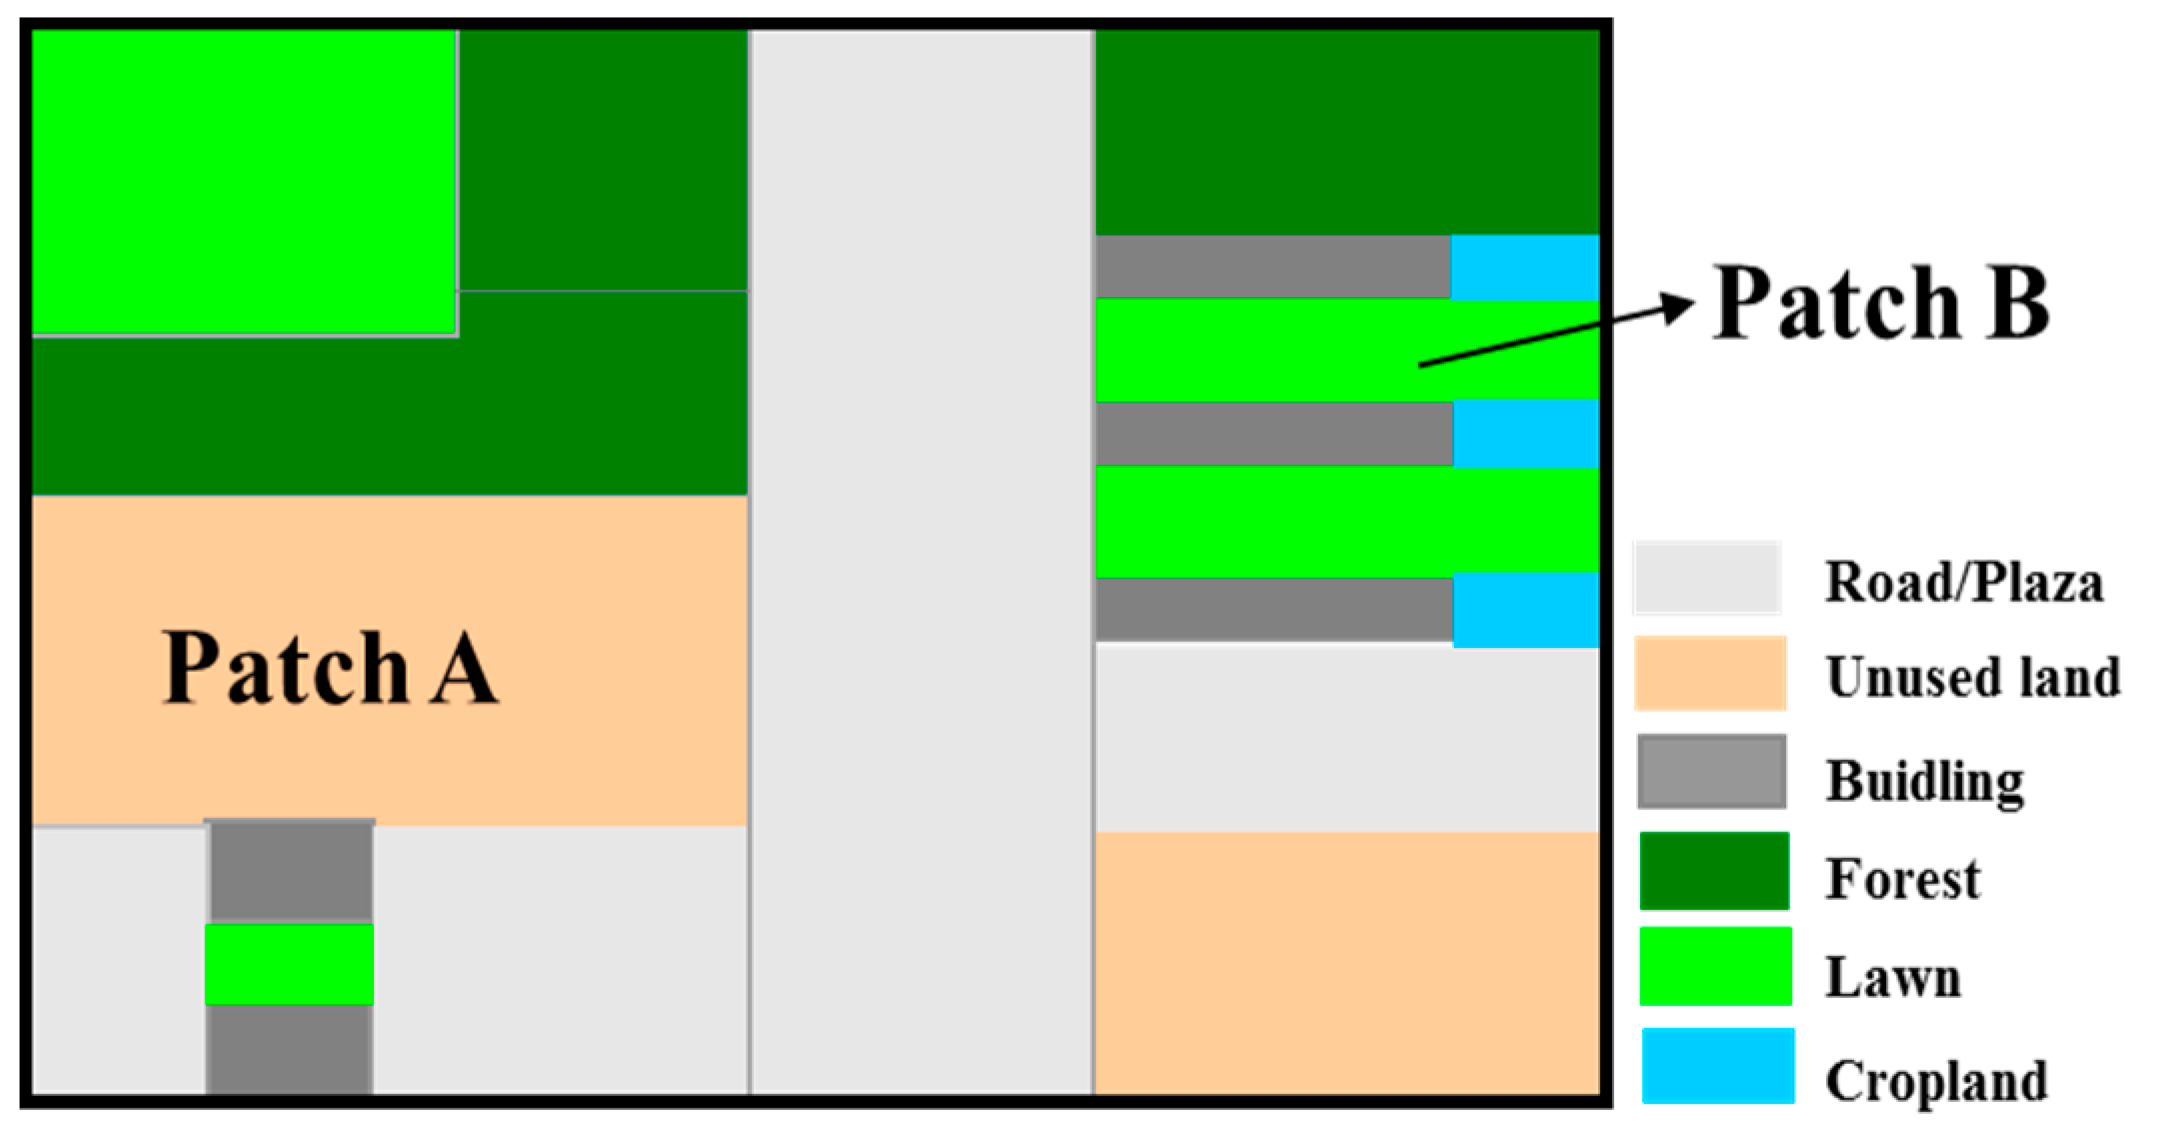
3.3.2. The Smallest Catchment Division Based on Land Type Data
- (1)
- Calculation of Land-use patch Areas
- (2)
- Determination of a Single Catchment
- (3)
- Iterative algorithm for the determination of mixed catchment areas
4. Experimental Analyses and Discussion
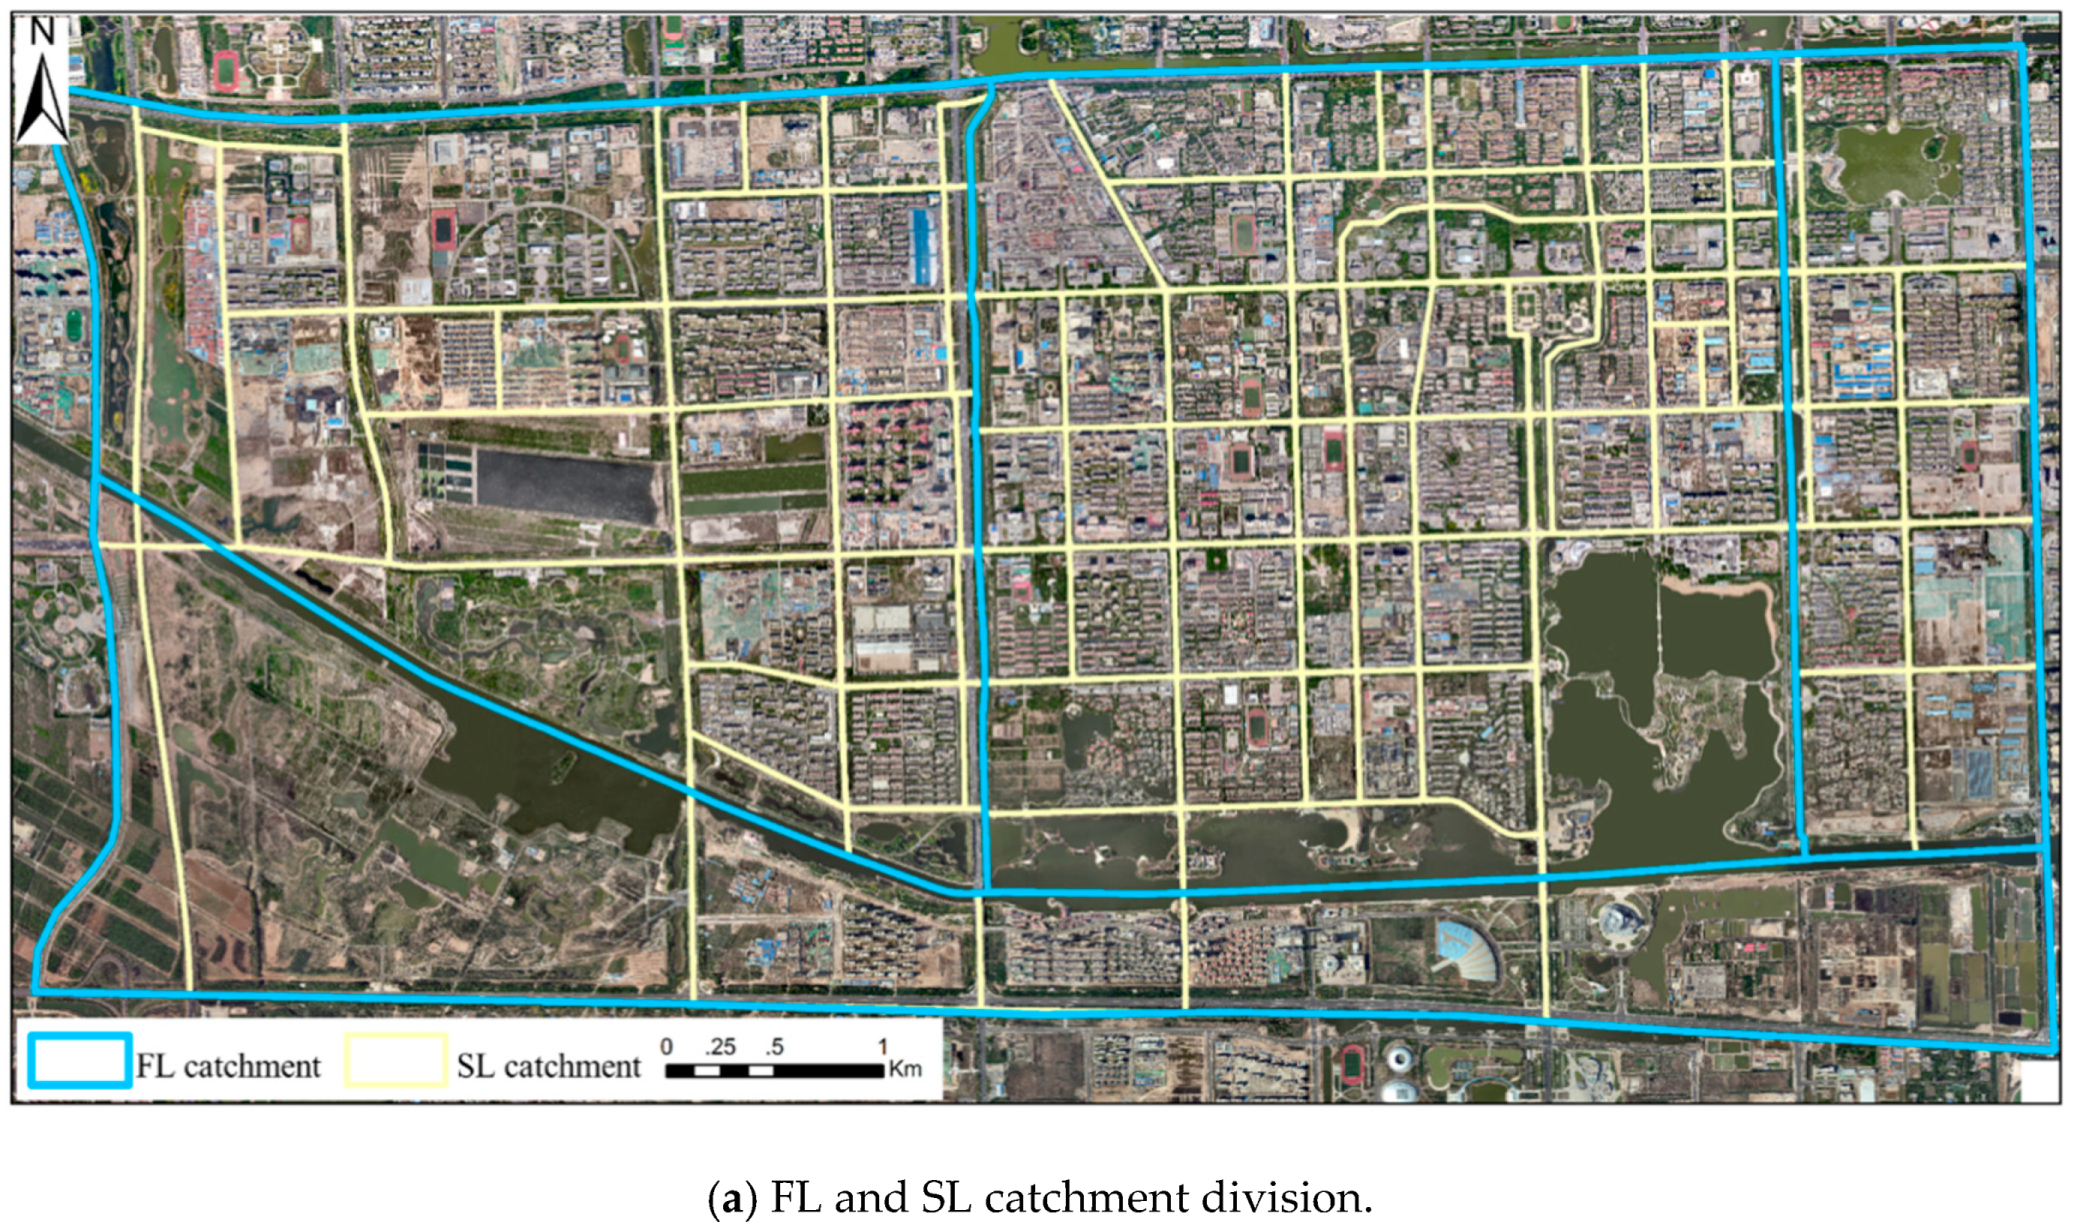
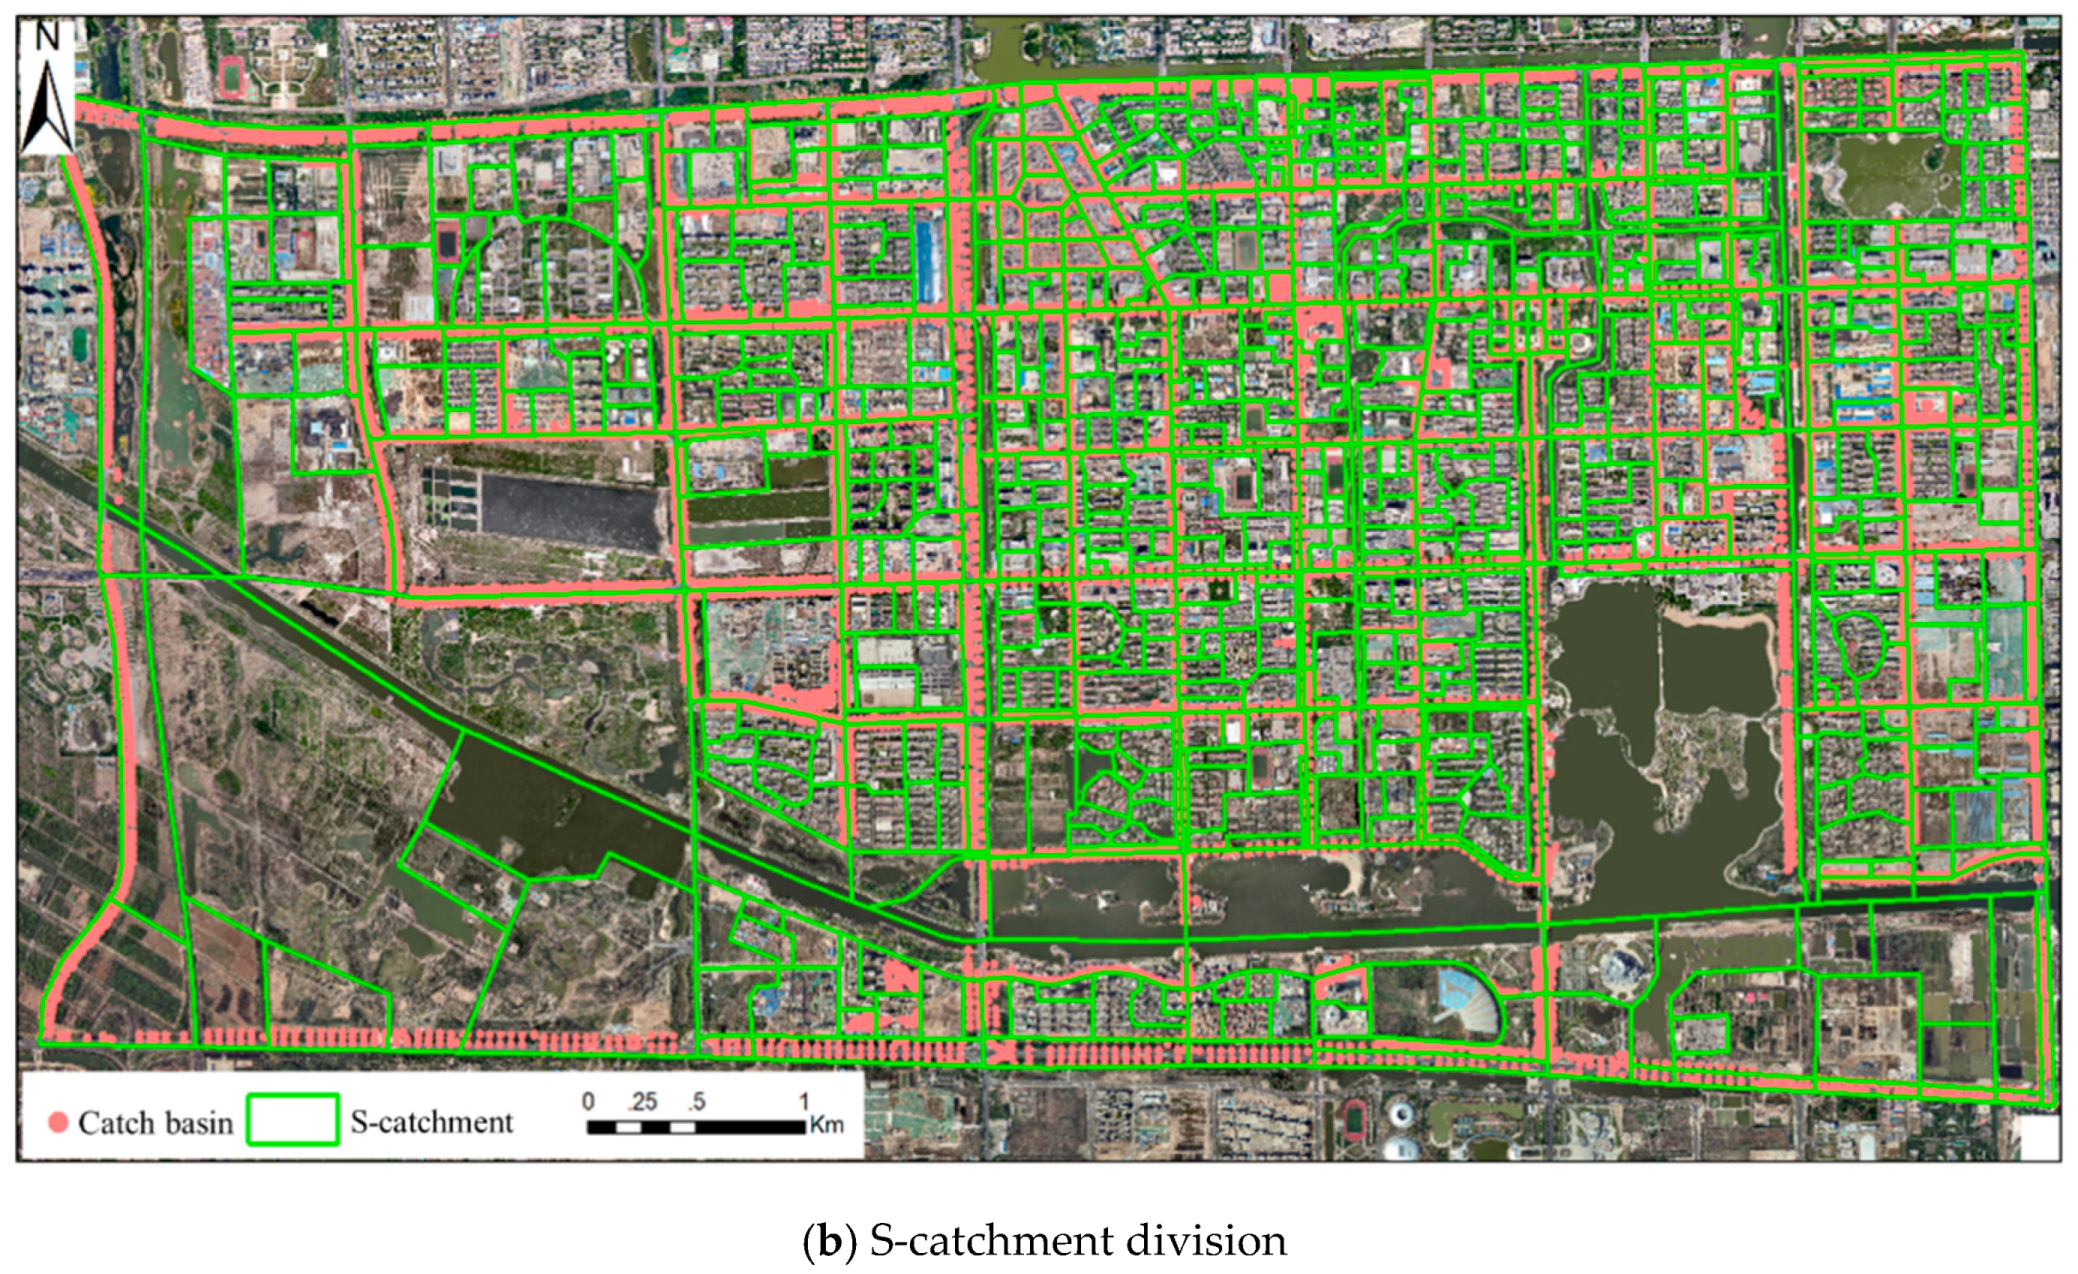
4.1. Catchment Division of the Study Area
4.2. Comparison with Other Methods and Discussion
4.2.1. Qualitative Comparison
- (1)
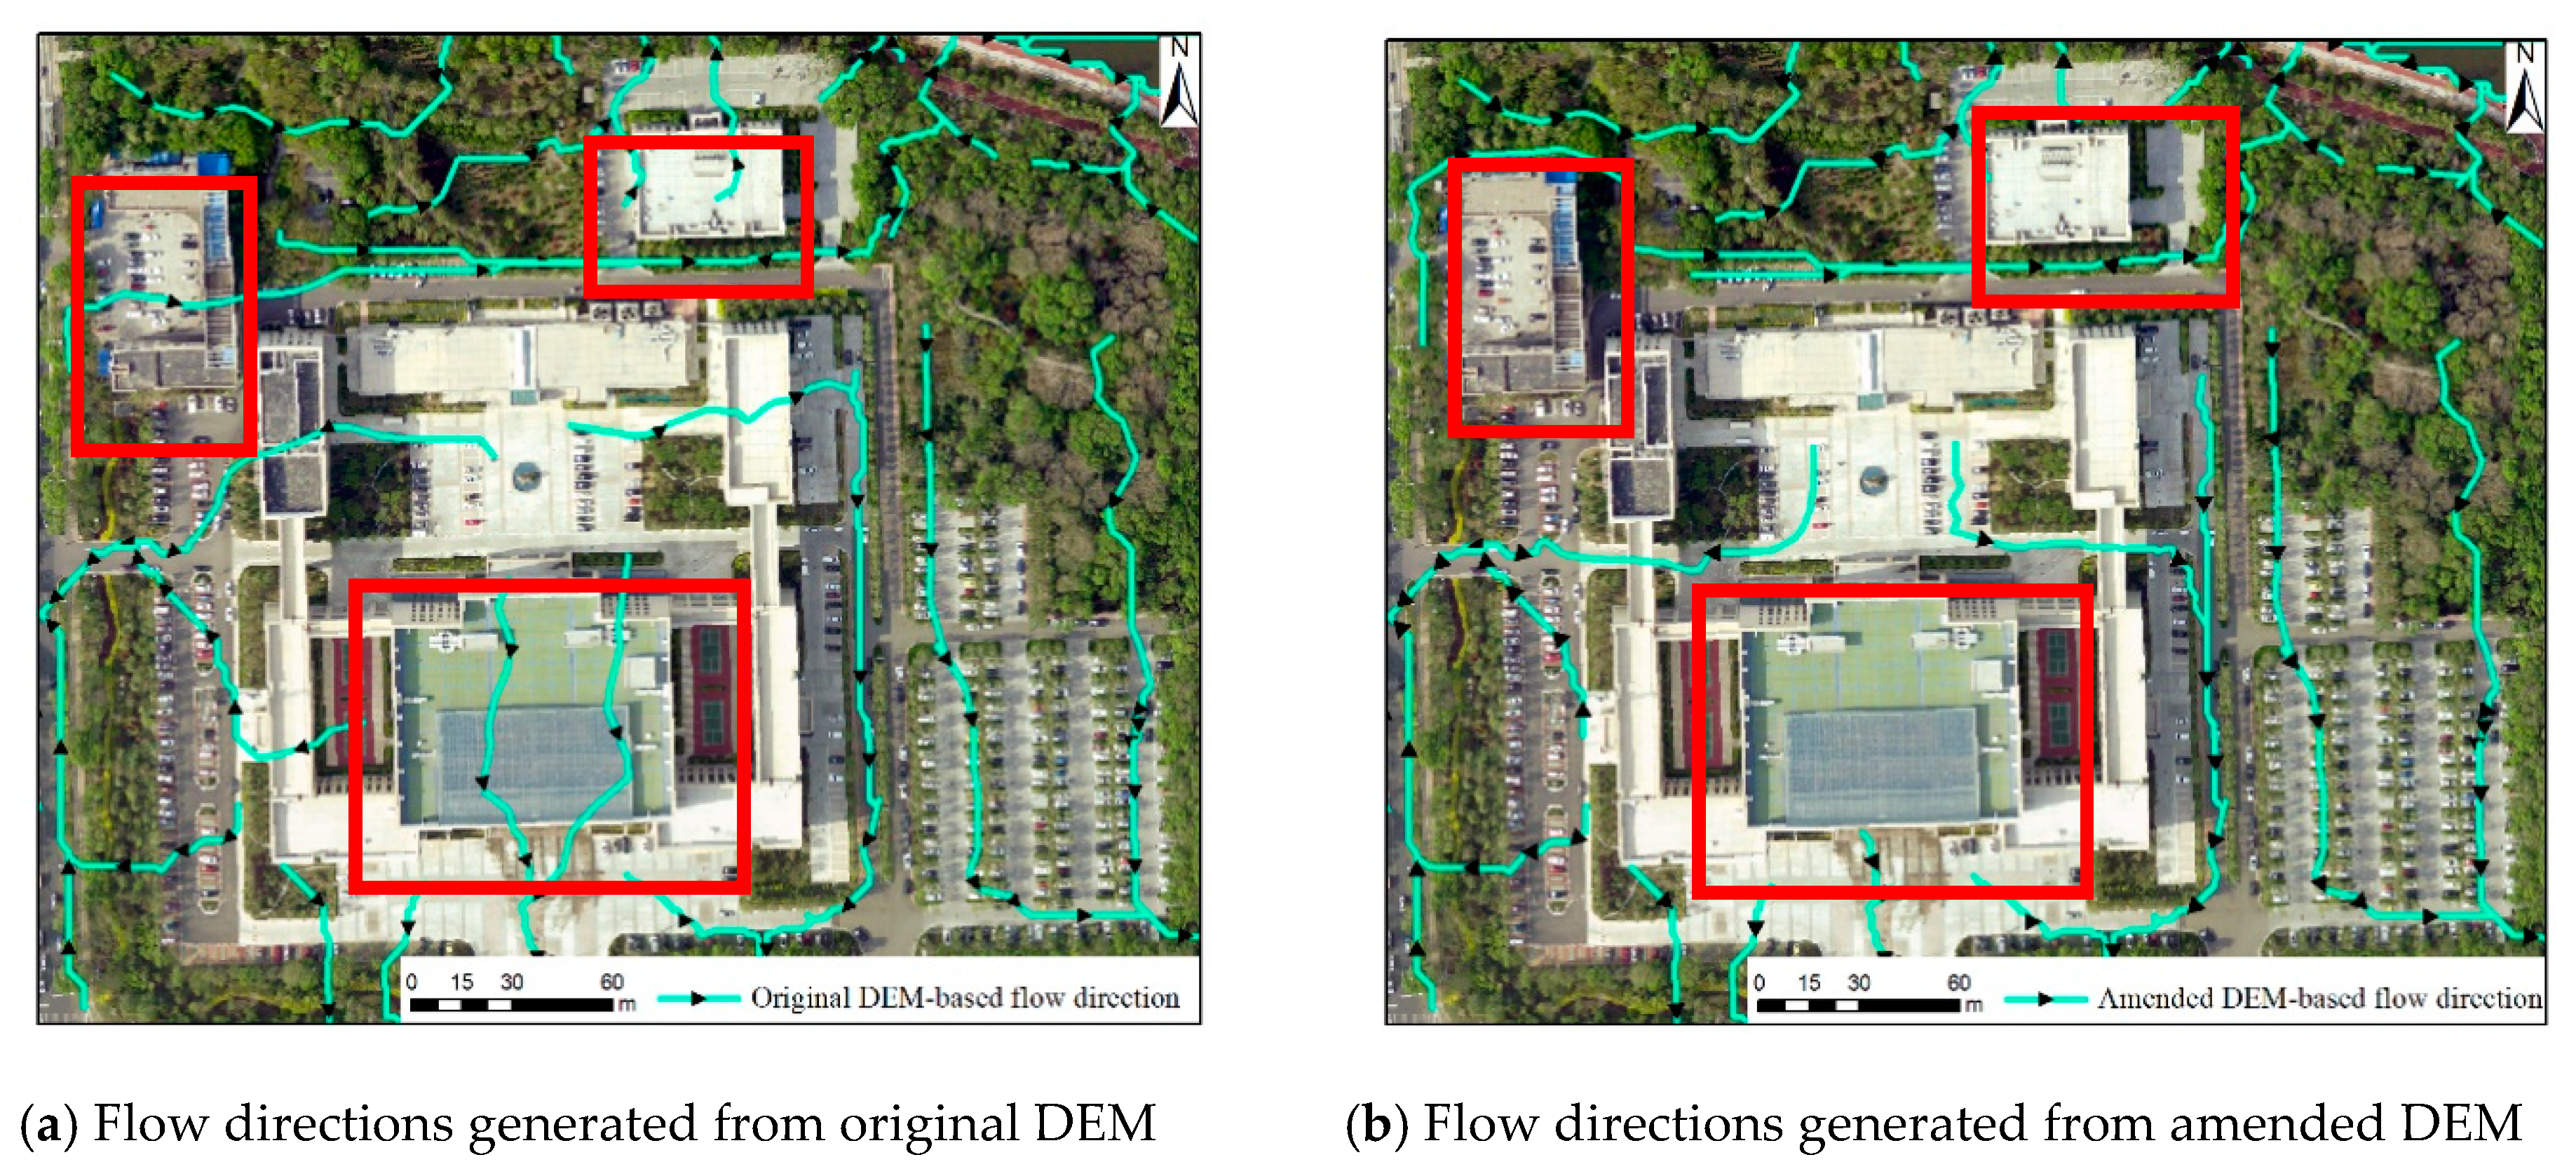
- Comparison between the flow directions based on the original DEM and amended DEM
- (2)
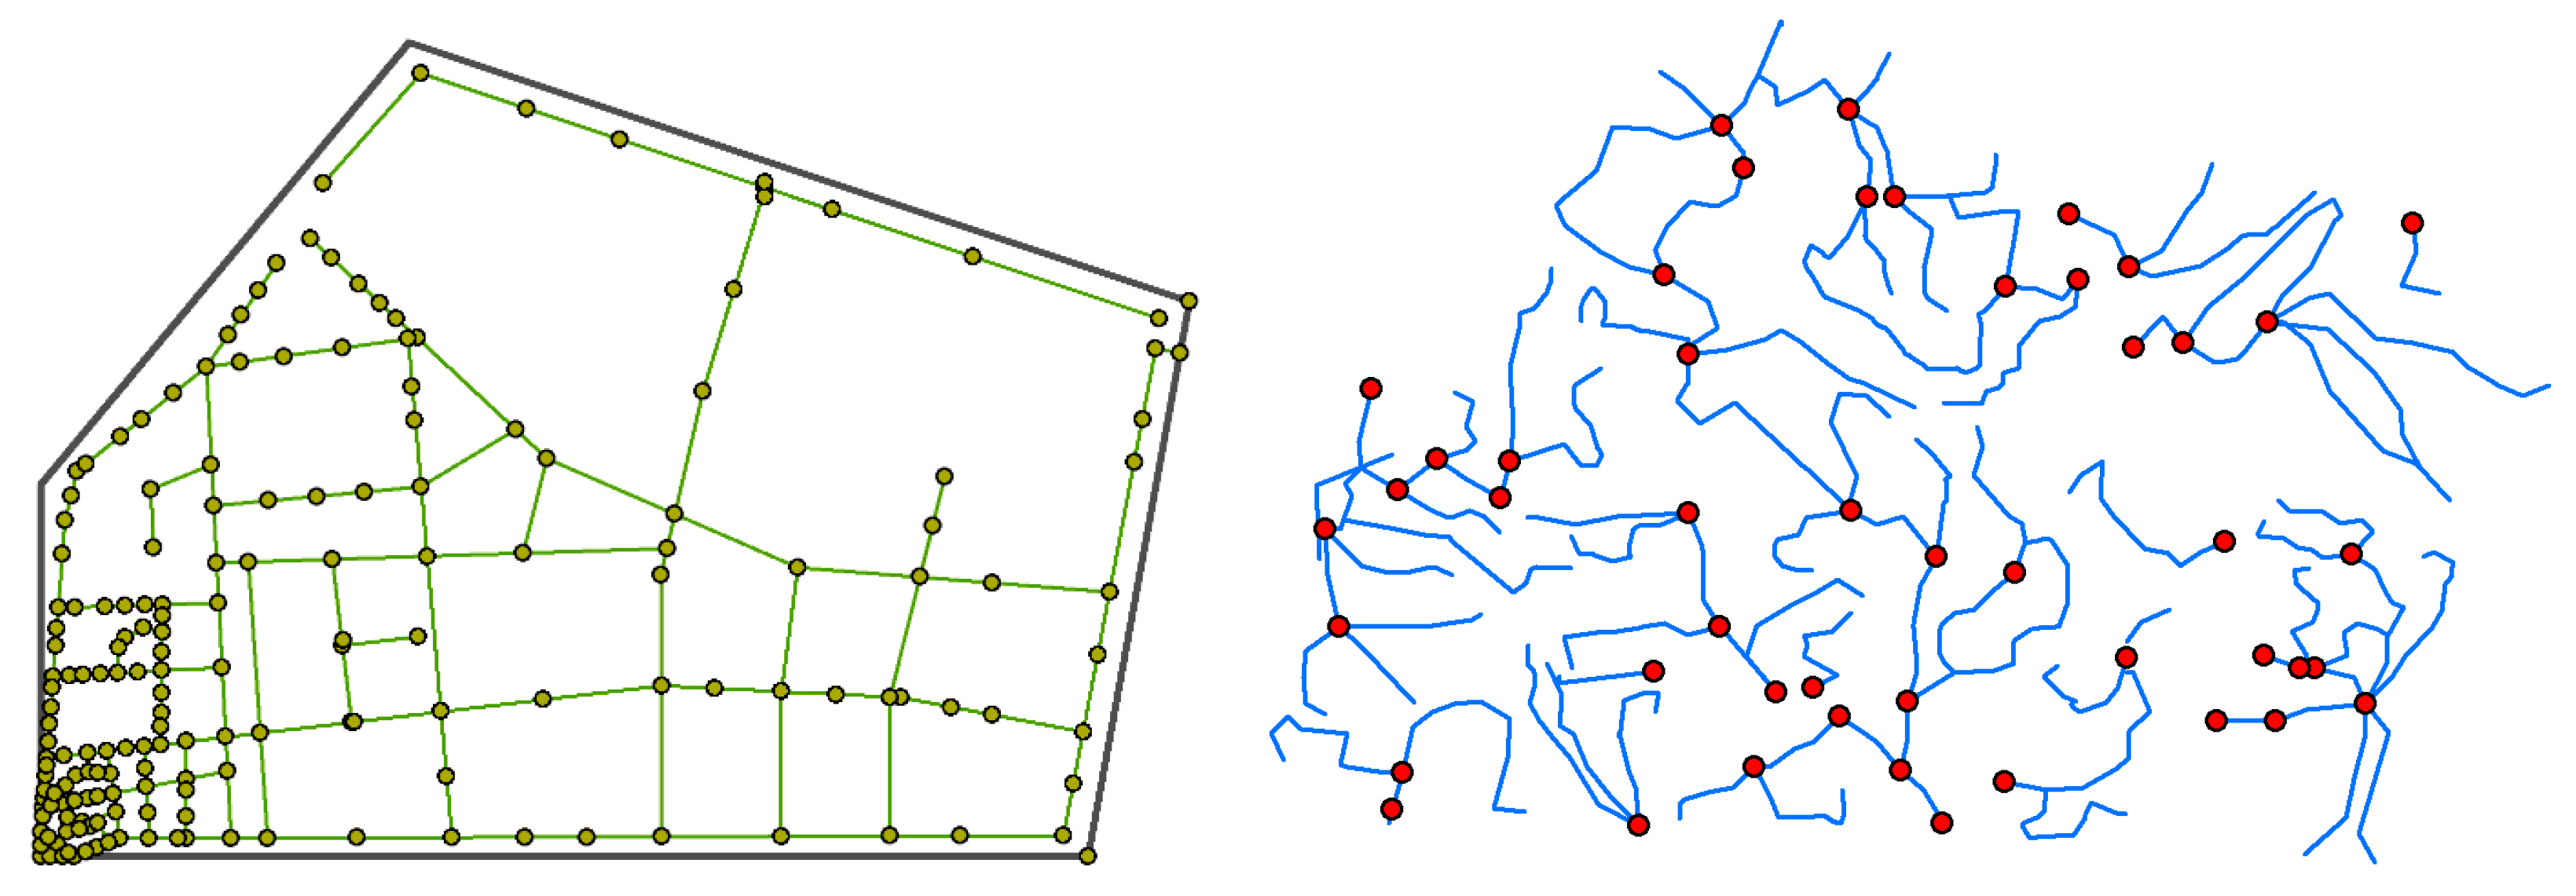
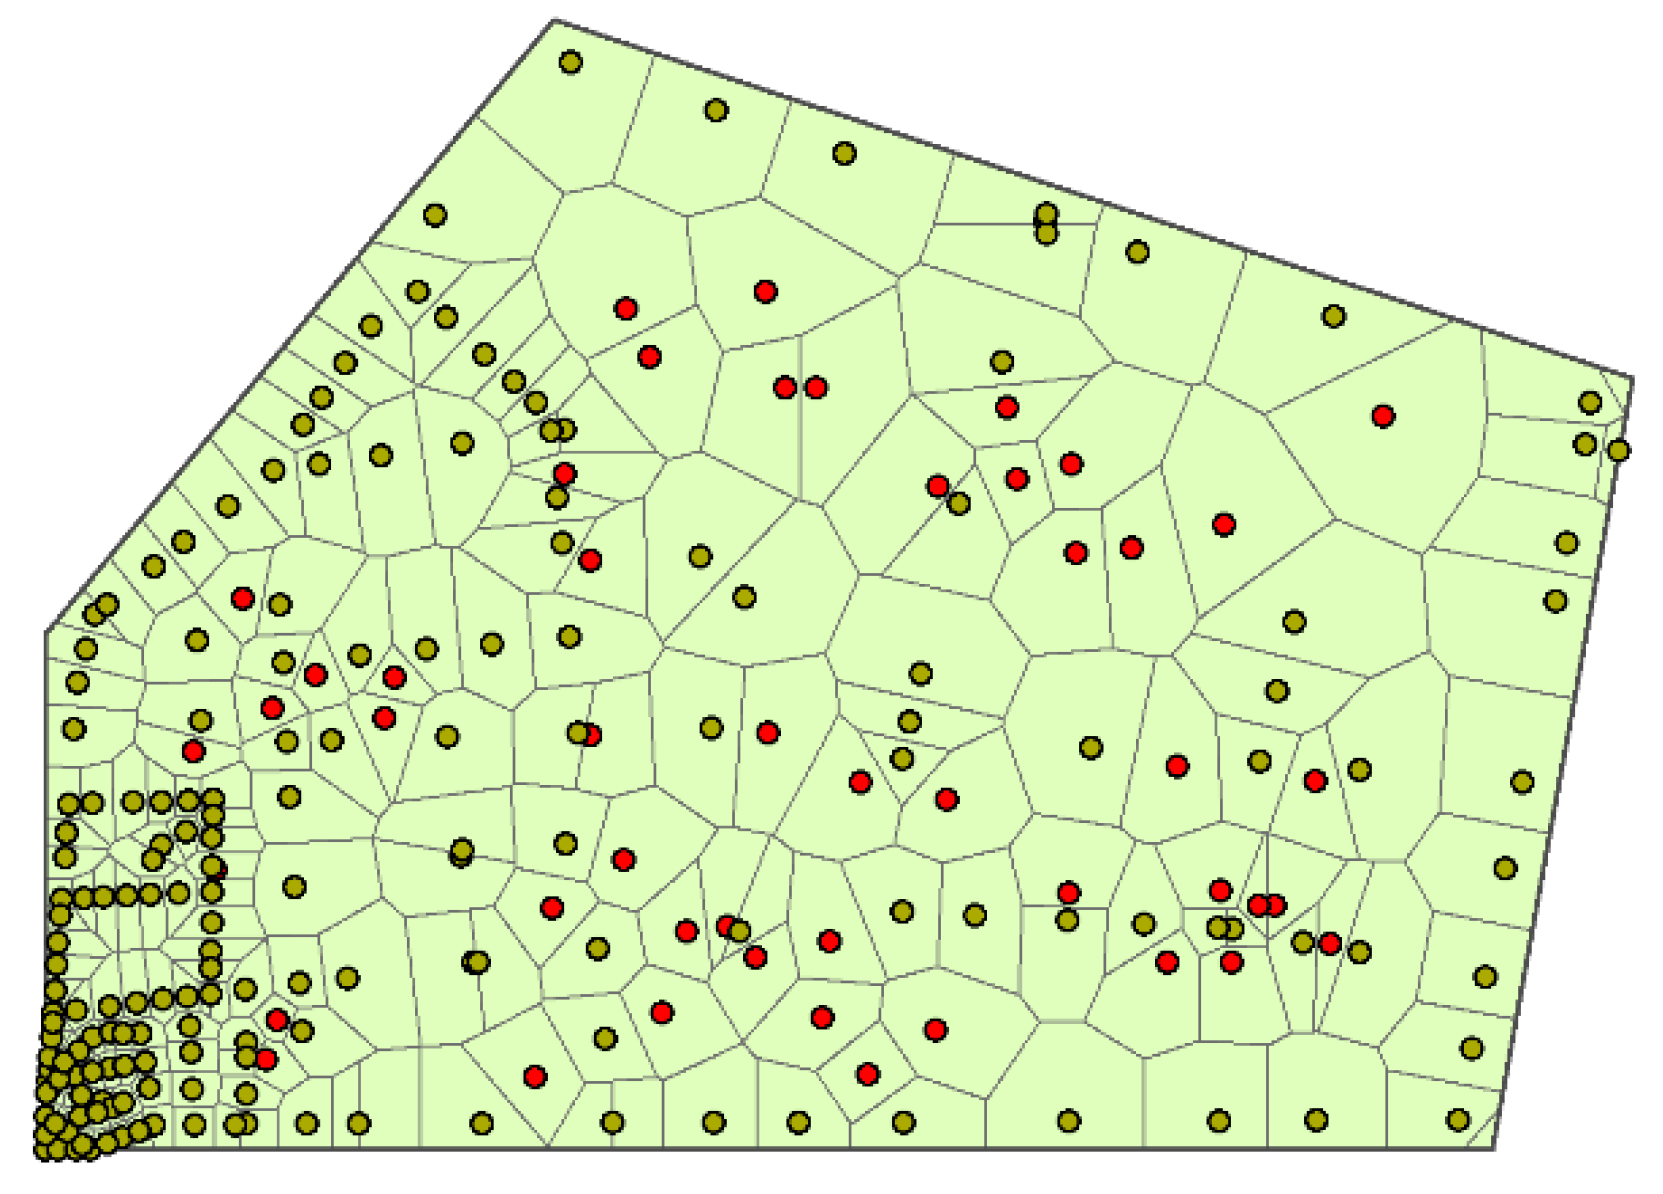
- Catchment division comparison based on the Voronoi method and the proposed method
4.2.2. Quantitative Analysis
5. Conclusions
Author Contributions
Funding
Conflicts of Interest
References
- Huong, H.; Pathirana, A. Urbanization and climate change impacts on future urban flooding in Can Tho city Vietnam. Hydrol. Earth Syst. Sci. 2013, 17, 379–394. [Google Scholar] [CrossRef] [Green Version]
- Tove, A.; Sabine, H.; Christoph, L.; Truffer, B.; Maurer, M. Emerging solutions to the water challenges of an urbanizing world. Science 2016, 352, 928–933. [Google Scholar]
- Zhao, G.; Xu, Z.; Pang, B.; Tu, T.; Xu, L.; Du, L. An enhanced inundation method for urban flood hazard mapping at the large catchment scale. J. Hydrol. 2019, 2, 8. [Google Scholar] [CrossRef]
- Akdogan, Z.; Guven, B. Assessing the sensitivity of SWMM to variations in hydrological and hydraulic parameters: A case study for the city of Istanbul. Glob NEST J. 2016, 18, 831–841. [Google Scholar]
- Chow, M.; Yusop, Z.; Toriman, M.E. Modelling runoff quantity and quality in tropical urban catchments using storm water management model. Int. J. Environ. Sci. Technol. 2012, 9, 737–748. [Google Scholar] [CrossRef] [Green Version]
- Lowe, S. Sanitary sewer design using EPA storm water management model (SWMM). Comput. Appl. Eng. Educ. 2010, 18, 203–212. [Google Scholar] [CrossRef]
- Costabile, P.; Costanzo, C.; De Bartolo, S.; Gangi, F.; Macchione, F.; Tomasicchio, G.R. Hydraulic Characterization of River Networks Based on Flow Patterns Simulated by 2-D Shallow Water Modeling: Scaling Properties, Multifractal Interpretation, and Perspectives for Channel Heads Detection. Water Resour. Res. 2019, 55, 7717–7752. [Google Scholar] [CrossRef]
- Cea, L.; Garrido, M.; Puertas, J. Experimental validation of two-dimensional depth-averaged models for forecasting rainfall-runoff from precipitation data in urban areas. J. Hydrol. Amst. 2010, 382, 88–102. [Google Scholar] [CrossRef]
- Hassan, R. Flood hydrograph prediction in a semiarid mountain catchment: The role of catchment subdivision. Flood Risk Manag. 2020, 13, e12568. [Google Scholar]
- Rulli, M. A physically based watershed partitioning method. Adv. Water Resour. 2010, 33, 1206–1215. [Google Scholar] [CrossRef]
- Guth, N.; Klingel, P. Demand allocation in water distribution network modelling—A GIS-based approach using Voronoi diagrams with constraints. In Application of Geographic Information Systems; Alam, B.M., Ed.; InTech: Rijeka, Yugoslavia, 2012. [Google Scholar]
- O’Callaghan, J.; Mark, D. The Extraction of Drainage Networks from Digital Elevation Data. Comput. Vis. Graph. Image Process. 1984, 28, 323–334. [Google Scholar] [CrossRef]
- Qin, C.; Ai, B.-B.; Zhu, A.-X.; Liu, J. An efficient method for applying a differential equation to deriving the spatial distribution of specific catchment area from gridded digital elevation models. Comput. Geosci. 2017, 100, 94–102. [Google Scholar] [CrossRef]
- Zhang, H.; Cheng, X.; Zhao, D.; Ma, H. Analyzing the contribution of high resolution water range in dividing catchment based on D8 algorithm. In Proceedings of the 2018 IEEE International Geoscience and Remote Sensing Symposium (IGARSS 2018), Valencia, Spain, 22–27 July 2018. [Google Scholar]
- Duke, G.; Kienzle, S.; Johnson, D.; Byrne, J. Improving overland flow routing by incorporating ancillary road data into Digital Elevation Models. J. Spat. Hydrol. 2009, 3, 1–27. [Google Scholar]
- Yu, W.; Chen, Y.; Chen, Z.; Xia, Z.; Zhou, Q. Service Area Delimitation of Fire Stations with Fire Risk Analysis: Implementation and Case Study. Int. J. Environ. Res. Public Health 2020, 17, 2030. [Google Scholar] [CrossRef] [Green Version]
- Shen, Z.; Zhang, Q. A GIS-based subcatchments division approach for SWMM. Open Civ. Eng. J. 2015, 9, 515–521. [Google Scholar]
- Huang, M.; Jin, S. A methodology for simple 2-D inundation analysis in urban area using SWMM and GIS. Nat. Hazards 2019, 97, 15–43. [Google Scholar] [CrossRef]
- Tero, J.; Lassi, W.; Maija, T.; Hickman, B.; Pulkkinen, S.; Krebs, G.; Moisseev, D.; Koivusalo, H.; Kokkonen, T. Applicability of open rainfall data to event-scale urban rainfall-runoff modelling. J. Hydrol. 2017, 547, 143–155. [Google Scholar]
- Luan, Q.; Fu, X.; Wang, H.; Liu, J.; Gao, X. SWMM-based rainfall-runoff simulations in large-scale urban area with no pipeline-flow observations: I: Key techniques for digitalizing urban area with complicated land-surface characteristics. Adv. Water Sci. 2019, 30, 653–660. [Google Scholar]
- Costa-Cabral, M.; Burges, S. Digital elevation model networks (DEMON): A model of flow over hillslopes for computation of contributing and dispersal areas. Water Resour. Res. 1994, 30, 1681–1692. [Google Scholar] [CrossRef]
- Orlandini, S.; Moretti, G. Determination of surface flow paths from gridded elevation data. Water Resour. Res. 2009, 45. [Google Scholar] [CrossRef] [Green Version]
- Pelletier, J. A robust, two-parameter method for the extraction of drainage networks from high-resolution digital elevation models (DEMs): Evaluation using synthetic and real-world DEMs. Water Resour. Res. 2013, 49, 75–89. [Google Scholar] [CrossRef]
- Sangireddy, H.; Stark, C.P.; Kladzyk, A.; Passalacqua, P. GeoNet: An open source software for the automatic and objective extraction of channel heads, channel network, and channel morphology from high resolution topography data. Environ. Model. Softw. 2016, 83, 58–73. [Google Scholar] [CrossRef] [Green Version]
- Li, J.; Zhang, M. Division method of catchments of plain river network based on Voronoi map. J. Zhejiang Agric Sci. 2012, 5, 761–763. [Google Scholar]
- Li, C.; Yin, Y.; Dai, Z.; Wu, W. Small-area patch-merging method accounting for both local constraints and the overall area balance. Trans. GIS 2020, 24, 1098–1118. [Google Scholar] [CrossRef]
- Zuo, J.; Cai, Y. An Automated Watershed Delineations Approach for Plain River Network Regions: A Case Study in Shanghai. Adv. Water Sci. 2011, 22, 337–343. [Google Scholar]
- Petroselli, A.; Fernandez, A. The flat area issue in DEMs and its consequences on the rainfall-runoff modeling. GIScience Remote Sens. 2012, 49, 711–734. [Google Scholar] [CrossRef]


| Method | Is There a Discharge Point for Each Catchment? | Consistent with the Real Land-Use Distribution? | Consistent with the Real Flow Directions? | Suitable for Large Areas? |
|---|---|---|---|---|
| Huang et al. [18] | Yes | No | Partially consistent | Not suitable (not able to partition without the manual selection of catch basins) |
| Our method | Yes | Yes | Consistent | Suitable (able to partition by simply setting a suitable threshold value for the area) |
Publisher’s Note: MDPI stays neutral with regard to jurisdictional claims in published maps and institutional affiliations. |
© 2020 by the authors. Licensee MDPI, Basel, Switzerland. This article is an open access article distributed under the terms and conditions of the Creative Commons Attribution (CC BY) license (http://creativecommons.org/licenses/by/4.0/).
Share and Cite
Li, C.; Fan, Z.; Wu, Z.; Dai, Z.; Liu, L.; Zhang, C. Methodology of Sub-Catchment Division Considering Land Uses and Flow Directions. ISPRS Int. J. Geo-Inf. 2020, 9, 634. https://0-doi-org.brum.beds.ac.uk/10.3390/ijgi9110634
Li C, Fan Z, Wu Z, Dai Z, Liu L, Zhang C. Methodology of Sub-Catchment Division Considering Land Uses and Flow Directions. ISPRS International Journal of Geo-Information. 2020; 9(11):634. https://0-doi-org.brum.beds.ac.uk/10.3390/ijgi9110634
Chicago/Turabian StyleLi, Chengming, Zixian Fan, Zheng Wu, Zhaoxin Dai, Li Liu, and Chengcheng Zhang. 2020. "Methodology of Sub-Catchment Division Considering Land Uses and Flow Directions" ISPRS International Journal of Geo-Information 9, no. 11: 634. https://0-doi-org.brum.beds.ac.uk/10.3390/ijgi9110634