1. Introduction
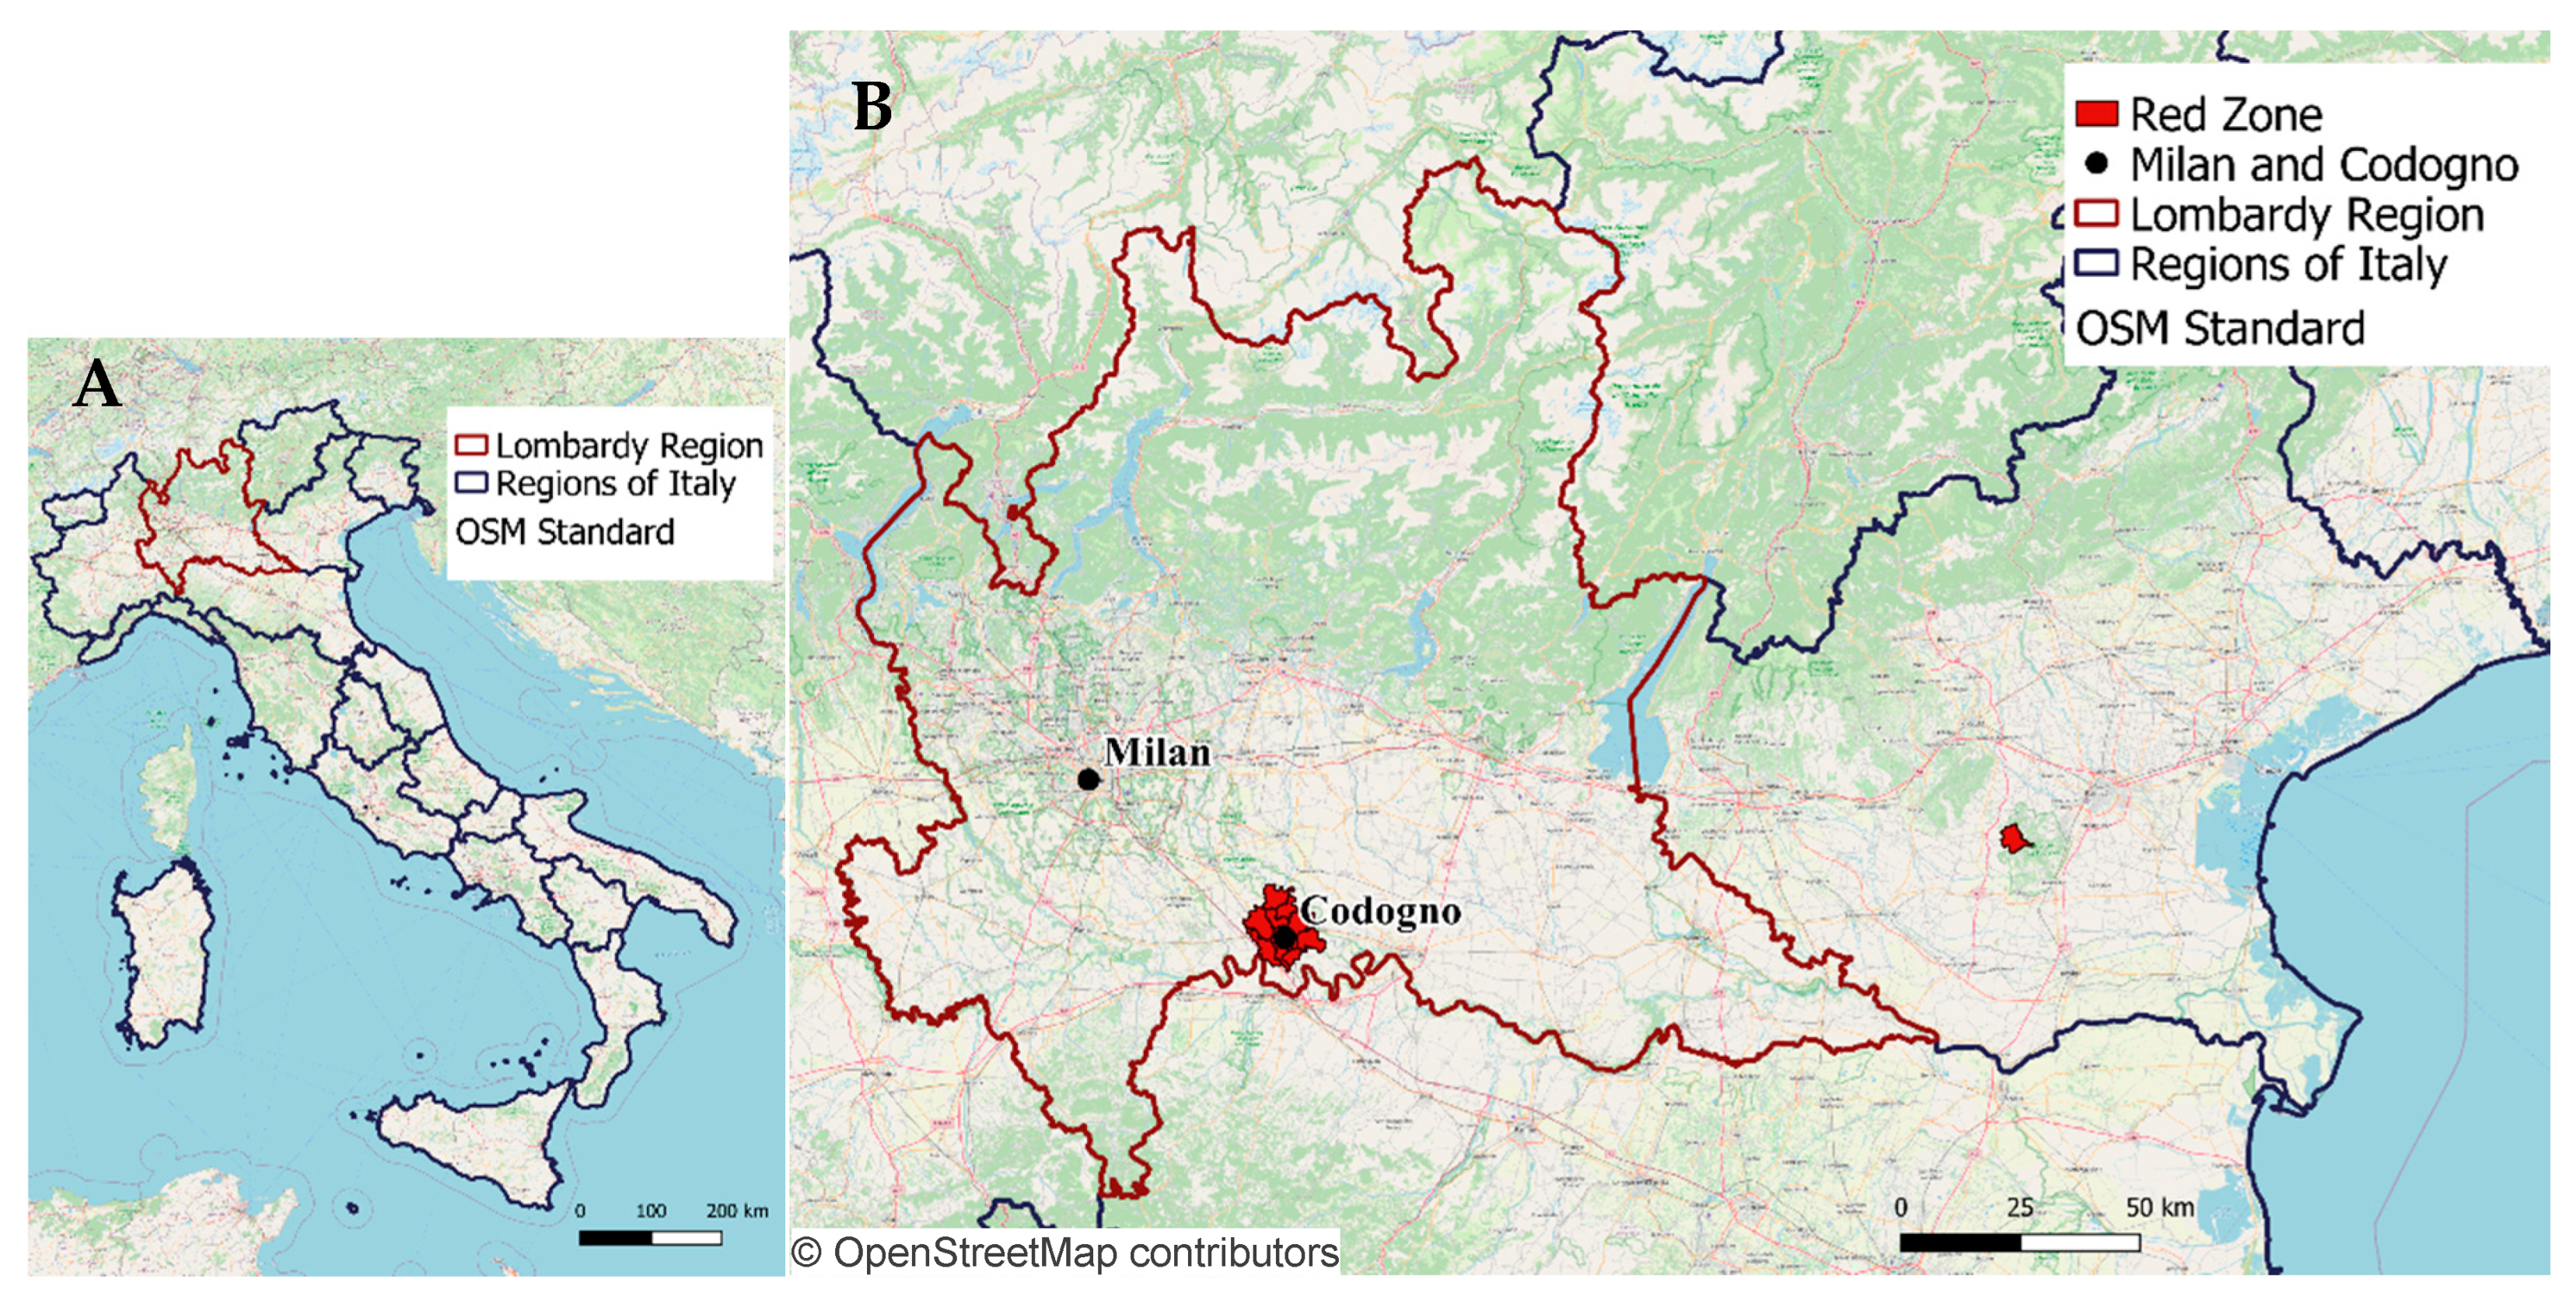
The epidemic of COronaVIrus Disease 2019 (COVID-19), generated by the diffusion of the severe acute respiratory syndrome coronavirus 2 (SARS-CoV-2), officially started in Italy on 21 February 2020, when the first case was diagnosed in the hospital of Codogno (Lodi province), a small city in the south of Lombardy region (
Figure 1A), the most populated area of Italy with 10.06 million residents (16.67% of the total 60.36 million people living in Italy).
Immediately after, screening protocols were rearranged to understand the contagion line, tracing back all contacts for people resulting positive to tests. When, after few days, the recorded cases exceeded tracing possibilities [
1], only people showing compatible symptoms with COVID-19 were tested (according to limited local capabilities).
A second hotspot was identified in Vo’ Euganeo (Padova province, Veneto), and containment measures were adopted on 24 February 2020 (with 229 confirmed cases of infection) by isolating as “red zones” the two hotspots identified so far, including more than 50,000 residents in 12 municipalities (
Figure 1B). These measures where only effective within the interested areas; as a matter of fact, the diffusion of the epidemic outside them was already exponential and affecting the whole country, thus leading to the government’s decision to secure an extended red zone including, at first on 9 March 2020, the whole Lombardy region and 14 other provinces, which was quickly extended to the whole national territory on 11 March 2020.
As of today (25 September 2020), the COVID-19 pandemic has affected 187 countries for a total of more than 32.2 million confirmed cases [
2] and is growing day-by-day. The worldwide scientific community is undertaking unprecedented efforts in an attempt to mitigate the effects of the pandemic, especially focusing on the application of edging technologies: several studies identified artificial intelligence (AI), machine learning (ML), and big data analytics as key assets in extracting information from available data useful to fight the pandemic [
3,
4,
5,
6,
7,
8,
9]. In particular, Bragazzi et al. [
4] identified four different fields of application on three time-horizons: rapid identification of outbreaks and diagnosis of cases (short-term), identification of therapeutic options (medium-term), and development of resilient smart-cities (long-term). On the same page, Ting et al. [
8] defined monitoring, surveillance, detection, prevention, and mitigation of indirect effects as goals for the application of new technologies such as big data, AI, Internet of Things (IoT), and blockchain. These authors also focused on the long-term impact of this unprecedented situation, stating that a successful application for these technologies in public health, forced by the emergency conditions, represents a unique opportunity to trigger a paradigm shift capable of conditioning the whole future of policies in public health and medicine.
With specific reference to data collection and processing, real-time data visualization, enabled by computational techniques, is a powerful means to spread information [
4], but even more important goals can be reached in the field of prevention using epidemiological data to raise awareness and guide interventions [
3,
10]. In particular, the concept of “surveillance” has been re-addressed to face this new scenario, thus pointing out the possibilities of new approaches such as digital and event-based surveillance [
11]. The vital contribution of “syndromic surveillance” in controlling and mitigating the effects of the epidemic have been recently pointed out [
12] together with critical issues relevant to the difficulties in obtaining syndromic surveillance intelligence at the local level, as already evidenced with reference to the Ebola outbreak [
13].
In this view, the focus on the spatial analysis, in relation to the COVID-19 pandemic, was recently explored in a systematic review [
14], in which five related topics were identified: (1) spatiotemporal analysis, in which a descriptive and/or predictive modeling of the evolution of the pandemic within a certain territory (usually national and provincial level) is explored using official data on positive cases, often also considering people mobility, with examples relevant to China [
15] South Korea [
16], the USA [
17], and Italy [
18]; (2) health and social geography, in which the relationship between epidemic spreading (based on confirmed cases) and healthcare resources [
19], nurses [
20], or surgeons [
21] is explored together with the correlation between confirmed cases and demographic and/or socio-economic characteristics [
22,
23]; (3) environmental variables, in which the correlation between confirmed cases and environmental factors, mainly climatic variables [
24], such as humidity and temperature [
25], is explored; (4) data mining, in which the analysis of additional data sources, such as mobility [
26,
27] and flights [
28], to corroborate spatial analysis is performed; (5) web-based mapping, in which web services implementation for results visualization are presented.
From this review, the potentialities of geographic information systems (GISs) as a set of tools for capturing, storing, checking, manipulating, analyzing, and displaying spatially georeferenced data to handle the geospatial component of the pandemic analysis also at the local level was highlighted, which is in line with other studies [
29,
30].
While the literature relevant to the spatiotemporal analysis of COVID-19 is mostly based on data from official diagnoses, several studies identified such data as potentially unreliable for modelling and analysis [
9,
11,
31,
32], in particular during the first phases of the epidemic when they were mostly needed [
10], leading to evaluate the possibility to exploit crowdsourced data, such as news media and social networks [
10,
12,
14].
With specific reference to Italy, this scenario poses a strong limitation on the validity of any retrospective analysis concerning the spatiotemporal evolution of the epidemic based on positive cases, since a whole month of official data was probably missing during the early spreading of the disease, when possible cases of COVID-19 were probably diagnosed as other common respiratory diseases due to seasonal flu. Moreover, even after the first cases were diagnosed and the testing policy rearranged, complete and reliable data could not be guaranteed due to quick saturation of the diagnosis capabilities, with the swab test for COVID-19 performed only in the most severe patients [
33,
34]. This resulted in a higher cases fatality rate (CFR, number of casualties/total number of diagnosed patients, set at 11.31% in September 2020) compared to the estimated infection fatality rate (IFR, number of casualties/total number of infected patients, considered to be between 0.5% and 1% [
35]).
Moreover, CFR values were consistently changing among Italian regions as a consequence of the different regional testing policies and diagnostic capabilities: for example, on 4 May 2020 (date of the first reduction of lockdown measures), CFR was 18.3% in Lombardy (with 14,294 casualties and 78,105 confirmed cases) but only 8.3% in the adjacent region of Veneto (1528 casualties and 18,373 confirmed cases).
This issue is also a possible explanation for the failure of the early containment measures: a genomic study conducted on the virus led to the hypothesis that the epidemic was already spreading weeks before the first case was diagnosed, between the second half of January and early February [
36], as inferred by assessing that the strain of the virus affecting Italy could be related to an earlier identified (and apparently contained) cluster in Germany. Another recent study conducted by the Italian National Institute of Health (ISS, Istituto Superiore di Sanità) revealed that traces of SARS-CoV-2 were present in water samples starting from December 2019 [
37]. As Italian screening protocols before 21 February 2020 suggested testing only patients with COVID-19-compatible symptoms and who travelled to China (or have been in direct contact with people who travelled to China), the hypothesis that the official start of the outbreak was postponed in respect to the real one appears likely to be realistic, and possibly explains the failure of the containment measures established with the first “red zones” on 24 February 2020.
In this context, we hypothesized that an unbiased and indirect representation of the spreading of COVID-19 (at least in the first phases of the epidemic diffusion) in a specific territory could be inferred by the analysis of georeferenced calls performed by citizens to 112, the unique emergency number relevant to respiratory problems, or by the following emergency medical services (EMS) interventions. The advantage of this approach, if proved solid, is that it does not need additional testing operations and it is strictly connected to the empowerment of the citizens that, based on their symptoms, call for medical assistance. In addition, it could prove useful for early identification of second-wave epidemics or areas with higher risk of contagion in order to suggest additional lock-down policies.
Accordingly, the aim of this study was to test this hypothesis by reconstructing a spatiotemporal evolution of COVID-19 in the specific territory of Lombardy region in order to identify the beginning of anomalous trends in emergency calls and EMS ambulances dispatches relevant to respiratory issues and thus infer the actual date of the beginning of the pandemic. This approach was performed applying geomatics methodologies, taking advantage of GIS, which provided all the required capabilities to handle georeferenced information, and to generate visual representations through mapping for an immediate fruition of the obtained results.
The proposed analysis was a composite process, and many methodological decisions were based upon the previous results; the proposed final framework was obtained after several steps of implementation and retroactive correction. Therefore, in order to offer a smoother and clearer reading, this paper will be composed of a main section collecting both the methods and the results (
Section 2), subdivided according to the working blocks of the proposed framework.
2. Methods and Results
2.1. Data Sources
All the relevant contextualizing information, such as the administrative borders and the demographics of the resident population, were publicly available as open data by the Italian National Institute of Statistics (ISTAT, Istituto Nazionale di Statistica,
https://www.istat.it/it/), updated on 1 January 2019. The georeferenced database of calls performed by citizens to the unique emergency number 112 and that of EMS ambulance dispatches on the Lombardy territory from 1 January to 23 March 2020 was provided after anonymization by AREU (Azienda Regionale Emergenza/Urgenza), which is the EMS provider in Lombardy and the manager of the calls to the unique emergency number 112. For each record in the emergency calls database, the date and time, geographic coordinates, and triage classification were reported (the database was provided already filtered for respiratory issues). For each record in the ambulance dispatches database, the following information was available: date and time (of first arrival, of eventual arrival of means for advanced life support, of eventual arrival to hospital), gender and age of the patient, place (category) and coordinates of intervention, intervention outcome (transport to hospital or not), and hospital where the patient was transported. Data about COVID-19-related casualties and officially diagnosed cases were made available by the Civil Protection (Protezione Civile) as open data through a dedicated GitHub repository (
https://github.com/pcm-dpc/COVID-19).
For all the following procedures (
Section 2.2,
Section 2.3,
Section 2.4 and
Section 2.5), the processing and management of georeferenced data, and the generation of maps, was performed using QGIS (
https://www.qgis.org/it/site/), an open source GIS developed by the OSGeo foundation (Beaverton, OR, USA—
https://www.osgeo.org/), whereas all the database pre-processing, the statistical analysis and the signal processing algorithms were implemented as custom software in MATLAB (MathWorks, Natick, MA, USA—
https://it.mathworks.com/products/matlab.html) under academic licensing.
2.2. Database Pre-Processing
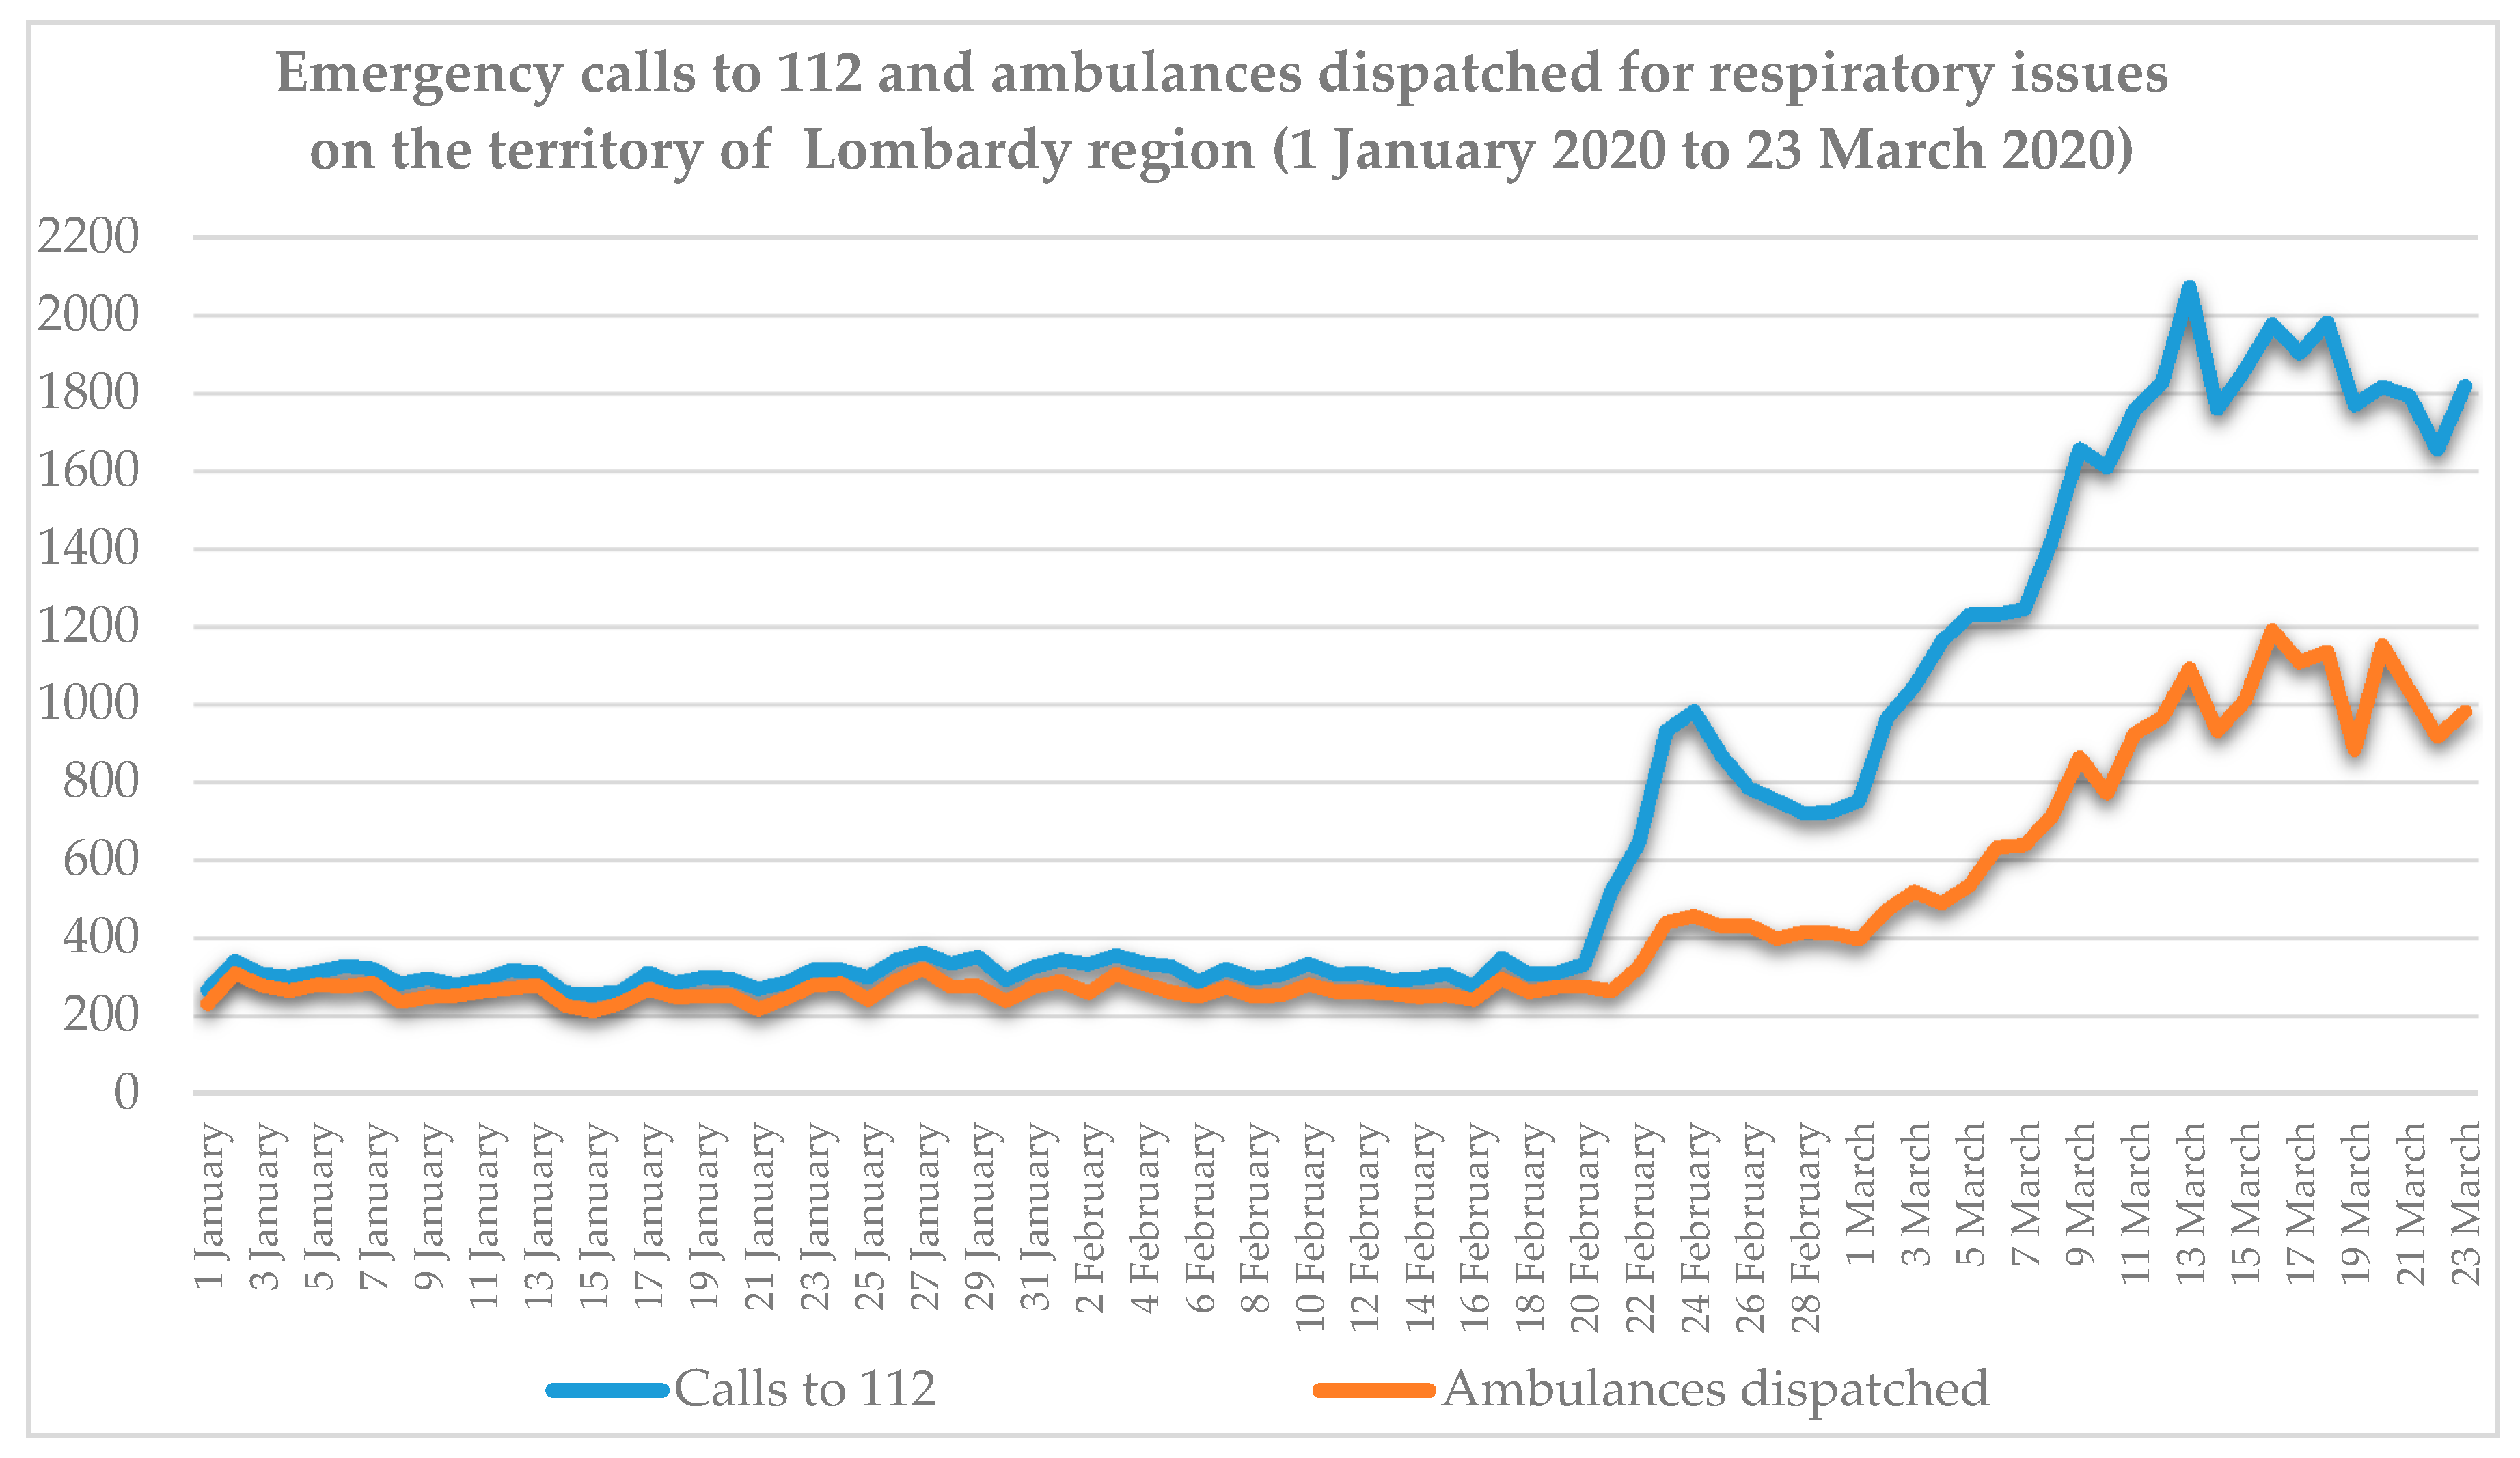
The AREU database of ambulance dispatches on the territory of Lombardy included 205,647 records from 1 January to 23 March 2020, of which 36,408 (17.7%) were labelled as related to respiratory issues by a specific field relevant to medical triage. The database of emergency calls was provided already filtered for respiratory and infective issues and included a total of 59,035 records for respiratory problems in the same period. It was decided to consider respiratory issues only in order to better model the scenario preceding the first COVID-19 diagnosis, as in that period its symptomatology was classified as part of the respiratory issues category. Considering daily data on the whole Lombardy, as reported in
Figure 2, two main considerations can be drawn:
1. The increase in daily events over the baseline period, both regarding emergency calls and ambulances dispatches, is evident from 21 February 2020 until the middle of March, when a plateau value was reached.
2. Starting from 21 February 2020, day of the first official diagnosis and consequent press release, a first phase of growth can be observed in both data series, reaching a peak around 24 February 2020, when the first localized lockdown was established, and decreasing in the next days. This peak could be interpreted as (1) an artifact due to the fact that, in those days, following the news of the first case in Italy, citizens called the emergency number more frequently in case of mild conditions that would not usually result in an emergency call or even just to inquiry information, as reflected by the less sharp peak of the ambulances dispatches curve in those days; or (2) as an effective sign of the beginning of the diffusion of the disease.
Ambulances dispatches and emergency calls relevant to respiratory issues were mapped on the 1506 municipalities of the Lombardy region on a daily basis. For ambulances dispatches, a subdivision according to the patient gender and age ranges (0–40, 41–50, 51–60, 61–65, 66–70, 71–75, 76–80, 81–85, 86–90, 90+) was performed. Age and gender distribution of patients with respiratory issues treated by ambulance dispatches changed significantly over time, as assessed by Wilcoxon’s signed-rank test (
p < 0.05) for all the pairs of weeks available (always in couples) considering the percentage of male and female patients divided by age range (complete results are available in
Appendix A). While during January the % of the weekly treated patients between 65 and 74 years old was in the range 11–13.5%, in the last analyzed week (16 March to 22 March 2020) this percentage raised to 21.77%. On the contrary, the share of patients over 85 years old fell from 29–33% in January to 10.54% at the end of March. These proportions, apparently in contrast with the hypothesis that COVID-19 more frequently generates severe symptoms in elderly people, were due to the more consistent increase in absolute numbers of patients in the range 65–74 years old (showing an anomalous number of respiratory issues in otherwise healthy people), while the absolute number of elderly people requiring assistance from an ambulance did not increase so consistently. Concerning patients’ gender, in January 44–46.5% of the total were males, while their share rose to 61.1% from 16 March to 22 March 2020; this difference was mostly evident in the age ranges from 50 to 64 and from 65 to 74 years old. Full results are reported in
Appendix B. These differences led us to hypothesize that introducing a weighting coefficient for the ambulance dispatches on the base of age and gender of the treated patients could add informative content and enhance the identification of the COVID-19 related phenomenology.
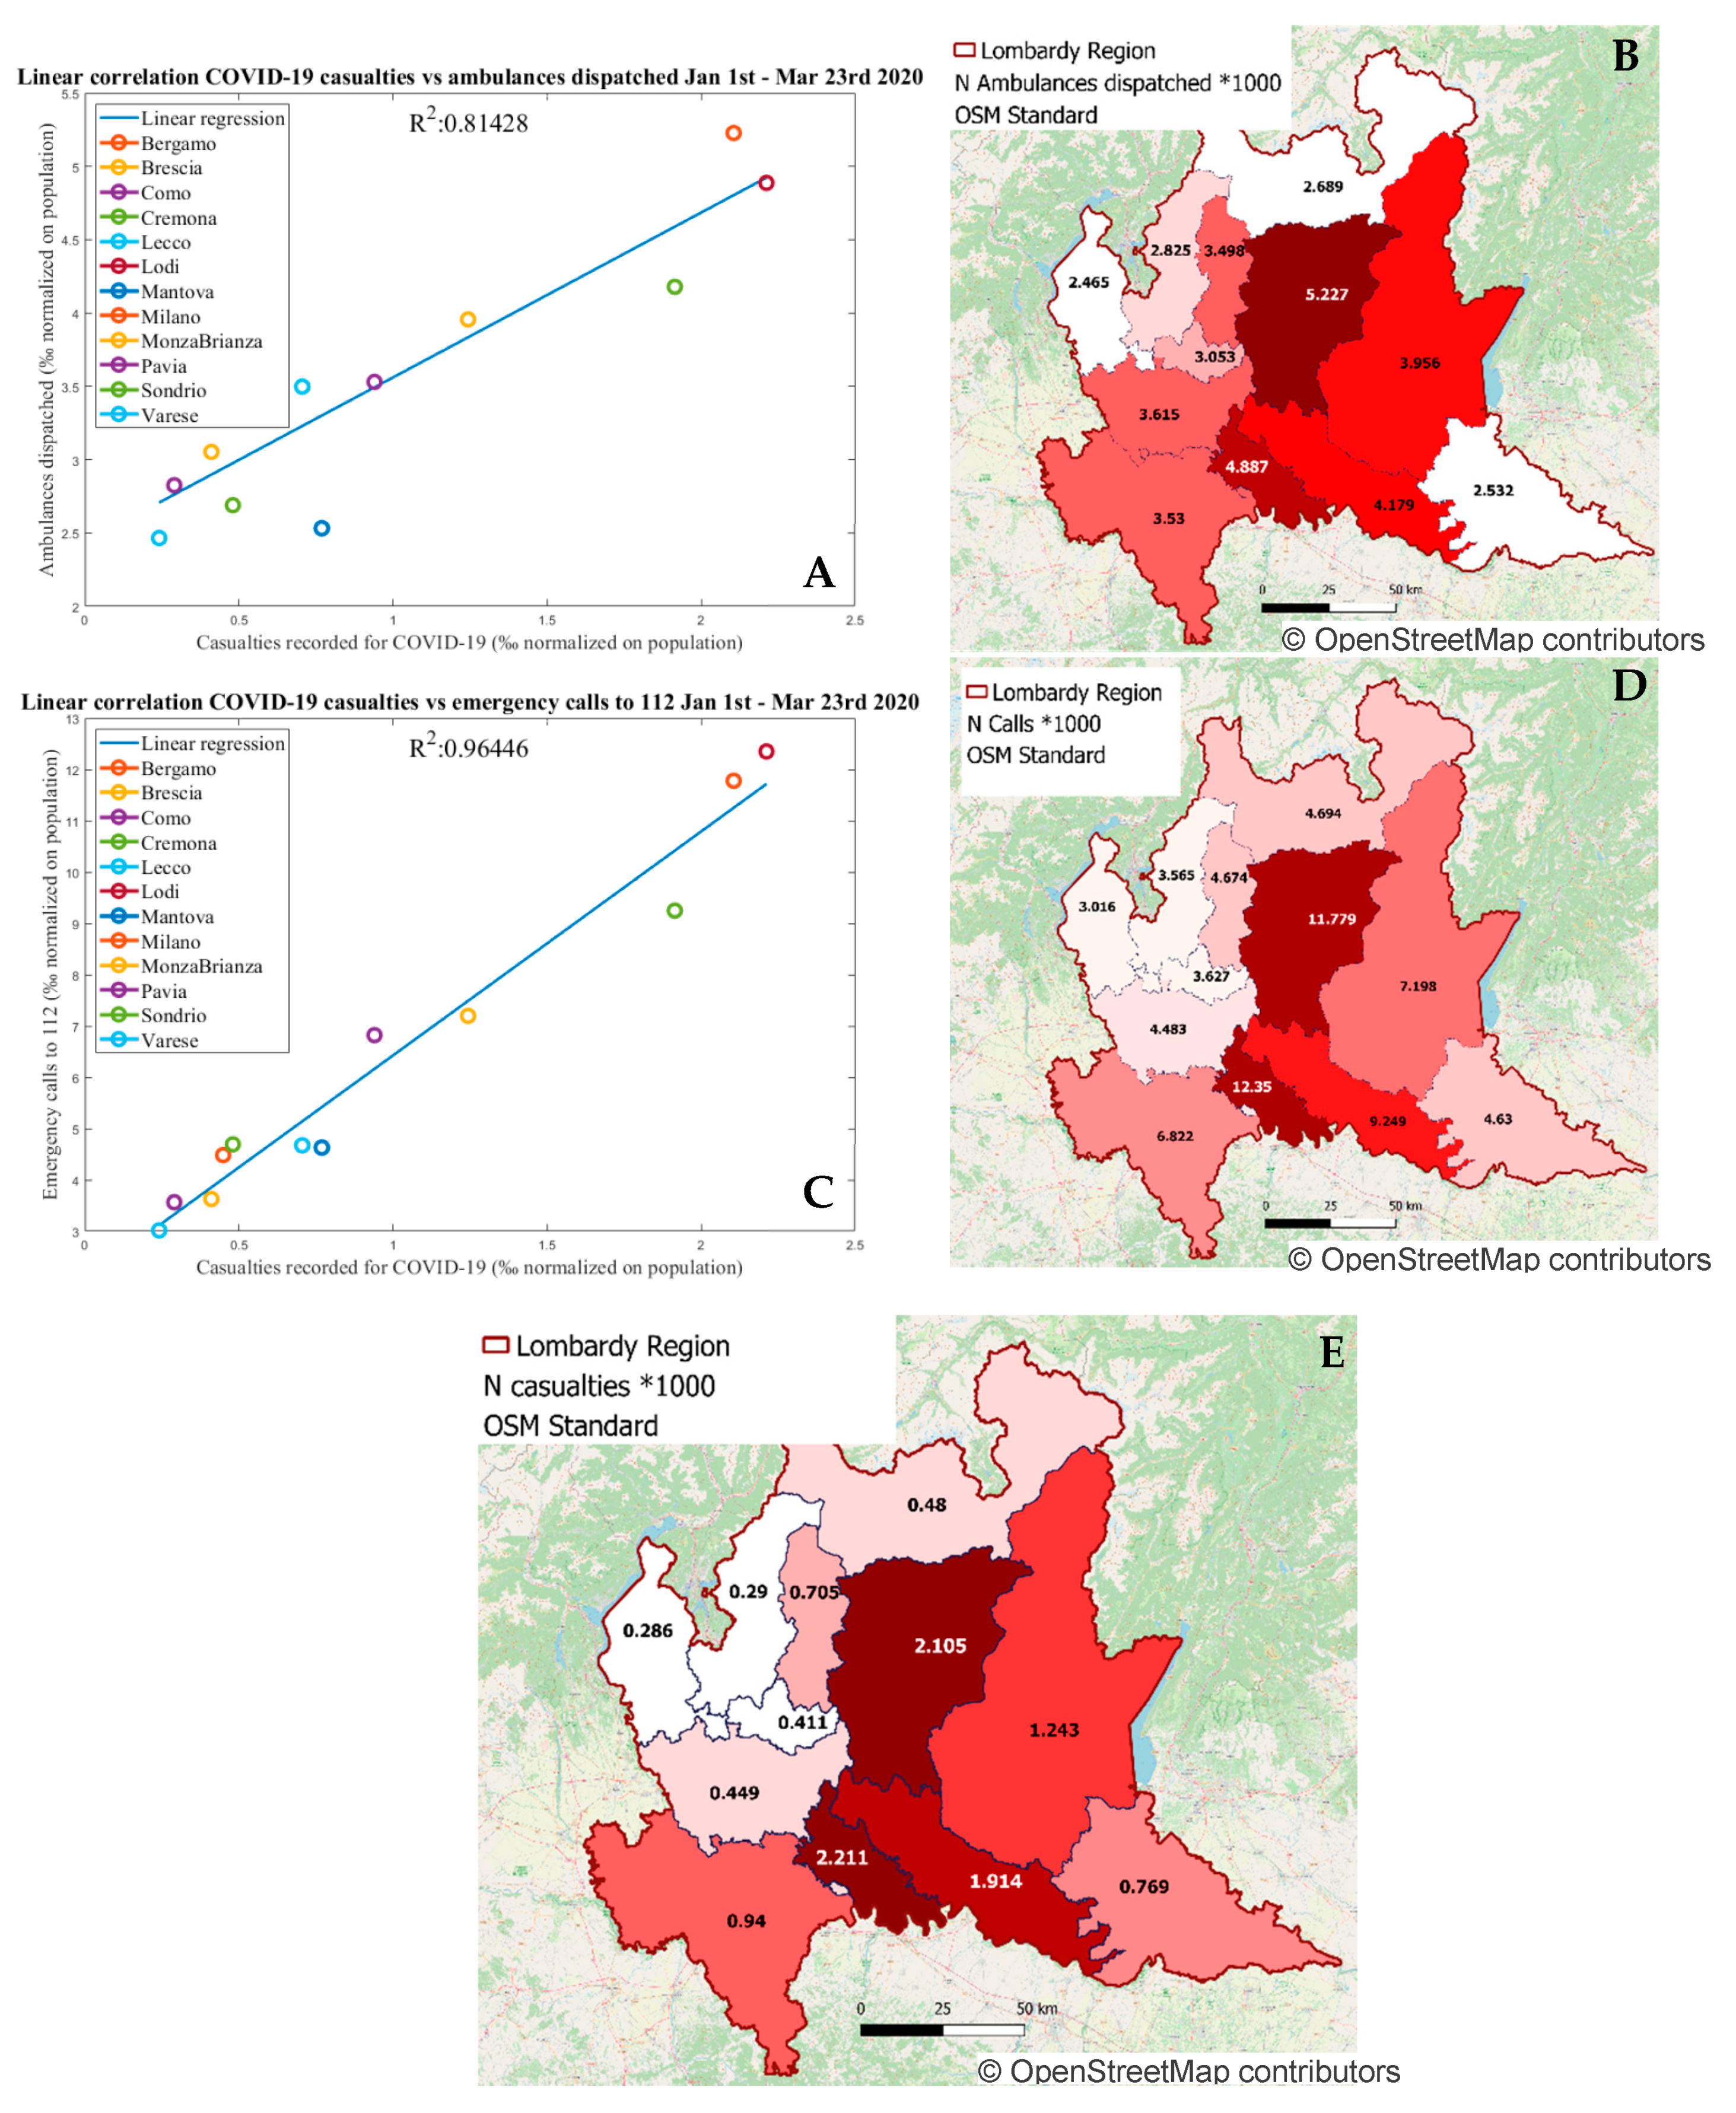
To corroborate the hypothesis that the emergency calls to 112 and the dispatching of ambulances could be considered as representative descriptive indexes of the epidemic expansion in its early phases, the linear regression between each of these two measurements, at the level of the 12 provinces in which Lombardy is sub-divided, and the number of casualties officially reported as being due to COVID-19 (considered less affected by diagnosis-related bias when compared to total cases), all normalized by the number of residents for each province, was computed. The COVID-19 related casualties aggregated at provincial level were made available by ISTAT as cumulative number in the period 1 January to 30 March 2020.
Figure 3 shows the computed linear regressions, resulting in a higher correlation (R
2 = 0.96) for emergency calls in respect to R
2 = 0.81 for ambulances dispatches.
2.3. Territory Subdivision
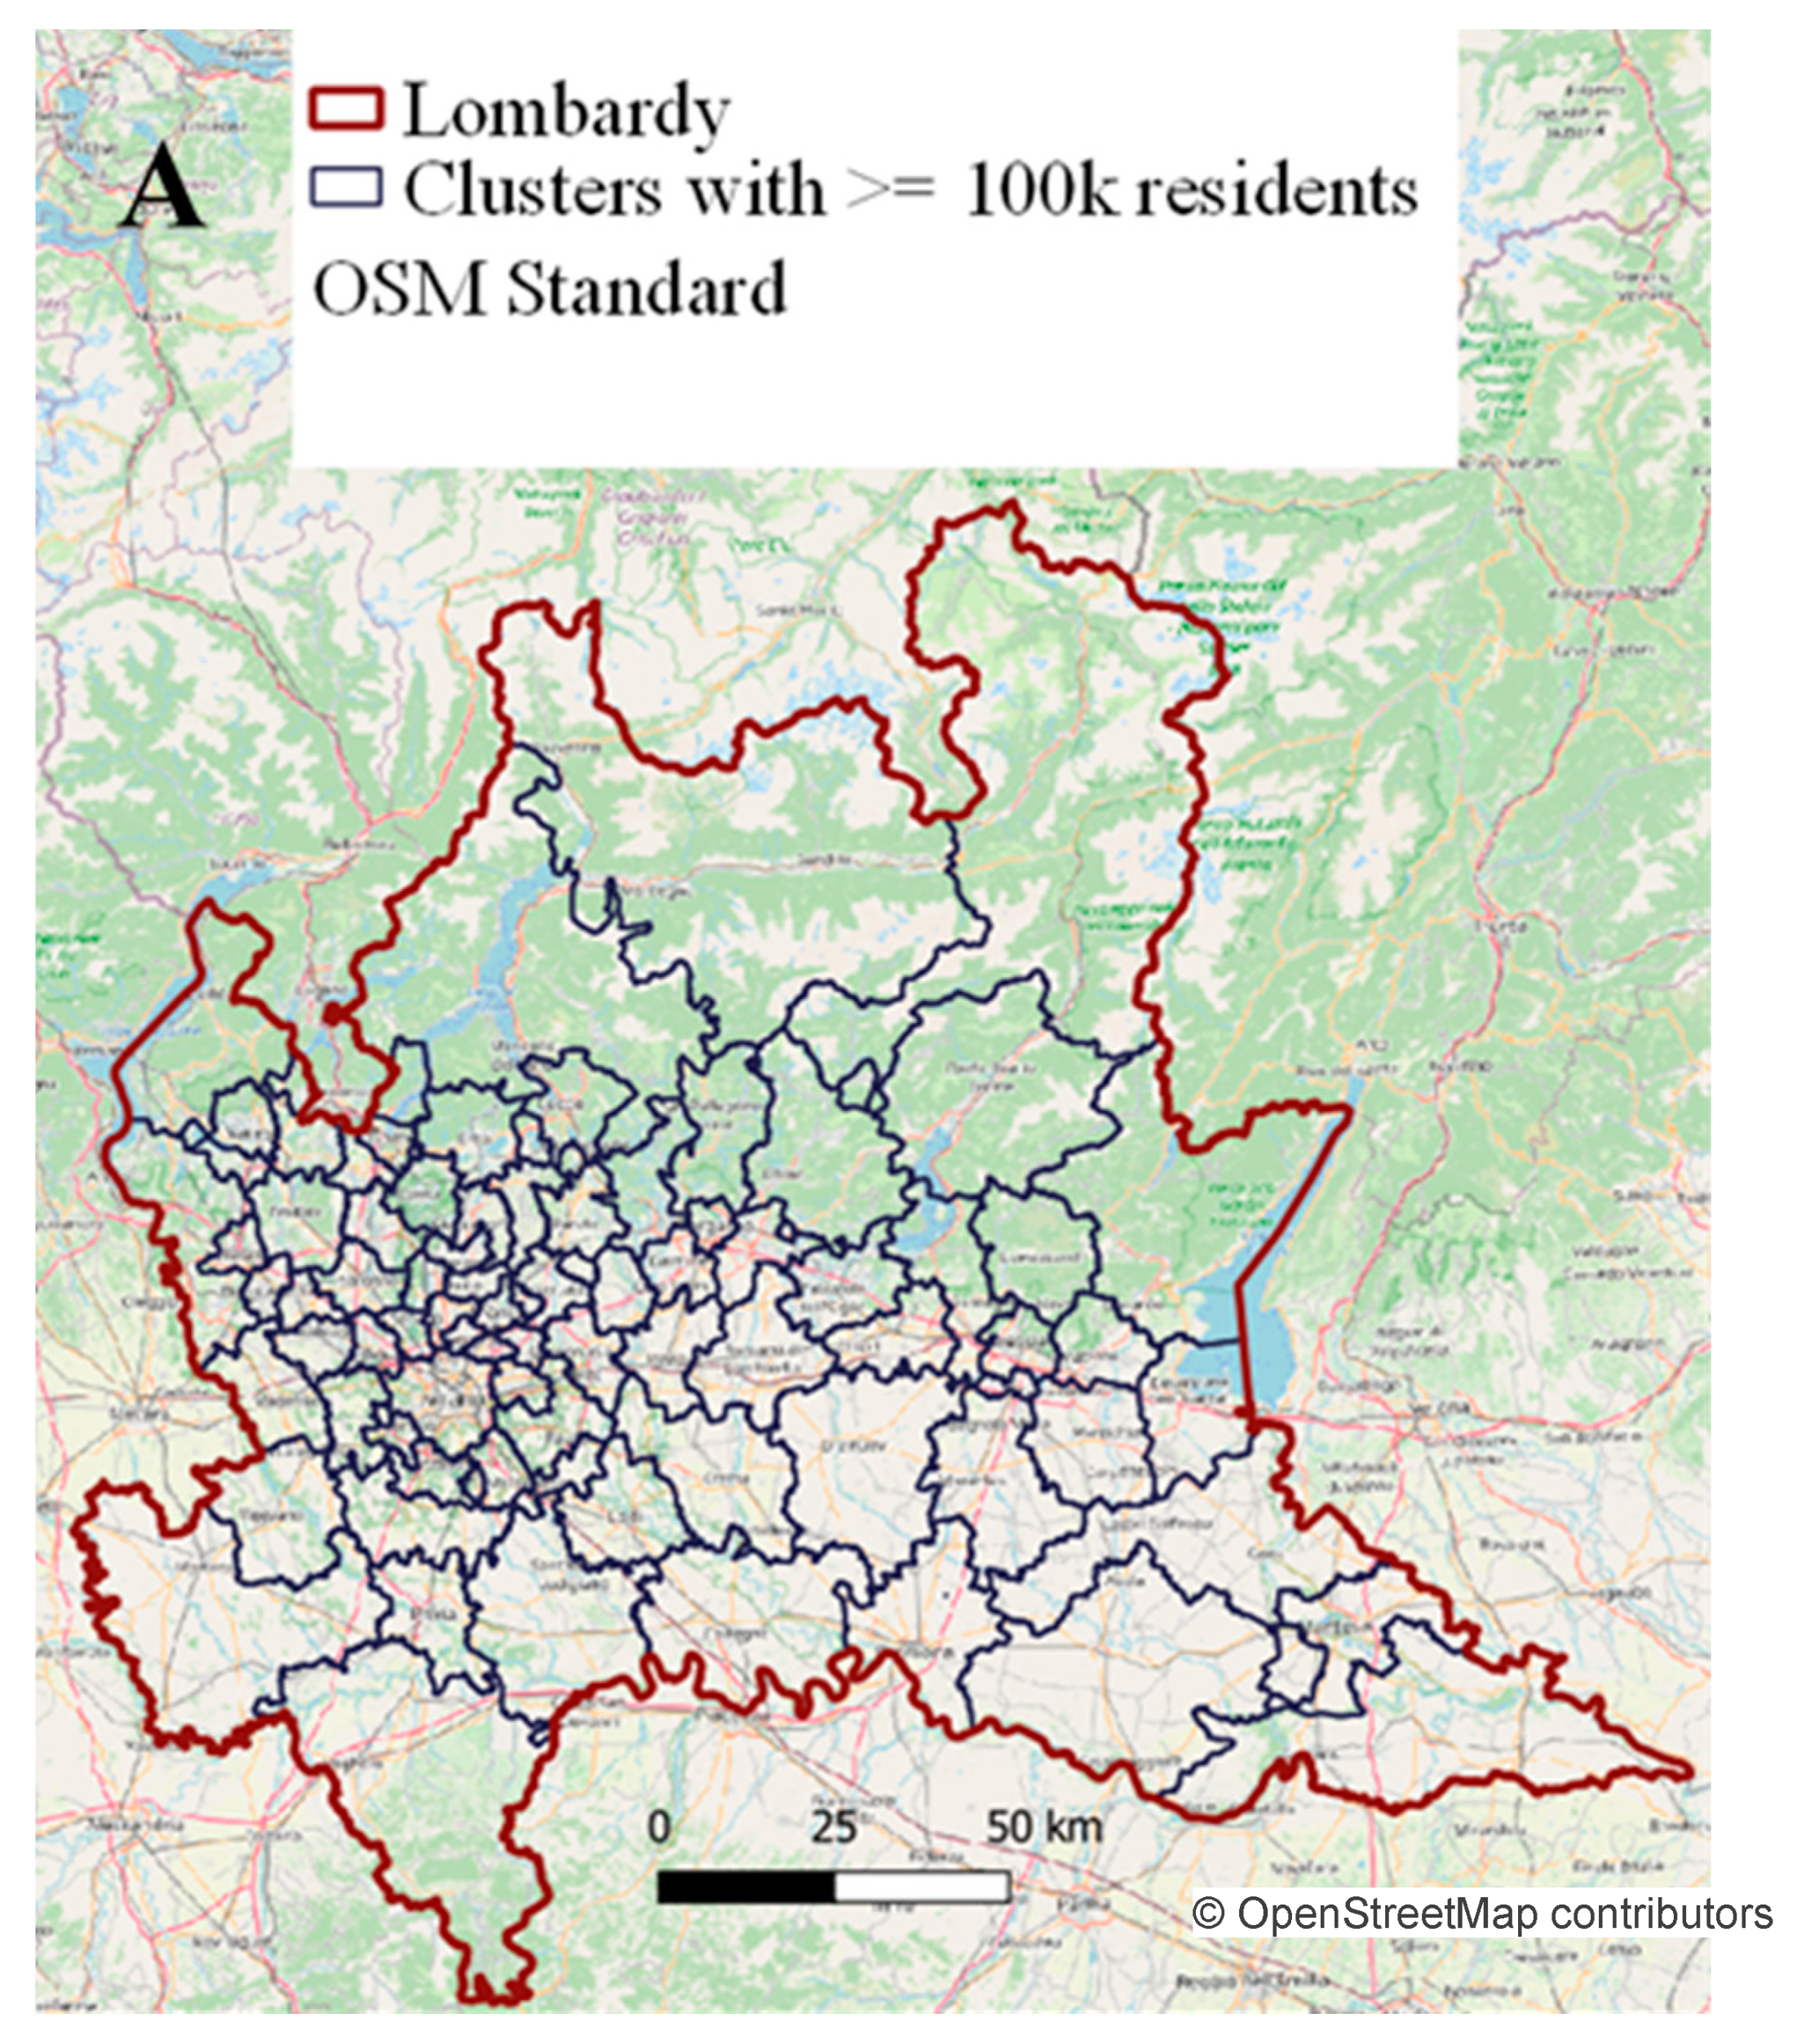
As a compromise between the need for spatial resolution in the data and the presence of random noise, data from neighboring municipalities were aggregated to obtain clusters of at least 100,000 residents. To this aim, the proposed algorithm starts from the most populated cities (towns with more than 100,000 inhabitants, such as Milan, Brescia, Monza, and Bergamo, were considered as single clusters) and progressively aggregates neighborhood municipalities (on the basis of coordinates of their centroids) until the target size is reached. After this first step, some municipalities (especially close to regional borders) are aggregated in a certain cluster, despite not being adjacent to the other municipalities of that cluster. In a further refinement step, all these cases are detected and corrected with the following procedure:
For each cluster (i), the coordinates of the centroids of its most outer municipalities (max latitude Ymax, min latitude Ymin, max longitude Xmax, min longitude Xmin) are selected;
A rectangular region of interest R is built using these extreme coordinates (Ymax, Ymin, Xmax, Xmin);
The number of municipality centroids () belonging to the cluster (i) is considered;
The number of municipality centroids () belonging to different clusters, but still falling within R is computed;
If < , the next cluster is selected, otherwise (i.e., ≥) each of the four (m = 1…4) external municipalities identified at step 1 are iteratively selected ();
Steps 1–4 are repeated excluding from the analysis;
If the (m + 1) computed at step 6 is smaller than (m) computed at step 4, is cancelled from the cluster i and re-assigned to the same cluster of its closest municipality (different from i); if (m + 1) < (m + 1), the next cluster (i) is selected, otherwise if (m + 1) is still greater than (m + 1), the next external municipality is considered (back to step 5).
The whole procedure is repeated until the condition ≥ is not reached for every cluster (i).
With this algorithm, considering the target value of at least 100,000 residents, 77 clusters of municipalities were obtained (
Figure 4), with a median (25th–75th) population (excluding single-city clusters of Milan, Brescia, Monza, and Bergamo) of 107,724 (100,382–121,096).
2.4. Time-Series Analysis
The spatiotemporal diffusion of COVID-19 was estimated by considering both the number of emergency calls to 112 and the dispatches of ambulances (in both cases, relevant to respiratory issues) along the territory, within the previously described clusters of municipalities. To do so, for each town included in the cluster, the demographic information relevant to total residents for each age range and gender was derived from the ISTAT data. In each cluster, for each day the total number of calls to the 112 emergency number was computed, and normalized by the total resident population:
where
NECi,d = emergency calls for respiratory issues normalized to the total resident population for cluster i-th and day d-th;
cd,m = emergency calls for respiratory issues on day d-th in municipality m-th;
popm = resident population in the municipality m-th.
With a similar procedure, for each day in each cluster (
i), the computation of a “COVID-19 score,”
, is proposed to take into account the specific age and gender of each patient in need of medical assistance, normalized by the resident population with the same characteristics, as:
where
add,m,a,s = Number of ambulance dispatches on day d-th in municipality m-th in the age range a-th for gender s;
popm,a,s = Resident population in the age range a-th and gender s in the municipality m-th;
wa,s = Weighting coefficient for the age range a-th and gender s.
The was computed for each combination of age range a-th and gender s as the ratio between the number of ambulance dispatches in the whole region in the period from 2 March to 22 March 2020 (i.e., considered as three weeks with known epidemic), divided by the number of ambulance dispatches from 6 January to 27 January 2020 (i.e., considered as three weeks of baseline with no evidence of pandemic spread).
Time series of daily (from 1 January to 23 March 2020) and were obtained for each cluster and then filtered with a five-day moving average in order to account for the strong randomness in the daily events.
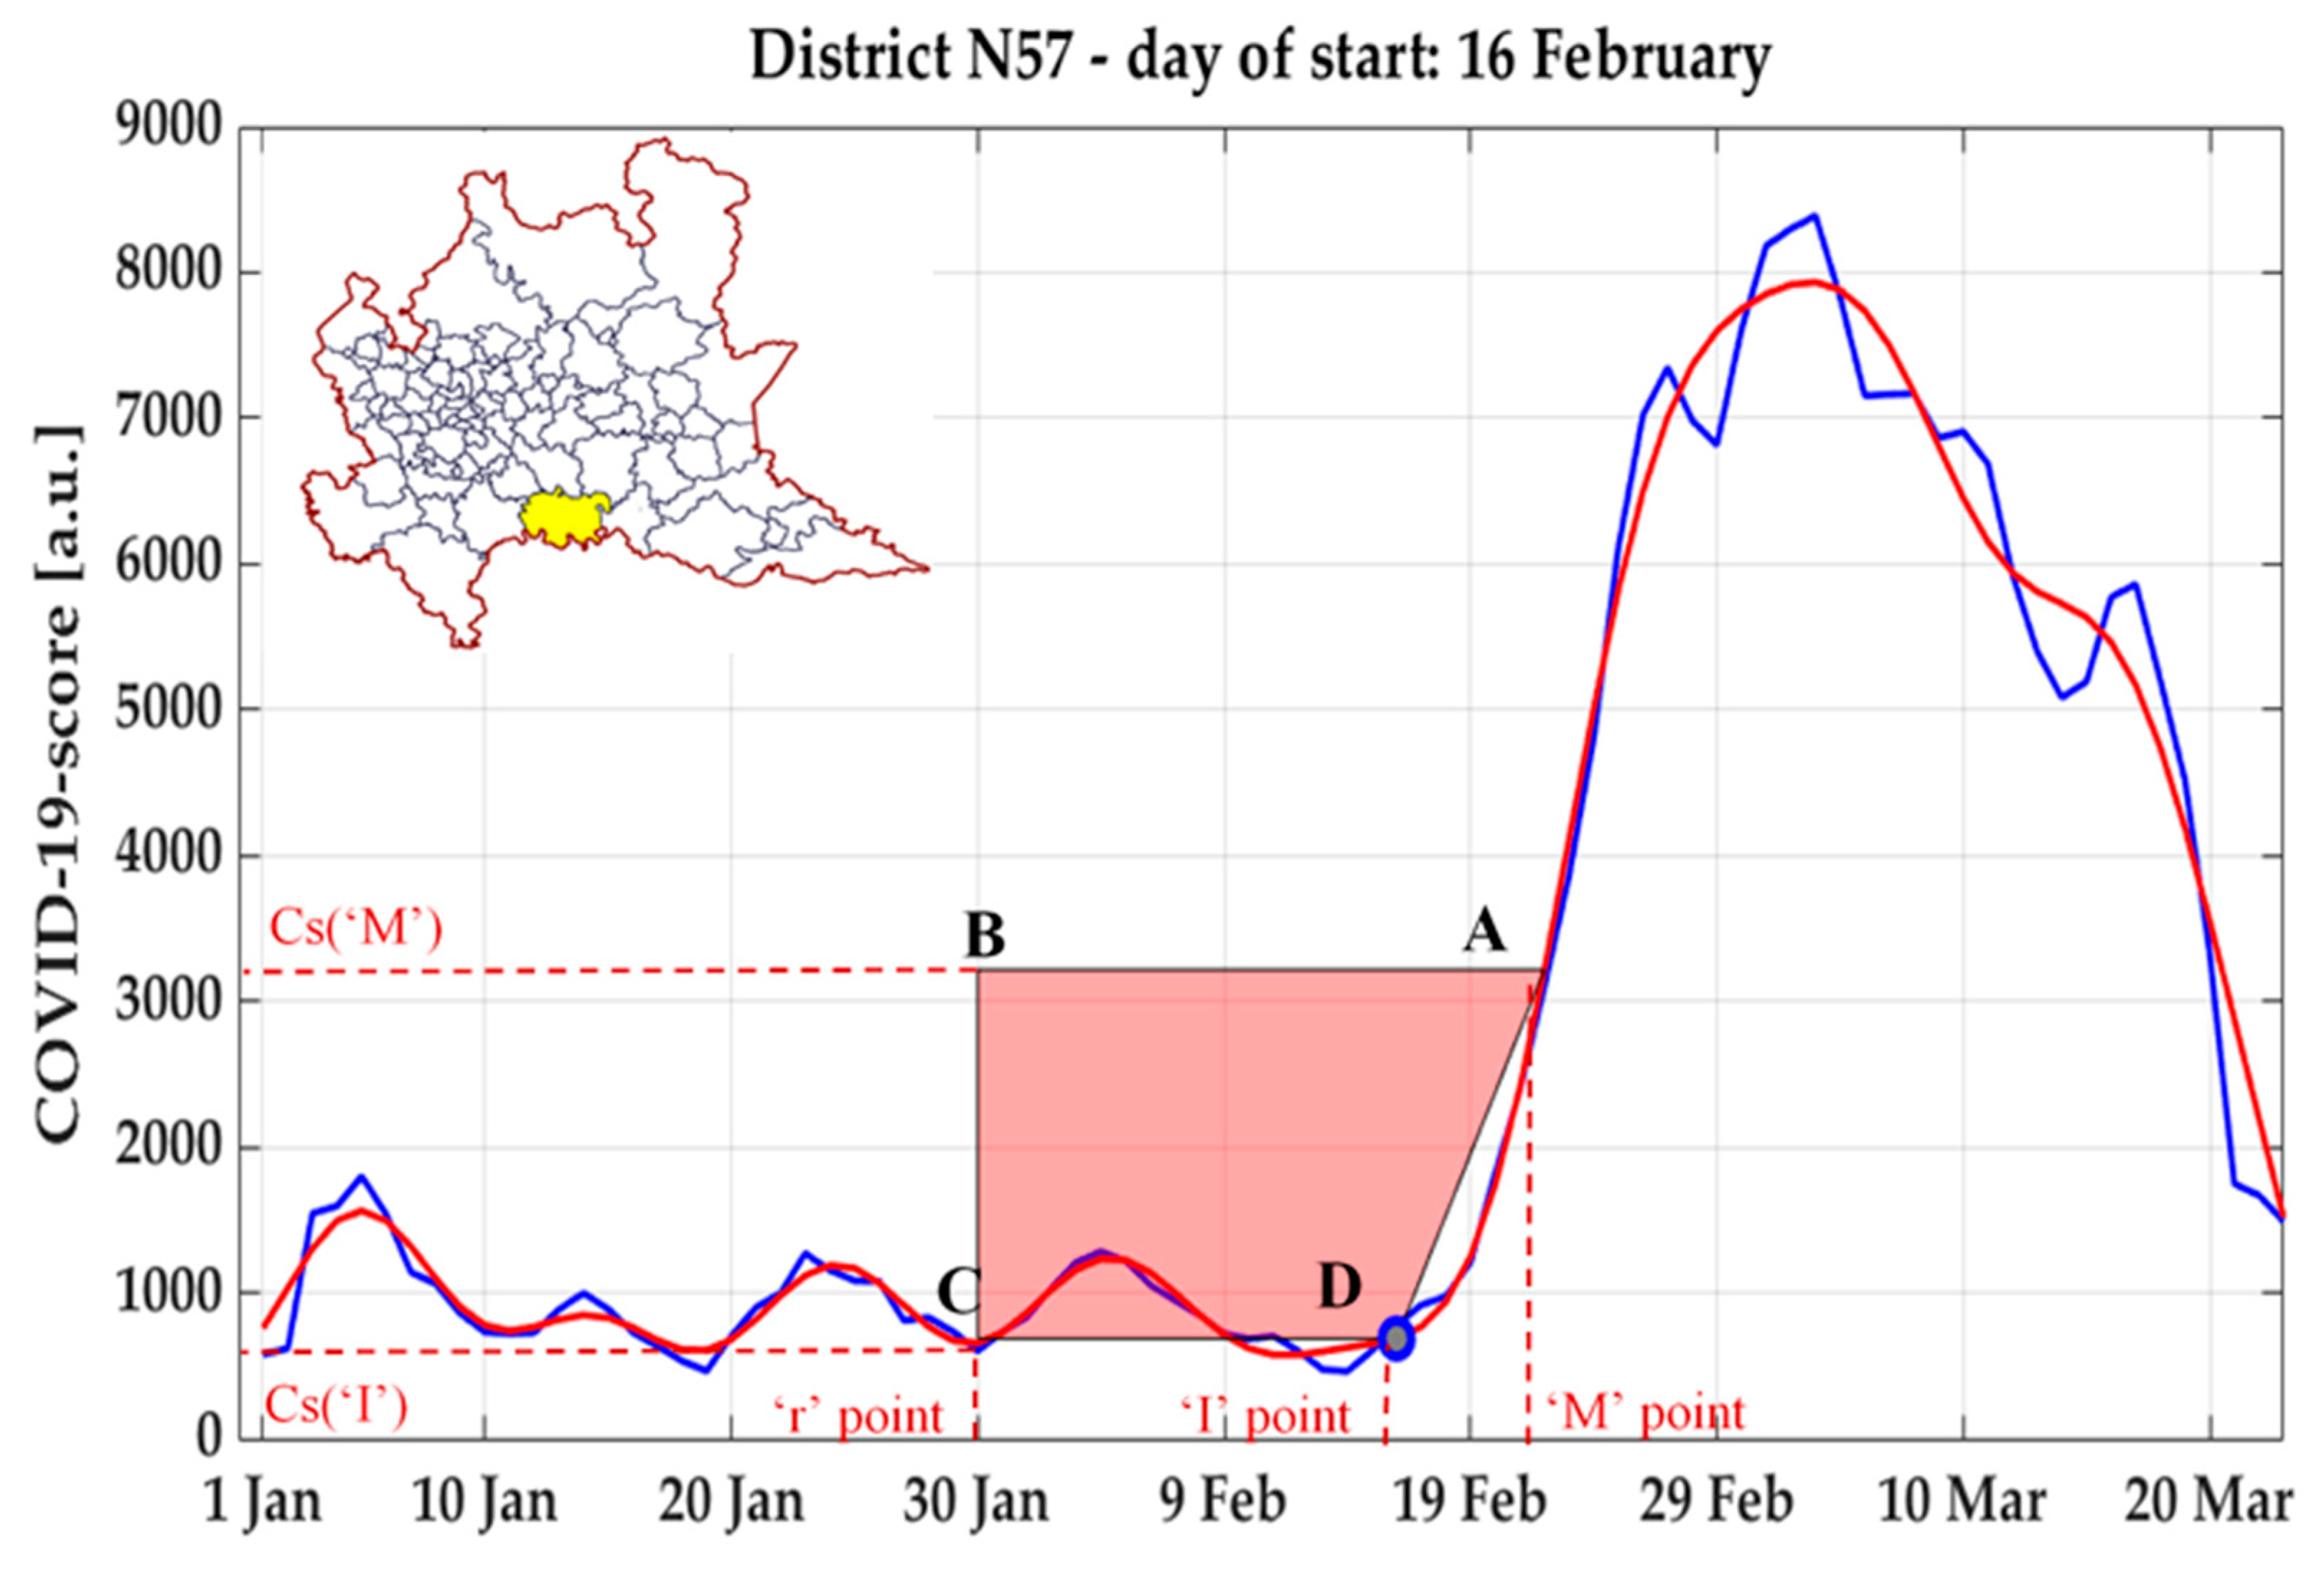
In order to identify on each sequence a fiducial point
representing the beginning of the phenomenon under analysis (i.e., the day associated to the potential start of the epidemic exponential growth), due to the morphological similarity of this curve with that of the ventricular repolarization phase (T wave) on the electrocardiogram signal, a validated methodology [
38] to robustly detect the inflection point developed in that context was applied.
Specifically, (see example in
Figure 5) the time-series was first low-pass filtered with a Finite Impulse Response digital filter (a second-order Butterworth with cut-off frequency set at 0.05 Hz), and the global maximum of the curve was identified, as well as the point A with the max derivative (highest slope) between such peak and the previous local minimum.
Then, a trapezium was built having as vertices the following points:
Point A, having as coordinates (M’, Csi,M);
Point B, having as x coordinate a value “r” arbitrary chosen in the baseline period, and as y coordinate the value of Cs at A (Csi,M);
Point C, having as coordinates (r, Csi,r);
Point D, having as coordinates (I, Csi,I), where I iteratively assumes all values between r and M.
For each possible position of the vertex D, the area of the trapezium ABCD is computed, and the inflection point
of the curve is identified as the value of I in which the area of the trapezium resulted the highest [
38].
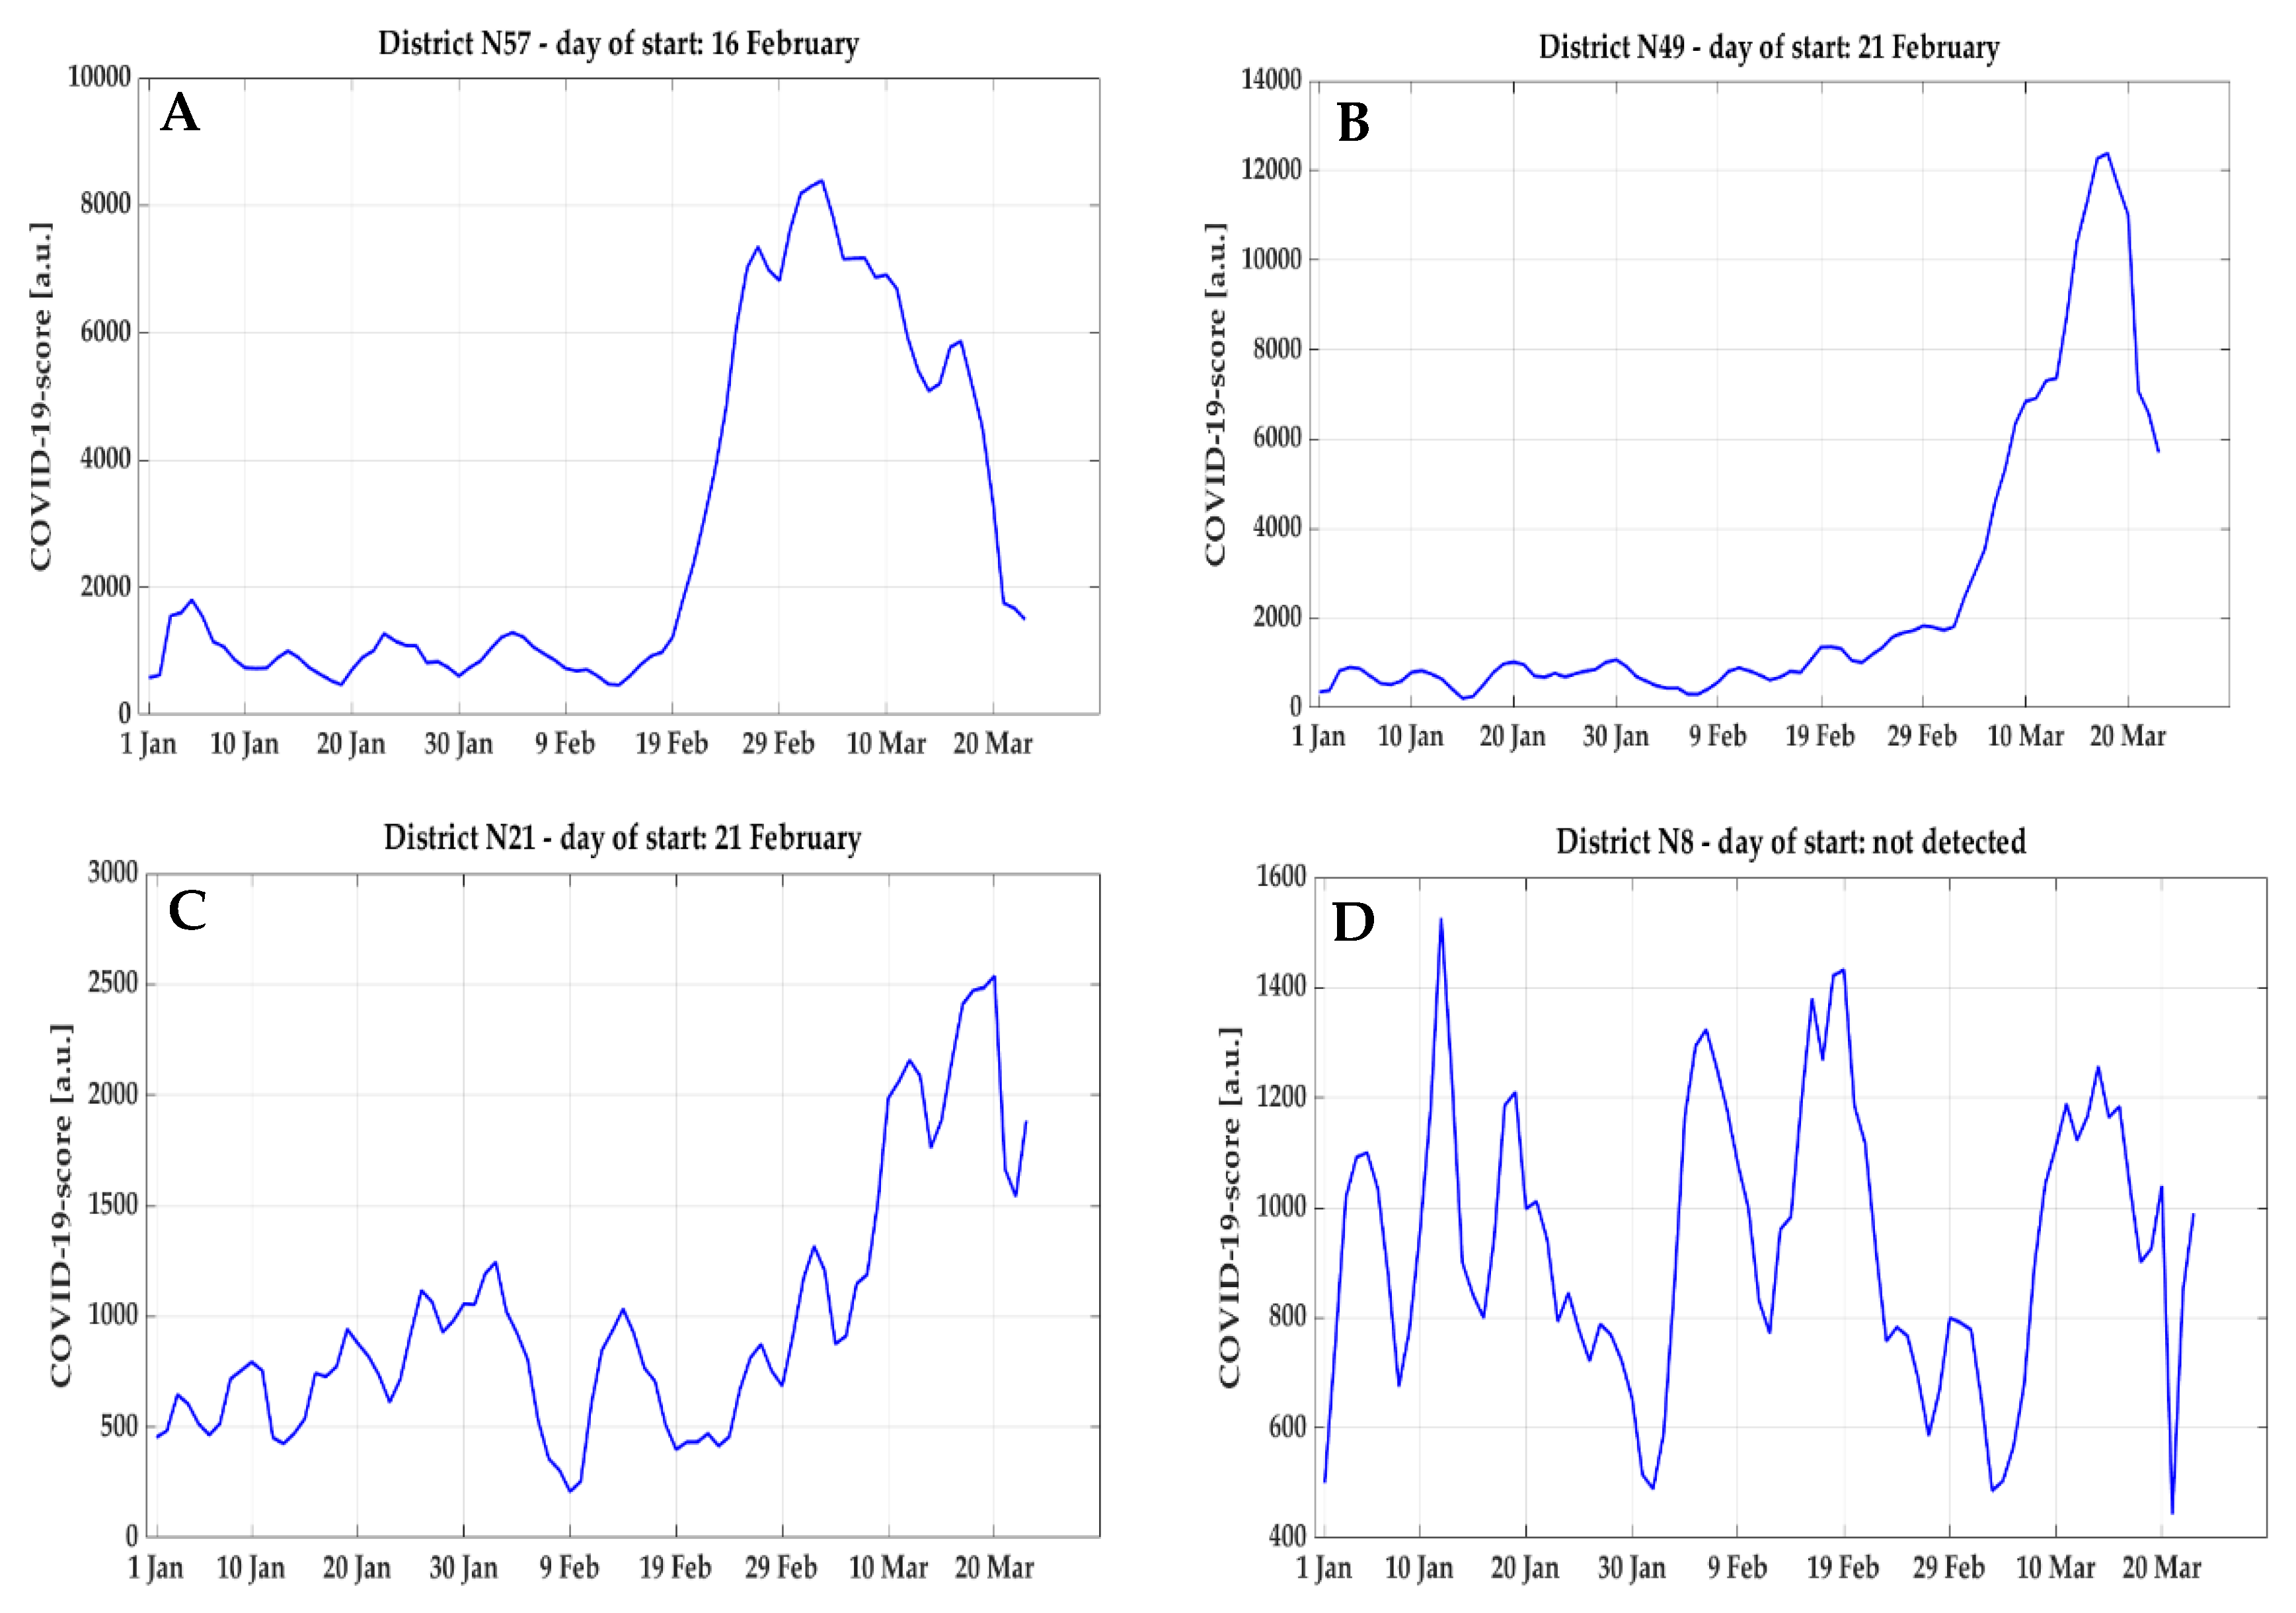
By analyzing the time-series obtained of COVID-19 score and NEC over the clusters, different morphologies were observed and categorized into four classes (examples reported in
Figure 6):
Class 1: very sharp and evident raising curve;
Class 2: evident but smoother raising curve;
Class 3: a raising trend with lower signal-to-noise ratio;
Class 4: no raising trend in the curve.
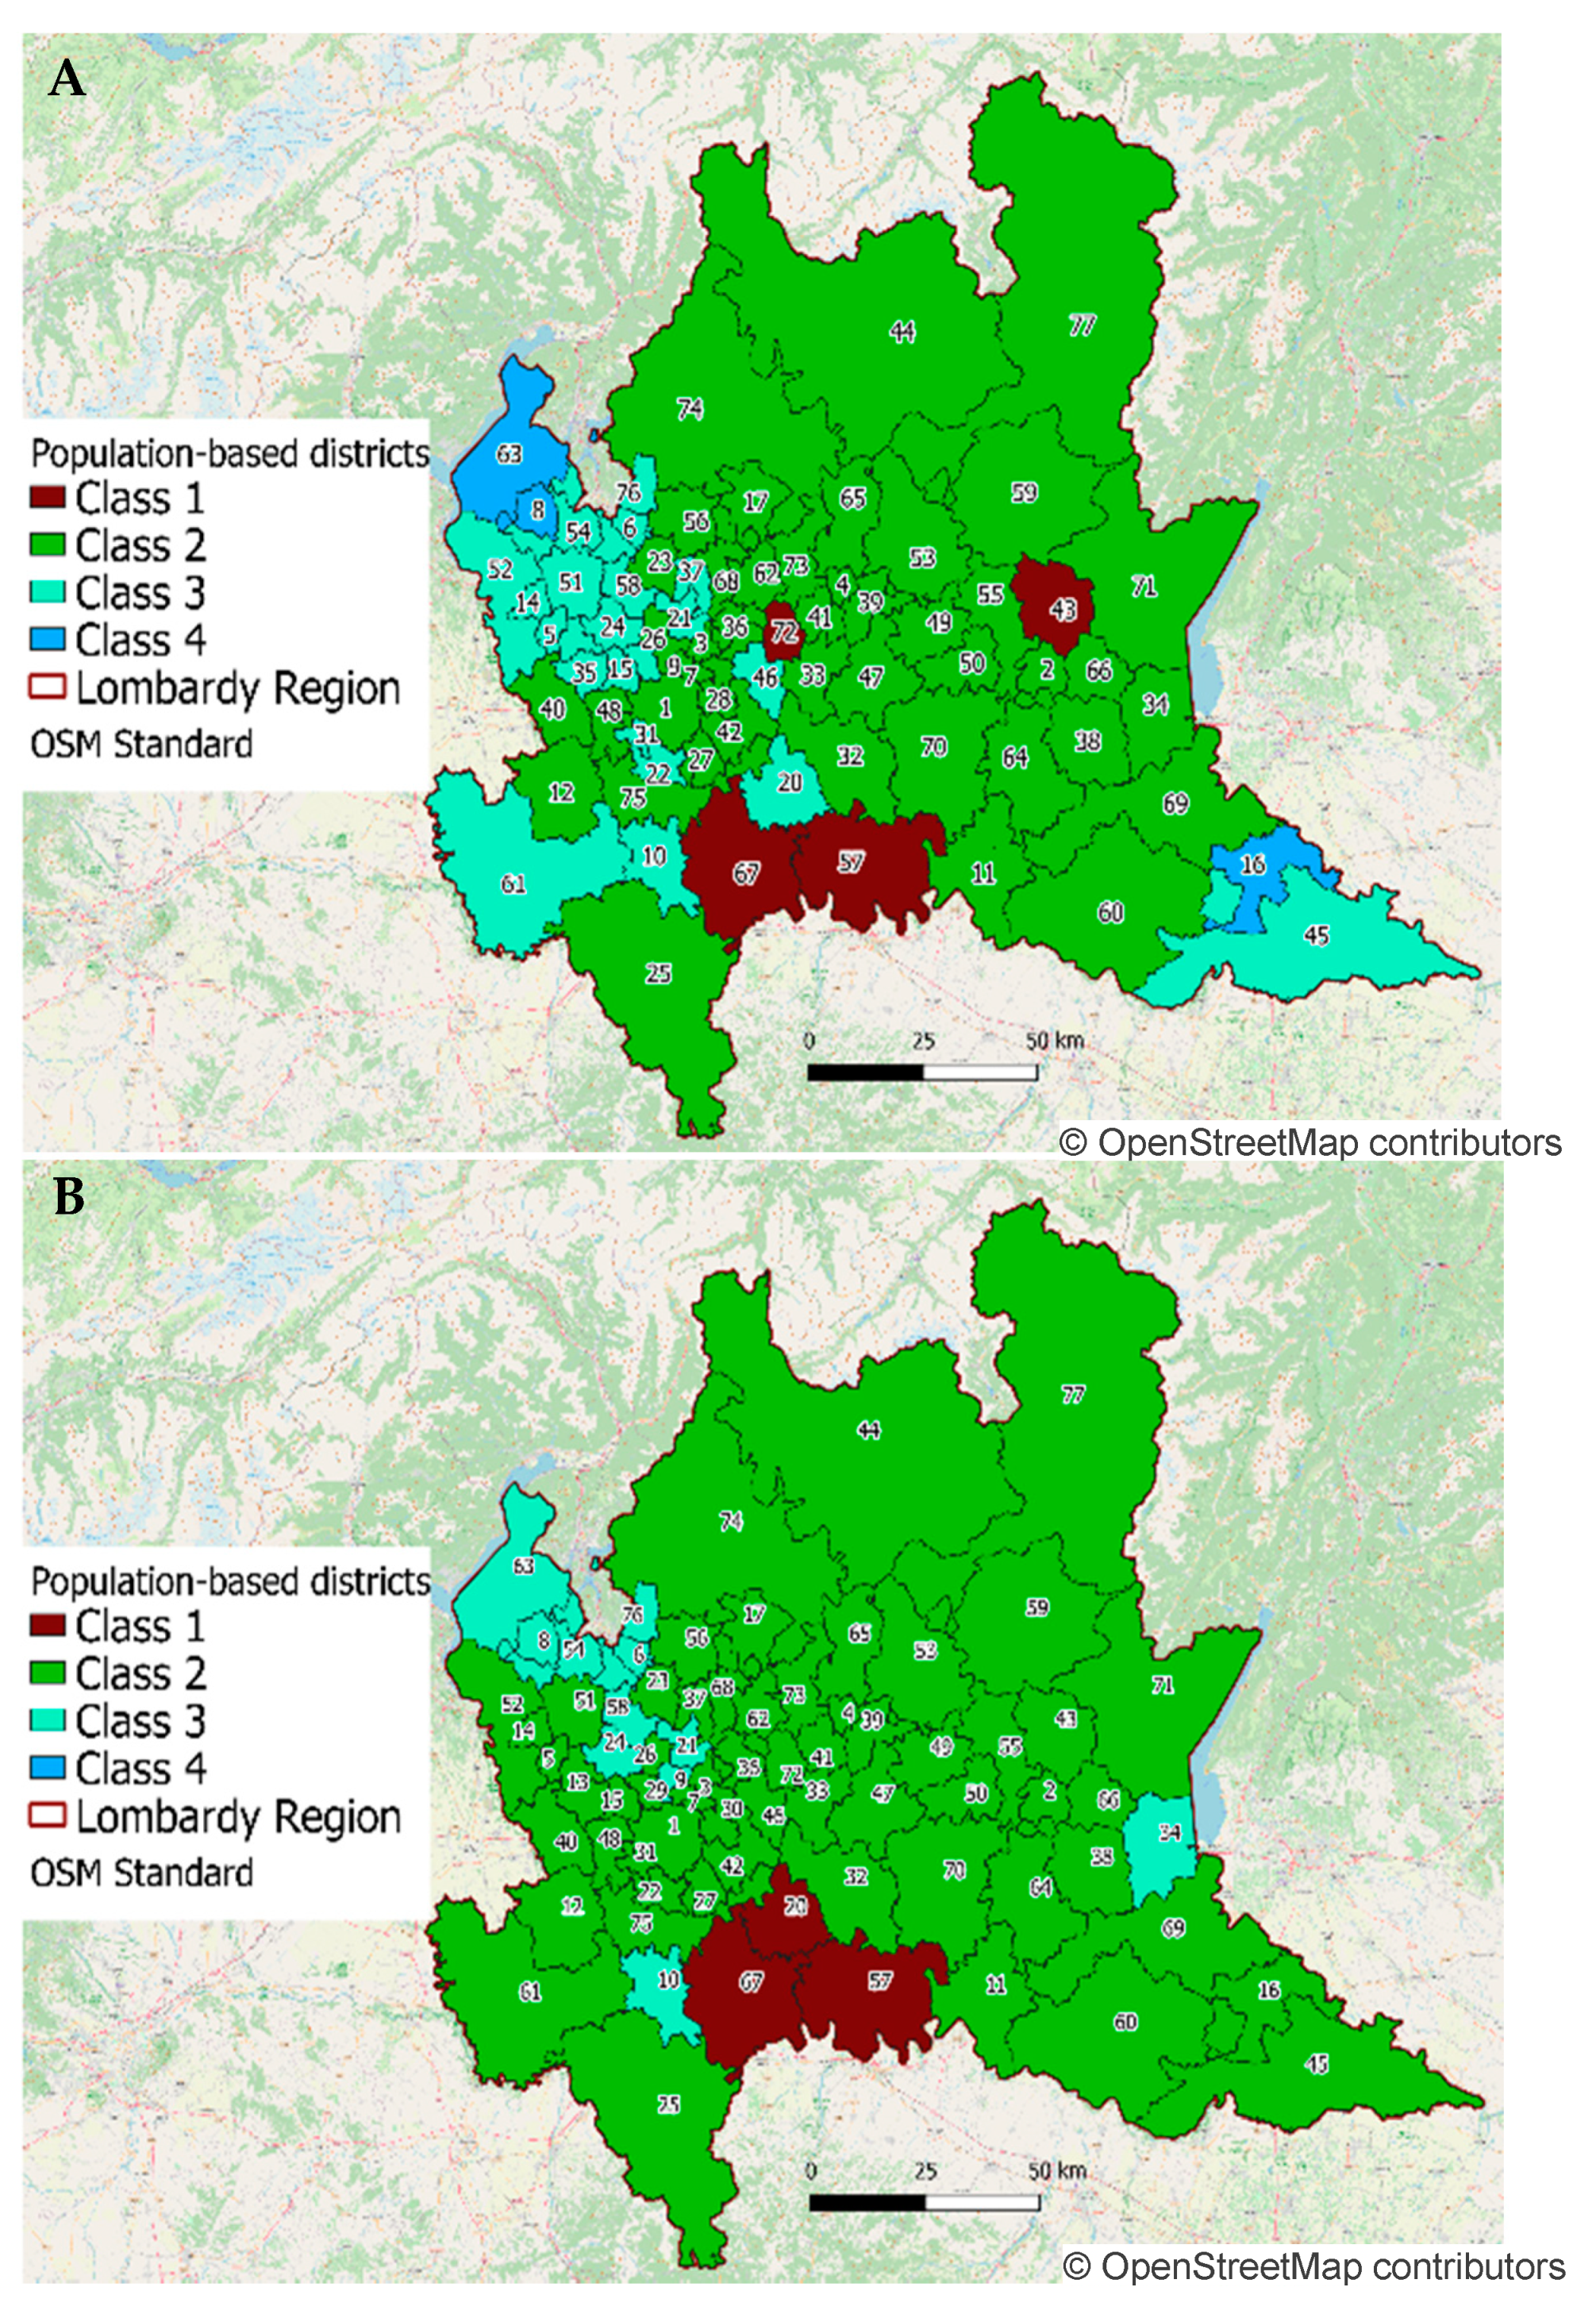
In order to better process all the time-series, they were manually categorized into these four classes and analyzed accordingly (mapping of this classification reported in
Figure 7).
While curves in class 4 were excluded from the computation of the start day , for all other morphologies, a filtering operation was applied. For class 2, the second order Butterworth with a 0.05 Hz cut-off frequency was effective in identifying the trend, whereas for class 1 and 3, it was necessary to modify the filter in order to adapt it to the sharper curves: therefore, a fifth-order Butterworth with 0.2 Hz cut-off frequency was used.
Following this classification, four clusters belonged to class 1, 47 to class 2, 23 to class 3, and three to class 4 according to the COVID-19 score, whereas for NEC, three clusters resulted in belonging to class 1, 62 to class 2, 12 to class 3, and no cluster to class 4.
The classification of COVID-19 score curve morphologies confirmed the hypothesis that the age and gender of patients rescued by ambulances could provide additional information. In fact, by applying the same classification to the normalized number of ambulance dispatches, without any weight for age and gender, 23 clusters were classified as class 4, and no cluster as class 1, while 24 clusters were assigned to class 2 and 30 to class 3. The higher number of clusters with time-series in class 3 (low signal-to-noise ratio) and in class 4 (no inflection point to be detected) revealed a lower quality in the non-weighted time-series, thus resulting in a less reliable detection of the starting day.
Within class 2, 55 clusters (71%) for NEC and 29 clusters (38%) for COVID-19 score showed the same morphology previously observed in aggregated data (as reported in
Figure 2), characterized by the presence of a first increase in correspondence to the first localized lock-down. On the base of the previously discussed observation that this feature could be related to an artifact, but also to an early sign of spreading of the disease, in order to avoid the algorithm systematically identifying as the inflection point the one following this first peak, a correction method by exponential interpolation was applied to filter it out and distribute the events on adjacent days. Considering a correction window from x1 to x2,the value of y(x1–1) is assigned to y(x1–2) and y(x1–3), and the exponential fitting is computed using these data: [y(x1–3), y(x1–2), y(x1–1), y(x2 + 1), y(x2 + 2), y(x2 + 3)]. For all x ≥ x1 and x ≤ x2, the value of y in the time series is substituted by the corresponding fitting values. A graphical representation of this operation is reported in
Figure 8, where x1 is set to be on 24 February and x2 is set (separately for every cluster) as the first day with a value above the first peak.
2.5. Robustness Assessment
For each cluster, the values of resulting from the NEC and from the COVID-19 score time-series were compared by associating them to each municipality, and the difference between them was then computed. As not all municipalities have the same number of residents, the final distribution of the difference was computed for every 1000 residents (assigning the same value to all people living in the same municipality). Statistical significance (p < 0.05) between the results obtained using the two series was tested by rank-sum test.
To assess the robustness of this approach in determining the possible beginning of the pandemic, the analysis was repeated applying a different territorial clustering constituted by the administrative subdivision used by AREU, composed by 107 clusters, with a median (25th–75th) population (excluding the cities of Milan, Brescia, Monza, and Bergamo, which are considered as single clusters) of 67,460 (38,845–108,018). The resulting
2 values were then compared with the previously obtained
for each of the 1506 municipalities in Lombardy (rank-sum test,
p < 0.05). Relevant results are reported in
Table 1.
The different comparisons show a significant (hence minimal) difference in the estimated inflection point for NEC considering the different clustering strategy applied, while no significance was found for COVID-19 score. When comparing NEC and COVID-19 score, a significant difference was systematically found (with the latter following the first), independently from the adopted clustering strategy.
With the AREU clustering, despite the fact that the smaller spatial dimensions of each cluster could give a better local insight, they might reduce the informative content for each signal due to less cases per day, making it more difficult to clearly identify the inflection point . As a matter of fact, using the AREU administrative clusters, the COVID-19 score and the NEC curves were attributed to Class 4 (i.e., no starting point to be computed) for 15 and 4 clusters, respectively, compared to 3 and 0, respectively, when the proposed population-based clustering was applied.
2.6. Results of the Spatiotemporal Evolution
Considering the COVID-19 score for the population-based clusters,
values ranged from 14 February to 9 March 2020, with a median date of 20 February 2020 (18 February, 22 February), whereas, on the base of NEC,
values were slightly anticipated, ranging from 11 February to 23 February 2020, with a median date of 18 February 2020 (17 February, 20 February). Corresponding results were mapped and color-coded in
Figure 9.
According to the analysis of both COVID-19 score and NEC, the start day
in the cluster including the town of Codogno (cluster #57) was identified on 16 February 2020 (
Figure 10A,B), five days before the first patient was officially diagnosed on 21 February 2020. In the following days, the trend was in abrupt increase, thus showing that on 21 February 2020, the epidemic could have been already in a phase of strong exponential growth, with a peak reached on 4 March 2020. This result is consistent with the cluster #11 corresponding to the near urban center of Cremona, where the start day
was identified even a day earlier, at 15 February 2020, considering both COVID-19 score (
Figure 10C) and NEC (
Figure 10D), and a peak value reached on 14 March 2020.
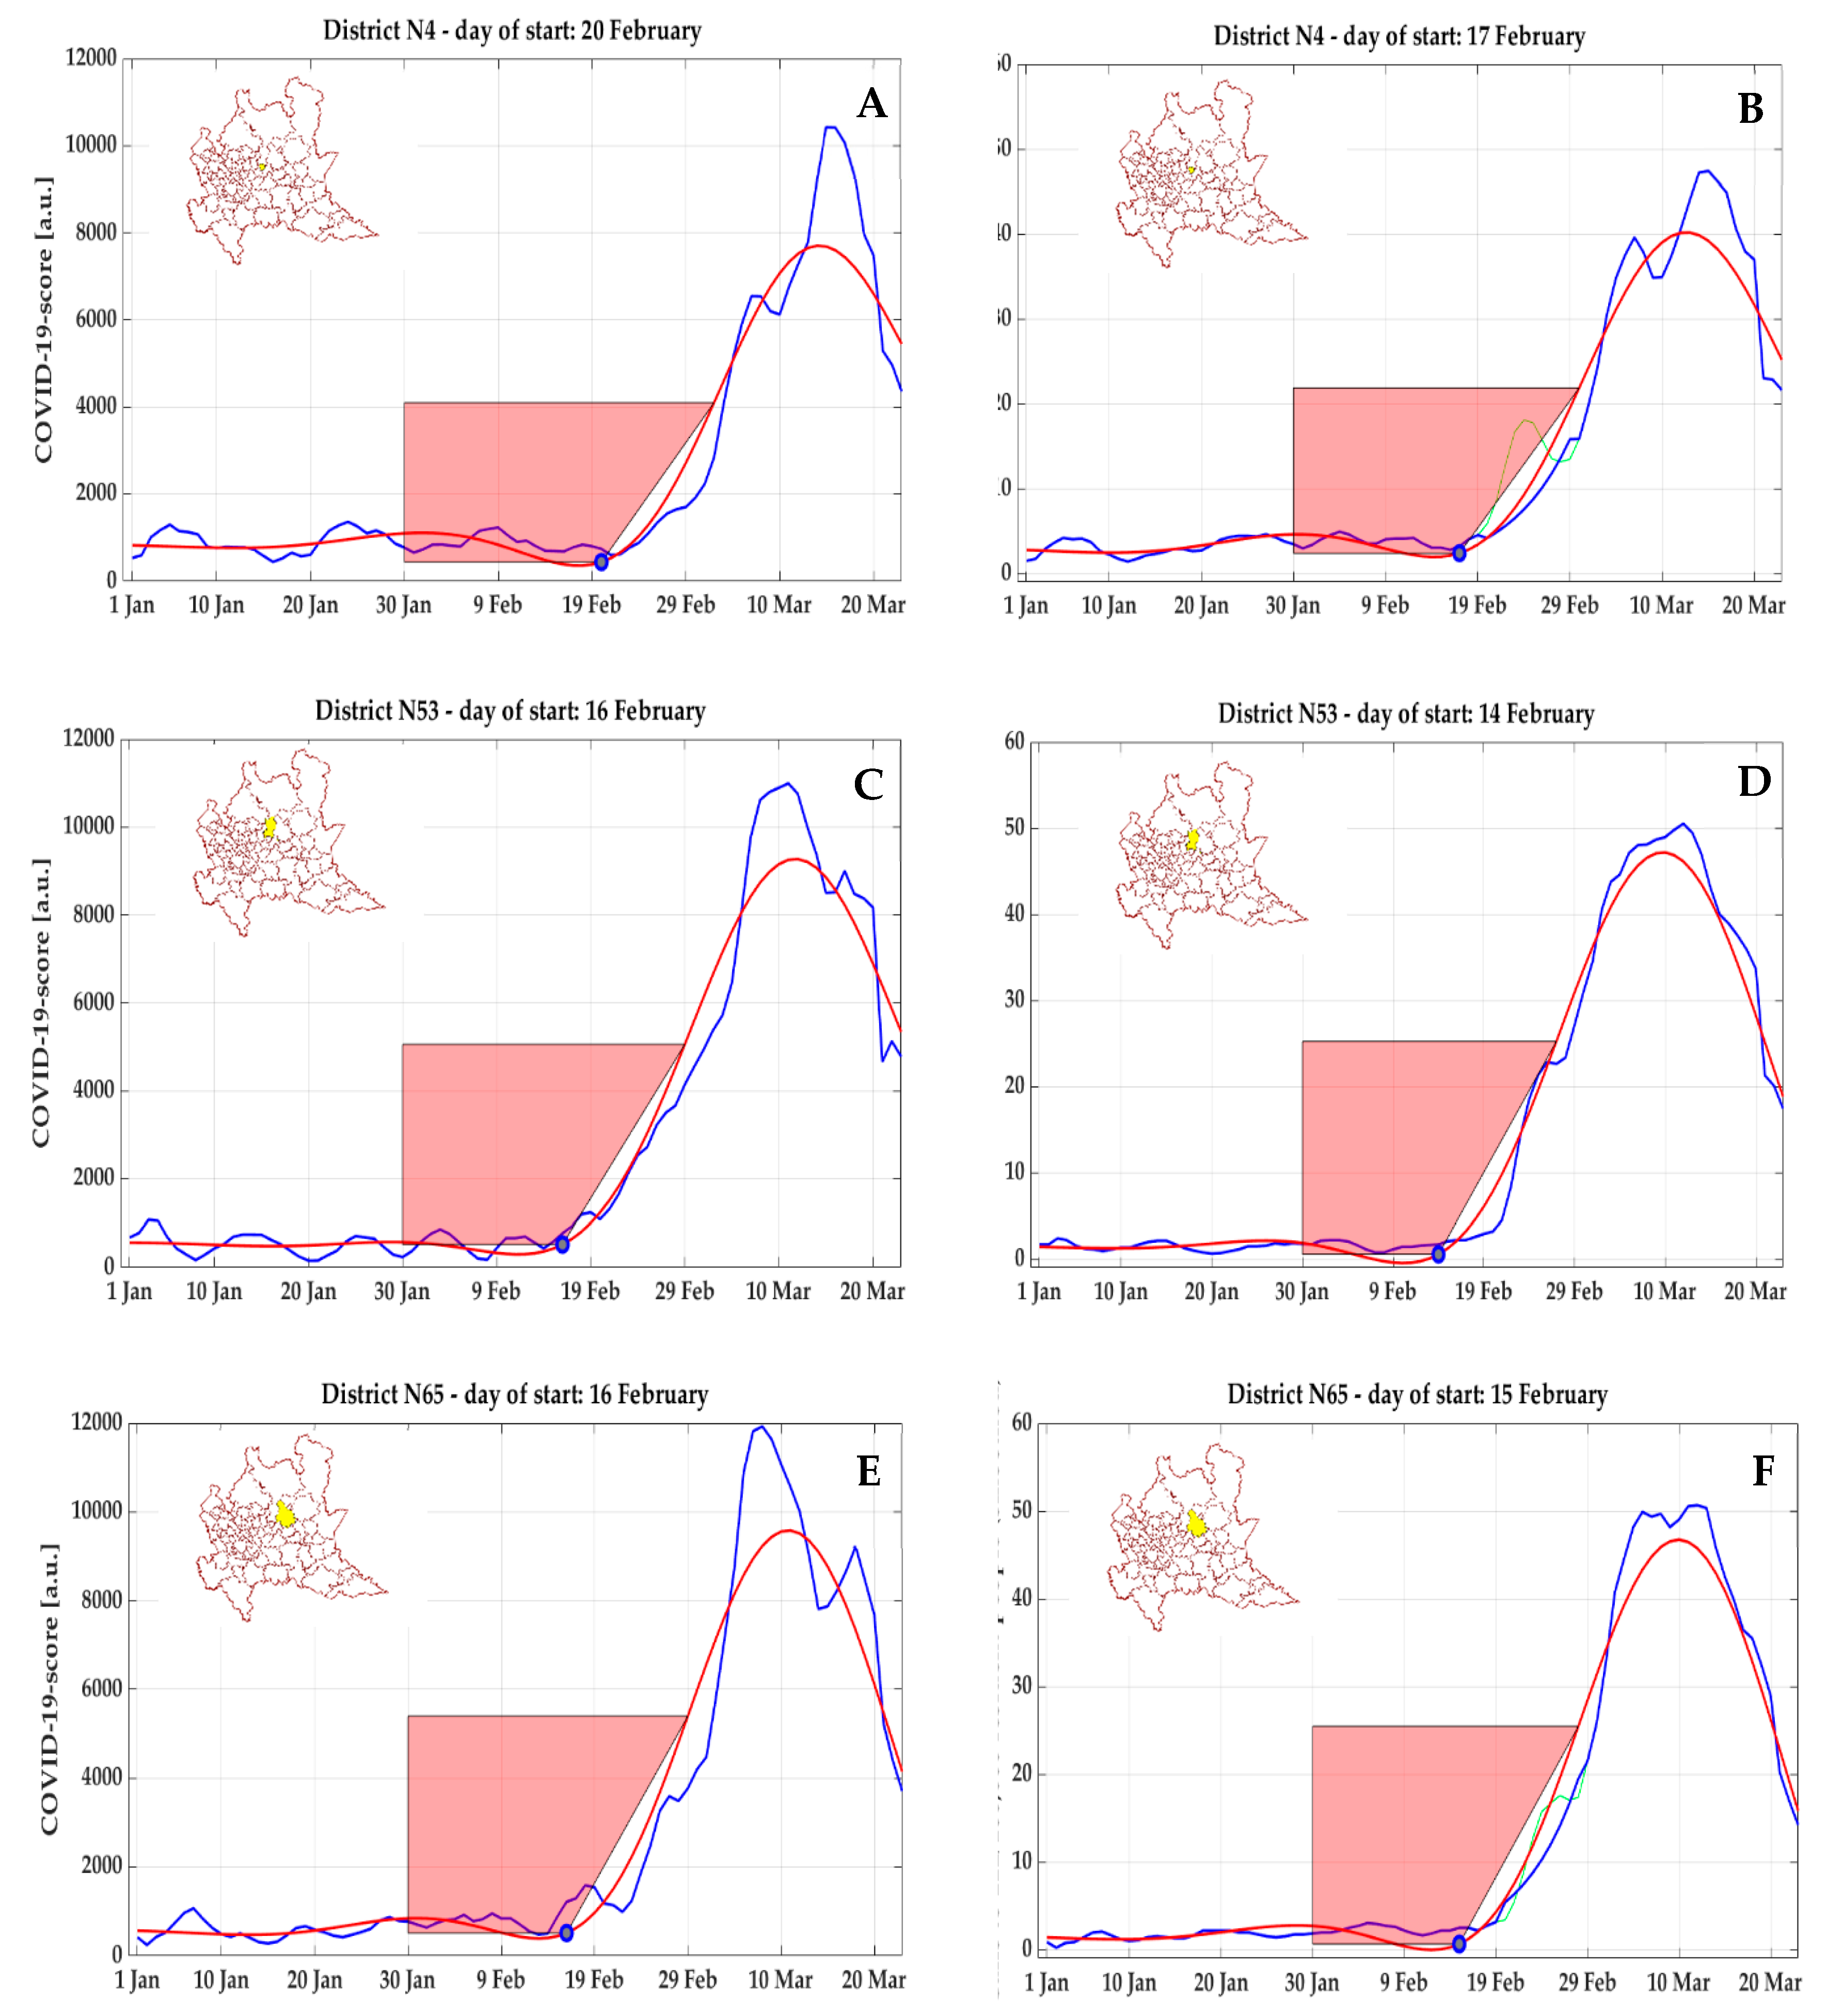
According to a posteriori official data, the most affected area during this first temporal phase was the province of Bergamo (1,114,590 resident population), with the highest absolute number of COVID-19 diagnoses (8527) up to 29 March 2020, with a prevalence of 0.765%. In the cluster corresponding to the city of Bergamo (#4), the start day
was identified on 20 February 2020 according to COVID-19 score (
Figure 11A), and on 17 February 2020 by NEC (
Figure 11B), whereas in two nearby clusters (#65 and #53) including Nembro and Alzano Lombardo (Val Seriana), respectively, the beginning of the curve was found even earlier, on 16 February 2020 (
Figure 11C,E) on the base of COVID-19 score and on 15 February 2020 and 14 February 2020, respectively, by NEC (
Figure 11D,F). These areas faced a critical situation, and were considered to be the most affected by the epidemic in the whole country, as confirmed by ISTAT data on mortality (for all causes), according to which the relative increase in the time period from 1 March to 21 March 2020 compared to the same time period in 2019 was +1000% for Nembro and +937.5% for Alzano Lombardo.
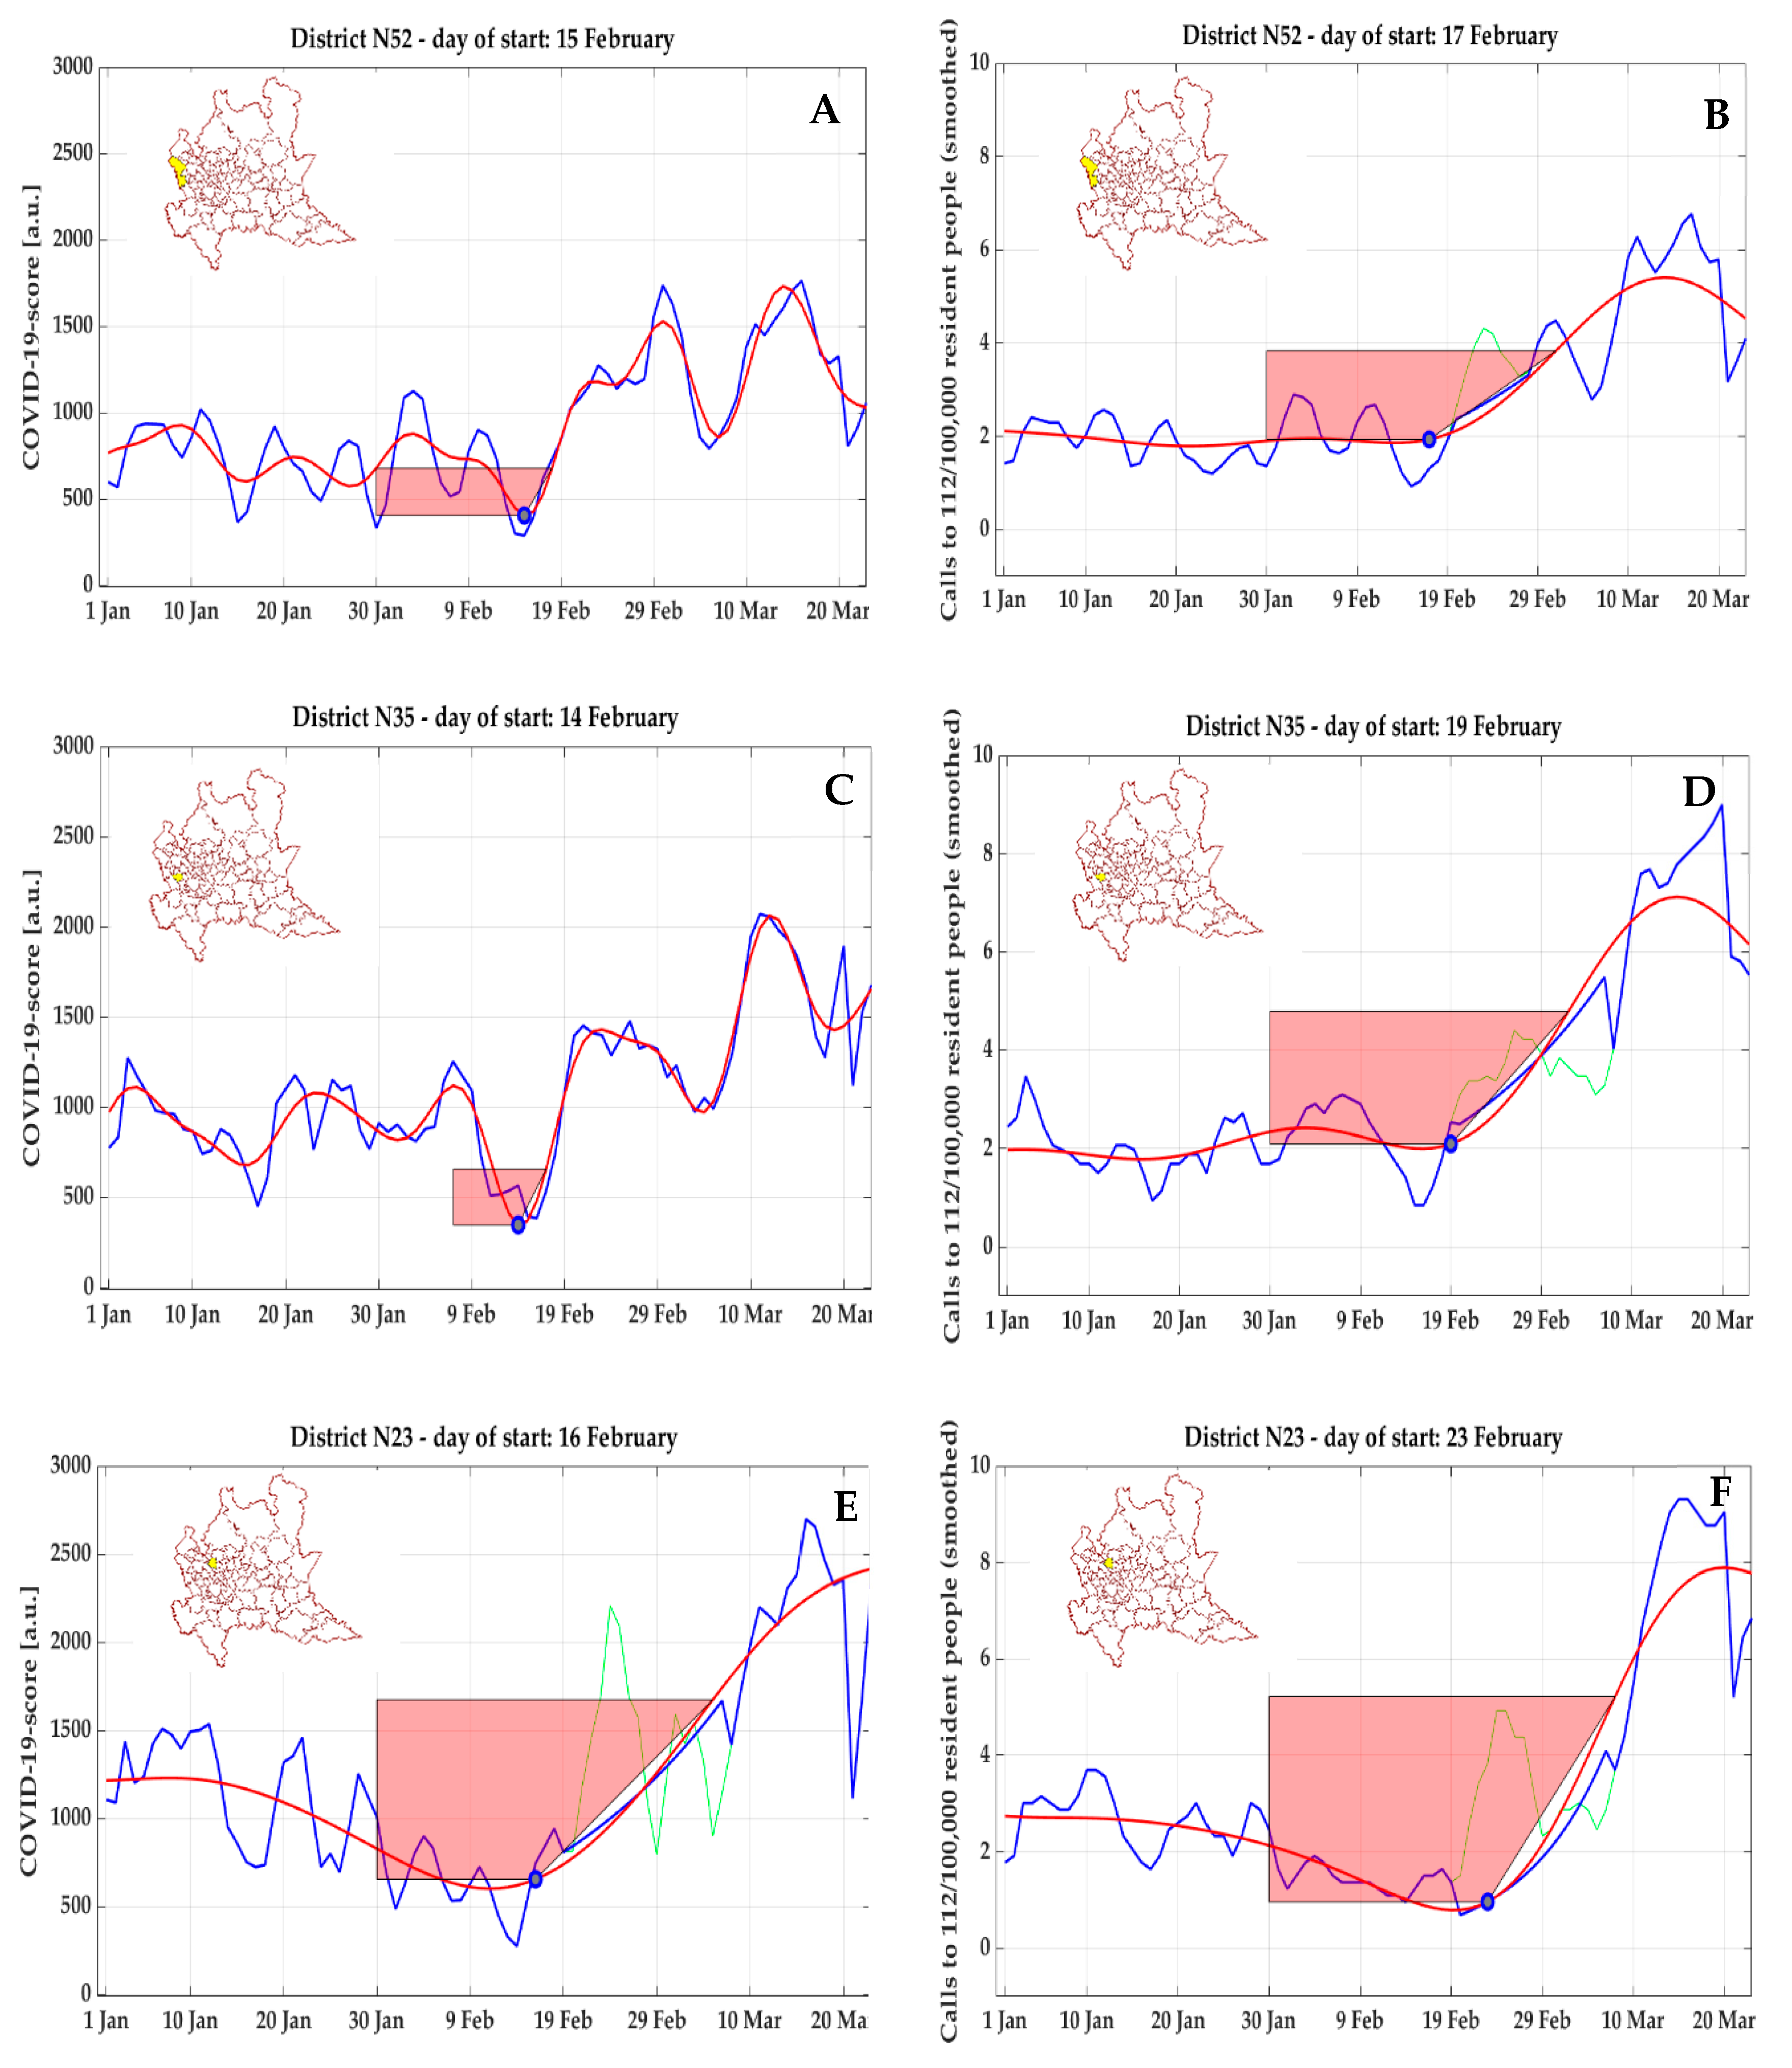
This approach is not completely free from artefacts. For COVID-19 score, an anomalous trend of anticipation in detecting the inflection point compared to NEC was clearly visible in three clusters in the north-west of Milan, including the area of Malpensa airport (#52,
Figure 12A,B), the second largest international airport of Italy and first in the Lombardy region, and other non-adjoining municipalities (#35,
Figure 12C,D, and #23,
Figure 12E,F). In these three clusters, a first early peak (but with moderate amplitude) of COVID-19 score was detected (respectively on 14 February 2020 for #35, on 15 February 2020 for #52, and on 16 February 2020 for #23); however, a phase of clear exponential growth did not follow, and from 5 March to 15 March 2020, a strong decrease was observed before reaching the global peak.
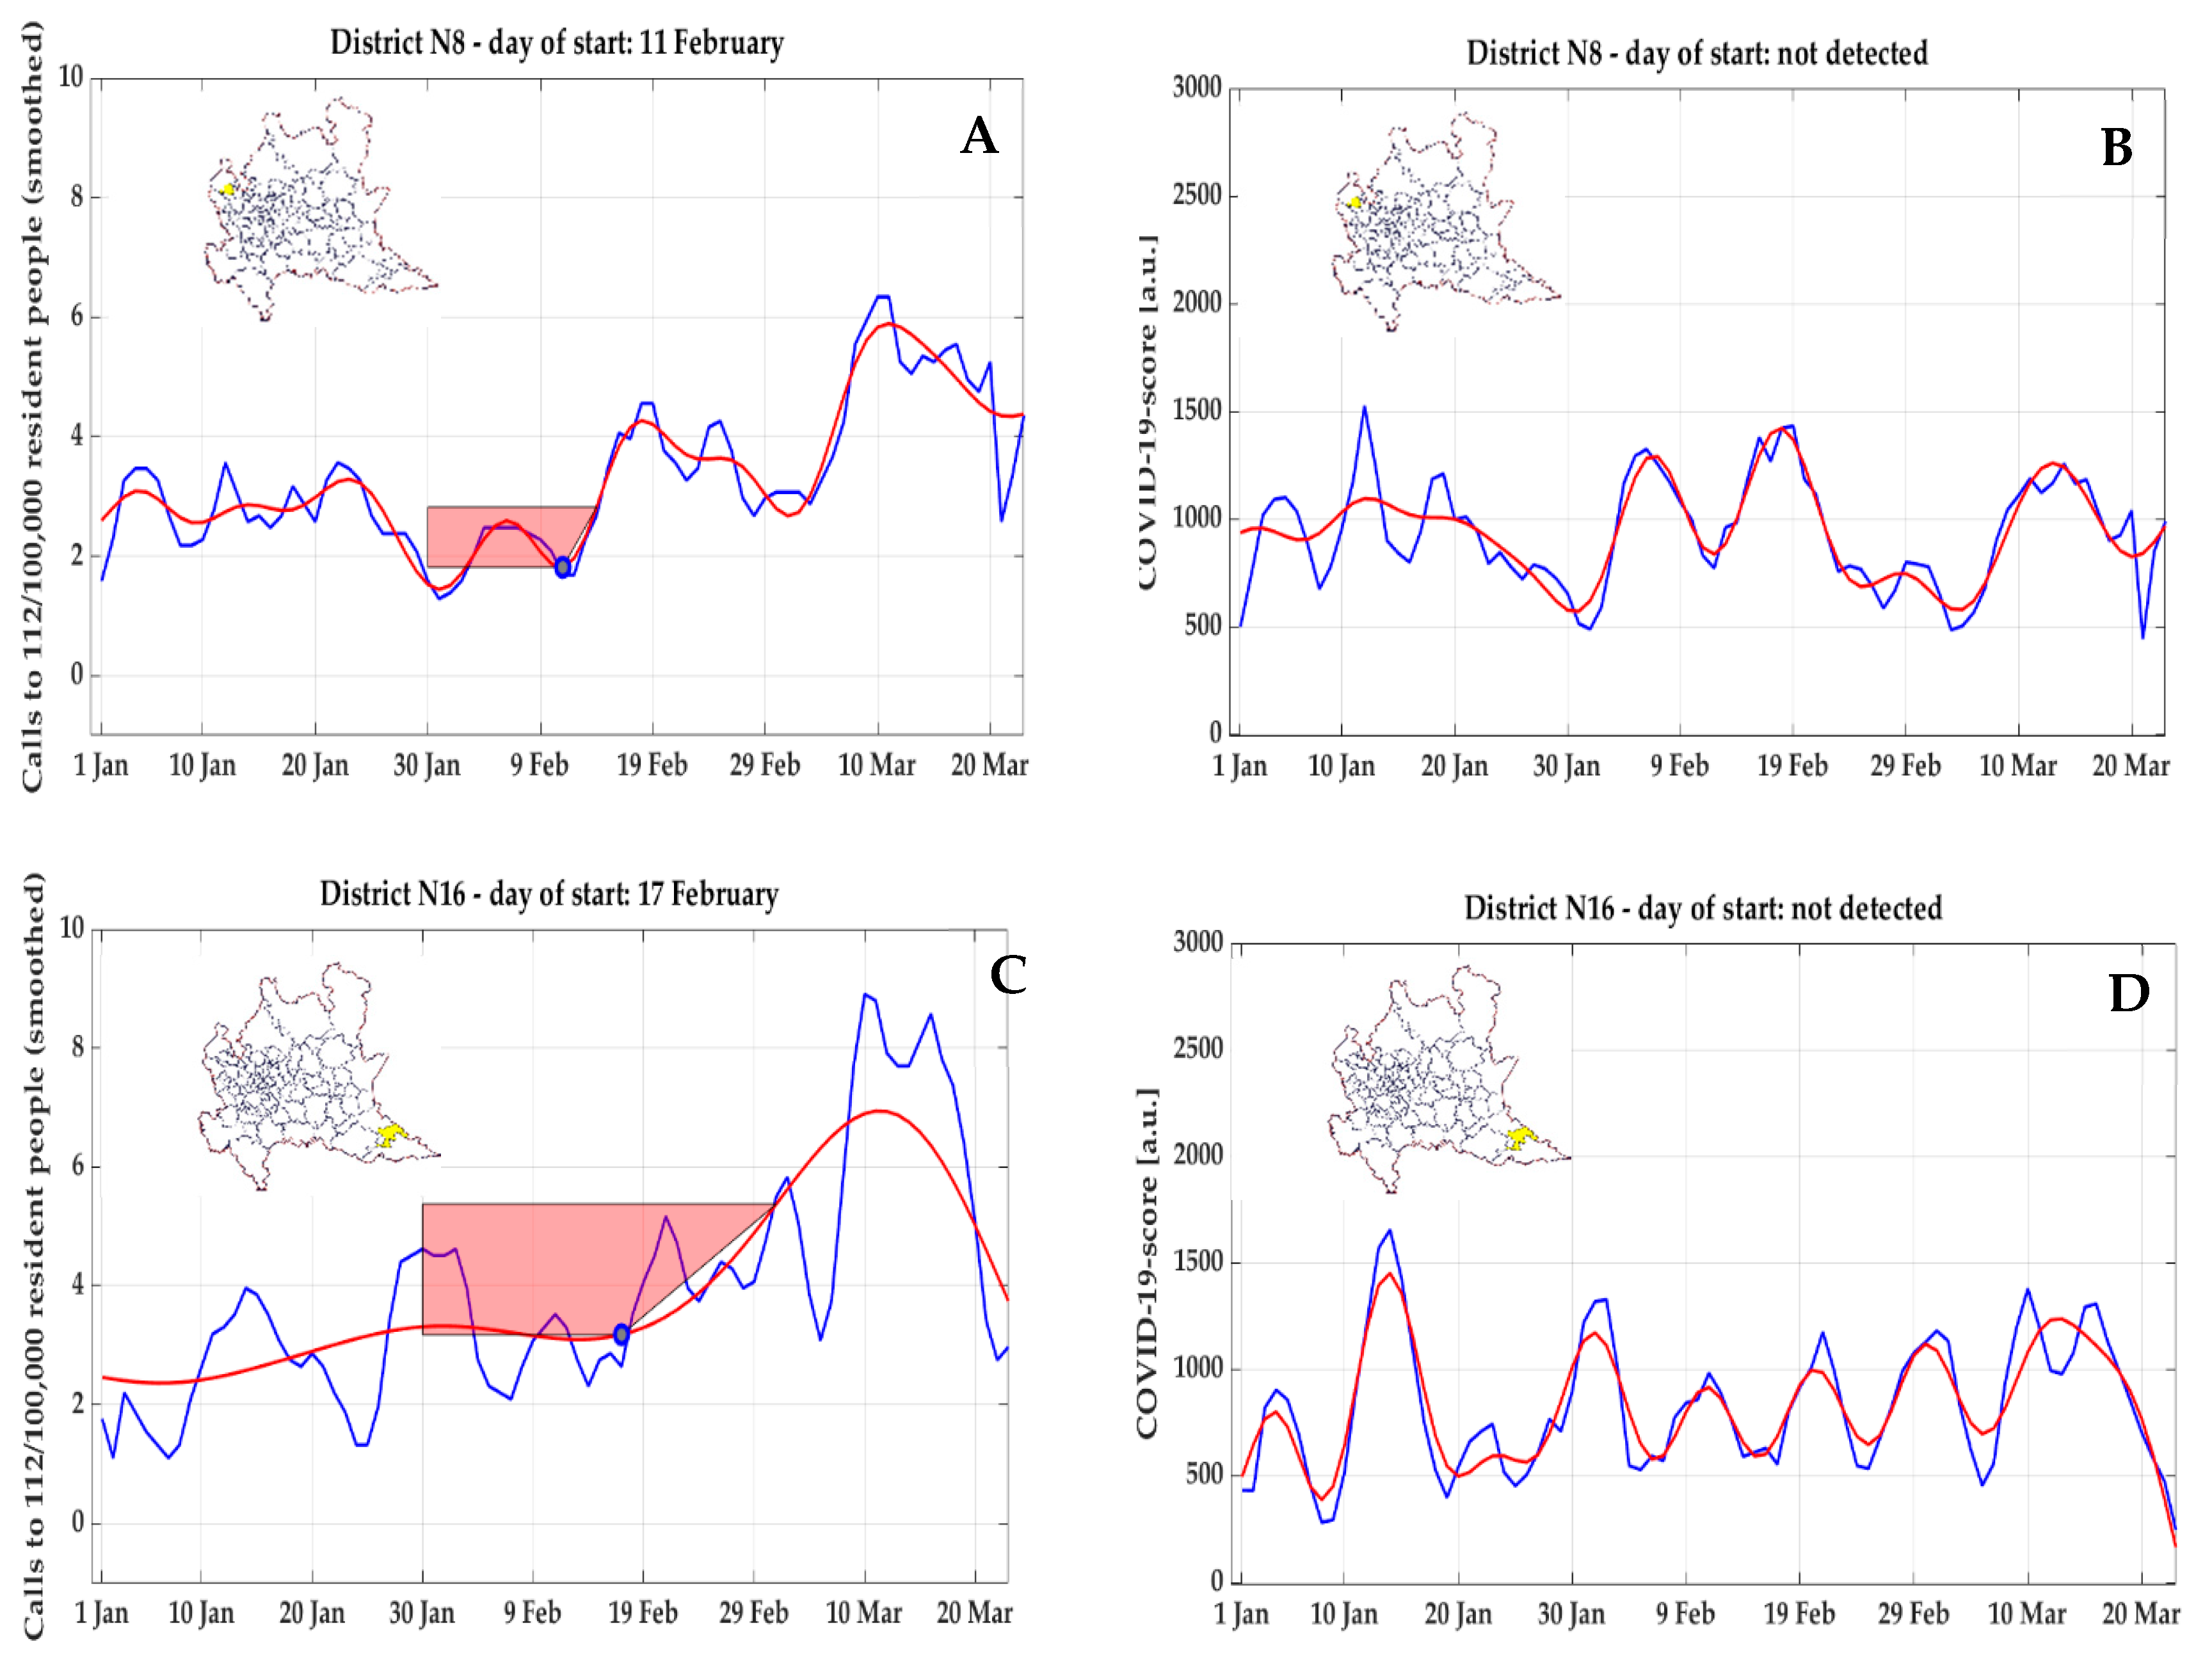
Also for NEC, a similarly anomalous trend, with a very early detected inflection point (11 February 2020), an early peak not followed by a clear exponential growth but followed instead by a decrease, and preceded by minimal values, was observed for cluster #8 (
Figure 13A) and cluster #16 (
Figure 13C); in both clusters, these early start days were not confirmed by COVID-19 score (
Figure 13B,D), where a start day
could not be detected.
3. Discussion
In this work, a novel approach, in the absence of accurate and complete data on positive cases over time, was proposed to obtain an estimate of the starting date of Covid-19 pandemic in clusters of at least 100,000 residents across the territory of the Lombardy region. The method was based on the analysis of daily georeferenced emergency calls to the unique emergency number 112 or of the following ambulance dispatches performed by AREU EMS, both relevant to respiratory issues.
Monitoring changes in healthcare utilization on a certain territory has been recently proposed as a key to interpret COVID-19 surveillance data, where ambulances dispatches were described as one of the possible indicators to be taken into account (yet, not developing a methodology in detail) [
12]. The need for using alternative and citizens-driven data sources has been previously identified in relation to spatial analysis of COVID-19 [
14]—for example, in assessing the informative content of social media [
10,
12]. In this context, the calls to the 112 emergency phone number represent a pure citizen-driven parameter, while the EMS dispatches can be considered as the result of a filtering process of the calls by healthcare professionals.
The proposed framework addresses two very relevant issues that are highlighted in literature as potential barriers:
- (1)
Data availability: Official diagnoses are limited by testing capabilities and available resources, in particular in the first phase of the epidemic [
10] due to the novelty of the pathology, posing a strong limitation when used as input for spatiotemporal analyses [
9,
11,
31,
32]. By using calls to the emergency number 112 or the following ambulances dispatches, the need of having a massive testing capacity to detect an abrupt increase in possible positive COVID-19 patients is bypassed: these alternative data sources are collected daily, with no delays due to external structures and protocols (as positivity to tests), thus providing a daily updated reference for comparison. Moreover, this approach is patient-centric: it is the patient that, based on the perceived symptoms, calls the 112 number that, following a first phone interview to verify the patient’s symptoms, dispatches the ambulance. As both the emergency calls and the ambulance dispatches resulted, on a provincial level, highly correlated with the official casualties due to COVID-19, they can be considered as representative of the phenomenology of COVID-19 early diffusion on the Lombardy territory.
- (2)
Geographic granularity: a localized early response is vital in mitigating the effects of epidemics spreading [
13,
14] by implementing interventions tailored to specific territorial needs and allowing a more accurate optimization of available healthcare resources. The proposed framework gives important insight considering specific geographical areas with similar numbers of resident population, that could be further refined to better highlight specific locations at risk where to suggest early lock-down preventive measures. To obtain sufficient granularity, clusters of homogeneous resident population (around 100,000 citizens) where defined, as a compromise between spatial resolution and the need of having enough events to trigger a visible increase of cases in a specific cluster. To do so, an original method to aggregate municipalities was developed and applied.
For both the proposed indicators (emergency calls to 112 and ambulances dispatches), the spatiotemporal analysis was focused on the definition of the beginning of the pandemic diffusion, identified by searching for a change in the curve morphology (i.e., an inflection point) that could be detected as the initial increase in the corresponding data over time. To this goal, a signal processing method previously used to address a similar problem in biological data analysis, in which there is not a certainty on the desired initial point, was applied.
When considering the dispatched ambulances, the number, ageand gender of patients, compatible with the phenomenology of COVID-19, was taken into account by the computation of a specific COVID-10 score rather than considering the absolute number, thus resulting in a much more informative signal capable of capturing the evolution of the pandemic in those gender-related age ranges hit in larger numbers.
The proposed analysis was data-driven and had to deal with characteristic features due to specific events, such as the presence of a first peak in correspondence to the setting of the first localized lockdown on 24 February 2020, probably due to a first panic-induced response. In order to take into considerations exogenous causes with respect to the epidemic spreading in all the areas where this morphology was manually identified, a specific correction method based on exponential data fitting was introduced to avoid in such cases a morphology-related delayed detection.
Considering the effect due to the application of different geographic clustering, the method revealed different results; however, the error distribution according to the resident population in each municipality had a median (quantile 25%–quantile 75%) of one day (0, 2) for NEC and one day (0, 5) for COVID-19 score. Accordingly, the applied methodology could be considered sufficiently robust to spatial variations in the subdivision of the territory, and the proposed population-based clustering was preferred over the administrative one, as the statistical meaningfulness of the results strongly depends on the dimension (in terms of resident population) of the clusters, as evidenced by the higher number of curves classified as Class 4 (i.e., noise) using the AREU administrative clustering.
It is worth noticing that, on the base of NEC, no cluster resulted having a start day
later than 23 February 2020. As already discussed, emergency calls had a spike on 24 February 2020, date when the first localized lockdown was established, and, even if a correction was applied for the clusters showing this morphology, the raise in NEC was consistent everywhere in the following days, thus resulting in the identification of inflection points right before the first peak (as a matter of fact, the median value is 20 February 2020, the day before the first official diagnosis). However, this increase did not always correspond to an increase in ambulance dispatches, thus underlying the hypothesis that the increased number of calls was mostly due to psychological factors and fear induced by the broadcasted news. Therefore, despite the emergency calls constitute a larger dataset, which is easier to analyze, the psychological effects could generate false positives, as clearly happened for clusters #8 and #16 on the basis of the comparison with COVID-19 score time-series (
Figure 13). On the other hand, possible saturation in ambulance utilization due to high number of calls and reduced hospital capacity in accepting patients could have reduced or delayed the number of ambulance dispatches, thus underestimating the spread velocity of the epidemic.
Despite the emergency calls represent an unfiltered source of information, which resulted strongly correlated with the mortality and, given the large sample size, less affected by noise, in an attempt to retrospectively reconstruct the spatial-temporal diffusion of the epidemic, the database of ambulances dispatches, weighted according the age and gender of patients and thus generating a COVID-19 representative score, was also taken in account.
The proposed analysis identified a potential early starting day of the exponential curve that represents a stage of the epidemic where a complete and successful contact-tracing would not probably be possible anymore (also considering a mean time of incubation before symptoms of six days [
39]). Based on the obtained results, in order to control the epidemic, a full lockdown (proved to be an effective measure with strong time-dependency [
34,
40,
41,
42]) should have been implemented in the second week of February, whereas the first diagnosis only occurred one week later, and an extensive lockdown (including the whole Lombardy region) followed on 9 March 2020 (i.e., with almost one month of delay). Moreover, based on our results, the first localized lockdown around the area of Codogno (including other 10 municipalities nearby) set starting 24 February 2020 was highly undersized, as at that date, 56 of the 77 considered clusters (72.73%) and 100% of the clusters appeared to be already in a stage of quick exponential growth, respectively, according to COVID-19 score and NEC time series, which is in agreement with other observations and hypotheses, thus providing a possible explanation about the failure of the first containment measures.
Based on our results, the spread of the epidemic was not uniform across the territory, with a starting day that varied from 14 February to 9 March 2020. This observation is in line with a key concept of modern spatial analysis, expressed by Escolano [
43] as “all objects (on the Earth’s surface) are related to each other, but the relationships are more intense among the better connected objects regardless of their proximity,” whose applicability to the COVID-19 pandemic was already proposed [
18,
44].
Areas with an early start (
Figure 10 and
Figure 11) registered a very high number of ambulances dispatches for patients of age and gender typical of COVID-19 (more males and younger than usual), represented by the computed COVID-19 score. Areas with delayed start mostly had lower levels of COVID-19 score, except an extended area (province of Brescia) characterized by medium-high peak values. Anyway, there were some areas with early start day that did not show a following phase of strong exponential growth (
Figure 12). These curves are of dubious interpretation, since in all other areas with an early start day
, a consistent exponential growth was observed to immediately follow, with high peaks reached. The hypothesis of a panic-induced and therefore false-positive first peak can be discarded since the growth began earlier than the first diagnosis (21 February 2020). Possible explaining hypotheses are the following:
It was caused by a COVID-19 outbreak that, for unknown reasons, did not cause an exponential growth of cases; this hypothesis is however in contrast with what was observed in other areas.
It was caused by respiratory issues of different origin with a phenomenology (age and gender of the patients) similar to that of COVID-19; however, in this case, the coincidence seems to be far-fetched.
A random decrease in ambulances dispatches right before the beginning of COVID-19 epidemic (observed in all the three clusters) caused an increase in the following days, which resulted super-imposed to the first cases of COVID-19 and enhanced their effect, leading to a first peak generated by a combination of the two events.
Unfortunately, the available information is not enough to assess the cause of this anomaly, and a deeper analysis, eventually corroborated by additional medical data from hospitals in the areas, would be needed to find a possible explanation. From these discrepancies between NEC and COVID-19 score, additional criteria based on the combination (or mutual correspondence) between the results of these two indices should be implemented, to filter out possible artefacts.
It is interesting to observe, as discussed in the results, that the large urban centers (such as the towns of Bergamo and Brescia) were affected later and less by the epidemic, which could be unexpected considering that a higher residential density is associated with higher crowding of public places and a larger use of public transportation, representing significant risk factors for the diffusion of respiratory viruses. The causes of this trend are unknown and would require further investigations.
Besides determining the best choice between the proposed data sources, the aim of this study was to highlight their potential in being used as input for indirect evaluation of the temporal evolution of the pandemic, leaving to future studies on prospective data the comparison of their results in the assessment of sensitivity and accuracy, separately or in combination.
The main limitations of this study are relevant to:
The identification of the different signal morphologies, which implied a different processing of data: the use of two different signals in the analysis (NEC and COVID-19 score) with their specific characteristics prevented the use of simple thresholding methods. For this reason, at the current stage, considering the limited number of clusters analyzed, the morphology classification of the resulting time-series was performed manually.
Validation of the results: the applied method was aimed at inferring a part of information that was not available elsewhere (start day of the exponential growth of epidemic spreading), and it was therefore impossible to validate the developed methodology against a gold standard. To minimize this limitation, both NEC and COVID-19 were proposed, thus obtaining a possible cross-comparison between their results.
Effect of geographical clustering: the obtained results appeared dependent (hence slightly) from the method used to create the clusters. However, a full validation would require comparison with different criteria resulting in clusters of similar number of residents, to overcome potential differences caused by limited number of events in clusters resulting in lower signal-to-noise ratio in the obtained time series.
Discrepancies in the availability and management of healthcare resources: although AREU is the manager and provider of EMS for all Lombardy, the distribution of the resources (especially ambulances) can be affected by local availability, as they strongly rely on the contribution of volunteers and private associations. Moreover, the unprecedented emergency in the early stages of the pandemic forced a rapid response and a deep re-organization of protocols at the local level, before the establishment of centralized directives. In the proposed framework, the demand for EMS was analyzed in detail with high geographical granularity, but the spatial differences of service availability were not taken into account; this approximation was anyway considered acceptable as the target of the study was the identification of a starting point, hence preceding the eventual saturation of availability.

 ,
, 


