Seeing Climate Change: A Framework for Understanding Visualizations for Climate Adaptation

1
Department of Geography, University of Victoria, Victoria, BC V8P 5C2, Canada
2
Food and Agriculture Institute, University of the Fraser Valley, Abbotsford, BC V2S 7M8, Canada
*
Author to whom correspondence should be addressed.
ISPRS Int. J. Geo-Inf. 2020, 9(11), 644; https://0-doi-org.brum.beds.ac.uk/10.3390/ijgi9110644
Submission received: 26 August 2020
/
Revised: 11 October 2020
/
Accepted: 23 October 2020
/
Published: 29 October 2020
Abstract
:Climate change has resulted in the need for adaptation tools to provide stakeholders with the ability to respond to a broad range of potential impacts. Geovisualizations serve as powerful engagement tools due to their capacity in communicating complex climate data to various audiences. Studies have also shown a preference towards conveying climate data through geo-visual representations, to quickly present ideas rooted in geographical challenges and solutions. However, a rapid pace of technological advancements has paved the way for an abundance of geovisualization products that have eclipsed the necessary theoretical inquiry and knowledge required to establish effective visualization principles. This study addresses this research gap through a two-step process of (1) conducting a thorough review of the geovisualization for climate change literature, and (2) creating a conceptual framework that classifies existing geovisualization products into themes relating to visualization features, audiences, and the intended outcome or purpose of the visualization medium. The result is the Climate Visualizations for Adaptation Products (CVAP) framework, a tool for researchers and practitioners to use as a decision support system to discern an appropriate type of geovisualization product to implement within a specific use case or audience. Visualizations with more interactivity were favoured among expert user groups, to act as tools for knowledge discovery. This is contrary to the visualizations intended for communicating a known message to a user group, as those products often had a low level of interactivity associated with their use.
1. Introduction
Climate change has resulted in the need for adaptation tools to provide stakeholders with the ability to respond to a broad range of potential impacts [1]. The field of geovisualization has demonstrated the potential for providing cutting-edge tools for communicating scientific data on climate change and climate adaptation measures in use cases, such as engaging people with future climate scenarios [2], sea-level rise or flooding [3], and urban flood risk management [1]. Geovisualizations serve as powerful engagement tools due to their capacity in communicating complex climate data to layperson audiences and other stakeholders outside of the academic sector [4]. Studies have shown a preference towards conveying climate data through geo-visual representations, to quickly present ideas which are rooted in geographical challenges and solutions [5]. Furthermore, employing geovisualizations to convey the multi-faceted nature of spatially-explicit data has been observed as an effective method for engaging different audiences with both complex and unfamiliar datasets or information [6].
Scientists have been developing digital data archives since the 1940s with the emergence of electronic computers [7]. The rise of the digital data format has transformed research procedures by offering facilitation of rapid data transfer and sharing of information. This rapid pace of technological advancements has paved the way for an abundance of easily accessible geovisualization products that were previously only available to industry experts and professionals. Over several decades, geovisualizations have evolved into highly realistic, interactive (and in some cases immersive) digital environments that allow for greater data exploration capabilities and new knowledge discovery [8,9]. However, the expedited rate of geovisualization production and development has eclipsed the necessary theoretical inquiry and knowledge required to establish effective visualization principles [10,11].
The term “geovisualization” can refer to a broad range of visual representations of geographical features, trends, and phenomena [8]. It is used here to describe a device or a visual medium to digitally convey geographically accurate information or data to a user [12,13]. The topic of geovisualization pertains to the interdisciplinary field of research that is situated at the intersection of geography, visualization, computer science, communication, and cartography. This definition follows the work of Maceachren and Kraak [14], who state that “all mapping can be considered a kind of visualization … in the sense of making visible”. The word geovisualization implies a topic involving data which contains a spatial component or geographical significance, combined with visual cues or stimuli that are implemented in order to communicate a message.
Geovisualizations have been found useful for presenting and communicating spatial ideas that are rooted in geographical challenges and solutions. These tools have been found especially useful for enabling assessment and understanding of issues or changes to a real-world environment among diverse users due to their ability to connect with people’s sense of place and space [15]. Accordingly, geovisualizations have demonstrated promise as useful tools for applications such as land-use planning [12], property damage risk assessment [16], urban planning decision-making [17], sea level rise issues [18], flood risk management [19], and wildfire hazard exposure [5]. Yet, although geovisualizations have shown promise for supporting climate adaptation practices, challenges still remain in applying this research in real world circumstances. There is a tremendous diversity of what is considered to be a “geovisualization tool”, as well as the intended users and/or audiences for these tools. Due to the varied nature of the geovisualizations and a lack of systematic and empirical evaluations [12], it is often possible to encounter contradicting results regarding the most appropriate geovisualization to implement within a certain use-case, towards a target audience, or an intended purpose. For example, it is often believed that products with higher interactivity imply greater user information processing [4]; however, high interactivity can have be advantageous or disadvantageous for information uptake depending on factors such as the complexity of the data and user-friendliness of the interface [20,21] and the specific formula and approach for creating optimal communication tools have yet been entirely determined [8].
Research that assesses performance of spatial data infrastructure suggests that the selection of geovisualization tools needs to use indicators related to access, use, and sharing of spatial data, and these include efficiency and quality, flexibility and innovation, and transparency and reliability [22]. While such indicators may help some developers and users of these tools be more informed during the tool selection process, there remains a need for a framework that contextualizes the diversity, types, and the applications of geovisualizations in order to improve knowledge and gain a comprehensive perception on suitable approaches for using visual tools in climate adaption efforts.
This study addresses this research gap by creating a conceptual framework that classifies existing geovisualization products into themes relating to visualization features, audiences, and the intended outcome or purpose of the visualization medium. The result of this work is the Climate Visualizations for Adaptation Products (CVAP) framework, which is a tool for researchers and practitioners to be used as a decision tree or a decision support system to discern the type of geovisualization product that is most appropriate to implement within a specific use case or audience. The following section presents the methods used in this research, namely a structured literature review use to develop, test, refine, and finalize the CVAP framework. Then, the paper presents the finalized version of CVAP, and it discusses how the framework can be applied to increase the comprehension of a geovisualization product. Finally, the paper discusses what CVAP has revealed about how geovisualizations can be used for climate adaption planning in different contexts, and it concludes with recommendations for further research. The overall goal of the framework is for it to be used as a tool for researchers and practitioners to use as a decision support system to discern an appropriate type of geovisualization product to implement within a specific use case or audience.
2. Materials and Methods
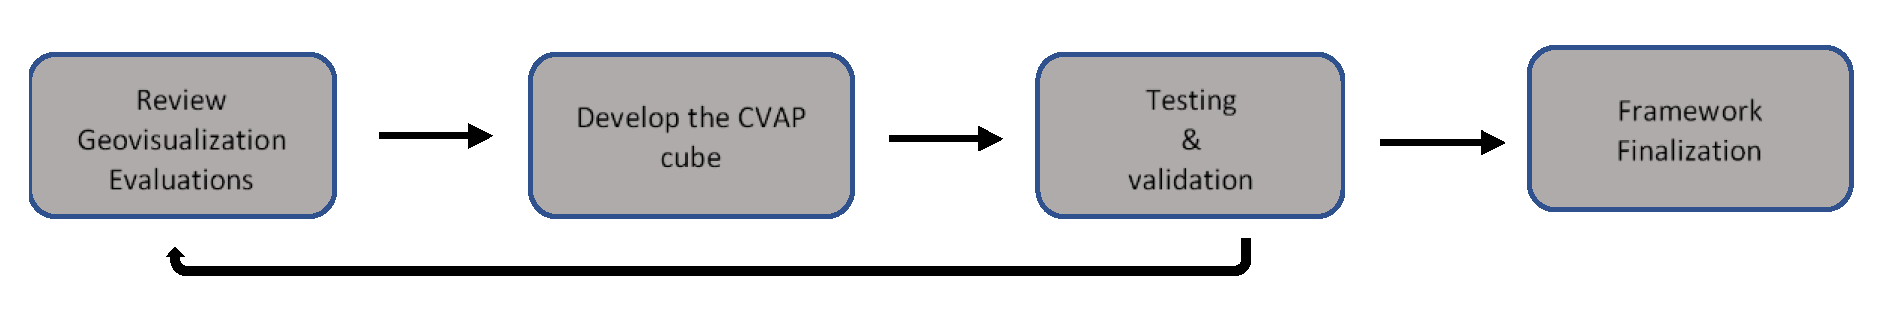
This research follows a two-stage process. First, a structured literature review was employed that examines the work related to the topics of visualization and geovisualization, climate adaptation strategies, and public and stakeholder engagement. Second, the literature review was then used to inform the qualitative development of a framework for classifying geovisualizations, referred to here as the Climate Visualizations for Adaptation Products (CVAP) framework. This translated into a 3D cube that provides a means for organizing visualizations along axes in terms of types, application, and intended audience for the tools, similar in its manner to MacEachren and Kraak [14] and Bohman et al. [16]. Initial versions of the framework were created and subsequently tested by populating them with geovisualization products that were developed and examined in previous research. CVAP was refined after several iterations of this process by evaluating its effectiveness at representing the various considerations that go into selecting and using geovisualization tools. Figure 1 illustrates the workflow pipeline of the steps involved in this research, and these are described in further detail in the subsequent sections.
2.1. Literature Review of Existing Geovisualization Frameworks
A structured literature review was performed between May and August, 2019 of frameworks pertaining to the topics of geovisualization, climate adaptation planning, and/or public and stakeholder engagement. These three topics were used to structure the literature review, as they all relate to the necessity of developing effective planning tools for climate adaptation. These topics together are consistently identified in the academic literature when examining research focused on managing solutions for mitigating climate change risks. This is a challenge as stakeholders, researchers, and members of the general public often have different perceptions of the most appropriate measures to implement in order to prepare for the potential impacts of climate change. The literature review was framed by searching multiple university search engines (e.g., Web of Science) and Google using the following keywords: geovisualization, visualization, climate framework, climate change, climate adaptation, public engagement, landscape planning, geographic information systems (GIS), landscape adaptation, landscape visualization, spatial decision support system, and risk mitigation. These were selected based on their relevance to the aspect of visually communicating or presenting geospatial data in an appropriate manner or format to a user.
The process entailed evaluating existing frameworks to extract relevant and meaningful aspects of the research, which were subsequently used to create CVAP.
2.2. Development of CVAP
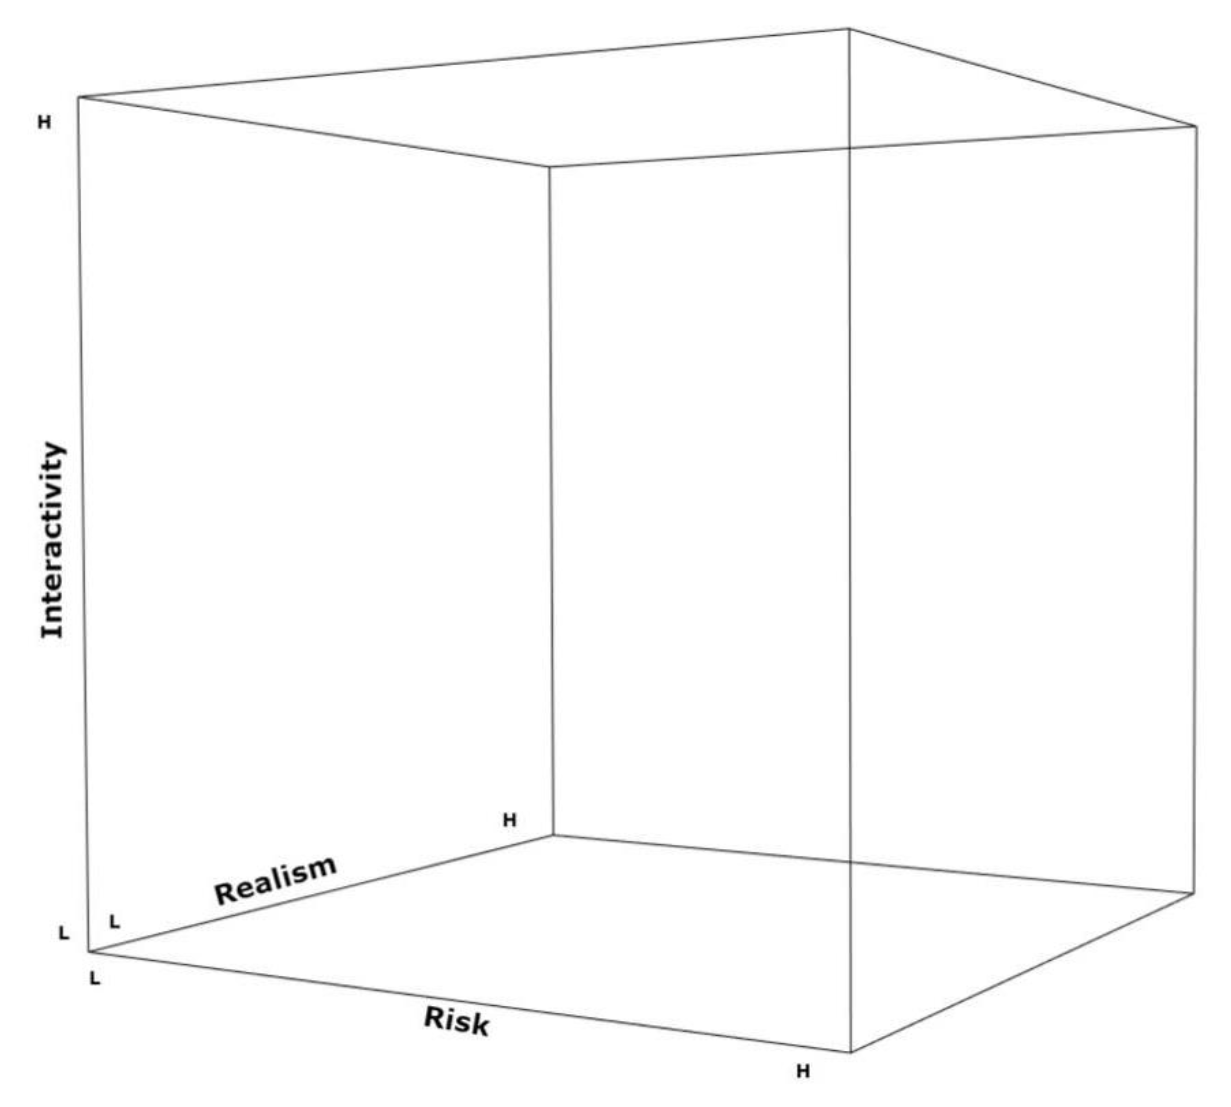
The CVAP cube is a visual framework developed for understanding different types and applications of geovisualizations for climate adaptation. The included axes were derived from recurrent and salient themes such as amount of interactivity [6,12,13,16], realism [9,13,23], and level of risk [4,6,12,13,22,24] associated with the type of impact resulting from the decision-making process. A cube shape was chosen for the framework representation because of its capacity to represent the interaction of three axes and thusly provide interconnected considerations on how climate change visualizations are developed and used.
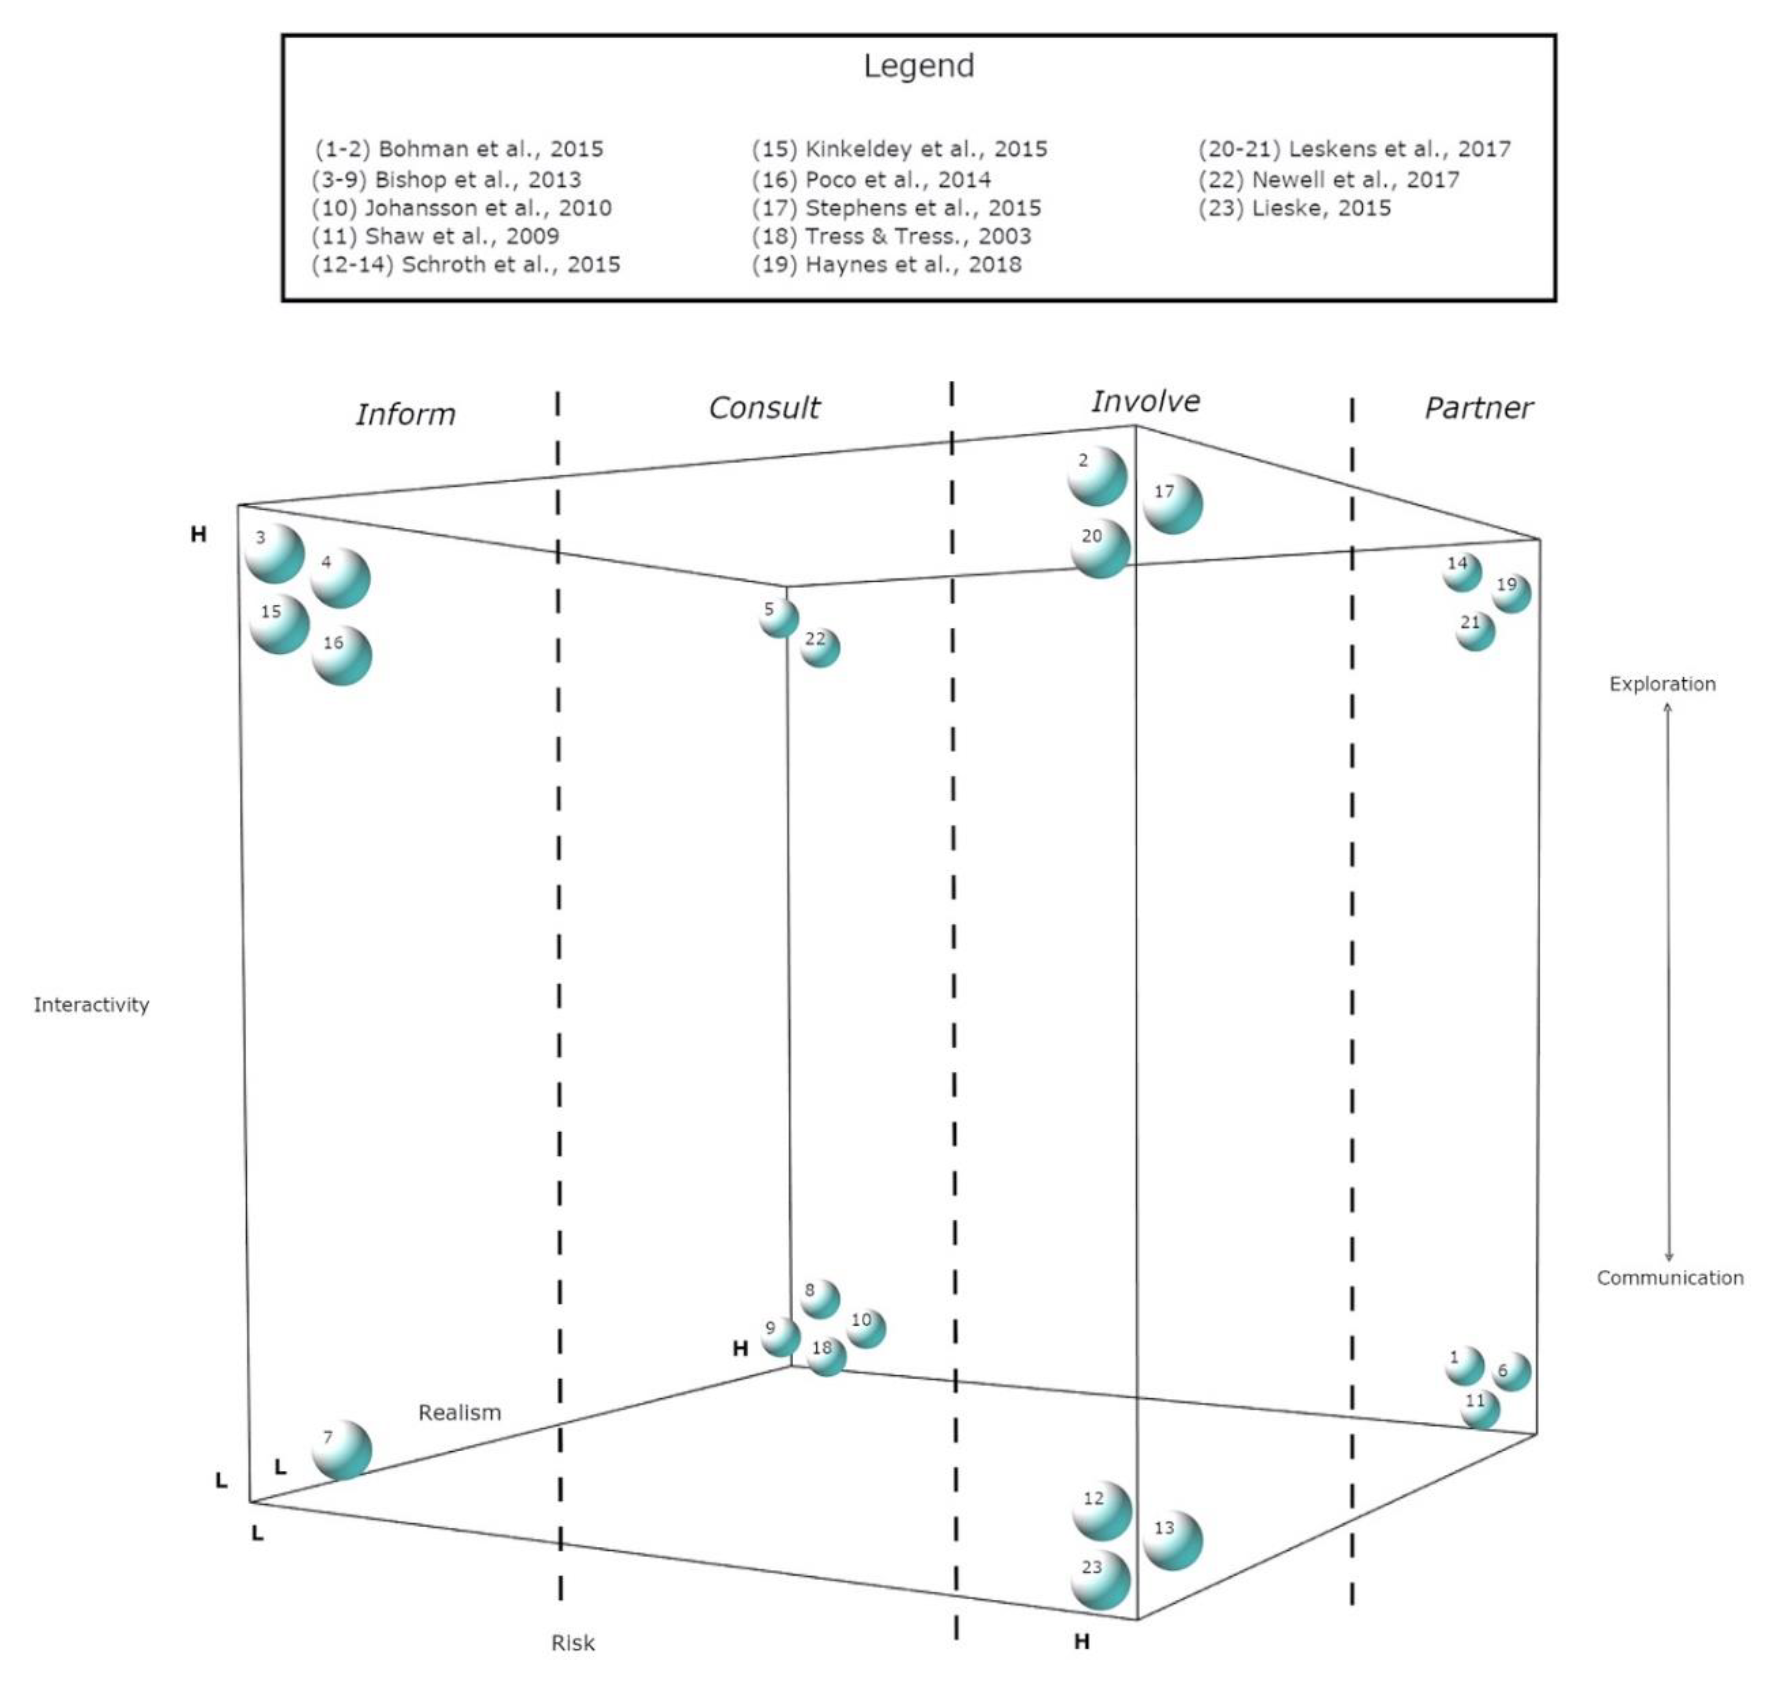
The design of the CVAP framework was informed by previous work on visualization concepts and best practices such as the amount interactivity available to a user [4], the level of abstraction versus realism depicted [2], communicating potential risk [25], and the general objective of geovisualizations as tools that represent geographical information [14,16]. Populating the CVAP cube was achieved by reviewing literature that analyzed or evaluated existing geovisualizations. The geovisualizations that were included in CVAP are represented as spheres inside the dimensions of the cube. Each geovisualization product was analyzed, with special focus directed towards the amount of interactivity, risk, and realism associated with the geovisualization. They were then compared amongst themselves, and during this stage each visualization product was assigned a relative value of “Lower” or “Higher” based on the amount of interactivity, risk, and realism associated with the geovisualization. This was a relative comparison performed amongst only the geovisualizations included in CVAP. This process resulted in the formation of clusters which capture geovisualizations with similar qualities. Finally, the applicability of the cube was evaluated by examining whether the included geovisualization products fit into relevant categories based on the intended purpose they achieved and an appropriate type of audience for which the visualizations are suited. This stage indicated whether the chosen parameters for the model were indeed appropriately selected.
3. Results
3.1. Literature Review Findings
The results of the literature review that contributed to the development of CVAP are summarized in Table 1, organized by the review of the important and shared characteristics between geovisualization, climate adaptation planning, and public and stakeholder engagement. For the purpose of this study, risk refers to the type of decision being made for which a geovizualization is employed. A high rating of risk refers to a scenario in which geovisualization tools are used to support decision-making associated with significant implications towards the well-being of communities (and human life), environmental systems, or public infrastructure. A lower risk rating implies a scenario in which the tool is used for decisions that have a less significant impact on property loss or do not pose a great hazard to someone’s safety. A higher amount of interactivity implies that users are able to choose options such as varying zoom levels, active data layer visibility, and panning and navigating imagery. Products with lower interactivity include visualizations like conventional maps and other static imagery. The final axis included in the CVAP cube is a rating of realism, which refers to whether the visualization presents the spatial information in an abstract, or highly realistic, form.
The Map Use Cube (MUC) created by Maceachren and Kraak [14] and further refined by Bohman et al. [16] provided a basis for structuring a representation of a geovisualization framework and classification tool. The MUC is two decades old and thus may not be entirely relevant to current technological capabilities. CVAP assumes the same shape as the MUC and shares a common axis (interactivity); the remaining parameters have been adapted from the other research listed in Table 1.
Grainger et al. [4] developed a design framework for facilitating effective communication of scientists and researchers with individuals outside of academic and scientific sectors. They found that the maximum amount of information uptake with regard to climate data occurs within a highly interactive visualization environment. Their work informed the development of the CVAP framework by providing insight on the role of interactivity in developing effective types of geovisualizations for communicating climate data across many disciplines.
Bishop et al. [2] evaluated several climate change visualization products that were focused on a coastal region in Southwestern Australia. The geovisualizations ranged from static, low risk scenarios that imply low to non-existent risk of life loss, property damage, or serious environmental consequences, all the way to interactive, realistic, and high consequential visualizations, that represent situations and decisions with severe environmental consequences, public infrastructure damage and risk of human life loss. This work provides a consensus that geovisualizations aid in communicating information, with an integral component consisting of evaluating the degree to which a geovisualization was able to achieve effective communication of data to a user. Although they did not compare the techniques to one another in order to state one type is “better” than the other, their work demonstrated that the range of realism (or abstraction) present in the geovisualizations can influence how people engage with and use the tools.
Glaas et al. [25] focused on the ability visualizations have for influencing Nordic homeowners’ perception of the risks (and extent thereof) to which their houses are susceptible to hazards brought on by climate change. This message is necessary to convey to homeowners as they are significant stakeholders within the realm of climate adaptation with regard to fortifying their homes from inclement climatic events. Most importantly, a lack of risk perception possessed by the residents can hinder their climate adaptation strategies. A salient theme within this work centered on risk, and the impacts this can have on reactions toward and levels of understanding of climate change. Therefore, risk was chosen as one of the factors in CVAP.
Robinson [26] provided a framework for understanding different approaches to community engagement in their work on waste management planning and decision-making in Western Australia. This work is relevant to CVAP as the research revolves around the importance of public participation in environmental decision-making. Robinson [26] compared the inherent risk of a situation with the complexity of information presented to the audience, to visualize various public engagement methods. In addition, they created themes that classified the different engagement methods within the Community Involvement Matrix: inform, consult, involve, and partner, and these are used in this research as a lens for interpreting the results of this study and CVAP application (see Section 4. Discussion).
3.2. The CVAP Framework
Based on the literature review, the properties defined for the CVAP framework were: risk [3,27,28], realism [1,2,13], and interactivity [1,4,10,12,16]. These properties have been found to have effects on the overall impression or purpose of a particular geovisualization product as based on research; however, previous studies have not yet considered all three of these characteristics together in concert. The three aforementioned parameters of interactivity, realism, and risk comprise the axes of CVAP (Figure 2).
In this research, traditional 2D maps were considered as abstract geovisualizations since they do not provide the necessary details for the user to feel immersed (i.e., as if they are actually present in the depicted place). Visualizations were classified as highly realistic when they contained elements that accurately represented real-world objects and entities and contributed to user impressions that they were viewing a scene or scenario as it would be in real life.
3.3. Applying CVAP
Studies that contributed to the testing and refinement of the CVAP process are listed in Table 2 and organized by the themes of the review topics. The thematic relevance of each project identifies how the work contributed to the formation of CVAP. The geovisualizations included in the newly developed framework all contained a user evaluation and/or usability testing component with regard to achieving a specific objective and use case, or targeting a distinct audience. Some rows included in the table represent multiple geovisualization products comprised in the CVAP framework, as the specified research analyzed more than one version or type of geovisualization (e.g., Bishop et al. [2]; Schroth et al., 2015). Products were ranked relative to one another along the three axes and were assessed on binary scales consisting of either a lower or higher rating for each of the chosen parameters. In ranking them relative to one another, decisions were made as to where the authors concluded, based on their prior expertise, the products aligned along the axes. This process resulted in the organization of geovisualizations into clusters or groups with similarities in terms of the features of the tools and how they are used.
Clustering can be found in the corners of the CVAP (Figure 3), as these areas represent the higher/lower polarization of geovisualization characteristics captured through the axes. The left-most corner on the bottom plane of the cube is the only junction where all three parameters are defined as lower. The remaining three corners on the bottom of the plane of the cube all share the same lower rating of interactivity present within the geovisualization. As we move up along the interactivity axis towards the topmost plane, there are increases in the degree to which users can interact with the geovisualization tool for engaging in data exploration. An increased value on the risk axis implies an increase in the risk rating of a visualization (i.e., consequences that may result in loss of human life, severe public infrastructure damage, and/or large-scale environmental impacts), and all the products that are nearest the right most, front facing plane of the cube share the increased rating of a higher risk implication. Finally, as we move along the realism axis towards the back of the cube, the visualizations with increased realism are situated along the rear plane. This implies that the examples located in the foreground of the cube are visualizations that exhibit abstract characteristics and are therefore considered to be less realistic. The visualizations that are considered abstract may display data in formats such as tables, graphs, and two dimensional (vector and/or raster) maps. This is contrary to realistic geovisualizations, which attempt to provide the highest level of authenticity through convincing imagery such as three-dimensional rendering or visualizations containing a high level of detail (i.e., sounds and textures).
3.4. Applying Engagement Themes
Each of the clusters of visualizations in CVAP aligned with themes of public engagement and visualization communications that have been, respectively, described by Robinson [26] and Bohman et al. [16]. Robinson’s community involvement matrix compared the inherent risk of a situation with the complexity of information being presented to the audience, to create a mapping of potential engagement processes that could be implemented in a specific situation. The four themes (or categories of engagement strategies) that Robinson [26] coined were: inform, consult, involve, and partner. These themes are denoted in the framework via dotted lines separating CVAP into four distinct sections. The regions and clustering within CVAP align with these themes, for example, inform-type geovisualizations were found at the lower end of the risk spectrum and partner-type tools at the high end of the risk spectrum. One of the alterations that Bohman et al. [16] applied to the Maceachren and Kraak [14] Map Use Cube was the addition of a communication to exploration spectrum that runs diagonally through the model. Bohman et al. [16] also illustrated the lower amount of human and system interaction as primarily intended for the communication of predefined information, and the increased level of interaction with the goal of facilitating new knowledge discovery (discerning unknown patterns and relationships within the data). Hildebrandt and Döllner [29] also associated an increased level of interactivity within a spatial visualization as a technique intended for exploration by allowing a client the capability of rotating and moving the view-point camera (point of view perspective of the user). This allowed the user to utilize the application to “show me something else”, creating opportunities for discerning other information, rather than simply receiving a predefined message or piece of information from the developer of the product.
When considering the Bohman et al. [16] spectrum and [26] engagement themes in the context of CVAP, eight distinct categories can be seen observed, and the clusters fall into ranges from Inform & Communicate all the way up to Partner & Explore. The categories are discussed further below, and are organized using Robinson’s [26] themes as subsections with discussion on Bohman et al.’s [16] Communicate and Explore variants in each section.
3.4.1. Inform
The Inform theme contains geovisualization tools that are used to support decisions associated with lower risk in terms of outcomes and impacts. Examples in the Communication region include 2D Projected Land Suitability maps illustrating four crop types projected for the years of 2010 and 2070 [2]. This type of visualization was used to present rather than produce research findings. Since an error in the crop suitability map does not imply direct human casualties or substantial property/infrastructure damage, this visualization is deemed as low risk.
Other low risk visualizations within the inform category contain a higher element of interactivity; therefore, they are situated in the Explore region of the cube. These visualizations included the ICchange prototype [30], the SimilarityExplorer [31], and Visual Exploration Interfaces (VEI) with an embedded Google Earth Application Programming Interface (API) [2]. The visualizations evaluated by Bishop et al. [2] both centered on rainfall and temperature change projections (agricultural purposes); however, they provided the user with more opportunity to interact with the presented data, thus situating the products near the Exploration end of the spectrum. This is the same for both the geovisualizations evaluated by Poco et al. [31] and Kinkeldey et al. [30], as they provided functionality such as allowing the user to filter the level of uncertainty in the land cover change predictions (ICchange), as well as prediction models, variables, and time resolution (SimilarityExplorer).
3.4.2. Consult
An increase in Realism in the geovisualizations results in products that are more strongly related to the Consult theme. The lower portion of this theme contains visualizations with less interactivity available to the user comprised of a visualization evaluated by Bishop et al. [2], the WorldView Project [32], and a photorealistic tool that demonstrated potential land use changes in the Danish countryside [33]. These visualization products all had a high aspect of realism and were used during circumstances which did not risk loss of life or vital public infrastructure. These tools were designed to communicate pre-constructed scenarios towards a greater audience to facilitate discussion and solicit thoughts and opinions on said scenarios; therefore, the geovisualizations were intended to be used by planners to consult with stakeholders regarding the future land use options such as farming, tourism, conservation efforts, or residential development. The WorldView Project presented global as well as regional effects of climate such as temperature, sea level rise, and loss of arctic sea ice cover [32]. The evaluation asked participants about the relevance of the presentation as well as ease of understanding of the presented data. Furthermore, the authors of [15] used a realistic and highly interactive geovisualization to model a coastal environment in order to familiarize users with the region. The software allowed stakeholders and local residents to apply different park management scenarios to the simulation, such as fencing (location, length, material) and boat mooring regulations (distance from shore, restricted number of vessels). The participants were then able to virtually “walk” around the area from a first-person point of view using the arrow keys on a keyboard, to preview what sort of impact the different park management scenarios would entail on the area. With this capability, the users were able to determine which management plan they believed to be most appropriate to enforce, as the amount of realism within the geovisualization contributed to their sense of place and understanding of the environment [15].
3.4.3. Involve
The Involve theme of the CVAP cube encompasses visualizations that were all used for decision-making that contained a higher amount of potential risk to property, infrastructure, or human health/lives. This includes the Community Adaptation Viewer [27], a spatial decision support system intended to implement pro-active community adaptation strategies for both home-owners and renters, in order to reduce their vulnerability to tidal forces. There was minimal interactivity present within the product; therefore, it falls within the Communicate end of the spectrum. This visualization was successful at both engaging the community and also communicating to the residents their personal level of susceptibility to the risk of local dyke failure, and the influence of climate change on the frequency and severity of storms. Another example of community involvement was exhibited within the Kimberley Climate Adaptation Project (KCAP), an initiative which focused on community adaptation to climate change impact at the local level [5]. The authors found that in certain cases, “traditional” methods of presentation (such as posters, and over-head slideshows) were successful at communicating a message in real-world settings, such as an open house, or in order to reach less technologically advanced individuals and stakeholders. Increased interactivity leads to visualization that can serve as a tool for data exploration, such as ViewExposed [34]. ViewExposed was developed as a means to involve local authorities with planning a response to natural disasters caused by climate change, by identifying the most vulnerable regions. A usability evaluation indicated that users of ViewExposed considered it to be a valuable tool for collecting and viewing complex data sets and would prefer to have even more interactivity functions available with the data, such as the capability to upload personal databases (e.g., natural hazards data).
Two more visualizations located in the Involve–Explore region are both related to sea level rise. One of these was developed by [21], who evaluated the effectiveness of the communicative ability of an interactive sea-level rise viewer designed to allow coastal resource managers to support their decision-making process regarding ecological changes such as marsh migration, infrastructure addition, and general communication regarding the dynamics of sea level rise. Participants responded positively to the ease of use of the application, and all were able to complete the specified tasks as well as correctly respond to the questions posed during the evaluation. Some participants found that the ability to select and view multiple data layers at the same time was difficult to understand, which implies that increased interactivity does not always correlate with improved tool performance.
Another sea level rise geovisualization was studied by Leskens et al. [1], who compared two versions of a tool intended to demonstrate the risk of coastal flooding in urban regions, which are, a two-dimensional and a three-dimensional versions of the same visualization. Since the 3D rendering of the visualization contained an increased amount of realism with regard to the two-dimensional version, that product was placed within the Partnering theme of the framework while the 2D version is situated within the Involve theme. A user study conducted with non-domain experts indicated that participant’s sentiments were split half and half between the 2D and 3D versions of the tool for the purpose of estimating whether an evacuation order is necessary for a region when presented with appropriate data. Due to the complexity of information being presented, the flood risk visualizations are placed closer towards the Exploration end of the spectrum in the CVAP cube. A case study was conducted with practitioners and flood model experts to assess the level of product accessibility amongst an expert crowd. In this case, the 3D version was considered beneficial over its 2D alternative for several reasons including better inundation estimates, which ultimately leads to improved decision-making during a time of crisis. With the 3D version, participants of this session were also able to propose various adaptation measures for different stakeholder groups to mitigate disaster impacts. This indicates that both dimensionalities of the product were successful at visually communicating coastal flood risks to the user; however, the 3D version was more effective with experts due to the complexity of information and the increased level of realism allowing for greater data exploration capabilities. This allowed different stakeholders (i.e., provincial and municipal governments, companies, residents) to form a partnering relationship and work together to ensure community resilience in the wake of climate change.
3.4.4. Partner
Partnering tools include realistic visualizations with a high level of inherent risk present in the decision-making process. Visualizations intended for communicative purposes (less interaction available to the user) include the Local Climate Change Visioning Project (LCCVP) [18] and VisAdapt [16]. As stated by Bohman, VisAdapt had significantly less interactivity present (when compared to its counterpart ViewExposed) and was better employed for presenting already known information. VisAdapt can also be used by private property owners to determine strategies for rendering their residence more resilient against climatic exposure, thus making them partners with other stakeholder and community leaders. This is similar to what was observed within the LCCVP, where a participatory approach with a coastal community focused on increasing community resilience with regard to rising sea levels and the risk to their property. This type of visualization was successful in creating a partner-like relationship between decision-makers and stakeholders.
Visualizations with increased interactivity, which are intended for partnering, feature more exploratory capabilities. These can be useful in situations where the answer to a particular problem may have multiple possible solutions, and those solutions are not easily apparent and require discussion to reach an appropriate consensus. Examples of such visualizations include a Mobile Augmented Reality (MAR) tool for flood visualization [19], a 3D coastal flooding risk tool [1], and a virtual globe tool implemented for KCAP [5]. The MAR tool was intended as a supplementary application to existing flood risk management tools, in order to aid the comprehension of inundation maps by industry experts. The results indicated that the participants found the application mostly easy to understand and rated it as useful for emergency services. Such a tool could be passed onto local community leaders for the purposes of community resilience, thus positioning them as partners with larger governmental sectors in charge of resource distribution and planning. The 3D version of the urban flooding visualization [1] was preferred by the majority of participants as best suited for estimating the damage to houses, and as the most suited tool for estimating life loss. Similar to the previous example, this type of visualization would be appropriate for local community adaptation planning, and to form a partnering relationship between stakeholders at both smaller and larger scales. This would facilitate rapid communication and sensible resource dispersal, ensuring that the regions and people in need of the most assistance would receive it first.
The virtual globe geovisualization presented in the KCAP [5] was intended to effectively increase awareness and the understanding of the risks and impacts of effects brought on by climate change. It was interesting to discover that this format, which provided the highest degree of user interactivity and realism (evaluated within Schroth et al.’s study), was deemed as an ineffective and an unreliable source of information by some participants of the study. This could have been caused in part by pre-dispositioned attitudes of certain participants, lack of technological ability, or perhaps a shortcoming in the presentation format itself as technical glitches were reported during the demonstration process. However, this again draws attention to the fact that creating an effective geovisualization product does not directly imply generating the highest amount of interactivity and realism present within the product; rather, this should be decided on by a case-by-case situational basis.
4. Discussion
This study sought an in-depth understanding of the current state of effective geovisualization approaches in order to advance research in this area and assist practitioners in harnessing technological opportunities. The CVAP framework that was developed during this project can catalyze further research and practices for effectively developing and using platforms for academic, stakeholder, and practitioner groups to communicate, interact, and engage with spatial data. The research is built upon the Map Use Cube [14], among other work, in order to update the original framework for modern technologies. With this modernized framework, researchers and practitioners can understand the preferred methods of visual communication for different user groups and/or the intentions for a specific purpose or circumstance.
4.1. Challenges and Opportunities around Classifying Geovisualizations
It is necessary to acknowledge a specific difference between interactive and immersive visualization. Certain differences in the visualizations proved to be difficult to discern since the formation of the CVAP was a qualitative process. Such issues were observed when classifying the WorldView product [32], which is an immersive dome-shaped chamber environment with realistic qualities. This geovisualization took participants on a journey, showing them local and global effects of climate change; however, in CVAP, this product was ranked as having lower interactivity. This is because even though the participants were provided with a realistic geovisualization that gave a 360° view of the landscape, there was little to no user interaction with the data, such as selecting custom data layers or the availability of zoom and pan functionality. This sort of difference between immersive and interactive geovisualization needs to be further researched, in order to attain a better understanding regarding the benefits of these types of geovisualizations. Another notable discrepancy between the geovisualizations included in the CVAP framework was exhibited in the product analyzed by Tress and Tress (2003). The authors created highly realistic, but static, imagery of the Danish countryside using Adobe Photoshop. This was a visualization that, at the time of its release, was at the forefront of what is possible to achieve via a computer-simulated image. However, if this research had been performed in more recent years, one can assume that the visualization product would have been a more advanced and interactive tool simply due to the amelioration of and ease of access to visualization technology and software.
The purpose of this process was to create a framework that organizes existing geovisualizations into clusters and themes that describe the intentions that the particular geovisualization product was successful at achieving and the most suited audience for those specifics of the visualization. Accordingly, CVAP can be used to guide the development of new geovisualization products by determining an appropriate type of visualization to use within specific circumstances. Decisions regarding the amount of realism or interactivity presented to the user of a particular geovisualization are able to be resolved with increased confidence after using CVAP to justify the decision.
A pattern that emerged during the formation of the CVAP relates to the level of inherent skill or previous domain knowledge present amongst the user group when evaluating a geovisualization. Visualizations with higher levels of interactivity were favoured among more expert user groups due to the geovisualization’s capabilities to act as tools for knowledge discovery. This describes situations where the potential solution to a problem was not immediately apparent and required new perspectives on data analysis in order to reach a conclusion. This is contrary to the visualizations that are intended for communicating a predefined or an already known message to a user group, as those products often had a low level of interactivity associated with their use.
4.2. Potential Framework Use
A workflow that implements CVAP resembles a three-step pipeline. This process can be described with the following use case: an organization is faced with a decision that is impacted via climatic variation, such as coastal flooding from sea level rise and changing precipitation patterns (e.g., Leskens et al., 2017). Using a geovisualization to communicate the information is considered to be a conceivable option; however, there is uncertainty regarding what form of visualization would best be suited for the intended purpose (i.e., disaster mitigation) and audience (i.e., policy analysts). The organization consults the CVAP framework to affirm the most appropriate form of geovisualization. Step 1 consists of determining the intended outcome of the geovisualization with regard to the audience (i.e., to inform, consult, involve, or partner with the user group). Then, it is necessary to decide whether the tool in question is intended to communicate already known facts, or if it is to be used for new knowledge discovery (Step 2). This can be partially influenced by considering the expertise level of the intended user group, as exploratory products (highly interactive geovisualizations) were often preferred by more advanced users. Finally, Step 3 involves commissioning a team of developers and analysts to create a product based on the insights derived from applying CVAP.
The CVAP will further guide visual product development because this framework determines what qualities of a geovisualization were preferred in a specific circumstance, and towards which audience. Different versions of the same geovisualization product could be developed based on the target audience (layperson or expert) or intended purpose (communicate known message or knowledge discovery), thus ensuring that each user group is able to extract the most amount of information and ultimately attain a level of better judgement when considering the effects of climate change on their personal business, well-being, and interests. Most importantly, the CVAP serves as a tool to guide the decision-making process regarding whether a geovisualization will be an effective medium based on specific qualities of the intended task, as per research regarding effective ways of communicating data through a visual tool.
5. Conclusions and Future Work
Geovisualizations have demonstrated potential as tools for communicating complex scientific data on climate change to a wide audience with different levels of expertise in the subject. However, albeit promising, there are still challenges that remain in applying research to real-world settings. There is a tremendous breadth in the diversity of geovisualization tools and the audiences that they are designed for; therefore, it is often possible to encounter contradicting conclusions regarding what makes for useful climate planning and engagement tools. This research addresses the gap in geovisualization knowledge and understanding by creating a conceptual framework that classifies geovisualization products into groups or themes, which best represent the aspects of the visualization medium. The CVAP framework can be used as a decision tree system for determining which form of geovisualization is most appropriate in a specific situation and for which audience.
The CVAP is also relevant within research fields which may not be directly related to climate adaptation, planning, and community engagement. For further study, it is recommended to test the use of CVAP within alternate sectors in order to determine whether it is appropriate to implement within different circumstances. These fields include areas such as nuclear disaster evacuation [35], urban flood evacuation [36], Indigenous knowledge mapping [37], urban development [10], arctic shipping sector [38], resource management [39], and recreational tourism [33]. Even though the CVAP framework has demonstrated its potential within the climate adaptation and community engagement fields, more usability evaluations are still required in order to attain a complete understanding of effective visual communication strategies and their intended audiences. As part of an ongoing research project, the CVAP framework will be subsequently tested in focus groups and workshops in which practitioners and decision makers can evaluate the effectiveness of the cube in representing the tradeoffs with various products. Focus groups and workshops can provide such stakeholders with the opportunity to see where they feel specific geovisualization tools should be positioned within the cube, which would improve our current presentation in which we have all products clustered into the cube’s corners. Furthermore, stakeholders could also determine where they feel their level of comfort with using geovisualization tools resides along the cube’s axes, thus providing new knowledge on how well various tools are aligned with stakeholder experiences and expectations.
Author Contributions
Conceptualization of ideas and research goals was conceived by Alexei Goudine, Robert Newell, and Christopher Bone; Validation was done by Alexei Goudine, Robert Newell, and Christopher Bone; Data Curation was done by Alexei Goudine; Writing—Original Draft Preparation was done by Alexei Goudine; Writing—Review and Editing was done by Alexei Goudine, Robert Newell, and Christopher Bone; Visualization was done by Alexei Goudine; Supervision was done by Christopher Bone; Funding Acquisition was done by Christopher Bone. All authors discussed the results and contributed to the final manuscript. All authors have read and agreed to the published version of the manuscript.
Funding
The authors would like to acknowledge the generous support from the Marine Environmental Observation, Prediction, and Response Network (MEOPAR) for funding that supported this study.
Conflicts of Interest
The authors declare no conflict of interest. The funders had no role in the design of the study; in the collection, analyses, or interpretation of data; in the writing of the manuscript, or in the decision to publish the results.
References
- Leskens, J.G.; Kehl, C.; Tutenel, T.; Kol, T.; De Haan, G.; Stelling, G.; Eisemann, E. An interactive simulation and visualization tool for flood analysis usable for practitioners. Mitig. Adapt. Strateg. Glob. Chang. 2017, 22, 307–324. [Google Scholar] [CrossRef] [Green Version]
- Bishop, I.D.; Pettit, C.J.; Sheth, F.; Sharma, S. Evaluation of data visualisation options for land-use policy and decision making in response to climate change. Environ. Plan. B Plan. Des. 2013, 40, 213–233. [Google Scholar] [CrossRef]
- Kuser Olsen, V.B.; Momen, B.; Langsdale, S.M.; Galloway, G.E.; Link, E.; Brubaker, K.L.; Ruth, M.; Hill, R.L. An approach for improving flood risk communication using realistic interactive visualisation. J. Flood Risk Manag. 2018, 11, S783–S793. [Google Scholar] [CrossRef]
- Grainger, S.; Mao, F.; Buytaert, W. Environmental data visualisation for non-scientific contexts: Literature review and design framework. Environ. Model. Softw. 2016, 85, 299–318. [Google Scholar] [CrossRef] [Green Version]
- Schroth, O.; Pond, E.; Sheppard, S.R.J. Evaluating presentation formats of local climate change in community planning with regard to process and outcomes. Landsc. Urban Plan. 2015, 142, 147–158. [Google Scholar] [CrossRef] [Green Version]
- Neset, T.S.; Glaas, E.; Ballantyne, A.G.; Linnér, B.O.; Opach, T.; Navarra, C.; Johansson, J.; Bohman, A.; Rød, J.K.; Goodsite, M. Climate change effects at your doorstep: Geographic visualization to support Nordic homeowners in adapting to climate change. Appl. Geogr. 2016, 74, 65–72. [Google Scholar] [CrossRef] [Green Version]
- Yang, C.; Raskin, R.; Goodchild, M.; Gahegan, M. Geospatial Cyberinfrastructure: Past, present and future. Comput. Environ. Urban Syst. 2010, 34, 264–277. [Google Scholar] [CrossRef]
- Marmo, C.; Cartwright, W.; Yuille, J. Knowledge in (Geo) Visualisation: The relationship between seeing and thinking. GeoCart 2010, 2010, 123–132. [Google Scholar]
- Newell, R.; Canessa, R. Seeing, Believing, and Feeling. Spaces Flows Int. J. Urban ExtraUrban Stud. 2015, 6, 15–30. [Google Scholar] [CrossRef]
- Lewis, J.L.; Casello, J.M.; Groulx, M. Effective Environmental Visualization for Urban Planning and Design: Interdisciplinary Reflections on a Rapidly Evolving Technology. J. Urban Technol. 2012, 19, 85–106. [Google Scholar] [CrossRef]
- Foo, K.; Gallagher, E.; Bishop, I.; Kim, A. Critical landscape visualization to LAND SI “Critical Approaches to Landscape Visualization”. Landsc. Urban Plan. 2015, 142, 80–84. [Google Scholar] [CrossRef]
- Lovett, A.; Appleton, K.; Warren-Kretzschmar, B.; Von Haaren, C. Using 3D visualization methods in landscape planning: An evaluation of options and practical issues. Landsc. Urban Plan. 2015, 142, 85–94. [Google Scholar] [CrossRef]
- Newell, R.; Canessa, R.; Sharma, T. Visualizing Our Options for Coastal Places: Exploring Realistic Immersive Geovisualizations as Tools for Inclusive Approaches to Coastal Planning and Management. Front. Mar. Sci. 2017, 4, 290. [Google Scholar] [CrossRef]
- Maceachren, A.M.; Kraak, M.J. Exploratory cartographic visualization advancing the agenda. Comput. Geosci. 1997, 23, 335–343. [Google Scholar] [CrossRef]
- Newell, R.; Canessa, R.; Sharma, T. Modeling Both the Space and Place of Coastal Environments: Exploring an Approach for Developing Realistic Geovisualizations of Coastal Places. Front. Mar. Sci. 2017, 4, 87. [Google Scholar] [CrossRef] [Green Version]
- Bohman, A.; Neset, T.S.; Opach, T.; Rød, J.K. Decision support for adaptive action—Assessing the potential of geographic visualization. J. Environ. Plan. Manag. 2015, 58, 2193–2211. [Google Scholar] [CrossRef] [Green Version]
- Al-Kodmany, K. Using visualization techniques for enhancing public participation in planning and design: Process, implementation, and evaluation. Landsc. Urban Plan. 1999, 45, 37–45. [Google Scholar] [CrossRef]
- Shaw, A.; Sheppard, S.; Burch, S.; Flanders, D.; Wiek, A.; Carmichael, J.; Robinson, J.; Cohen, S. Making local futures tangible-Synthesizing, downscaling, and visualizing climate change scenarios for participatory capacity building. Glob. Environ. Chang. 2009, 19, 447–463. [Google Scholar] [CrossRef]
- Haynes, P.; Hehl-Lange, S.; Lange, E. Mobile Augmented Reality for Flood Visualisation. Environ. Model. Softw. 2018, 109, 380–389. [Google Scholar] [CrossRef]
- Newell, R.; Dale, A.; Winters, C. A picture is worth a thousand data points: Exploring visualizations as tools for connecting the public to climate change research. Cogent Soc. Sci. 2016, 2, 1201885. [Google Scholar] [CrossRef]
- Stephens, S.H.; DeLorme, D.E.; Hagen, S.C. Evaluating the Utility and Communicative Effectiveness of an Interactive Sea-Level Rise Viewer through Stakeholder Engagement. J. Bus. Tech. Commun. 2015, 29, 314–343. [Google Scholar] [CrossRef]
- Vandenbroucke, D.; Dessers, E.; Crompvoets, J.; Bregt, A.K.; Van Orshoven, J. A methodology to assess the performance of spatial data infrastructures in the context of work processes. Comput. Environ. Urban Syst. 2013, 38, 58–66. [Google Scholar] [CrossRef]
- Pettit, C.J.; Raymond, C.M.; Bryan, B.A.; Lewis, H. Identifying strengths and weaknesses of landscape visualisation for effective communication of future alternatives. Landsc. Urban Plan. 2011, 100, 231–241. [Google Scholar] [CrossRef]
- Morseletto, P. Analysing the influence of visualisations in global environmental governance. Environ. Sci. Policy 2017, 78, 40–48. [Google Scholar] [CrossRef]
- Glaas, E.; Ballantyne, A.G.; Neset, T.S.; Linnér, B.O. Visualization for supporting individual climate change adaptation planning: Assessment of a web-based tool. Landsc. Urban Plan. 2017, 158, 1–11. [Google Scholar] [CrossRef]
- Robinson, L. Public outrage and public trust: A road map for public involvement in waste management decision-making. In Proceedings of the Waste and Recycle 2002 Conference, Perth, Australia, October 2002; pp. 1–4, 7, 9–14. Available online: https://citeseerx.ist.psu.edu/viewdoc/download?doi=10.1.1.200.1308&rep=rep1&type=pdf (accessed on 1 September 2020).
- Lieske, D.J.; Wade, T.; Roness, L.A. Climate change awareness and strategies for communicating the risk of coastal flooding: A Canadian Maritime case example. Estuar. Coast. Shelf Sci. 2014, 140, 83–94. [Google Scholar] [CrossRef]
- Macchione, F.; Costabile, P.; Costanzo, C.; De Santis, R. Moving to 3-D flood hazard maps for enhancing risk communication. Environ. Model. Softw. 2019, 111, 510–522. [Google Scholar] [CrossRef]
- Hildebrandt, D.; Döllner, J. Service-oriented, standards-based 3D geovisualization: Potential and challenges. Comput. Environ. Urban Syst. 2010, 34, 484–495. [Google Scholar] [CrossRef]
- Kinkeldey, C.; Schiewe, J.; Gerstmann, H.; Götze, C.; Kit, O.; Lüdeke, M.; Taubenböck, H.; Wurm, M. Evaluating the use of uncertainty visualization for exploratory analysis of land cover change: A qualitative expert user study. Comput. Geosci. 2015, 84, 46–53. [Google Scholar] [CrossRef] [Green Version]
- Poco, J.; Dasgupta, A.; Wei, Y.; Hargrove, W.; Schwalm, C.; Cook, R.; Bertini, E.; Silva, C. SimilarityExplorer: A visual inter-comparison tool for multifaceted climate Data. Comput. Graph. Forum 2014, 33, 341–350. [Google Scholar] [CrossRef]
- Johansson, J.; Schmid Neset, T.S.; Linnér, B.O. Evaluating climate visualization: An information visualization approach. In Proceedings of the 2010 14th International Conference Information Visualisation, London, UK, 26–29 July 2010; pp. 156–161. [Google Scholar]
- Tress, B.; Tress, G. Scenario visualisation for participatory landscape planning—A study from Denmark. Landsc. Urban Plan. 2003, 64, 161–178. [Google Scholar] [CrossRef]
- Opach, T.; Rød, J.K. Cartographic visualization of vulnerability to natural hazards. Cartographica 2013, 48, 113–125. [Google Scholar] [CrossRef]
- Tsai, M.K.; Lee, Y.C.; Lu, C.H.; Chen, M.H.; Chou, T.Y.; Yau, N.J. Integrating geographical information and augmented reality techniques for mobile escape guidelines on nuclear accident sites. J. Environ. Radioact. 2012, 109, 36–44. [Google Scholar] [CrossRef] [PubMed]
- Bodoque, J.M.; Díez-Herrero, A.; Amerigo, M.; García, J.A.; Olcina, J. Enhancing flash flood risk perception and awareness of mitigation actions through risk communication: A pre-post survey design. J. Hydrol. 2019, 568, 769–779. [Google Scholar] [CrossRef]
- Smith, D.A.; Ibáñez, A.; Herrera, F. The importance of context: Assessing the benefits and limitations of participatory mapping for empowering indigenous communities in the Comarca Ngäbe-Buglé, Panama. Cartographica 2017, 52, 49–62. [Google Scholar] [CrossRef]
- Hong, D.-B.; Bae, J.-J.; Yang, C.-S. Automatic Mapping Technique of Sea Ice in the Coastal Waters of the Arctic Ocean Using Sentinel-1 Data. J. Coast. Res. 2018, 85, 556–560. [Google Scholar] [CrossRef]
- Goode, D.J. Visualisation cartographique des prélèvements d’eau souterraine à l’échelle d’un sous-bassin. Hydrogeol. J. 2016, 24, 1057–1065. [Google Scholar] [CrossRef]
Figure 1.
Methods workflow chart.

Figure 2.
Climate Visualizations for Adaptation Products (CVAP).

Figure 3.
CVAP populated with geovisualization products.


Table 1.
Summary of research used in formation of the CVAP framework.
| Source | Theme/Contribution | Description | Audience |
|---|---|---|---|
| Grainger et al. (2016) | Interactivity | A high level of interactivity increases scientific information uptake | Academia and Laypersons |
| Bishop et al. (2013) | Abstraction vs Realism | Amount of realism can impact level of communication | Decision makers |
| Glaas et al. (2017) | Risk | Communicate magnitude of potential damage | Homeowners and Public |
| Bohman et al. (2015); Maceachren and Kraak (1997) | Map Use Cube | Characterizes geovisualization objectives | Academia |
| Robinson, L. (2002) | Community Involvement | Classification of engagement processes | General public and government agencies |
Table 2.
Research used to test and refine the CVAP framework.
| Source | Geovisualization | Climate Adaptation | Public Engagement | Relevance to Framework |
|---|---|---|---|---|
| Glaas et al. (2017) | VisAdapt Product | Integration of climate scenarios and local risk maps | Adaptive capacity for homeowners | Risk, Interactivity, Realistic visuals, |
| Lovett et al. (2015) | 3D landscape visualization | Future landscape changes | Stakeholder involvement | Level of realism in 3D visuals |
| Bohman et al. (2015) | VisAdapt and ViewExposed | Nordic climate change property risks | Urban planners and decision makers, homeowners and insurance brokers | Risk assessment, Public decision-making, Geovisualization |
| Bishop et al. (2012) | Victorian Climate Change Adaptation Program (VCCAP) | Climate change predictions | Policy and decision makers, extension staff, researchers | Visualizing expected climate change, Risk |
| Sheppard et al. (2011) | Local Climate Change Visioning Project (LCCVP) | Change effects at local (community) level | Public debate on climate change | Climate adaptation, Realistic visuals |
| Pettit et al. (2011) | Lower Murray Landscape Futures (LMLF) | Communicating landscape futures | Environmental managers, planners, and university students | Interactivity, Realism |
| Lieske D.J. (2015) | Community Adaptation Viewer (CAV) | Spatial decision support system to assist in adaptation planning | Community stakeholders | Risk, Interactivity |
| Romañach et al. (2014) | EverVIEW Data Viewer | Everglades restoration | National and International planning | Coastal environment Risk reduction, Community involvement |
| Tress and Tress (2003) | Photorealistic Visualization | Rural land use planning | Participatory planning | Realistic visuals |
| Stephens et al. (2015) | Sea Level Rise Viewer | Hurricane risk communication | Stakeholders and Resource managers | Risk |
| Poco et al. (2014) | SimilarityExplorer | Tool for analysis of climate data | Climate scientists | Data interaction |
| Li et al. (2011) | Web based GIS for sea ice archives | Sea ice monitoring | Ease of access and data dissemination | Interactivity, data exploration |
| Kinkeldey et al. (2015) | Land cover change analysis tool | Future land cover change scenarios | Experts | Risk and Uncertainty |
| Macchione et al. (2019) | 3D urban flood inundation maps | Sea level rise | Engage public, stakeholders, and engineers with flood hazards | Realistic visuals, Risk, Interactivity |
| Schroth et al. (2015) | Kimberley Climate Adaptation Project (KCAP) | Mountain pine beetle impacts and flood susceptibility | Community awareness and participation | Interactivity, Risk |
| Johansson et al. (2010) | WorldView | Representation of climate change related issues | Public involvement | Realistic visuals, Interactivity, Risk |
Publisher’s Note: MDPI stays neutral with regard to jurisdictional claims in published maps and institutional affiliations. |
© 2020 by the authors. Licensee MDPI, Basel, Switzerland. This article is an open access article distributed under the terms and conditions of the Creative Commons Attribution (CC BY) license (http://creativecommons.org/licenses/by/4.0/).
Share and Cite
MDPI and ACS Style
Goudine, A.; Newell, R.; Bone, C. Seeing Climate Change: A Framework for Understanding Visualizations for Climate Adaptation. ISPRS Int. J. Geo-Inf. 2020, 9, 644. https://0-doi-org.brum.beds.ac.uk/10.3390/ijgi9110644
AMA Style
Goudine A, Newell R, Bone C. Seeing Climate Change: A Framework for Understanding Visualizations for Climate Adaptation. ISPRS International Journal of Geo-Information. 2020; 9(11):644. https://0-doi-org.brum.beds.ac.uk/10.3390/ijgi9110644
Chicago/Turabian StyleGoudine, Alexei, Robert Newell, and Christopher Bone. 2020. "Seeing Climate Change: A Framework for Understanding Visualizations for Climate Adaptation" ISPRS International Journal of Geo-Information 9, no. 11: 644. https://0-doi-org.brum.beds.ac.uk/10.3390/ijgi9110644
Note that from the first issue of 2016, this journal uses article numbers instead of page numbers. See further details here.