Understanding Individual Mobility Pattern and Portrait Depiction Based on Mobile Phone Data

Abstract
:1. Introduction
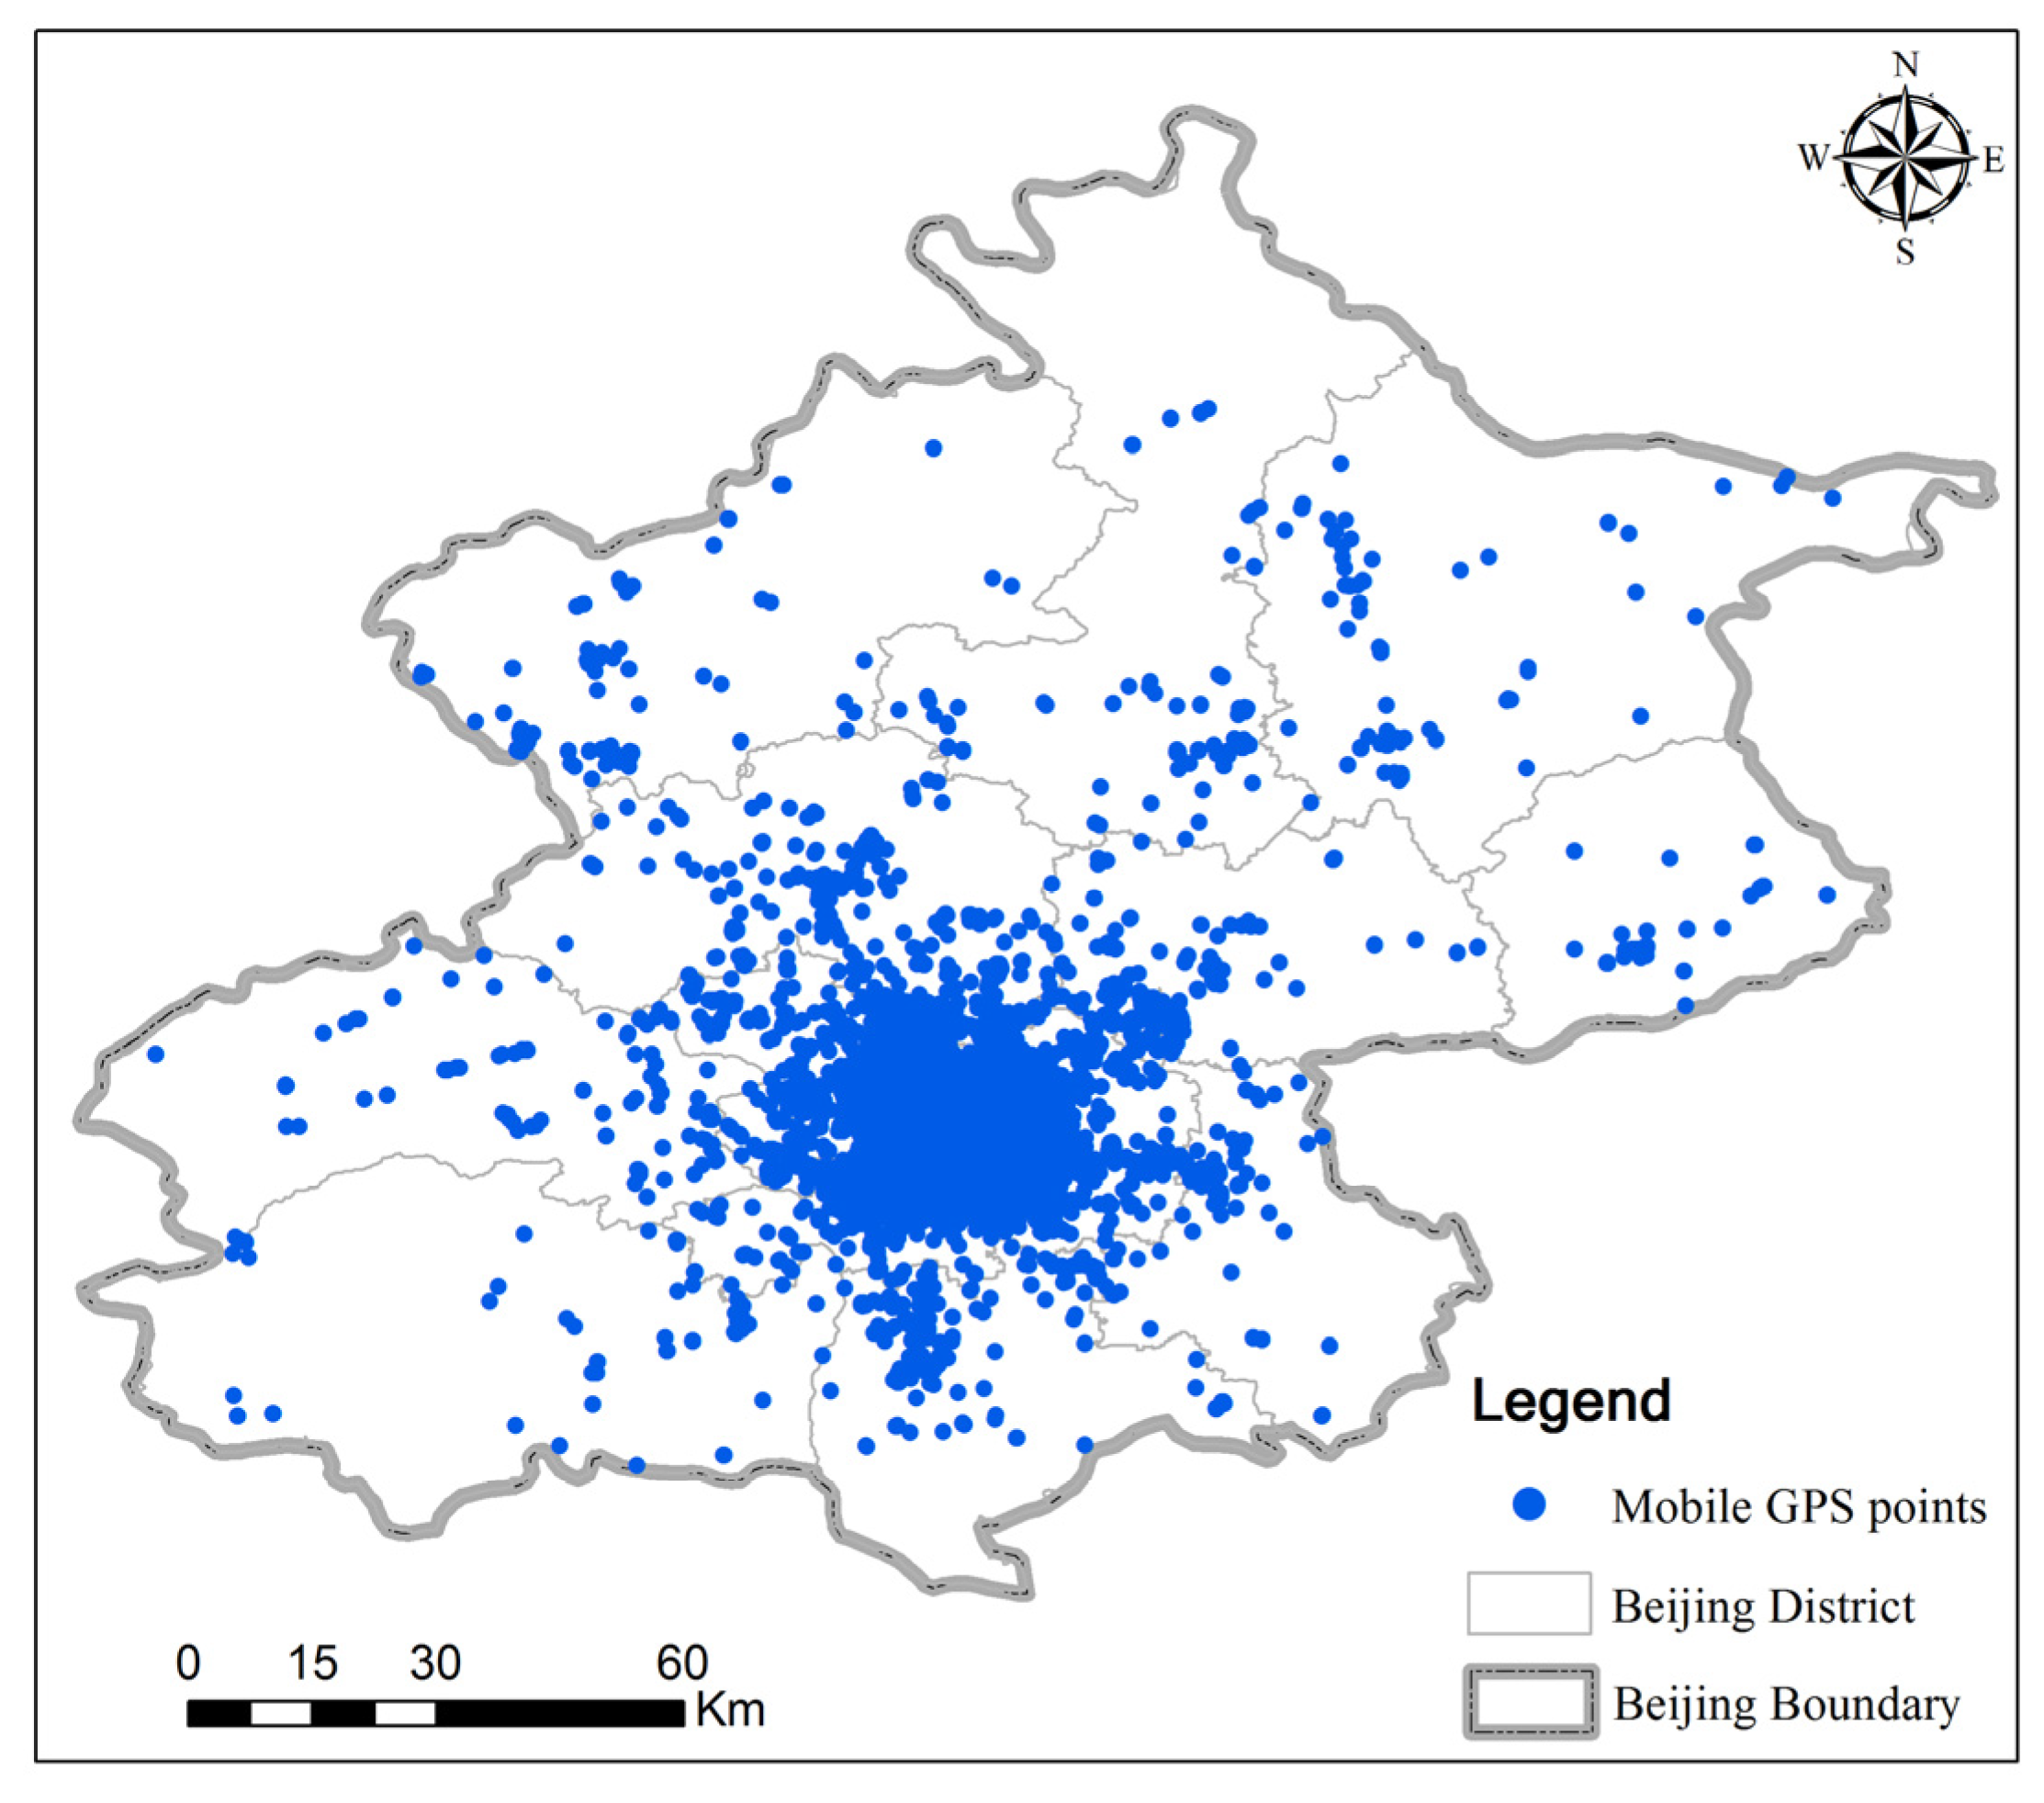
2. Data Sources
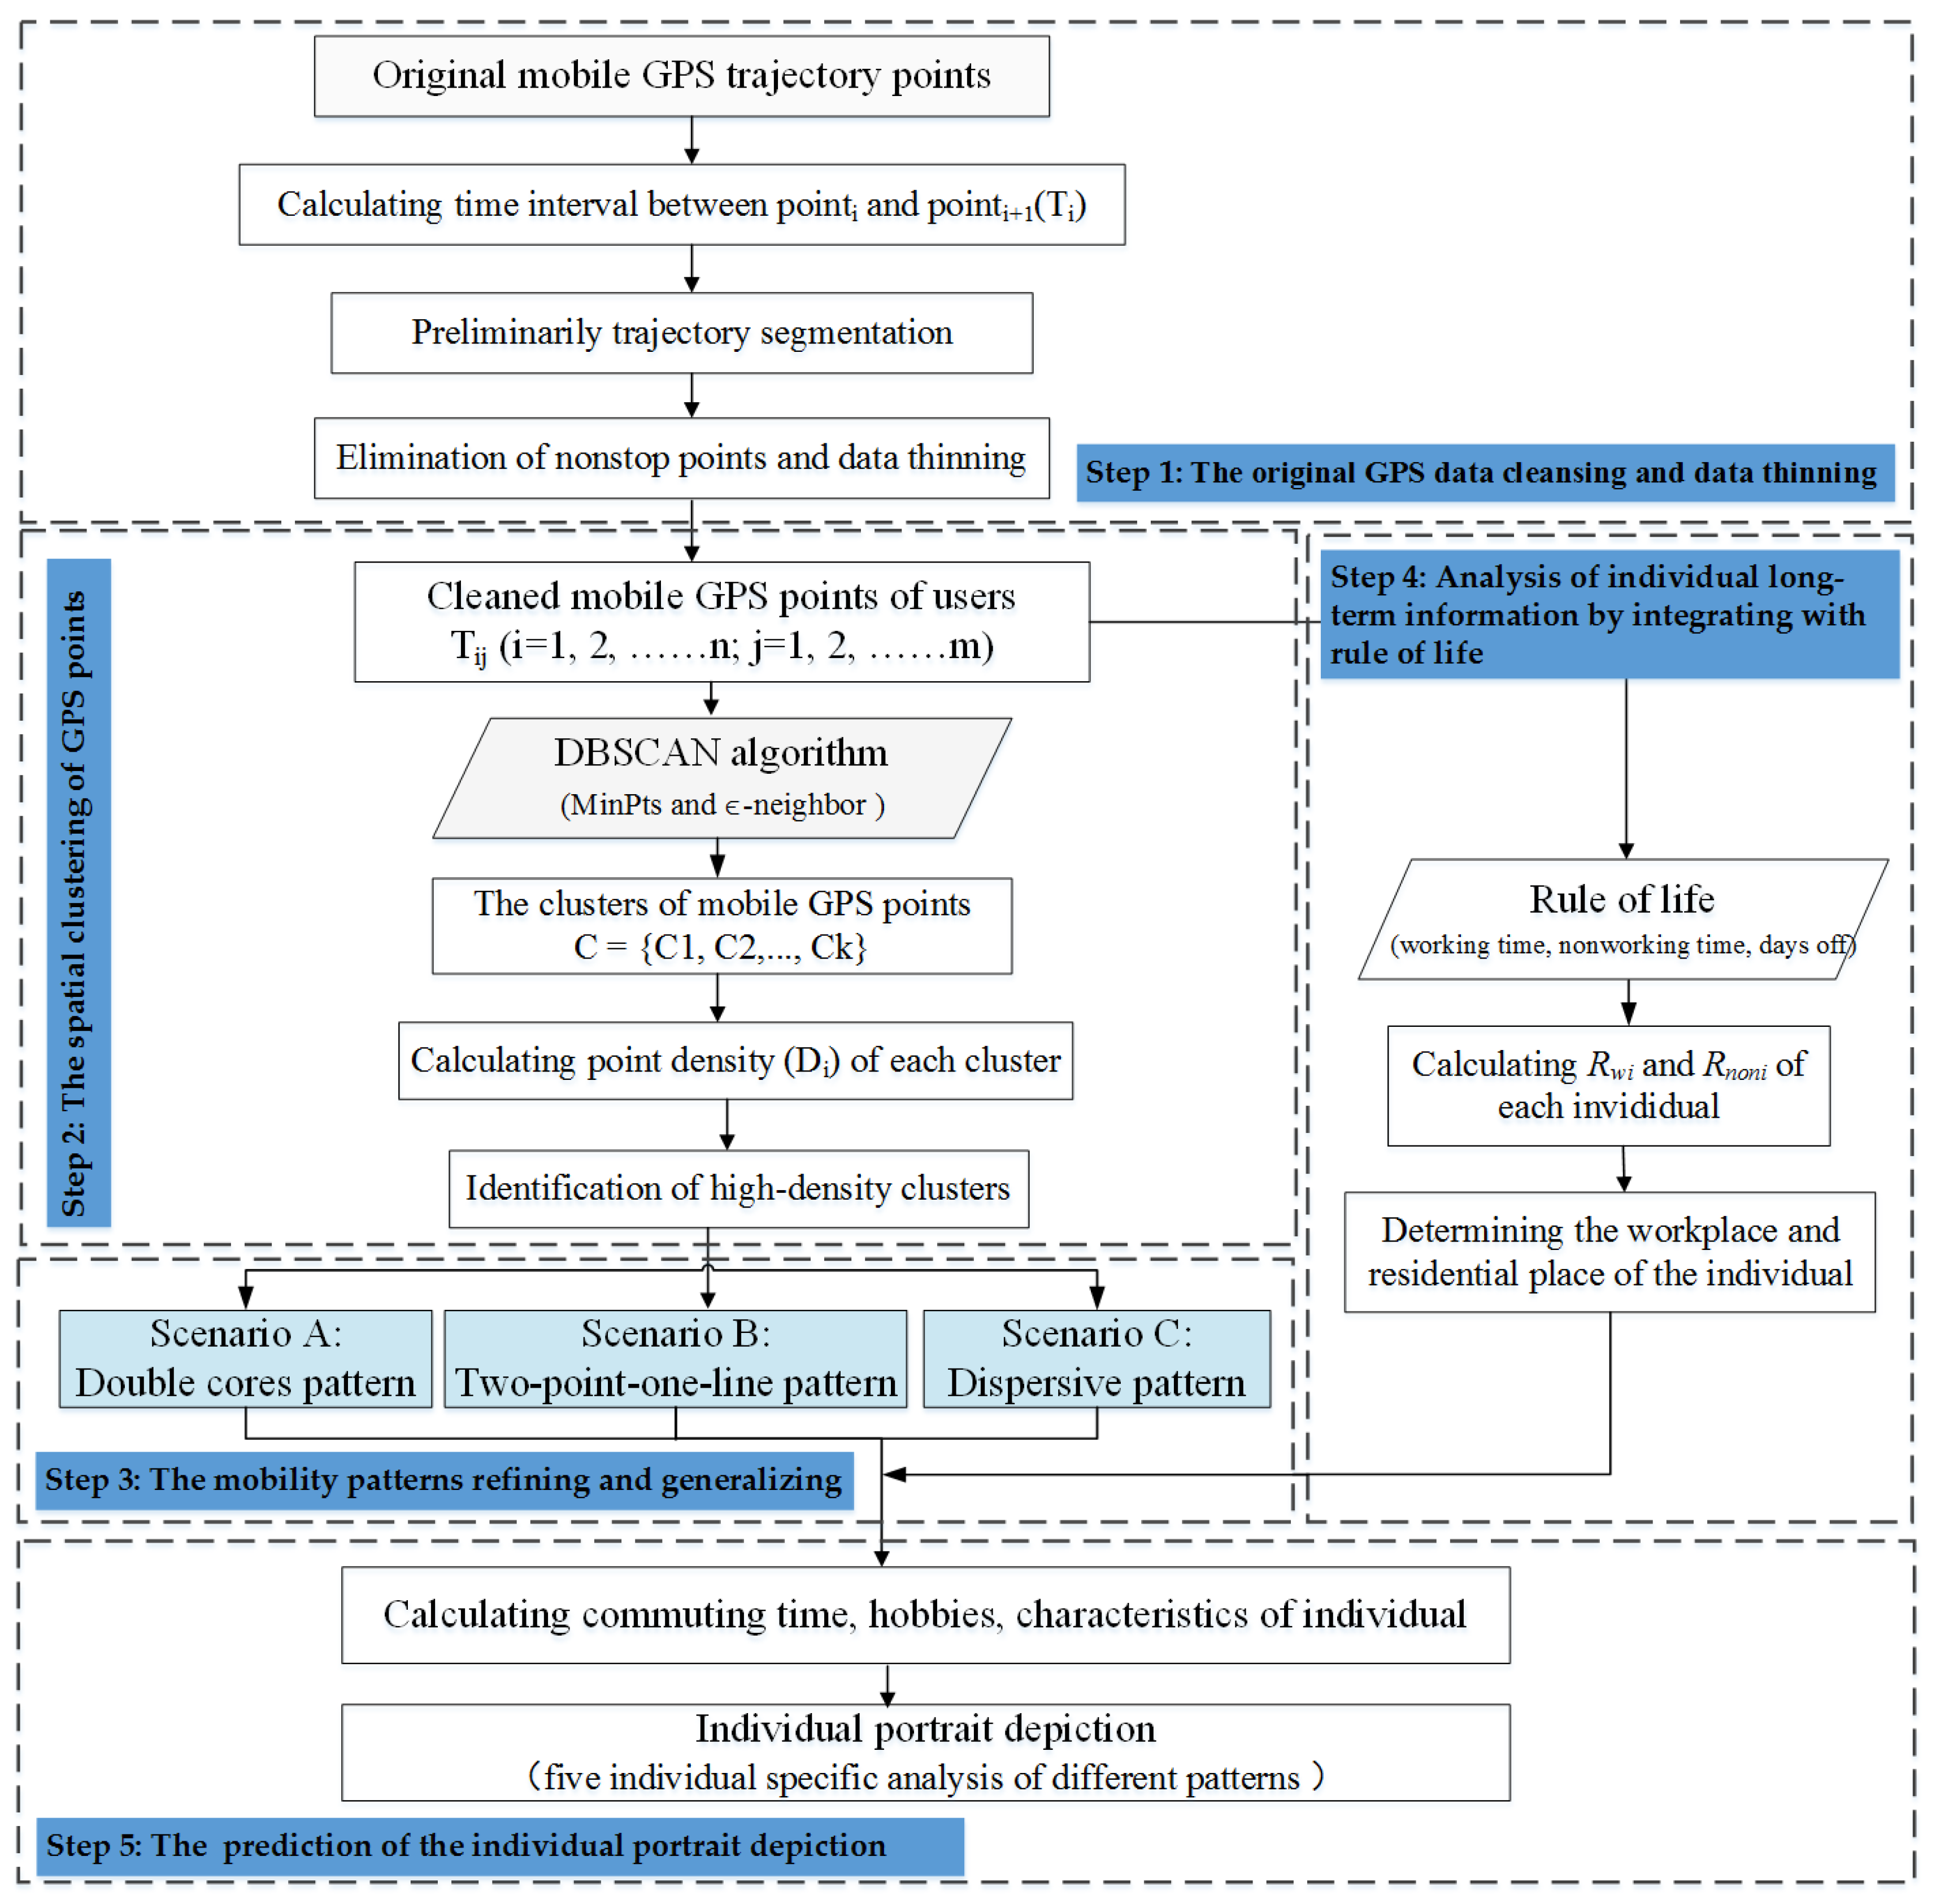
3. Individual Mobility Pattern Determining and Portrait Depicting
3.1. The Original GPS Data Cleansing and Data Thinning
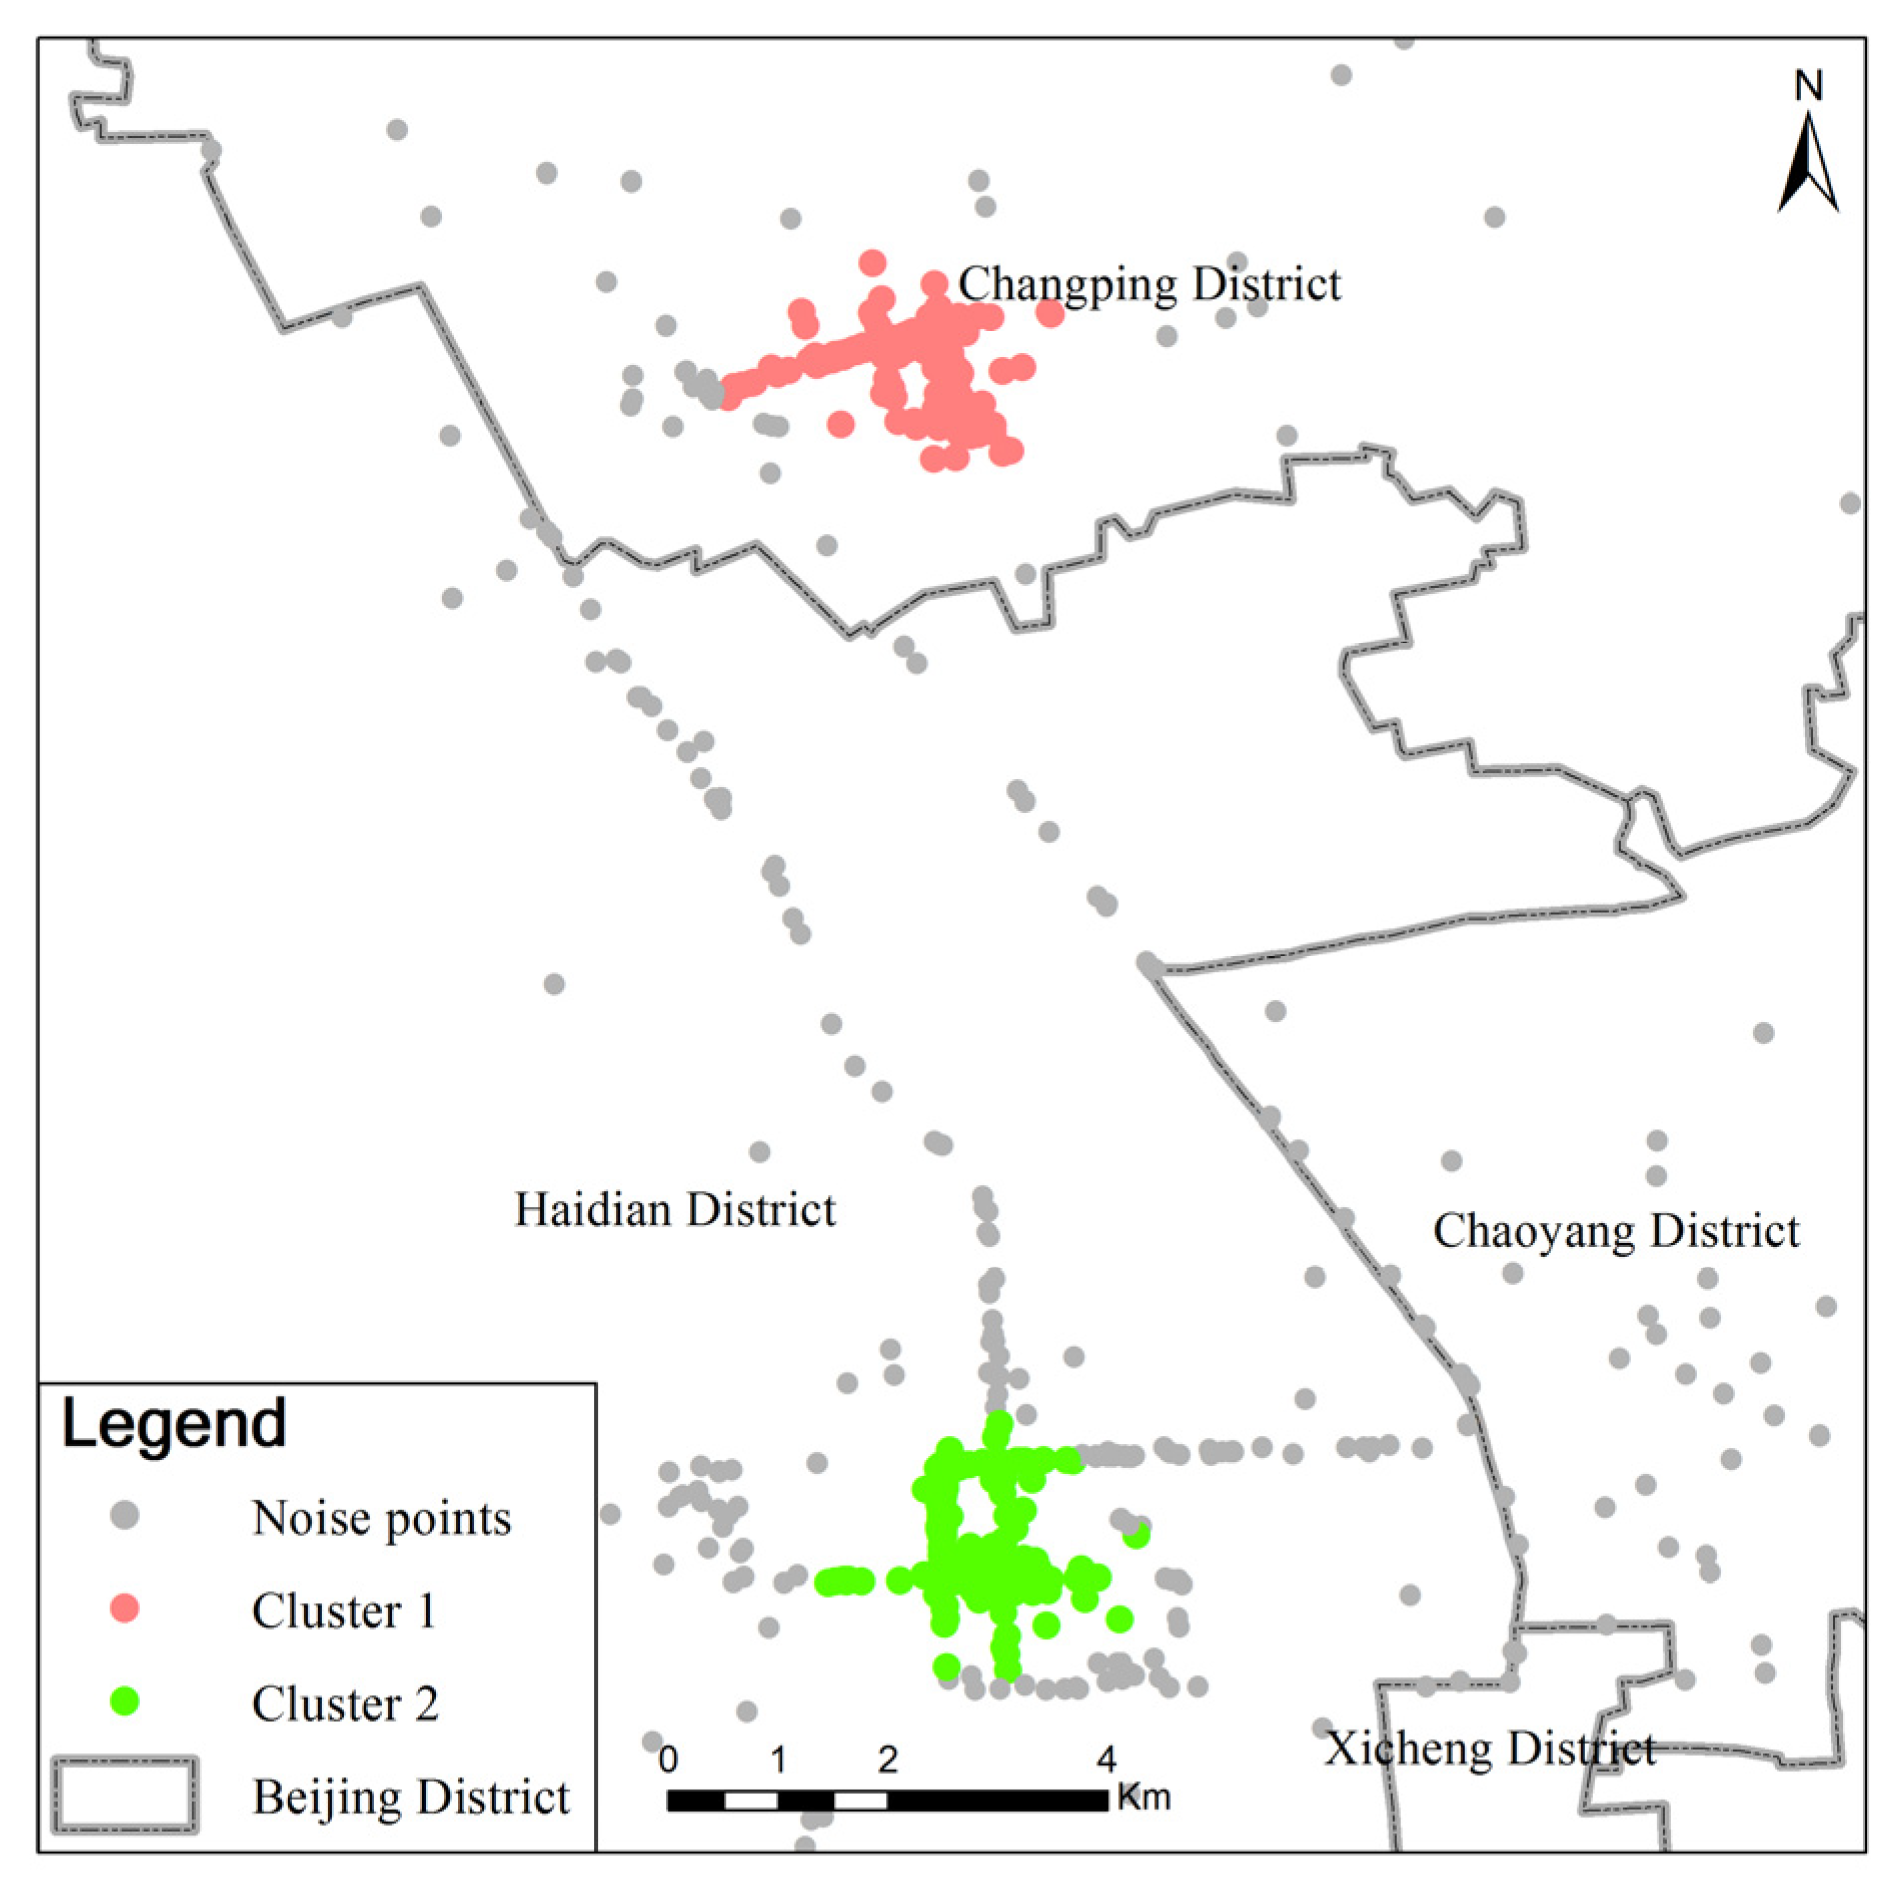
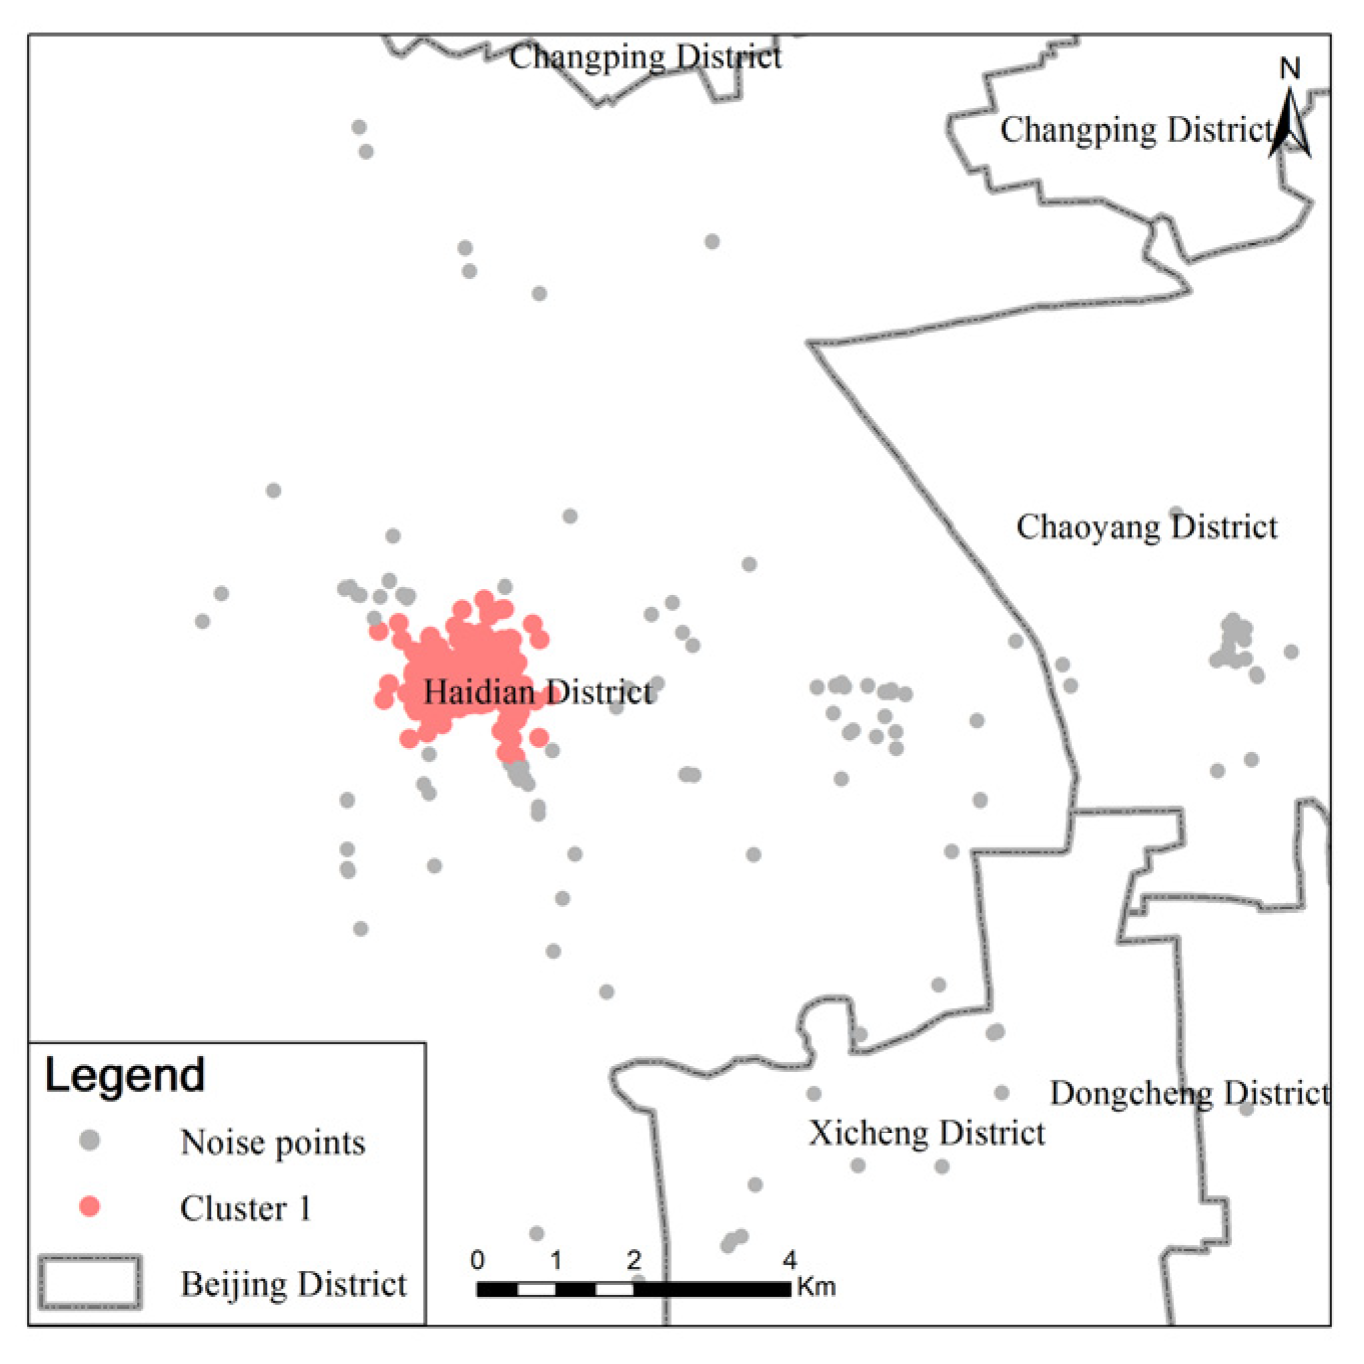
3.2. The Spatial Clustering of GPS Points
3.3. The Mobility Patterns Refining and Generalizing
3.4. Analysis of Individual Long-Term Information by Integrating with Rule of Life
3.5. The Prediction of the Individual Portrait Depiction
4. Individual Mobility Pattern Analysis and Portrait Depiction
4.1. Analysis of the Different Patterns
4.2. Portrait Depiction of Individuals
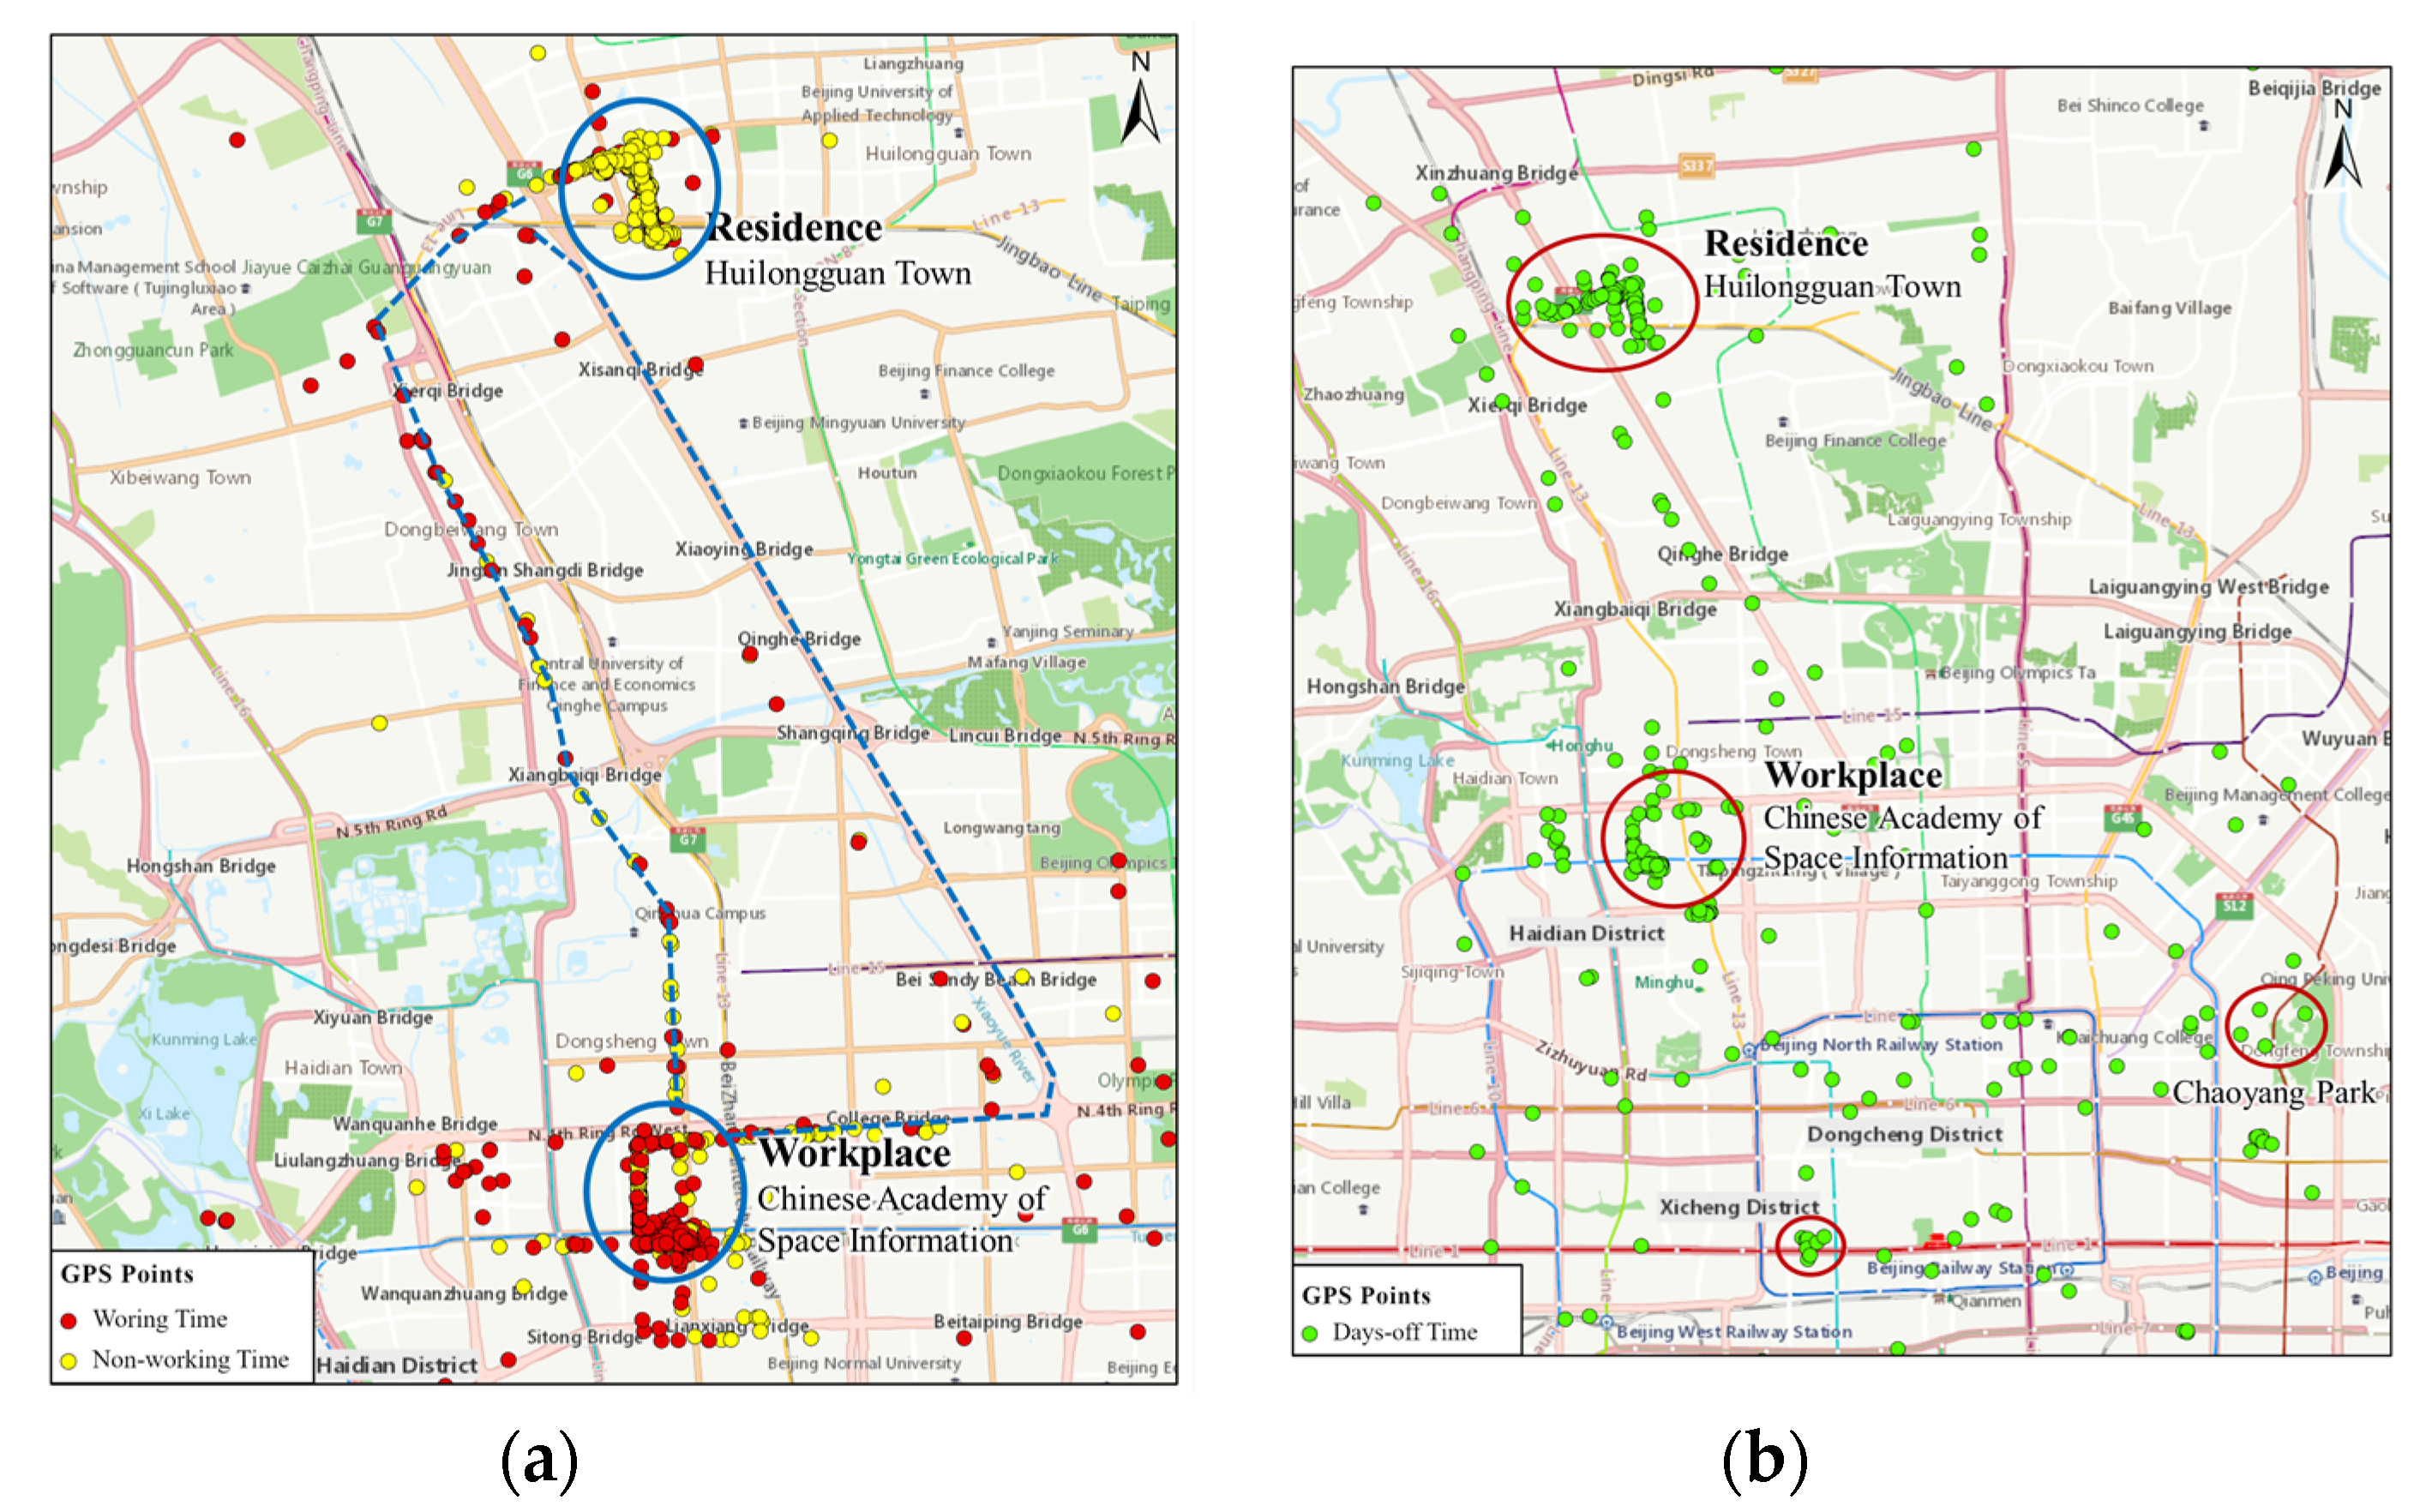
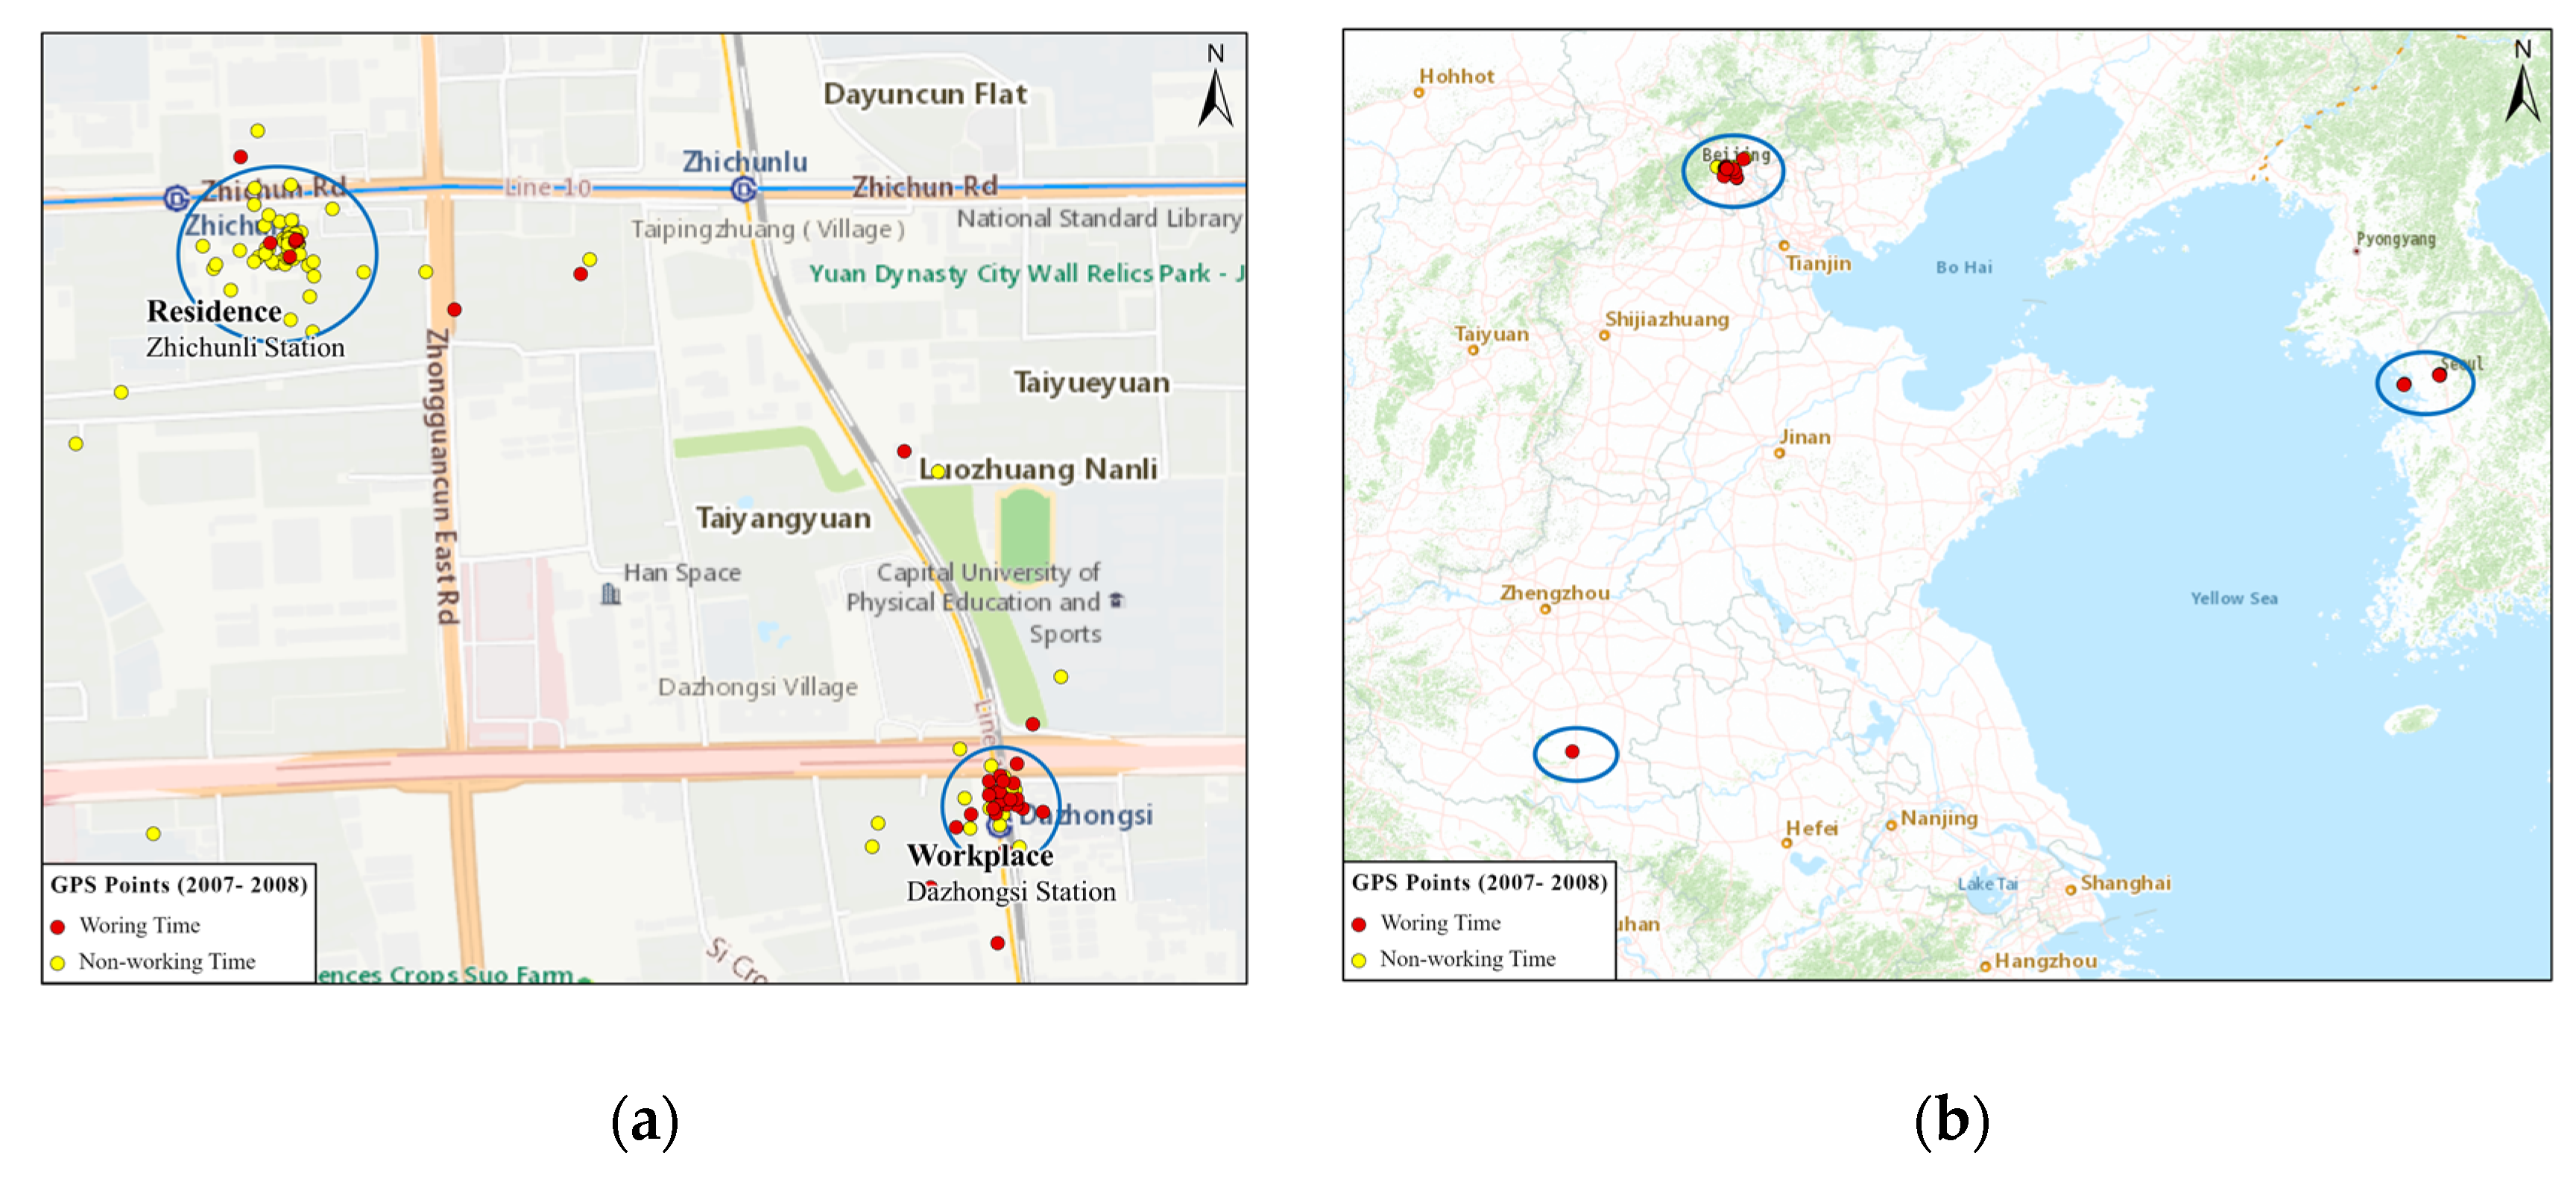
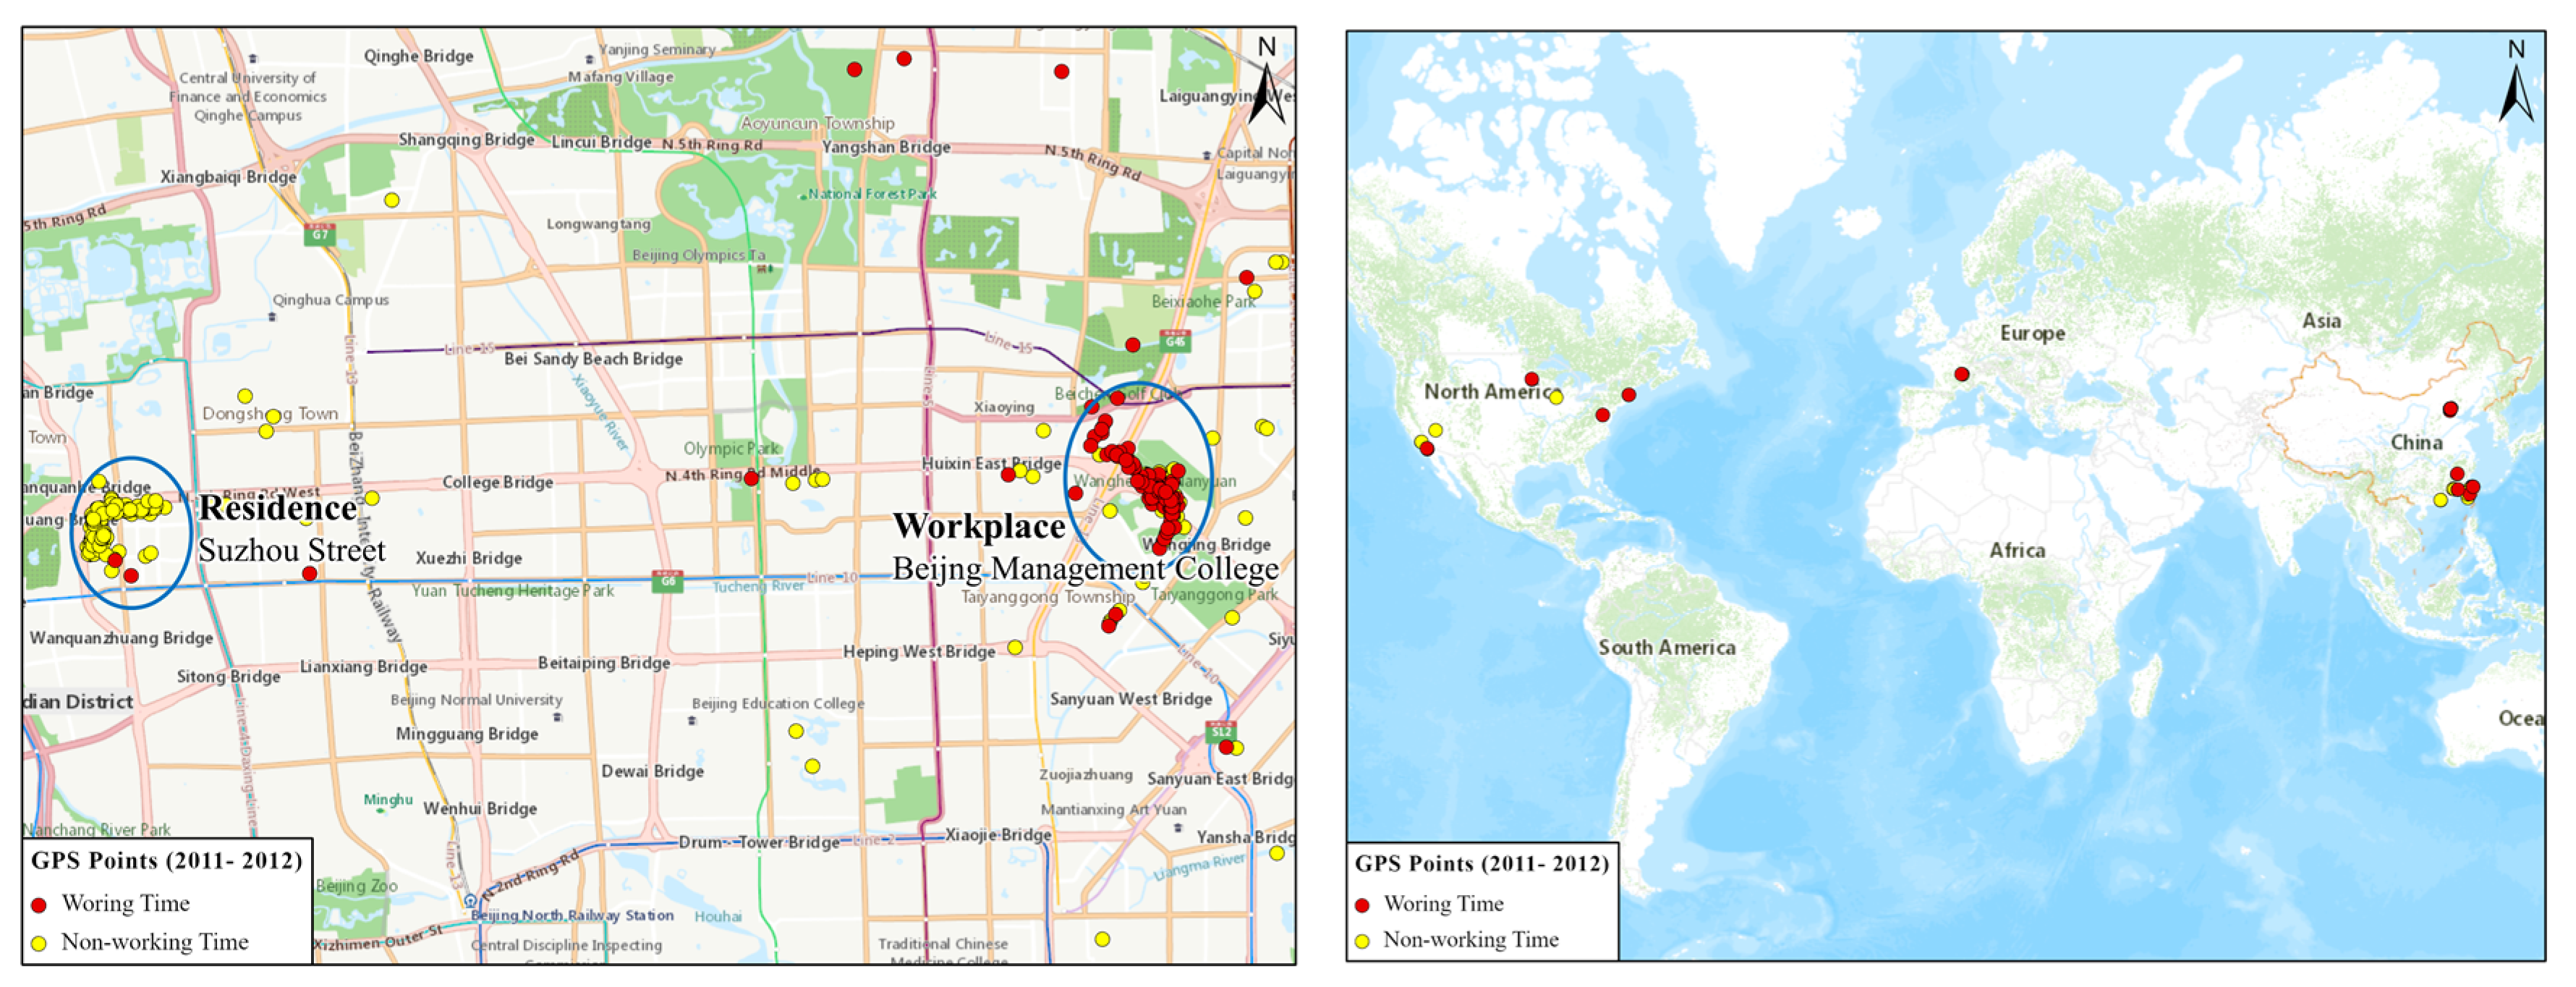
4.2.1. Two-Point-One-Line Pattern
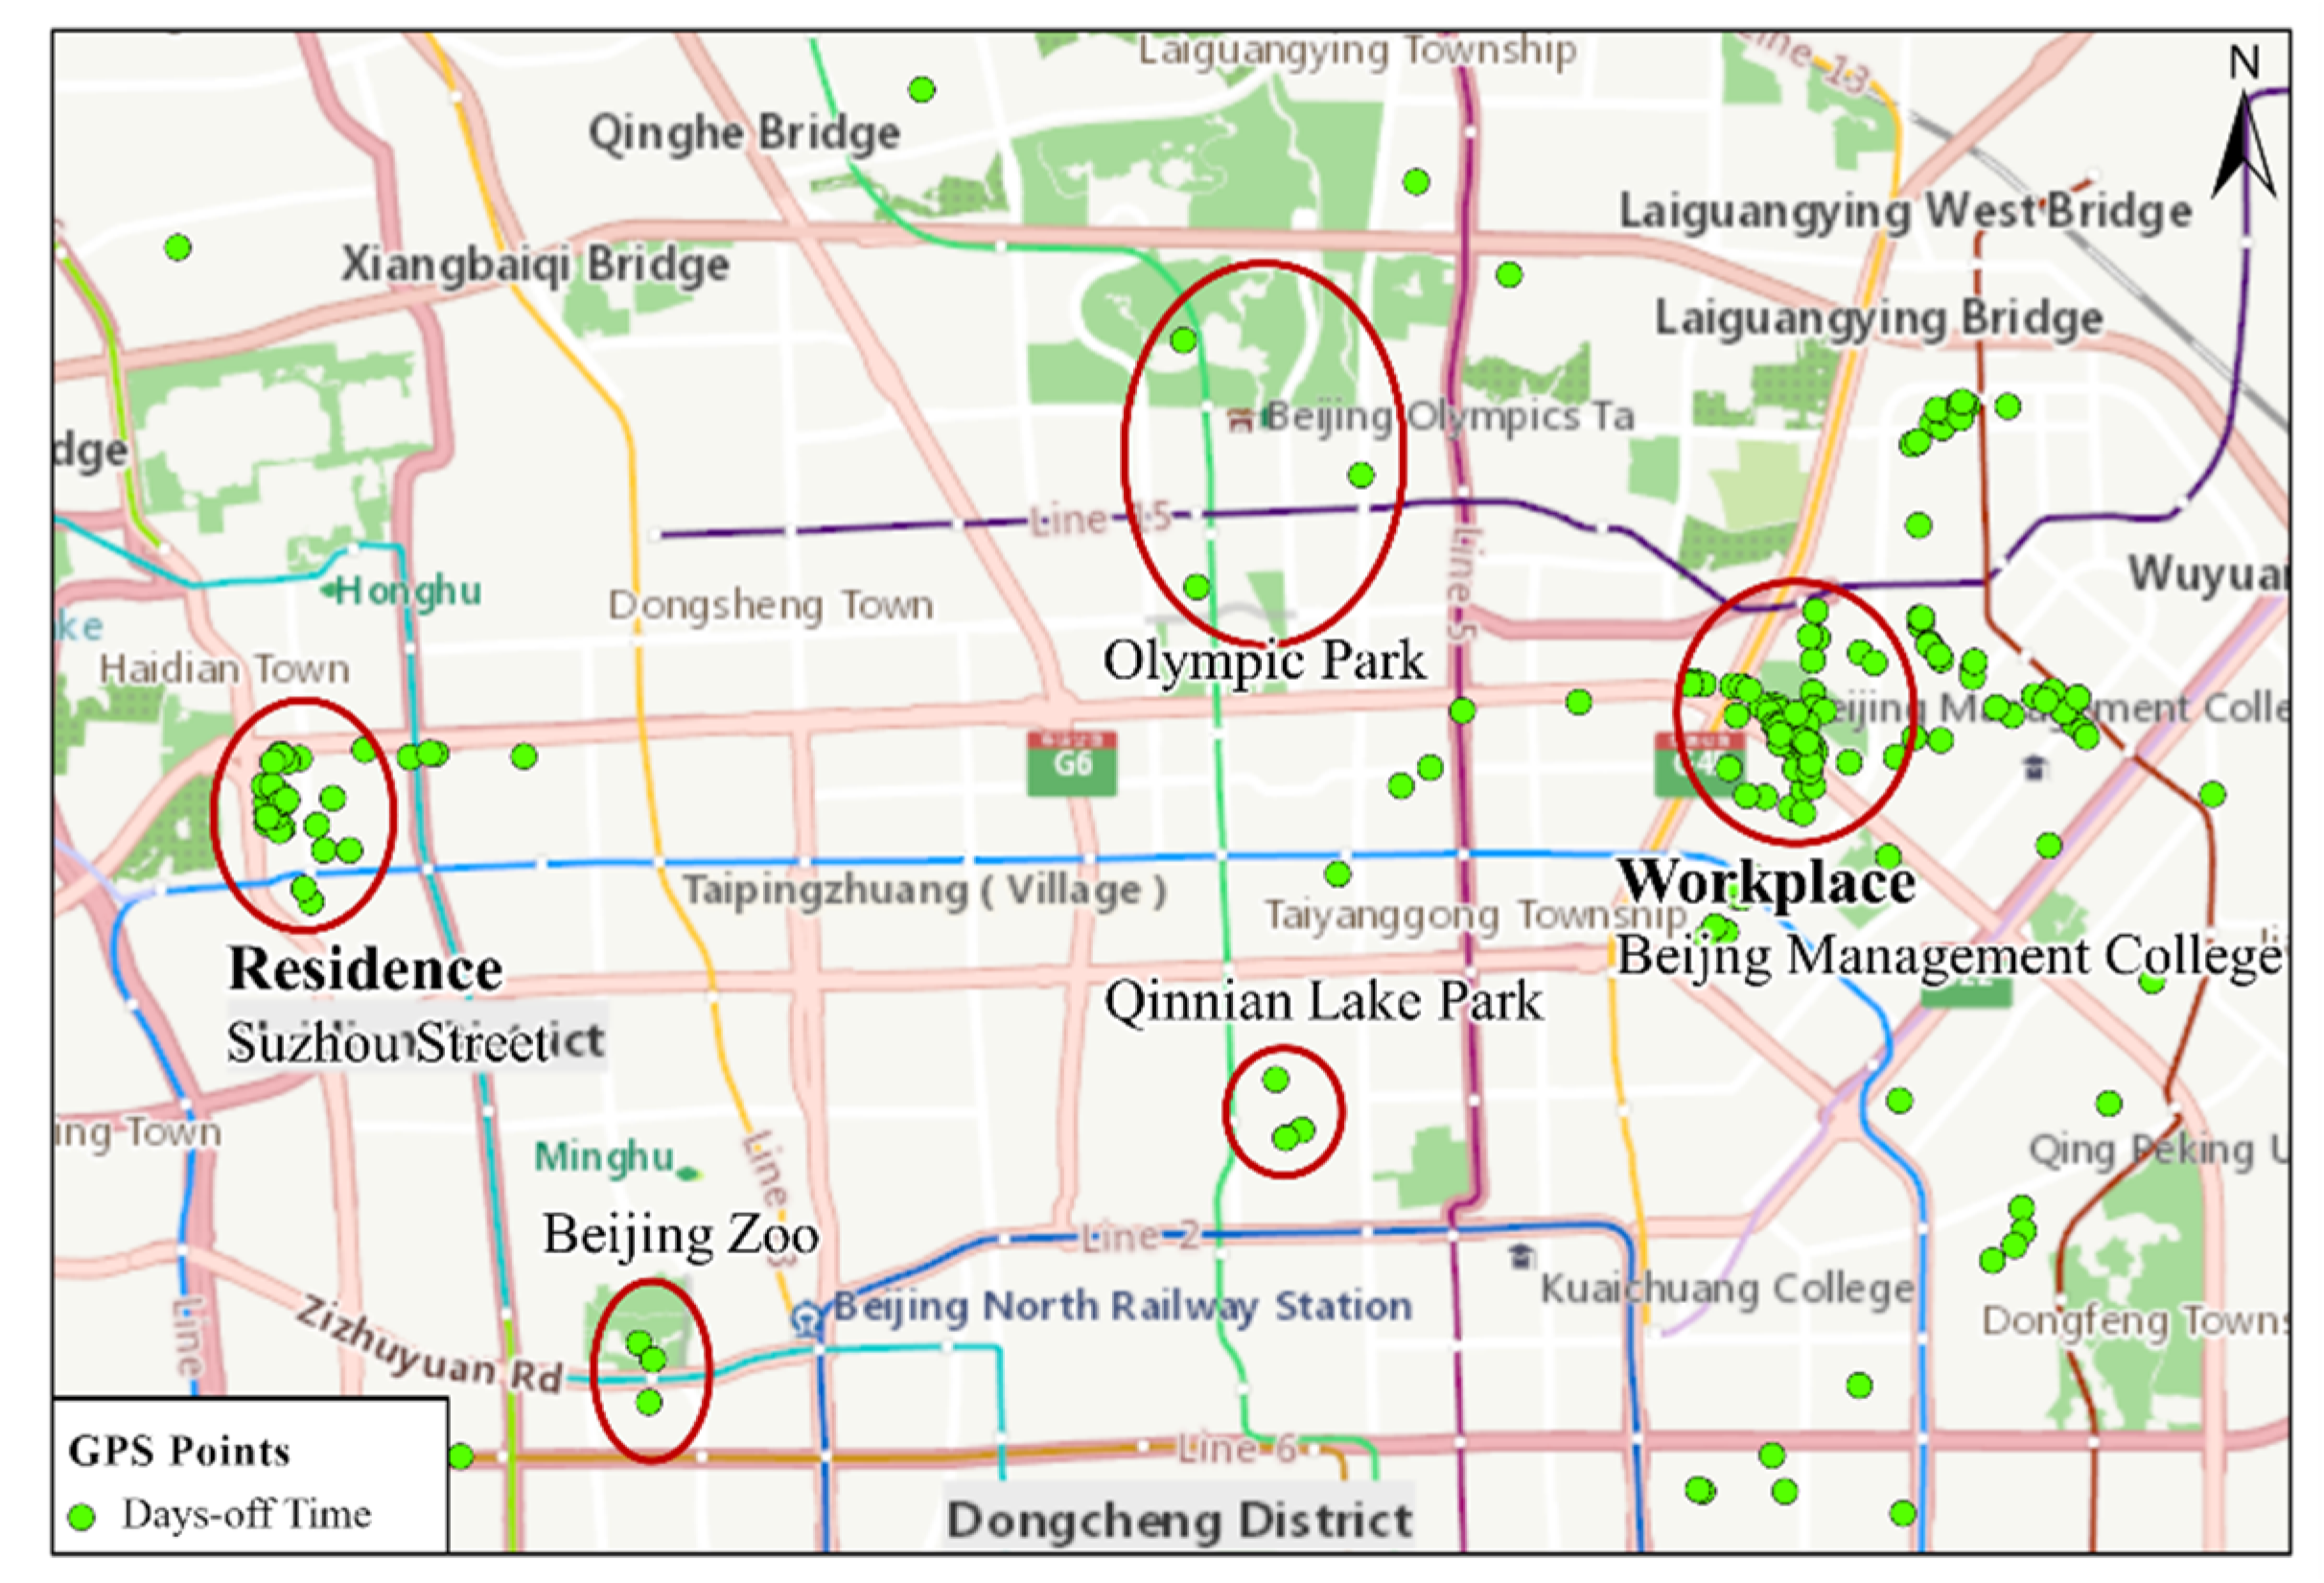
4.2.2. Dispersive Pattern (Evenly Distributed Trajectory Centered at a Point)
4.2.3. Trajectory with Double Cores
5. Conclusions
Author Contributions
Funding
Conflicts of Interest
References
- Chen, Y.; Shen, C. Performance Analysis of Smartphone-Sensor Behavior for Human Activity Recognition. IEEE Access 2017, 5, 3095–3110. [Google Scholar] [CrossRef]
- Senaratne, H.; Mueller, M.; Behrisch, M.; Lalanne, F.; Bustos-Jiménez, J.; Schneidewind, J.; Keim, D.; Schreck, T. Urban Mobility Analysis with Mobile Network Data: A Visual Analytics Approach. IEEE Trans. Intell. Transp. Syst. 2017, 19, 1537–1546. [Google Scholar] [CrossRef] [Green Version]
- Lin, M.; Hsu, W. Mining GPS data for mobility patterns: A survey. Pervasive Mob. Comput. 2014, 12, 1–16. [Google Scholar] [CrossRef]
- Doyle, J.; Huang, P.; Farrell, R.; McLoone, S. Population mobility dynamics estimated from mobile telephony data. J. Urban Technol. 2014, 21, 109–132. [Google Scholar] [CrossRef]
- Manfredini, F.; Pucci, P.; Tagliolato, P. Toward a systemic use of manifold cell phone network data for urban analysis and planning. J. Urban Technol. 2014, 21, 39–59. [Google Scholar] [CrossRef]
- Chen, Q.; Hu, Z.; Su, H.; Tang, X.; Yu, K. Understanding travel patterns of tourists from mobile phone data: A case study in Hainan. In Proceedings of the 2018 IEEE International Conference on Big Data and Smart Computing (BigComp), Shanghai, China, 15–17 January 2018; Volume 1, pp. 45–51. [Google Scholar]
- Kwon, Y.; Kang, K.; Bae, C. Unsupervised learning for human activity recognition using smartphone sensors. Expert Syst. Appl. 2014, 41, 6067–6074. [Google Scholar] [CrossRef]
- Ronao, C.A.; Cho, S.-B. Human activity recognition with smartphone sensors using deep learning neural networks. Expert Syst. Appl. 2016, 59, 235–244. [Google Scholar] [CrossRef]
- Jiang, S.; Ferreira, J.; Gonzalez, M. Activity-Based Human Mobility Patterns Inferred from Mobile Phone Data: A Case Study of Singapore. IEEE Trans. Big Data 2017, 3, 208–219. [Google Scholar] [CrossRef] [Green Version]
- Widhalm, P.; Yang, Y.; Ulm, M.; Athavale, S.; González, M.C. Discovering urban activity patterns in cell phone data. Transportation 2015, 42, 597–623. [Google Scholar] [CrossRef] [Green Version]
- Lee, K.-S.; You, S.Y.; Eom, J.K.; Song, J.; Min, J.H. Urban spatiotemporal analysis using mobile phone data: Case study of medium- and large-sized Korean cities. Habitat Int. 2018, 73, 6–15. [Google Scholar] [CrossRef]
- Louail, T.; Lenormand, M.; Picornell, M.; Cantú, O.G.; Herranz, R.; Frias-Martinez, E.; Ramasco, J.J.; Barthelemy, M. Uncovering the spatial structure of mobility networks. Nat. Commun. 2015, 6, 6007. [Google Scholar] [CrossRef] [PubMed] [Green Version]
- Gao, S. Spatio-Temporal Analytics for Exploring Human Mobility Patterns and Urban Dynamics in the Mobile Age. Spat. Cogn. Comput. Interdiscip. J. 2015, 15, 86–114. [Google Scholar] [CrossRef]
- Zhao, P.; Hu, H.; Hai, X.; Huang, S.; Lyu, D. Identifying Metropolitan Edge in City Clusters Region Using Mobile Phone Data: A Case Study of Jing-Jin-Ji. Urban Dev. Stud. 2019, 26, 69–79. [Google Scholar]
- Niu, X.; Ding, L.; Song, X. Understanding Urban Spatial Structure of Shanghai Central City Based on Mobile Phone Data. China City Plan. Rev. 2015, 24, 15–23. [Google Scholar]
- Ding, D.; Mao, H.; Lu, Z. Research on population type recognition based on mobile signaling data. In Proceedings of the 14th China Intelligent Transportation Conference, Qingdao, China, 31 October 2019; pp. 417–428. [Google Scholar]
- Jiang, S.; Ferreira, J.; González, M. Clustering daily patterns of human activities in the city. Data Min. Knowl. Discov. 2012, 25, 478–510. [Google Scholar] [CrossRef] [Green Version]
- Ahas, R.; Aasa, A.; Yuan, Y.; Raubal, M.; Smoreda, Z.; Liu, Y.; Ziemlicki, C.; Tiru, M.; Zook, M.A. Everyday space–time geographies: Using mobile phone-based sensor data to monitor urban activity in Harbin, Paris, and Tallinn. Int. J. Geogr. Inf. Sci. 2015, 29. [Google Scholar] [CrossRef]
- Cao, J.; Tu, W.; Li, Q.; Zhou, M.; Cao, R. Exploring the distribution and dynamics of functional regions using mobile phone data and social media data. In Proceedings of the 14th International Conference on Computers in Urban Planning and Urban Management, Boston, MA, USA, 10 July 2015. [Google Scholar]
- Yang, X.; Fang, Z.; Xu, Y.; Shaw, S.-L.; Zhao, Z.; Yin, L.; Zhang, T.; Lin, Y. Understanding Spatiotemporal Patterns of Human Convergence and Divergence Using Mobile Phone Location Data. ISPRS Int. J. Geo-Inf. 2016, 5, 177. [Google Scholar] [CrossRef]
- Wang, Q.; Zhang, J.; Yang, F.; Du, S.; Zhang, H. Analysis of the Trip Characteristics of Urban Residents Based on Mobile Phone Positioning Data in Nanjing. In Proceedings of the 18th COTA International Conference of Transportation Professionals, Beijing, China, 5–8 July 2018; pp. 2274–2284. [Google Scholar]
- Zhong, G.; Wan, X.; Zhang, J.; Yin, T.; Ran, B. Characterizing Passenger Flow for a Transportation Hub Based on Mobile Phone Data. IEEE Trans. Intell. Transport. Syst. 2017, 18, 1507–1518. [Google Scholar] [CrossRef]
- Available online: https://www.microsoft.com/en-us/download/details.aspx?id=52367 (accessed on 9 August 2012).
- Xie, X. Understanding User Behavior Geospatially. In Proceedings of the Contextual and Social Media Understanding and Usage, Wadern, Germany, 15–20 June 2008. [Google Scholar]
- Zheng, Y.; Zhang, L.; Xie, X.; Ma, W.Y. Mining correlation between locations using human location history. In Proceedings of the 17th ACM SIGSPATIAL International Conference on Advances in Geographic Information Systems, Seattle, WA, USA, 4–6 November 2009; pp. 472–475. [Google Scholar]
- Li, C.; Dai, Z.; Peng, W.; Shen, J. Green Travel Mode: Trajectory Data Cleansing Method for Shared Electric Bicycles. Sustainability 2019, 11, 1429. [Google Scholar] [CrossRef] [Green Version]
- Ester, M.; Kriegel, H.; Sander, J.; Xu, X. A density-based algorithm for discovering clusters in large spatial databases with noise. In Proceedings of the Second International Conference on Knowledge Discovery and Data Mining, Portland, OR, USA, 2–4 August 1996; pp. 226–231. [Google Scholar]
- Tran, T.; Wehrens, R.; Buydens, L. KNN-kernel density-based clustering for high-dimensional multivariate data. Comput. Stat. Data Anal. 2006, 51, 513–525. [Google Scholar] [CrossRef]
- Tang, J.; Liu, F.; Wang, Y.; Wang, H. Uncovering urban human mobility from large scale taxi GPS data. Phys. A Stat. Mech. Appl. 2015, 438, 140–153. [Google Scholar] [CrossRef]
- Wu, D.; Shi, R.; Wang, J.; Wu, S. Urban Population Distribution Characteristics Analysis Method based on Mobile Phone Data. In Proceedings of the 2016 5th International Conference on Advanced Materials and Computer Science, Qingdao, China, 26–27 March 2016. [Google Scholar]
- Tran, T.; Drab, K.; Daszykowski, M. Revised DBSCAN algorithm to cluster data with dense adjacent clusters. Chemom. Intell. Lab. Syst. 2013, 120, 92–96. [Google Scholar] [CrossRef]
- Liu, P.; Hong, Z.; Feng, W.; Li, Y.; Wu, L. Design and implementation of an improved DBSCAN algorithm. In Proceedings of the 2019 IEEE 3rd Advanced Information Management, Communicates, Electronic and Automation Control Conference (IMCEC 2019), Chongqing, China, 11–13 October 2019. [Google Scholar]
- Zhao, K.; Tarkoma, S.; Liu, S.; Huy, V. Urban human mobility data mining: An overview. In Proceedings of the 2016 IEEE International Conference on Big Data (Big Data), Washington, DC, USA, 5–8 December 2016; pp. 1911–1920. [Google Scholar]
- Hou, J.; Gao, H.; Li, X. DSets-DBSCAN: A Parameter-Free Clustering Algorithm. IEEE Trans. Image Process. 2015, 25, 3182–3193. [Google Scholar] [CrossRef]


| UserID | Time | Longitude | Latitude |
|---|---|---|---|
| 1 | 09:33:34, 19 January 2008 | 116.482 | 40.0213 |
| 10 | 09:34:36, 19 January 2008 | 116.481 | 40.0212 |
| 108 | 09:58:39, 03 May 2009 | 113.011 | 39.9888 |
| 108 | 10:20:15, 03 May 2009 | 113.011 | 39.9888 |
Publisher’s Note: MDPI stays neutral with regard to jurisdictional claims in published maps and institutional affiliations. |
© 2020 by the authors. Licensee MDPI, Basel, Switzerland. This article is an open access article distributed under the terms and conditions of the Creative Commons Attribution (CC BY) license (http://creativecommons.org/licenses/by/4.0/).
Share and Cite
Li, C.; Hu, J.; Dai, Z.; Fan, Z.; Wu, Z. Understanding Individual Mobility Pattern and Portrait Depiction Based on Mobile Phone Data. ISPRS Int. J. Geo-Inf. 2020, 9, 666. https://0-doi-org.brum.beds.ac.uk/10.3390/ijgi9110666
Li C, Hu J, Dai Z, Fan Z, Wu Z. Understanding Individual Mobility Pattern and Portrait Depiction Based on Mobile Phone Data. ISPRS International Journal of Geo-Information. 2020; 9(11):666. https://0-doi-org.brum.beds.ac.uk/10.3390/ijgi9110666
Chicago/Turabian StyleLi, Chengming, Jiaxi Hu, Zhaoxin Dai, Zixian Fan, and Zheng Wu. 2020. "Understanding Individual Mobility Pattern and Portrait Depiction Based on Mobile Phone Data" ISPRS International Journal of Geo-Information 9, no. 11: 666. https://0-doi-org.brum.beds.ac.uk/10.3390/ijgi9110666