BITOUR: A Business Intelligence Platform for Tourism Analysis


1
Valencia Research Institute for Artificial Intelligence (VRAIN), Universitat Politècnica de València, 46022 Valencia, Spain
2
Facultad de Ingeniería, Universidad del Magdalena, Santa Marta 470001, Colombia
*
Author to whom correspondence should be addressed.
ISPRS Int. J. Geo-Inf. 2020, 9(11), 671; https://0-doi-org.brum.beds.ac.uk/10.3390/ijgi9110671
Submission received: 3 October 2020
/
Revised: 31 October 2020
/
Accepted: 6 November 2020
/
Published: 12 November 2020
(This article belongs to the Special Issue Social Computing for Geographic Information Science)
Abstract
:Integrating collaborative data in data-driven Business Intelligence (BI) system brings an opportunity to foster the decision-making process towards improving tourism competitiveness. This article presents BITOUR, a BI platform that integrates four collaborative data sources (Twitter, Openstreetmap, Tripadvisor and Airbnb). BITOUR follows a classical BI architecture and provides functionalities for data transformation, data processing, data analysis and data visualization. At the core of the data processing, BITOUR offers mechanisms to identify tourists in Twitter, assign tweets to attractions and accommodation sites from Tripadvisor and Airbnb, analyze sentiments in opinions issued by tourists, and all this using geolocation objects in Openstreetmap. With all these ingredients, BITOUR enables data analysis and visualization to answer questions like the most frequented places by tourists, the average stay length or the view of visitors of some particular destination.
1. Introduction
Social and collaborative data have become an important source of information and knowledge in several domains, including political elections, emotion recognition, disaster management, smart cities, and spreading of diseases [1,2,3]. Much of this importance is due to a significant change in the Web. Internet users have gone from being consumers to creators of information, a phenomenon called Web 2.0, which allows online users to participate in social communities to (co)-create and distribute Web content [4,5,6]. An increasing number of Web users participate in such content sharing and online social activities.
Users are increasingly paying attention to comments posted on the Web before making a decision on, for instance, an online purchase. Users affirm that they feel more confident when checking the comments left on the website before going to a hotel, restaurant, or tourist attraction. In particular, the content created by tourists is perceived as highly reliable, credible, relevant, up-to-date and attractive [7,8,9].
In this paper, we focus on how to use data created collaboratively in social networks to analyze the tourism sector, an industry that greatly impacts economic performance and living standards of countries. Travel destinations continuously seek to improve their competitive position in the international or national tourist market and attract the largest flow of tourists according to their capabilities [10,11,12,13,14]. Taking 2019 as a reference, this economic sector grew 3.5% above the global economy, which grew 2.5%, generated 330 million jobs (1 in 10) and represented 10.3% of gross domestic product global. A important aspect in competitiveness improvement is the understanding of the sector through data analysis.
As a consequence of the increasing existing data, more and more information about tourists and attractions is stored. Thanks to the advances in data processing performance and machine learning maturity we can process all these available data in order to improve tourism competitiveness.
Spatial data also represents a valuable source of information to be able to geographically locate establishments, places, roads, attractions, etc. This information is very helpful to know the places visited by tourists, how long tourists spend at attractions, etc.
In this work, we use collaborative and spatial data sources that provide valuable knowledge for the analysis of the tourism sector. Specifically, we used four data sources OpenStreetMap, Twitter, Tripadvisor and Airbnb. With the information provided by these data sources and using Business Intelligence as technological support, a platform responsible for the entire process of extracting and consolidating data from these sources was created. This includes the extraction and integration of data in a consistent format, processing and structuring data to be used in analysis tasks and visualization of the analysis results. The built platform is called BITOUR.
Business Intelligence (BI) emerges as a concept for extracting and analyzing business data for better decision making, and as such BI is a good example which lays the foundations of leveraging the current explosion and dissemination of data. According to Gartner analysts, BI is “an umbrella term that includes the applications, infrastructure and tools, and best practices that enable access to and analysis of information to improve and optimize decisions and performance” [15]. BI incorporates a wide range of technologies such as Data Warehouse, online analytical processing (OLAP), data mining, benchmarking, text mining and prospective analytics [16]. The key success factor of BI lies in, among other aspects, its ability to manage internal and external sources composed of structured and unstructured data. BI architectures are rapidly spreading as a solution for tourism management and development [17].
The integration of collaborative data in a BI platform represents an attractive approach for the analysis of tourism information to discover the activities tourists carry out in a destination, the opinions about a particular destination, tourist attractions or the seasons more frequented by tourists according to nationality, among many other questions.
Existing tourism BI Platforms in the literature seek to integrate data sources to better tourism understanding. BI platforms in tourism are typically used for:
BITOUR enables to interactively define a destination to be analyzed, loading data from different types of sources like spatial or opinion data, executing routines to associate opinions to places, identifying users who are tourists as well as visualizing the data in the same platform. BITOUR created dynamic tables and graphics that make it possible to manipulate the results of all the operations carried out on the platform. In this way, tourist trends can be analyzed to shorten response time to events, put the focus on marketing campaigns, etc. In short, another way of approaching tourists and understanding them.
The paper is structured as follows; Section 4 presents an overview of the platform’s functionalities. Later, in the Section 5 we present how the different component are organized. Next, Section 6 highlights some key aspects of data processing such as the allocation of tweets. Finally, Section 7 illustrates how all the data incorporated in the platform can be exploited.
2. State of Art
The use of Business Intelligence solutions and collaborative data sources has increased in the decade both in isolation and together. In both academic and scientific literature, several benefits of the use of BI have been identified, including the optimization of operational work, improvements in the relationship with customers and suppliers, reduction in data redundancy, facilitation of new types of questions by part of end users, higher profitability, better decision support and creation of a competitive advantage [21,22,23].
One of the sectors that makes the most use of BI is the health sector, which includes data warehouses, OLAP systems and dashboards for monitoring health policies [24,25,26]; spatial data warehouses that seek to take advantage of patient information to facilitate a more effective approach to epidemiological treatments [27,28,29]; and use of data mining techniques to create a health profile of patients and communities to facilitate treatments [26,29,30].
Specifically, examples of online analytical processing (OLAP) and data mining applied to tourism can be found in:
Additionally, for some authors, Business Intelligence is one of the facets of Decision Support Systems (DSS) [40,41] and there are in the literature several examples of DSS that seek to integrate diverse sources to facilitate the decision-making process. For instance, The Tourism Management Information System (TourMIS) [42] is a DSS financially supported by the Austrian National Tourist Office and the European Travel Commission and it is developed according to the specific requirements of tourism managers. TourMIS provides an integrated view of various data sources, which can be visualized and analyzed through a graphical interface. TourMIS accommodates official data from Eurostat and the Federal Statistical Office as well as local and national tourism data supplied by the respective tourism organizations, and it returns trends of occupancy rates, number of visitors, hot destinations, etc.
Similar to the previous example, The Exposing Tourism Indicators as High Quality Linked Data (ETIHQ) is a tourism DSS which draws upon TourMIS and allows visualizing and analyzing statistical indicators from different data sources and from different domains (tourism, economics, environment) [18]. ETIHQ exploits semantic technologies and opinion mining techniques to process the collected data and extract actionable knowledge from the repositories. In addition, it showcases statistics from TourMIS as Linked Data (LD), allowing tourism practitioners to connect to other sources of indicators and explore linked data archives. ETIHQ experienced difficulties in performing data integration because most open data are offered under different syntactic formats that require substantial effort for integration. From a semantic standpoint, the difficulties stem from the use of different terms for the same entity, different geographic granularity or measurements at different time intervals.
Both TourMIS and ETIHQ use official data to a large extent. An attempt to integrate data from heterogeneous sources is found in [43], where authors present an application of BI to the tourism industry, specifically, a case study of a local food festival in Thailand. This system integrates massive data about products purchased by tourists, experienced services, evaluated destinations as well as data about accommodation, and translates such data into a meaningful information so that event organizers understand the behavior of tourists in order to increase their satisfaction and boost revenues and profits. The framework relies on an architecture composed of a database management systems, business analytic, business performance management, machine learning techniques, and data visualization to guide the analyze.
On the other hand, collaborative data sources have been used to understand user behavior. Different collaborative sources according to the particular nature of your data can be used to extract different types of information. For example:
- Twitter has become a valuable source of information for different types of analysis, allowing the extraction of knowledge [44]. Some of the most widespread uses of Twitter data in analysis tasks are: Extracting the sentiment expressed in the text of tweets using techniques that range from the simplest such as word bags to the most advanced as algorithms of machine learning (vector support machines, neural networks, etc.) [45]; It has also been used in specific domains such as tourism to know the image that tourists have of a destination, identification of tourists and residents, etc. [46]; Use of geographic information that can be extracted from tweets to determine the routes of users, places of concentration of people and the length of stay in a place [19].
- OSM it has become the leading example of VGI on the Internet. OSM is not just a collectively created geospatial database but has developed to the point of becoming a vast ecosystem of data, software systems and applications and tools that make use of the data contained in OSM [4,47,48]. One of the most frequent uses of OSM is oriented towards the definition of transit routes (bicycles, people in wheelchairs and vehicles), thus allowing users of these services to obtain timely and visual information on both routes and the situation of the traffic [49,50]; and Map services for finding places like houses, attractions, restaurants, etc. These services allow answering questions such as, where is place X? What is the distance between places X and Y? What is the best route between two points X and Y? [51,52,53].
3. Methodology
The objective of BITOUR is to provide insight of the tourism development of a country or geographical area by using collaborative and open data. Ultimately, we seek to gather and analyze people opinions and feelings in order to have a picture of the tourism industry of a destination.
BITOUR follows a three-phase methodology for the design and development of the platform. Subsequently, we explain these three phases.
3.1. Requirement Analysis
At this stage we identify the requirements to accomplish the objective of BITOUR and review the expectations of obtaining a tourism prospect of a destination. The requirement analysis is in turn composed of two stages:
- Analysis of information needs. Given a particular destination, BITOUR requires data of visitors’ opinions and facilities provided by the destination. Specifically, (a) data should contain the opinion of travelers about a destination and its points of interest, (b) data sources should mainly be openly accessible and contain geo-referenced information (c) data sources should be collaborative data sharing platforms that provide a manageable access to data.BITOUR data sources collect a large variety of data ranging from points of interest, accommodation facilities, restaurants, tourists’ opinions about places, etc. Additionally, we use open data publicly available.
- Information strategy roadmap: BITOUR must allow users to select the geographical area of study so as to load data referred to the area of interest. Additionally, BITOUR must keep it open the possibility of including further data sources in the long run.
3.2. Solution Design
In this phase we define the building blocks of the platform and we present a high level design of the blocks.
- Technical Environment. In order to accomplish our objective of making data available for free, we restrict to free-use tools and environments such as the PHP programming language and the Postgres database system. In addition, a web environment over a desktop environment was used to make the site available to anyone interested.
- Data sources. The primary data sources of BITOUR are:
- OSM: it is the leading and most complete project of free and collaborative geographic information worldwide. In addition, it provides automatic access mechanisms to the spatial information of a place of interest through APIs.
- Twitter: it is the most popular and used microbloging social network worldwide, thus becoming a valuable source of information on personal opinions. Additionally, geo-referenced tweets are very helpful for tourism analysis.
Data sources which provide complementary information are:- Tripadvisor: it provides information about accommodation location, price and ratings. Among the multiple virtual travelling platforms, Tripadvisor comprises the largest amount of content created by users in terms of reviews and ratings of establishments.
- Airbnb: it is the world leading project in providing a mediation service between hosts and travelers for informal accommodation, generally for tourism purposes. It provides relevant data of establishments such as the price, evaluations and location. Airbnb complements the formal accommodation data (hotels and hostels) of Tripadvisor.
- Requirements definition. At this stage we identify the dimensions needed to define the requirements previously analyzed such as time, tourist attractions, travelers’ opinions as well as the metrics of the data analysis such as the number of tweets per user and length of stay. Finally, it is key to define the level of granularity, or level of detail in which the data will be stored. In BITOUR, data is stored at the level of granularity of a single user, a single tweet, a single point of interest, a single hotel, etc. Establishing relationships among these data is needed in order to uncover useful information. That is, tourists need to be identified among the users posting tweets in the area of interest; tweets must be related to specific points of interest or accommodation facilities to discover which ones of them are visited, etc.
- Solution architecture. We define and design at a very high level the building blocks of BITOUR.
- System architecture: It follows a classical BI architecture with four layers: ETL, data integration, processing and visualization. Details about this architecture will be shown in Section 5.
- ETL architecture. In this step, we define the strategy that will be used to extract the data from the sources and the way data will be processed. Data extraction is performed via the APIs provided by each data source and our own implementations (see Section 5.1).
- Data integration. Data extracted from the sources are integrated into a common and consistent data warehouse. This will allow to organize the information in a way that optimizes the performance of the queries. The details of the data model will be given in Section 5.2.
- Visualization. The navigation structure of the website displays how data will be browsed by the user (see Section 7).
3.3. Implementation and Deployment
This step consists in the actual implementation of the platform.
- Database and ETL development. This phase comprises the definition of the routines for extracting data from the sources and the data processing to derive information that will then populate the database. The APIs provided by the data sources are used and the code that allows access to them is created (Section 5.1). Furthermore, routines for assigning tweets to places are implemented using different criteria. The routines for the identification of tourists and those for the calculation of basic statistics are also coded.
- Web environment. We build a prototype of a web application that integrates all the functionalities, data loading, processing and visualization of the derived data.
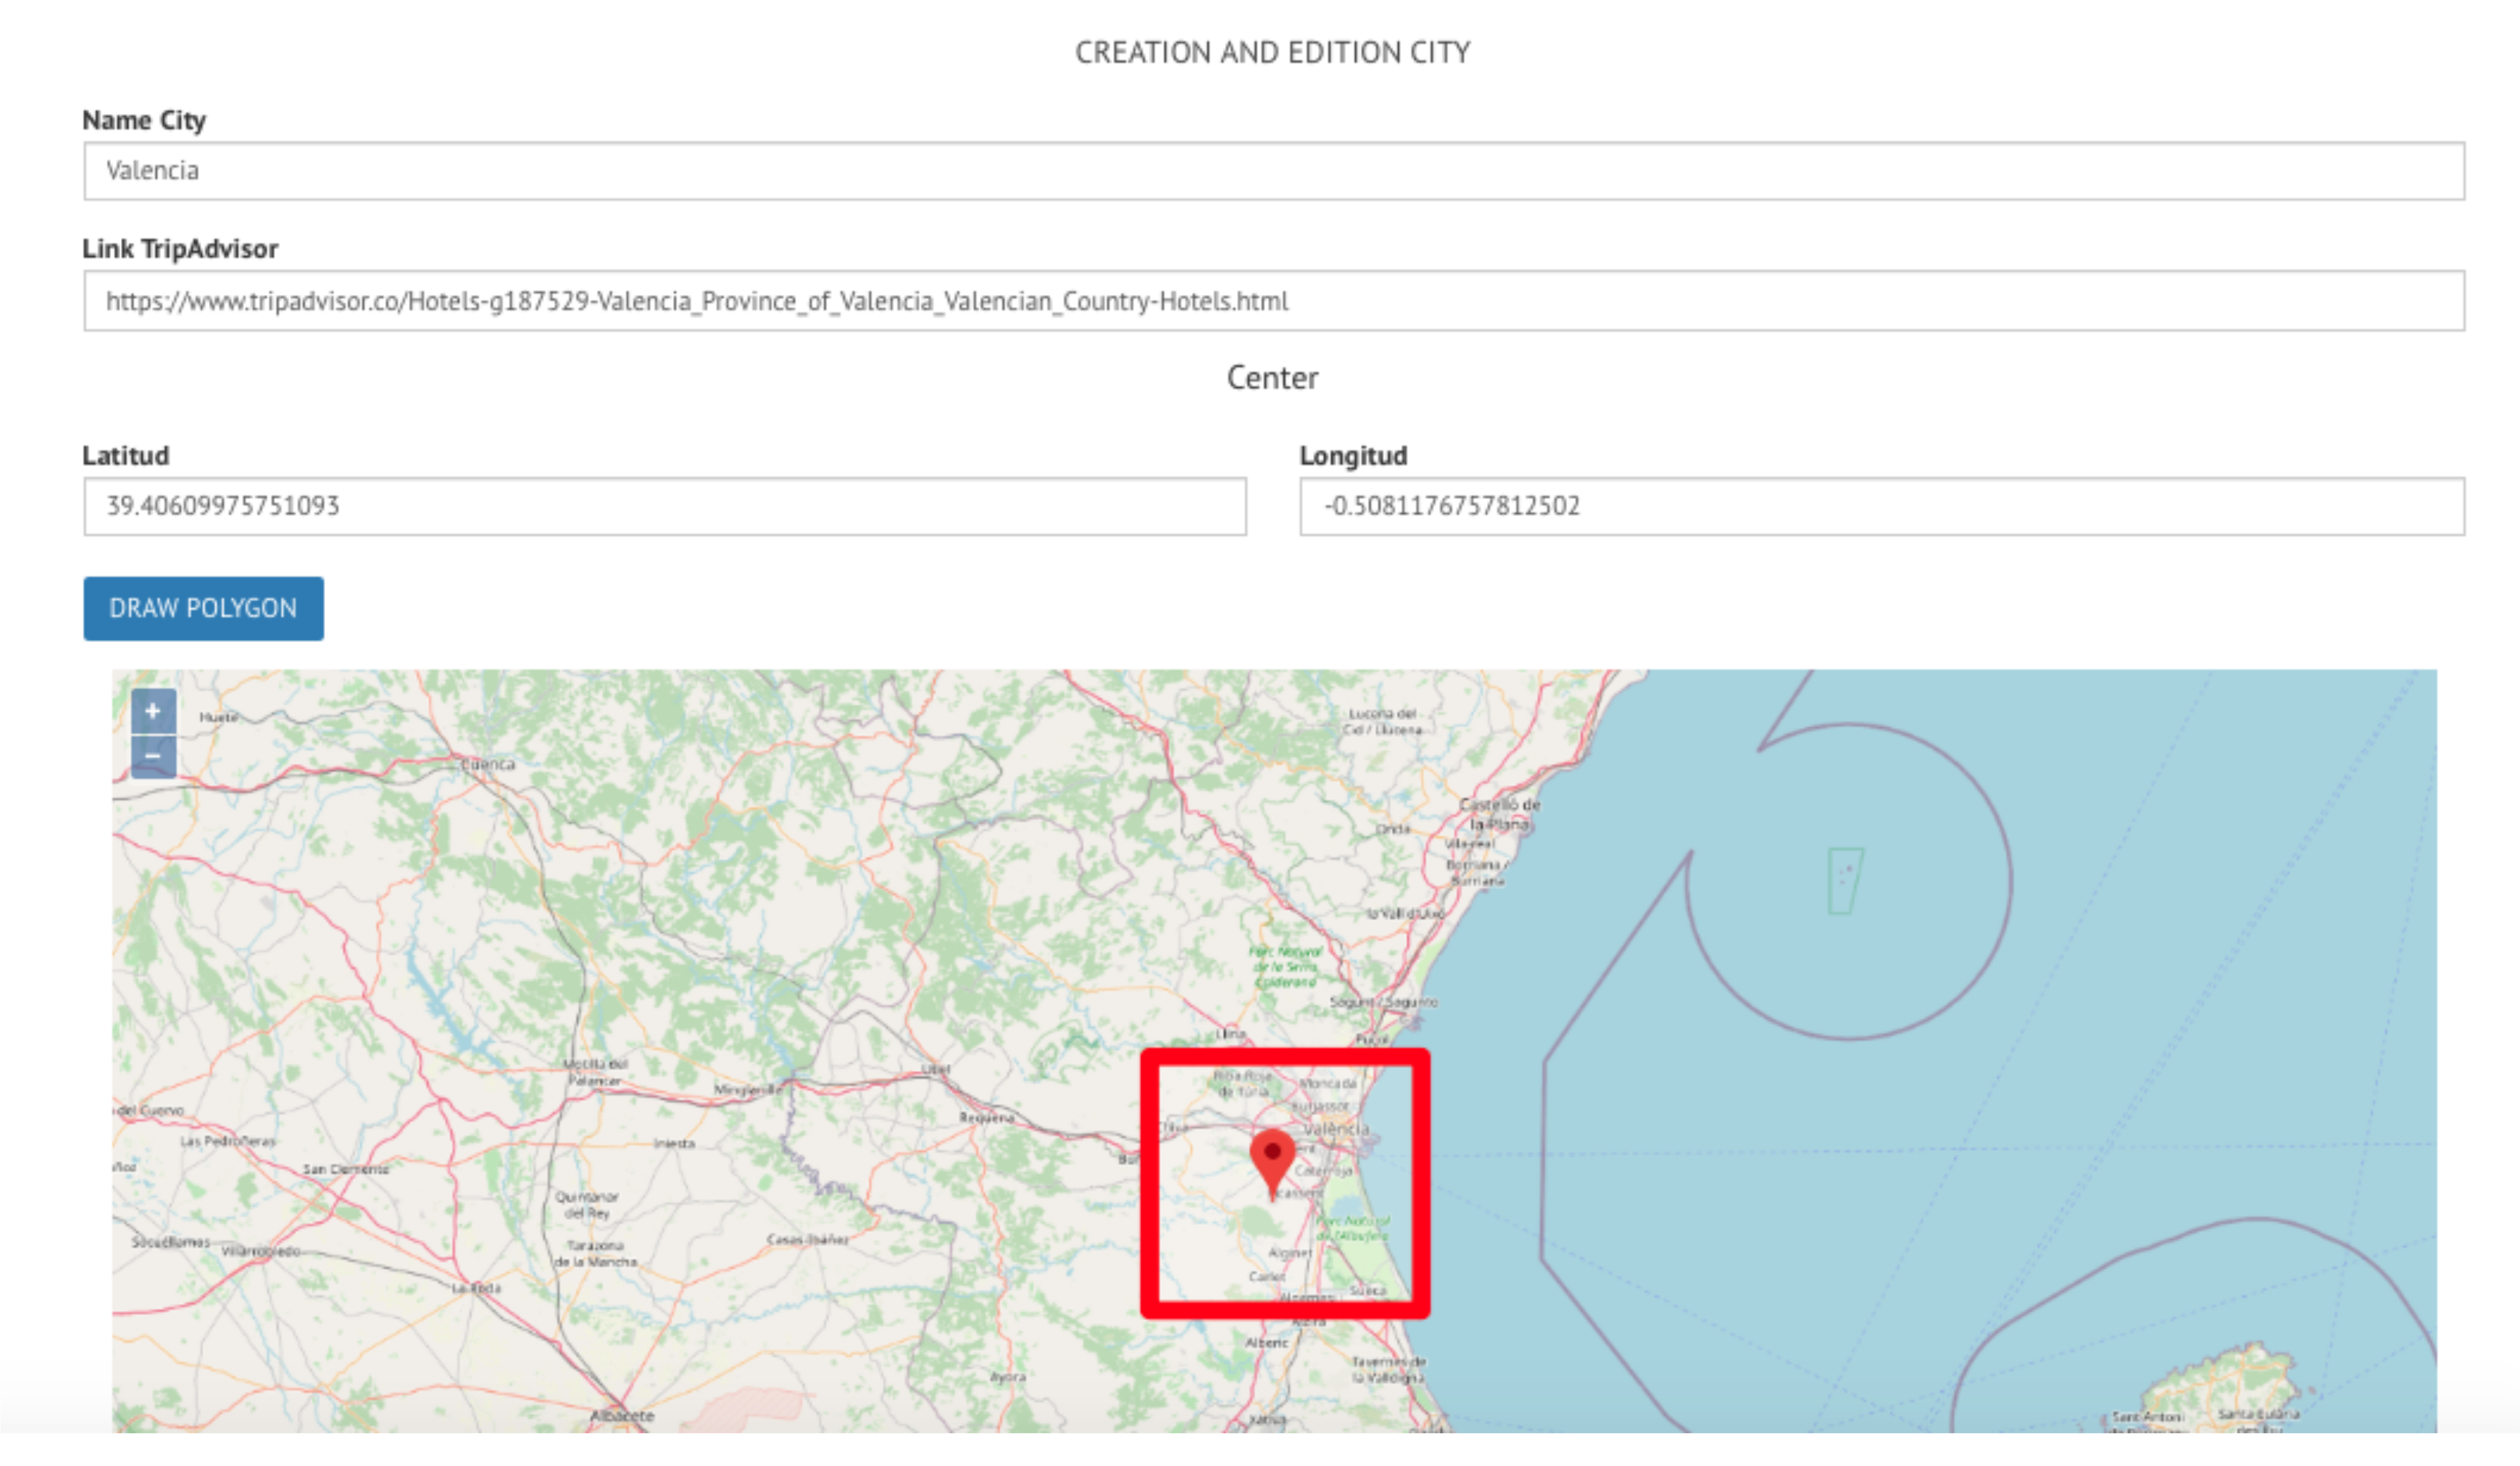
- Deployment. The prototype developed is deployed in a production environment (server) with a public IP address that allows access from the various entities. In this server, all the tools, libraries and languages used by BITOUR are properly configured. Figure 1 shows a graphical view of BITOUR during deployment. The figure geographically displays the destination to analyze (Valencia city, Spain, in the figure). The tool allows to zoom in the red rectangular area and get a close-up map view of the city.
4. System Overview
BITOUR is a BI platform specially oriented to the analysis of tourist destinations with an emphasis on the use of content and data created by the users of Web 2.0. The backbone of the tool is made up of data sources that are independent of the tourism domain, namely, one with spatial information (such as OpenStreetMap) and another with social information (such as Twitter). The content that BITOUR handles is, importantly, of two types:
- Spatial: represents information related to the location and shape of places of a destination, according to a geographic coordinate system.
- Social: represents opinion data that is attributed to a destination such as text created in microblogging.
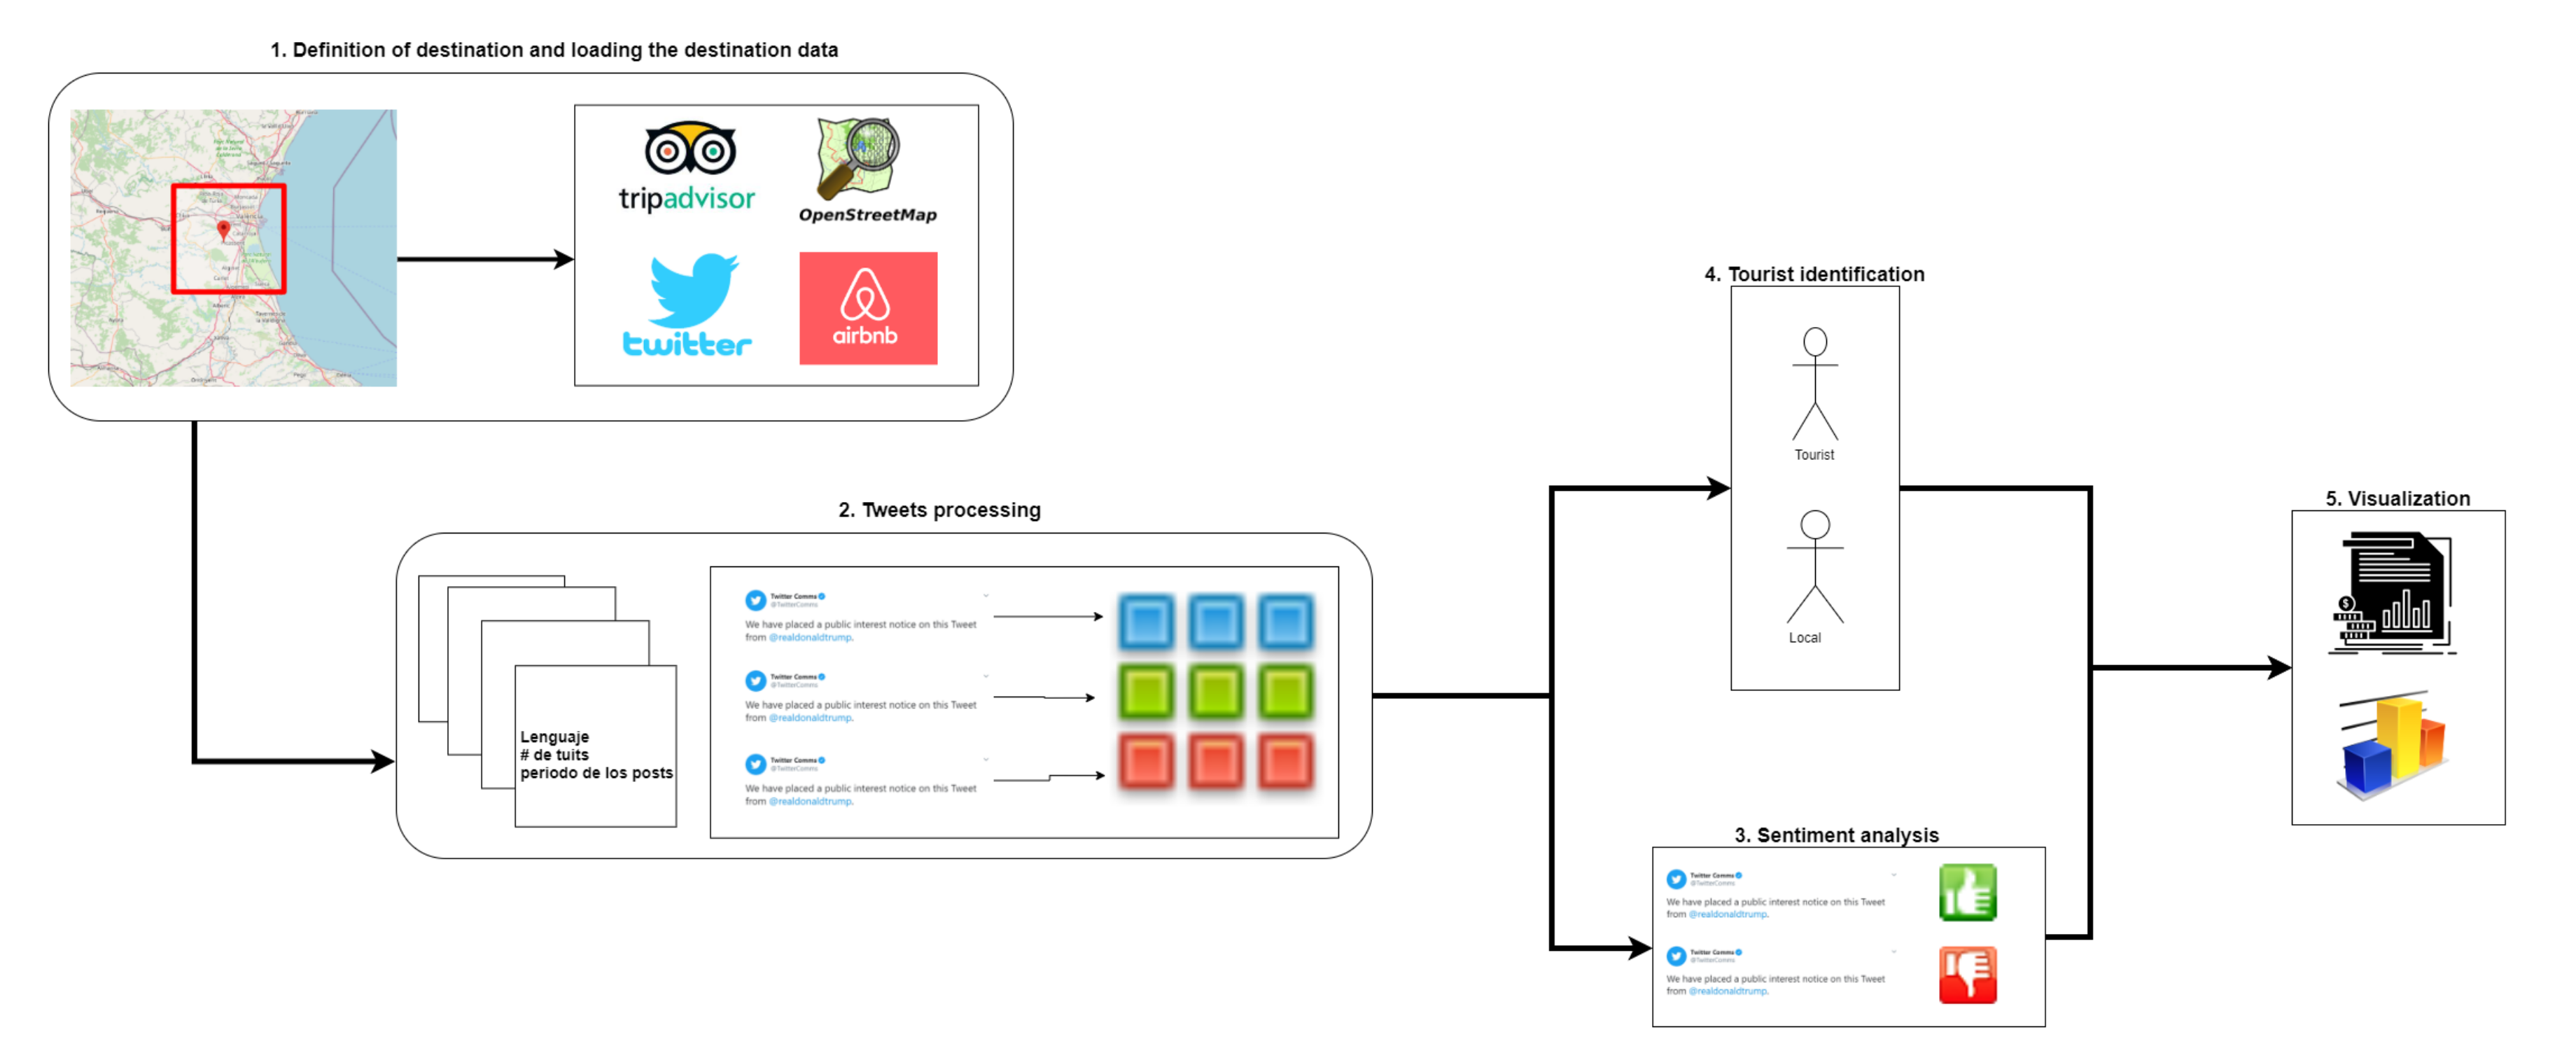
The general process supported by BITOUR is made up of five functionalities (see Figure 2):
- Definition of destination and loading the destination data. As can be seen in Figure 2, the first functions that BITOUR offers is to define the destination of interest and specifying the elements of the destination to be loaded into the platform from each of the sources.
- Tweets processing. The tweets obtained in the data upload are assigned to the objects closest to the destination following priority and distance criteria and a series of statistics and data corresponding to the number of tweets sent, period of stay, etc. are calculated for each user who has sent tweets.
- Sentiment analysis. The text of the tweets is analyzed to determine if it expresses a positive or negative sentiment.
- Tourist identification. This function consists of deciding the users that can be considered as tourists.
- Data analysis and visualization. Finally, all the data downloaded and processed in the functionalities described above are made available to the analyst. The analyst can combine and explore the data, create graphs from it, and examine the spatial distribution of the resulting data in order to obtain information to support the decision-making process.
A user in BITOUR can adopt any of two roles, administrator or analyst. Each one of the aforementioned functionalities is performed by either the administrator or analyst:
- administrator: this role groups together all the functionalities that the platform has for its configuration and for the specification of destinations. In this way, the definition of the destination or data load, among other functionalities, can only be performed by a user under the administrator role.
- analyst: in this role, the functionalities that the platform has to analyze a destination are grouped once all the necessary variables for data analysis have been configured.
The administrator has four functionalities, all of them with the same purpose of preparing the destination data for later analysis. Among these functionalities is the definition of the destination and data loading and all the processing of the loaded data (assignment of tweets, analysis of sentiments and identification of tourists).
On the other hand, the analyst is responsible for the data analysis and visualization functionalities, which in turn can be broken down into three tasks that are: (1) creation of dynamic charts and tables; (2) filtering data on a map; and (3) distribution of tweets around the attractions of a destination. This last functionality is, perhaps, the most important because it is oriented to fulfill the purpose for which the platform was created; that is, the use of collaborative data and calculations made from them to support the decision-making process in the tourism domain.
5. Architecture
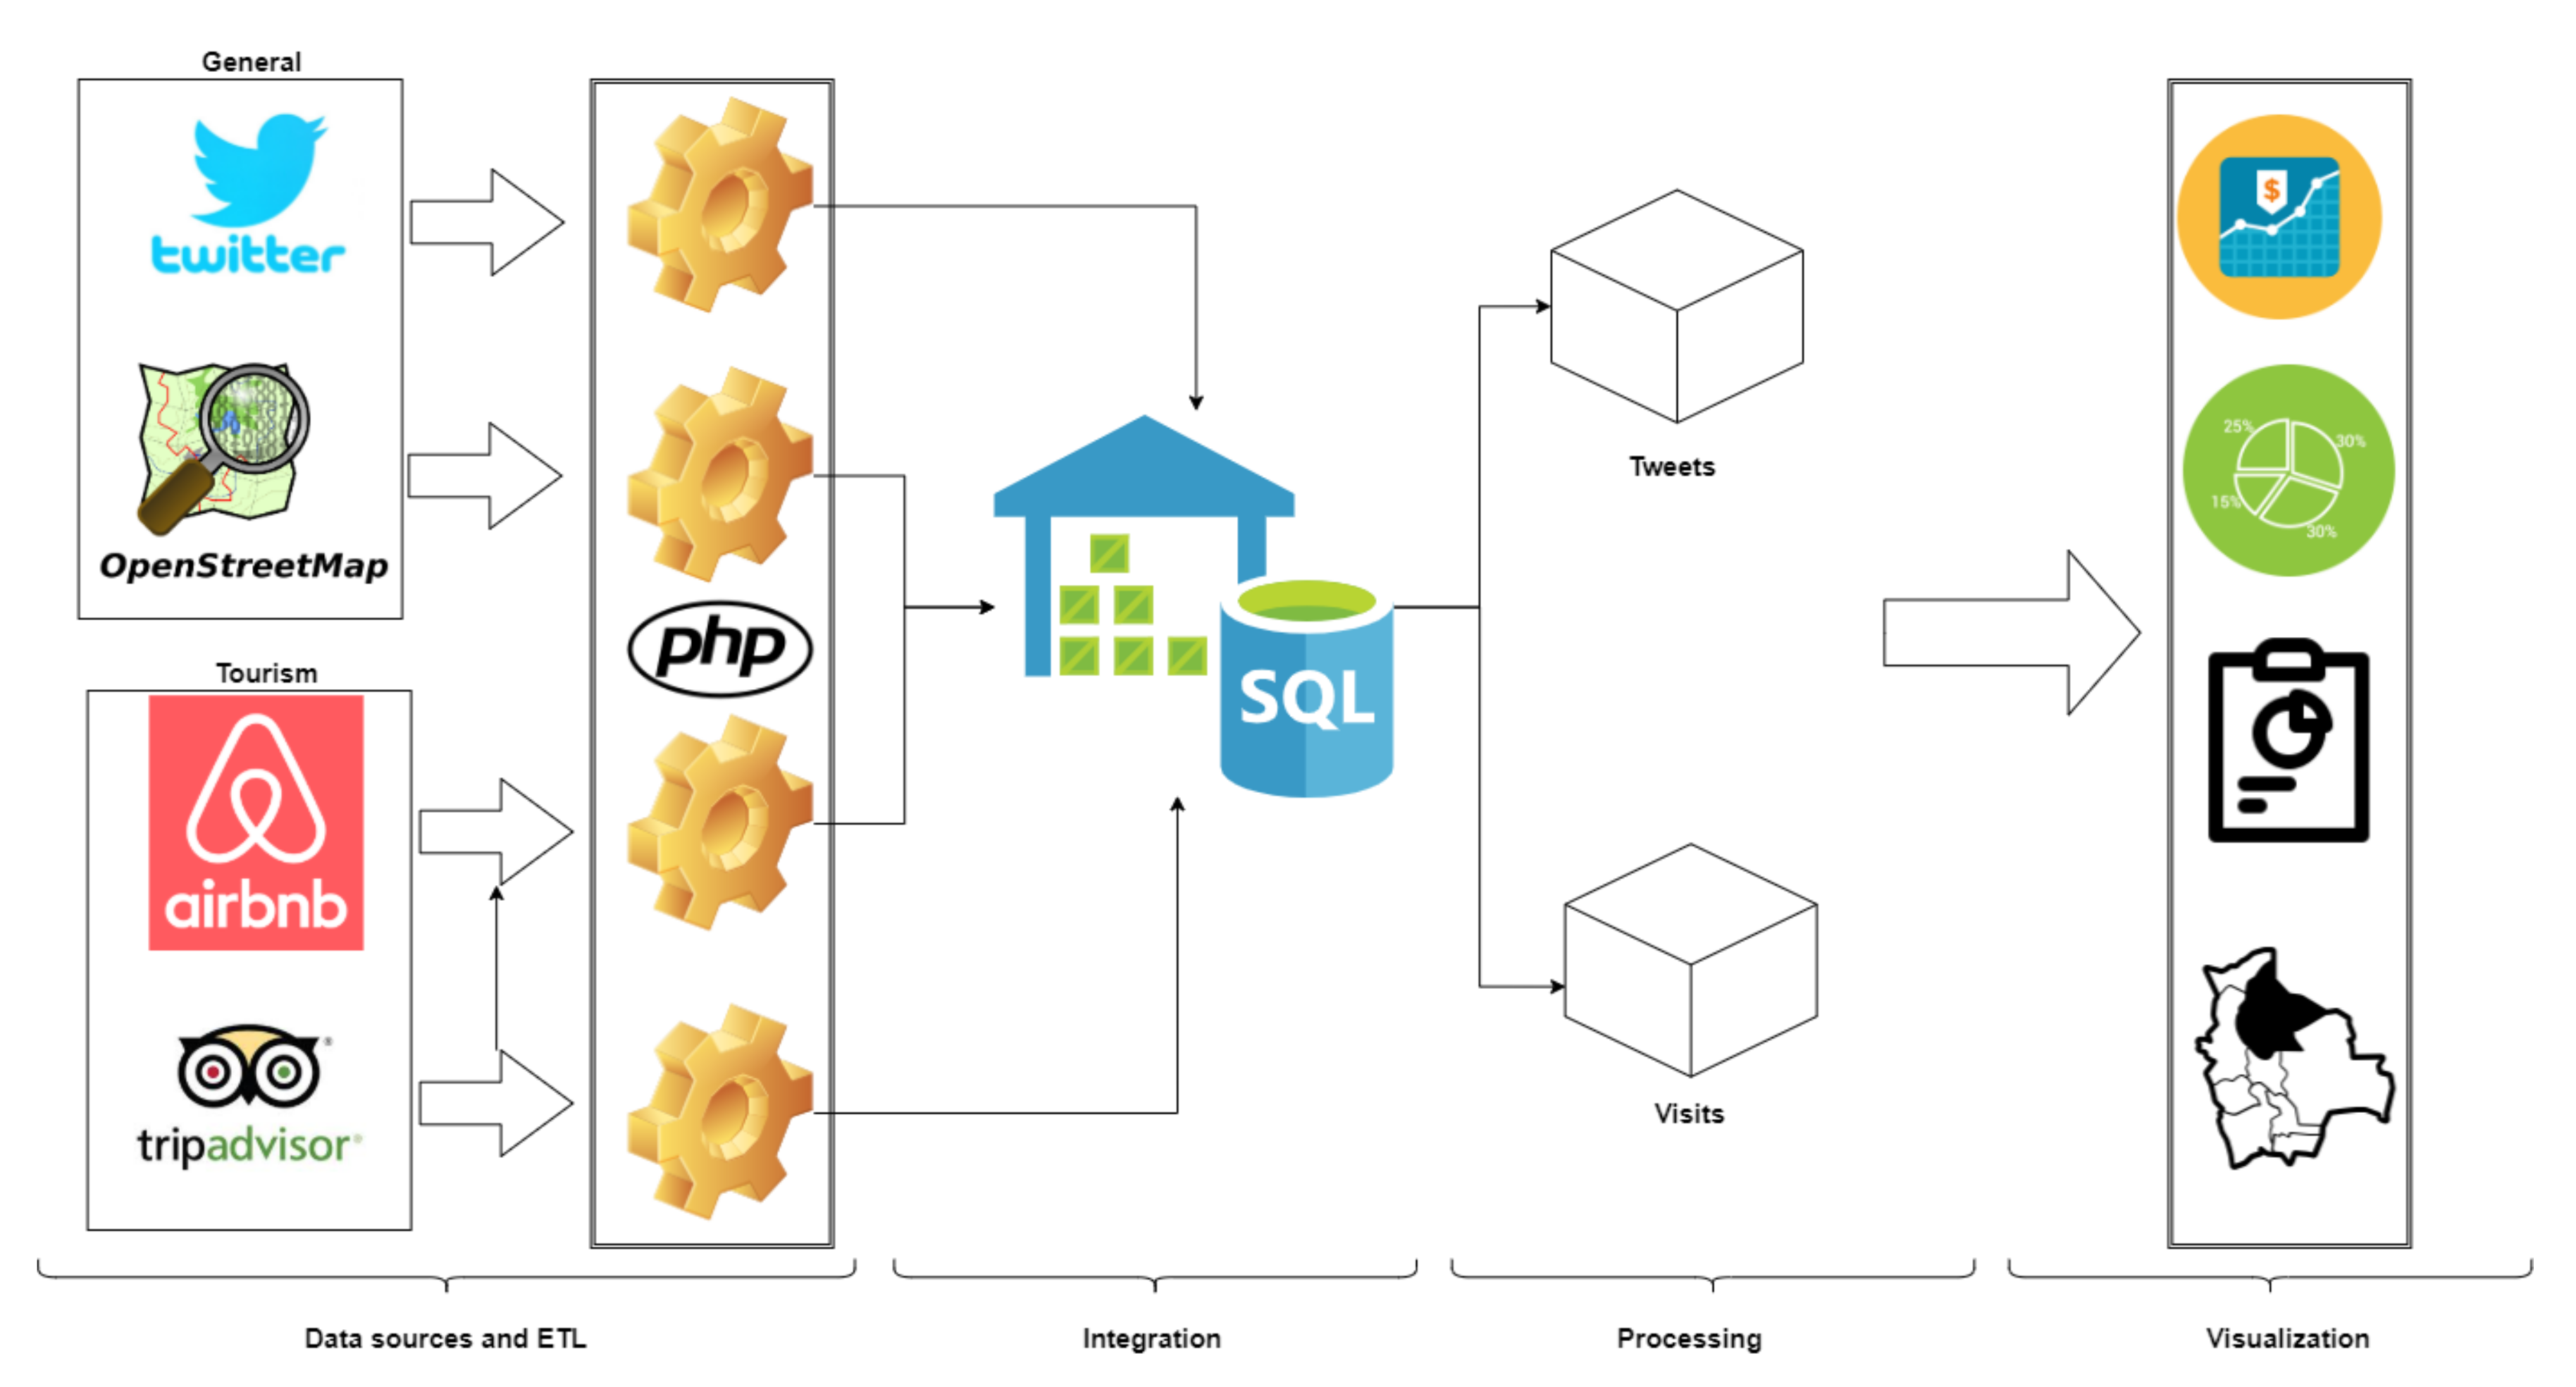
Figure 3 shows the architecture of BITOUR, which is composed of four layers: the Data Source and ETL layer; the Integration layer; the Processing layer and the Visualization layer. We can observe in Figure 3 that each layer uses products or results from the preceding layer like, for instance, the Visualization layer is fed with the output of the data processing.
The following sections illustrate in detail the operations performed at each layer of BITOUR, also depicting the tools used for the design of BITOUR.
5.1. Data Source and ETL Layer
As can be seen in Figure 3, we used four data sources in BITOUR, which provide relevant and necessary information for the analysis of the tourism sector. Two of them are general-purpose sources: OpenStreetMap (OSM) provides spatial data and Twitter provides social data in the form of public opinions and comments about spots of a destination:
- OSM: it records the location and geometry of millions of places in the world that are freely accessible. OSM allows access to different places located within a destination, such as museums, restaurants, monuments, etc. Additionally, OSM data can be queried in various ways, among which the following stand out: (a) by geographical areas (for example, the city of Valencia); and (b) by labels of the form key/value to classify objects (for example, objects where tourism = museum).
- Twitter: it is the most popular microblogging network in the world. It stores the opinion, state of mind and position of millions of people about any type of event around the world. It also provides easy access to its data through an API that allows retrieving the opinions expressed about a tourist destination.
Additionally, BITOUR uses two other data sources specific to the tourism domain, Tripadvisor and Airbnb:
- Tripadvisor: it provides data on the facilities and services of tourist services of a destination. In BITOUR, Tripadvisor is used to acquire information about the hotels located in a particular destination.
- Airbnb: this source, similar to Tripadvisor, provides data of accommodation services, mainly for tourism purposes, which cannot be classified as hotels and are mostly informal accommodation.
The Extract, Transform and Load (ETL) process for all data sources, as seen in Figure 3, was implemented using the PHP programming language. This process consists in accessing each data source, extract and process the target information and load it in a data warehouse. This ETL process is explained in Section 6.
5.2. Integration Layer
As shown in Figure 3, the goal of this layer is to integrate the data from the four sources used in one place, the data warehouse. This warehouse is built using the approach proposed by Bill Inmon [54]; namely, the entire standardized data model is configured first, and then the rest of the analysis structures are configured, whether they are departmental data stores or OLAP cubes.
Data in this layer is basically of two types: non-spatial and spatial. The first type contains all the textual or numerical information concerning the characteristics of objects or entities such as the name of an attraction or the price of a hotel; in the second type, the geographic and geometric coordinates of a place are stored. As indicated in Figure 3, the data warehouse was implemented in an SQL (or relational) database. The handling of non-spatial data was carried out using the PostgreSQL database management system; and to handle the spatial data, PostGIS, the PostgreSQL plug-in for spatial data, was used.
Some important entities in the data warehouse are the following:
- Destination: this entity stores all the created destinations in the platform. For each destination, the following information is stored: name, geographical center and geographical bounding box. This entity is transversal to the other entities, since all data and operations take place in the scope of a destination.
- OSM places: this entity stores all the OSM objects that have been downloaded for each destination. For each object, it is stored the name, the associated OSM tags, the geometry, among others.
- Tweets: this entity stores the tweets data, including the user, the tweet coordinates, the language assigned by Twitter, among others. From this information, another entity is created to store the information regarding the Twitter users.
- Entities Hotels and Airbnb store information about accommodation extracted from TripAdvisor and AirBnB, specifically, name, location and price, among others.
The data in the Data Warehouse is updated on demand. In other words, the user interested in the analysis tasks can update the data at any time. Some of these data is updated directly from the platform and others must be uploaded. This is explained in Section 6.
5.3. Processing Layer
This layer, as shown in Figure 3, takes the integrated data from the data warehouse and processes and restructures it so that it can be efficiently exploited by the visualization layer. In this layer, two main components can be found:
Processing. This component is responsible for taking the data, as it has been integrated from the different sources, and performs operations and calculations on them, deriving useful information for subsequent analysis. Two main tasks of this component are the tweets assignment, which allows to assign the tweets associated with a destination to particular places within that destination, such as attractions, hotels, restaurants, etc. and the tourist identification, process which determines which Twitter users can be classified as tourists, so as to focus the analysis on these users. This component will be detailed in Section 6.
OLAP Cubes. OLAP cubes allow to structure data in a multidimensional way to make it easier to consult. For this work, a ROLAP processing scheme has been selected so that the data always resides in departmental data stores. Specifically, two cubes are defined, one that allows analyzing the visits of tourists and the other that allows analyzing the tweets made. This will also be detailed in Section 6.
5.4. Visualization Layer
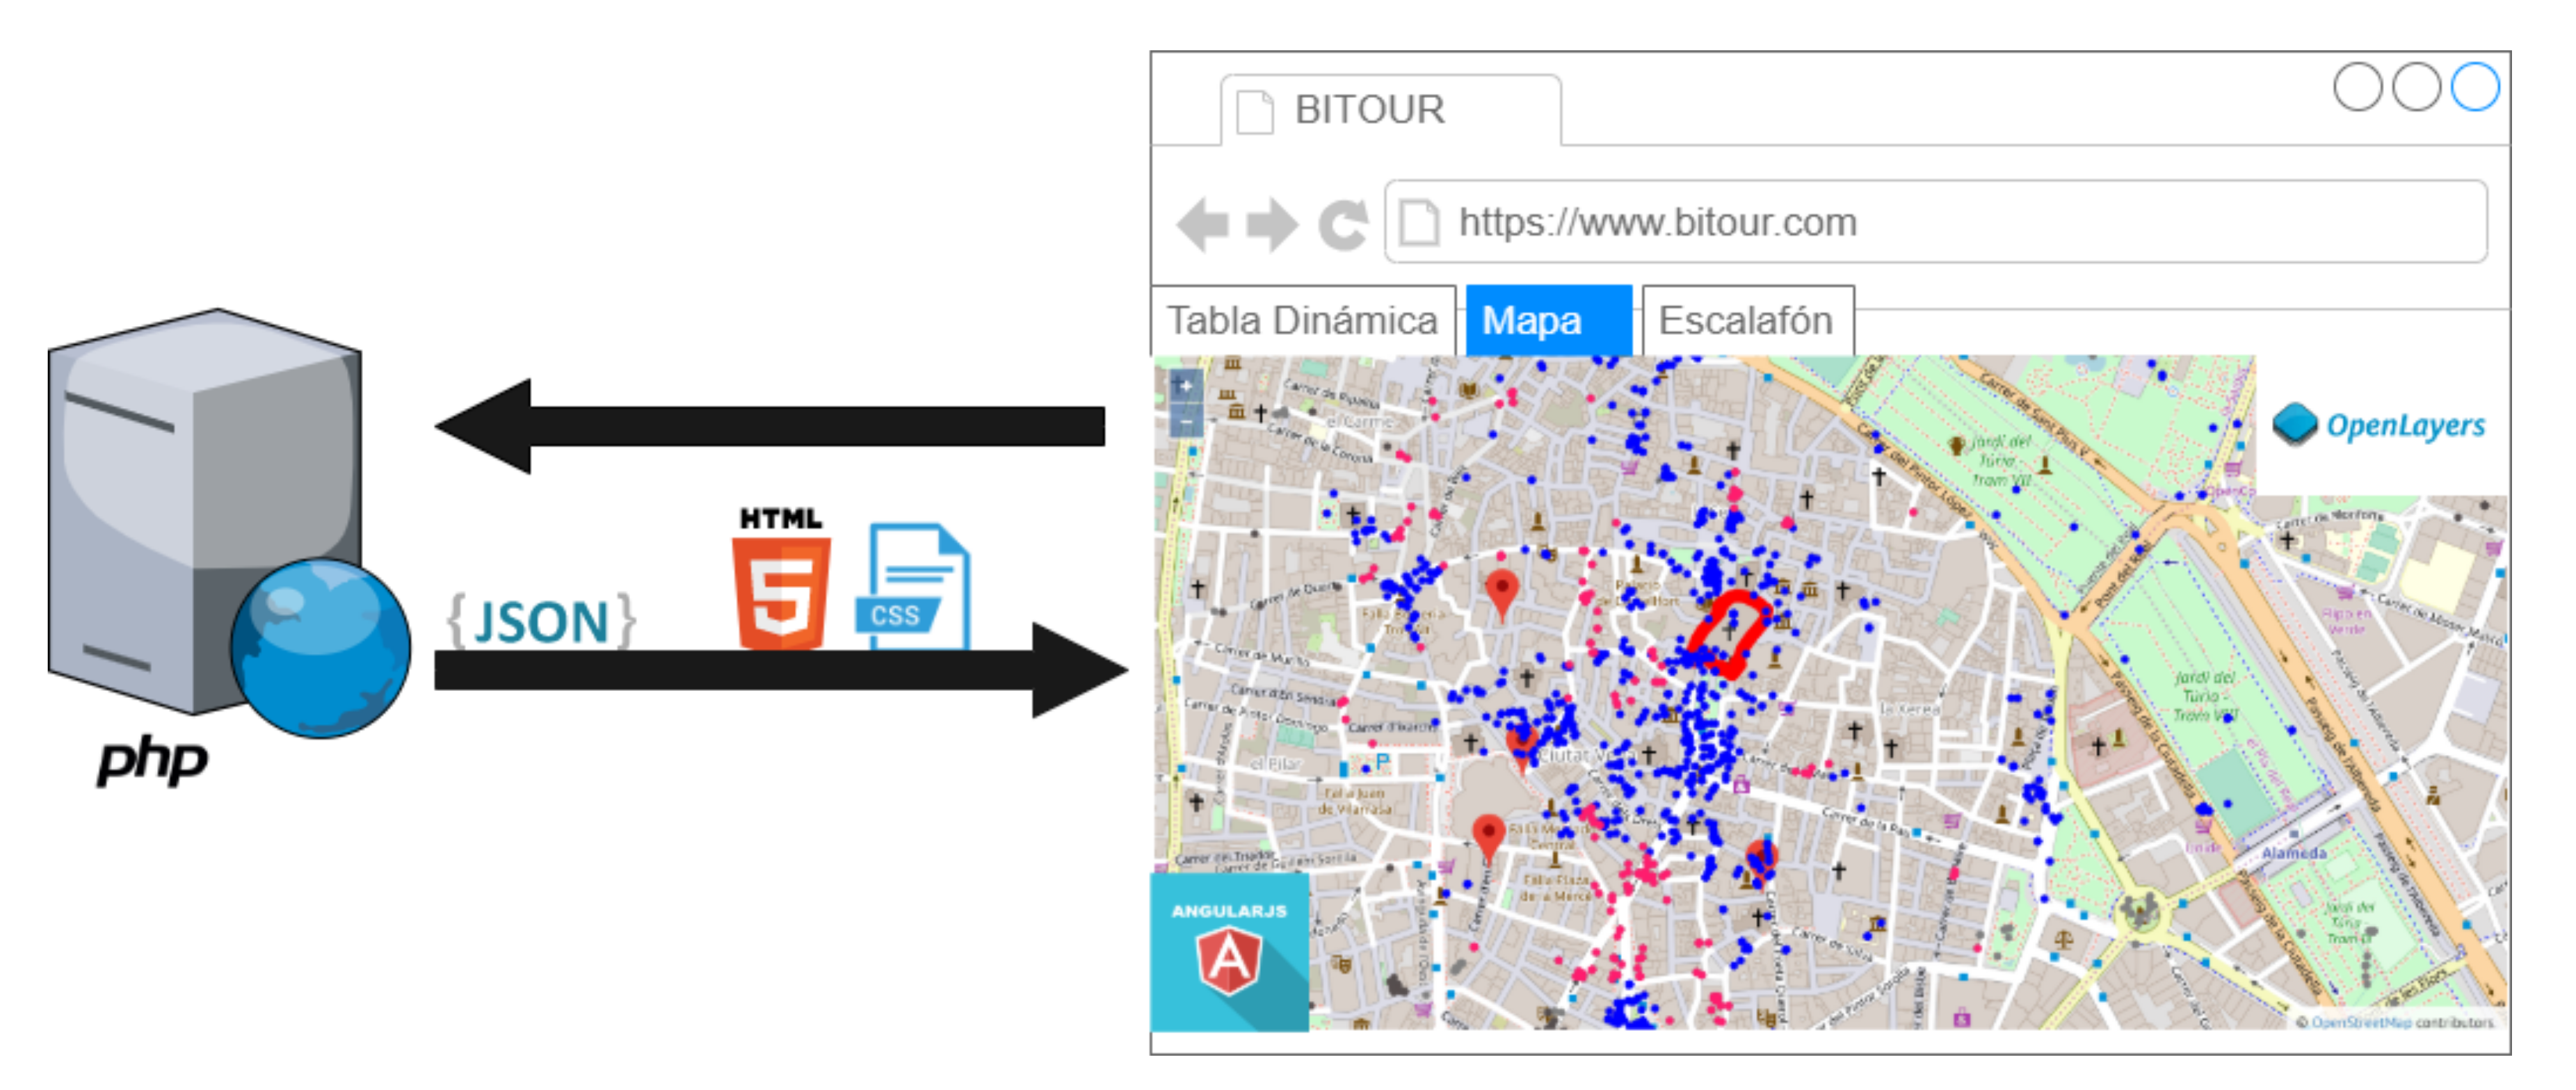
As the figure shows Figure 3, this is the last layer of the architecture and it is responsible for making all information available to interested users. To fulfill this purpose, BITOUR makes use of a group of technologies that are articulated to make the different analysis tasks possible. These technologies are:
- JavaScript Object Notation for data exchange.
- OpenLayers for displaying maps.
- HTML5 for the definition of the structure of the web pages.
- CSS3 y BootStrap to define the appearance of web pages.
- AngularJS to handle the dynamism of the page and the asynchronous requests to the data service
- PHP as a programming language to define the logic of data services.
Figure 4 shows a typical interaction for this layer. The user requests from the browser an address of a resource; the server returns a set of data in JSON and a web page (HTML5) with its style (CSS3); This data is received by the browser and through code in AngularJS the data is displayed on a map created with OpenLayers. Each of the technologies mentioned is described below.
6. Data Processing
This section deeps into some BITOUR functionalities that require further explanation, namely the information extraction process in the Data Source layer, the tweet assignment and other procedures to derive new information in the Processing layer, and the OLAP cubes configuration.
6.1. Information Extraction
Table 1 summarizes the data sources used in BITOUR, the data that extracted from each of them and the type of access. Some relevant aspects of the extraction process are:
- Twitter data is downloaded from the Search API (Application Programming Interface), which allows to obtain the tweets posted in a specific geographic area in a JSON (JavaScript Object Notation) format. For instance, in our case, we collected around 570,000 tweets for the city of Valencia in Spain for the period between February 2015 to February 2018, and around 670,000 tweets for the city of Berlin in Germany for the period between February 2015 to August 2018. Data comprised in tweets is split into the user information and the rest of fields in the tweet (text, hashtag, location, language).
- TripAdvisor data cannot be accessed through an API and, for this reason, data about hotels is obtained by web scrapping. This means it is necessary to access the HTML code of the webpage, analize its structure and navigate through the page sections to extract the target information.
- AirBnB does not provide automatic access to data through an API either; however, there exist third-party applications such as Inside Airbnb (http://insideairbnb.com/) that make data available in CSV format (Comma Separated Values).
Given that OSM is the cornerstone of BITOUR, we will explain its extraction process in more detail. OSM data are accessible through the Overpass API. In this work, the approach that has been followed for data retrieval is to use the abstraction layer provided by the BITOUR platform to group the OSM tags under more general categories that may be of interest for the analysis tourist. In this way, for example, the tags tourism = museum and amenity = art_center can be grouped under the category museum. Table 2 shows the mapping between the tourism category used in this work and the OSM tags. During the OSM data recovery process, which is done for one particular destination, the objects associated to the OSM tags in Table 2 are retrieved for each category.
Using the specific case of the ‘Museums’ category (see Table 2), we can see that this category is associated with two tags. The process to retrieve the information is as follows:
- A data query is created using the Overpass API syntax for each of the tags that make up the category. Thus, a query is created to retrieve the objects where the key tourism is equal to museum and another where the key amenity is equal to art_center. The following Algorithm 1 shows the query for the case of the first tag.
- For each of the queries created, an HTTP request is made to the OSM data server, which is in charge of processing it and retrieving the OSM objects that meet that condition. For the example of museums in Valencia, Spain, objects such as the fallero museum are recovered (see Algorithm 1). In this code snippet, we can see that information such as street (addr:street = “Plaça Montolivet”) comes along with the object.
- The recovered objects are grouped into a single package and returned to the client. The latter is responsible for processing the data returned by each of the requests and saving them in the data warehouse.
- [out:csv(::id,::type,"name")];
- area[name="Valencia"];
- way(area)[tourism=museum];
- out;
| Algorithm 1: Fallero Museum represented in OSM. |
|
6.2. Tweet Assignment
This procedure constitutes a cornerstone for the operation of BITOUR because it serves as a support for both subsequent visualization tasks and input data for other tasks, such as the identification of tourists. The purpose of this procedure is to assign a tweet to a place in order to know from which place the tweet was made. The procedure is based on the following premises:
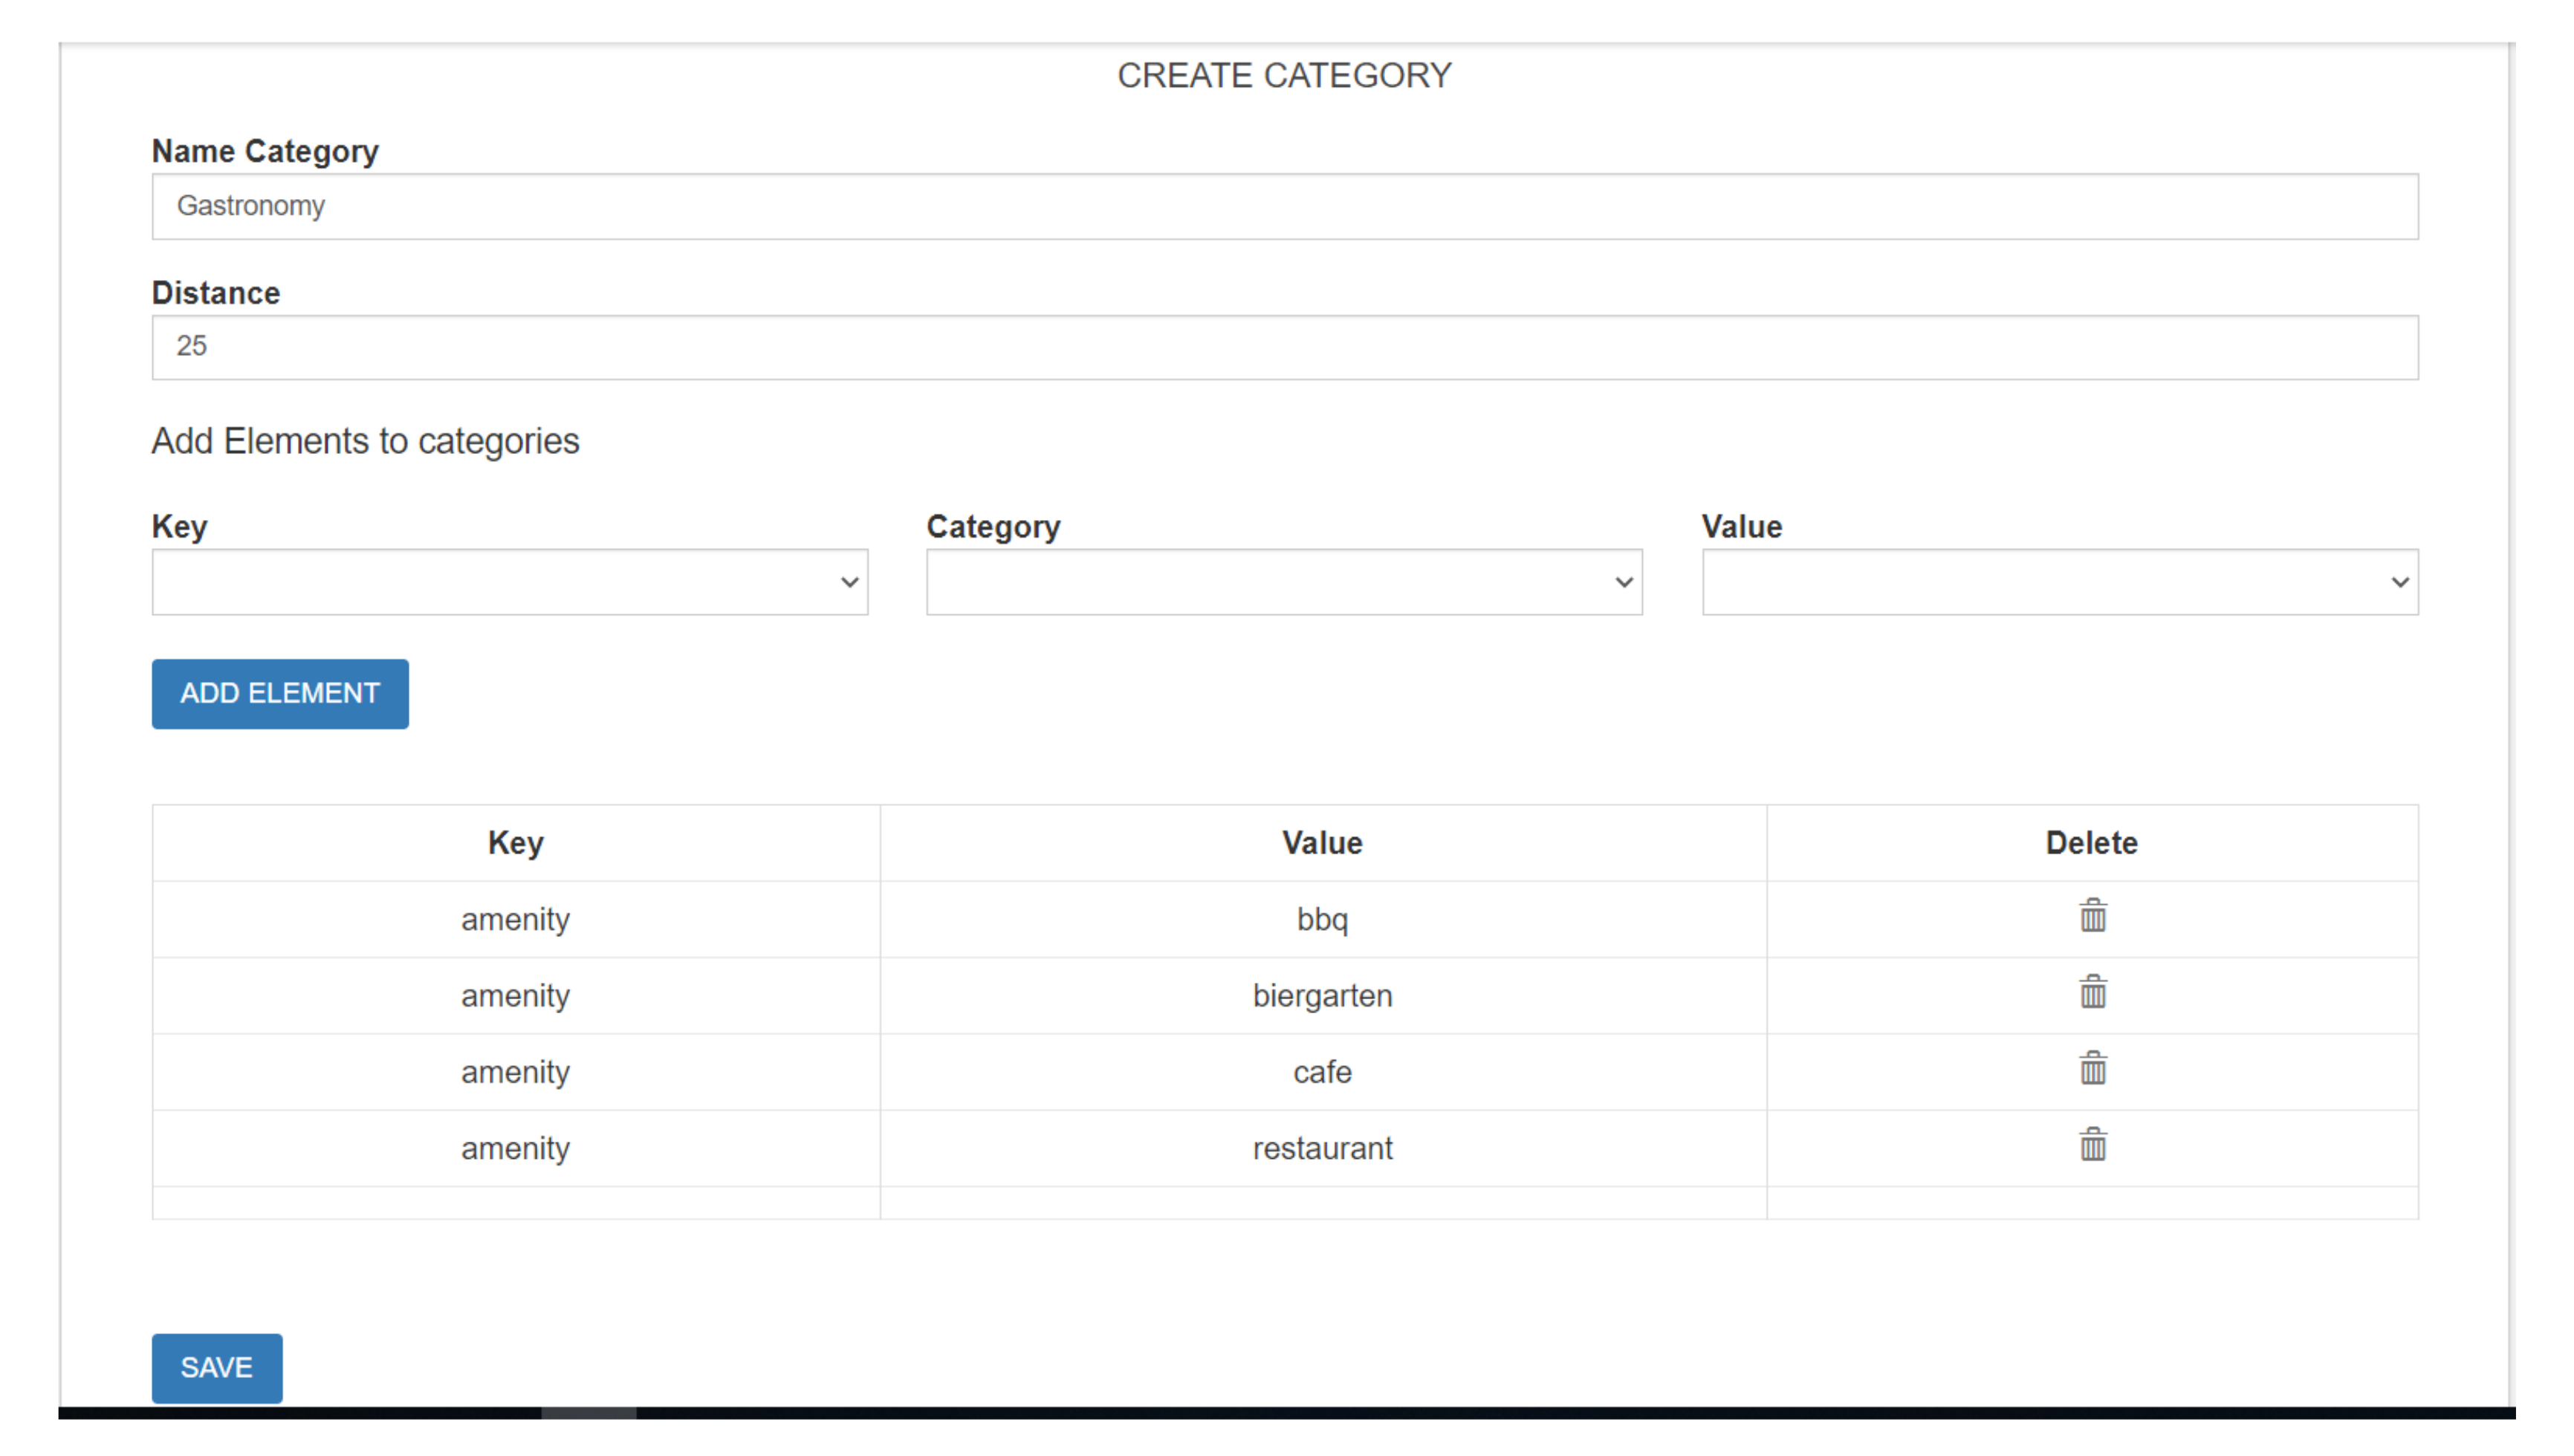
- All the places are grouped into categories that denote the type of activity that can be carried out in them. This is how some places can be categorized as museums, monuments, etc. Table 3 shows the list of categories currently defined in BITOUR. However, new categories can be added by means of the form in Figure 5, which shows the information that must be entered to create a new category: the name, the maximum distance allowed and the objects associated with it.
- A tweet is considered to be made from a particular location if the distance between the location of the tweet and the location of the location is less than a value, in meters, previously established for each category. For example, if we have defined that the maximum distance allowed to consider that a tweet was made from a hotel is 35 m (as Table 3 shows), every tweet at a distance less than or equal to 35 m with respect to a place previously categorized as a hotel can be assigned to the place. This distance is established when a category is created (see Figure 5).
- Each tweet can only be assigned to one place. However, it may happen that, given a given tweet, it can be assigned to more than one place because they meet the maximum distance condition. Therefore, a priority list is defined by category so that the tweet will be assigned the highest priority place that meets the maximum distance condition. Table 3 shows the priorities assigned to the defined categories.
The definition of the distances and priorities of Table 3 was established based on the relevance of each category in the tourism sector. However, these values can be altered on the platform and adjusted to the analysis needs of each problem and domain.
Therefore, the input data to the tweets assignment process are:
- Tweets with geographic location ready to be assigned.
- Places with geographical location uploaded to the platform and classified into categories.
- Categories with a preset distance and priority.
With this information, the allocation procedure works as follows:
- For each tweet, its location is taken and the distance between each tweet and the places saved on the platform is calculated and it is verified that they comply with the condition of being within the maximum allowed distance, keeping only those places that satisfy this condition.
- Of the places that satisfy the distance criterion, the place closest to the tweet is selected for each category. Subsequently, of all the remaining places, the one that belongs to the highest priority category is selected.
- If after running the previous two steps at least one place meets both criteria, the tweet is assigned to this place. Otherwise, the tweet is unassigned.
As an example, the identifier tweet 1020 can be considered: after calculating the distance between its location and that of the places stored on the platform, the values reflected in the Table 4 are obtained. In this table you can see how there are three places that satisfy the distance criterion, one from the Monuments category, one from the Leisure category and another from the Gastronomy category. Therefore, following the priority criterion, the tweet is assigned to the place categorized as Monument, since its priority is 2 compared to priorities 5 and 6 of Gastronomy and Leisure. Figure 6 shows that the tweet (red dot) is located inside the Oceanographic (blue polygon).
In a similar ways tweets are assigned to hotels or airbnb sites according to the following criterion:
- We apply a proximity of 35 m to associate a tweet with a Hotel or Airbnb, whenever possible.
- Hotels have priority over Airbnb sites.
- If a tourist has tweets assigned to hotels and tweets assigned to Aribnb, if they have the same amount, it is considered to be staying in a hotel, if not, it is assigned to the type of accommodation to which the tourist has the highest number of tweets.
6.3. Other Procedures
An important procedure, executed prior to perform any analysis, is the bots detection, which consists in identifying those users that can be classified as non-human, i.e., machines that write tweets automatically, because these “users” introduce noise. Nowadays, this detection is performed with a simple procedure: the distance between each pair of tweets posted by the same users is computed; this user is considered a bot if at least 10 tweets have been posted from a distance of less than 20 m.
Then, BITOUR performs a series of calculations to extract information about the remaining users:
- Number of tweets posted by each user.
- Period of stay of each user, calculated from the date of the first and last tweet.
- Number of tweets per category, which summarizes the number of tweets associated with a user for each of the categories defined in the platform.
- User’s language, which is identifyied as follows: (1) When the language specified by the user in his Twitter account is not English, the language specified in the account is selected; (2) For those users who have English assigned to their account: (a) English is assigned if at least 75% of the tweets are written in English or (b) the dominant language in the texts of the tweets is selected.
Finally, given that all the analysis that can be performed in BITOUR are related with tourists and their behaviour when visiting a destination, it is important to distinguish which users are residents in the destination and which users are tourists. This tourist identification process is a machine learning classification task, based on a clustering technique. The variables considered for this ML task are: posting period, time zone, number of posted tweets, number of assigned tweets, percentage of tweets in each category, among others. Details about the clustering method can be found in [46].
On the other hand, BITOUR also offers the possibility to perform a sentiment analysis on the tweets, so as to identify whether the opinion expressed in the text can be classified as positive or negative. Additionally, the texts are also classified as religious, gastronomic, among others. This analysis is done using the Linguistic Inquiry and Word Count (LIWC) tool (https://liwc.wpengine.com/). This tool has shown an accuracy between 0.6 and 0.9 in similar works [55,56].
6.4. OLAP Cubes
As explained above, OLAP cubes in this work have been built using a ROLAP processing scheme, so that the data always resides in departmental data stores. Specifically, two cubes are defined. These two newly created structures reorganize the integration layer data in a dimensional format.
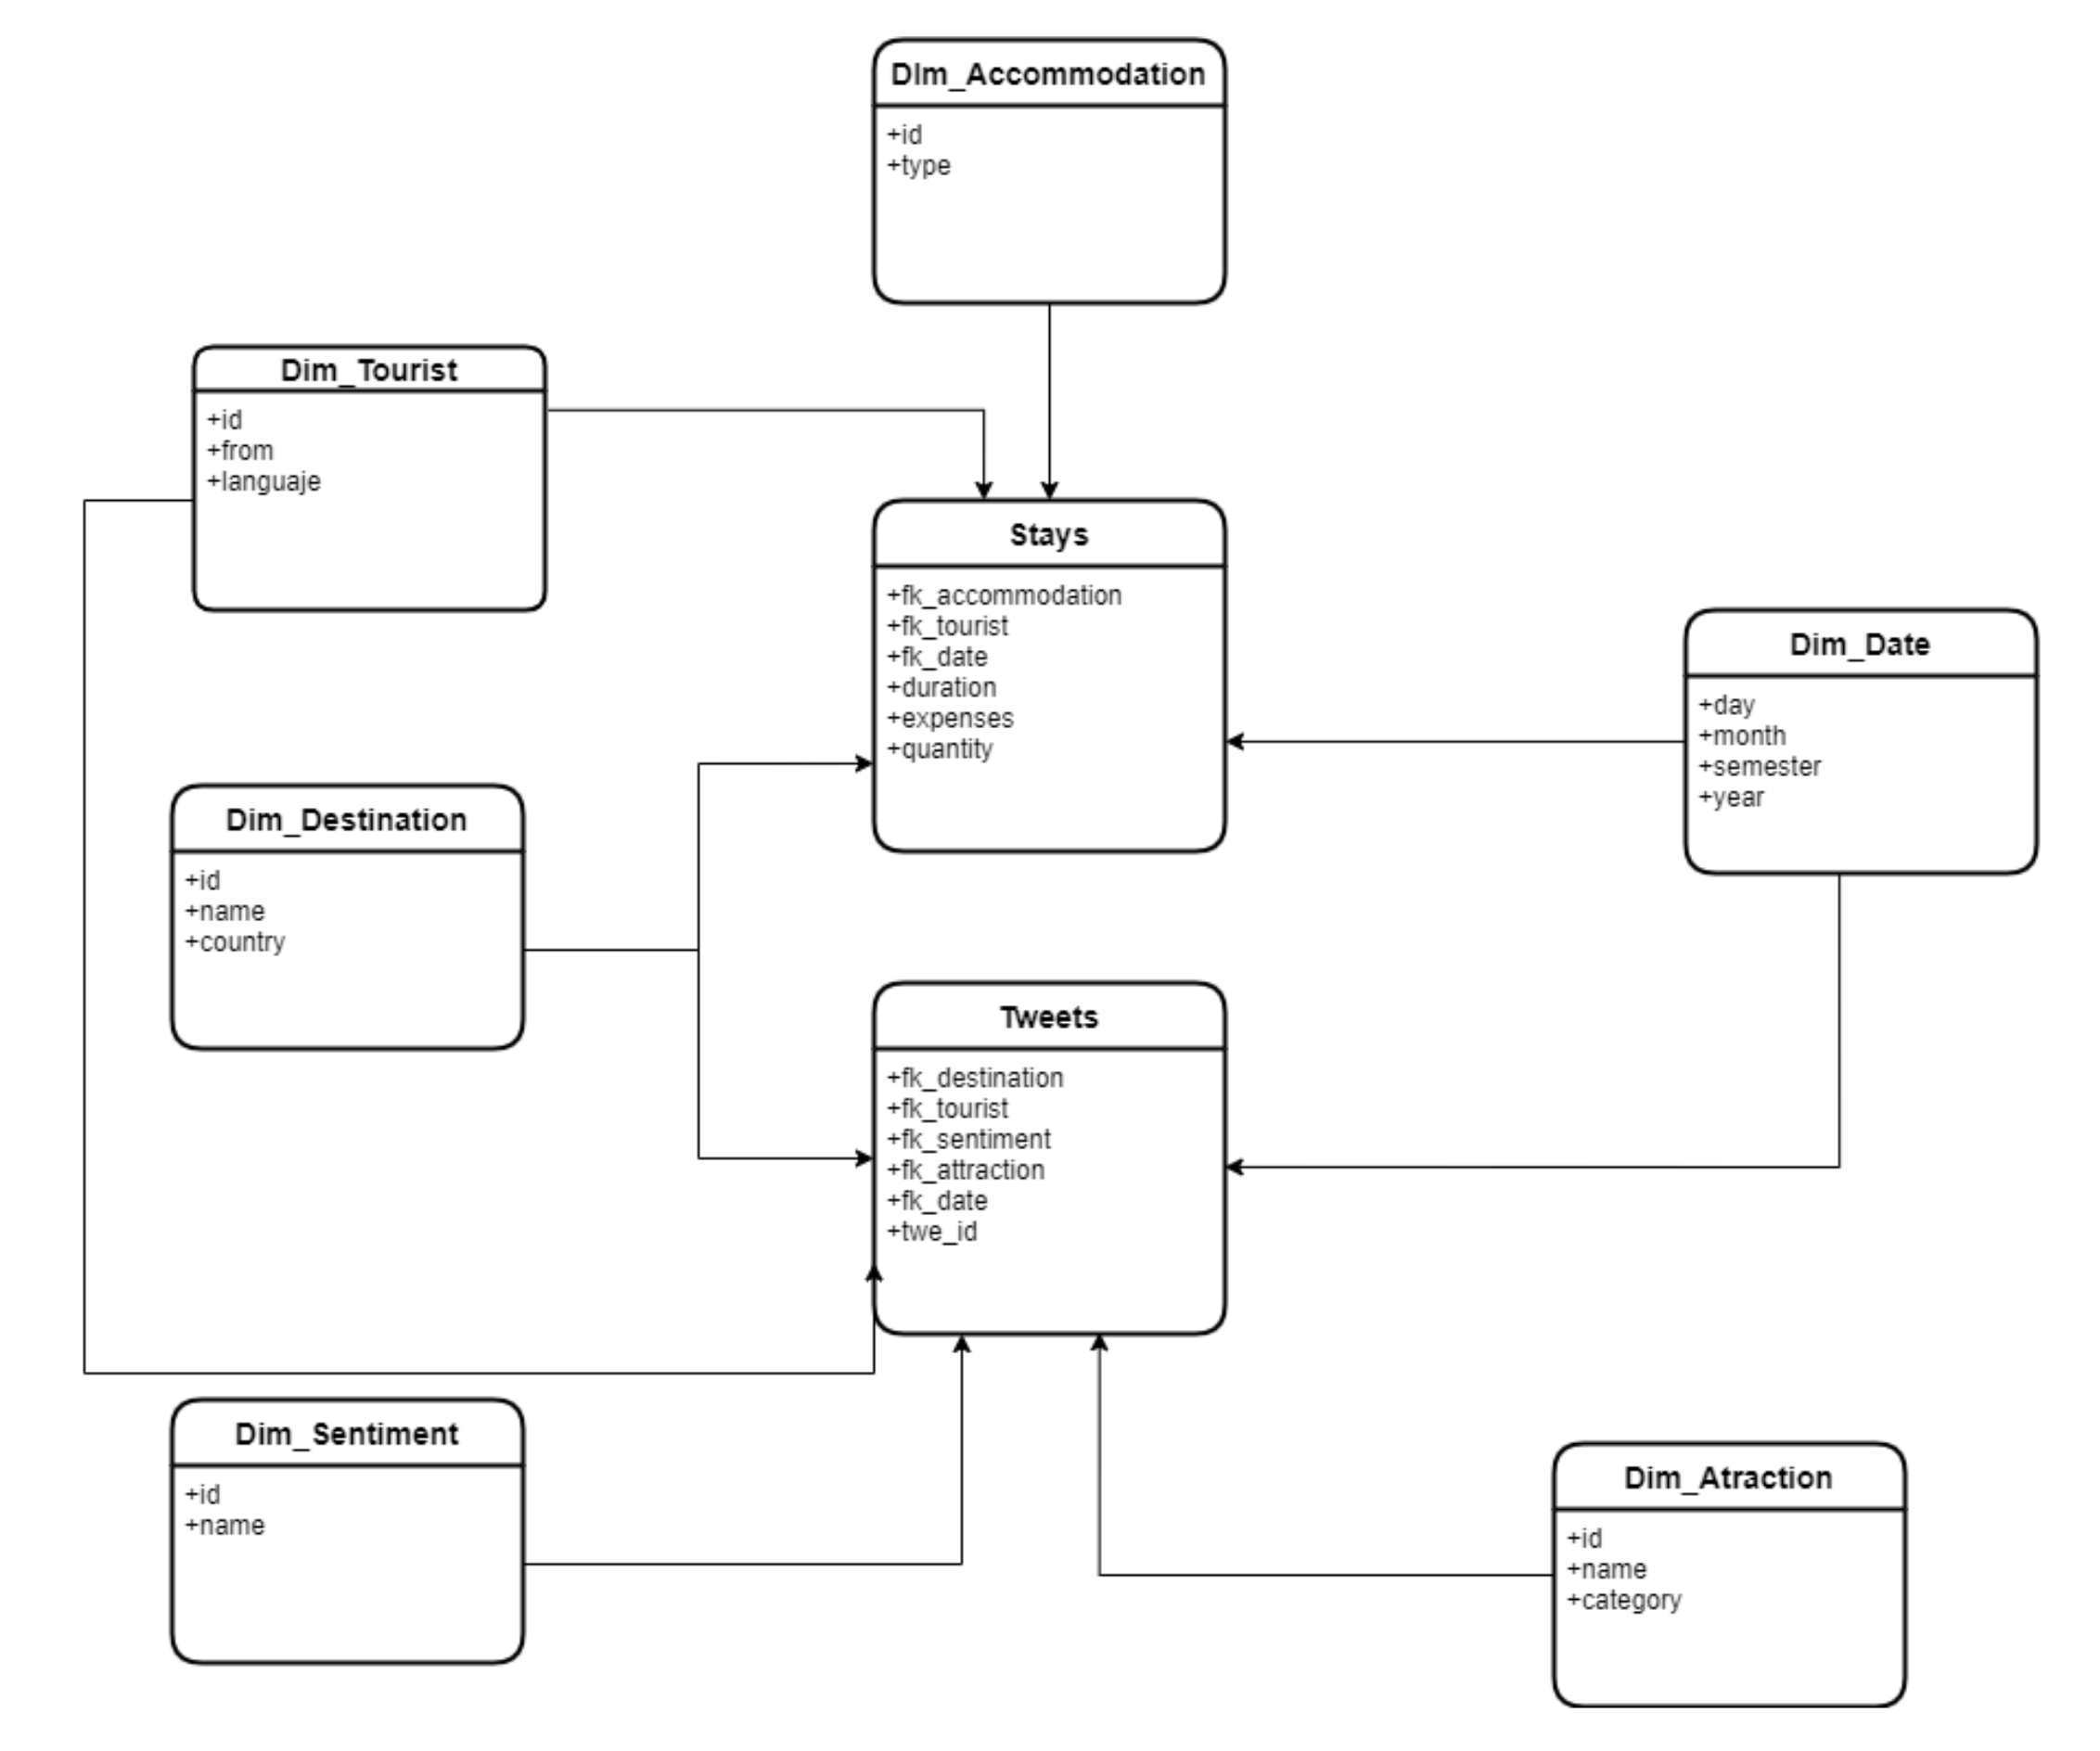
- Stays: This structure is designed to enable analysis related to tourists, that is, the number of tourists present, the length of their stay and the total expenditure made at the destination. For this analysis, dimensions such as the visited attractions, the time of year and the type of visited attractions are used.
- Tweets: This structure allows to perform analysis at a lower level of aggregation, that is, at the level of the tweet instead of the users who perform it. This is how the number of tweets can be analyzed based on whether the sentiment expressed in each tweet is positive or negative; the day, month, or year the tweet was made; and the places from which the tweets were sent.
In Figure 7 we can appreciate how the two entities Tweets and Stays contain measures such as duration and expenses which can be analyzed using dimensions such as attraction, accommodation and date.
7. Visualization
Once the processing is finished and the data is structured in the dimensional model, these data can be navigated with the visualization tools provided by BITOUR. This section delves into the functionality that BITOUR offers for users in the role of analyst to interact with the data, so that it serves as a support for decision-making in the domain of tourism. The objective is to offer the necessary mechanisms to answer questions such as: which are the attractions with the greatest influx of tourists, what type of attraction (or which attraction) has the most negative comments and which places that people who stay in hotels prefer to visit. This section shows some examples of analysis that can be performed using BITOUR tools. In general, the analyst can visualize the information in two ways: by means of dynamic charts and tables and by means of maps.
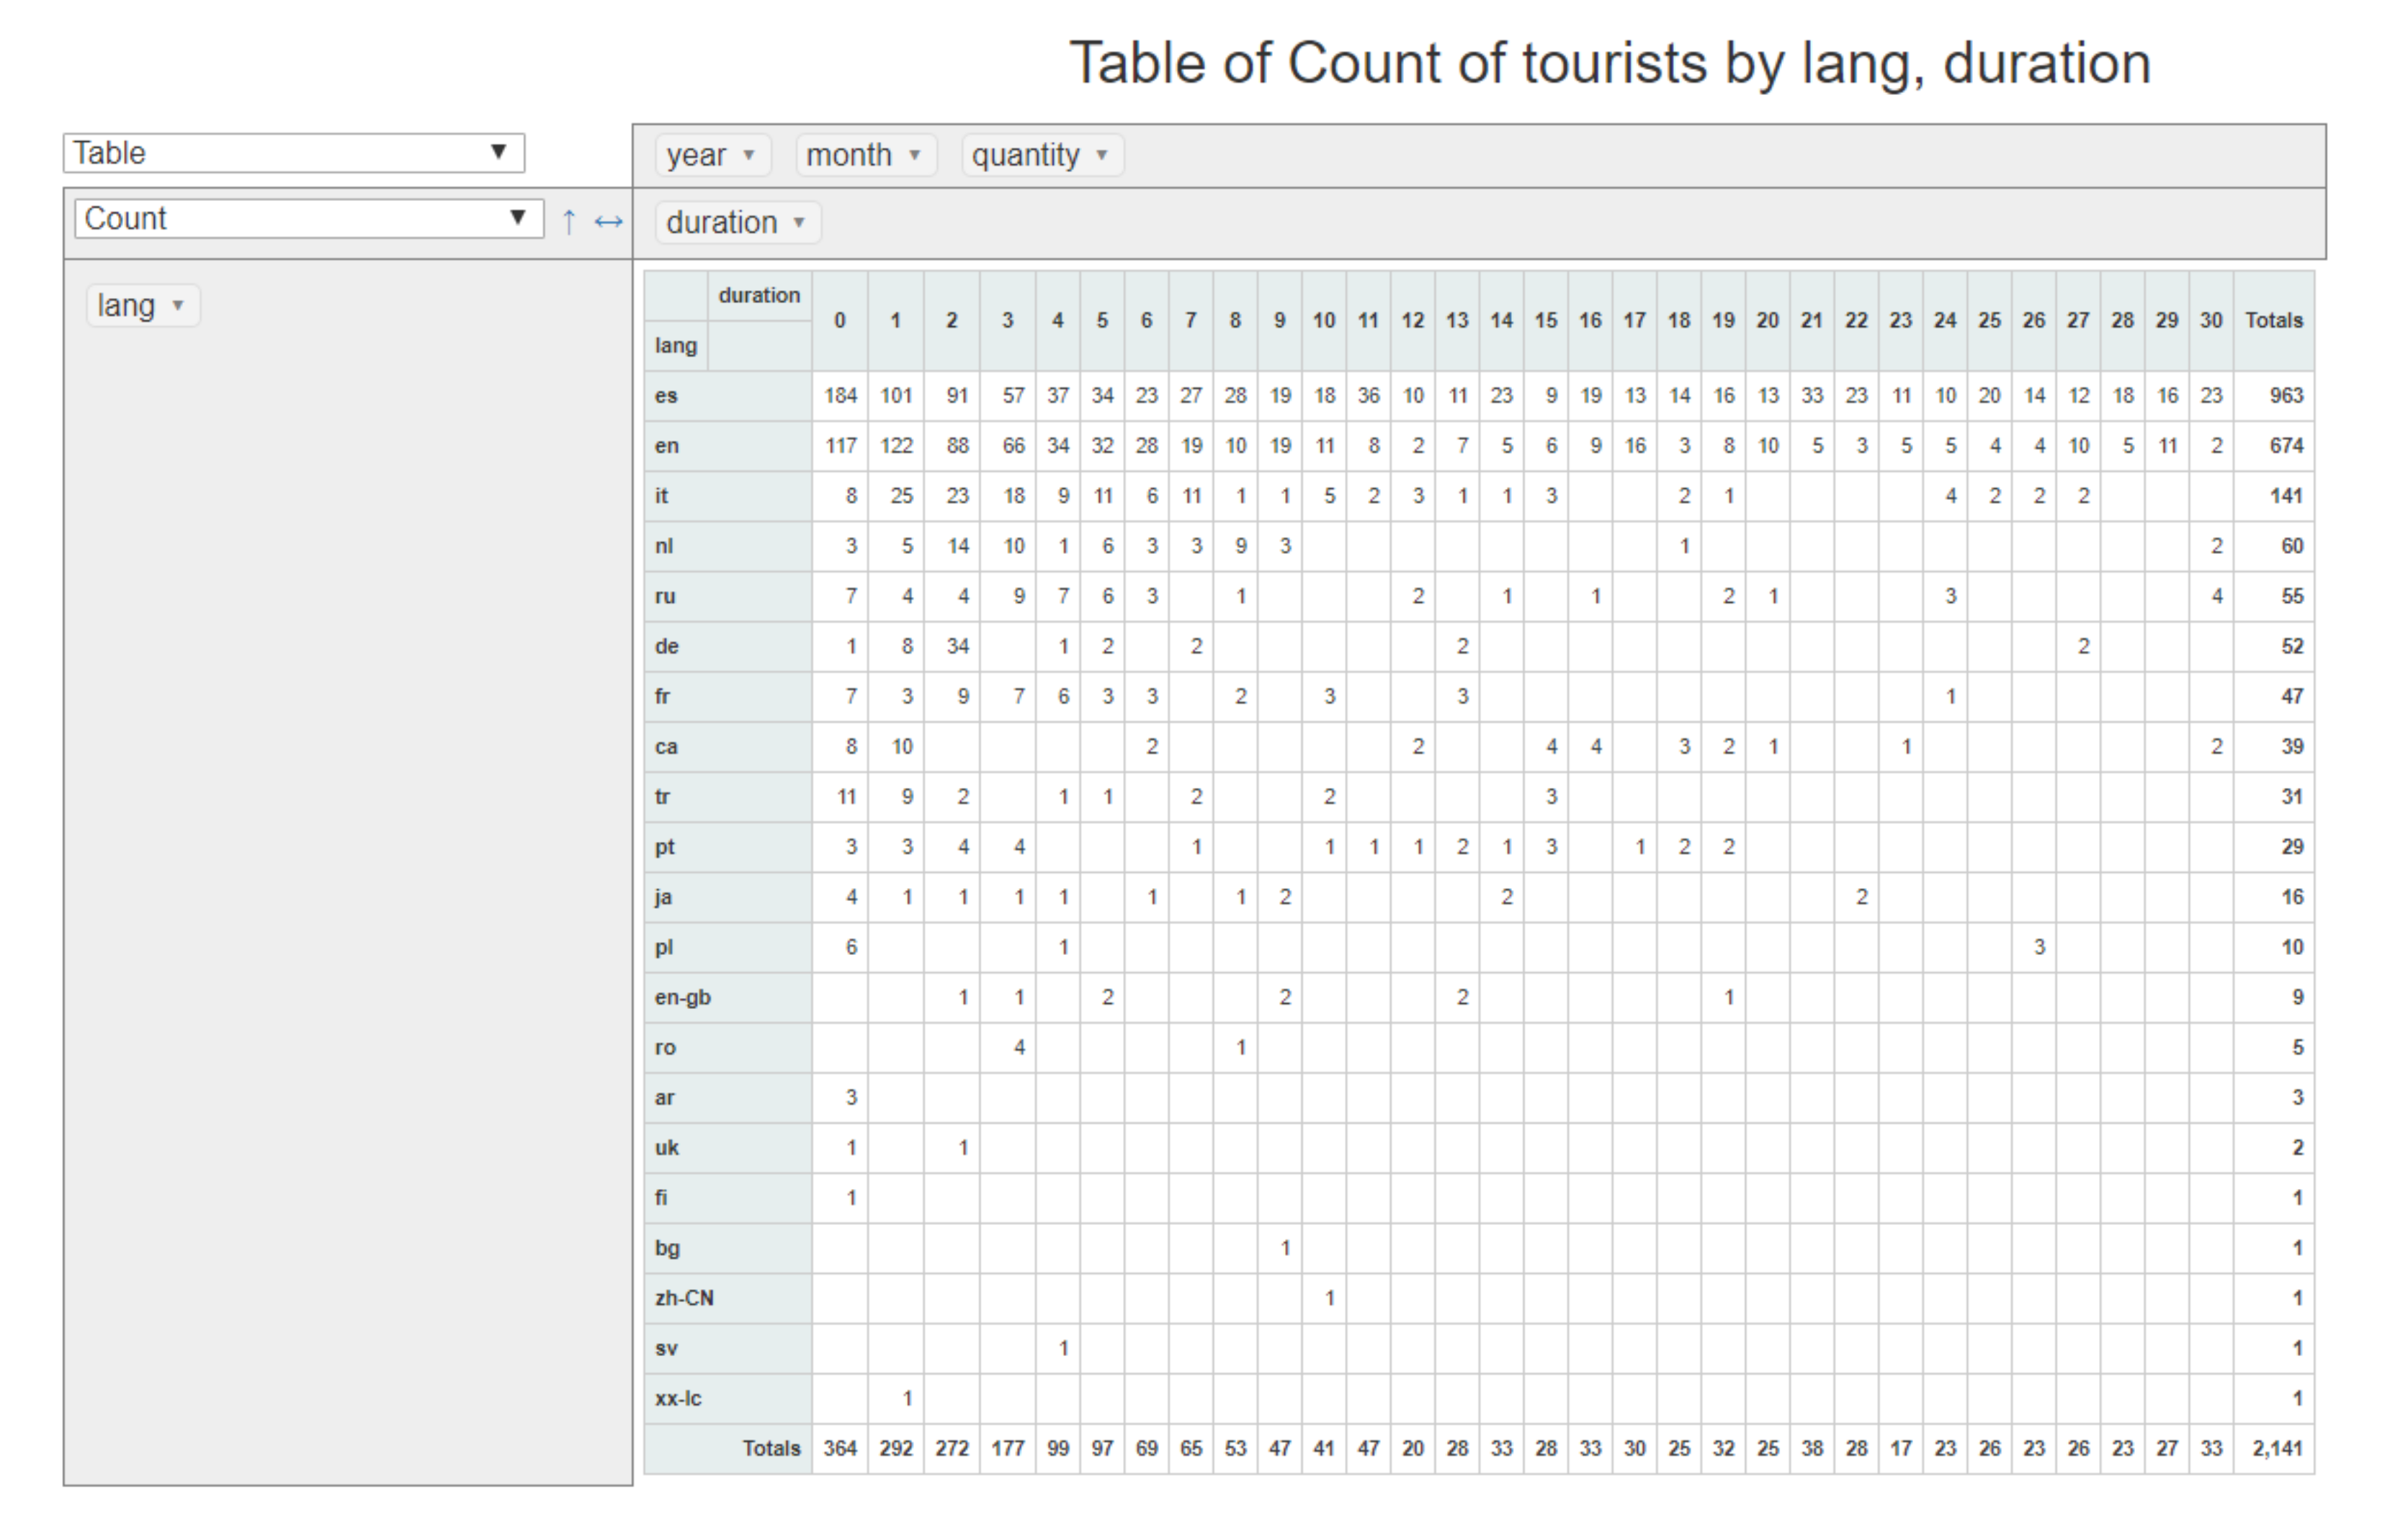
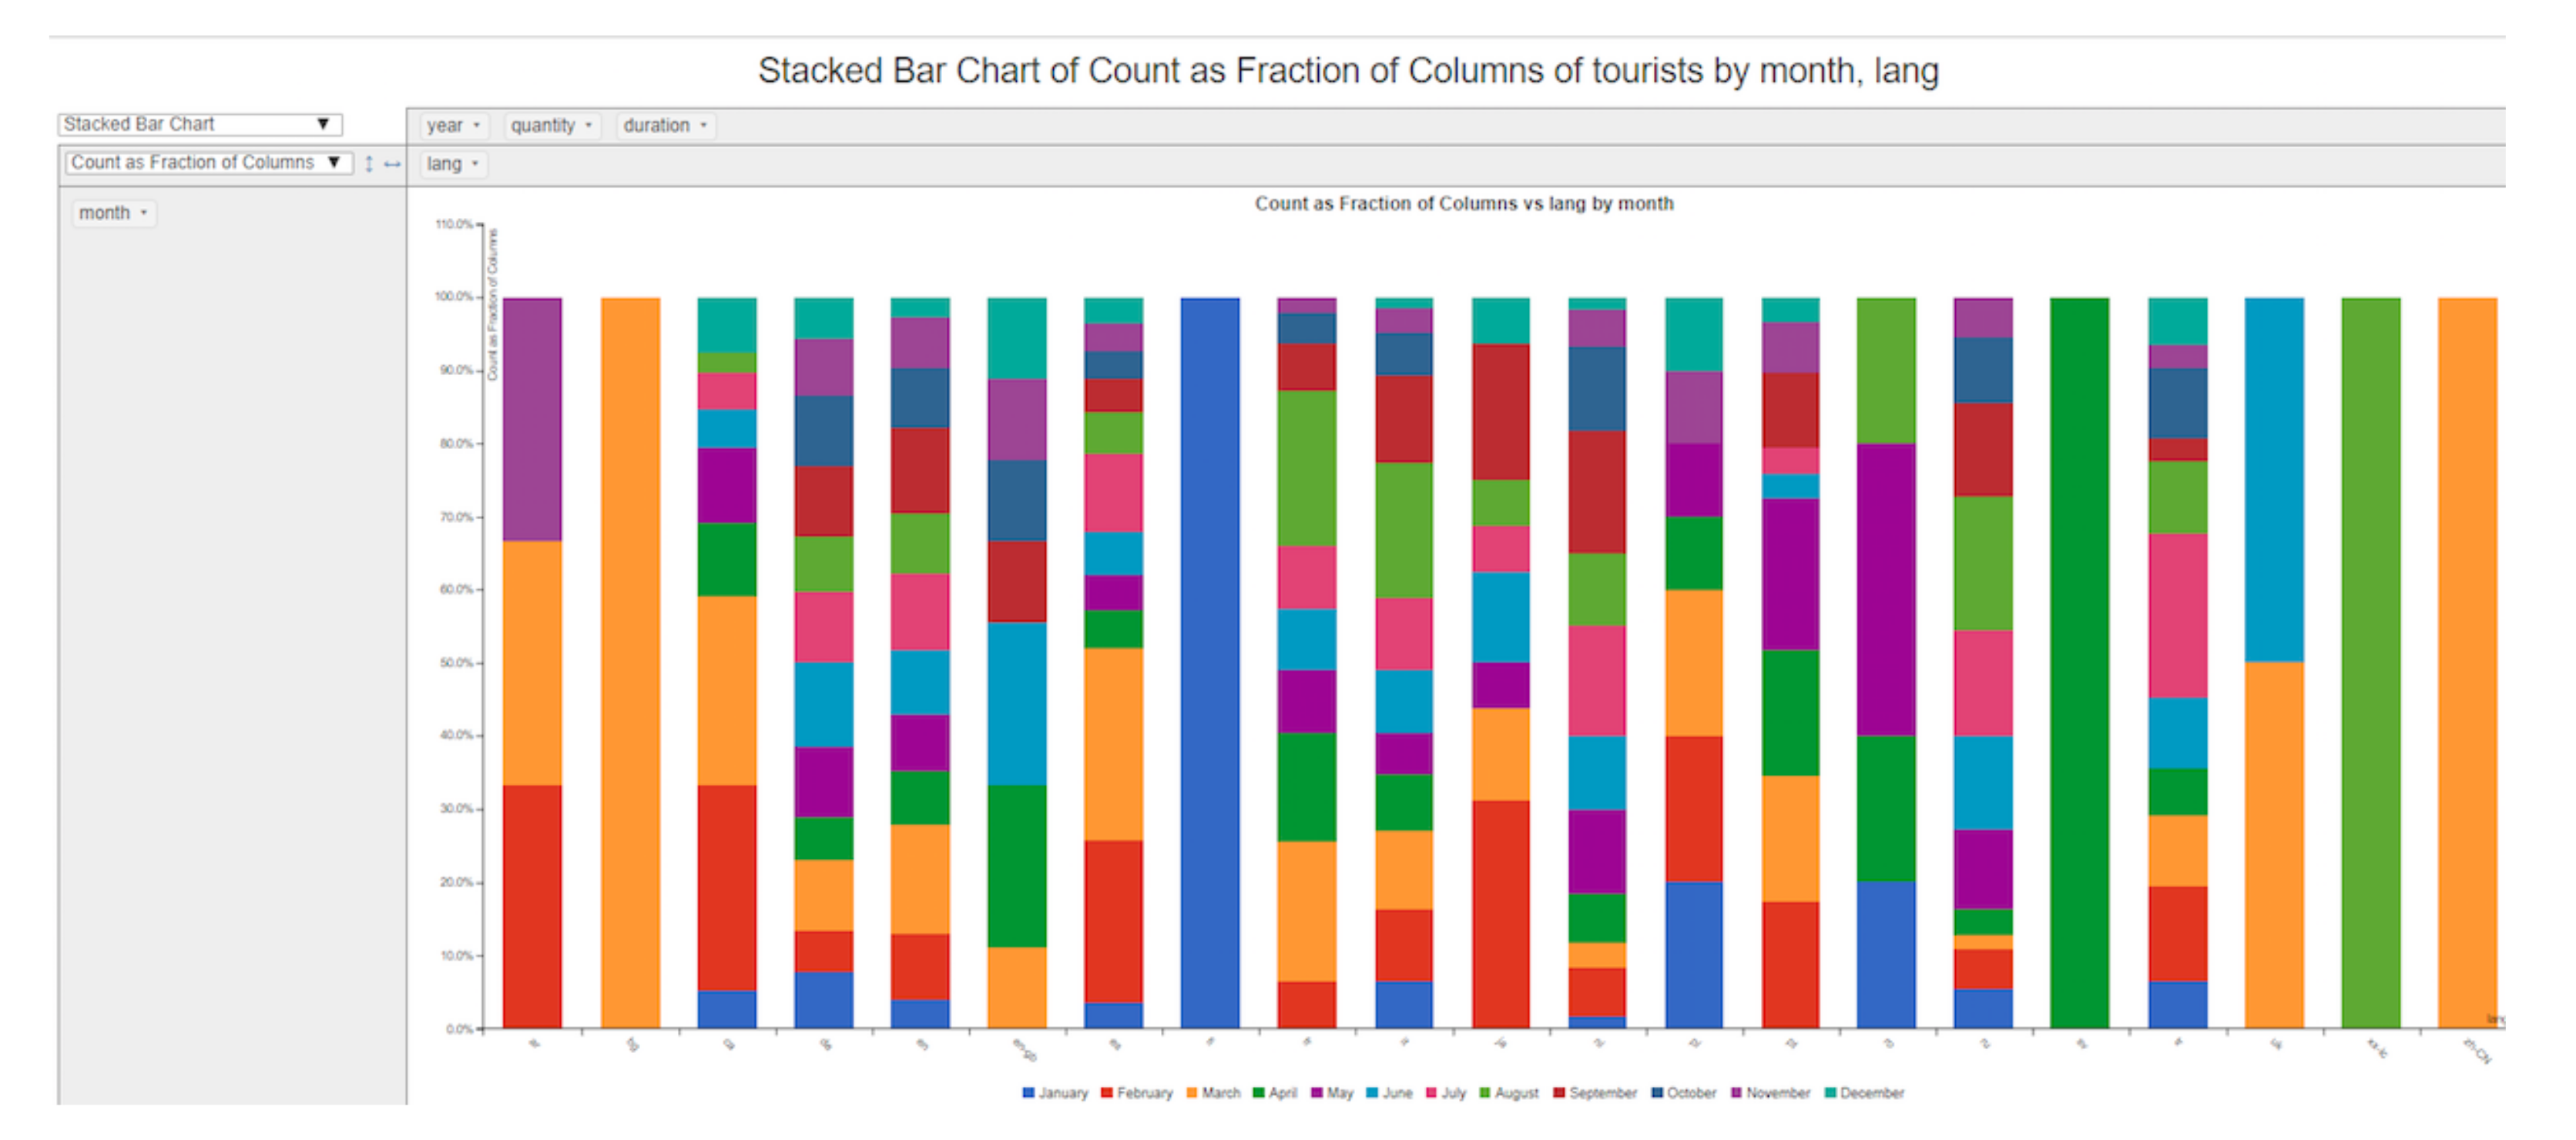
First, we focus on the Stays cube. From this cube, it is possible to analyze data about tourists individually or group them by language, selected type of accommodation, etc. For instance, Figure 8 shows a table which allows to analyze how long tourists stay in the city of Valencia according to the language they speak. In this case, it can be observed that, in general, Spanish-speaking tourist are the most numerous, followed by English and Italian speakers. Moreover, attending to the length of stay, the number of tourists decreases as the number of days increases. On the other hand, it is possible to study these data from the perspective of tweets posted by each tourist. For example, Figure 9 shows the distribution of tweets per month according to the language identified for the tourist.
With respect to the Tweets cubes, many aspects and at a different level of granularity can be analyzed. First, a general perspective of the tweets distribution can be observed by using the map functionality in BITOUR. For example, Figure 10 shows how the tweets made by tourists are distributed around the city of Valencia. Additionally, in this case, the analyst can also specify ten attractions to perform a more detailed analysis (attractions are represented as markers (red dots) and tweets as smaller gray dots). This can be used to understand aspects such as which are the attractions that have the greatest impact on tourism, if these attractions have an impact on the activities that take place around them and in what way type of activity. For example, in this case, gastronomy places are also analyzed: data at the top right corner indicated how many tweets related to gastronomy places have been posted around the selected attractions.
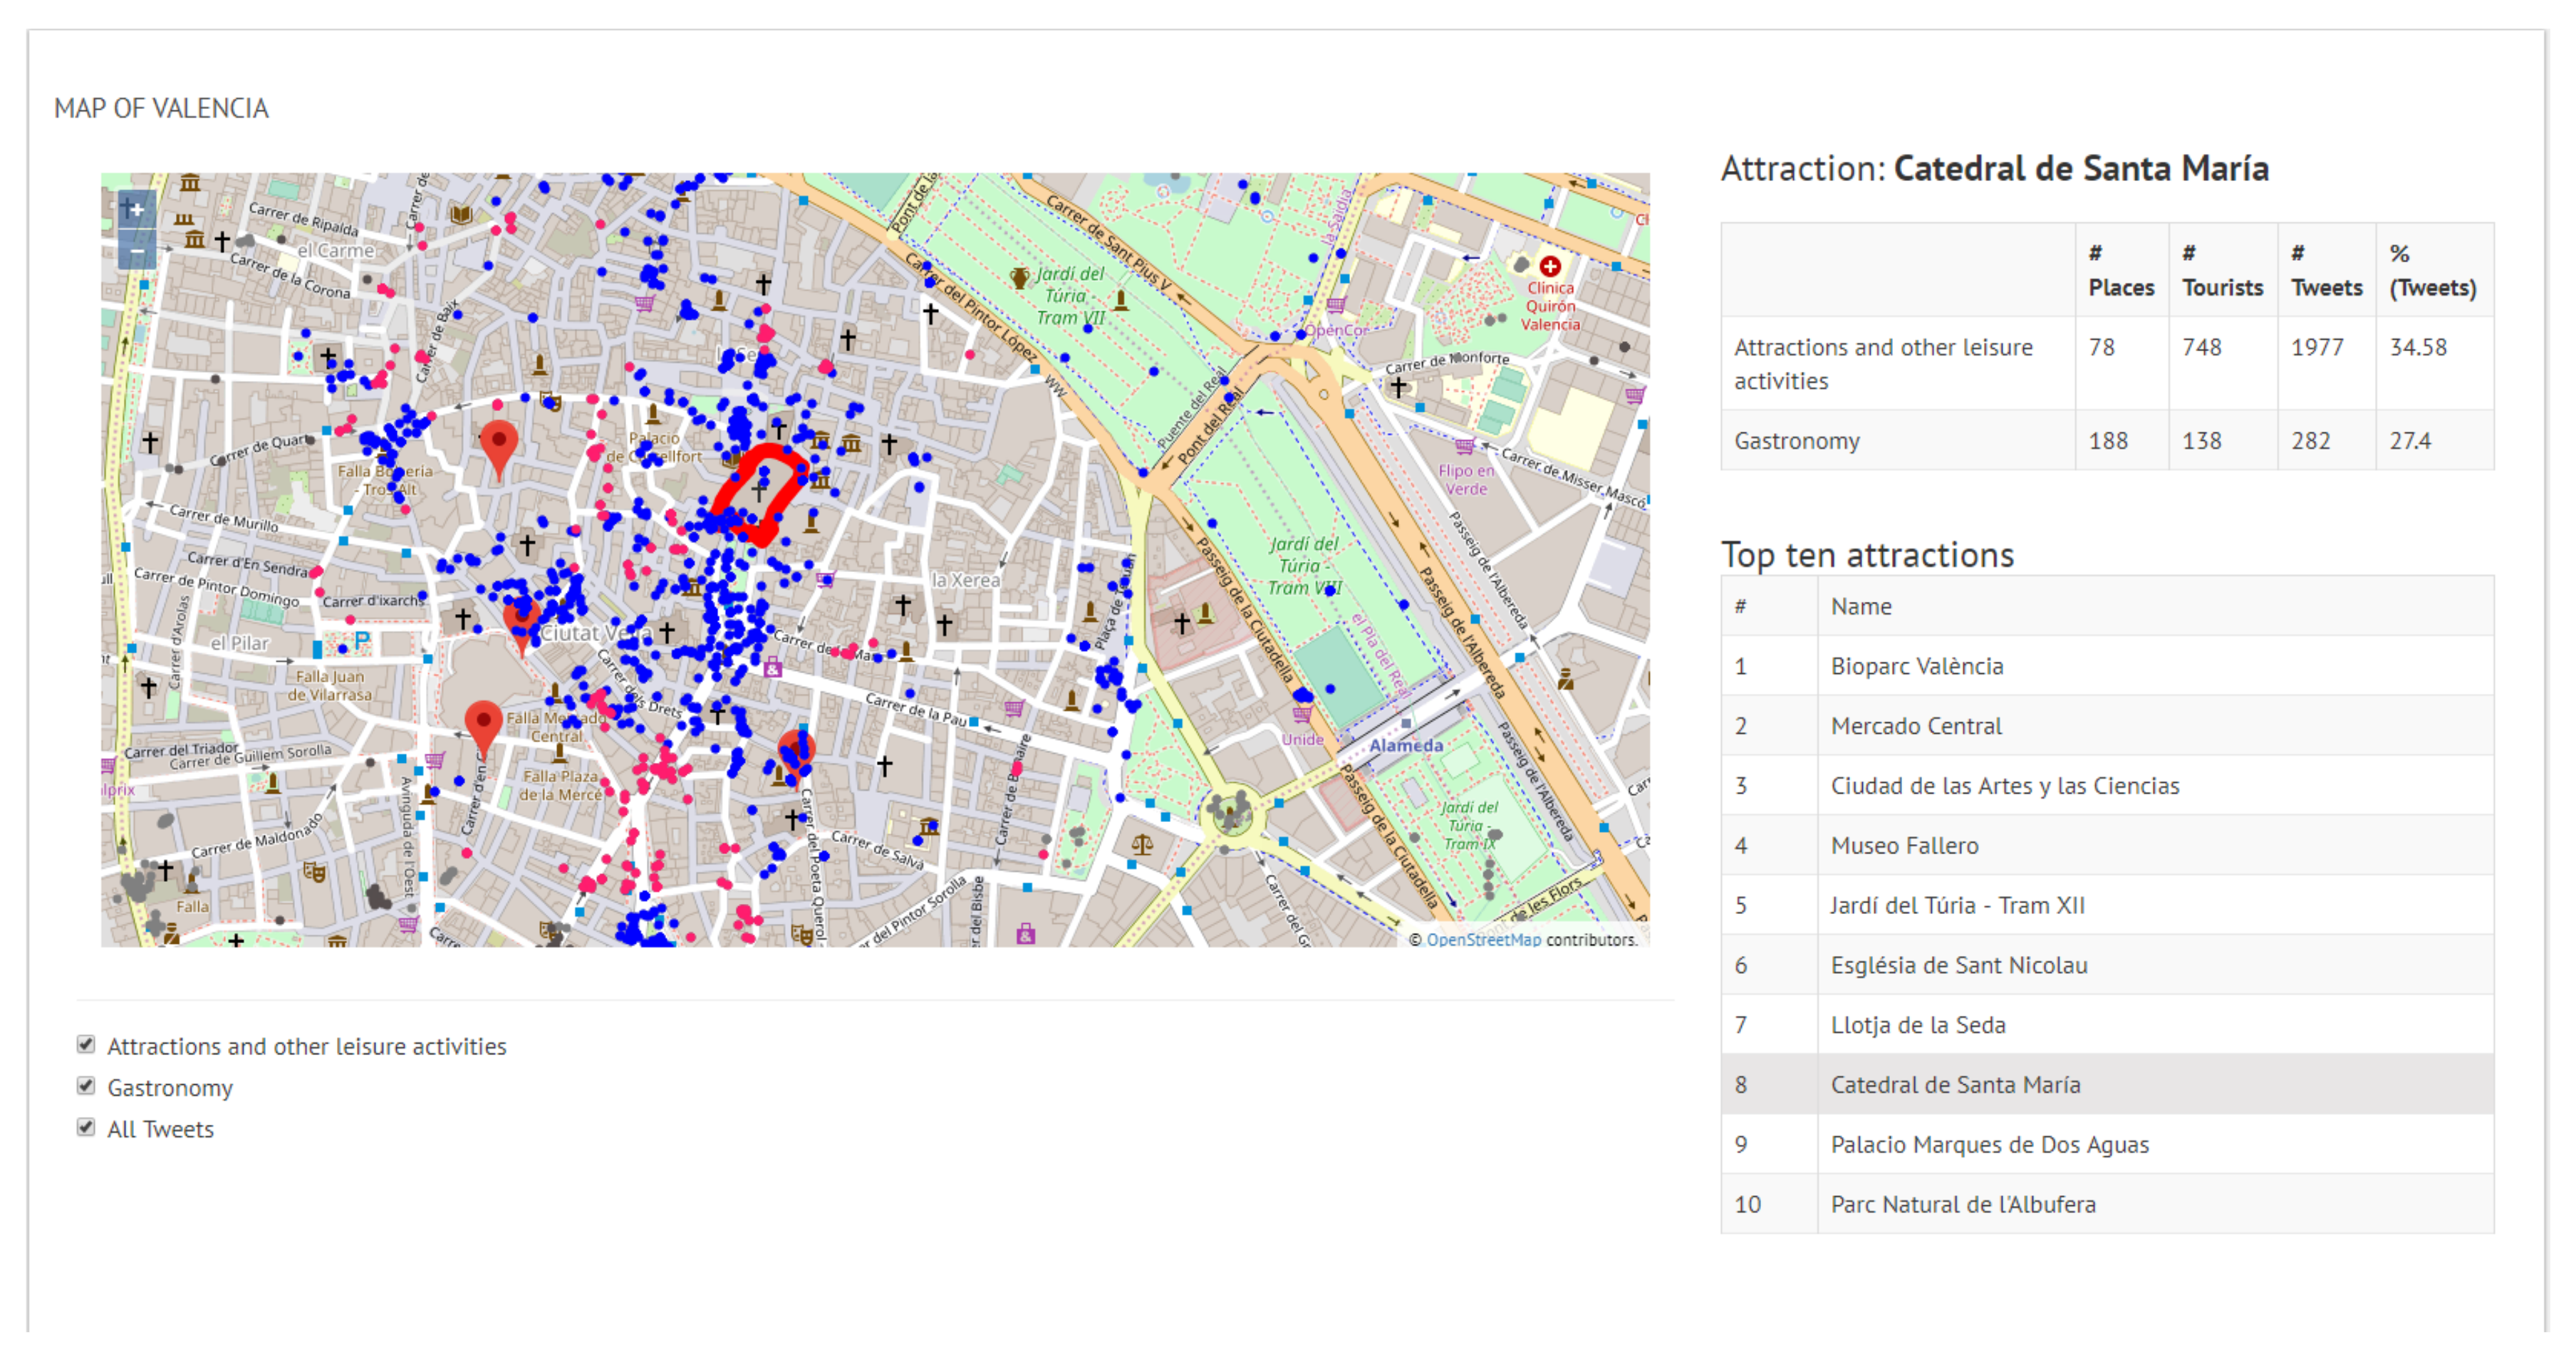
If a particular attraction is selected (see Figure 11), the location of this attraction is shown in the map with a red polygon and data about this attraction is summarized at the top right corner and depicted in the map. Specifically, here we see how a large number of related tweets converge at this point of the city and that most of these are from gastronomic sites (blue points) and less about leisure sites (pink points).
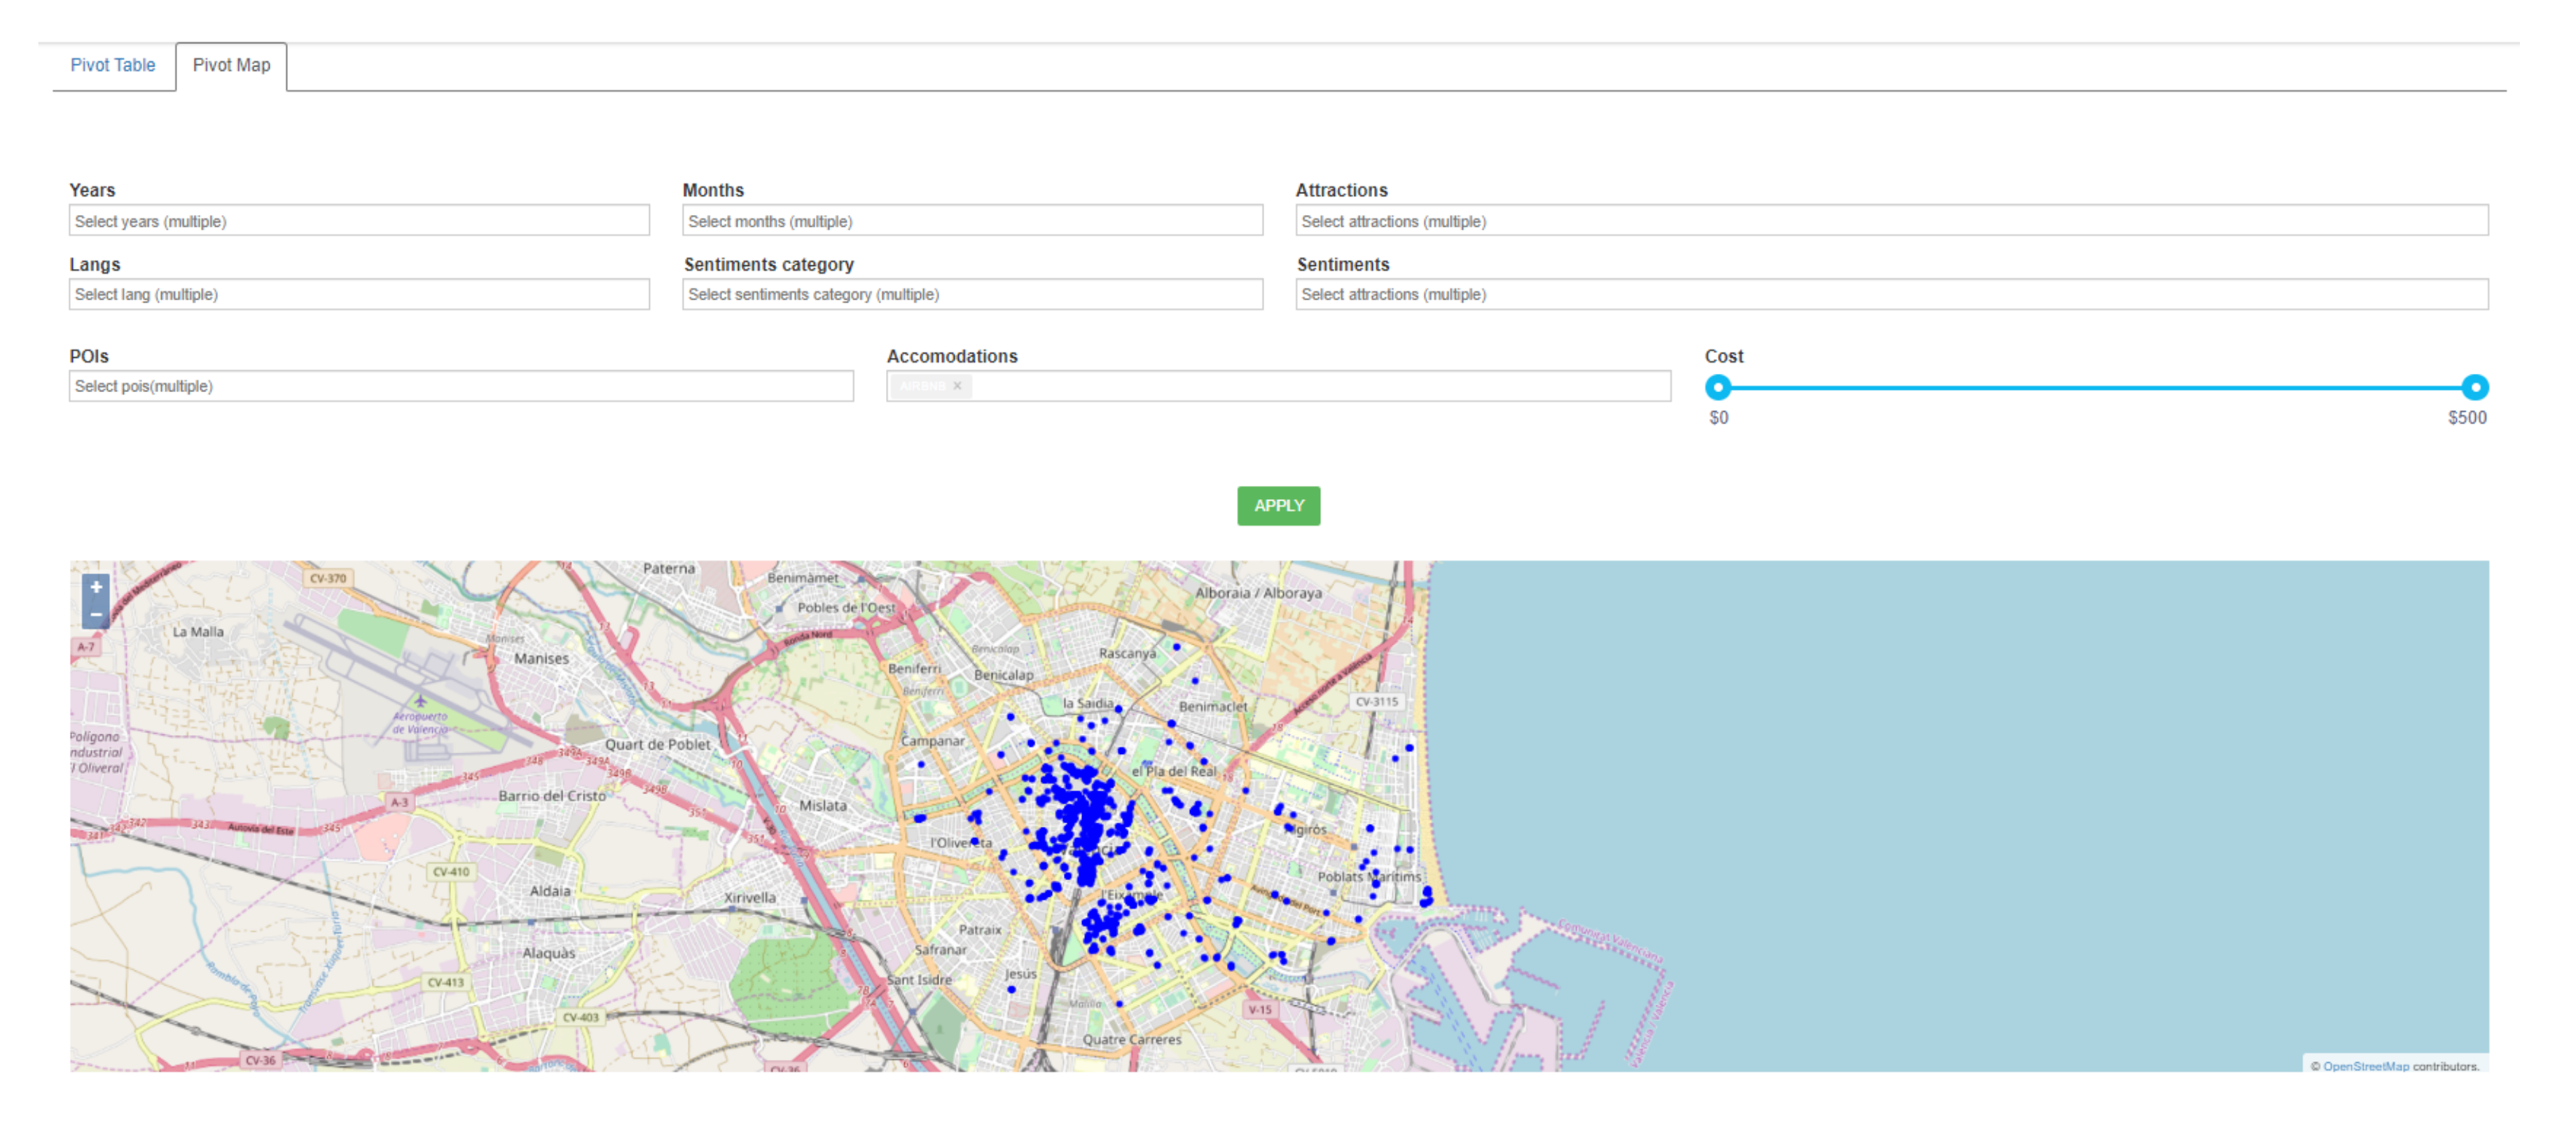
BITOUR also allows the visual exploration of the tweets on the map according to other variables defined in the cube designed to analyze the tweets. As an example, Figure 12 shows how tweets can be analyzed according to the accommodation dimension, specifying the type of accommodation to be analyzed, Airbnb for this case. Tweets are shown as blue dots on the map. Similarly, the map can also depict tweets posted from museums and monuments in the city (Figure 13). In general, the map can be displayed using any of the attributes of the created dimensions and also applying some filters over these attributes.
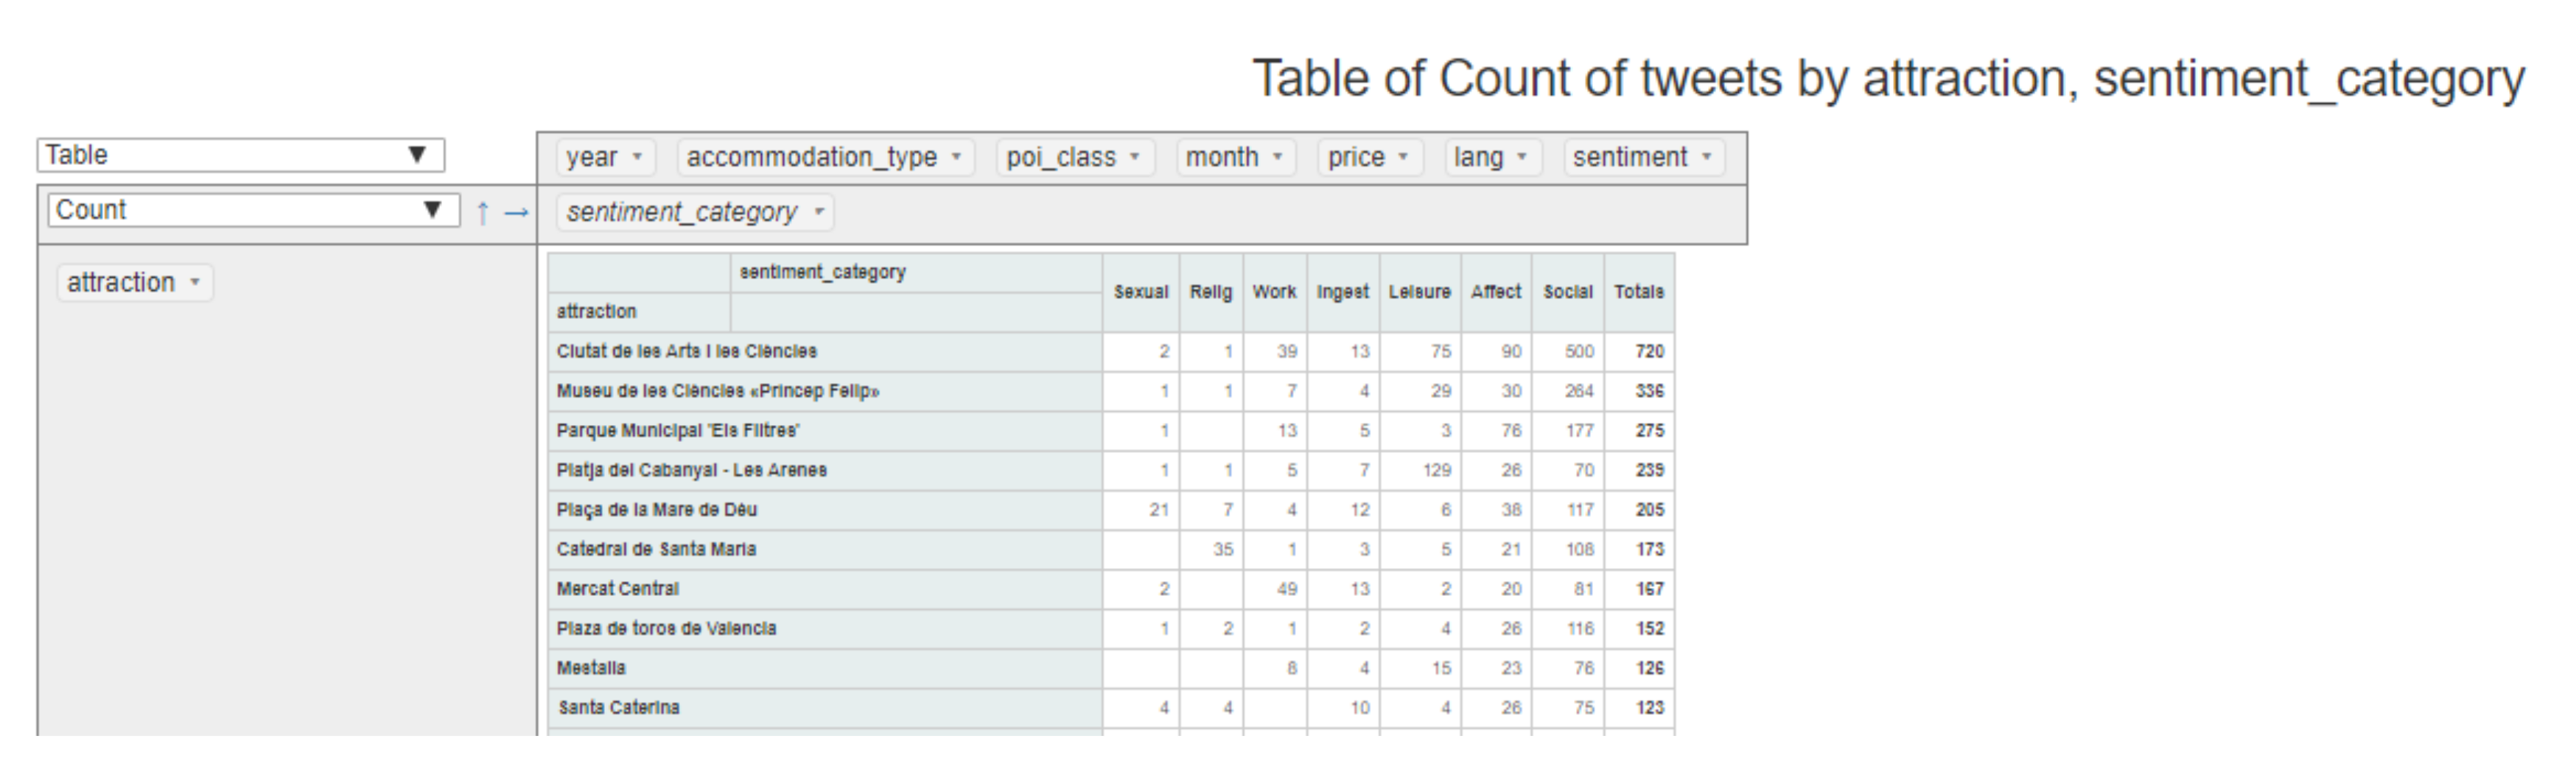
Another interesting analysis is related to the sentiment predicted for each tweet. Figure 14 shows the sentiments associated to tweets posted from some attractions. It can be observed that the predominant topics are “social”, “leisure” and “affection” and that, for example, the attraction from which tweets related with “work” are posted is Mercado Central (Central Market).
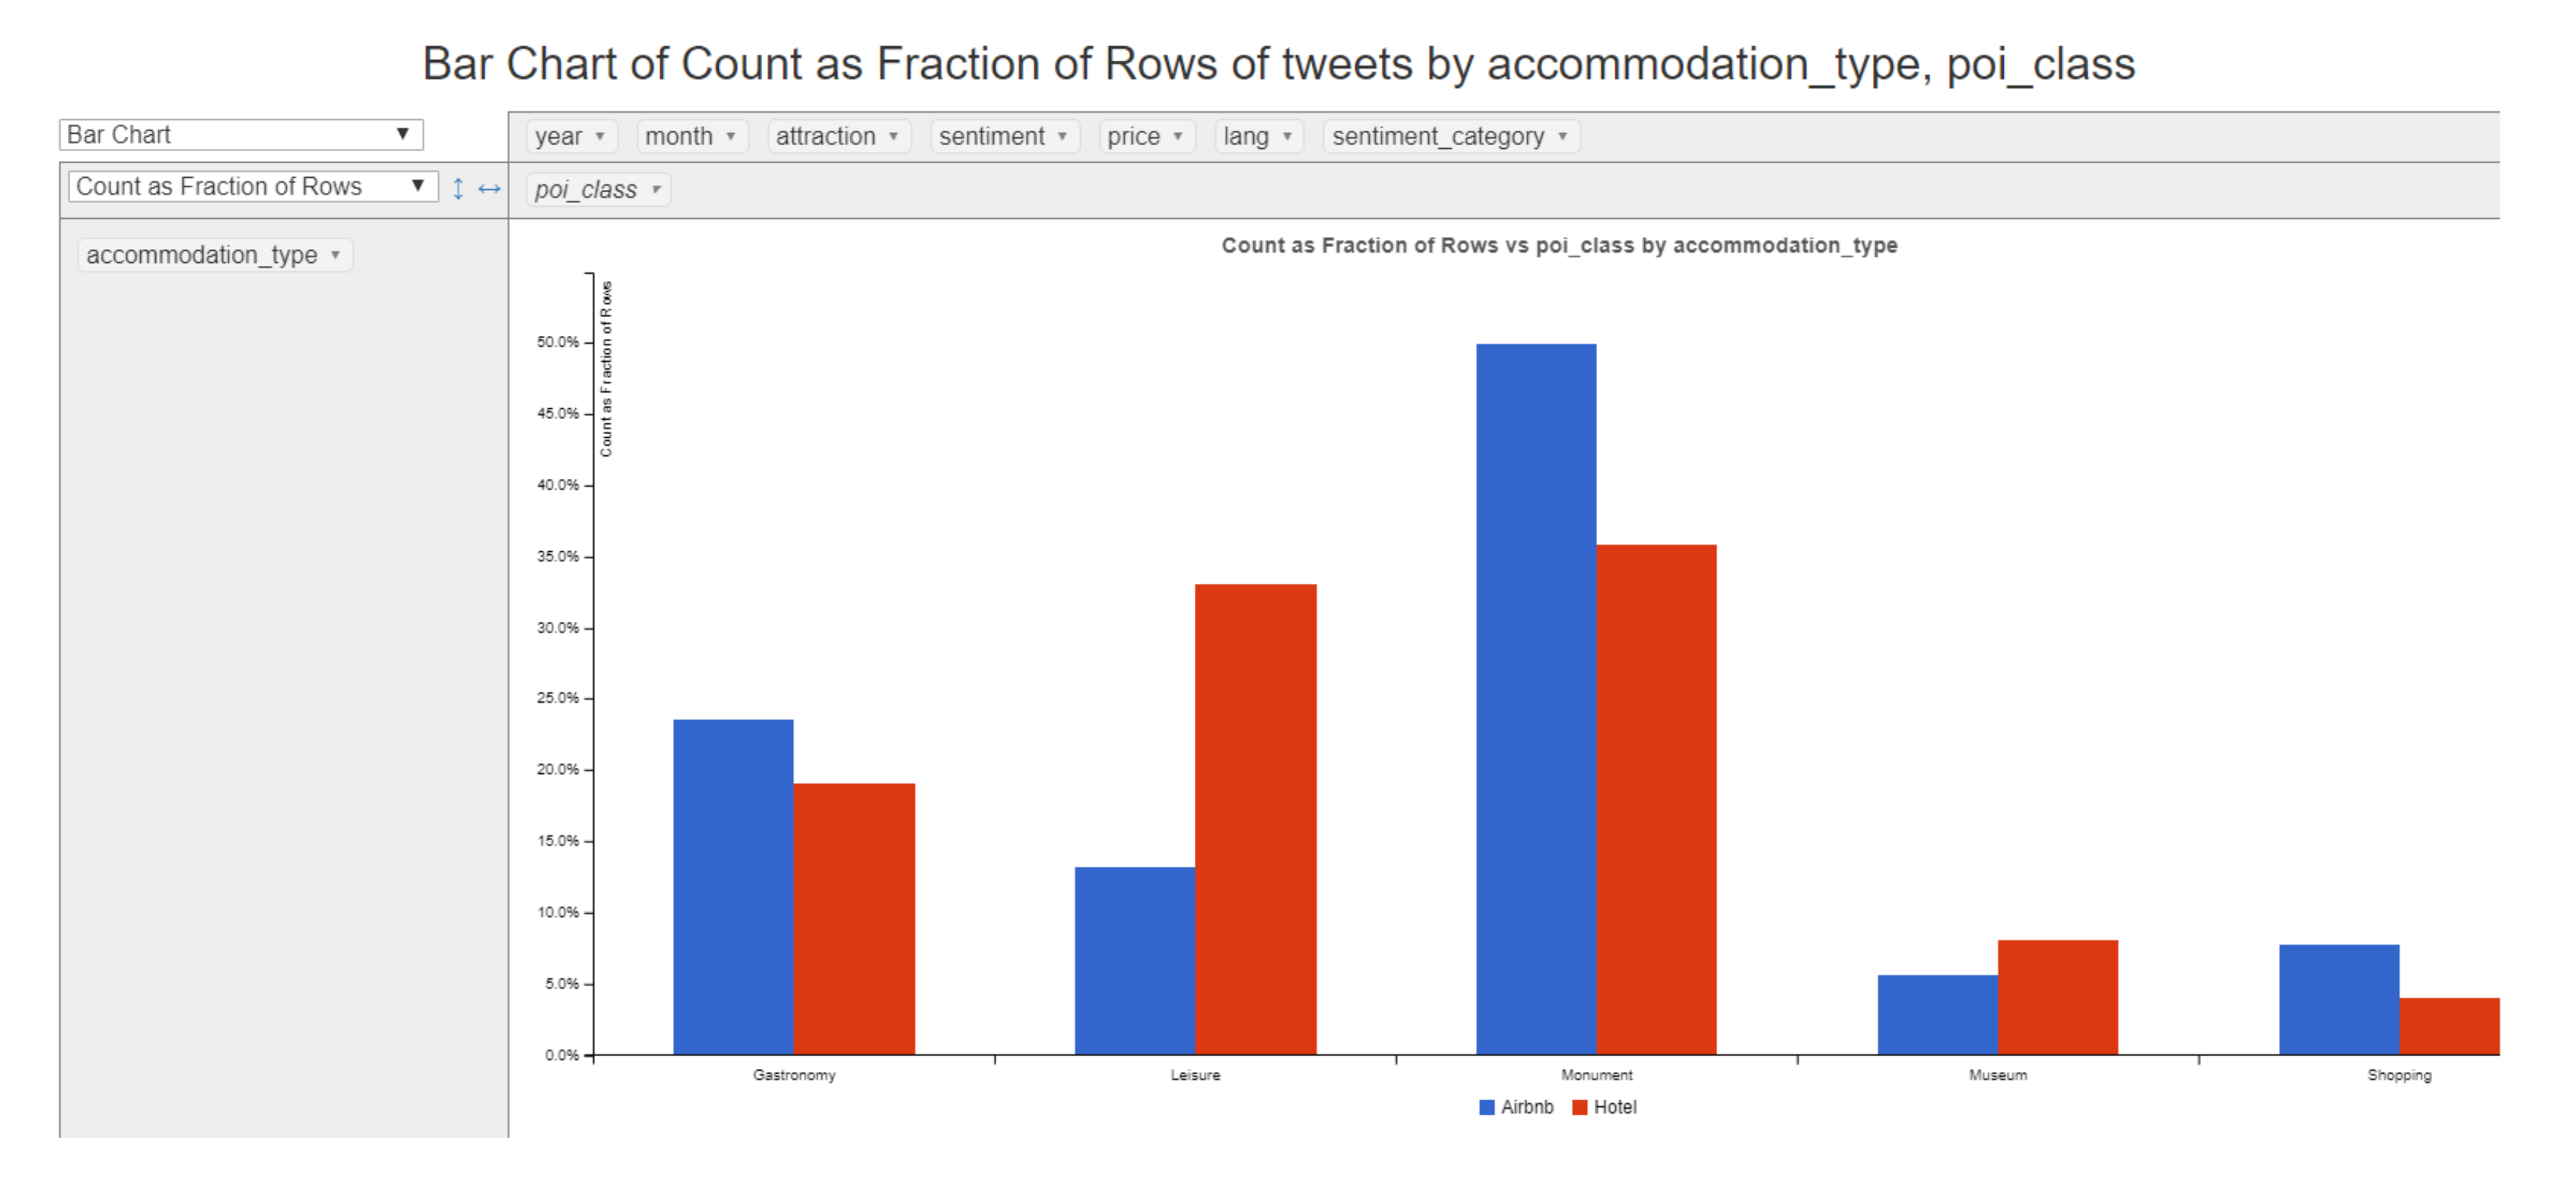
Finally, the combination of both cubes, Stays and Tweets, gives the possibility of analyzing the behaviour of tourists in a deeper way. For example, Figure 15 shows the tweets by the type of accommodation, selected by the tourist, and the type of point of interest, which is determined by the place from which the tweet is posted.
8. Conclusions
Modern society is characterized, among other aspects, by the preponderant role of information and knowledge. In this context, collaborative data represent an invaluable resource to obtain a better insight of tourist behaviour. For the tourism sector, whose growth and success heavily rely on the user experiences, making informed decisions based on preferences and behaviour of tourists is a valuable asset. In return, tourists can enjoy a more rewarding experience when they are offered quality and tailored services.
In this paper we have presented a BI platform named BITOUR that integrates data from four collaborative sources, the social network Twitter, the open map platform OpenStreetMap and two accommodations services TripAdvisor and Airbnb. The platform automatically collects data from these sources and integrates them into a data warehouse from which data mining techniques are applicable. The output of the data analysis is visualized via the web by the community in charge of decision making in tourism initiatives in a geographical area or destination. This way, the process of identifying tourists and assigning tweets to places enables to analyze aspects such as the distribution of tweets and users around a destination, the impact that attractions have on the activities that take place around the spot, average length stay of tourists in the destination, etc.
From this research, a wide variety of issues emerge that deserve to be addressed. The following paragraphs describe some lines of work that are considered potentially interesting for future research:
- From the point of view of the internal implementation of the platform there are three routines that can be refined: the algorithm for the identification of tourists, the algorithm for bot identification and algorithm for tweet assignment. Although these algorithms yielded good results, they can be enriched with the incorporation of information extracted from the text of the tweets.
- Moreover, there are other data sources that can be incorporated to complement BITOUR’s vision. Some of these sources can be FourSquare that provides details about the movements of users in the destinations and Instagram that allows to better understand the leisure activities that tourists carry out in the destination.
- Despite the important benefits of the collaborative data sources already mentioned and explored in the BITOUR platform, their use may also have some drawbacks, mainly related to the quality of these data. Given that there is not a supervising entity, data quality is not guaranteed because users may introduce unaccurate data. However, it is the community itself who acts as supervisor, since other users can correct this wrong data. Before using these data sources in BITOUR, we performed a study to check the OSM information and, for example, we compared the OSM hotels location with their location in TripAdvisor with satisfactory results. However, despite our analysis and the fact that various studies have shown that the quality of these sources is close to that of official sources [57,58], it would be important to analyze the quality of these collaborative data sources and compare their content with official and open data from territorial, national and international sources. Some of the sources that could be explored are the data provided by the World Tourism Organization in its annual compendium on country tourism statistics and the report on tourism competitiveness released by the World Economic Forum.
Author Contributions
Alexander Bustamante: Conceptualization, Visualization, Software, Writing—original draft; Laura Sebastia: Methodology, Writing—review & editing; Eva Onaindia: Supervision, Writing—review & editing. All authors have read and agreed to the published version of the manuscript.
Funding
This work has been supported by COLCIENCIAS through a PhD scholarship.
Acknowledgments
This work is supported by the Spanish MINECO project TIN2017-88476-C2-1-R.
Conflicts of Interest
The authors declare no conflict of interest.
References
- Nakahira, K.T.; Akahane, M.; Fukami, Y. Intelligent Interactive Multimedia: Systems and Services. Smart Innov. Syst. Technol. 2012, 14, 609–617. [Google Scholar]
- Nin, J.; Villatoro, D. Citizen in sensor networks: Second international workshop, citiSens 2013 Barcelona, Spain, September 19, 2013 revised selected papers. Lect. Notes Comput. Sci. 2014, 8313, 26–35. [Google Scholar]
- Chua, A.; Servillo, L.; Marcheggiani, E.; Moere, A.V. Mapping Cilento: Using geotagged social media data to characterize tourist flows in southern Italy. Tour. Manag. 2016, 57, 295–310. [Google Scholar] [CrossRef]
- Karagiannakis, N.; Giannopoulos, G.; Skoutas, D.; Athanasiou, S. OSMRec Tool for Automatic Recommendation of Categories on Spatial Entities in OpenStreetMap. In Proceedings of the 9th ACM Conference on Recommender Systems (RecSys ’15), Vienna, Austria, 16–20 September 2015; Association for Computing Machinery: New York, NY, USA, 2015; pp. 337–338. [Google Scholar] [CrossRef]
- Burcher, M.; Whelan, C. Social network analysis as a tool for criminal intelligence: Understanding its potential from the perspectives of intelligence analysts. Trends Organ. Crime 2017, 21, 1–17. [Google Scholar] [CrossRef]
- Oubezza, M.; Elkafi, J. An approach for the implementation of semantic Big Data Analytics in the Social Business Intelligence process on distributed environments (Cloud computing). In Proceedings of the 4th International Conference on Big Data and Internet of Things, Rabat, Morocco, 23–24 October 2019; pp. 1–6. [Google Scholar] [CrossRef]
- Zeng, B.; Gerritsen, R. What do we know about social media in tourism? A review. Tour. Manag. Perspect. 2014, 10, 27–36. [Google Scholar] [CrossRef]
- Lalicic, L. Open innovation platforms in tourism: How do stakeholders engage and reach consensus? Int. J. Contemp. Hosp. Manag. 2018, 30, 2517–2536. [Google Scholar] [CrossRef]
- Chareyron, G.; Da-Rugna, J.; Raimbault, T. Big data: A new challenge for tourism. In Proceedings of the 2014 IEEE International Conference on Big Data (Big Data), Washington, DC, USA, 27–30 October 2014; pp. 5–7. [Google Scholar]
- Dwyer, L.; Kim, C. Destination Competitiveness: A Model and Determinants. Curr. Issues Tour. 2003, 6, 369–414. [Google Scholar] [CrossRef]
- Gomezelj, D.O.; Mihalic, T. Destination competitiveness—Applying different models, the case of Slovenia. Tour. Manag. 2008, 29, 294–307. [Google Scholar] [CrossRef]
- Zhong, L.; Deng, J.; Xiang, B. Tourism development and the tourism area life-cycle model: A case study of Zhangjiajie National Forest Park, China. Tour. Manag. 2008, 29, 841–856. [Google Scholar] [CrossRef]
- Fernández, J.I.P.; Rivero, M.S. Measuring Tourism Sustainability: Proposal for a Composite Index. Tour. Econ. 2009, 15, 277–296. [Google Scholar] [CrossRef] [Green Version]
- Cibinskiene, A.; Snieskiene, G. Evaluation of City Tourism Competitiveness. Procedia Soc. Behav. Sci. 2015, 213, 105–110. [Google Scholar] [CrossRef] [Green Version]
- Gartner. Business Intelligence (BI)—Glossary. 2019. Available online: https://www.gartner.com/it-glossary/business-intelligence-bi/ (accessed on 16 September 2020).
- Williams, S. Business Intelligence Strategy and Big Data Analytics; Morgan Kaufmann: Cambridge, MA, USA, 2016. [Google Scholar]
- Mariani, M.; Baggio, R.; Fuchs, M.; Höepken, W. Business intelligence and big data in hospitality and tourism: A systematic literature review. Int. J. Contemp. Hosp. Manag. 2018, 30, 3514–3554. [Google Scholar] [CrossRef] [Green Version]
- Sabou, M.; Brasoveanu, A.; Onder, I. Linked Data for Cross-Domain Decision-making in TOurism. J. Internet Serv. Appl. 2015, 6, 1–13. [Google Scholar]
- Maeda, T.; Yoshida, M.; Toriumi, F.; Ohashi, H. Decision Tree Analysis of Tourists’ Preferences Regarding Tourist Attractions Using Geotag Data from Social Media. In Proceedings of the Second International Conference on IoT in Urban Space, Tokyo, Japan, 24–25 May 2016; pp. 61–64. [Google Scholar] [CrossRef]
- Guy, I.; Mejer, A.; Nus, A.; Raiber, F. Extracting and Ranking Travel Tips from User-Generated Reviews. In Proceedings of the 26th International Conference on World Wide Web (WWW ’17), Perth, Australia, 3–7 April 2017; International World Wide Web Conferences Steering Committee: Geneva, Switzerland, 2017; pp. 987–996. [Google Scholar] [CrossRef] [Green Version]
- Peng, M.; Tuan, S.H.; Liu, F.C. Establishment of Business Intelligence and Big Data Analysis for Higher Education. In Proceedings of the International Conference on Business and Information Management, Beijing, China, 16–17 July 2017; pp. 121–125. [Google Scholar] [CrossRef]
- Castellanos, M.; Gupta, C.; Wang, S.; Dayal, U.; Durazo, M. A Platform for Situational Awareness in Operational BI. Decis. Support Syst. 2012, 52, 869–883. [Google Scholar] [CrossRef]
- Rajesh Kumar, G.; Radhakrishna, V.; Aljawarneh, S. Strategic Application of Software Process Model to Optimize Business Intelligence Results. In Proceedings of the International Conference on Engineering & MIS, Istanbul, Turkey, 24–26 September 2015. [Google Scholar]
- Cohen, L. Impacts of business intelligence on population health: A systematic literature review. In Proceedings of the South African Institute of Computer Scientists and Information Technologists, Thaba Nchu, South Africa, 26–28 September 2017; pp. 1–9. [Google Scholar] [CrossRef]
- Love, M.; Boisvert, C.; Uruchrutu, E.; Ibbotson, I. Nifty with Data: Can a Business Intelligence Analysis Sourced from Open Data form a Nifty Assignment? In Proceedings of the 2016 ACM Conference on Innovation and Technology in Computer Science Education, Arequipa, Peru, 9–13 July 2016; pp. 344–349. [Google Scholar] [CrossRef]
- Berndt, D.; Hevner, A.; Studnicki, J. Hospital discharge transactions: A data warehouse component. In Proceedings of the 33rd Annual Hawaii International Conference on System Sciences, Maui, HI, USA, 4–7 January 2000; Volume 1, p. 10. [Google Scholar] [CrossRef]
- Musa, G.; Chiang, P.H.; Sylk, T.; Bavley, R.; Keating, W.; Lakew, B.; Tsou, H.C.; Hoven, C. Use of GIS Mapping as a Public Health Tool—From Cholera to Cancer. Health Serv. Insights 2013, 6, 111–116. [Google Scholar] [CrossRef]
- Mooney, S.; Westreich, D.; El-Sayed, A. Epidemiology in the Era of Big Data. Epidemiology 2015, 26. [Google Scholar] [CrossRef]
- Rizi, S.; Roudsari, A. Development of a Public Health Reporting Data Warehouse: Lessons Learned. Stud. Health Technol. Inform. 2013, 192, 861–865. [Google Scholar] [CrossRef]
- Wisniewski, M.; Kieszkowski, P.; Zagorski, B.; Trick, W.; Sommers, M.; Weinstein, R. Development of a Clinical Data Warehouse for Hospital Infection Control. J. Am. Med. Inform. Assoc. 2003, 10, 454–462. [Google Scholar] [CrossRef] [Green Version]
- Miah, S.; Vu, H.; Gammack, J.; McGrath, M. A Big Data Analytics Method for Tourist Behaviour Analysis. Inf. Manag. 2016, 54. [Google Scholar] [CrossRef] [Green Version]
- Li, D.; Deng, L.; Cai, Z. Statistical analysis of tourist flow in tourist spots based on big data platform and DA-HKRVM algorithms. Pers. Ubiquitous Comput. 2019, 24. [Google Scholar] [CrossRef]
- Krawczyk, M.; Xiang, Z. Perceptual mapping of hotel brands using online reviews: A text analytics approach. Inf. Technol. Tour. 2015, 16. [Google Scholar] [CrossRef]
- Alaei, A.; Becken, S.; Stantic, B. Sentiment Analysis in Tourism: Capitalizing on Big Data. J. Travel Res. 2017, 58, 004728751774775. [Google Scholar] [CrossRef]
- Thelwall, M. Sentiment Analysis for Tourism. In Big Data and Innovation in Tourism, Travel, and Hospitality: Managerial Approaches, Techniques, and Applications; Sigala, M., Rahimi, R., Thelwall, M., Eds.; Springer: Singapore, 2019; pp. 87–104. [Google Scholar] [CrossRef]
- Shayegh, P.; Daneshpour, N. Using a Data Warehouse to improve analyzing Tourism Data. In Proceedings of the 9th International Conferences on e-Commerce with Focus on e-Business, Isfahan, Iran, 16 April 2015. [Google Scholar]
- Hopken, W.; Fuchs, M.; Höll, G.; Keil, D.; Lexhagen, M. Multi-Dimensional Data Modelling for a Tourism Destination Data Warehouse. In Information and Communication Technologies in Tourism; Springer: Berlin/Heidelberg, Germany, 2013. [Google Scholar] [CrossRef]
- Sabou, M.; Onder, I.; Brasoveanu, A.; Scharl, A. Towards Cross-Domain Decision Making in Tourism: A Linked Data Based Approach. SSRN Electron. J. 2015. [Google Scholar] [CrossRef] [Green Version]
- Fermoso, A.M.; Mateos, M.; Beato, M.E.; Berjón, R. Open linked data and mobile devices as e-tourism tools. A practical approach to collaborative e-learning. Comput. Hum. Behav. 2015, 51, 618–626. [Google Scholar] [CrossRef]
- Chen, K.C. Decision Support System for Tourism Development: System Dynamics Approach. J. Comput. Inf. Syst. 2004, 45, 104–112. [Google Scholar]
- Baggio, R.; Caporarello, L. Decision support systems in a tourism destination: Literature survey and model building. In Proceedings of the itAIS-2nd Conference of the Italian Chapter of AIS (Association for Information Systems), Verona, Italy, 1–2 December 2005. [Google Scholar]
- Wöber, K.W. Information supply in tourism management by marketing decision support systems. Tour. Manag. 2003, 24, 241–255. [Google Scholar] [CrossRef]
- Vajirakachorn, T.; Chongwatpol, J. Application of business intelligence in the tourism industry: A case study of a local food festival in Thailand. Tour. Manag. Perspect. 2017, 23, 75–86. [Google Scholar] [CrossRef]
- Diakopoulos, N.; Naaman, M.; Kivran-Swaine, F. Diamonds in the Rough: Social Media Visual Analytics for Journalistic Inquiry. In Proceedings of the 2010 IEEE Symposium on Visual Analytics Science and Technology, Salt Lake City, UT, USA, 24–29 October 2010; pp. 115–122. [Google Scholar] [CrossRef]
- Stojanovski, D.; Dimitrovski, I.; Madjarov, G. TweetViz: Twitter Data Visualization. In Proceedings of the Data Mining and Data Warehouses, Ljubljana, Slovenia, 6 October 2014. [Google Scholar]
- Bustamante, A.; Sebastia, L.; Onaindia, E. Can Tourist Attractions Boost Other Activities Around? A Data Analysis through Social Networks. Sensors 2019, 19, 2612. [Google Scholar] [CrossRef] [Green Version]
- Yasseri, T.; Quattrone, G.; Mashhadi, A. Temporal Analysis of Activity Patterns of Editors in Collaborative Mapping Project of OpenStreetMap. In Proceedings of the 9th International Symposium on Open Collaboration (WikiSym ’13), Hong Kong, China, 7–9 August 2013; Association for Computing Machinery: New York, NY, USA, 2013. [Google Scholar] [CrossRef]
- Jilani, M.; Corcoran, P.; Bertolotto, M. Multi-Granular Street Network Representation towards Quality Assessment of OpenStreetMap Data. In Proceedings of the Sixth ACM SIGSPATIAL International Workshop on Computational Transportation Science (IWCTS ’13), Orlando, FL, USA, 5–8 November 2013; Association for Computing Machinery: New York, NY, USA, 2013; pp. 19–24. [Google Scholar] [CrossRef]
- Jokar Arsanjani, J.; Mooney, P.; Zipf, A.; Helbich, M. An Introduction to OpenStreetMap in GIScience: Experiences, Research, Applications; Springer: Berlin/Heidelberg, Germany, 2015. [Google Scholar]
- Luxen, D.; Vetter, C. Real-Time Routing with OpenStreetMap Data. In Proceedings of the 19th ACM SIGSPATIAL International Conference on Advances in Geographic Information Systems (GIS ’11), Chicago, IL, USA, 1–4 November 2011; Association for Computing Machinery: New York, NY, USA, 2011; pp. 513–516. [Google Scholar] [CrossRef]
- Baumbach, S.; Rubel, C.; Ahmed, S.; Dengel, A. Geospatial Customer, Competitor and Supplier Analysis for Site Selection of Supermarkets. In Proceedings of the 2019 2nd International Conference on Geoinformatics and Data Analysis (ICGDA 2019), Prague, Czech Republic, 15–17 March 2019; Association for Computing Machinery: New York, NY, USA, 2019; pp. 110–114. [Google Scholar] [CrossRef]
- Milot, J.; Munroe, P.; Beaudry, E.; Grondin, F.; Bourdeau, G. Lookupia: An Intelligent Real Estate Search Engine for Finding Houses Optimally Geolocated to Reach Points of Interest. In Proceedings of the 25th International Conference Companion on World Wide Web (WWW ’16 Companion), Montreal, QC, Canada, 11–15 April 2016; International World Wide Web Conferences Steering Committee: Geneva, Switzerland, 2016; pp. 651–653. [Google Scholar] [CrossRef]
- Ciepluch, B.; Mooney, P.; Jacob, R.; Winstanley, A.C. Using OpenStreetMap to Deliver Location-Based Environmental Information in Ireland. SIGSPATIAL Spec. 2009, 1, 17–22. [Google Scholar] [CrossRef] [Green Version]
- Inmon, W. Building the Datawarehouse; John Wiley & Sons, Inc.: Hoboken, NJ, USA, 2002. [Google Scholar]
- Del Pilar Salas-Zárate, M.; López-López, E.; Valencia-García, R.; Aussenac-Gilles, N.; Almela, Á.; Alor-Hernández, G. A study on LIWC categories for opinion mining in Spanish reviews. J. Inf. Sci. 2014, 40, 749–760. [Google Scholar] [CrossRef] [Green Version]
- Gambino, O.; Calvo, H. A Comparison Between Two Spanish Sentiment Lexicons in the Twitter Sentiment Analysis Task. In Proceedings of the 25th International Conference Companion on World Wide Web, Montreal, QC, Canada, 11–15 April 2016; Volume 10022, pp. 127–138. [Google Scholar] [CrossRef]
- Mooney, P.; Corcoran, P.; Winstanley, A.C. Towards Quality Metrics for OpenStreetMap. In Proceedings of the 18th SIGSPATIAL International Conference on Advances in Geographic Information Systems (GIS ’10), San Jose, CA, USA, 3–5 November 2010; Association for Computing Machinery: New York, NY, USA, 2010; pp. 514–517. [Google Scholar] [CrossRef] [Green Version]
- El-Ashmawy, K.L.A. Testing the positional accuracy of OpenStreetMap data for mapping applications. Geod. Cartogr. 2016, 42, 25–30. [Google Scholar] [CrossRef]
Figure 1.
Destination definition in BITOUR.

Figure 2.
Process overview supported by BITOUR.

Figure 3.
Architecture of BITOUR.

Figure 4.
Visualization layer overview.

Figure 5.
Configuration of each category.

Figure 6.
Geographical visualization of the tweet.

Figure 7.
OLAP Cubes.

Figure 8.
Stay duration grouping tourists by language.

Figure 9.
Tweets by nationality.

Figure 10.
Distribution of tweets around ten attractions in Valencia.

Figure 11.
When the Cathedral of Santa Maria is selected.

Figure 12.
Tweets from Airbnb accommodations.

Figure 13.
Tweets from museums and monuments.

Figure 14.
Tweets per attraction and sentiment category.

Figure 15.
Tweets per accommodation and type of POI.


Table 1.
Summary of data sources.
| Source | Data Extracted from Data Sources | Type of Access |
|---|---|---|
| OSM | name of objects, characteristics in the form of labels, geometry and coordinates | API |
| the text of the tweet, the coordinates, the language assigned by Twitter, the hashtags, the date of creation of the tweet and the user who made it; user location and language | JSON | |
| Tripadvisor | the name of the hotels, their location, price per night and valuation of their services. | Web Scrapping |
| Airbnb | the name of the accommodations, their location, price per night and valuation of their servicess. | CSV |
Table 2.
OSM Tags and BITOUR categories.
| Category | OSM Tags |
|---|---|
| Museum | (“tourism”, “museum”); (“amenity”, “arts_centre”) |
| Monument | (“tourism”, “attraction”); (“tourism”, “viewpoint”); (“historic”, “monument”), (“historic”, “wayside_shrine”), (“historic”, “memorial”), (“historic”, “castle”), (“historic”, “ruins”), (“historic”, “archaelogical_site”), (“historic”, “battlefield”), (“amenity”, “grave_yard”), (“amenity”, “crypt”); (“building”,“cathedral”), (“building”,“chapel”), (“building”,“church”) |
| Night life | (“amenity”, “nightclub”); (“amenity”, “pub”), (“amenity”, “stripclub”); (“amenity”, “bar”) |
| Hotel | (“tourism”, “hotel”); (“tourism”, “hostel”); (“building”,“hotel”) |
| Gastronomy | (“amenity”, “bbq”), (“amenity”, “biergarten”), (“amenity”, “cafe”),(“amenity”, “restaurant”) |
| Leisure | (“tourism”, “zoo”); (“tourism”, “aquarium”); (“tourism”, “theme_park”); (“amenity”, “cinema”); (“amenity”, “theatre”); (“leisure”, “water_park”); (“leisure”, “stadium”); (“leisure”, “water_park”); (“leisure”, “garden”); (“leisure”, “park”); (“leisure”, “playground”), (“leisure”, “nature_reserve”), (“natural”,“beach”); (“natural”,“bay”); (“natural”,“cliff”); (“natural”,“coastline”); (“natural”, “cave_entrance”); (“natural”, “peak”); (“natural”, “glacier”); (“natural”, “volcano”); (“natural”, “wood”); (“natural”, “grassland”); (“natural”, “tree”) |
| Transport | (“aeroway”, “aerodrome”); (“building”,“train_station”) |
| Shopping | (“amenity”, “marketplace”); (“shop”, “mall”) |
Table 3.
Example of priorities and distances used by categories.
| Category | Distance | Priority | Category | Distance | Priority |
|---|---|---|---|---|---|
| Museums | 25 m | 1 | Gastronomy | 25 m | 5 |
| Monuments | 50 m | 2 | Leisure | 25 m | 6 |
| Nights | 25 m | 3 | Transport | 15 m | 7 |
| Hotels | 35 m | 4 | Shoppings | 15 m | 8 |
Table 4.
Example of a tweet processing.
| Tweet Id | Place | Distance | Category |
|---|---|---|---|
| 1020 | Submarine Restaurant | 5.89 m | Gastronomy |
| 1020 | City of arts and sciences | 0 m | Monument |
| 1020 | Oceanographic | 0 m | Leisure |
Publisher’s Note: MDPI stays neutral with regard to jurisdictional claims in published maps and institutional affiliations. |
© 2020 by the authors. Licensee MDPI, Basel, Switzerland. This article is an open access article distributed under the terms and conditions of the Creative Commons Attribution (CC BY) license (http://creativecommons.org/licenses/by/4.0/).
Share and Cite
MDPI and ACS Style
Bustamante, A.; Sebastia, L.; Onaindia, E. BITOUR: A Business Intelligence Platform for Tourism Analysis. ISPRS Int. J. Geo-Inf. 2020, 9, 671. https://0-doi-org.brum.beds.ac.uk/10.3390/ijgi9110671
AMA Style
Bustamante A, Sebastia L, Onaindia E. BITOUR: A Business Intelligence Platform for Tourism Analysis. ISPRS International Journal of Geo-Information. 2020; 9(11):671. https://0-doi-org.brum.beds.ac.uk/10.3390/ijgi9110671
Chicago/Turabian StyleBustamante, Alexander, Laura Sebastia, and Eva Onaindia. 2020. "BITOUR: A Business Intelligence Platform for Tourism Analysis" ISPRS International Journal of Geo-Information 9, no. 11: 671. https://0-doi-org.brum.beds.ac.uk/10.3390/ijgi9110671
Note that from the first issue of 2016, this journal uses article numbers instead of page numbers. See further details here.