Influence of Quality of Remote Sensing Data on Vegetation Passability by Terrain Vehicles


Faculty of Military Technology, University of Defence, Kounicova 65, 662 10 Brno, Czech Republic
*
Author to whom correspondence should be addressed.
ISPRS Int. J. Geo-Inf. 2020, 9(11), 684; https://0-doi-org.brum.beds.ac.uk/10.3390/ijgi9110684
Submission received: 21 September 2020
/
Revised: 2 November 2020
/
Accepted: 12 November 2020
/
Published: 16 November 2020
Abstract
:The article studied databases of vegetation created from remote sensors, outcome of analyses of Cross-Country Movement in forests, and quality of utilized data. The aim was to combine various databases of forests and get statistics of best data by using different methods of evaluation. Passability in forests is mainly conducted with analysis of driving between trees. The most suitable datasets in the Czech Republic are Forest Economic Plan and Digital Elevation Model 5th generation combined with Digital Surface Model 1st generation. Accuracy and usability of databases were compared with digital model of surface created from orthophoto images. Processing of data is the most important part that influences quality of statistical and map results. Studied characteristics of input databases and applied methods also have considerable influence on results of analysis of forest passability. The outcome substantially varies for personnel armored vehicles and wheeled vehicles mostly due to their movement capabilities.
1. Introduction
Forest stands are one of the most important type of terrain that interests forestry, rescue teams, and the army during the use of off-road vehicles in crisis situations. In some regions, especially with sufficient rainfall, forests are a key part of terrain. Similar situation is in Central Europe, where forests cover about 30% of the territory; also see Reference [1]. Types of vegetation in a specific area can also give indication of climatic conditions, hydrologic transformation, drainage systems, water supply, and soil type. Vegetation cover can affect military tactics, decisions and operations. In the case when drivers are not able to use some segments of roads (damaged or destroyed objects, traffic jam, etc.), they have to be provided with complete cross-country mobility (CCM) analyses considering all main geographical factors to solve transportation problems [2]. Major needed elements for the purpose of classification and quantification of geographic factors of CCM are:
- particular degrees of CCM;
- typology of terrain practicability by kind of military vehicles;
- geographic factors and features with significant impact on CCM;
- other factors (technical, personnel, environmental, etc.).
Warfare distinguishes 3 basic degrees of CCM, standard NATO (North Atlantic Treaty Organization) terms are in parentheses:
- passable terrain (GO);
- terrain passable with restrictions (SLOW GO);
- impassable terrain (NO GO).
Army planners consider dense vegetation as an obstacle hard to pass through. In a closer look, majority of forests can be qualified as passable for some types of vehicles when considering detailed analyses of suitable data [2]. Remote sensors-based databases are contemporary optimal choice for extensive CCM analyses with large coverage and easier capture and processing of input data. Time is vital for military and rescue operations; hence, availability, actuality and accuracy of data must have the highest priority when executing CCM analyses procedures.
There is a great amount of literature focused on the above-mentioned factors of cross-country mobility. Ahlvin and Haley [2], in “NATO reference mobility model”, described the calculation of the influence of individual factors on the movement of military vehicles. Cibulová describes the main factors that determine the mobility of vehicles during crisis situations in Reference [3]. The impact of microrelief forms on vehicle movement is the subject of a study Dohnal et al. [4]. Hošková-Mayerová et al. deal with the influence of spatial database quality on the analysis of terrain passability by military vehicles [5]. The impact of geographic and meteorological factors on vehicle movement in the open environment is the subject of the study Hubacek et al. [6]. Pokonieczny [7] developed specific own methodology for the automated creation of maps of terrain passability of various scales based on the factors of landscape coverage by geographical elements. Rybansky described a comprehensive methodology of the influence of the main geographical factors on the speed of off-road vehicles, including the creation of synthetic maps and the application of factor analysis to calculate the resulting vehicle speed [8]. The impact of geographic factors on Cross-Country Movement (CCM) is the subject of studies [9,10,11]. Shoop and al. give a very detailed overview of cold regions mobility modeling in Reference [12]. General procedures for calculating terrain passability as part of field analysis are given in Reference [13]. Stodola and Mazal solve the process of navigation of Autonomous Unmanned Ground Vehicles (UGV) in Reference [14]. Terramechanical models dealing with vehicle-terrain interaction are described in Teheri et al. [15].
Publications that deal with vehicle navigation in the wooded field can be divided into two groups. The first group includes publications focused on the CCM possibility [2,3,4,5,6,7,8,9,10,11,12,13,14,15], the second group includes publications evaluating the possibilities of using remote sensing data to determine the structure of the forest (tree location, stem diameter). The position of trees is the most important factor for modeling the navigation of off-road vehicles. Current methods for determining the positions of individual trees are based primarily on remote sensing technologies using aerial laser scanning technology. The first application of airborne laser scanning (ALS) for individual tree based height determination and volume estimation was published by Hyyppä and Inkinen in 1999; see Reference [16]. Other relevant publications that develop methodological and technological aspects of forest structure determination include studies using the algorithms for the automatic detection of trees in lasser scanner data; see Blair et al. [17], Lim et al. [18], Heurich et al. [19], Aschoff and Spiecker [20], Gobakken and Næsset [21], Carson et al. [22], Ahlberg et al. [23], Vauhkonen [24], Mikita et al. [25], and Rybansky et al. [26]. Some authors are developing technologies using vegetation mapping strategy by combining airborne LIDAR (light detection and ranging) data and aerial imagery, e.g., Su et al. [27]. Some studies are focused on the use of radar methods of forest mapping, e.g., Martone et al. [28], Kugler et al. [29], and Cazcarra-Bes et al. [30]. These methods can be applied, for example, in difficult meteorological conditions, where LIDAR technology cannot be used for navigation of off-road vehicles. Some publications are focused on the use of remote sensing methods to support crisis management, e.g., Gitas et al. [31], Ambrosia [32], and Ambrosia and Zajkowski [33].
The object of this study was finding and statistically evaluating a connection between results of analyses of CCM and quality of input data obtained with laser scanning and photogrammetric methods. The initial goal was to determine suitable forest layers and their key attributes exploitable in analyses of forests passability. The main goal was to determine influence of quality of forest databases to results of CCM analyses.
2. Method of Investigation
The main method of research is based on analysis of available forest and terrain data in the Czech Republic. Accuracy and density of data are the major observed aspects of related databases. Methods used in the research deal with influence of inner structure of forest on capability of military vehicles to pass through this kind of obstacle, see Reference [25]. Input data (selected databases) had to be processed to acquire forest parameters. Majority of tasks to compute passability utilized formulas and diagrams in Microsoft Excel 2019. Evaluation of data and creating map outputs have been processed in ArcGIS 10.4.1.
The key sources of information used in the study were the research papers on Cross-Country Movement (CCM) published by the department of military geography and meteorology of the University of Defence in Brno. The part of the article which focuses on remote sensing data capture and processing is based on studies Mikita et al., 2013 [25], Rybansky et al., 2016 [26], and Simon et al., 1998 [34]. Introduced databases must have been processed for CCM analysis with a methodology of table conversion of forest characteristics Simon et al., 1998 [34]. Table conversion means assign characteristics of forest according to official growth tables, e.g., 60 years old tree with mean height 22,0 m can be defined as 1084 number of trees per hectare. Number of trees per hectare were then used to calculate mean tree spacing for CCM analysis.
The analysis of the passability in forests can be divided to a methodology of driving between trees and a calculation of capability of overcoming the tree trunks, which will be omitted for the purpose of the study. Data analyses were performed for two different types of military vehicles: personnel wheeled vehicle Land Rover Defender 110 (LRD 110) and armored personnel tracked vehicle BVP-2 (bojove vozidlo pechoty - infantry military vehicle). The overall task is determining influence of quality of data used in terrain analyses to decision-making processes of commanders and staff by specifying uncertainty in percentage of final CCM results; see Vala and Rybansky, 2001 [35]. Databases and methodology of their processing have been tested in two selected areas. They represent a sample of the most common landscapes in the Czech Republic, rolling land partially covered with a forest consisting mostly of coniferous trees. First locality (coordinates 50.307 N, 16.217 E), the Bačetín Forest, is in the northeastern part of the Czech Republic, its size is 2.5 × 1.5 km. It is a plateau with majority of sandy-clayey soils and coniferous trees in the southern part. The mean slope gradient of the southern part is 5.2°. The northern part of the forest is a narrow valley with the mean slope gradient 11.7° and for the most part, with alluvial soils and broadleaved trees. The second selected area (coordinates 49.360 N, 15.440 E), a forest near Dolní Cerekev with similar size, is in the Southern Bohemia. It consists of more spruce trees and less broadleaved trees than the first selected area. It is covered mostly of sandy and sandy-clayey soils. The terrain is hilly with the mean slope gradient of 13.5°. The overview of sorts of trees in two selected areas is in Table 1. The second area was not completely covered with all tested datasets; therefore, it serves as complementary to verify conclusions set from the first area. Majority of trees in both areas are coniferous trees, the overwhelming majority in sort of trees are spruce trees. This shows that the selected area of Bačetín is representative for testing of forest characteristics.
Evaluation of forest datasets qualities is based on the comparison of analysis of passability for individual parts of the selected forest. Input parameter for CCM is a mean height of a forest. CCM results (whether the forest is passable, hardly passable, or impassable) are given from conversion of the mean height of the forest gathered from each database to the number of trees per hectare.
3. Analysis of Methodology and Data
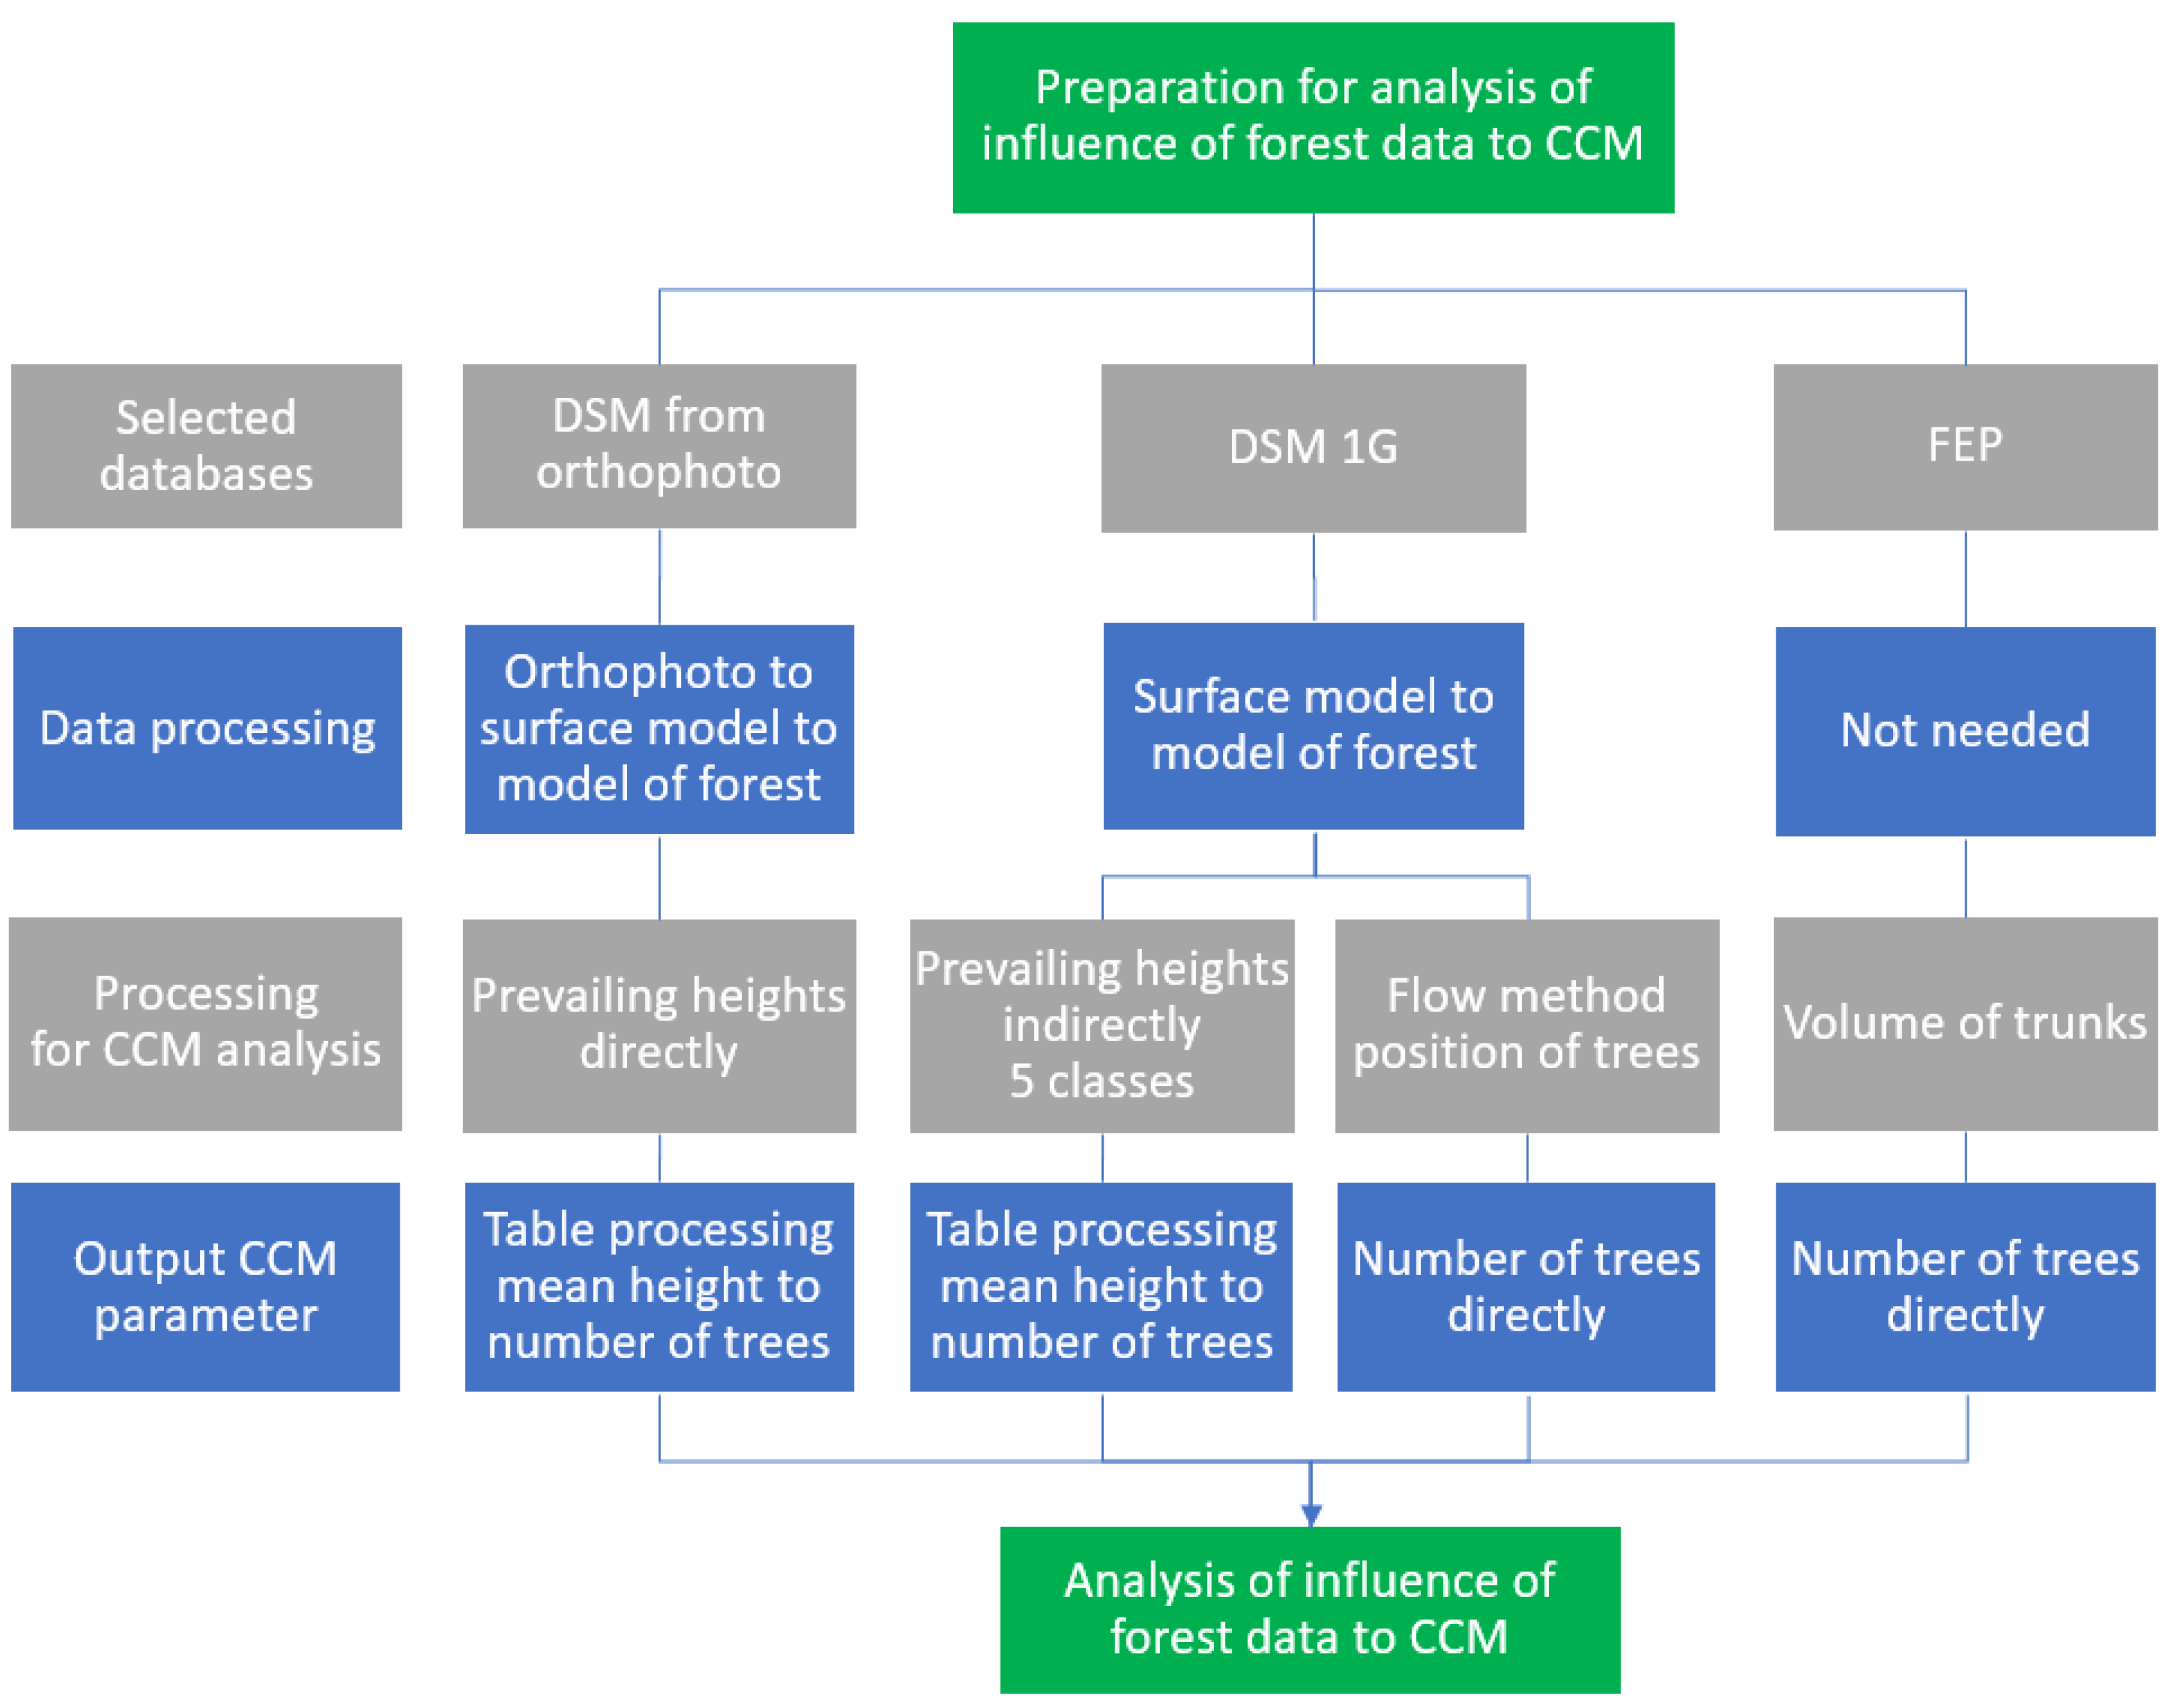
In order to establish suitable data statistics, three various datasets have been tested, each with different method. First tested dataset is a combination of the key elevation models in the Czech Republic, Digital Elevation Model 5th generation (DEM5) [37] and Digital Surface Model 1st generation (DSM 1G) [38], both with the irregular network of points with the density less than one point per one square meter. The second tested dataset is Forest Economic Plan (FEP). It is the most suitable data of forest stands which is managed by the Forest Management Institute [39]. Both previous datasets are based on laser scanning data. In order to balance density and actuality of data, photogrammetric method-based data had to be applied. The third tested dataset is digital surface model (DSM) based on imagery captured with a DJI drone (Shenzhen, China) and processed into the model of surface of the selected Forest Bačetín. This digital surface model created from orthophoto is up-to-date and the most accurate studied dataset of the forest. All results and conclusions are defined from a relation to this dataset. Methodological steps of processing data and preparing them for CCM analysis are shown in Figure 1.
3.1. Forest Economic Plan Database
Information from FEP database was processed with a method of volume of trunks. This method is not described in any known publication. It was created as a result of available tree characteristics in the database. The method utilizes parameters of trunks. Each polygon in FEP carries information about total trunk volume of every type of tree and trunk volume of a single tree of each type. A number of trees per hectare is then calculated with Formula (1) [8]:
where NTH is a number of trees per hectare, TVT is a total volume of trees in cubic meters in a forest area, VST is a mean volume of a single tree in cubic meters, and AR is an area of a forest in hectares. A resulting mean tree spacing is calculated with Formula (2); see Rabansky, 2009 [10]:
where MTS is a mean tree spacing, π is the constant, and NTH is a number of trees per hectare.
3.2. Data Based on Digital Surface Model 1st Generation
DSM 1G based dataset is another easily accessed and exploitable vegetation data source. Among many published papers about this part, two were partially utilized in the research. First is evaluation of accuracy of DSM 1G which is studied by Cibulka, 2013 [24]. The other is processing of DSM 1G to obtain characteristics of forests and trees, which is a part of study Rybansky et al. [26]. Processing of cloud of points for forest parameters is based on Mikita [16], Heurich [15], Vauhkonen [18], and Čeplová [28]. Another method of determining the heights of an object (e.g., buildings) that could be applied to vegetation surface detection is described by Plowright et al., 2018 [40].
Processing of DSM 1G for the purpose of CCM analysis is more complicated than in case of FEP database. DSM 1G and DTM5 must be combined in Raster Calculator to obtain heights of forest. The next step was determining correct boundaries defining a different structure inside a forest. The pre-defined model of forest in national vector database ZABAGED [41] was used as the pattern and was modified manually by evaluation of DSM and aerial orthophoto to match inner polygons correctly. The resulting model of the forest was modified with two methods for using in a CCM analysis.
First method of processing DSM 1G for the purpose of CCM analyses is modifying forest heights to height classes. Calculating heights only from highest floors of forest is crucial for creating a proper method for processing of DSM 1G. Fulfilling this condition requires following processing in ArcMap:
- (1)
- Reclassify—classifies raster data of the forest heights to 5 classes.
- (2)
- Zonal statistics-majority—calculates majority of a class in inner zones of the forest.
- (3)
- Less than and set null—erases lower heights pixels (than calculated majority) of the forest in each zone.
- (4)
- Zonal statistics-mean—calculates a mean height in each zone of remaining pixels.
The first method of processing of heights is accurate, but it is also capacitively demanding to process all data properly. Therefore, influence of DSM 1G to CCM analysis was tested on data processed with a different method.
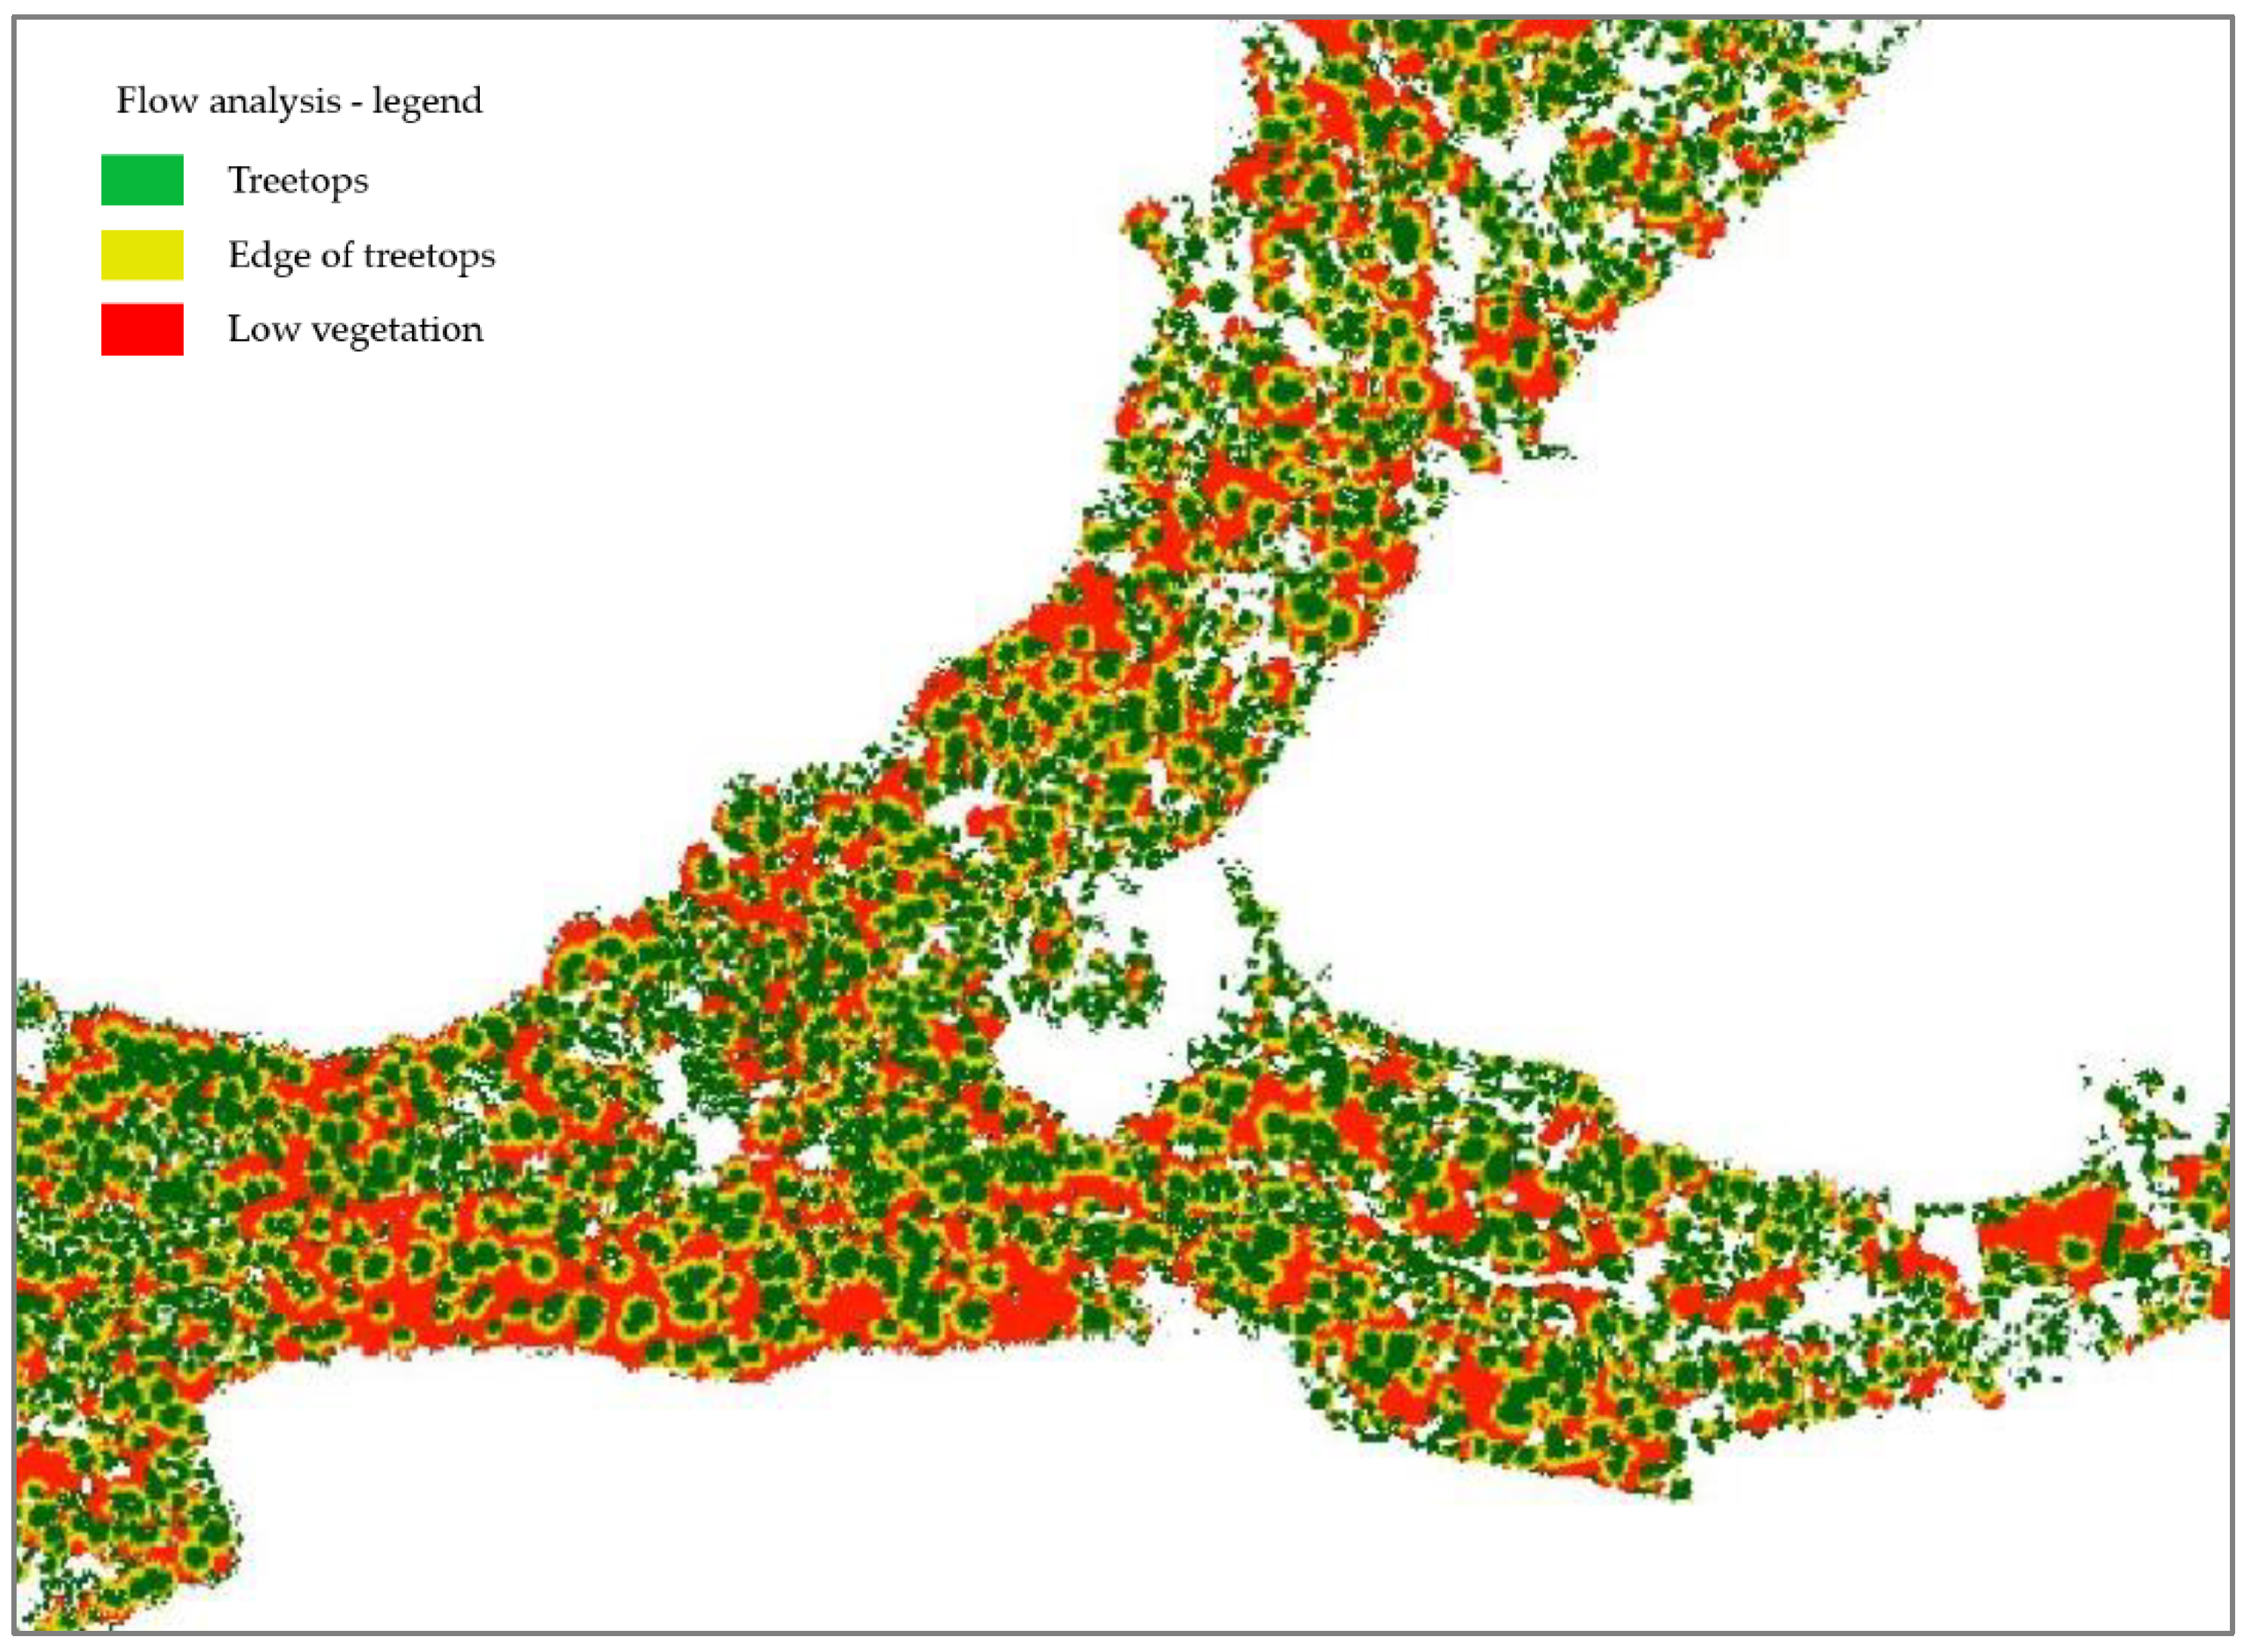
With the second method of DSM 1G processing, the tools of Arc Toolbox Flow Length and Flow Direction were applied to compute areas of treetops [42]; see Figure 2. Each polygon representing an individual tree was then converted into a point. Finally, MTS was calculated directly with Formula (3):
where MTS is a mean tree spacing, NTH is a number of trees per hectare, and AR is an area of a forest in hectares.
3.3. Digital Surface Model Created from Orthophoto
Imagery data was created with the DJI Phantom3 Advanced drone with use of the planner of flights Drone Harmony [43]. Height of the flight was set to 80 m and images only to perpendicular with overlap of 82% in axis x and y. Input files for further processing are 1340 images with resolution 5 cm per pixel. Images were processed with the program WebODM into the form of orthophoto mosaic and digital surface model (DSM). The surface model of the selected Forest Bačetín was created as a combination of DSM from orthophoto and DEM5. Resolution of resulting raster is 40 × 40 cm, the mean error in height is 30 cm.
First step was creating model of forest by combination of DSM heights and DMT5 in Raster Calculator in ArcMap. Afterwards, mean heights of each inner polygon of the Forest Bačetín were calculated with Zonal Statistics of the raster in ArcMap. Finally, a mean height per polygon was re-calculated with MS Excel formulas to MTS. Table values of forest growth from the publication Forest economic adjusting [36] were used to modify mean heights to a number of trees per hectare. Resulting formulas to compute MTS were the same as the ones described in formula 2.
3.4. Evaluation of Passability
To find the optimal route through forest, it is necessary to know: parameters of a vehicle, parameters of trees, start and end point of a route and impassable areas. The most important parameters of a vehicle are vehicle width (VW), length, turning radius, and tolerance (T) [10]. T determines the minimum distance of a vehicle from a trunk to pass between two trees safely. To simplify the passability model, T also replaces the effect of other vehicle parameters (length, turning radius, etc.). In turn, tree parameters refer to those characteristics that are key to finding an optimal route in a forest. In this case, those parameters are stem simulated coordinates, mean tree spacing (MTS), mean diameter at breast height (MDBH), mean riding corridor (MRC), and vehicle width VW—all parameters in (m). A relation between MTS, MDBH, and MRC can be expressed using the Formula (4) and is displayed in Figure 3 [10].
Outcome values are classified according to this key:
- if T < 0, then passability = NO GO;
- if T = ⟨0, 1⟩, then passability = SLOW GO;
- if T > 1, then passability = GO.
4. Results and Discussion
4.1. Evaluation of Boundaries within Forests
The important part of a statistical evaluation is creating a proper sample of data, in this case, a correct placement of boundaries between smaller areas in the forest. FEP has all forests divided into subsections according to the type and age of a prevailing tree. Subareas were directly taken into evaluation of CCM. Yet, some minor changes of boundaries had to be done manually due to inaccuracies mainly of the outer boundary of the main forest. DSM based data has to be split to subsections partially manually. With correct processing and its evaluation, division can be accurate, although, this process is relatively time consuming and is not currently supported by any automated technology.
The areas in FEP are larger than those created from DSM. This makes them more generalized, and in some cases, it provides inaccurate information about MTS. Placement of subareas and their density within the main forest bring better results with the DSM data method. On the other hand, manual work is a downside of the method. Distinction of smaller areas with a more automated method is not that effective and does not necessary lead to accurate results.
4.2. Evaluation of Databases and Methods of Processing
Three databases have been tested with different methods (see Figure 1). The vector database of forests FEP, the model of surface DSM 1G processed with two different methods and the model of surface DSM created from orthophoto. Each database possesses different qualities and usability in CCM analyses.
4.2.1. FEP Database
FEP is by far the most detailed vector database of forests in the Czech Republic. It comprises above all height, thickness, age and volume of trees. The biggest advantage is that attributes of FEP database can be directly utilized in CCM analyses without complicated processing. A drawback is a small coverage of Czech territory, less than 20%. In addition, the data are not regularly updated, which, in a combination with growth of forests, signifies a lower reliability of the database.
4.2.2. DSM 1G
The most significant advantages of DSM 1G are density, accuracy and global coverage of data [44]. On the other hand, laser scanning based data can be perceived as a drawback for certain methods of processing of data for the purpose of CCM analyses. Laser scanning in the area of eastern Bohemia was finished in 2013. According to the growth tables, trees of the selected forest have grown 2 m in average in a comparison with 7-year-old surface data of DSM 1G. Measured height of a forest from DSM 1G can be converted with use of a growth table to age of a tree, a mean stem diameter and a number of trees per hectare [45]. A mean tree spacing can be calculated from number of trees per hectare. Accuracy of height of vegetation is the most important for determination number of trees per hectare. Influence of 3-m variance of height of trees to characteristics of 20-year-old and 60-year-old forest is displayed in Table 2. Variance 3 m is given by 7-year-old growth (2 m) and accuracy of the method of data processing (1 m). The selected age of forest is representative for the studied locality.
The average value of MTS in the studied forest is 3.5 m. The width of a selected military vehicle BVP-2 is 3.15 m. These 2 values are very close (in the range of MTS variance); therefore, accuracy of height of the forest is crucial for determination of passability of the area. Another unknown variable is calculation of average height of a forest from DSM 1G. Height of a forest calculated directly as an average of all forest surface points is lower than real values. The reason is that surface of a forest includes lower parts of trees and even low vegetation; thus, calculated average height is considerably lower. Another issue includes inaccuracy in determining of maximum height of a treetop caused by density of points created by laser scanning. The difference in height might reach 6 m [11].
4.2.3. DSM Created from Orthophoto
The DSM created from orthophoto is suitable dataset for CCM analysis due to its actuality and level of detail. Disadvantage is complicated and time-consuming processing. This method of data collection is different from laser scanning. In comparison with DSM 1G, DSM from orthophoto has better resolution of the height raster and similar accuracy of heights but worse rendering of shapes. The comparison is displayed in Figure 4a,b.
DSM created from orthophoto cannot be processed with the same method as DSM 1G (determination of individual trees) due to the lower details of treetops. This type of data cannot completely substitute point clouds created with laser scanning methods due to lower detail of information; nevertheless, it is sufficient and even suitable for CCM analyses for its actuality. A collection and processing of data, gathered from a smaller area, take two days. Lesser possible extent and time needed to obtain data are disadvantages which prevent this data and the method of processing from being applied in general for larger areas. Nonetheless, the data can be used in analyses of limited range for the most part in research projects.
4.2.4. Comparison of Databases
To verify which of the datasets is closer to correct real up-to-date values of MTS (or else number of trees per hectare and their height), photogrammetric measurement of height of trees from orthophoto images was conducted. This orthophoto was created by DJI drone. Resulting characteristics of the Forest Bačetín representing each tested database is in Table 3. For a comparison, DSM 1G with sorted heights (first method of processing) and DSM 1G without sorted heights are included. This shows that DSM 1G without sorted heights cannot be utilized for CCM analysis because its number of trees is overestimated. Sorted DSM 1G has very close values to most accurate data DSM from orthophoto. FEP is closer to real values than unsorted DSM 1G. More detailed analyses of the results showed that FEP has better values because it was updated once, two years after the last aerial laser scanning was finished. DSM 1G with a proper method of processing, either with sorting of heights or position of trees can be used in CCM analysis, even though, the method of tree positions underestimates total number of trees. The flow analysis, a method of DSM 1G processing, fails in reliable detection of lower vegetation. Without correct determination of number of smaller trees (height below 5 m), applicability of this method of processing is limited.
Both tested datasets (DSM 1G and FEP) were created with laser scanning method in 2013. Seven years of growth increases height of a tree approximately by 2 m (given by average age of trees of the area Bačetín). The value has been determined in a growth table and processed into a growth curve [46]. A two-meter difference represents 10% error in output data. FEP is slightly adjusted because its update was done in 2015; however, the bulk of the data is laser scanning-based and remained outdated. Corrections of growth were not included in calculations. The overall accuracy of individual methods must be corrected in accordance with actuality of respective data.
Laser scanning-based data with the global coverage (Czech Republic) is better in detail with shapes of trees and accuracy; nevertheless, it is outdated. Photogrammetry-based data is actual and easier to utilize in CCM analysis. The downside is long-winded and complex processing of the data. For current data, acquisition from large forest areas and subsequent automation of their processing is advantageous using LIDAR technology with sufficient record density; see, e.g., Goodbody et al., 2017 [47], Mulverhill et al., 2019 [48], or Point Cloud Technology [49].
4.3. Data Quality Assesed from CCM Analyses
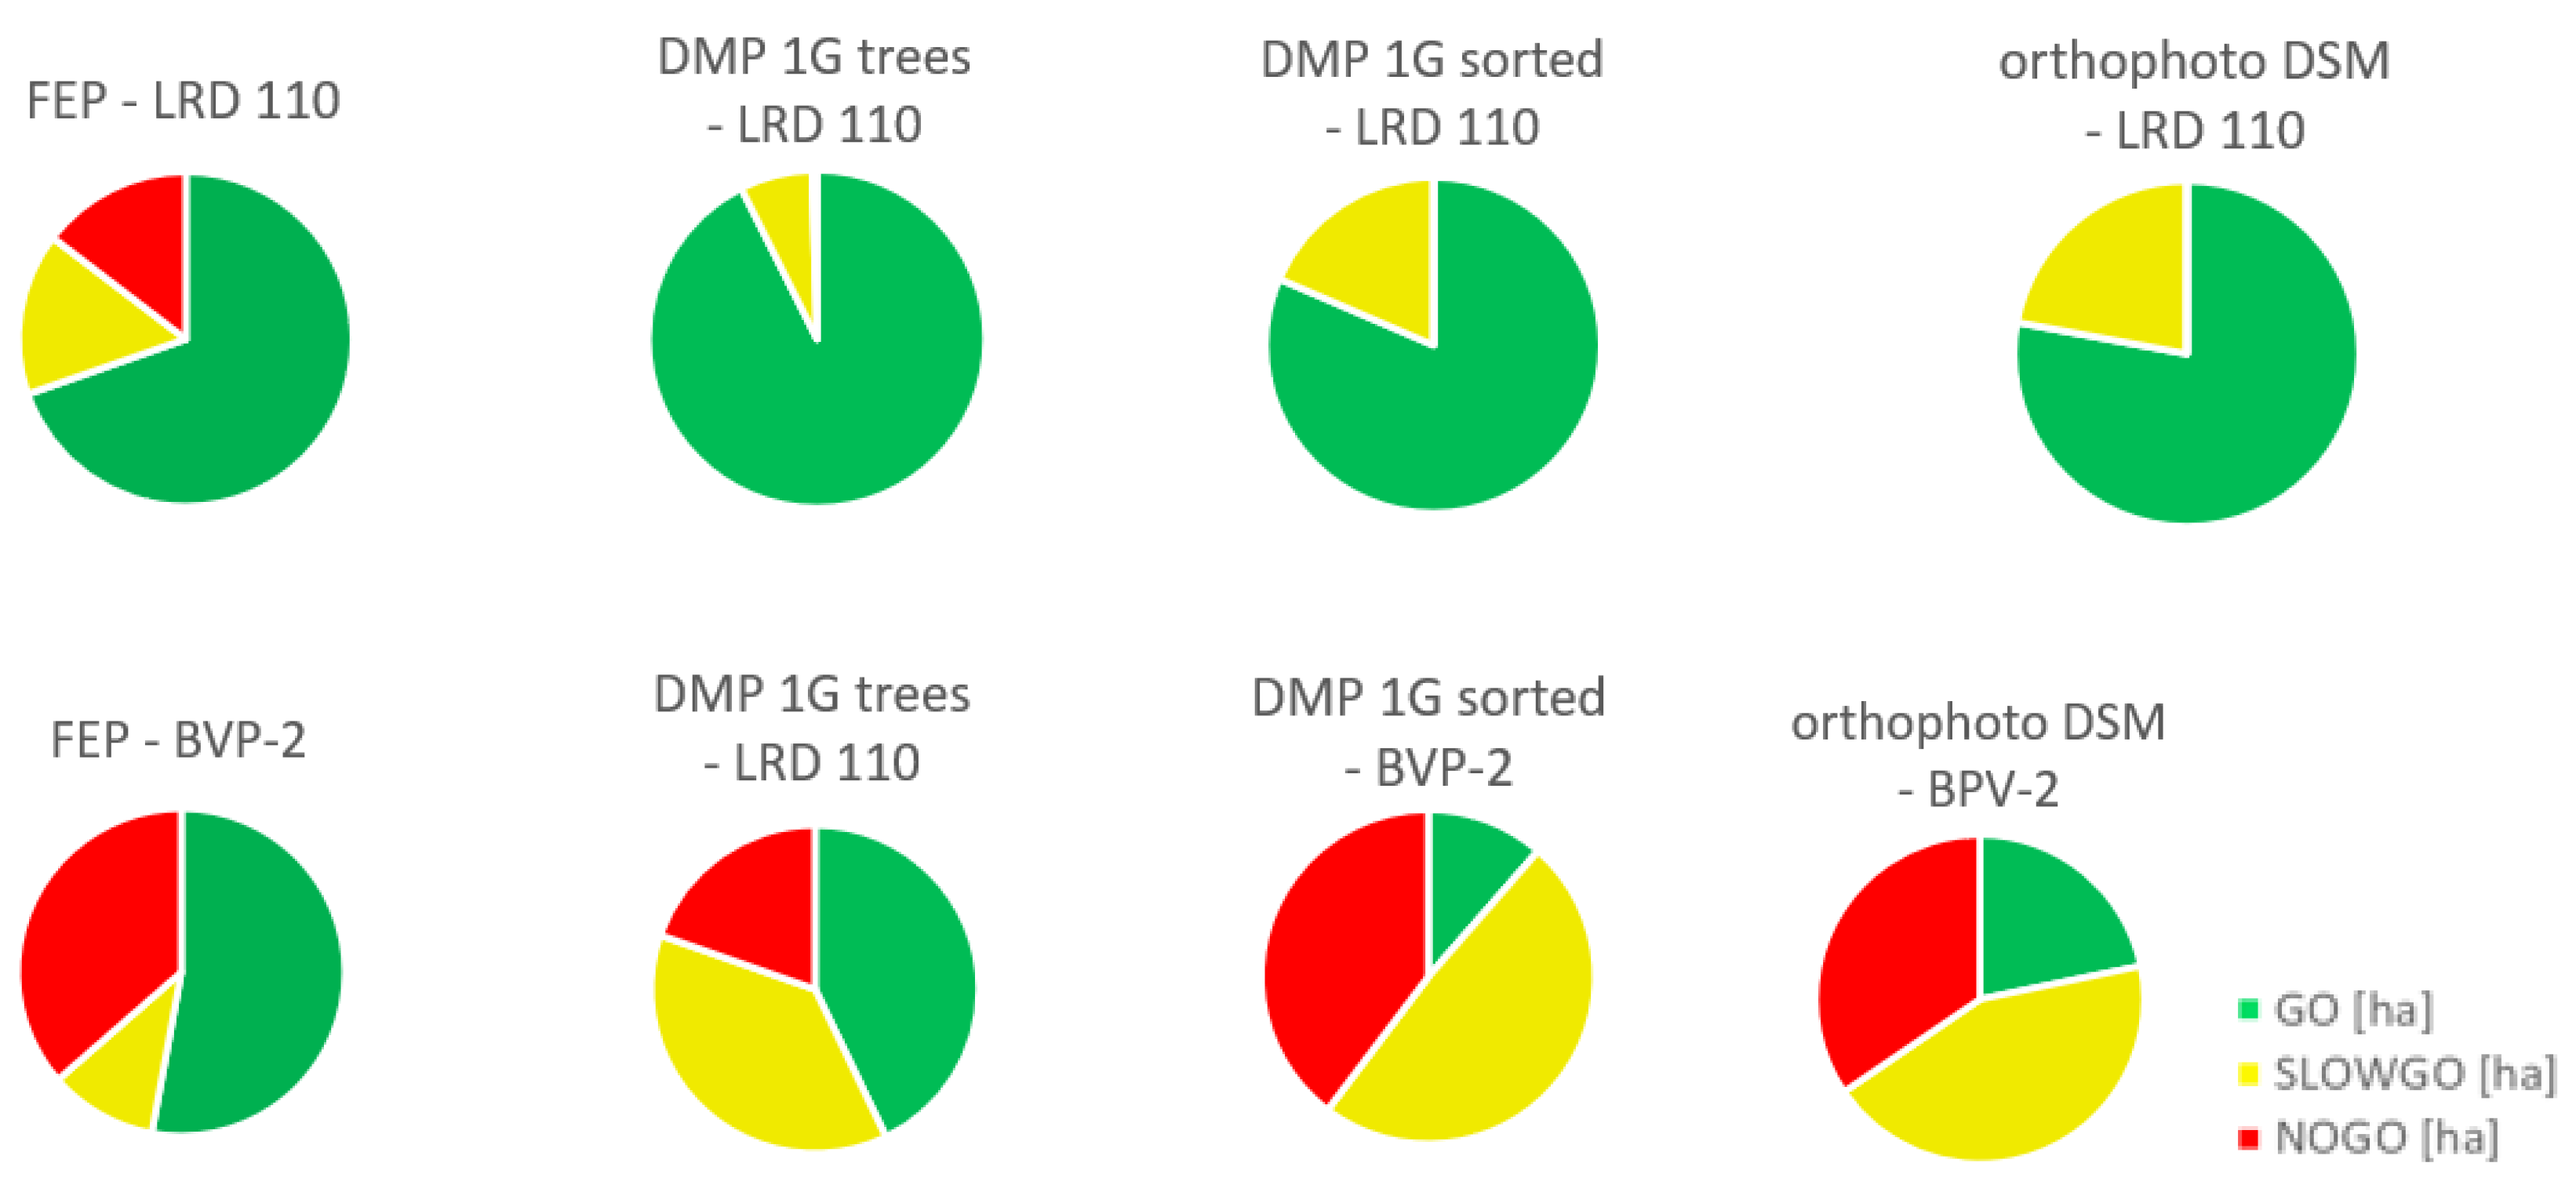
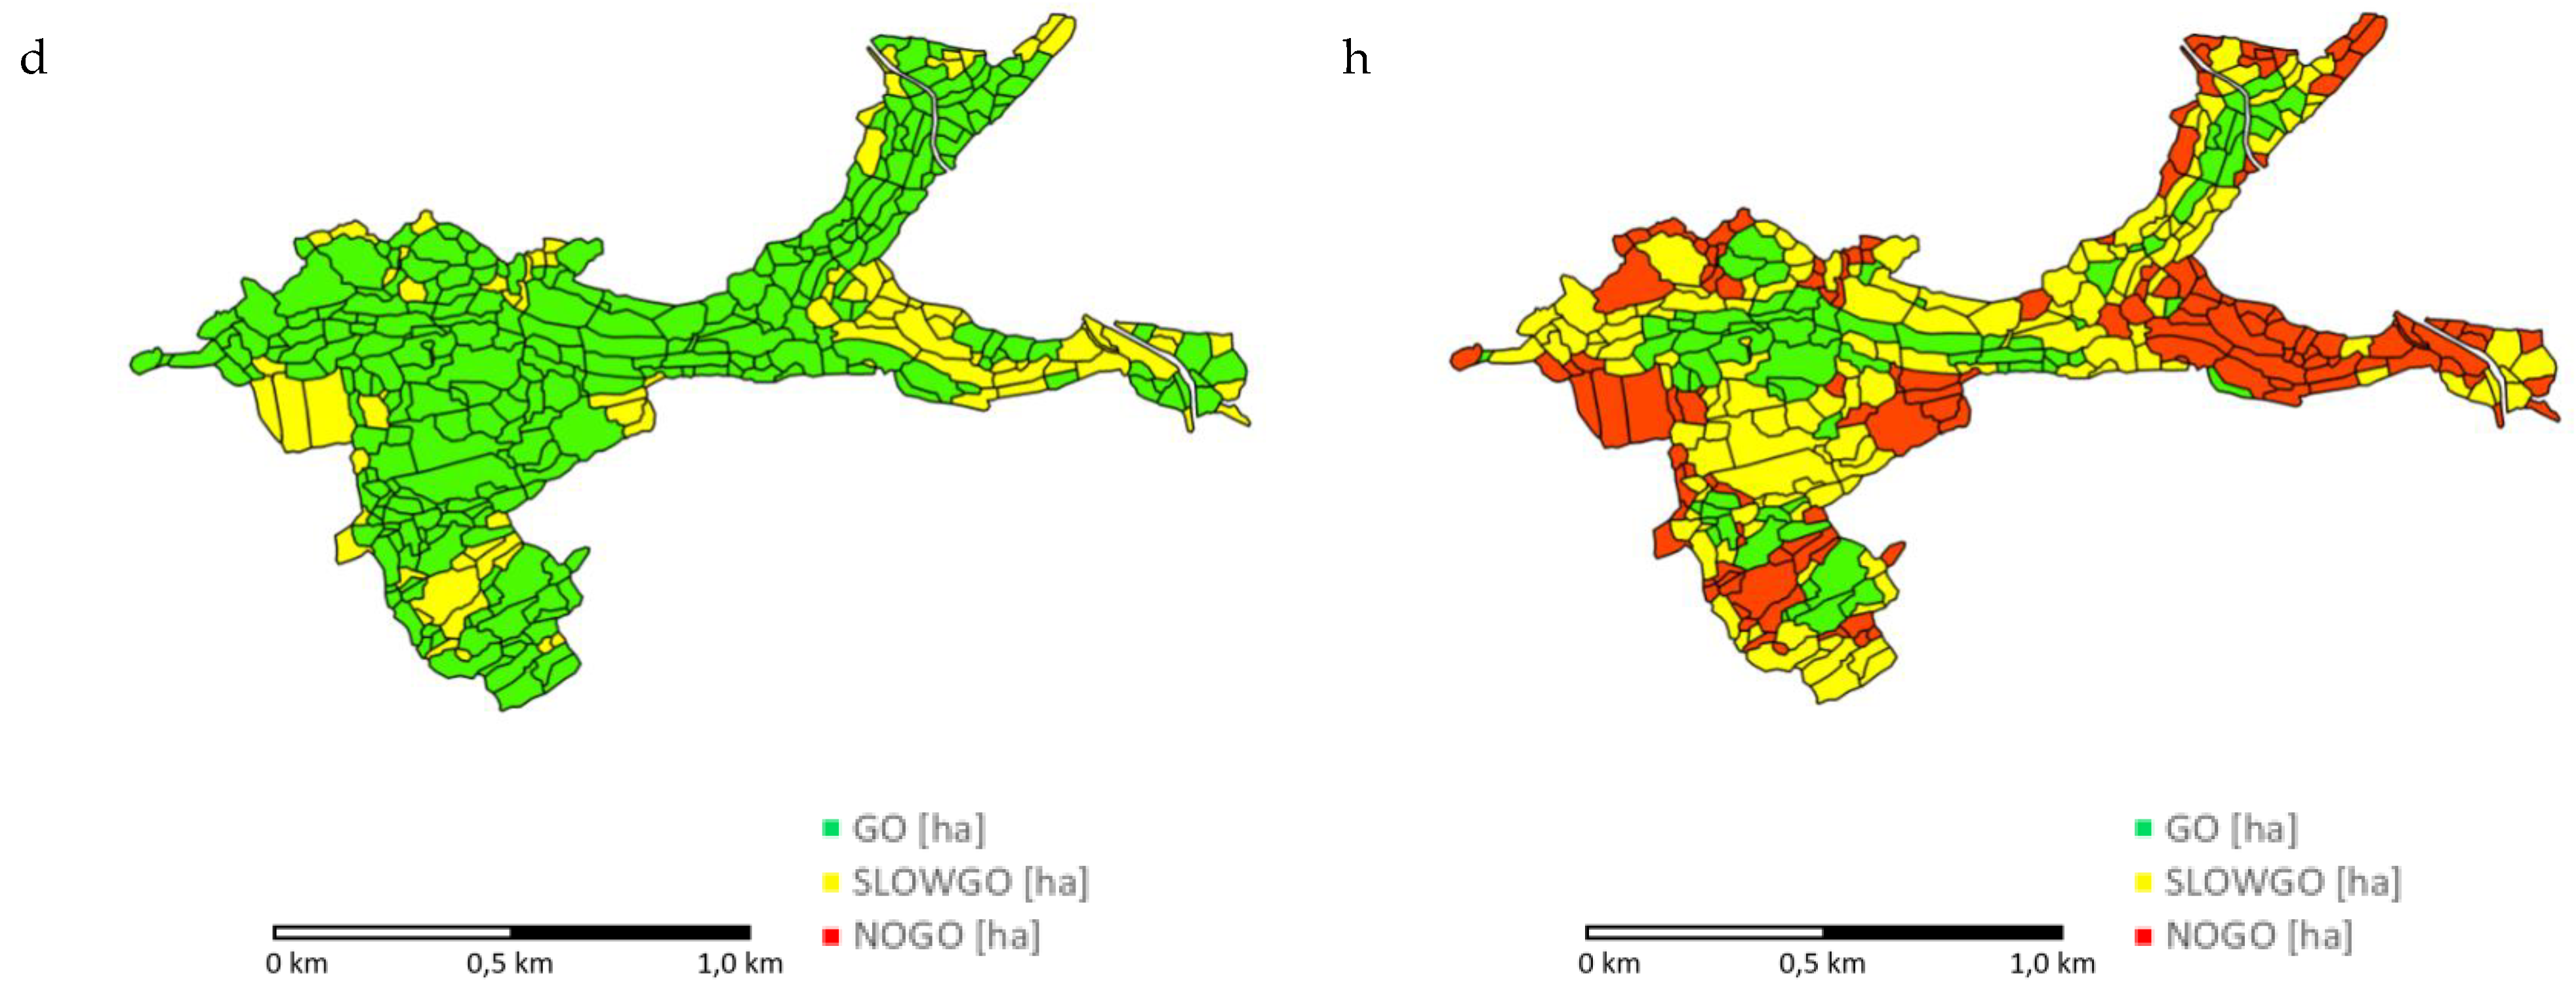
Evaluation of data quality, based on a comparison of output CCM analyses, is displayed as passable, hardly passable and impassable areas; see Figure 5 and Figure 6. Data created from the drone imagery serves as the most accurate and up-to-date model. Results indicate discrepancies in both data quality and employed processing methodology. With current results, the DSM 1G based tree data is more accurate than FEP dataset when used for passability analysis. The problem resides in a table method of calculation of number of trees per hectare. Conversion between height and NTH is approximate due to complexity of table characteristics of trees. A more accurate methodology is yet to be developed. The relation between results for different vehicles (light wheeled and armored tracked) has the same proportion for both datasets, as it is shown in Figure 5a–h and Figure 6. In general, the DSM 1G-based data analysis means that most areas are passable for a light wheeled vehicle, and half of areas are passable for armored vehicle; see Figure 6. The level of calculated passability when using FEP is significantly lower; however, tendency with different vehicles is the same.
DSM 1G sorted into 5 classes is the most suitable dataset for CCM movement analysis in the selected area. DSM 1G processed with Flow analysis to positions of trees is less reliable for larger vehicles, and passable area is bigger than in the real conditions. Data gathered from FEP has similar NOGO areas for larger vehicles as the most accurate database DSM created from orthophoto; on the other hand, it has the highest ratio of passable areas which is the worst result. Overall ranking of the tested databases according to their global usability in CCM analyses is the following:
- DSM 1G sorted into 5 classes.
- DMS 1G processed with Flow analysis to positions of trees.
- FEP database.
DSM created orthophoto is not in the ranking because this dataset was created only for comparison of quality of the tested databases. If it is included in the ranking, it would be in the last position. Even though it is the most actual and accurate database, it has very limited extent and global usage is not possible.
The following measures and recommendations need to be taken in order to improve the tested remote sensing-based datasets for CCM analyses:
- FEP database has a small coverage of data in the Czech Republic, and less than 20% of forests are included. At present, the dataset is not globally useable because some regions do not have any information about forests filled in. After the data covers majority of the Czech territory, it can serve CCM and other analyses connected with a forest evaluation.
- Regular updates of characteristics of forests in FEP database must be secured to ensure a higher level of accuracy of information.
- DSM 1G is getting outdated. Data exported from DSM 1G has to be properly processed to assure, e.g., updated heights of trees in the form of corrections to actual real values.
- A suitable methodology is a crucial part of DSM 1G processing, for the most part, conversion from height of trees to number of trees per hectare. New methods for utilization of growth tables of forests for the purpose of DSM processing should be created.
- DSM created from orthophoto is accurate and up to date, yet it’s complicated and long-winded processing limits wider usability. The process of capturing, processing and evaluating data has to be automated. Otherwise, the time and capacity consumption are overly extensive.
5. Conclusions
Passability through forests represents viable alternative to transportation on roads during crisis situations. The findings in the study show that forests similar to the studied one (Forest Bačetín) are mostly passable for majority of military vehicles. Data analyses led to selecting the suitable datasets for different occasions. Remote sensing data can be utilized in CCM analyses due to their accuracy. Obsolescence has smaller influence on CCM analyses outputs than methodology of processing of data. Difference of methodology and used data have a bigger impact on evaluation of CCM for a larger armored vehicle (BVP-2) than for a smaller terrain vehicle (LRD 110). Resulting statistics show that output attributes of forests processed from tested databases can be utilized for terrain analyses without any significant adjustments or updates. As DSM 1G becomes outdated (more than 10 years) in upcoming years, reliability of CCM analysis will be considerably worse and more adjustments will have to be done to perform such a task. The database FEP has accurate results of CCM analyses, nonetheless, its small coverage of forests in the Czech Republic prevents from global usage for terrain analyses. Based on the results obtained from testing the quality of databases in terms of their use for modeling the passability of forest units, it can be stated that it is not possible to clearly determine which method of data collection is universal. In terms of automating the evaluation of data from large areas, it appears to be the fastest method of data collection using LIDAR technology. However, this method may be less accurate compared to photogrammetric evaluation of aerial photographs. In addition, the use of different sensors on UAVs (Unmanned Aerial Vehicle) can be limited by range and weather. The use of radar methods may be the only applicable method for navigating military and other off-road vehicles in adverse weather conditions (rain, snow, smoke, etc.). It should also be noted that there are a number of limitations of this study and the applied methods. These methods were tested in temperate latitudes on selected tree types. It is easier to determine the parameters of coniferous trees than deciduous ones and the parameters of sparse stands than dense stands, such as in the case of young vegetation, or, for example, in the case of dense jungle vegetation.
Author Contributions
Conceptualization and methodology, Josef Rada and Marian Rybansky; model programming, Josef Rada; validation, Josef Rada, Marian Rybansky and Filip Dohnal; writing the paper, Josef Rada and Marian Rybansky; original draft preparing, Filip Dohnal All authors have read and agreed to the published version of the manuscript.
Funding
This research received no external funding.
Acknowledgments
This paper is a particular result of the defense research project DZRO K-210 NATURENVIR managed by the University of Defense in Brno, NATO-STO Support Project (CZE-AVT-2019) and Specific research project 2019 at the department K-210 managed by the University of Defense in Brno.
Conflicts of Interest
The authors declare no conflict of interest. The funders had no role in the design of the study; in the collection, analyses, or interpretation of data; in the writing of the manuscript, or in the decision to publish the results.
References
- Hansen, M.C.; Potapov, P.V.; Moore, R.; Hancher, M.; Turubanova, S.A.; Tyukavina, A.; Thau, D.; Stehman, S.V.; Goetz, S.J.; Loveland, T.R.; et al. High-resolution global maps of 21st-century forest cover change. Science 2013, 342, 850–853. [Google Scholar] [CrossRef] [PubMed] [Green Version]
- Ahlvin, R.B.; Haley, P.W. NATO Reference Mobility Model, 2nd ed.; NRMM II User’s Guide; TR GL-92-190; US Army Engineer Waterways Experiment Station: Vicksburg, MS, USA, 1992. [Google Scholar]
- Cibulova, K. The Mobility during Crisis Situations. Key Eng. Mater. 2017, 755, 236–241. [Google Scholar] [CrossRef]
- Dohnal, F.; Hubáček, M.; Šturcová, M.; Bureš, M.; Šimková, K. Identification of Microrelief Shapes Along the Line Objects Over DEM Data and Assessing Their Impact on the Vehicle Movement. In Proceedings of the 2017 International Conference on Military Technologies (ICMT), Brno, Czech Republic, 31 May–2 June 2017; pp. 262–267. [Google Scholar]
- Hošková-Mayerová, Š.; Talhofer, V.; Hofmann, A.; Kubíček, P. Spatial Database Quality and the Potential Uncertainty Sources. In Advanced Dynamic Modeling of Economic and Social Systems, Studies in Computational Intelligence; Springer: Berlin/Heidelberg, Germany, 2013; Volume 448, pp. 127–142. [Google Scholar] [CrossRef]
- Hubáček, M.; Kovařík, V.; Talhofer, V.; Rybanský, M.; Hofmann, A.; Břeňová, M.; Čeplová, L. Modelling of geographic and meteorological effects on vehicle movement in the open terrain. In Central Europe Area in View of Current Geography; Masarykova univerzita: Brno, Czech Republic, 2016; pp. 149–159. [Google Scholar]
- Pokonieczny, K. Automatic military passability map generation system. In Proceedings of the 2017 International Conference on Military Technologies (ICMT), Brno, Czech Republic, 31 May–2 June 2017; pp. 285–292. [Google Scholar]
- Rybanský, M. Modelling of the Geographical Factors Influence on the Cross-Country Movement (in Czech). Habilitation’s Thesis, VA Brno, Brno, Czech Republic, 2002; p. 477. [Google Scholar]
- Rybanský, M. Effect of the Geographic Factors on the Cross Country Movement during Military Operations and the Natural Disasters. In International Conference on Military Technologies 2007; University of Defence: Brno, Czech Republic, 2007; pp. 590–596. ISBN 978-80-7231-238-2. [Google Scholar]
- Rybanský, M. The Cross—Country Movement—The Impact and Evaluation of Geographic Factors; CERM: Brno, Czech Republic, 2009; p. 113. ISBN 978-80-7204-661-4. [Google Scholar]
- Rybanský, M. Modelling of the optimal vehicle route in terrain in emergency situations using GIS data. In 8th International Symposium of the Digital Earth (ISDE8) 2013; IOP Conf. Series; Earth Environmental Science 18 012071: Kuching, Malaysia, 2014. [Google Scholar] [CrossRef] [Green Version]
- Shoop, S.A.; Richmond, P.W.; Lacombe, J. Overview of cold regions mobility modeling at CRREL. J. Terramechanics 2016, 43, 1–26. [Google Scholar] [CrossRef]
- STANAG 3992-AGeoP-1 Terrain Analyses, Field Manual No. 5-33; Headquarters Department of the Army: Washington, DC, USA, 1990.
- Stodola, P.; Mazal, J. Optimal Location and Motion of Autonomous Unmanned Ground Vehicles. WSEAS Trans. Signal Process. 2010, 6, 68–77. [Google Scholar]
- Taheri, S.; Sandu, C.; Taheri, E.P.; Pinto, E.; Gorisch, D. A technical survey on Terramechanics models for tire–terrain interaction used in modeling and simulation of wheeled vehicles. J. Terramechanics 2015, 57, 1–22. [Google Scholar] [CrossRef]
- Hyyppä, J.; Hyyppä, H.; Litkey, P.; Yu, X.; Haggrén, H.; Rönnholm, P.; Pyysalo, U.; Pitkänen, J.; Maltamo, M. Algorithms and methods of airborn laser scanning for forest measurement. Int. Arch. Photogramm. Remote Sens. 2004, 36, 82–89. [Google Scholar]
- Blair, J.; Rabine, D.L.; Hofton, M.A. The Laser Vegetation Imaging Sensor: A medium-altitude, digitisation-only, airborne laser altimeter for mapping vegetation and topography. ISPRS J. Photogramm. Remote Sens. 1999, 54, 115–122. [Google Scholar] [CrossRef]
- Lim, K.; Treitz, P.; Wulder, M.; St-Onge, B.; Flood, M. LiDAR remote sensing of forest structure. Prog. Phys. Geogr. Earth Environ. 2003, 27, 88–106. [Google Scholar] [CrossRef] [Green Version]
- Heurich, M.; Persson, A.; Holmgren, J.; Kennel, E. Detecting and measuring individual trees with laser scanning in mixed mountain forest of central Europe using an algorithm developed for Swedish boreal forest conditions. Int. Arch. Photogramm. Remote Sens. Spat. Inf. Sci. 2004, 36 (Pt 8), W2. [Google Scholar]
- Aschoff, T.; Spiecker, H. Algorithms for the automatic detection of trees in lasser scanner data. Int. Arch. Photogramm. Remote Sens. 2004, 36, 71–75. [Google Scholar]
- Gobakken, T.; Næsset, E. Effects of forest growth on laser derived canopy metrics. Int. Arch. Photogramm. Remote Sens. 2004, 36, 224–227. [Google Scholar]
- Carson, W.W.; Andersen, H.E.; Reutebuch, S.E.; McGaughey, R.J. Lidar Applications in Forestry—An Overview. In Proceedings of the ASPRS Annual Conference, Denver, CO, USA, 23–28 May 2004. [Google Scholar]
- Ahlberg, S.; Söderman, U.; Tolt, G. High Resolution Environment Models from Sensor Data 2006. In Proceedings of the Defence Imagery Exploitation 2006, London, UK, 17–18 October 2006. [Google Scholar]
- Vauhkonen, J. Estimating Single-Tree Attributes by Airborne Laser Scanning: Methods Based on Computational Geometry of the 3-D Point Data. Ph.D. Thesis, Finnish Society of Forest Science, University of Helsinky, Helsinky, Finland, 2010. [Google Scholar]
- Mikita, T.; Klimánek, M.; Cibulka, M. Evaluation of airborne laser scanning data for tree parameters and terrain modelling in forest environment. In Acta Universitatis Agriculturae et Silviculturae Mendelianae Brunensis; Mendel University Press: Brno, Czech Republic, 2013; pp. 1339–1347. [Google Scholar]
- Rybansky, M.; Břeňová, M.; Čermák, J.; Van Genderen, J.; Sivertun, A. Vegetation structure determination using LIDAR data and the forest growth parameters. In 8th IGRSM International Conference and Exhibition on Geospatial and Remote Sensing, IGRSM 2016. Kuala Lumpur, Malaysia: IOP PUBLISHING LTD, DIRAC HOUSE, TEMPLE BACK, BRISTOL BS1 6BE, ENGLAND; IOP Publishing: Bristol, UK, 2016. [Google Scholar]
- Su, Y.; Guo, Q.; Fry, D.L.; Collins, B.M.; Kelly, M.; Flanagan, J.P.; Battles, J.J. A Vegetation Mapping Strategy for Conifer Forests by Combining Airborne LiDAR Data and Aerial Imagery. Can. J. Remote Sens. 2015, 42, 1–15. [Google Scholar] [CrossRef] [Green Version]
- Martone, M.; Rizzoli, P.; Wecklich, C.; González, C.; Bueso-Bello, J.-L.; Valdo, P.; Schulze, D.; Zink, M.; Krieger, G.; Moreira, A. The global forest/non-forest map from TanDEM-X interferometric SAR data. Remote Sens. Environ. 2018, 205, 352–373. [Google Scholar] [CrossRef]
- Kugler, F.; Schulze, D.; Hajnsek, I.; Pretzsch, H.; Papathanassiou, K.P. TanDEM-X Pol-InSAR Performance for Forest Height Estimation. IEEE Trans. Geosci. Remote Sens. 2014, 52, 6404–6422. [Google Scholar] [CrossRef]
- Cazcarra-Bes, V.; Tello-Alonso, M.; Fischer, R.; Heym, M.; Papathanassiou, K.P. Monitoring of Forest Structure Dynamics by Means of L-Band SAR Tomography. Remote Sens. 2017, 9, 1229. [Google Scholar] [CrossRef] [Green Version]
- Gitas, I.Z.; Polychronaki, A.; Katagis, T.; Mallinis, G. Contribution of remote sensing to disaster management activities: A case study of the large fires in the Peloponnese, Greece. Int. J. Remote Sens. 2008, 29, 1847–1853. [Google Scholar] [CrossRef]
- Ambrosia, V.G. UAS Remote Sensing Platforms for Emergency Response and Management. Northern California Region—American Society of Photogrammetry and Remote Sensing (ASPRS), Technical Session: Remote Sensing of Fire and Ecosystem Impacts; ASPRS: Sacramento, CA, USA, 2012. [Google Scholar]
- Ambrosia, V.; Zajkowski, T. Selection of Appropriate Class UAS/Sensors to Support Fire Monitoring, Real-Life Experiences in the US, Handbook of Unmanned Aerial Vehicles; Valavanis, K.P., Vachtsevanos, G.J., Eds.; Springer: New York, NY, USA, 2014; ISBN 978-9048197064. [Google Scholar]
- Simon, J.; Kadavý, J.; Macků, J. Forest Management (in Czech); Script; Mendel University in Brno: Brno, Czech Republic, 1998. [Google Scholar]
- Vala, M.; Rybanský, M. Influence of Relief on the Cross-Country Movement by the Selected Military Vehicles; VA Brno: Brno, Czech Republic, 2001; p. 84. [Google Scholar]
- Forest Economic Adjusting. Forest Management Institute Brandýs and Labem. Available online: http://geoportal.uhul.cz/mapy/mapylho.html (accessed on 24 June 2020).
- Digital Elevation Model of the Czech Republic of the 5th Generation (DMR5G) ČÚZK. Available online: https://geoportal.cuzk.cz/(S(xg531xtrv3wnozbfp2hdiitu))/Default.aspx?mode=TextMeta&side=vyskopis&metadataID=CZ-CUZKDMR5GV&head_tab=sekce02-gp&menu=302 (accessed on 8 August 2020).
- Digital Surface Model of the Czech Republic of the 1st Generation (DMP1G) ČÚZK. Available online: https://geoportal.cuzk.cz/(S(xg531xtrv3wnozbfp2hdiitu))/ (accessed on 8 August 2020).
- Forest Economic Plan. ÚHÚL. Available online: http://geoportal.uhul.cz/mapy/mapylho.html (accessed on 16 September 2020).
- Plowright, A.; Tortini, R.; Coops, N. Determining Optimal Video Length for the Estimation of Building Height through Radial Displacement Measurement from Space. ISPRS Int. J. Geo-Inf. 2018, 7, 380. [Google Scholar] [CrossRef] [Green Version]
- Planimetric components/ZABAGED®-Fundamental Base of Geographic Data. ČUZK. Available online: https://geoportal.cuzk.cz/(S(xg531xtrv3wnozbfp2hdiitu))/Default.aspx?mode=TextMeta&text=dSady_zabaged&side=zabaged&menu=24 (accessed on 8 August 2020).
- Čeplová, L. Modelling of Influence of Terrain and Vegetation on Movement of Military Vehicles. Ph.D. Thesis, University of Defence Brno, Brno, Czech Republic, 2017. [Google Scholar]
- DJI. DJI Phantom 3 Advanced, Quick Start Guide [online]. Dà-Jiāng Innovations. Available online: https://dl.djicdn.com/downloads/phantom_3/en/Phantom_3_Advanced_Quick_Start_Guide_V1.2.pdf (accessed on 18 August 2020).
- Cibulka, M. Accuracy of digital elevation models derived from aerial laser scanning data in forest stands (in Czech) Brno. Disertation Thesis, Mendel University in Brno, Brno, Czech Republic, 2011. [Google Scholar]
- Černý, M.; Pařez, J.; Malík, Z. Growth and Taxation Tables of the Main Tree Species in the Czech Republic (Spruce, Pine, Beech)—In Czech; IFER–Institute of Forest Ecosystems Research: Jílové u Prahy, Czech Republic, 1996; p. 245. [Google Scholar]
- Čeplová, L.; Břeňová, M.; Hubáček, M.; Zerzán, P.; Mikita, T. Analysis of Vehicle Movement Possibilities in Terrain Covered by Vegetation. In ICMT2015 International Conference on Military Technologies 2015; University of Defence, Faculty of Military Technology: Brno, Czech Republic, 2015; pp. 301–305. ISBN 978-80-7231-976-3. [Google Scholar]
- Goodbody, T.R.H.; Coops, N.; Marshall, P.; Tompalski, P.; Crawford, P. Unmanned aerial systems for precision forest inventory purposes: A review and case study. For. Chron. 2017, 93, 71–81. [Google Scholar] [CrossRef] [Green Version]
- Mulverhill, C.; Coops, N.C.; Tompalski, P.; Bater, C.W.; Dick, A.R. The utility of terrestrial photogrammetry for assessment of tree volume and taper in boreal mixedwood forests. Ann. For. Sci. 2019, 76. [Google Scholar] [CrossRef] [Green Version]
- Point Cloud Technology. Available online: https://demo.pointcloudtechnology.com/TreeDetection/ (accessed on 19 October 2020).
Figure 1.
Methodological steps of processing selected databases and preparing them for cross-country mobility (CCM) analysis.
Figure 1.
Methodological steps of processing selected databases and preparing them for cross-country mobility (CCM) analysis.

Figure 2.
Processing of Digital Surface Model (DSM) based data in the Forest Bačetín with ArcGIS tools Flow analysis, processed and highlighted treetops (green)—the direct method to identify individual trees. Displayed area 600 × 500 m.
Figure 2.
Processing of Digital Surface Model (DSM) based data in the Forest Bačetín with ArcGIS tools Flow analysis, processed and highlighted treetops (green)—the direct method to identify individual trees. Displayed area 600 × 500 m.

Figure 3.
The relation between a particular tree spacing, diameter at breast height (DBH), and a riding corridor.
Figure 3.
The relation between a particular tree spacing, diameter at breast height (DBH), and a riding corridor.
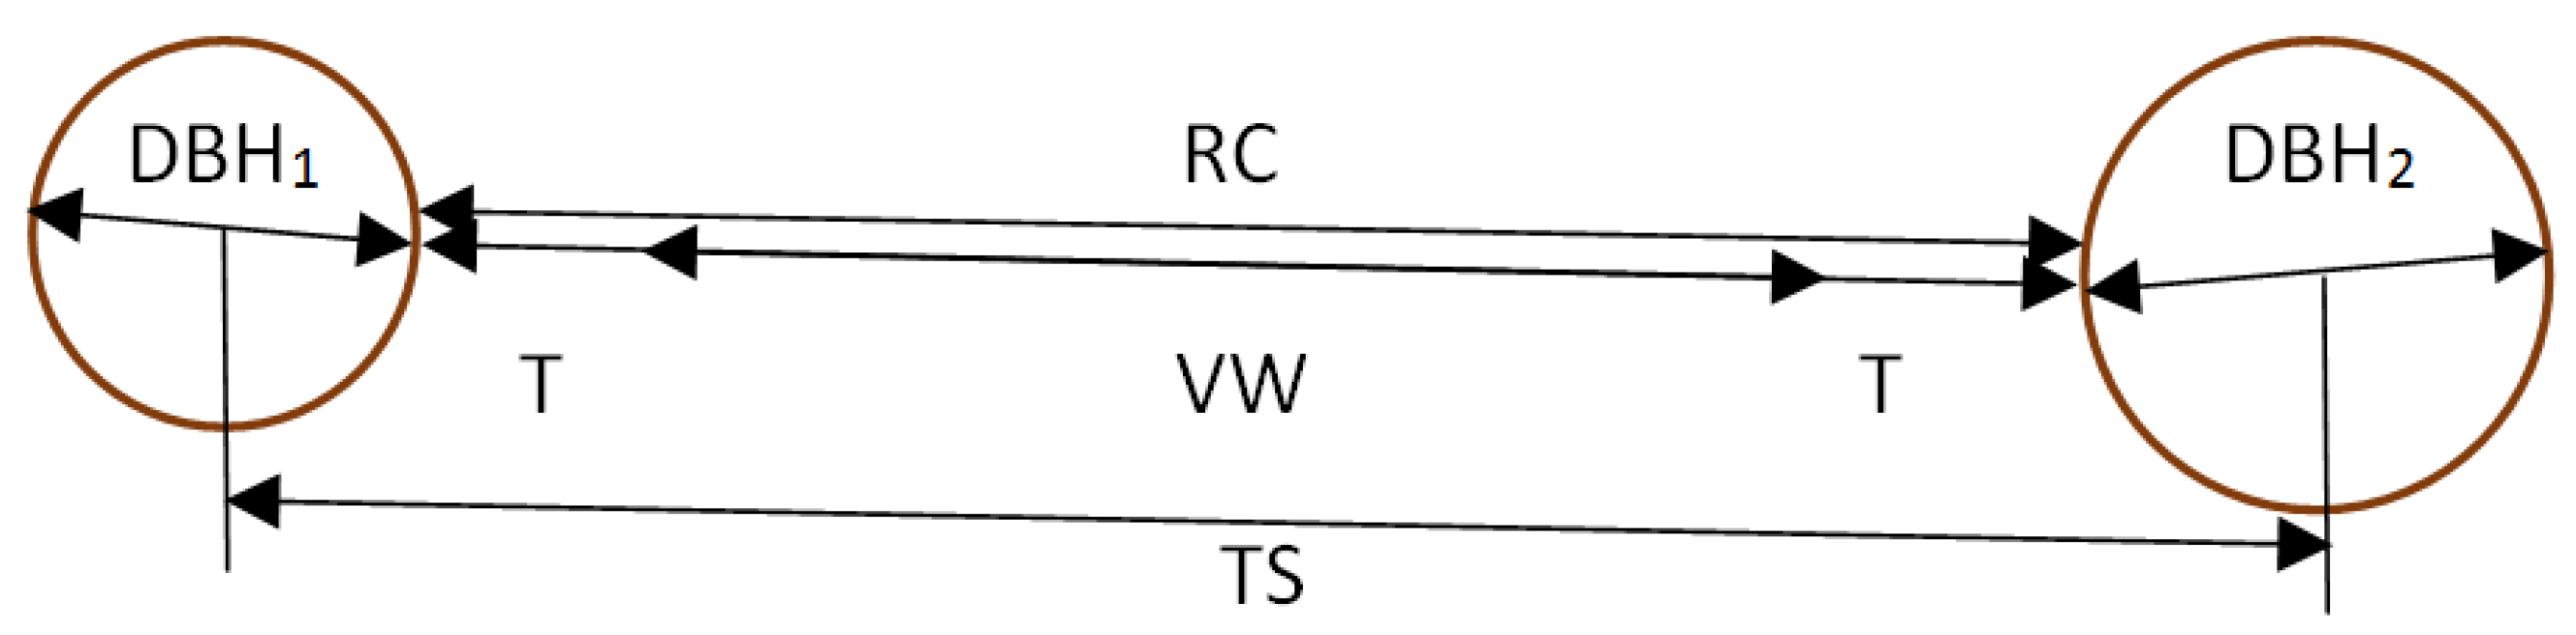
Figure 4.
(a). The comparison of different raster of heights of the selected Forest Bačetín. A raster created from DSM 1G shows more detailed structure of the forest represented for example by blank spots across the picture. (b) A raster based on DSM created from orthophoto is smoother; however, because of generalization of surface, it does not include detailed missing values of heights in data. Same region displayed in both pictures; it has size of 200 × 200 m.
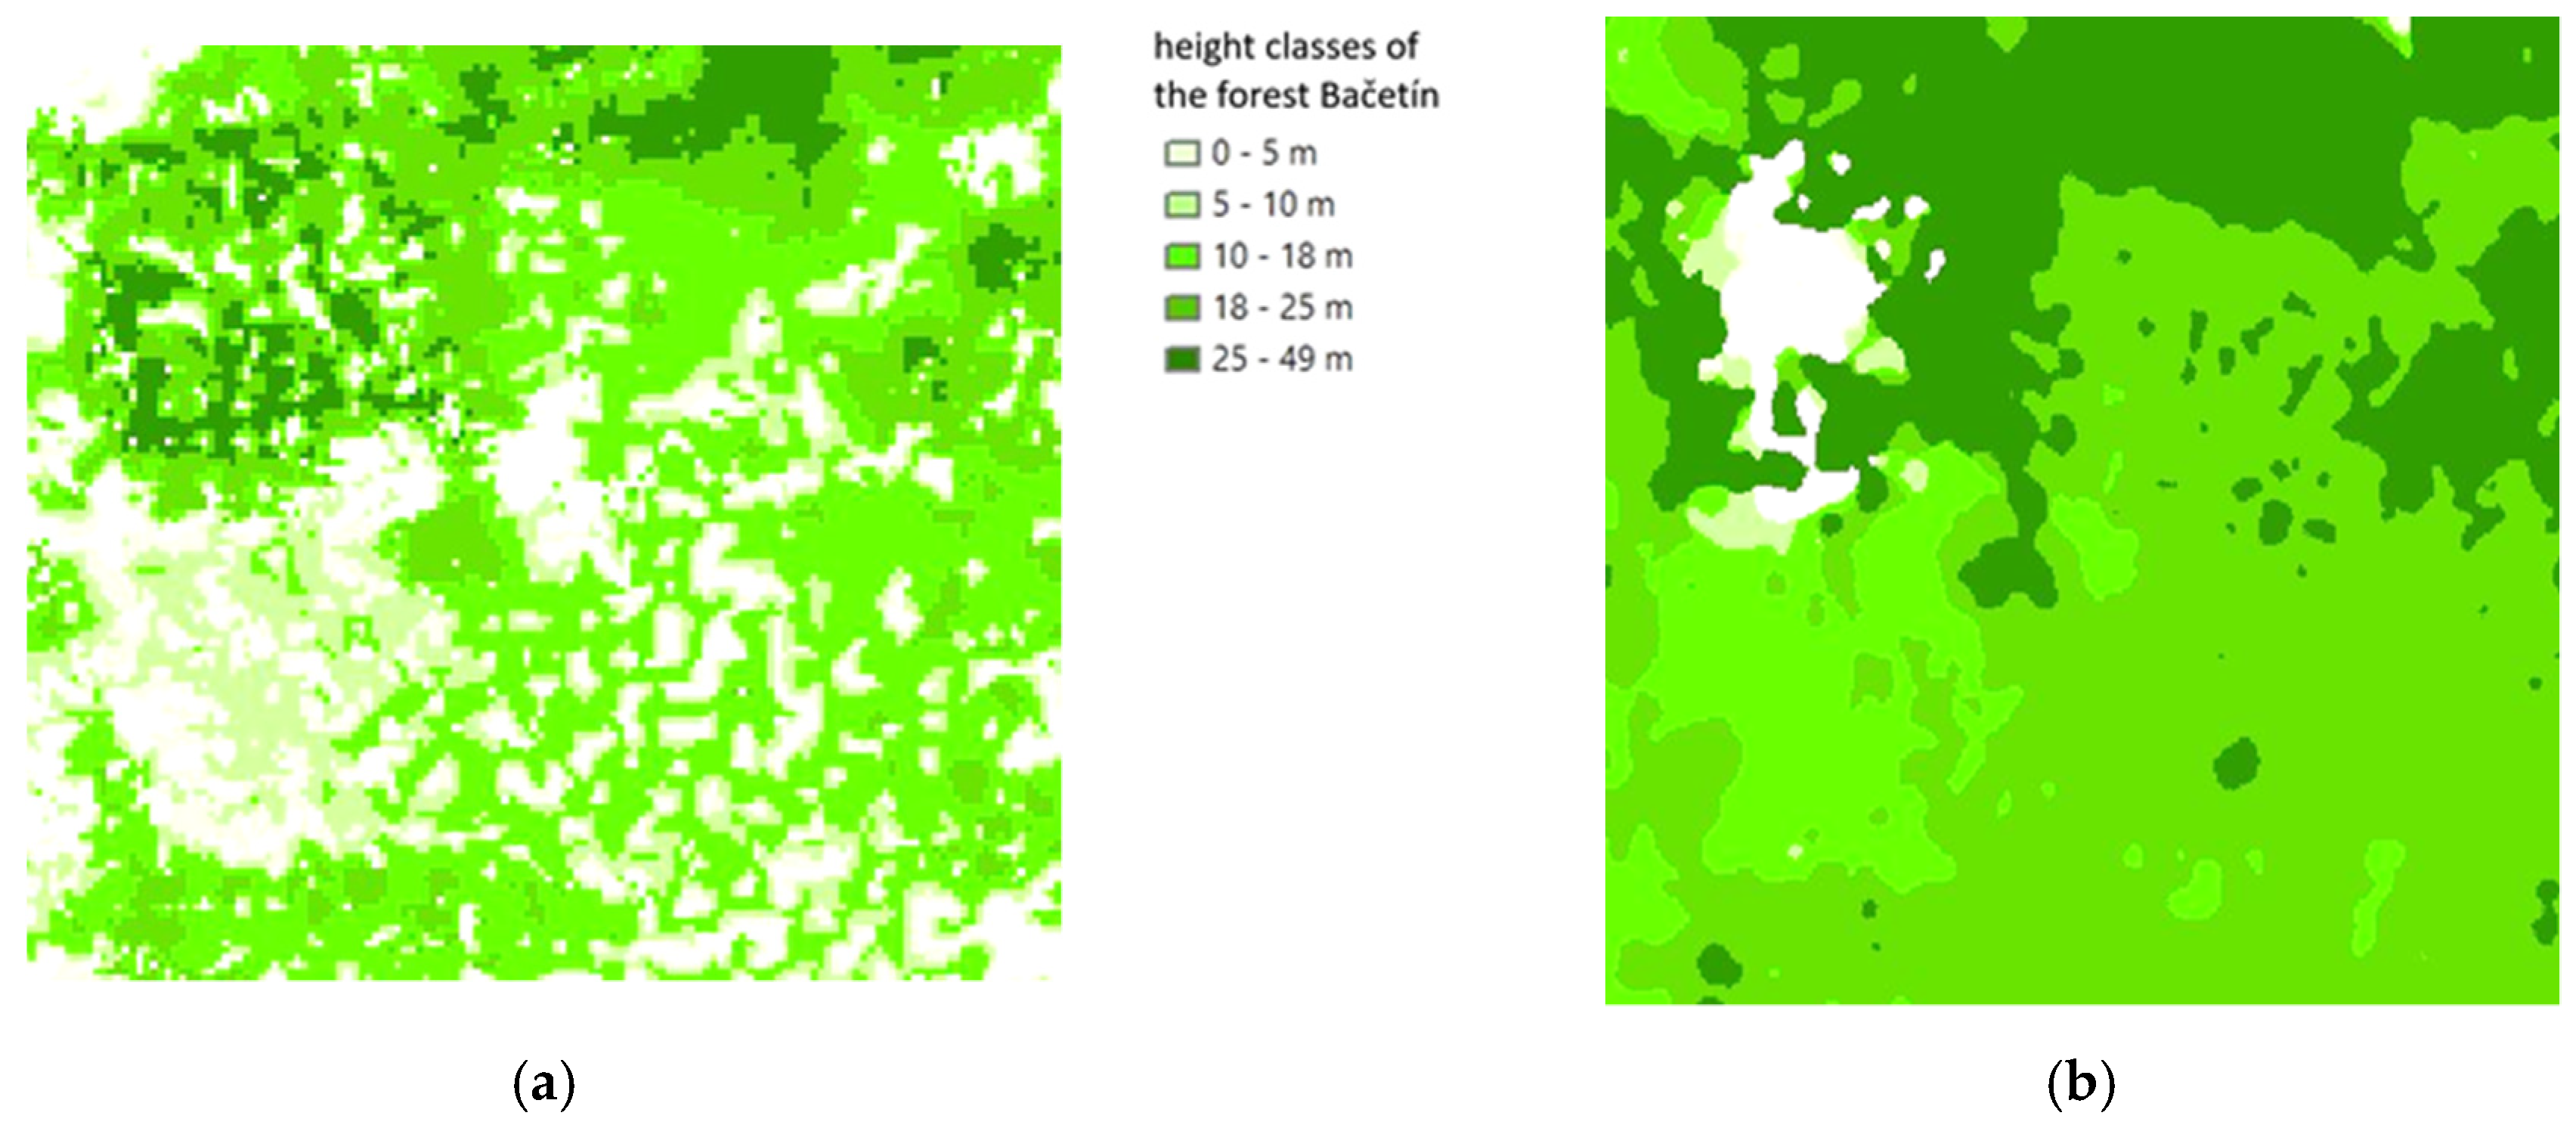
Figure 5.
The map of passability through the selected Forest Bačetín for a light wheeled vehicle (left) and armored tracked vehicle (right), data Forest Economic Plan FEP-based (upper), DSM 1G tree positions (middle), orthophoto DMS-based data (lower); green—GO, orange—SLOW GO, red—NO GO areas: (a) for a light wheeled vehicle LRD 110, data FEP, (b) for a light wheeled vehicle LRD 110, data DSM 1G—trees, (c) for a light wheeled vehicle LRD 110, data DSM 1G—sorted (5 classes), (d) for a light wheeled vehicle LRD 110, data DSM from orthophoto, (e) for an armored tracked vehicle BVP-2, data FEP, (f) for an armored tracked vehicle BVP-2, data DSM 1G—trees, (g) for an armored tracked vehicle BVP-2, data DSM 1G—sorted (5 classes), (h) for an armored tracked vehicle BVP-2, data DSM from orthophoto.
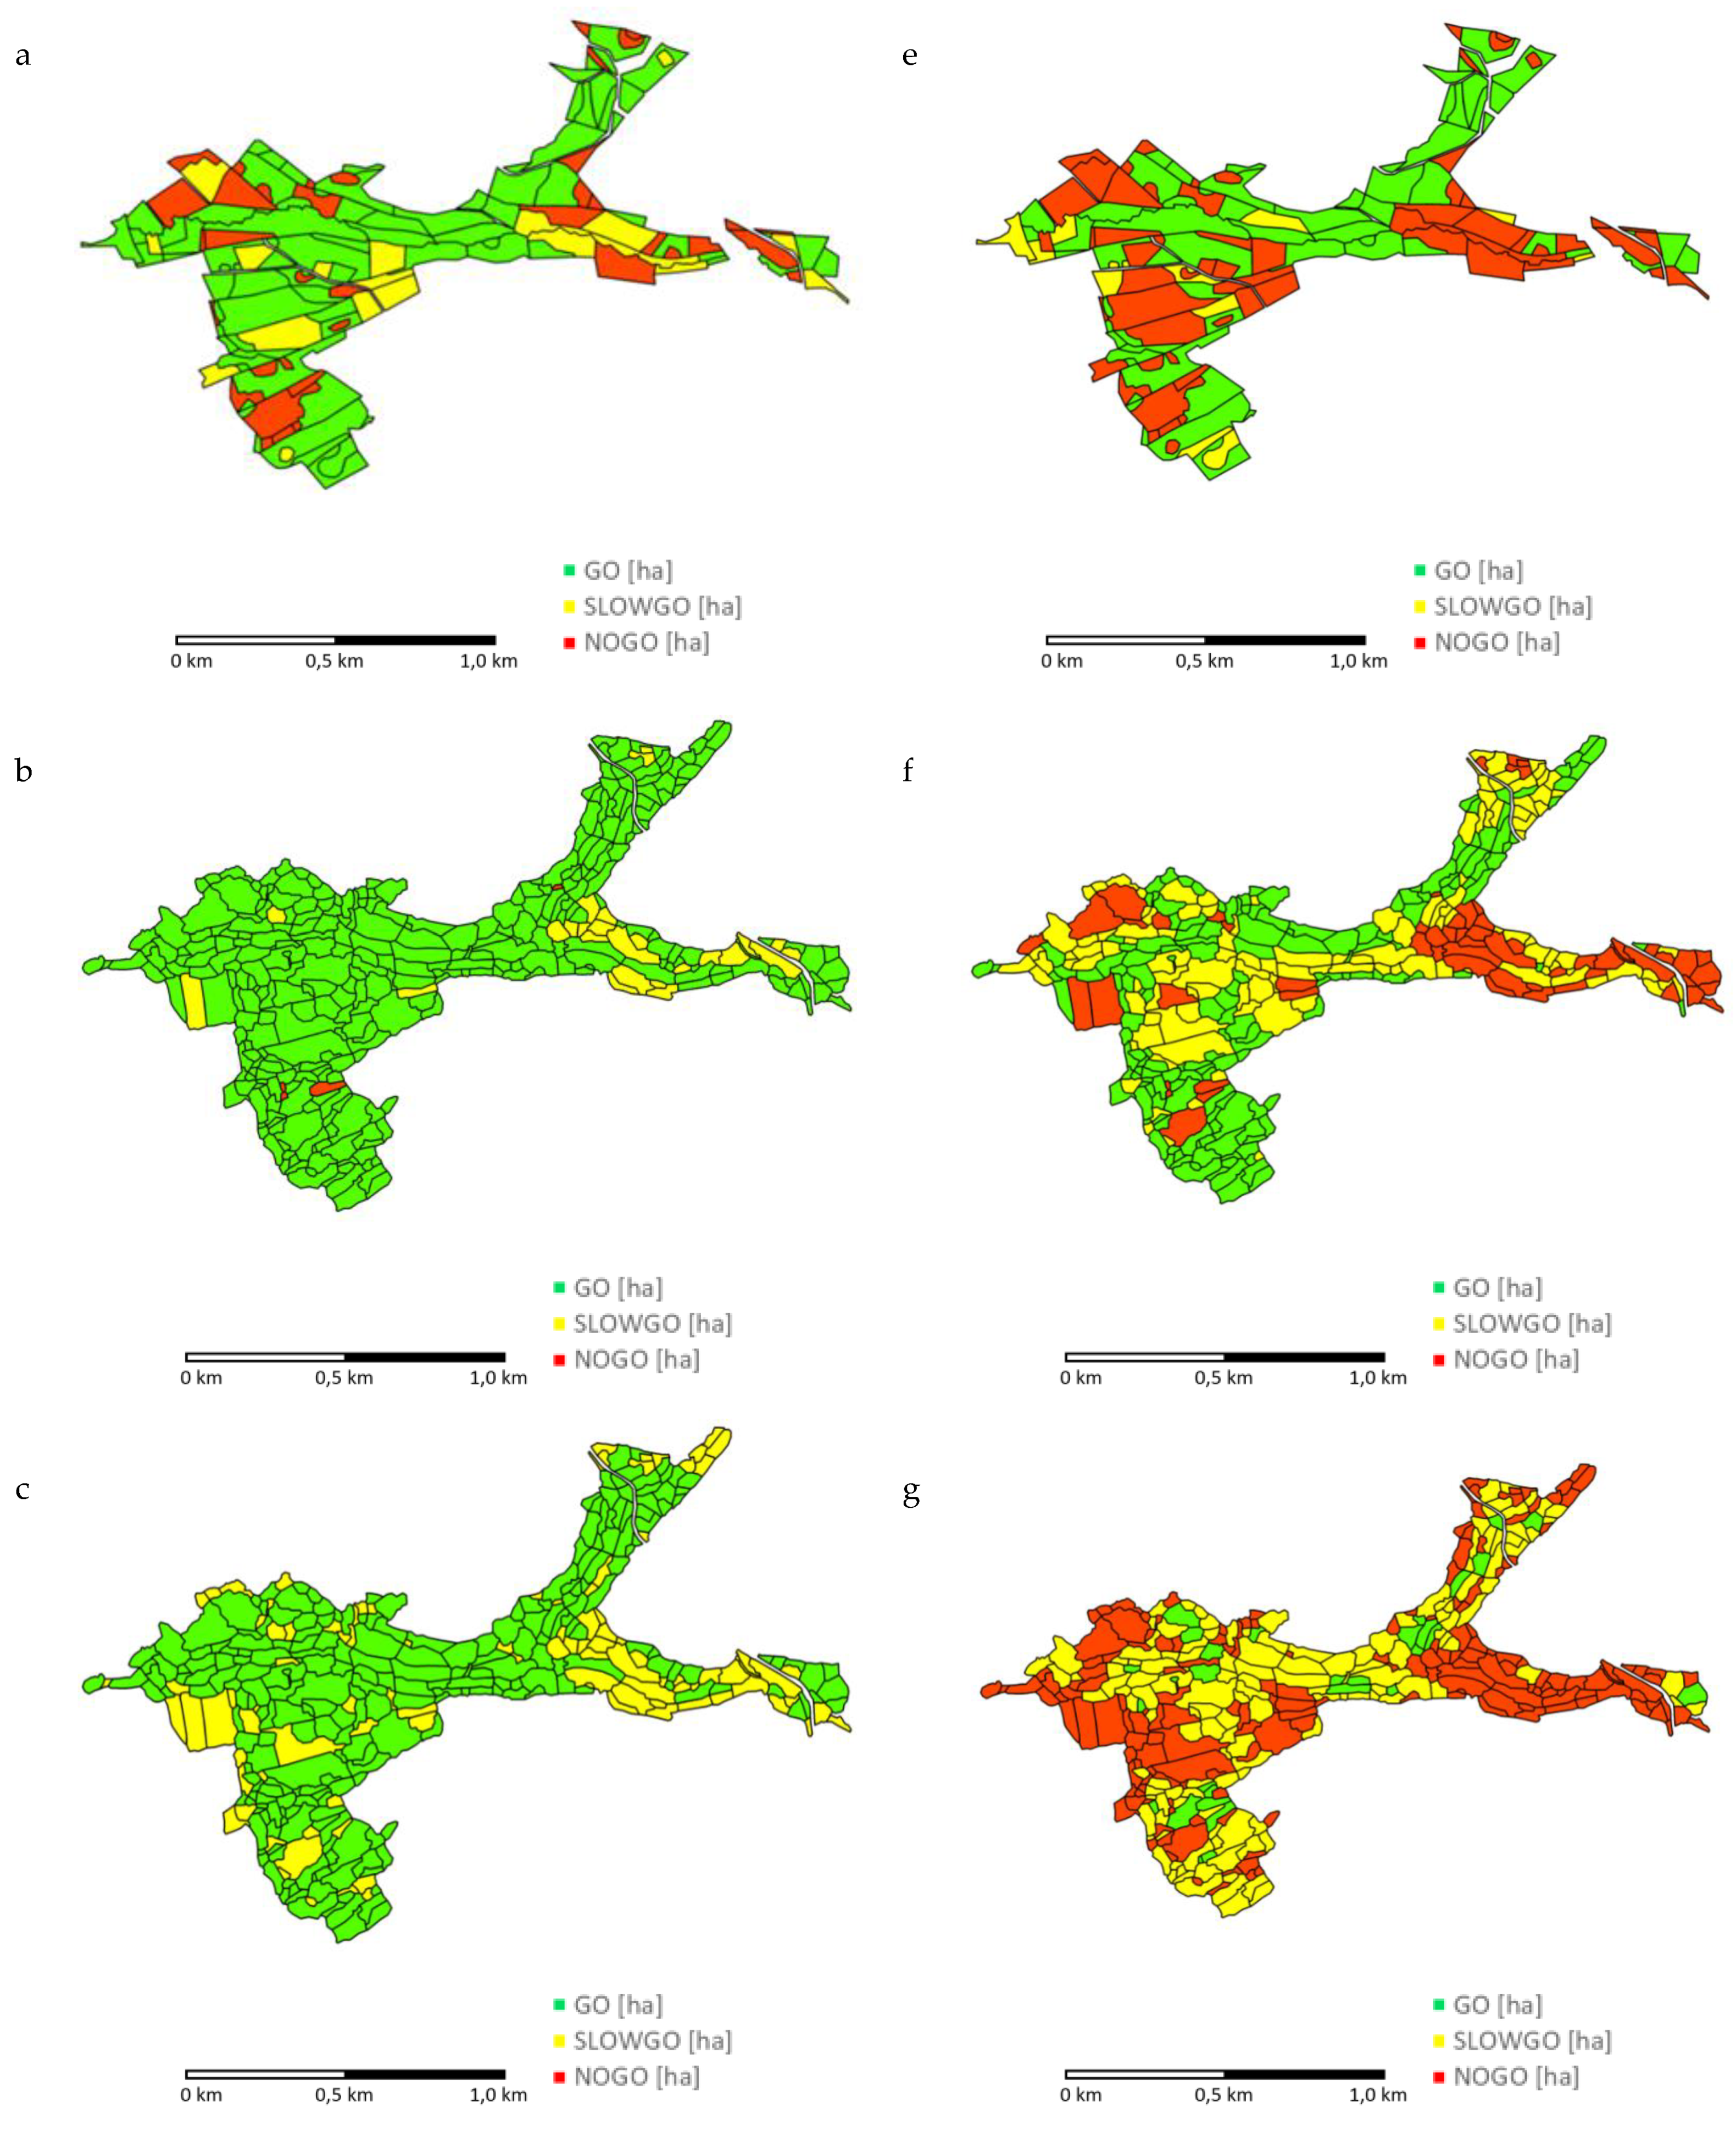

Figure 6.
The ratio of passability of the selected Forest Bačetín for a light wheeled vehicle Land Rover Defender 110 (LRD 110) and armored tracked vehicle BVP-2; CCM analysis processed with data FEP, DSM 1G tree positions, and orthophoto DSM based data.
Figure 6.
The ratio of passability of the selected Forest Bačetín for a light wheeled vehicle Land Rover Defender 110 (LRD 110) and armored tracked vehicle BVP-2; CCM analysis processed with data FEP, DSM 1G tree positions, and orthophoto DSM based data.

Table 1.
The sort of trees and their number occurring in the tested areas; first number is from the Bačetín locality; second number is from the locality Dolní Cerekev [36].
Table 1.
The sort of trees and their number occurring in the tested areas; first number is from the Bačetín locality; second number is from the locality Dolní Cerekev [36].
| Sort of Tree | Number of Trees Bačetín | Number of Trees Dolní Cerekev | Ratio in % Bačetín | Ratio in % Dolní Cerekev |
|---|---|---|---|---|
| beech | 1424 | 1220 | 3.63 | 2.02 |
| pine | 1508 | 5405 | 3.84 | 8.94 |
| birch | 1583 | 2112 | 4.03 | 3.49 |
| oak | 1061 | 954 | 2.7 | 1.58 |
| hornbeam | 788 | 302 | 2.01 | 0.50 |
| fir | 190 | 459 | 0.48 | 0.76 |
| ash | 257 | 138 | 0.65 | 0.23 |
| maple | 2417 | 1596 | 6.16 | 2.64 |
| larch | 1350 | 926 | 3.44 | 1.53 |
| alder | 1040 | 1490 | 2.65 | 2.46 |
| poplar | 82 | 0 | 0.21 | 0.00 |
| spruce | 27,564 | 45,851 | 70.2 | 75.85 |
| broadleaved trees | 8652 | 7812 | 22.04 | 12.92 |
| coniferous trees | 30,612 | 52,641 | 77.96 | 87.08 |
| total number of trees | 39,264 | 60,453 | ||
Table 2.
Characteristics of 20-year-old and 60-year-old forest for 3-m variance of height of the forest (heights per age in parentheses). The prevailing age of trees in the studied areas is used from a growth table from Cerny, 1996 [46].
Table 2.
Characteristics of 20-year-old and 60-year-old forest for 3-m variance of height of the forest (heights per age in parentheses). The prevailing age of trees in the studied areas is used from a growth table from Cerny, 1996 [46].
| Age of Forest | 20-Year-Old Forest | 60-Year-Old Forest | ||
|---|---|---|---|---|
| Characteristic | Number of Trees Per Ha | MTS (m) | Number of Trees Per Ha | MTS (m) |
| Min. height of forest (9/22 m) | 2800 | 1.90 | 900 | 3.5 |
| Max. height of forest (12/25 m) | 2300 | 2.15 | 750 | 3.9 |
| Variance | 500 | 0.25 | 150 | 0.4 |
Table 3.
Characteristics of the Forest Bačetín representing each tested database.
| Data | Number of Trees | Trees Per Hectare | Mean Height (m) | Mean Diameter (cm) | Mean Tree Spacing (m) |
|---|---|---|---|---|---|
| FEP | 39,231 | 1109 | 17.91 | 21.1 | 3.99 |
| DSM 1G sorted | 48,631 | 1196 | 19.44 | 19.9 | 3.30 |
| DSM 1G unsorted | 60,207 | 1481 | 16.44 | 16.4 | 2.91 |
| DSM 1G trees positions | 33,963 | 835 | 21.34 | 21.9 | 4.01 |
| DSM from orthophoto | 46,010 | 1132 | 20.22 | 21.1 | 3.44 |
Publisher’s Note: MDPI stays neutral with regard to jurisdictional claims in published maps and institutional affiliations. |
© 2020 by the authors. Licensee MDPI, Basel, Switzerland. This article is an open access article distributed under the terms and conditions of the Creative Commons Attribution (CC BY) license (http://creativecommons.org/licenses/by/4.0/).
Share and Cite
MDPI and ACS Style
Rada, J.; Rybansky, M.; Dohnal, F. Influence of Quality of Remote Sensing Data on Vegetation Passability by Terrain Vehicles. ISPRS Int. J. Geo-Inf. 2020, 9, 684. https://0-doi-org.brum.beds.ac.uk/10.3390/ijgi9110684
AMA Style
Rada J, Rybansky M, Dohnal F. Influence of Quality of Remote Sensing Data on Vegetation Passability by Terrain Vehicles. ISPRS International Journal of Geo-Information. 2020; 9(11):684. https://0-doi-org.brum.beds.ac.uk/10.3390/ijgi9110684
Chicago/Turabian StyleRada, Josef, Marian Rybansky, and Filip Dohnal. 2020. "Influence of Quality of Remote Sensing Data on Vegetation Passability by Terrain Vehicles" ISPRS International Journal of Geo-Information 9, no. 11: 684. https://0-doi-org.brum.beds.ac.uk/10.3390/ijgi9110684
Note that from the first issue of 2016, this journal uses article numbers instead of page numbers. See further details here.