Article

Generalization of Soundings across Scales: From DTM to Harbour and Approach Nautical Charts

1
Cartography Laboratory, School of Rural and Surveying Engineering, National Technical University of Athens, 15780 Zografou, Greece
2
National Ocean Service, NOAA Office of Coast Survey, Silver Spring, MD 20910, USA
*
Author to whom correspondence should be addressed.
ISPRS Int. J. Geo-Inf. 2020, 9(11), 693; https://0-doi-org.brum.beds.ac.uk/10.3390/ijgi9110693
Submission received: 17 October 2020 / Revised: 12 November 2020 / Accepted: 14 November 2020 / Published: 20 November 2020

Abstract

:
This paper presents an integrated digital methodology for the generalization of soundings. The input for the sounding generalization procedure is a high resolution Digital Terrain Model (DTM) and the output is a sounding data set appropriate for portrayal on harbour and approach Electronic Navigational Charts (ENCs). The sounding generalization procedure follows the “ladder approach” that is a requisite for the portrayal of soundings on nautical charts, i.e., any sounding portrayed on a smaller scale chart should also be depicted on larger scale charts. A rhomboidal fishnet is used as a supportive reference structure based on the cartographic guidance for soundings to display a rhombus pattern on nautical charts. The rhomboidal fishnet cell size is defined by the depth range and the compilation scale of the charted area. Generalization is based on a number of rules and constraints extracted from International Hydrographic Organization (IHO) standards, hydrographic offices’ best practices and the cartographic literature. The sounding generalization procedure can be implemented using basic geoprocessing functions available in the most commonly used Geographic Information System (GIS) environments. A case study was performed in the New York Lower Bay area based on a high resolution National Oceanic and Atmospheric Administration (NOAA) DTM. The method successfully produced generalized soundings for a number of Harbour and Approach nautical charts at 10 K, 20 K, 40 K and 80 K scales.

Graphical Abstract

1. Introduction

Electronic navigational charts (ENCs) are vector charts with a standardized content, structure and format, which support safe navigation to vessels through the portrayal of depth contours, soundings, coastline, dangers and other symbols [1]. ENCs are intended for use in an electronic chart display and information system (ECDIS), which is a geographic information display system, used for nautical navigation and can also interface with other navigation systems, such as GPS, RADAR, and echosounders [2]. The ECDIS itself is limited to displaying no more than six different scale charts, one for each of the six ENC scale bands. The division between the ECDIS scale bands is based on the intended navigational use: harbour, berthing, approach, coastal, general and overview [3]. As a result, ENCs are compiled in a wide range of scales from large scales (e.g., 1:5 K), medium scales (e.g., 1:160 K), and small scales (e.g., 1:2000 K) serving the above-mentioned navigational uses. According to the practices adopted by national hydrographic organizations, cartographic generalization is performed on large-scale sources in order to produce smaller scale nautical charts with consistent topology for all charted features. Nautical chart reliability is of paramount importance for safe navigation, and generalization is a critical stage in the chart compilation process. Automation of such a complicated process is still a significant research issue [3,4,5,6,7,8,9,10,11,12,13,14,15,16,17,18]. Many of these processes were based on source data collected using single-beam echosounders or legacy fair sheets. Current survey technologies used by Hydrographic Offices (HOs) and crowd-source bathymetry lead to massive amounts of geographic datasets that get updated almost on a weekly basis (big data) [3]. Therefore, cartographic generalization for the publication of up-to-date nautical charts is an exceptionally important topic.
This paper describes a new procedure for the generalization of soundings based on the International Hydrographic Organization (IHO) standards and well-known cartographic practices. The methodology proposed in this paper tackles generalization of soundings based on a number of geoprocessing procedures. A big challenge for the solution of the problem at hand is the use of a high-resolution digital terrain model (DTM) as a source dataset for the selection of soundings appropriate for portrayal at a number of scales. This study proposes a solution that is consistent with the “ladder approach”, i.e., compiling from the original source data into the largest scale chart and then compiling the next smaller scale using the largest scale chart as source, and so on to the smallest scale appropriate for the data type. The sounding generalization procedure is easy to implement in a software environment and will considerably reduce the time and chart production costs. As a result, it will minimize the manual intervention of the nautical cartographers and allow them to focus on the review and on shortening the time for producing a new edition or chart update. Measures of success were evaluated against the current production workflows at NOAA’s marine chart division and in other HOs.
The paper is organized as follows: Section 2 refers to related work on the subject; Section 3 elaborates on the proposed soundings generalization procedure; Section 4 describes the case study and the results at various scales; Section 5 evaluates the results and discusses potential use of this procedure in charting and other applications.

2. Related Work

A nautical chart is a map of the underwater world with symbols and notes that are specifically intended for safe navigation. In addition to the paper chart and its digital form (Raster Navigational Chart), ENC is now broadly used and is considered mandatory carriage on several classes of ships [2]. One key chart element is water depth information that includes the shoreline, soundings, and depth contours. In ENCs, it is also important to define depth areas (i.e., contiguous depth contours between depth areas). Water depth information is collected using a tidally-referenced survey, also known as a hydrographic survey that measures the bottom and detects objects that are dangerous for navigation (e.g., rocks and wrecks). Depth areas without survey data are defined as “unsurveyed” and do not include soundings or depth contours. Extraction of the shoreline, soundings, and depth contours from the survey data must undergo generalization, a process of meaningfully reducing chart information to product scale. Nautical chart generalization is guided by the following constraints [4]:
  • The legibility constraint: An overdose of information (clutter) slows down the map reading process by the mariner. Thus, only essential information should be depicted on the chart in a form that is clearly and efficiently apprehensible.
  • The safety constraint: At every location, the depth portrayed must not be deeper than the depth that was originally measured during the survey; this is to guarantee that a ship never runs aground because of a faulty chart. This constraint is a so-called hard constraint, i.e., it can never be broken.
  • The topology constraint: The topology of the depicted map elements must be correct, e.g., depth contours may not intersect.
  • The morphology constraint: The map should be as realistic and accurate as possible, i.e., the overall morphology of the underwater surface should be clearly perceivable and characteristic features should be preserved.
These four constraints are sometimes in conflict. For instance, the morphology constraint gives priority to measured shape of the seafloor, while the legibility constraint leads to deviations from that exact shape disregarding some of the large-scale chart details. It is therefore evident that the end result must be a reasonable compromise between the four constraints. The soundings are considered the base for the definition of depth contour and depth areas. As such, soundings are considered the most significant features portrayed on nautical charts, showing where a vessel can safely navigate. Soundings generalization procedures conducted in previous studies typically classify the soundings into groups based on their function [5,6,7] and support the cartographer to select the appropriate soundings. In the cartographic literature, there are a number of research proposals for soundings generalization [5,8,9,10,11,12,13,14,15,16,17,18]. Additionally, constraints for portrayal of soundings on nautical charts appear in standards published by the IHO [19] and in best practices adopted by HOs [7]. The above constraints set the context for generalization of soundings and are reviewed in the following paragraphs.

2.1. Soundings Classification

Soundings selection in the framework of nautical charts compilation is guided by their classification in groups with different roles in seabed portrayal. Zoraster and Bayer [5] propose classification of soundings into three basic types: prime, background and limiting. Prime soundings mark ocean bottom features, which deviate significantly in depth from the bottom depth that would be expected based on linear interpolation between depth contours. They tend to be distributed irregularly and are concentrated in areas of high relief. Because they serve as aids to safe navigation, prime soundings are usually selected with a shoal bias. Background soundings are selected to present a regular pattern of soundings over the entire chart. The desired pattern is triangular or rectangular with the spacing between them increasing with depth. They make it easier to estimate ocean bottom depth between widely spaced or convoluted depth contours. Although they do not delineate significant ocean bottom features, some of them are selected because they deviate from the depth that would be expected based on linear interpolation between depth contours. They are often selected with a shoal bias as well and they are usually the most numerous soundings on a chart. Soundings which show the least depth encountered when following the deepest part of a natural channel or river are called limiting depths or controlling depths. They account for a small percentage of all the soundings on a chart. In order to enable location of more details on the chart, background soundings can be divided into three sub-groups [6]: deep, fill and supportive. Deep soundings are approximately 10%–20% deeper than their surroundings [7] and are less important than prime soundings and limiting depth soundings. Fill soundings provide information about large, gradually sloping depressions that are not deep enough to be enclosed by a depth contour. Supportive soundings provide additional information about the shape of the seafloor and changes in bottom slope away from shoals or deeps. According to the National Oceanic and Atmospheric Administration (NOAA) Nautical Chart Manual [7,8], soundings are also categorized into five groups: least, critical, deep, fill and supportive soundings. Both least and critical soundings represent the shallowest areas; deep soundings are portrayed for navigational purposes; fill soundings represent areas of gradual submarine relief within discreet depth areas and finally supportive soundings are used in support of all previously mentioned soundings and can be described as the structural information that makes a chart interpretable to the human eye. They afford more detailed information about the disposition of hazardous features, the topology of the seafloor and communicate the value of depth contours.

2.2. Soundings Generalization

It is important to note that the generalization approach using the five sounding groups mentioned above [5,6,7,8] is targeting raster and paper chart products. Some of the studies base the sounding generalization techniques on hydrographic surveys using a single-beam echosounder or lead line that do not provide full bottom coverage. The soundings generalization procedure itself has been an important research subject and a number of research works have been published proposing semi-automated approaches [5,8,9,10,11,12,13,14,15,16,17,18]. Zoraster and Bayer [5] distinguish hydrographic sounding generalization from cartographic sounding generalization. Hydrographic sounding generalization involves thinning hydrographic survey data down to a more easily managed sounding subset, which is still dense enough to support planned bathymetric modelling or chart compilation tasks. Cartographic sounding generalization is the process of selecting soundings for chart display. Oraas [9] states three basic rules for cartographic soundings generalization: (1) selection of the shoalest soundings, (2) creation of a regularly spaced pattern (e.g., triangular pattern), and (3) validation of the variation of soundings spacing according to the depth value. Moreover, all small closed depth contours should have a sounding within them. Zoraster and Bayer [5] propose a method that selects prime and background soundings. Selection is performed independently in each distinct ocean bottom region bounded by depth contours or the shoreline. As a first step, an interpolated grid-based ocean bottom model is generated that includes digitized chart depth contours and shorelines as input. Then, soundings with a maximum residual from the grid are first selected with a bias to the selection process in favour of shoaler soundings. Last, a thinning process using circular neighbourhood buffer around the selected soundings is applied in order to prevent overcrowding of soundings (clutter) on the chart. The Zoraster and Bayer algorithm adjusts the ocean bottom model to integrate the depth of the selected soundings. Tsoulos and Stefanakis [10] proposed a method for soundings generalization with regard to background soundings. Four criteria are applied: (1) the shoalest soundings must be depicted, (2) the density of selected soundings must increase in shoal areas and decrease in less dangerous areas, (3) the density of selected soundings must also increase to show local bottom irregularities, and (4) small “closed” depth contours should be emphasized with the depiction of a sounding. In areas of homogeneous depth, soundings generalization should form an equilateral triangular pattern. A triangulated irregular network (TIN) is used as an auxiliary structure to describe sea bottom. Du et al. [11] based their soundings generalization method on recognition of terrain features with the aid of Delaunay triangulation. The Du et al. method selects soundings that are on the top of an elevated underwater point or area feature (shoals, rocks, etc.), showing the waterways and representing the outline of sea bottom. Additionally, the soundings density increases in shoal areas and decreases in less dangerous areas and in areas of homogeneous depth. Finally, the soundings in the chart should form a rhomboidal pattern. The deepest and the shallowest soundings are selected wherever within every subarea. Solaric [12] proposed a method for soundings generalization that focused on the selection of the shallowest soundings by covering the original data with a network of squares. Sui et al. [13] focuses on the selection of background soundings based on the following criteria: (1) the shoalest soundings in any area are selected, (2) a relatively regular pattern is produced, and (3) the spacing of the soundings varies according to the depth. For shoalest sounding selection, the term “influence circle” is introduced which implies that only the shoalest sounding will be selected from all soundings located inside the circle and the others will be eliminated (i.e., buffer radius). A recent study by Yu [14] presents an approach that analyses and quantifies the morphology of the sea bottom derived from sounding data. In this approach, the region is first divided into several sub-regions, by adopting techniques of computational geometry and graph theory. Then, based on the complexity of bottom morphology, the DTM grid is characterized according to the defined sub-regions. Finally, a composite complexity index is developed to guide the operation of soundings selection in each of the different sub-regions. The composite complexity index is based on aspects of steepness and depth variation at a given scale that will result in a high number of soundings when the seafloor is rugged with steep slopes, and a small number of soundings are retained in flat areas. The method is applied to the generalization of existing nautical charts. Owens and Brennan [8] proposed manual selection for soundings that appear on or too close the depth contours and obstructions. Lovrinčević [16] presented a new methodology for automated soundings selection of significant and critical soundings showing unexpected changes in the seafloor. To achieve this, significant seafloor features are detected using the values of slope and aspect parameters calculated from the survey data and categorized according to the type of feature that they represent. A set of selection rules for each category is defined within the selection algorithm based on the parameters extrapolated from the existing soundings charted on official charts.
Based on the literature review, it seems that the studies mentioned above have adopted a number of common principles (Table 1): soundings classification, depth related criteria, auxiliary structures, pattern in soundings, anti-crowding tactics, soundings density and area segmentation.
Most HOs nowadays handle soundings generalization with commercial software or custom developed solutions, such as C-Map dKart Editor [17], CARIS Bathy DataBASE tools [8], and depth area tool [18]. However, soundings generalization is not fully automated and the intervention of the experienced cartographer to a considerable extent is required.

2.3. Soundings Standards and Constraints

IHO S-4 [19] provides specific guidelines for sounding standards and constraints. The shoal soundings are retained for safety. The deep soundings tend to be eliminated but sufficient numbers of deep soundings should be retained to show the full range of depths. Regarding the compilation procedure, it is advised by the above standard to use the ladder approach to ensure that any sounding depicted on the smallest scale chart will also be portrayed on the largest scale. The least depth must be shown in the usable channels, over shoals and banks, and over sills (bars) in navigable channels. Particular attention should also be paid to full and accurate representation of all other ‘critical’ areas, for example: on and adjacent to leading lines; controlling depths in fairways and along recommended tracks in anchorages, alongside jetties, quays and berths; and in the entrances to harbours and basins. Maximum as well as minimum depths should be shown where possible, for example to show the line of deepest water in narrow channels.
The NOAA’s Nautical Chart Manual [7], which is used as a reference guide for chart production in the U.S., provides additional guidelines on the selection and spacing of soundings. The selection process must ensure that the overall presentation of depth data is accurate, complete, and must be quickly and easily understood by mariners. A balance between clear and safe interpretation and complete survey presentation must be maintained. In addition, bottom contouring and feature identification are defined as necessary predecessors to soundings selection. The density of soundings on the chart is usually considerably reduced from that on the sources. Additional supportive soundings are selected at a lesser density to complete the bottom description. Fill soundings (over flat bottom areas) should be relatively widely spaced. The density of soundings in shoal areas helps to draw the chart users’ attention to potentially dangerous areas. Emphasis must be placed on selecting a sufficient density of soundings for natural channels, shoals, or other hazardous areas to adequately highlight these features for quick recognition by the mariner. The selection of soundings must meet the following requirements: all shoal areas that might impede surface navigation must be identified, information about natural channels between or through shoal or hazardous areas must be provided and the configuration of the bottom must be graphically portrayed. The order in which soundings are selected from sources depends upon the bottom features of the area being charted and their relative significance to the overall bottom shape. As a rule, selection of soundings should begin with shoal areas and natural navigational channels and work toward deeper water. The NOAA’s Nautical Chart Manual also quantifies the sounding density as follows: critical soundings should be located no closer than 6 mm, fill soundings should be from 15 to 30 mm apart, and supportive soundings should be at least 10 mm apart and between 40 and 100 percent of the spacing between fill soundings.

3. A New Method for Soundings Generalization across Scales

Based on the review of rules, constraints and proposed procedures for soundings generalization, there are a number of alternative approaches to tackle this problem. Such approaches have been proposed in the literature, but they are not supported at all by clear and cohesive rules for their implementation in an ENC production environment. As a result, current sounding generalization procedures are subjective and cartographic judgement is not consistent within a hydrographic office. Depending on ENC cell size and the complexity of the sea bottom, manual sounding generalization sometimes prolongs to several weeks. Given that this work aims at rules and procedures for the application of generalization in a production environment, a realistic solution that avoids lengthy analyses of the sea bottom morphology is preferable.

3.1. Soundings Generalization Framework

The soundings generalization approach proposed in this paper assumes the following framework:
  • Soundings source is a high resolution DTM (5 m).
  • The target charts include: Harbour charts (scales 1:10 K and 1:20 K) and Approach charts (scales 1:40 K and 1:80 K).
  • The generalization should be based on IHO specifications.
  • The proposed method should be implementable in a standard GIS environment.
Analysis of the IHO specifications led to the adoption of the “ladder approach”, i.e., each scale will be the result of the generalization of the larger one. Thus, the content of the chart at the largest production scale (1:10 K) through generalization is of paramount importance for all subsequent/smaller scales. The need for a hydrographic soundings generalization, i.e., to portray a subset of the original soundings from the DTM on charts across scales will downgrade the DTM generalization as a solution. Instead, each cell from the DTM grid is converted to a point feature with a depth value. This data set is generalized according to the largest scale (1:10 K) that will be used as a reference for the production of the next smaller scale. This process is then applied to all subsequent scales (Figure 1). Thus, any sounding portrayed at a smaller scale chart will be also depicted at the larger scale chart as required by IHO specifications. Based on the assumptions in Section 2, metrics for algorithm (cartographic requirements for sounding selection approach) are as follows:
  • Generalization operator: Soundings generalization is performed only with the elimination operator. No displacement or other generalization operator is applicable;
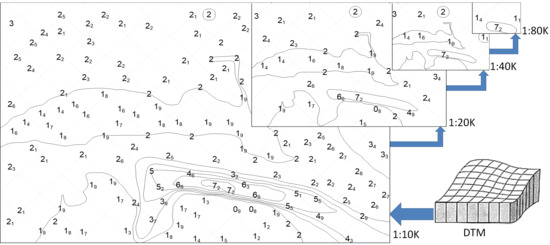
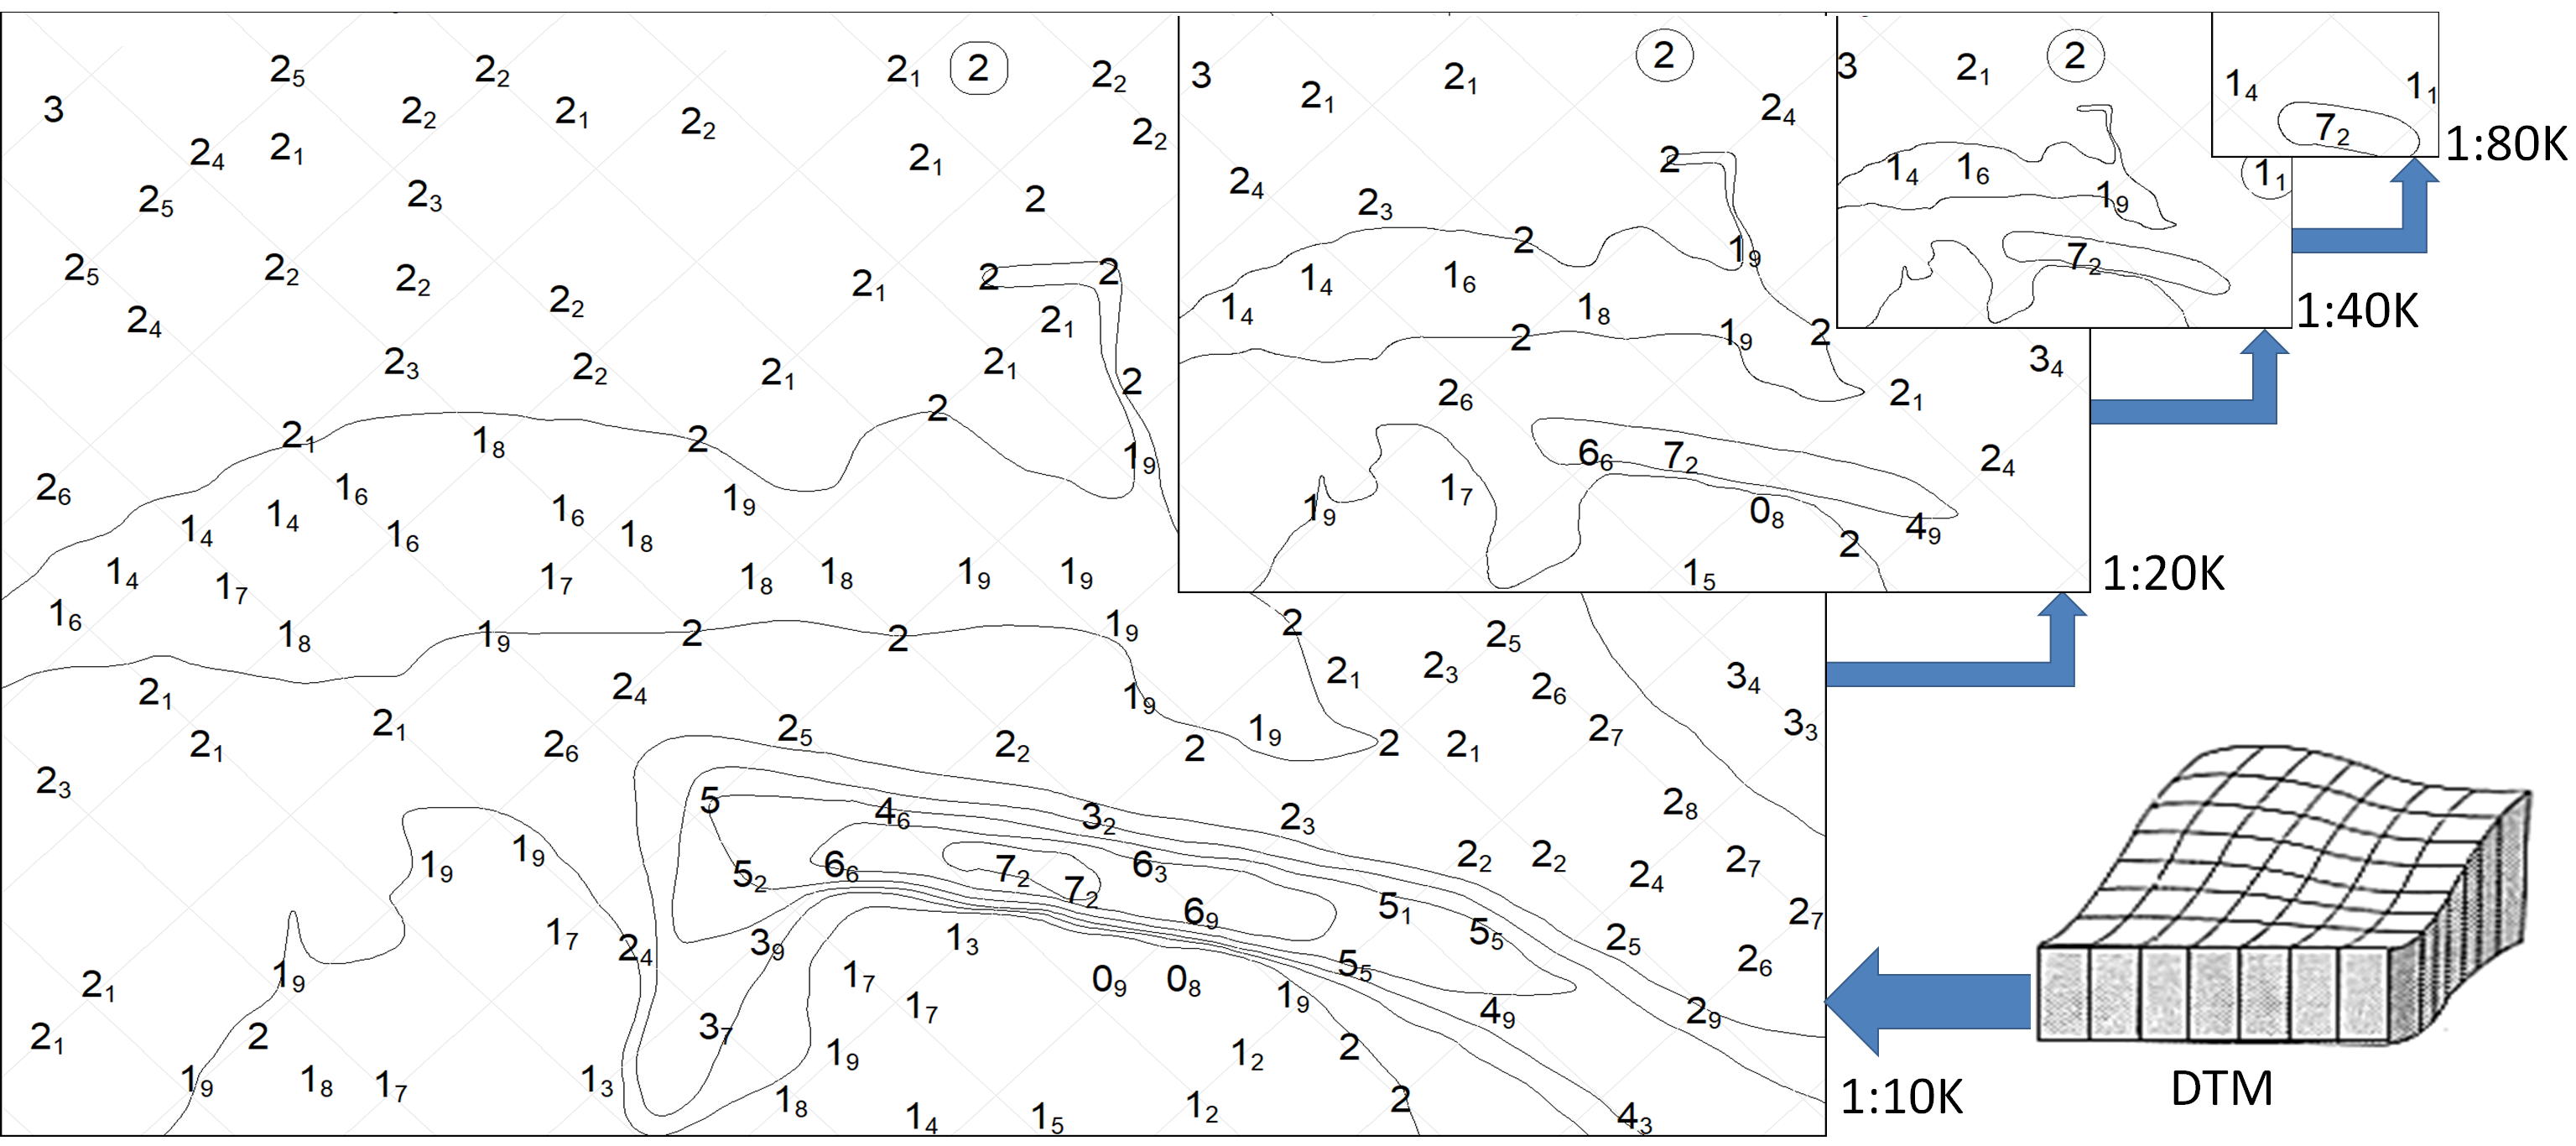
  • Sequence of generalization: The ladder approach is applied based on the “Largest scale first” principle. Thus, soundings are decreased gradually in a systematic manner when transition from a large-scale chart into small-scale charts is made;
  • Soundings Classification: Specific rules are applied for the selection of soundings belonging to groups with different functionality in depth portrayal;
  • Density: The soundings separation distance on charts will vary depending on the depth range. Distances between soundings are defined, in relation to the group they belong to according to their values, in a way that serves the safety of navigation and the aesthetics of the portrayal. In the framework of this project, Table 2 provides the acceptable ranges for separation distances as a function of depth [10]. In addition, any overlay between soundings should be avoided in order to retain cartographic aesthetics;
  • Pattern: The method aims to achieve a rhomboidal pattern for the portrayed soundings. A rhombus fishnet is used as an auxiliary structure for soundings selection. The rhombus size depends on the depth range and the chart scale. Using the spatial extent limits of each depth range group as defined by the depth contours derived from the DTM, a rhombus fishnet is created and is overlaid on the area under examination. In Table 3, the rhombus size (in meters) and the corresponding R value (equal to half of the fishnet cell dimension) used in this work are shown;
  • Processing Areas: Depth areas/ranges on the chart are defined by the depth contours derived from the DTM. Before applying generalization, soundings are grouped according to the depth range of their values (e.g., 0–10 m, 10–25 m), where each soundings group follows its unique best practices. Since depths are not portrayed in the dredged areas, soundings in these areas are not taken into account in the selection process. The overlay of the rhomboidal fishnet on the soundings dataset creates rhomboidal subareas where selection rules according to constraints are applied (see Section 3.2). This way, local processing at a scale related to the nautical chart scale is feasible;
  • Rules: The chart product must follow IHO S-4 cartographic rules and maintain surface structure information without violating the depth integrity;
  • Retention criteria: Priority is given to the shoal soundings. According to the specifications, shoals should be portrayed along with the deep ones in the vicinity, i.e., those with a depth value difference greater than 20% are selected [7];
  • Automation: The new procedure should include automation capabilities for more frequent bathymetry updates as survey technology advances;
  • Implementation: The new approach should be easy to implement in a variety of GIS environments (e.g., ESRI or QGIS) with the ability to customize the cartographic rules as new standards or establish unique standards in a given hydrographic office.

3.2. Methodology

As a first step, the preprocessing of the sounding dataset includes a rhombus fishnet overlaid on the soundings dataset and soundings belonging to each rhombus cell are assessed. The mesh of the fishnet is created to fully cover the soundings extent, rotated to −45 degrees. Its origin is defined with respect to the lower left corner coordinates of the soundings extent. The cell size is defined in accordance with the specifications adopted by the producing organization. In the case of the experiment carried out, cell sizes are those shown in Table 3. As a result, the soundings are processed on a local cell level. Statistics are computed for each rhombus cell that include attributes such as minimum depth, maximum depth and depth range.

3.2.1. Soundings Classification

Soundings to be portrayed on the chart for each depth area (e.g., 0–10 m, 10–25 m etc.) are classified as follows: prime, background, fill and morphology related. It is important to note that this sounding classification differs from the previous work mentioned in Section 2.1 that use five sounding classes: least, critical, deep, fill and supportive soundings. Selection criteria for each class for each rhombus cell in this study are as follows:
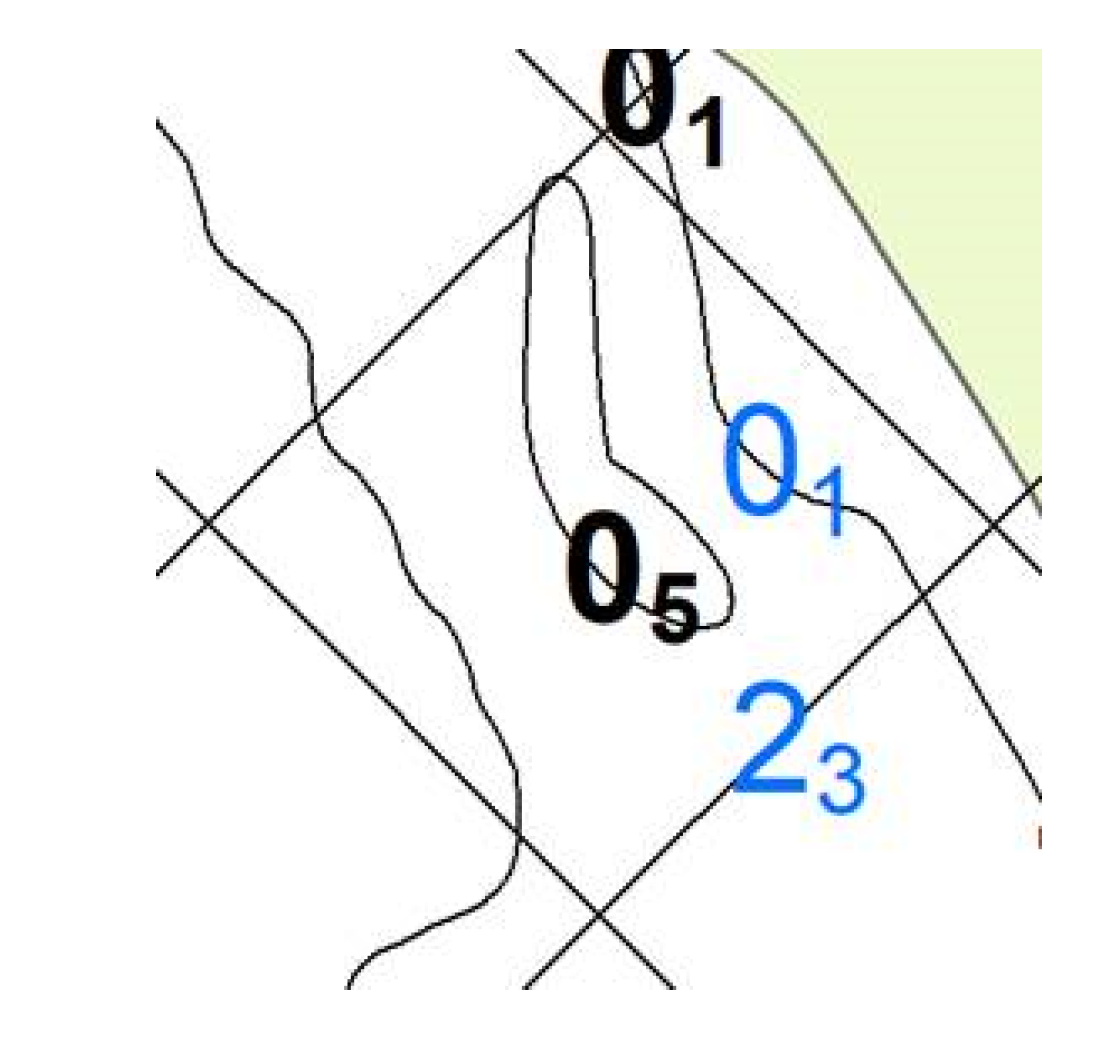
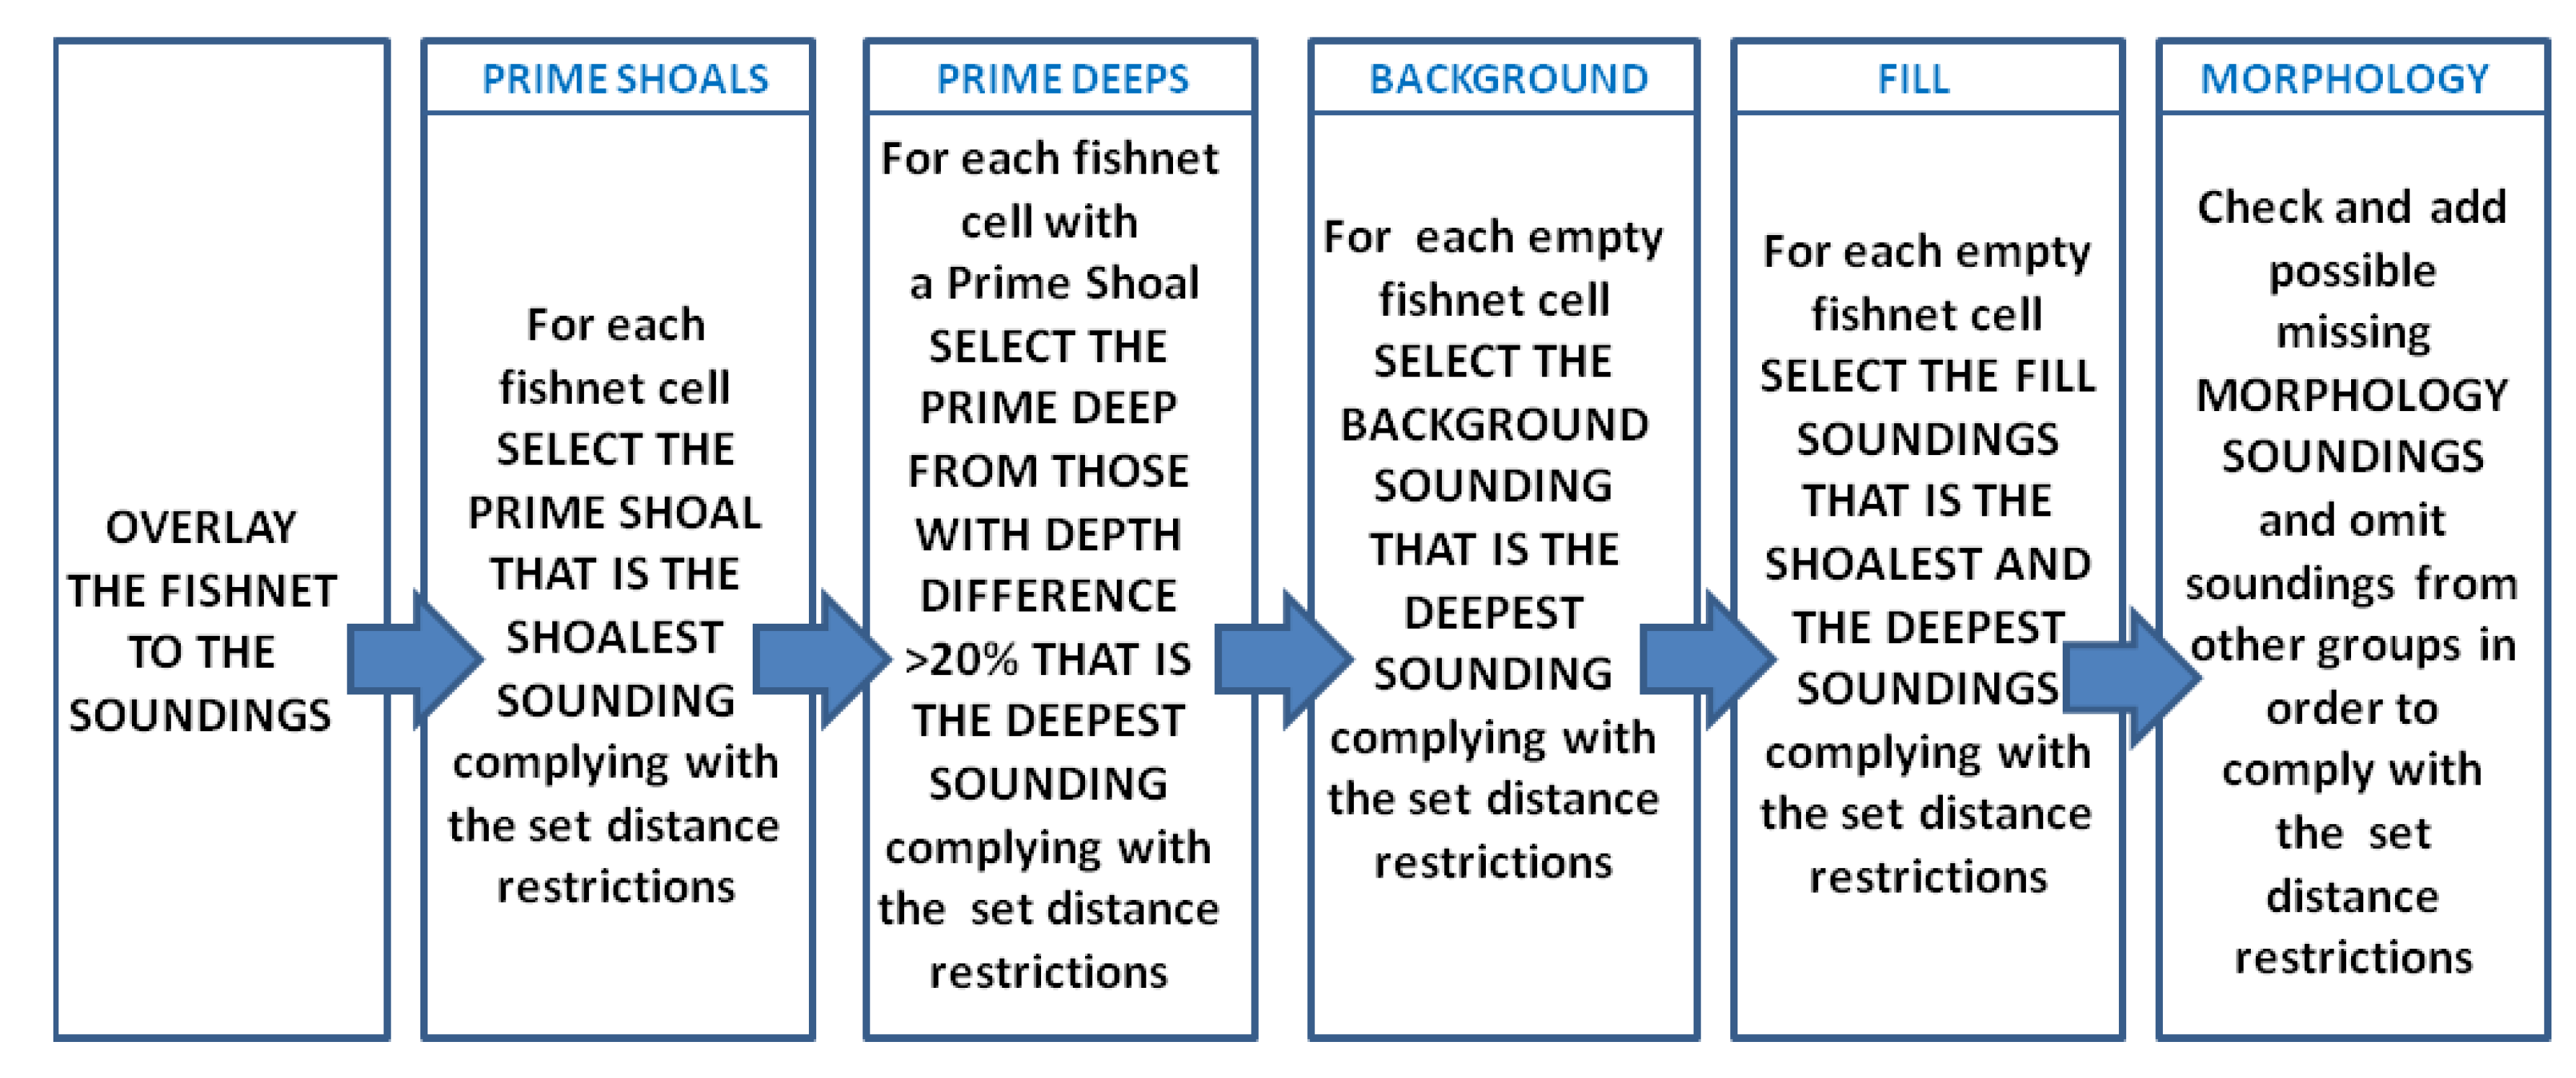
  • Prime: Prime soundings include shoals and deeps. Shoals refer to the shallowest sounding for each fishnet cell that fulfils the minimum distance restriction. Deeps refer to the deepest sounding for each fishnet cell that has a value greater or equal than 20% depth difference from the above mentioned shoals, when this is compliant with the minimum distance requirement.
  • Background: For each fishnet cell that has no Prime soundings, the deepest sounding is selected. The selection of the Background sounding is in accordance with the minimum distance restriction (Table 2), between two Background soundings as well as the distance from Prime soundings.
  • Fill: For each fishnet cell that has no Prime or Background soundings, the shallowest and the deepest soundings are selected following the distance restrictions (Table 2).
  • Morphology: Using the same rhombus fishnet, soundings will be added to support the portrayal of the sea bottom morphology. The Morphology soundings are complementary to the depth contours portrayed at each scale. In some cases when the morphology is critical for navigation, other soundings (i.e., Prime, Fill, and Background) will be deleted to meet distance restrictions.

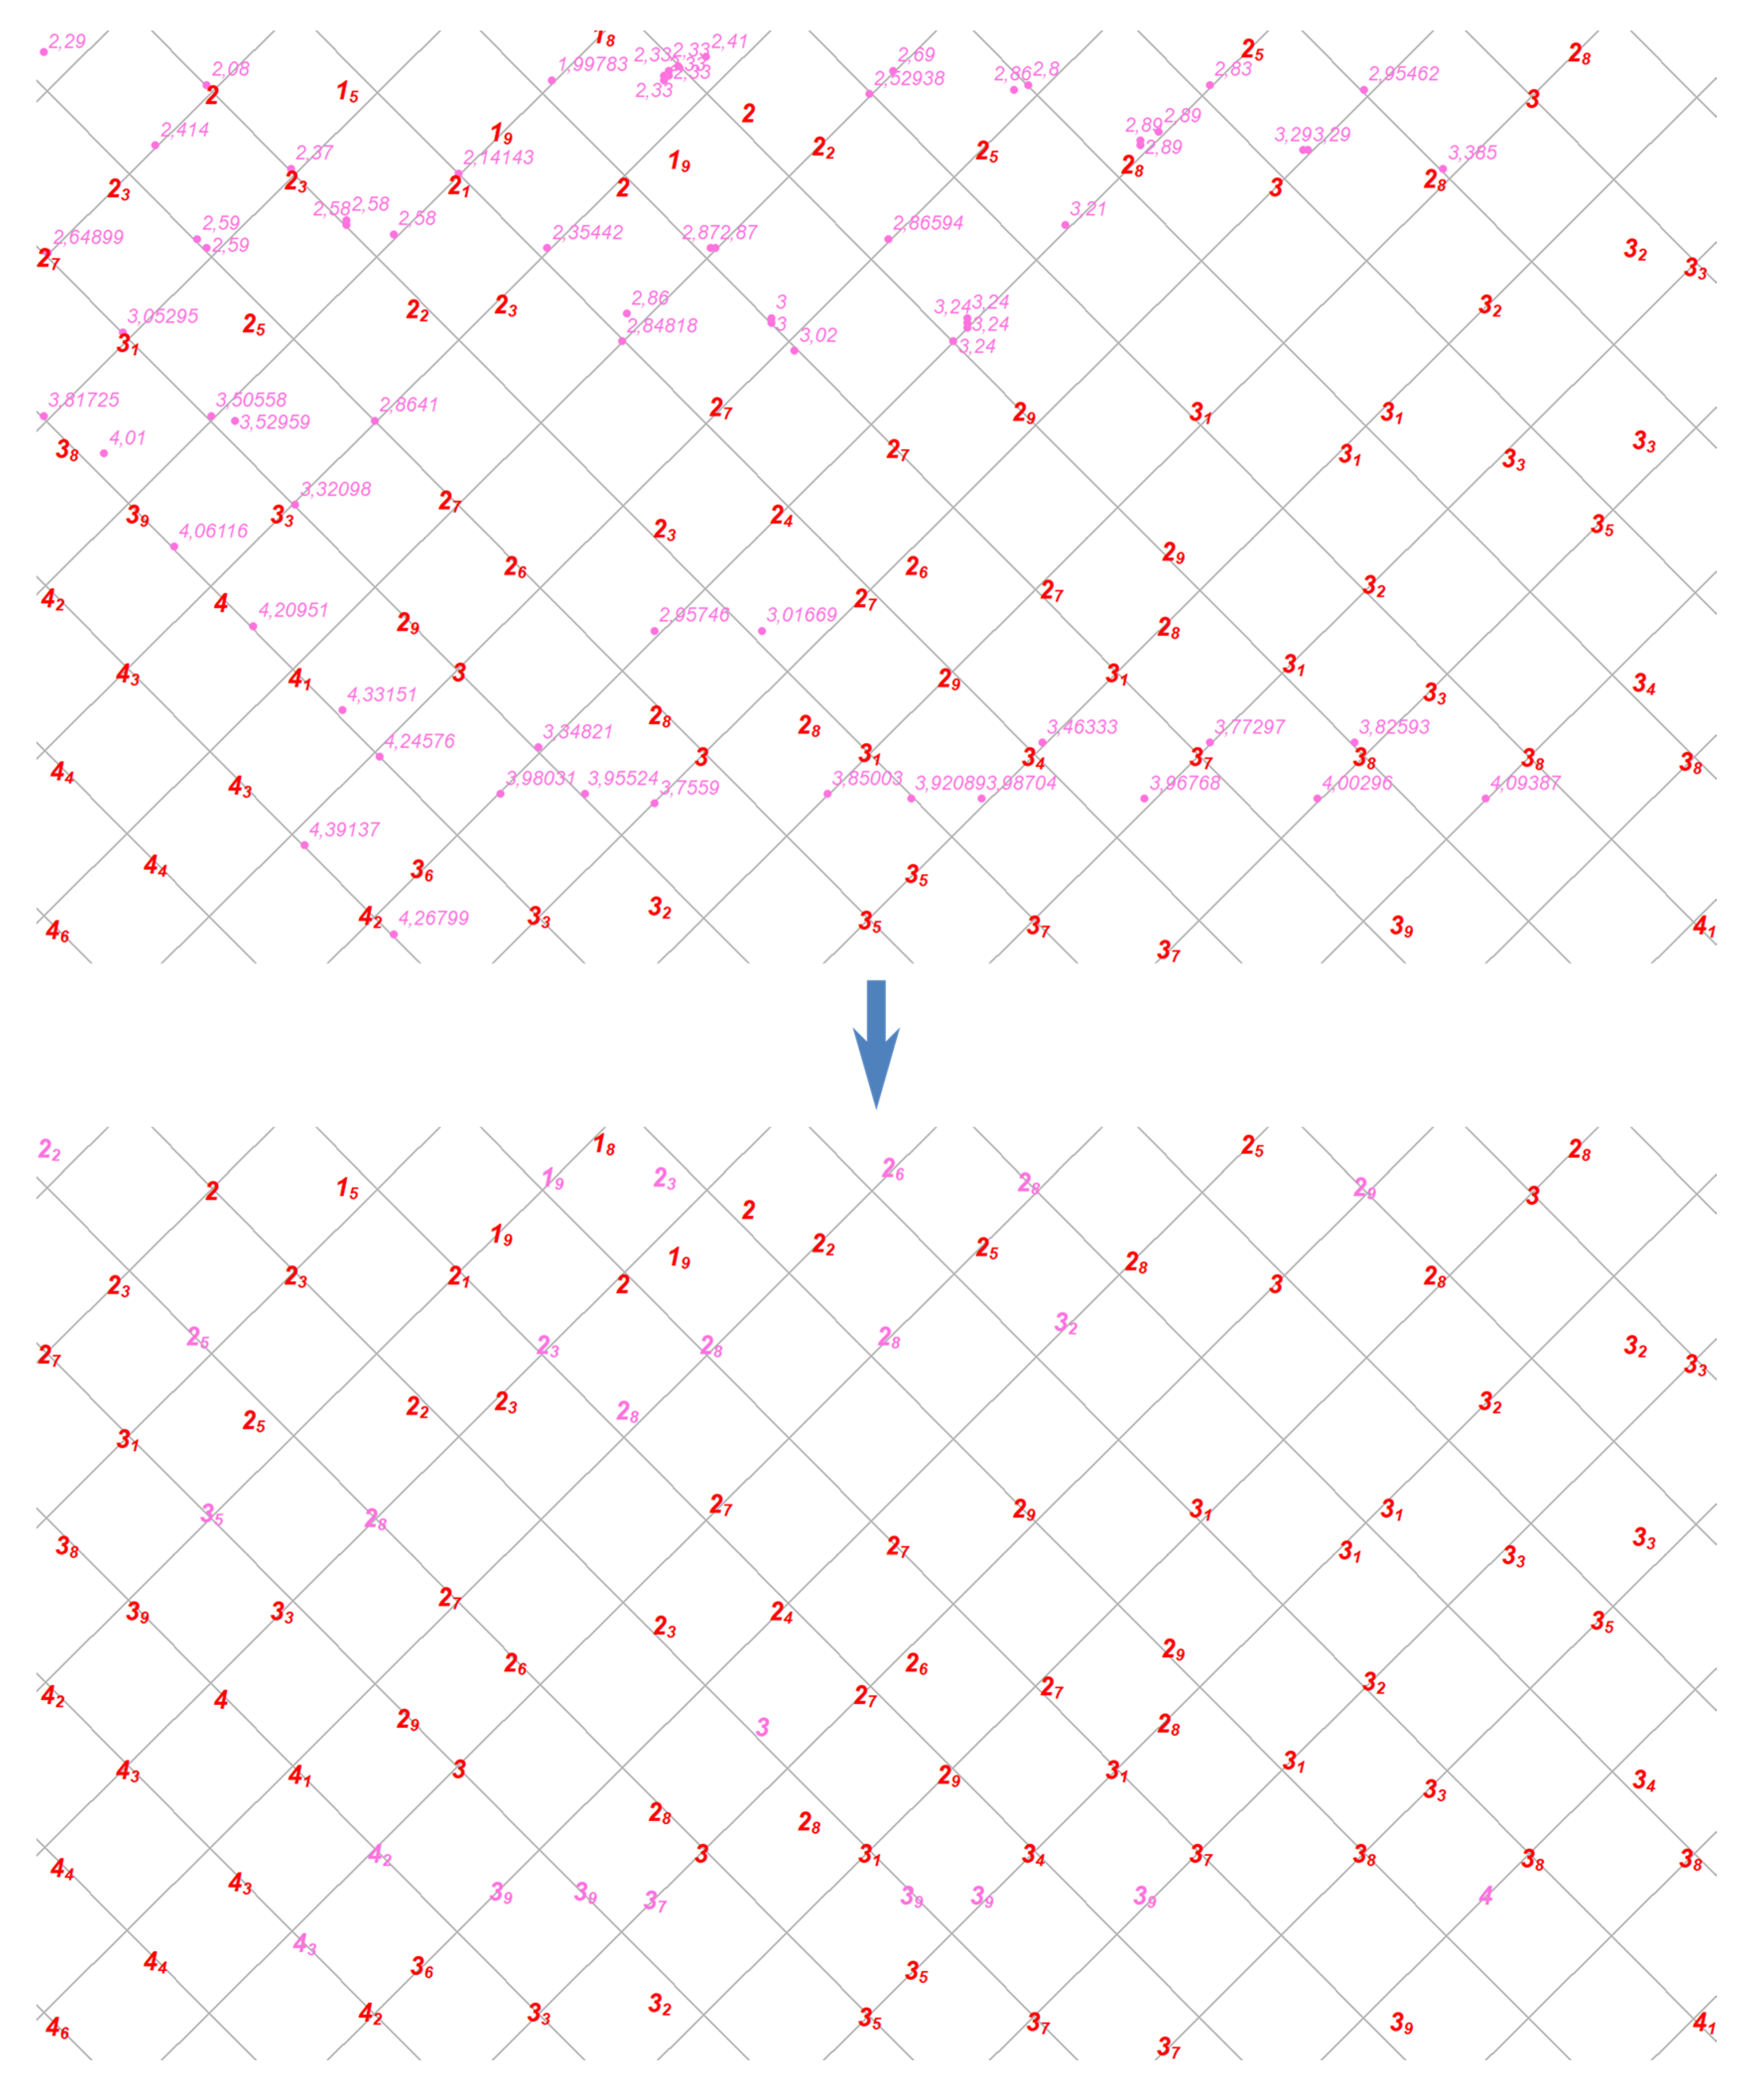
3.2.2. Prime Soundings

The process for the selection of Prime soundings for each fishnet cell is as follows:
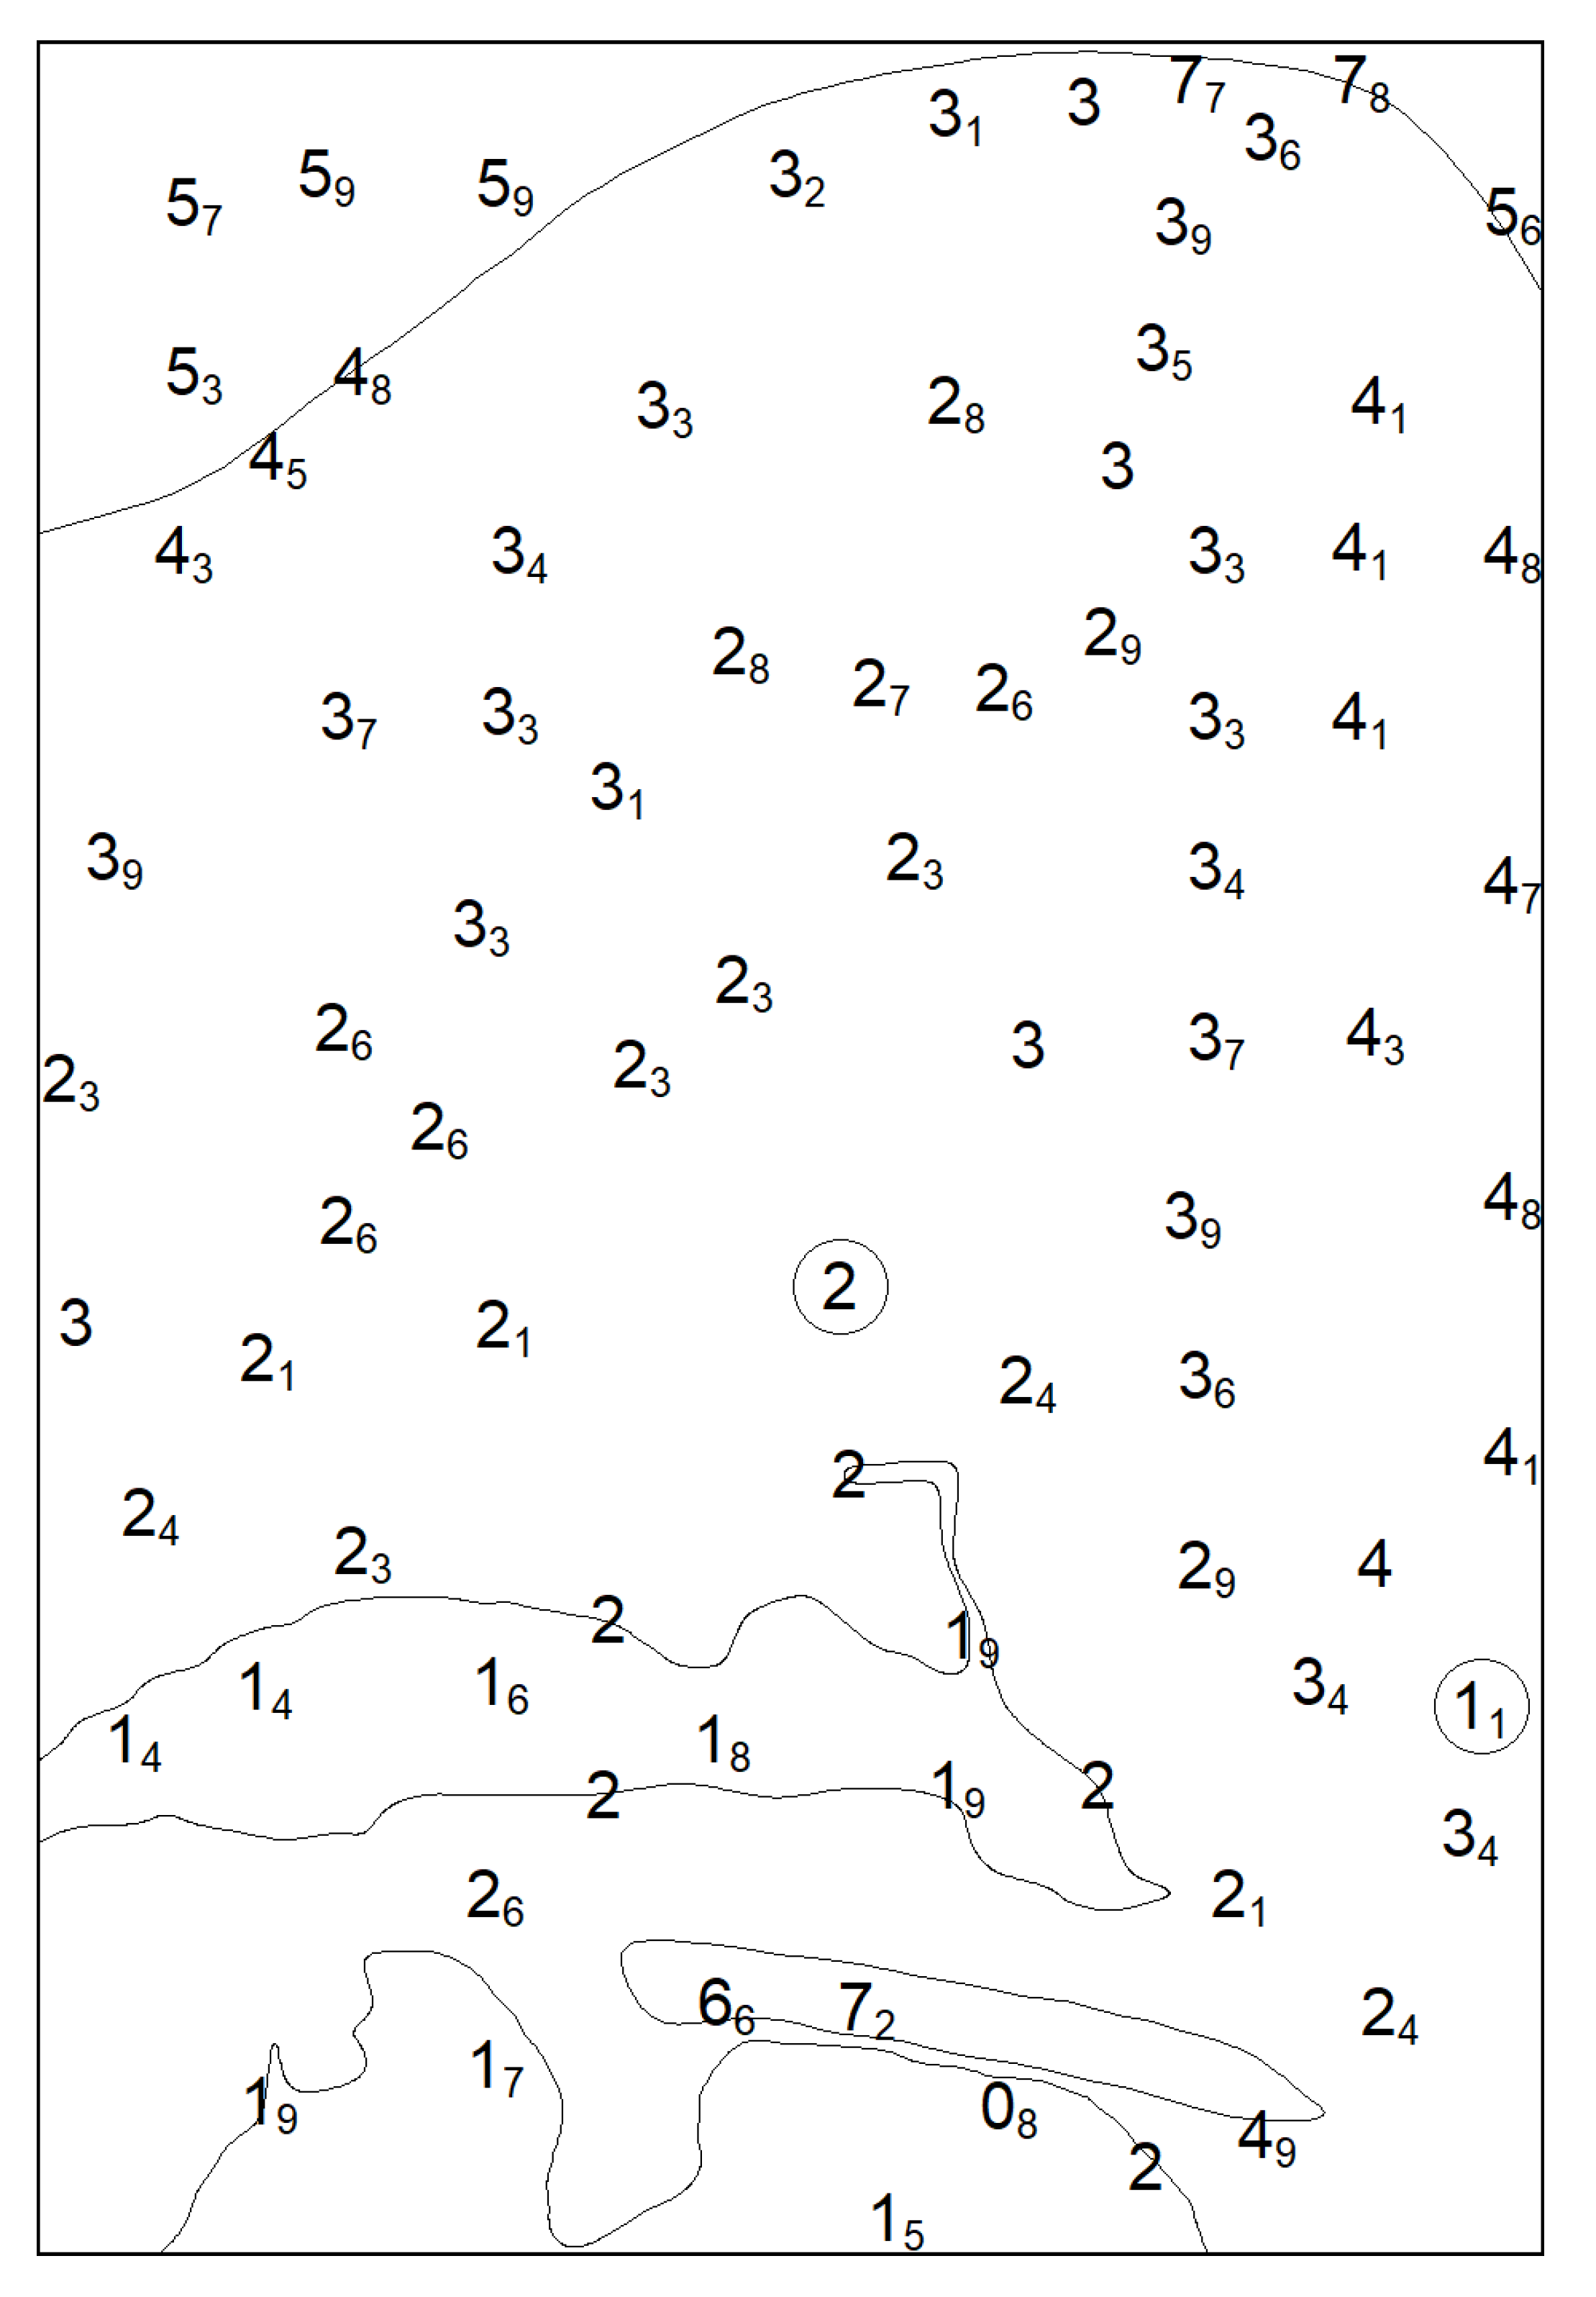
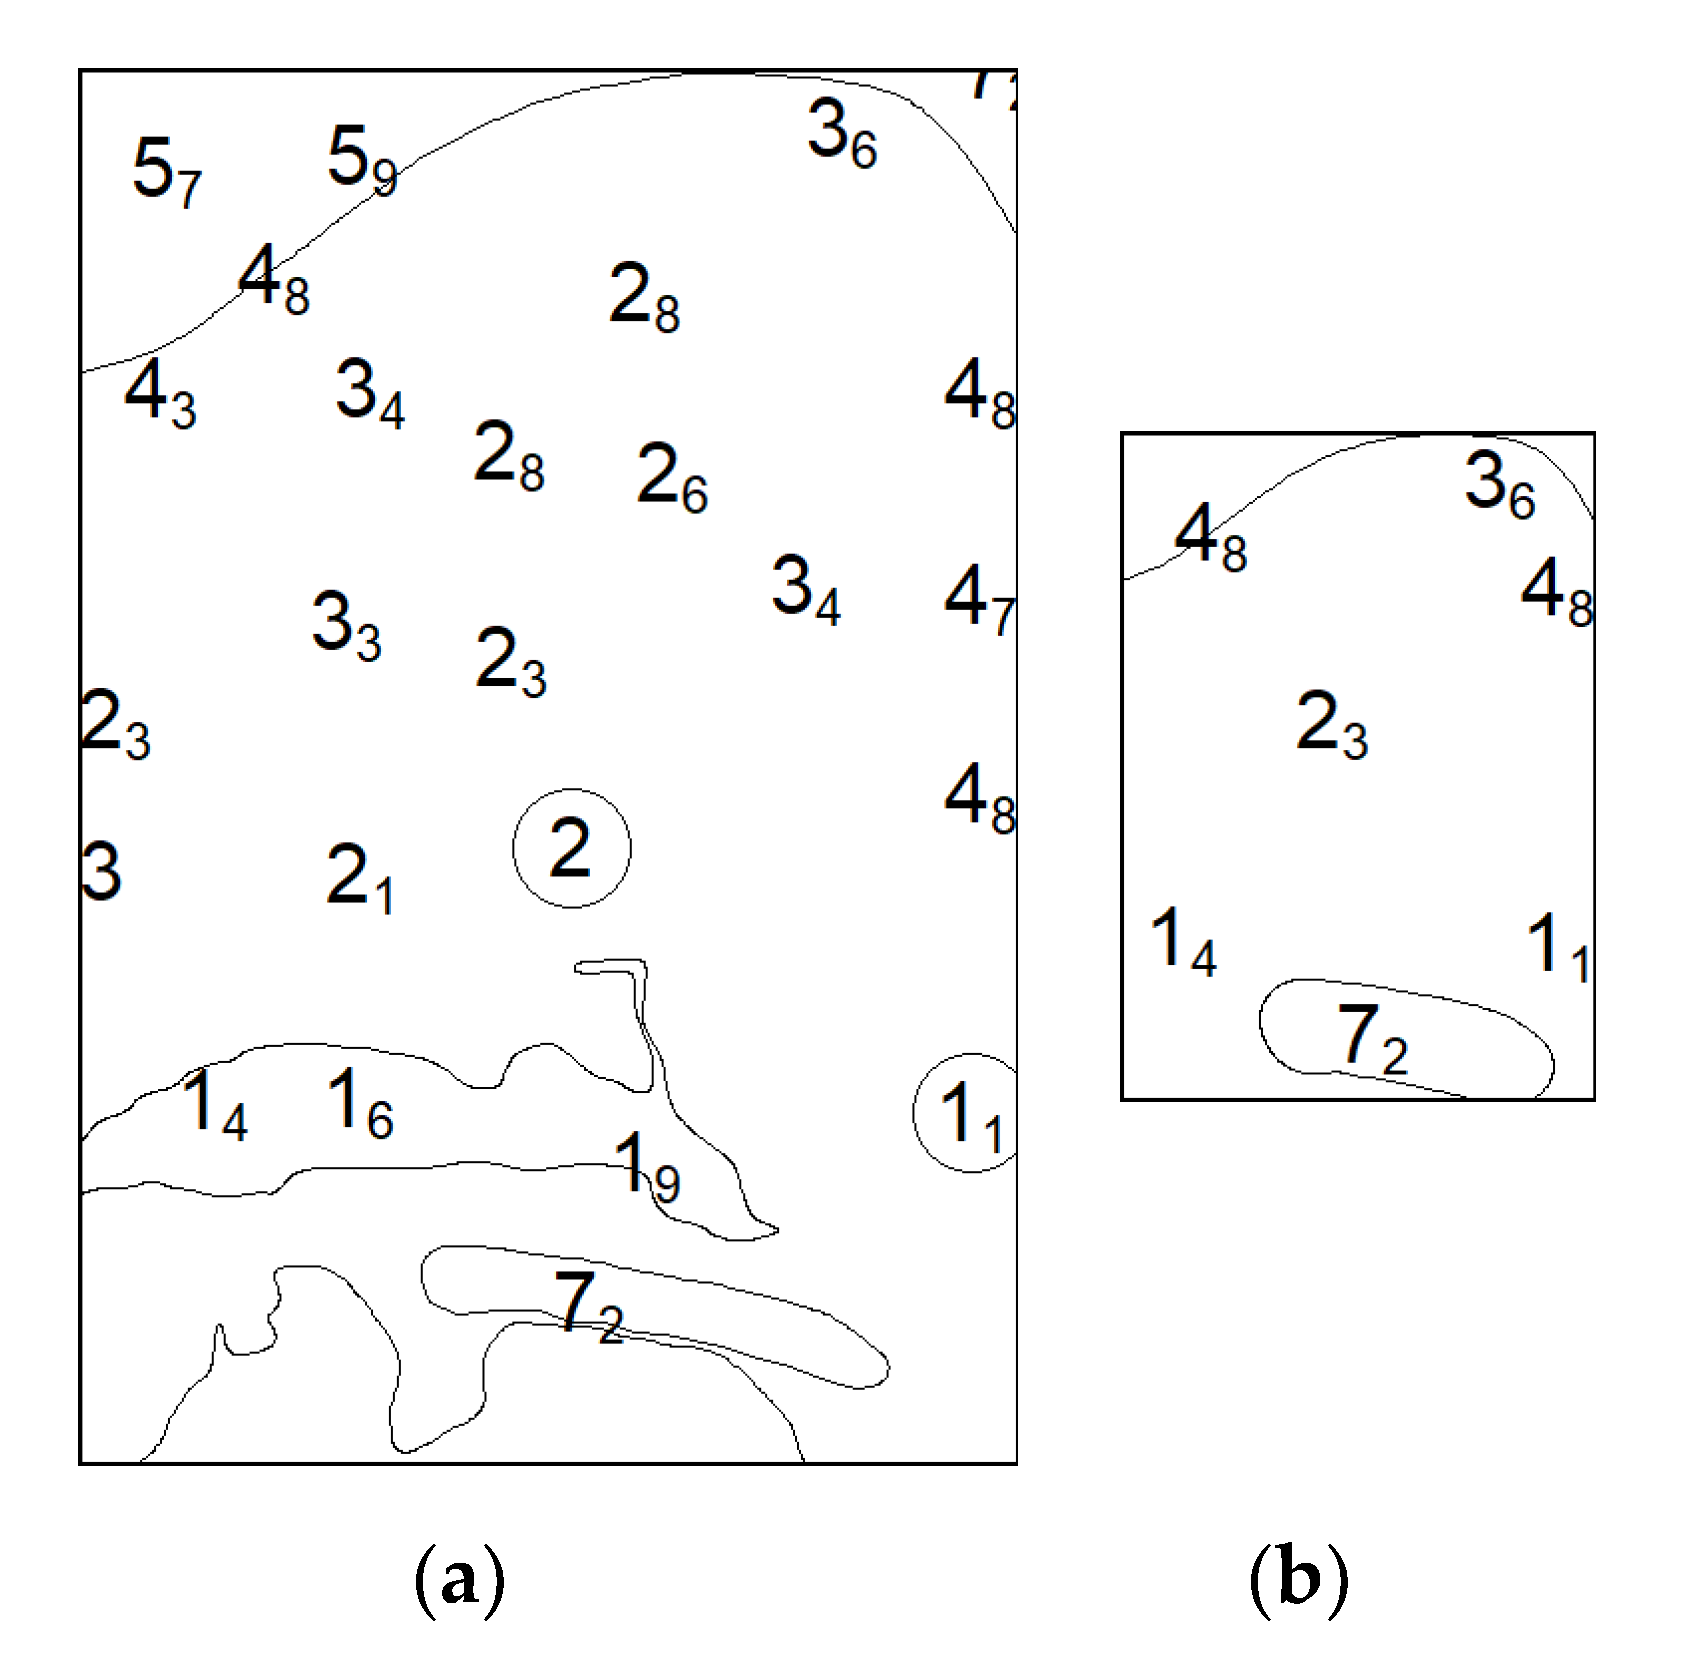
  • Shoals (Figure 2) result from the selection of soundings for each fishnet cell with depth values equal to the maximum for each cell (depth values are negative and thus the maximum value is the shallowest) and all the soundings from the fishnet cells where the maximum value is equal to the minimum value (flat cells).
  • Deeps (Figure 3) result from the selection of soundings for each fishnet cell with depth values equal to the minimum for each cell (depth values are negative and thus the minimum value is the deepest) and at the same time the maximum value is not equal to the minimum value (flat cells have been already selected in the previous phase). For these soundings, the percentage of the difference in relation to the maximum value (shoal depths) for each fishnet cell is computed. In this first selection phase, Prime Shoal soundings and Prime Deep soundings are identified. Regarding the Prime Shoal soundings, from the already selected shoals, the one closer to each fishnet cell centre is retained. The selected shoal soundings may be too dense. Soundings should have between them distance greater than (or equal to) R, which is equal to half of the fishnet cell size. This condition is violated when soundings resulting from two or more adjacent fishnet cells are too close requiring the examination of the distances between them.
The adjacency check is carried out in two stages:
  • Selection of soundings with distance between them greater than (or equal to) R;
  • Selection of soundings with distance between them shorter than R. Soundings are grouped in clusters of 2, 3 or more, based on the distances between them and their relative position. For each cluster the shoalest is selected. This process results to a subgroup of shoals with distances between them greater than (or equal to) R.
The final group of Prime Shoal soundings is the union of the soundings selected in these two stages.
Regarding Prime Deep soundings, for each fishnet cell with a shoal sounding selected in the previous phase, deeps with depth value difference greater than 20% compared to the selected shoals are selected. From this group, those with distance longer than R from the shoals are identified. Selected deeps are checked for distances between them. The adjacency check is completed in two stages:
  • Selection of soundings with distance between them greater than (or equal to) R;
  • Selection of soundings with distance between them smaller than R. Selected soundings are grouped in clusters of 2, 3 or more, based on distances between them and their relative position. For each cluster, the deepest is selected. This process results to a subgroup of deeps with distances between them longer than (or equal to) R.
The final group of Prime Deep soundings (Figure 3) is the union of the soundings selected in the above two stages.
Prime Shoal and Prime Deeps constitute the Prime soundings for the depth area under examination.

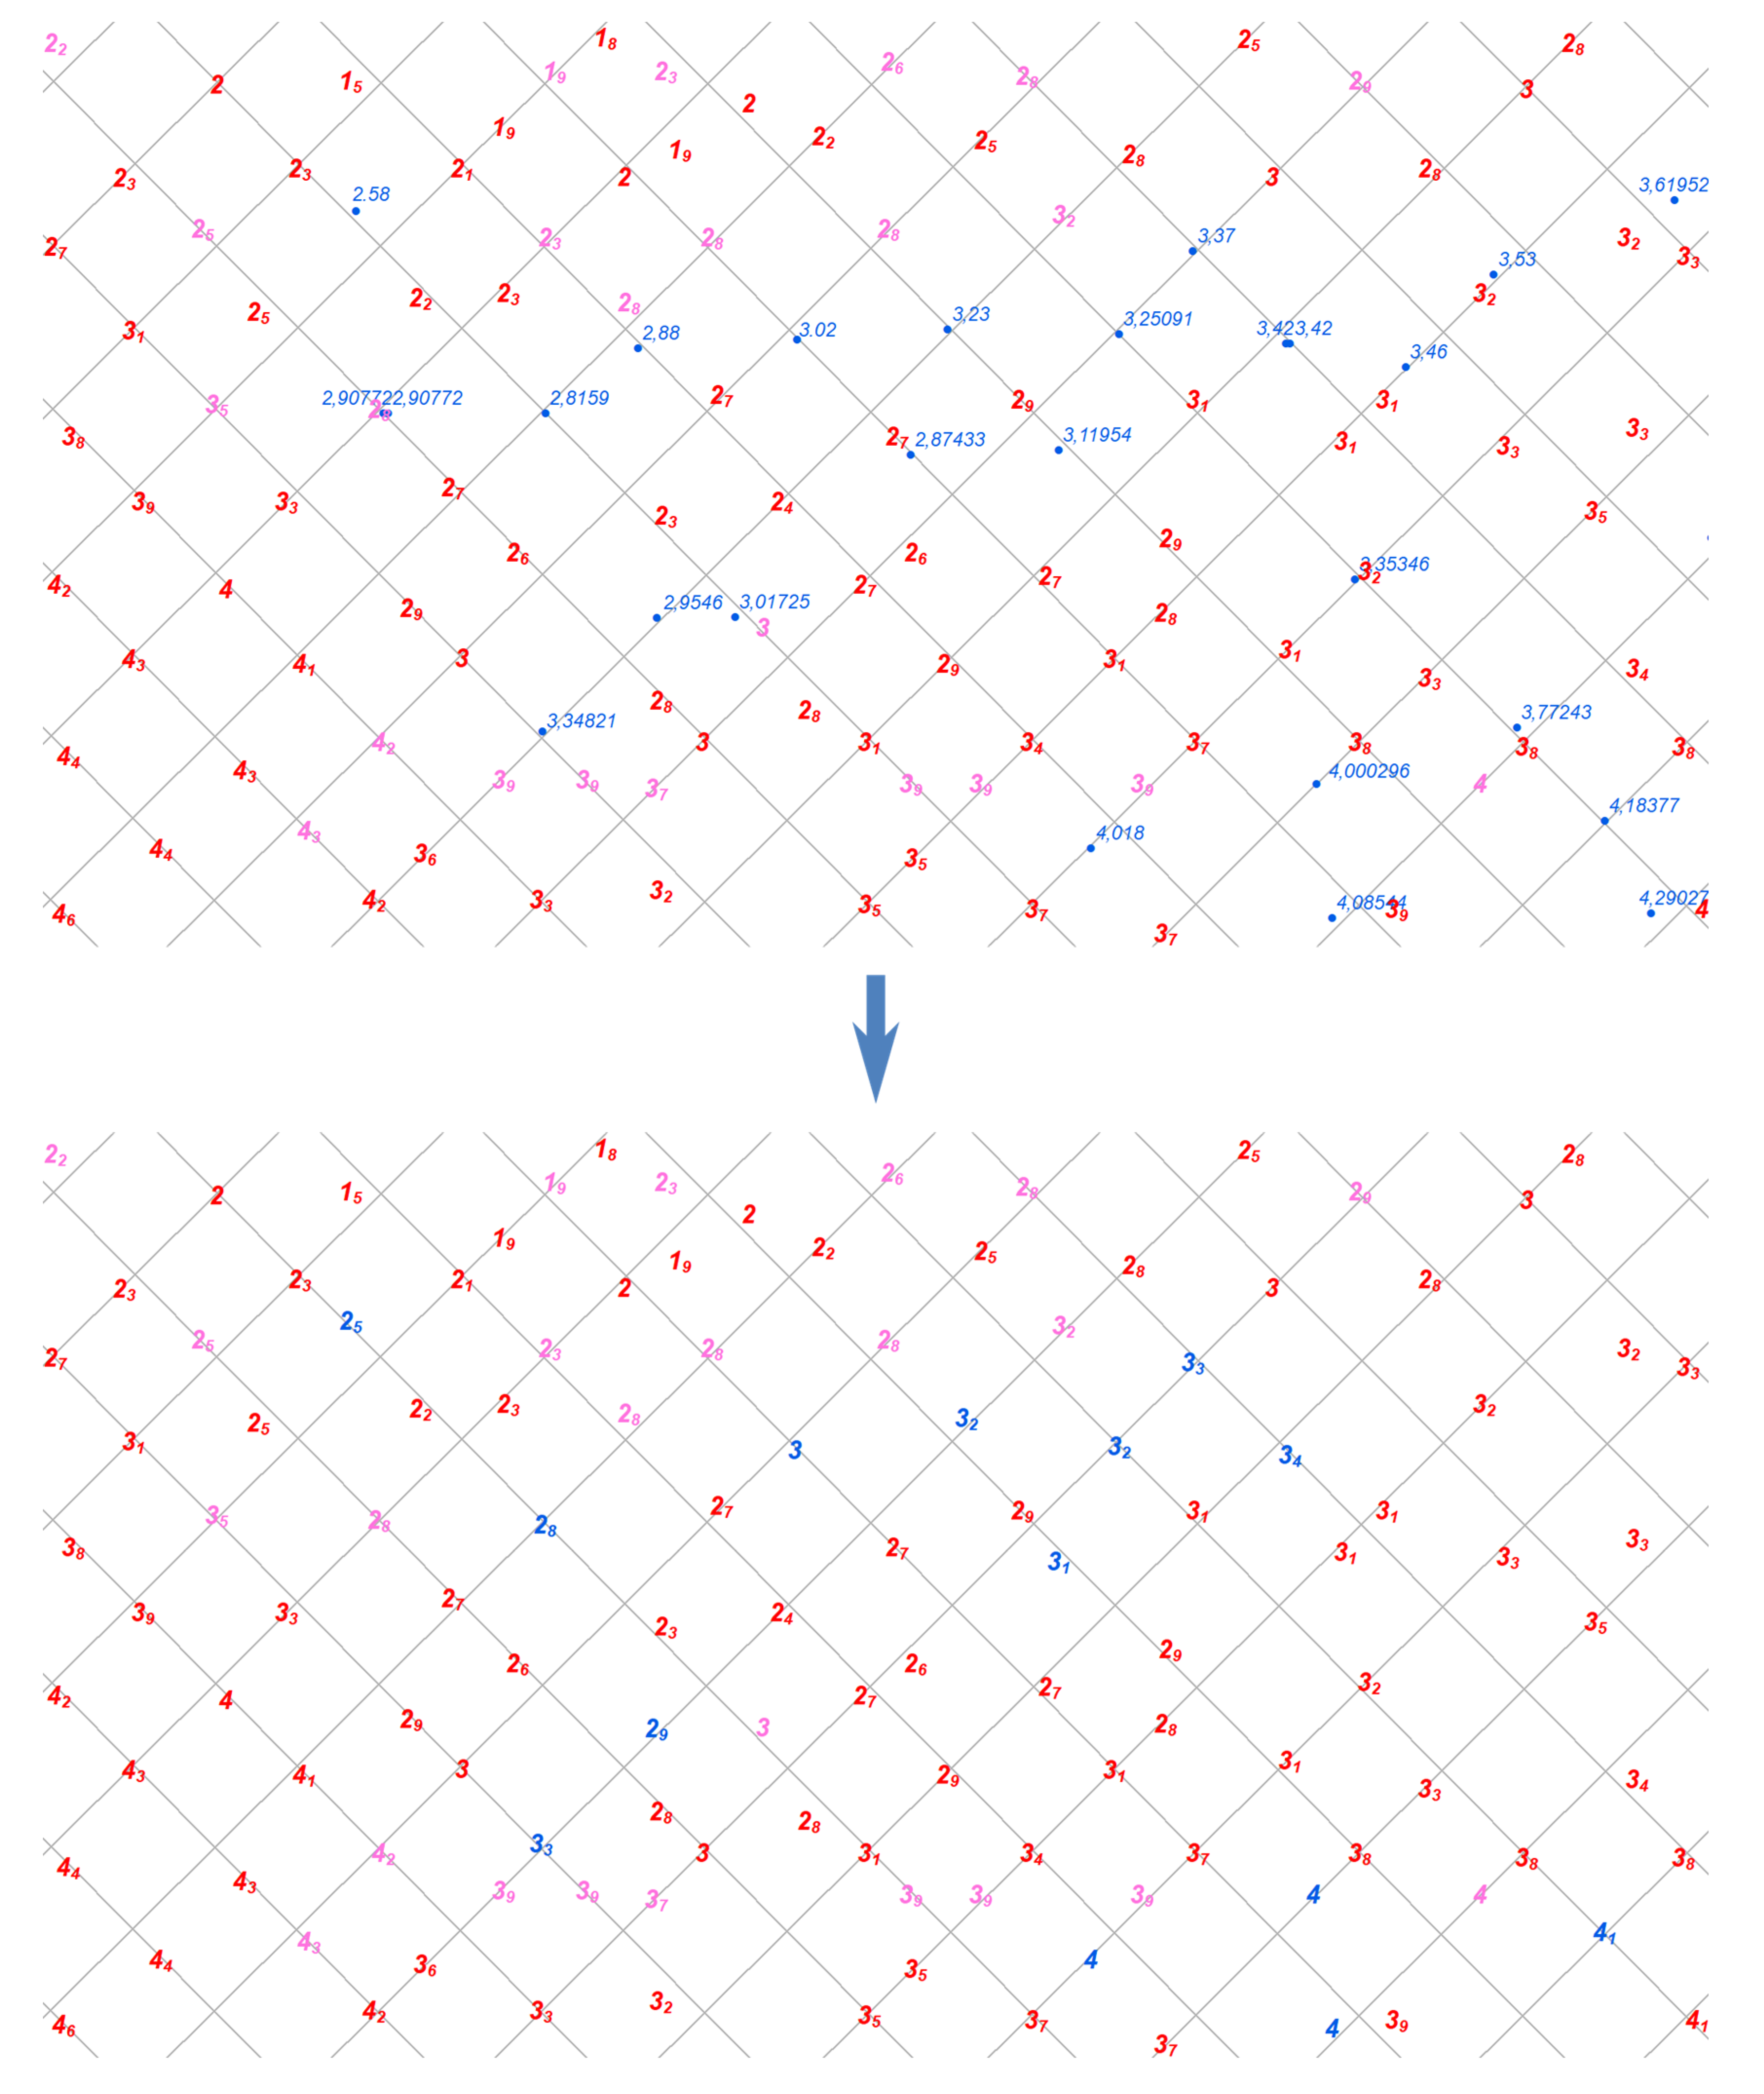
3.2.3. Background Soundings

Background soundings for each fishnet cell target those fishnet cells that have no Prime soundings (i.e., no shoals or deeps with 20% difference). Deeps identified in the prepossessing stage are re-examined as potential candidates. From this subgroup, those soundings with distance larger than R from the Prime soundings are selected. Then, the sounding located closer to the cell centre is selected for each fishnet cell. In the resulting subgroup, adjacency is checked anew in two stages:
  • Selection of those with distance between them longer than (or equal to) R;
  • Selection of those with distance between them smaller than R. Soundings are grouped in clusters of 2, 3 or more, based on distances between them and their relative position. For each cluster, the deepest one is selected. This process results to a subgroup of deeps with distances between them greater than (or equal to) R.
The study result for the Background soundings (Figure 4) is the union of the soundings selected in each of the two stages of the adjacency check.

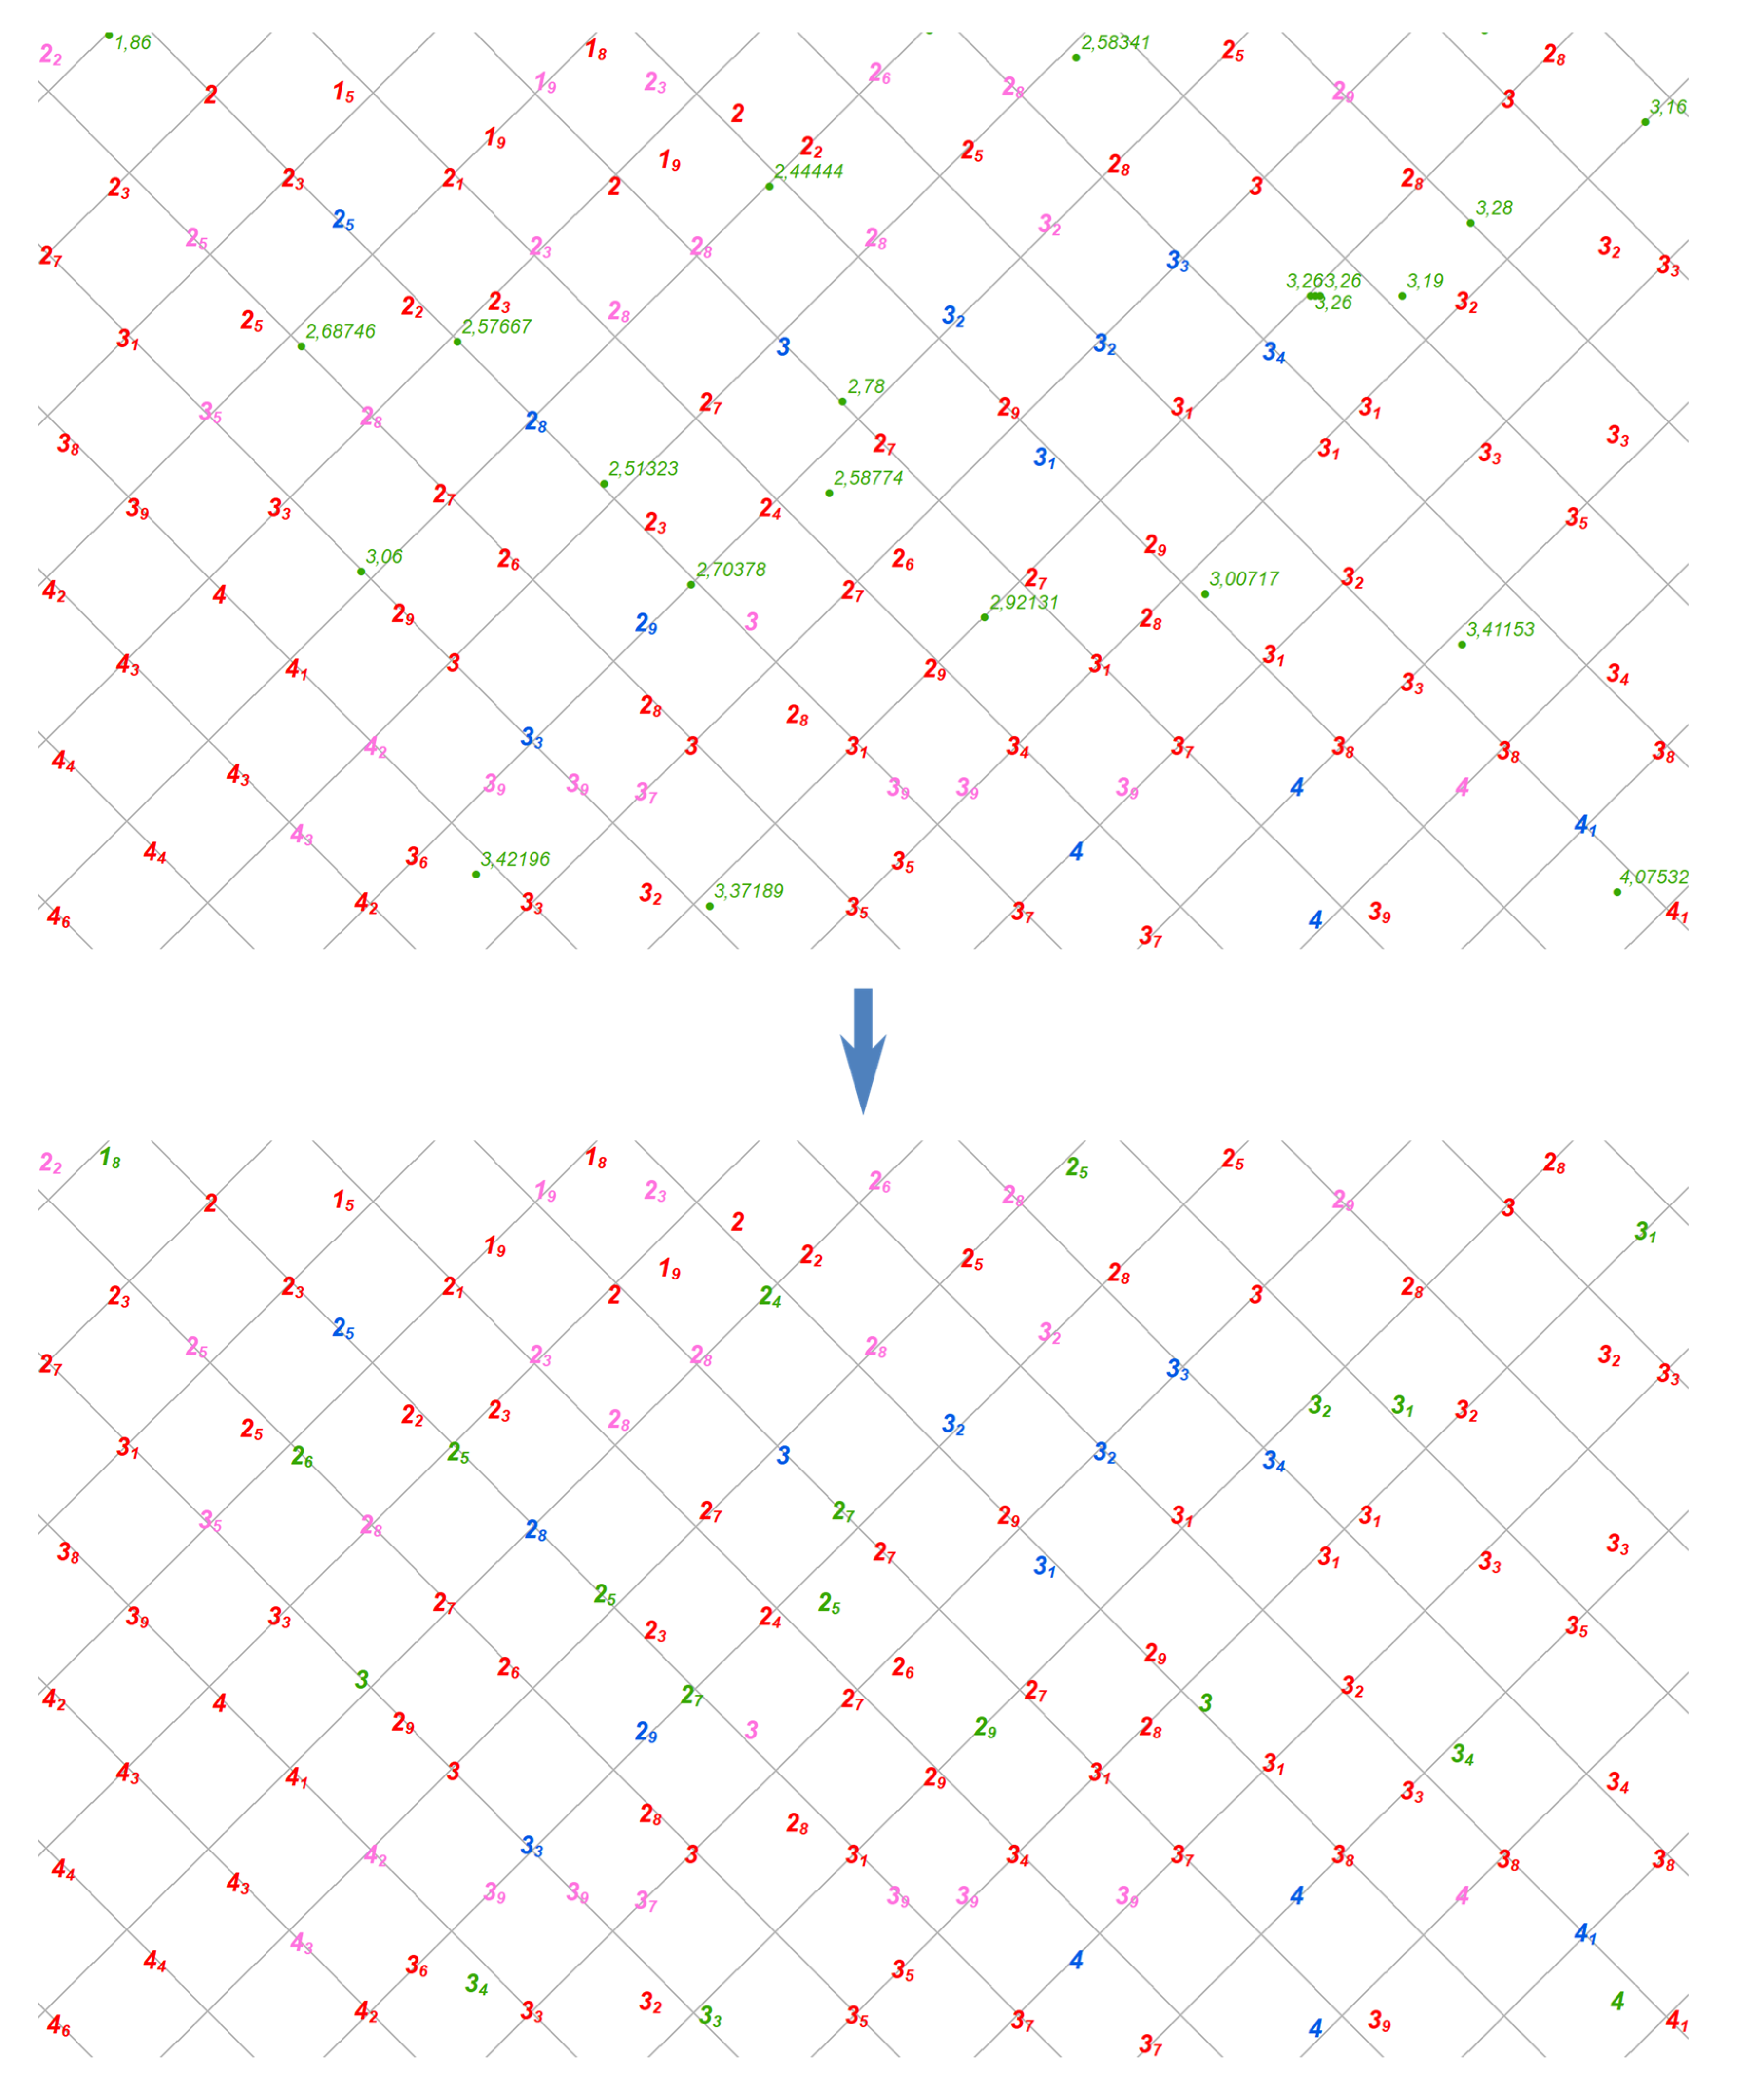
3.2.4. Fill Soundings

For those fishnet cells that are still empty after the identification of the Prime soundings and the Background ones, Fill soundings are retrieved from the remaining ones, which are considered as a new subgroup. From this subgroup, the shallowest and the deepest are selected for each fishnet cell. If more than one shoal exists, the one located closer to the fishnet’s cell center is selected. Finally, the resulting soundings are checked for adjacency and the final shoal subgroup is formed (Figure 5). Deeps selected in the first phase of this stage are compared to the final shoal subgroup, and those located closer than R are deleted. From the resulting deep subgroup, the ones located closer to the cell center are selected (in case of multiple occurrences per fishnet cell) (Figure 6). Shoals and deeps selected in this stage constitute the Fill Soundings group.

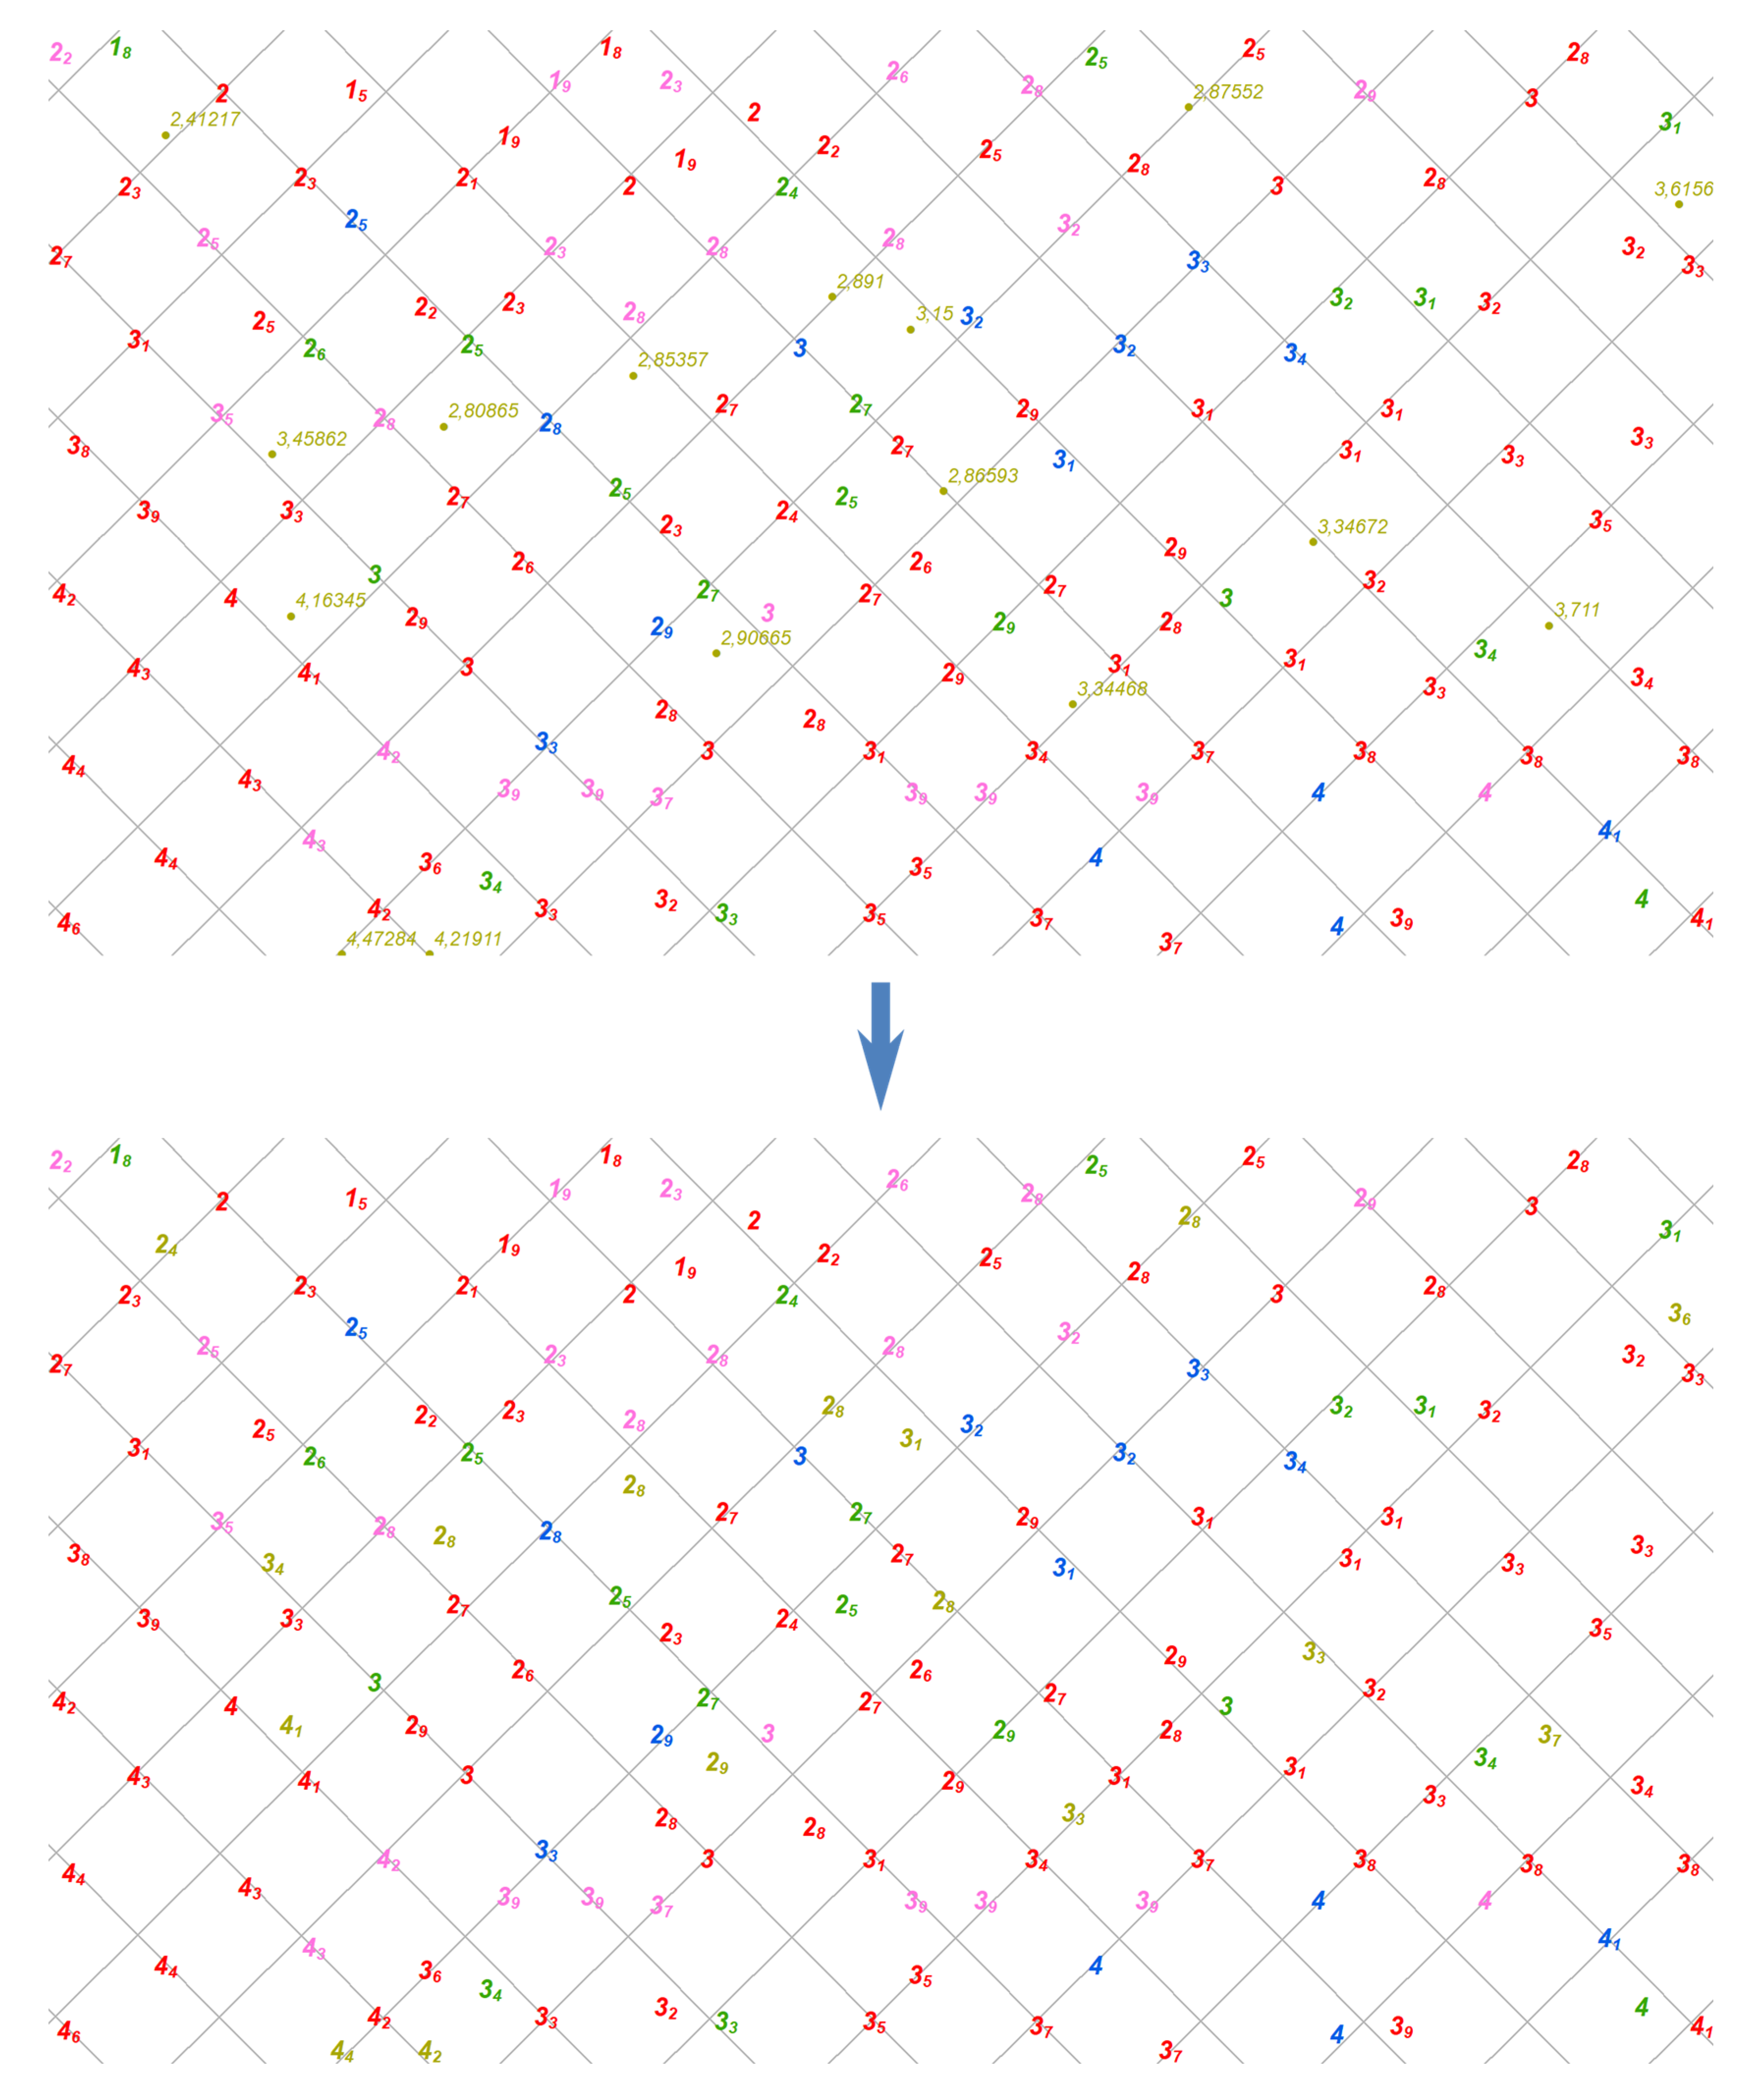
3.2.5. Morphology Related Soundings

A detailed soundings data set is derived from the original measurements extracted from the DTM through generalization at scale 1:10 K. This dataset satisfies the legibility constraint (minimum distance between soundings) and the safety constraint (selected shoals, deeps with specific depth value difference from the shoals, fill soundings, etc.) for this particular scale based on the selection criteria adopted. Due to the high density of the selected soundings at the 1:10 K scale, the morphology constraint is satisfied as well, that is the overall morphology of the seabed is portrayed clearly and characteristic features are preserved. For the smaller scales this is evaluated through comparison with the content of the immediate larger scale. When moving to a smaller scale, e.g., 1:20 K, additional information may be needed to satisfy the morphology requirement. Morphology cannot always be described by depths only. This is because depths—as point features—lack the continuity property, which is indispensable to reveal characteristic structures (morphology) of the seabed. Only the experienced cartographer can recognize morphology from depths utilizing complicate spatial recognition mechanisms inherent in the human brain.
As a result, depth contours extracted from the DTM and generalized to the chart compilation scale are used as a supporting structure capable to describe the morphology of the seabed. In particular closed depth contours, indicating local maxima and minima (pits and peaks) can be used to identify morphology related soundings. These soundings are indispensable for the description of the seabed fulfilling the morphology constraint. A number of researchers [9,10] realize the need for inclusion of soundings inside closed depth contours as a major constraint. As a result, if these soundings have not been selected through the aforementioned generalization process, they must be added to the soundings list in order to fulfil the morphology requirement. For example, a sounding with depth value 0.1 m (Figure 7—blue colour) is selected as the shallowest in the fishnet cell under examination. Additionally, the sounding with depth value 0.5 m should also be portrayed because of the 2 m depth contour, as a local minimum (peak). It cannot be selected by the information provided solely by the soundings values as it is neither the shallowest nor the deepest. However, it is a local peak and this information—that is related to morphology in the area—can be only provided by the depth contours.
The inclusion of these soundings may change the initial selection due to the minimum distance restriction. Therefore, soundings from other groups may be omitted in favour of depicting morphology related soundings.
The above described methodology for soundings generalization is summarized in Figure 8.

4. Results—Case Study

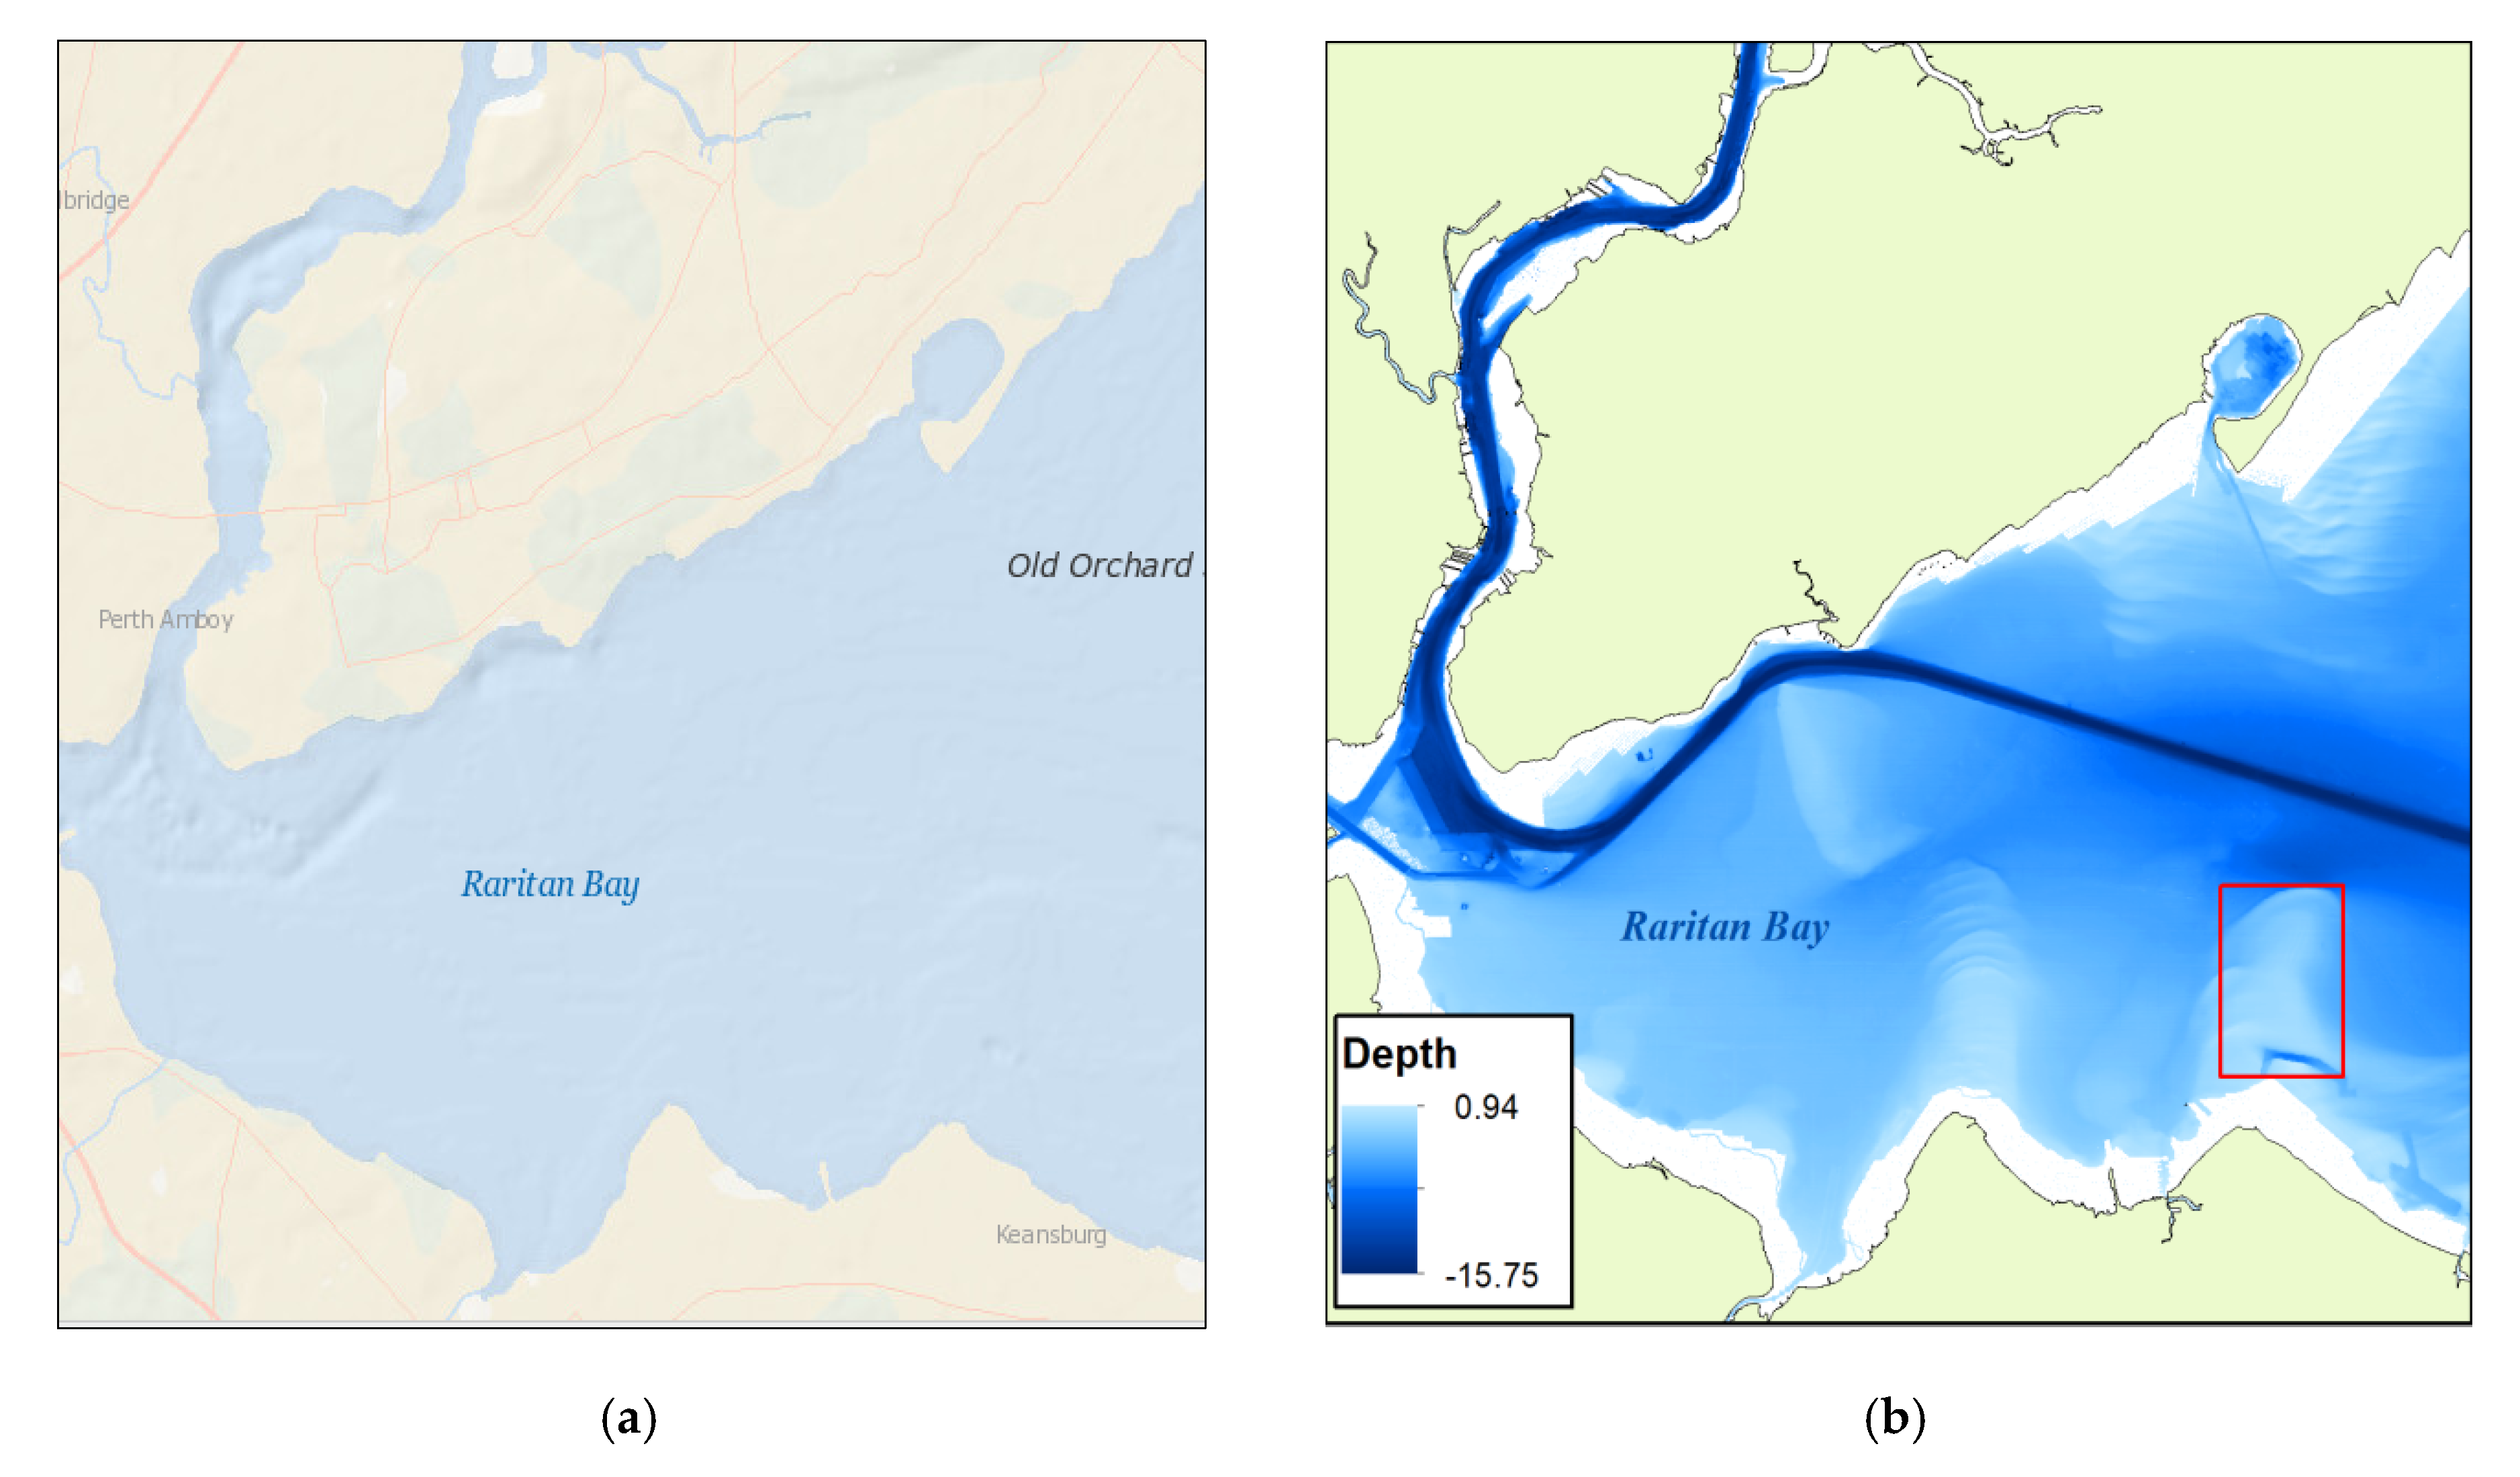
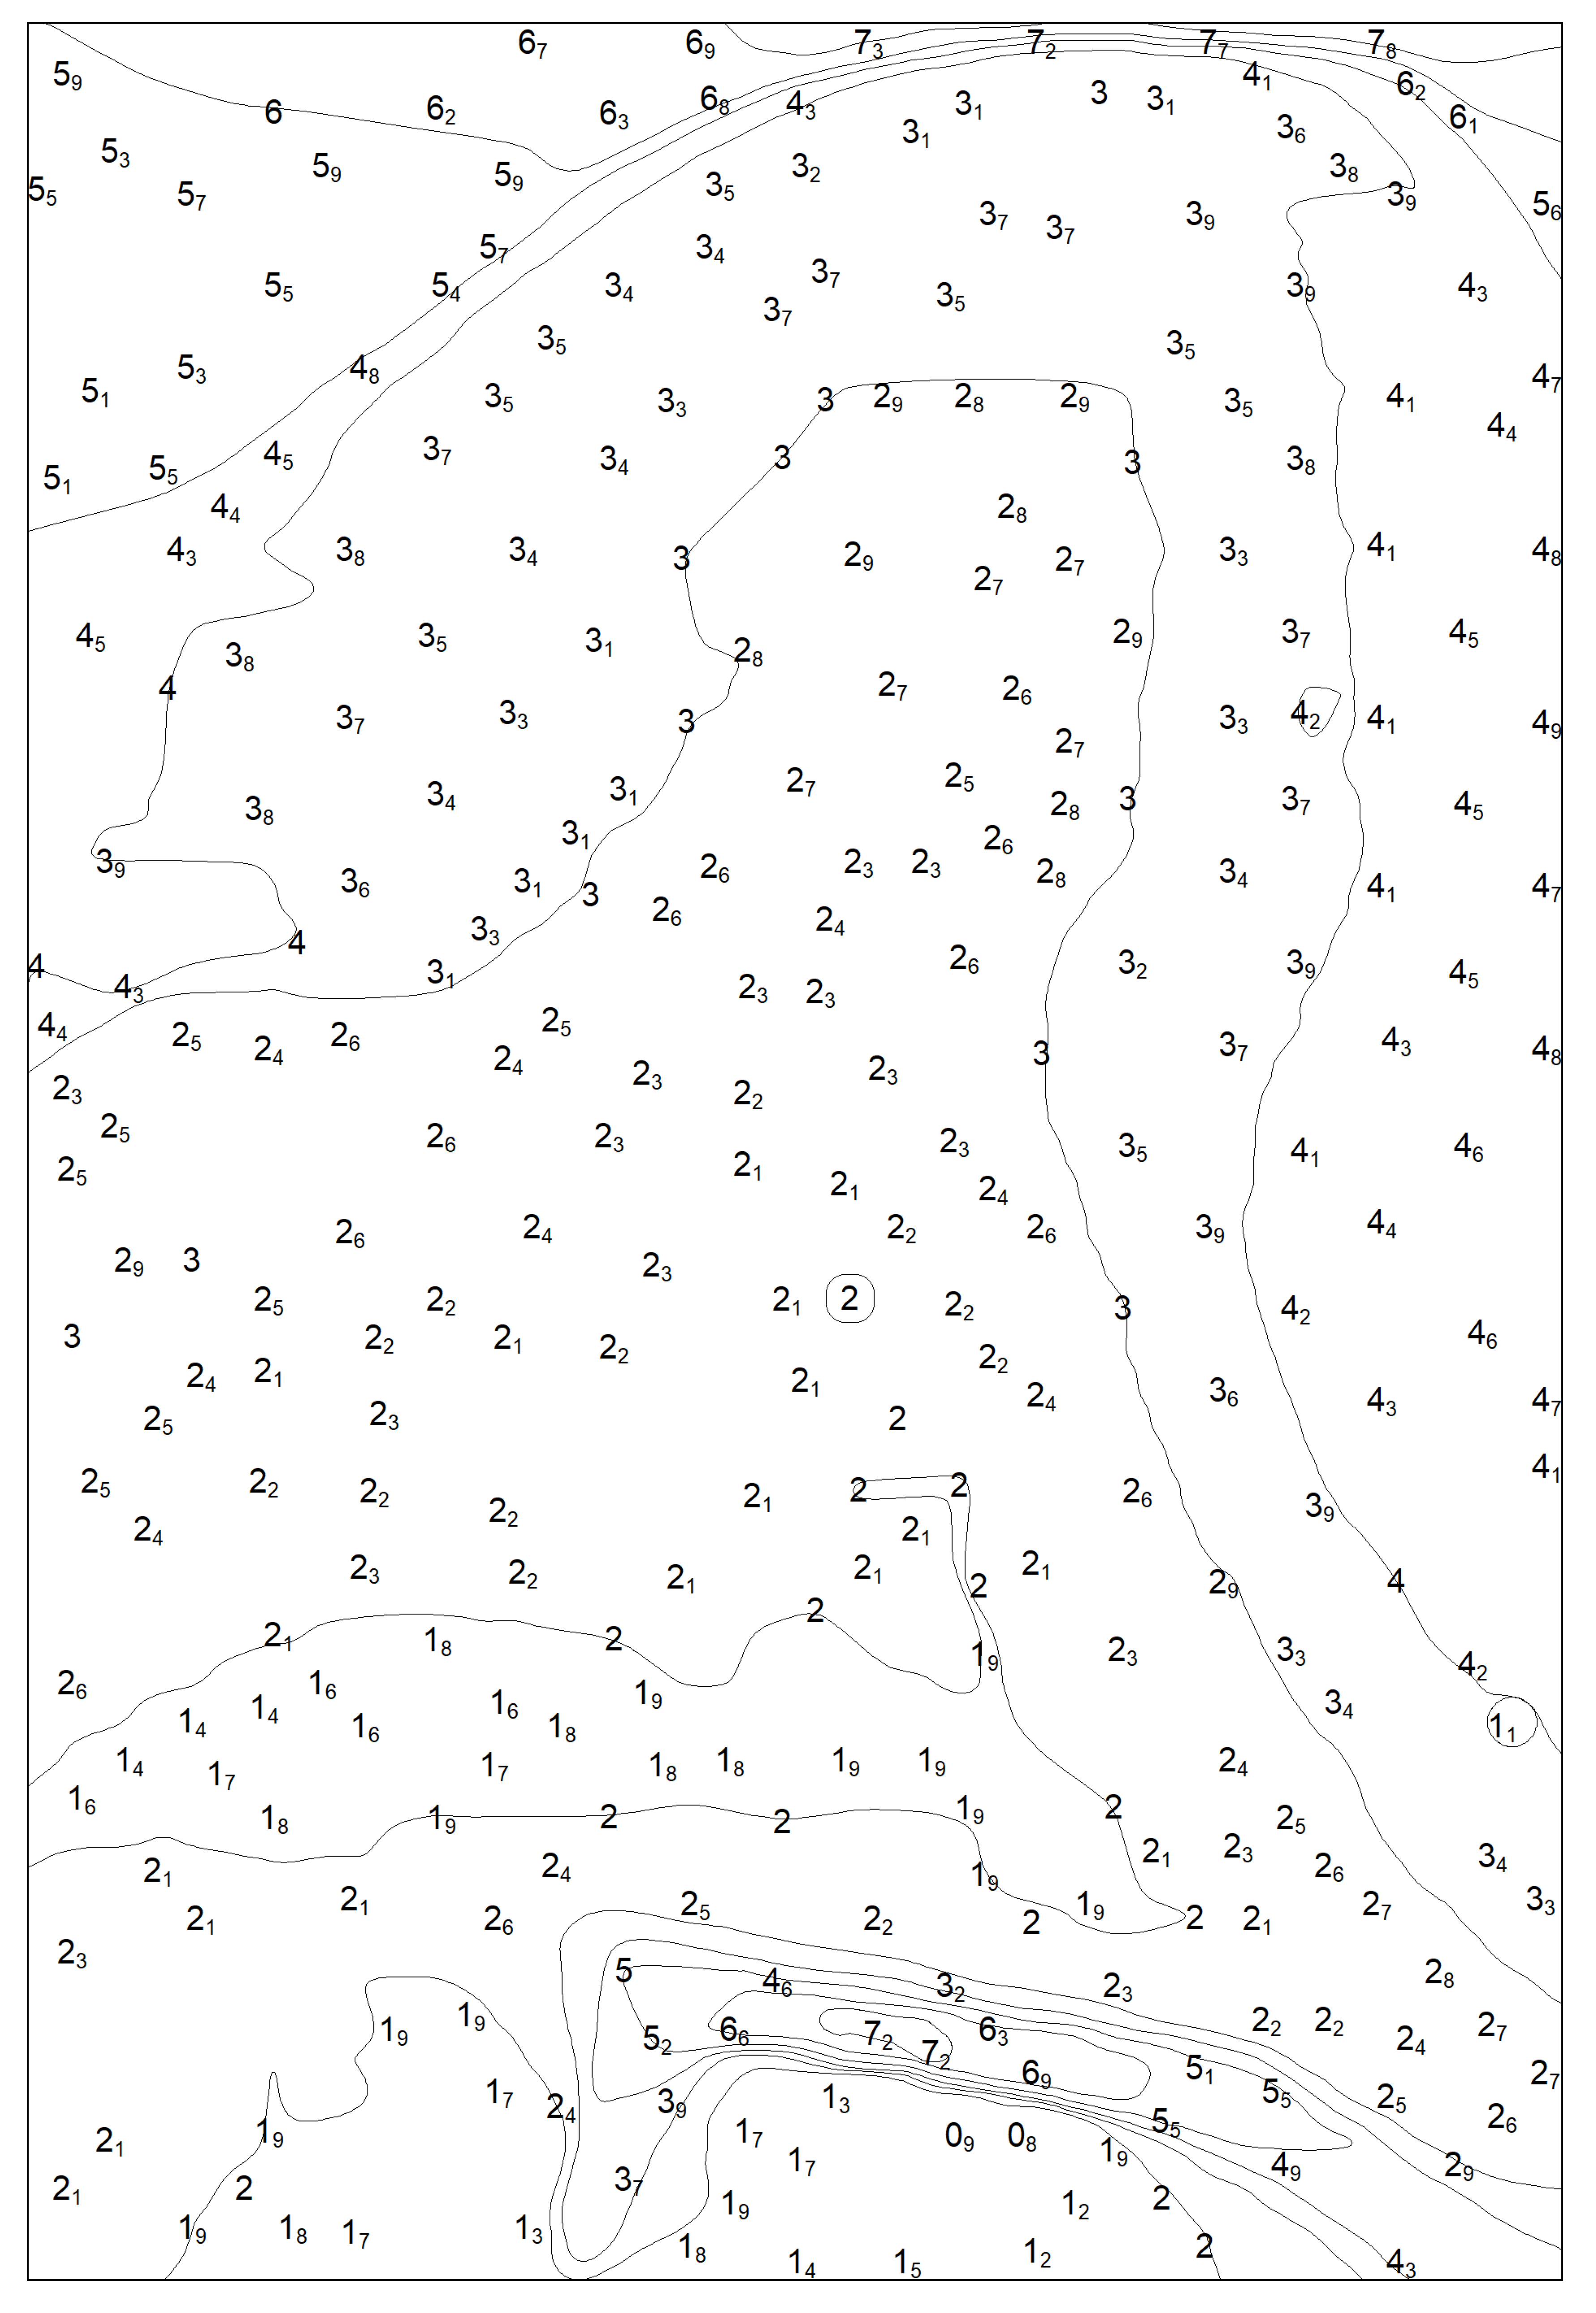
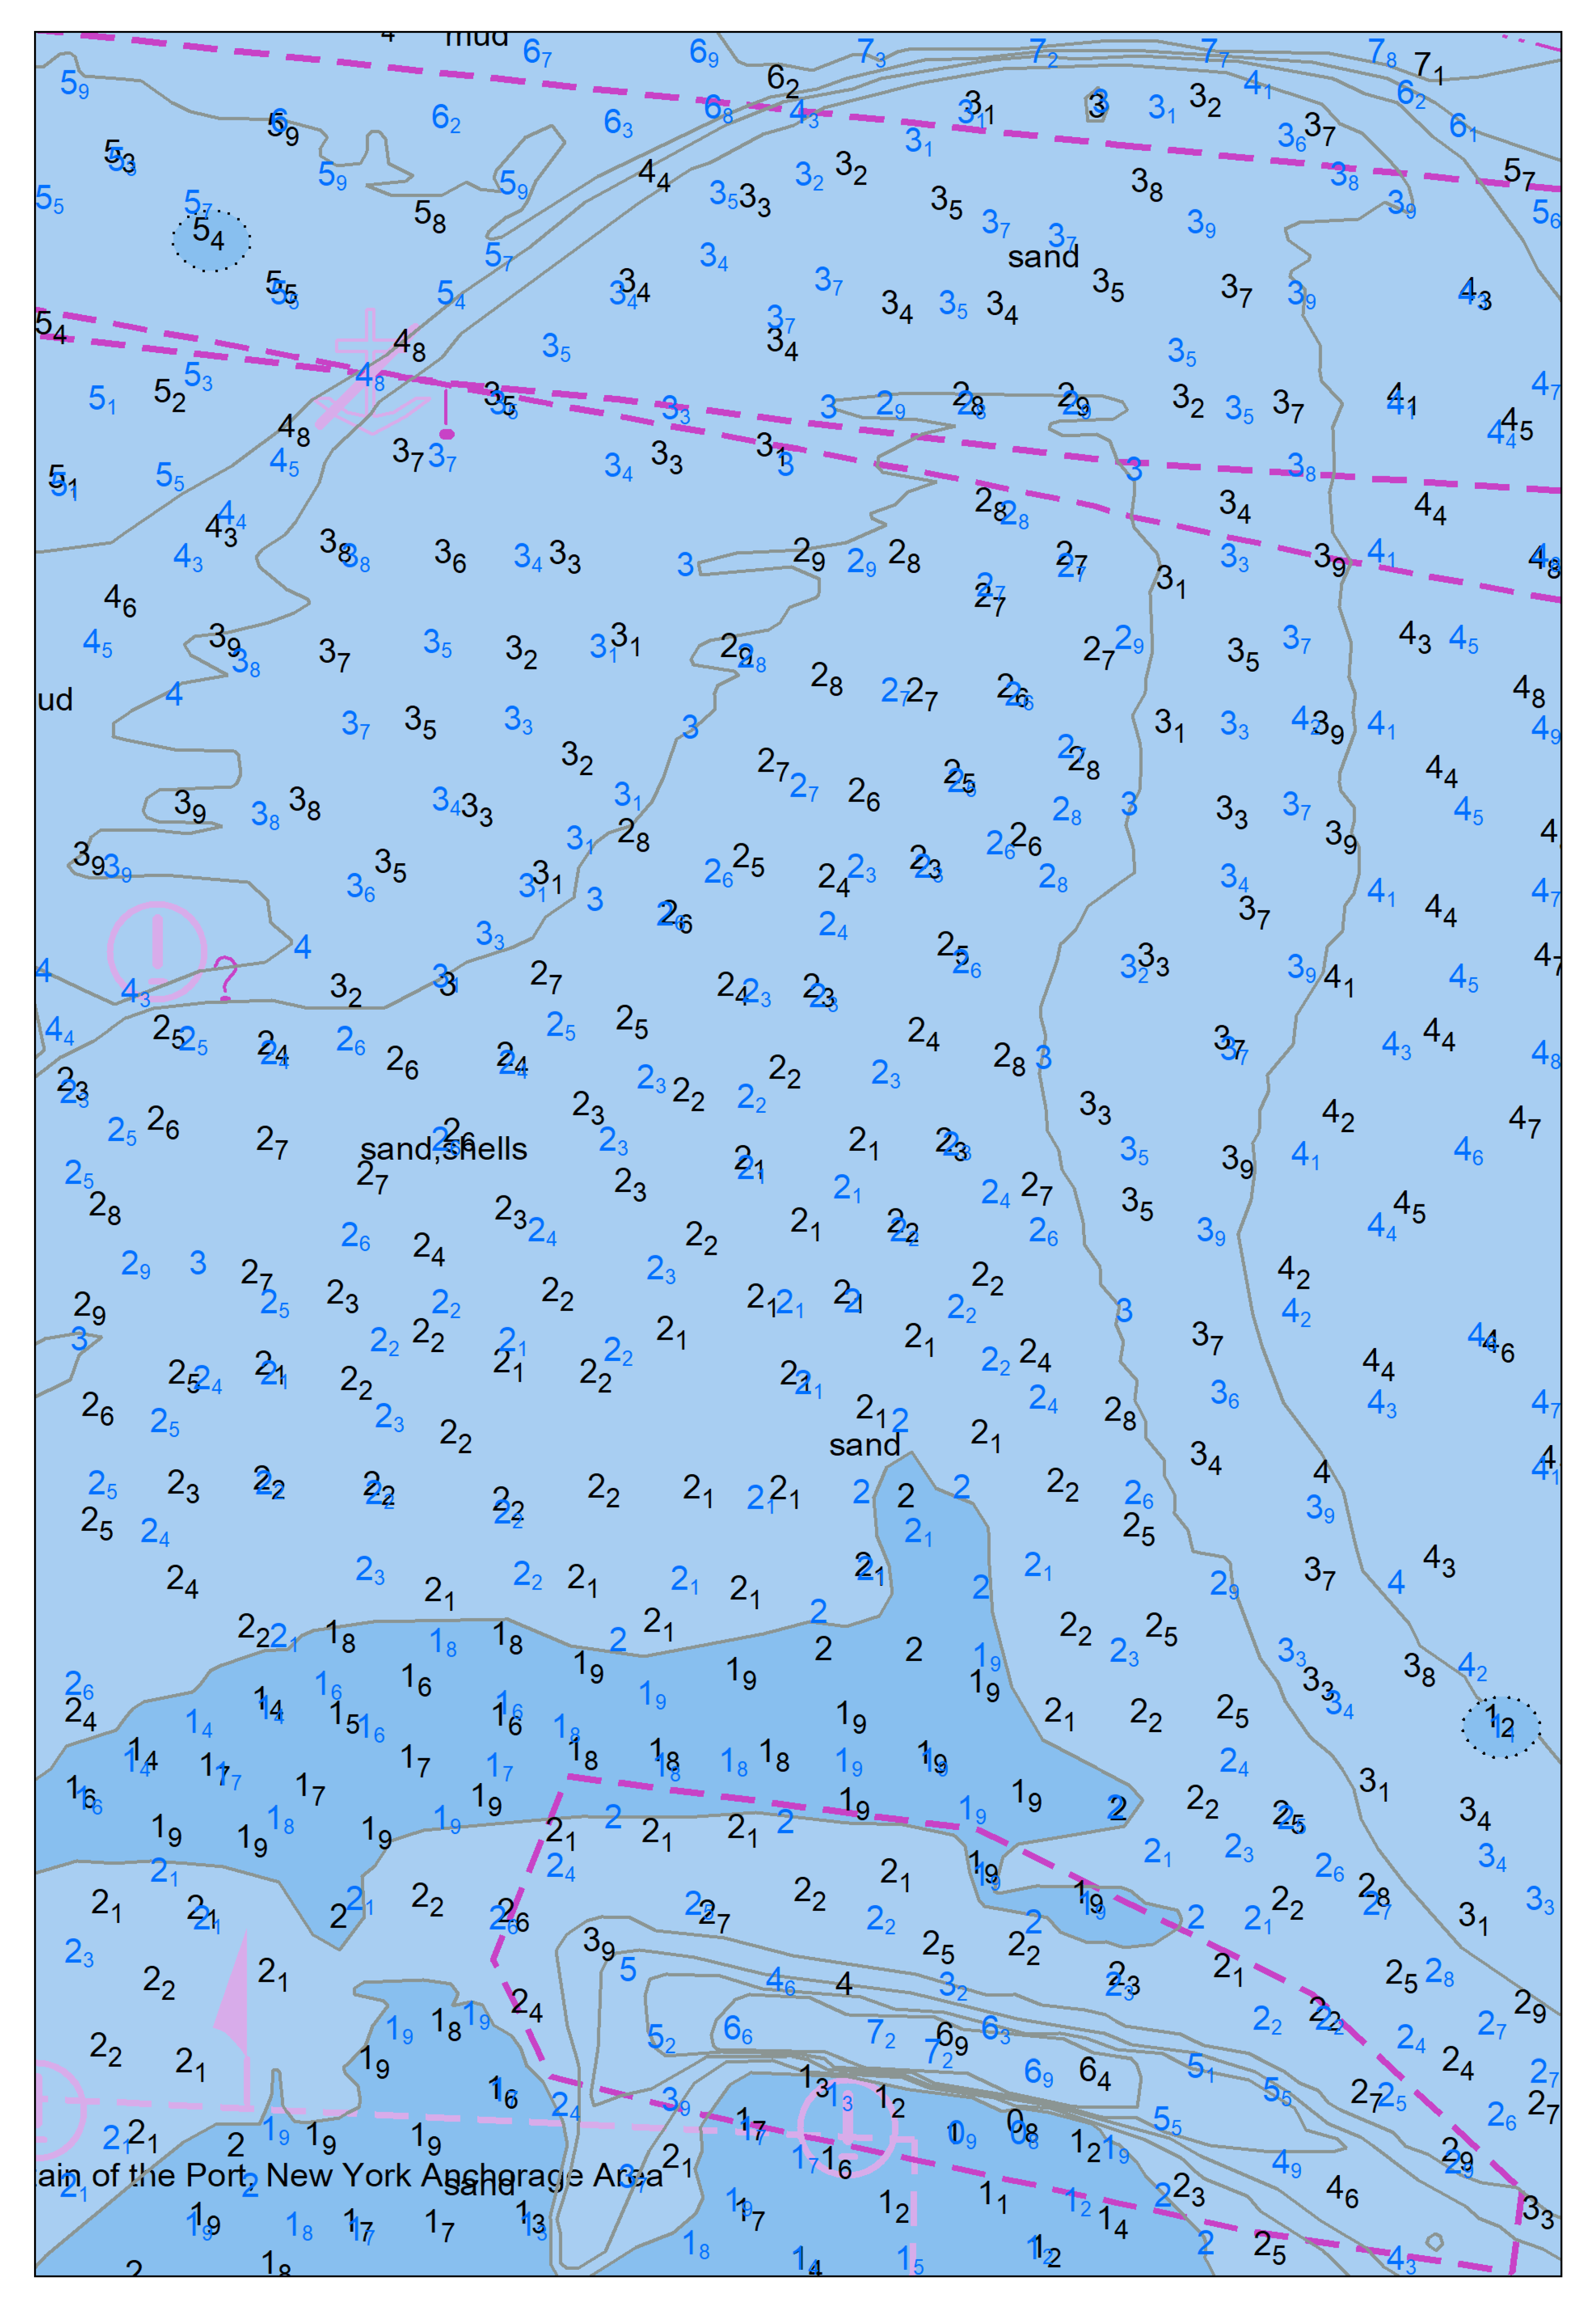
4.1. Study Area and Source Data

The study area for the aforementioned sounding selection procedure was the Raritan Bay area. Raritan Bay (Figure 9a) is a bay located at the southern portion of Lower New York Bay between the states of New York and New Jersey and is part of the New York Bight [20]. Bathymetric data of the bottom were generated from NOAA’s National Bathymetry Source [21] at a 5 m resolution DTM in bathymetry attributed grid (BAG) format over a 110 km2 area (Figure 9b). The depth range of the bathymetry dataset is between 0.94 m above mean lower low water (MLLW) to 15.75 m below MLLW. It is important to note, that the depths in the DTM were not interpolated and contain gaps between some of the survey lines and between the hydrographic survey to the shoreline.

4.2. Implementation

The sounding selection procedure is implemented in ArcGIS utilizing the geo-processing tools available therein along with specially developed customized routines. Key geo-processing tools include:
  • A rhomboidal fishnet with the appropriate cell size is created for each scale and depth area(s);
  • Soundings statistics are calculated for each fishnet cell;
  • Topological relations between soundings and the fishnet are assessed;
  • Adjacency relations and distance between soundings are also computed;
  • Soundings management and subgroup selection is carried out.
In the Raritan Bay area, depths can be divided in two depth range areas 0–10 m and >10 m. A different sounding density setting for generalization of soundings was applied for each of the two depth ranges and included four stages. This hierarchy was used in order to produce charts at the following scales: 1:10 K from the DTM, scale 1:20 K from soundings at scale 1:10 K, scale 1:40 K from soundings at scale 1:20 K and scale 1:80 K from soundings at scale 1:40 K.
Figure 10, Figure 11 and Figure 12 show extracts of the soundings generalization results from charts covering the study area at 10 K, 20 K, 40 K and 80 K scales. Depth contours are portrayed according to NOAA specifications for each of the four scales.
Generalization of soundings from the initial data set extracted from the DTM at the 1:10 K scale and up to the 1:80 K scale, led to the gradual decrease of the number of soundings (Table 4). Approximately 30% of the soundings from larger scale to smaller scale are preserved without cluttering the chart.
The results are considered as being very good with respect to the portrayal requirements of the sea bottom at these scales and according to the adopted specifications. A careful examination of the study results concluded that there are no inconsistencies between the soundings and the depth contours, i.e., a sounding depth value outside of the depth area defined by the depth contours. Furthermore, the charts produced show a very good correlation with NOAA ENCs US5NYCBC, US5NYCBE, US5NYCBD, US5NYCAC, US5NYCAD and US5NYCAE. In Figure 13, soundings at 1:10 K scale shown in Figure 10 are overlaid on an extract from ENC US5NYCAE. There is a great similarity between the two datasets. The main visible difference is that the computerized results of the study lead to a more systematic and homogeneous sounding pattern. This differentiation is attributed to soundings selection application of the generalization rules in Section 3.2, whereas the manual process is more subjective with respect to the location of the selected soundings. The proposed procedure is based on IHO standards and best practices that guide manual selection. Any discrepancies identified are due to different data sources used for the compilation of the ENCs that were not made available to us.

5. Discussion

The study results show several benefits using the proposed soundings generalization procedure. They include:
  • Criteria and constraints: Soundings generalization procedure is based on IHO standards and NOAA’s best practices.
  • Soundings classification: The method selects a subset from the soundings at the largest scale product in order to portray Prime, Background, Fill, and Morphology soundings at smaller scales.
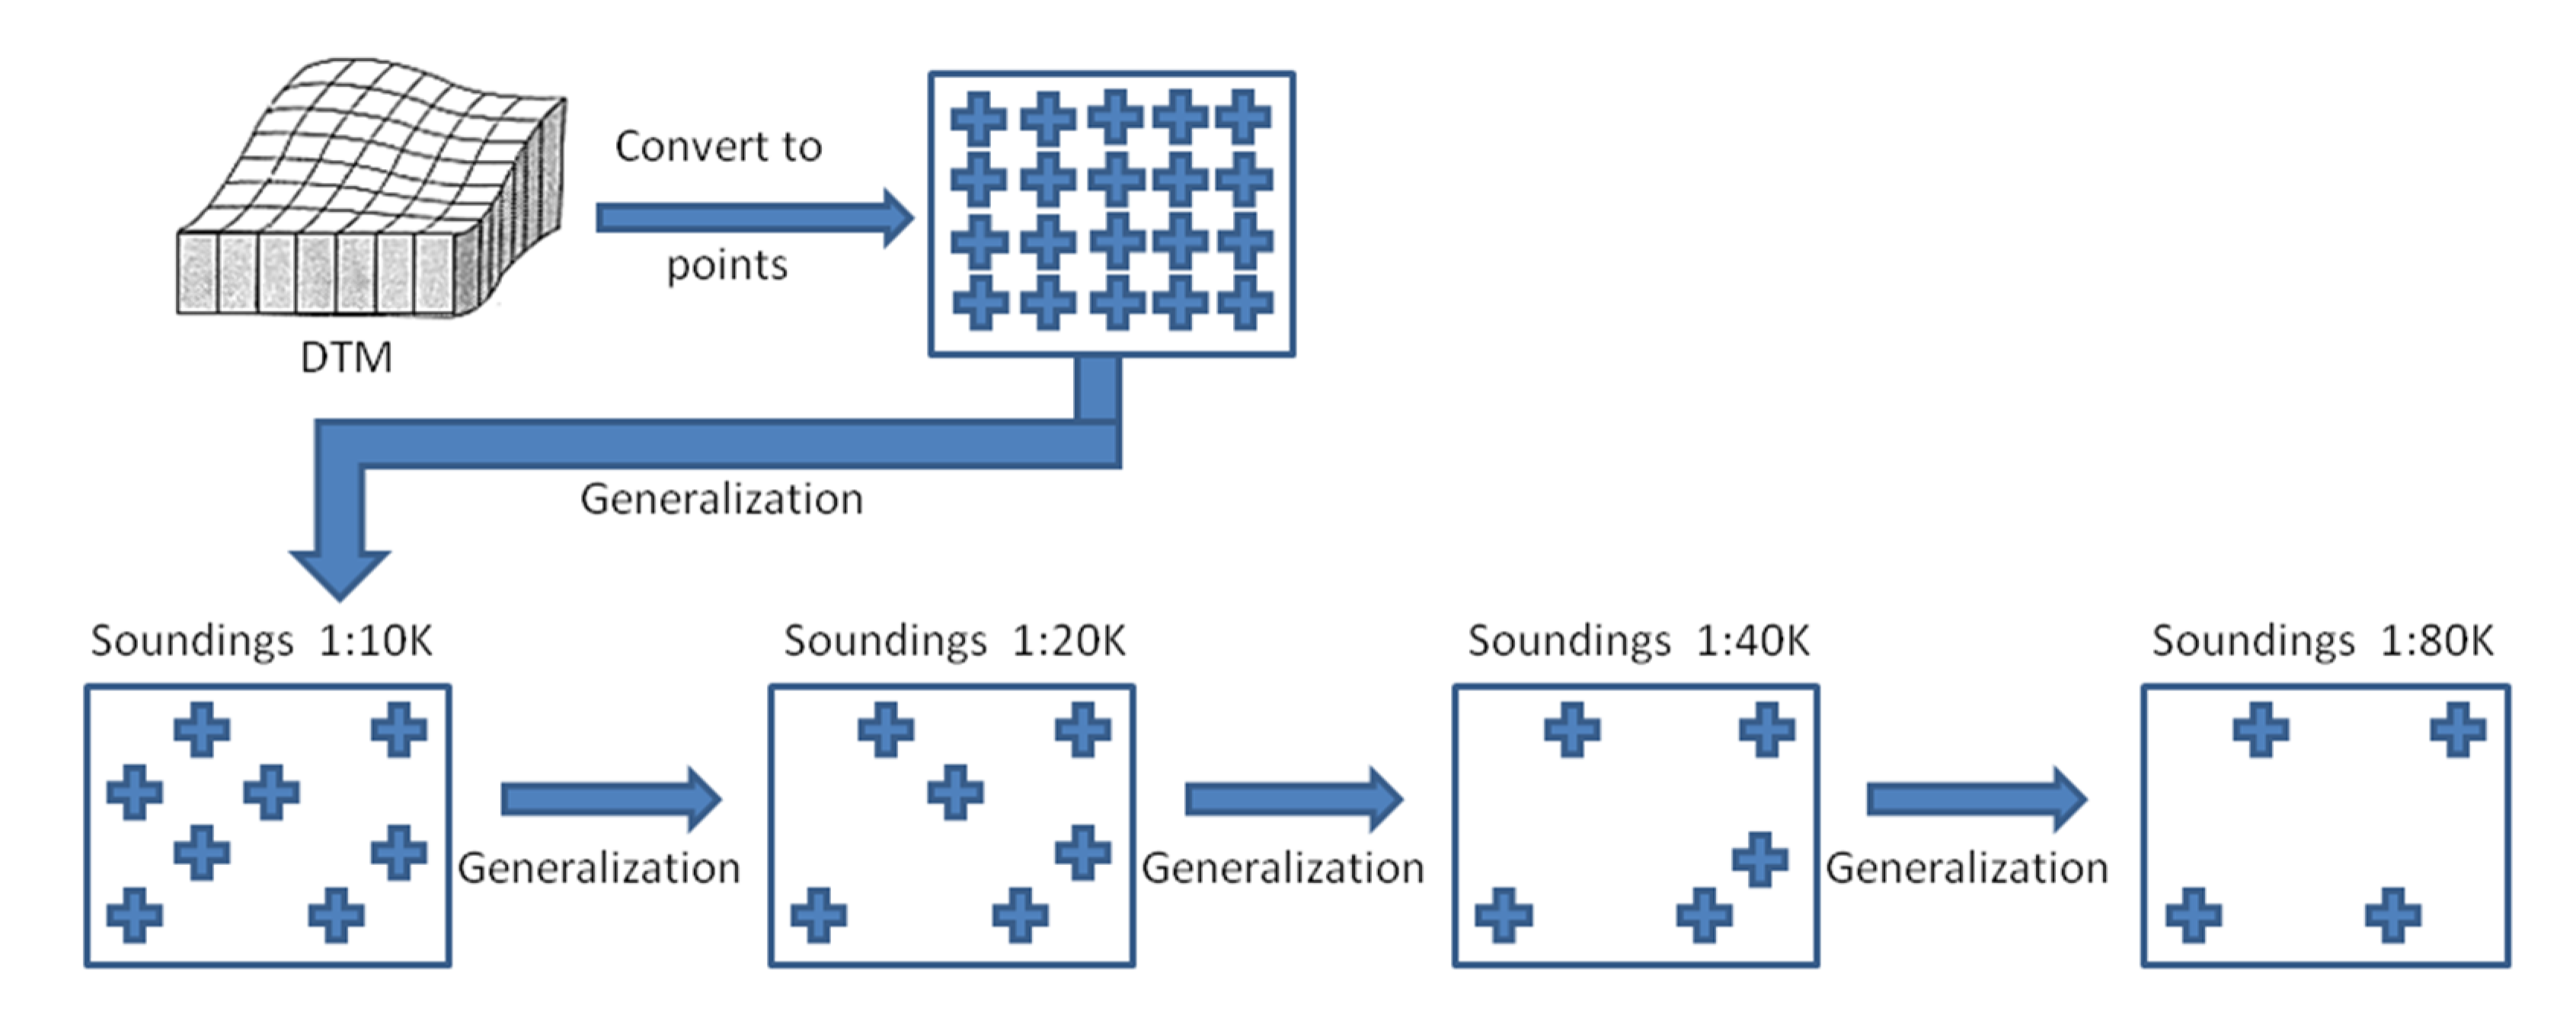
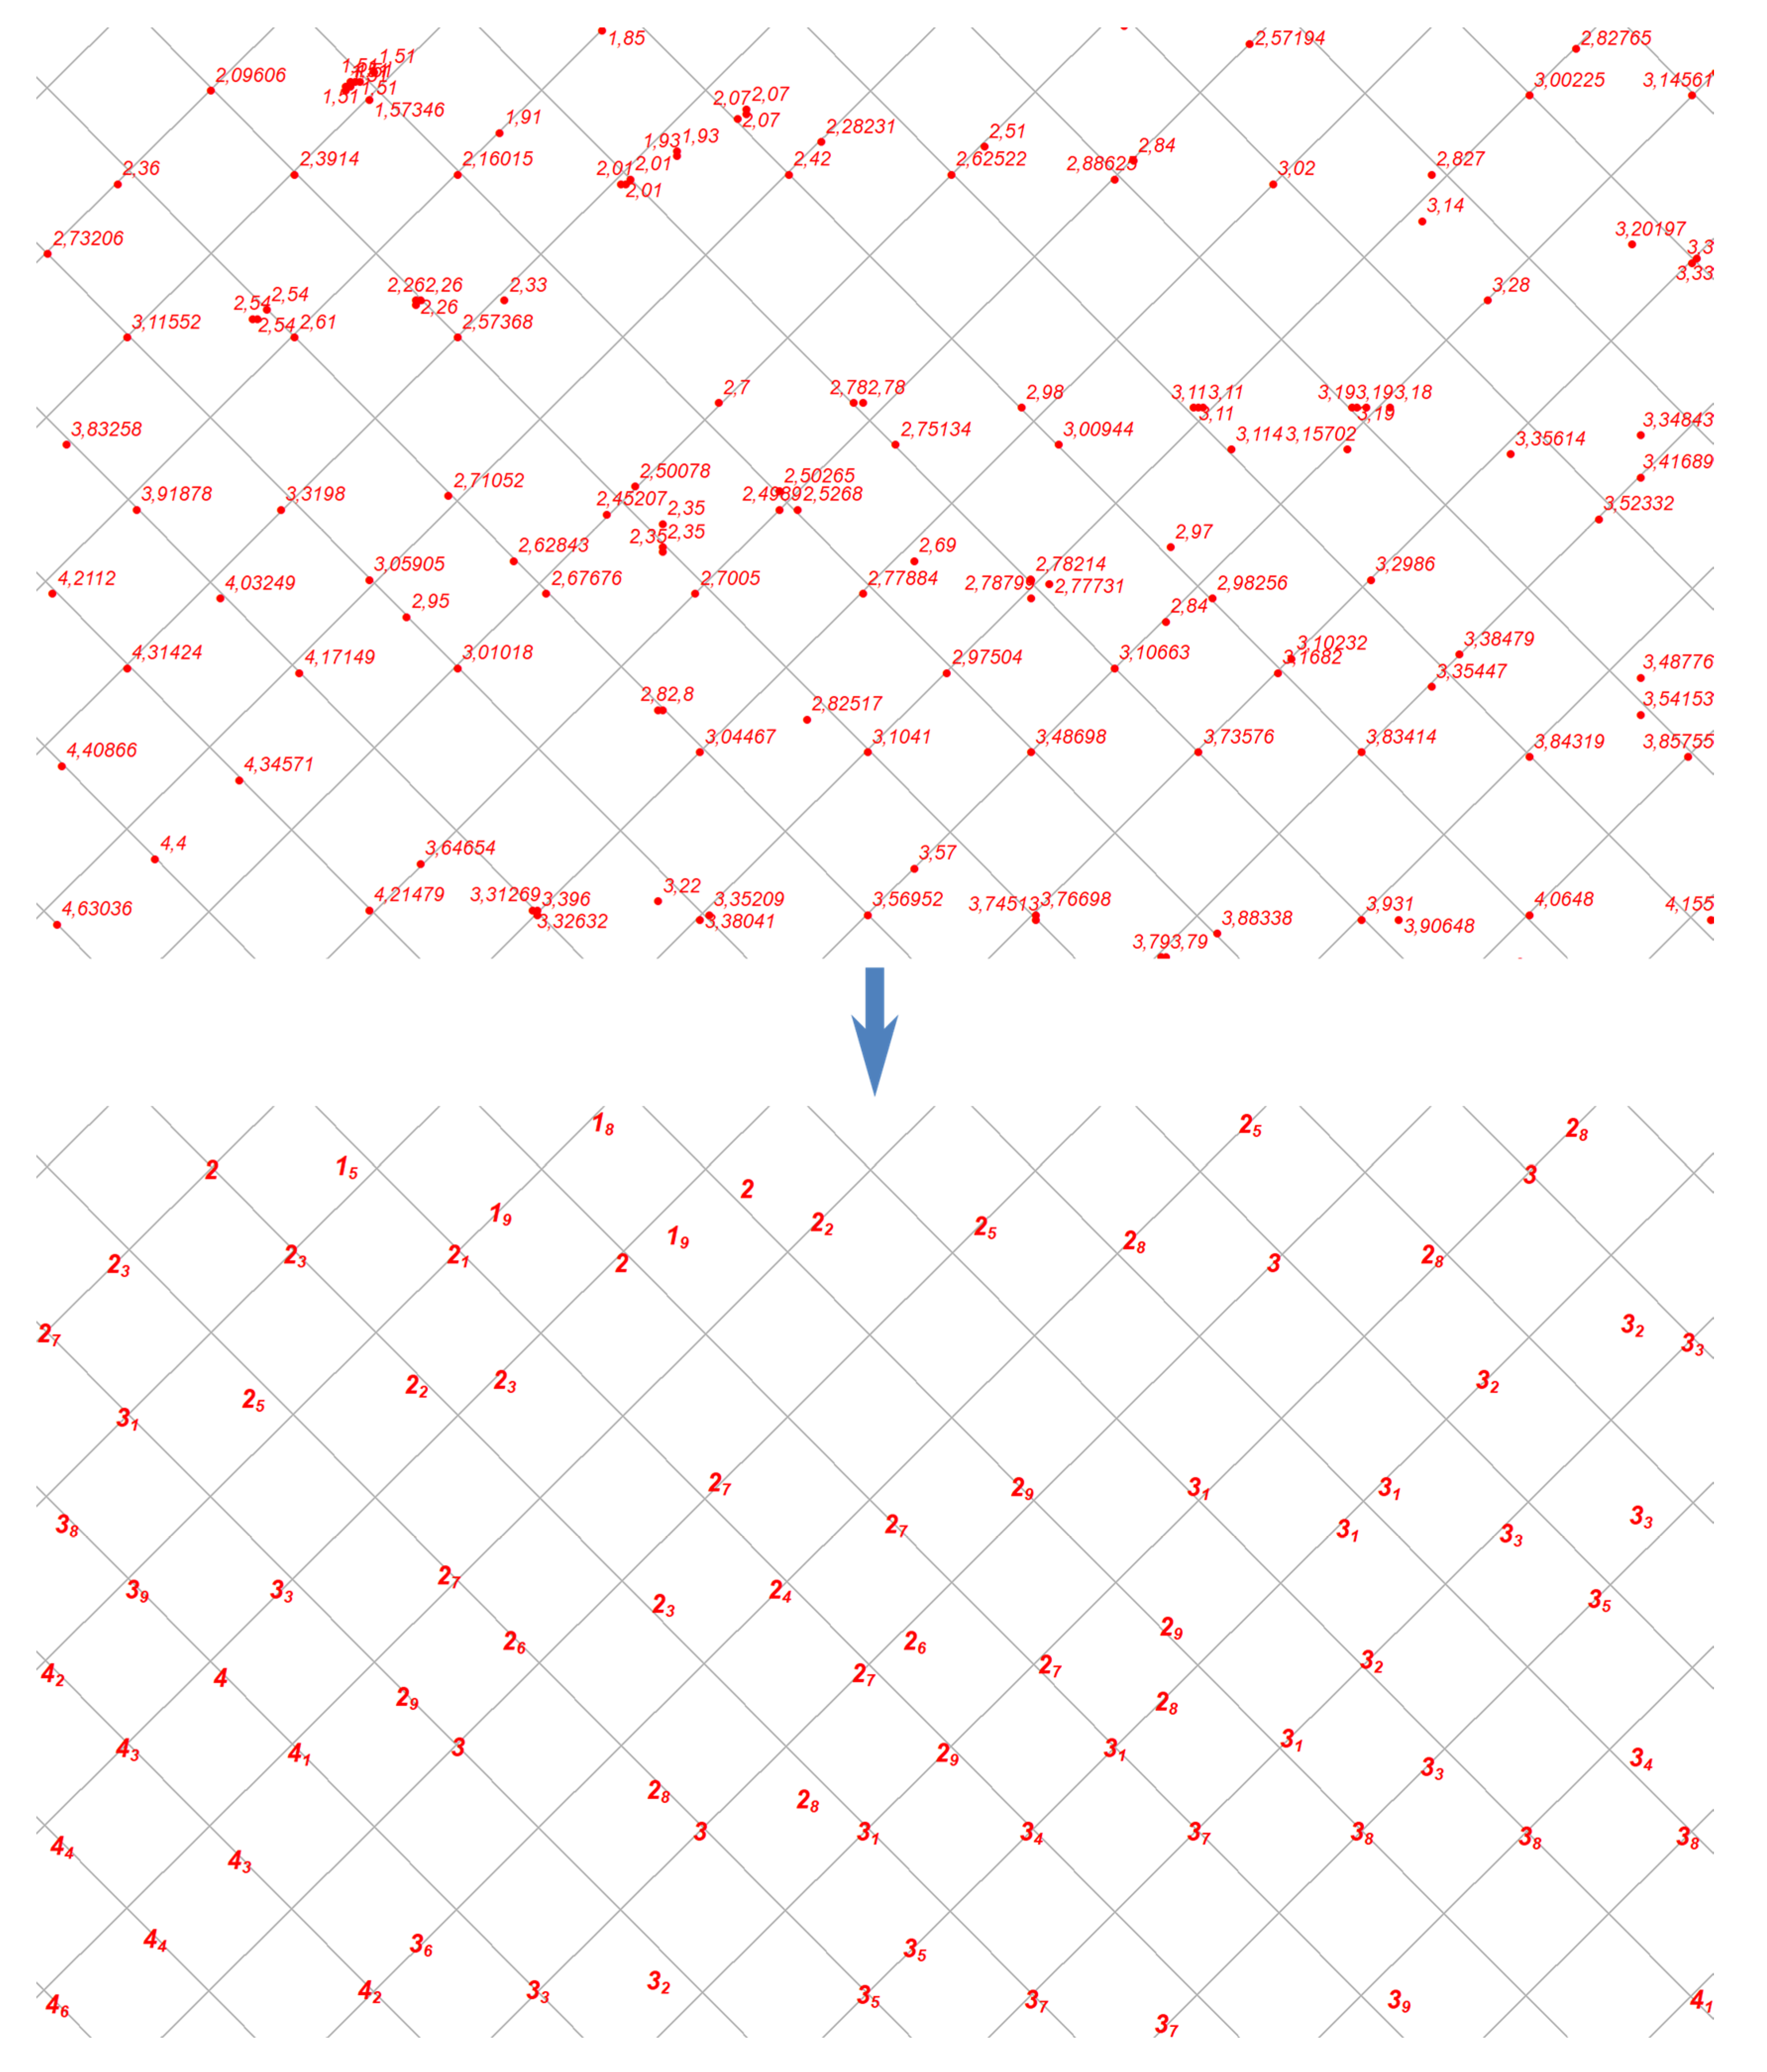
  • Source: Generalized soundings are typically derived from an elevation source (high-resolution DTM) dataset, or a larger scale chart. Each grid cell of the DTM is converted to a depth point and a generalized sounding dataset is selected at chart scale. The use of a continuous and high density dataset as a source, excludes the possibility of omission of soundings depicting significant seabed features. Moreover, a high resolution DTM is the result of any contemporary bathymetry collection method [21]. Therefore, it is important to adopt soundings generalization methods that can use a DTM as a source.
  • Soundings Pattern: The soundings selection method aims to achieve a rhomboidal pattern that is used as a reference for guiding the location of soundings that are candidates for selection. The rhombus cell size can be adjusted for density and location of the soundings with the rhombus size set by the cartographer.
  • Ladder approach: The method allows for the compilation of a number of charts at smaller scales based on the ladder approach. Thus, it is ensured that soundings portrayed at the smaller scales are portrayed as well at the larger ones.
  • Adjustable to scale and source: The method, as applied from the DTM depth points to the largest scale and from that scale to the smaller chart scale, is scale independent and can be applied successfully to regularly spaced depth points (points from a DTM) and irregularly spaced depth points (soundings from a larger scale nautical chart). As a result, it is appropriate for soundings generalization utilizing a DTM or a larger scale nautical chart as a source.
  • Surface structure and depth integrity: Surface structure description is based on depth contours extracted from the DTM and generalized at the chart compilation scale based on nautical chart specifications. Scale specific depth contours are generated by generalizing raw depth contours extracted from the DTM. As a result, surface structure description is scale dependent and contributes to a scale related selection of soundings. Thus, it is superior to other seabed structure description methods, e.g., slope, feature recognition etc. that focus on details not relevant to the map compilation scale. In order to maintain the integrity of the depths, sounding values are depicted within the depth areas defined by the generalized depth contours.
  • Ease of implementation: The rules and procedures proposed can be implemented in a GIS environment utilizing geoprocessing functions and custom developed tools. The methodology is based on basic operations used to manipulate geographic data and the Open Geospatial Consortium’s (OGC) simple feature model. Neither special tools nor special structures are needed. Therefore, it can be implemented in any GIS environment and spatially enabled database that provides these tools. This way, “in house” GIS, existing databases and well checked processing routines will not become obsolete. Consequently, the method can be easily adopted by HOs or private mapping companies regardless of the existing chart production procedures.
  • Flexibility and Customization: The values of the parameters used, e.g., distance between soundings, fishnet size and depth selection criteria etc. can be set by the cartographer, thus providing a fully parameterized solution. It is considered that a “parametric” approach contributes considerably to the flexibility of the method and accommodates the requirements of different hydrographic institutions.
  • Automation: The time required for nautical chart production is significantly reduced as generalization of soundings is automated to a considerable degree. Therefore, the cartographer can focus only on checking the result of the automated procedures to edit a small percentage of possibly missing cases. This way, chart production pace will increase with considerable reduction of the production cost.
The potential use of the proposed soundings generalization approach presented here is not limited only for IHO S-57 ENC products and their printed counterparts. Several HOs are preparing to transition to the new ENC format, IHO S-1xx. In addition to the display of depth soundings (SOUNDG layer) in an ECDIS, the soundings generalization approach can be used as a boundary condition input for common coastal and ocean community models. The mesh will follow conventional node selection rules that are common in cartography and oceanography using digital elevation grids as source. Attributes for the mesh and its node will include spatial reference systems (horizontal and vertical), scale, and application. As a result, the derived water levels [22] and currents [23] from the mesh can be also displayed in the ECDIS. The sounding classes presented in this paper can be also used to define in coastal modelling an area of interest using Prime soundings, Background soundings for a regional coverage, Fill soundings in shallow waters, and Morphology soundings over significant morphological features that can affect the physical properties of the coastal and ocean models.
It is important to note that currently the study has been only investigated in one region (i.e., Northeast United States) and modification to code and threshold parameters may occur as more geographic locations will be investigated. Future plans are to test the soundings generalization approach in other coastal areas in order to develop a systematic experimentation with different values for the parameters used by the method, e.g., rhombus size etc. which will lead to a fine tuning of the method across chart scales, sea bed diversity, depth range, etc. Future research will also focus on the resolution of problems of possible soundings overlay with other features portrayed on nautical charts, e.g., wrecks. The authors are only aware of hydrographic sounding generalization efforts that incorporate vertical uncertainty, Category of Zones of Confidence (CATZOC), and a validation procedure into the selection process [24]. In the broader cartographic community, there are discussions on incorporating machine learning techniques, but one of the key challenges is creating adequate number of reference datasets that are rich enough with information in order to generate cartographic rules [25].

Author Contributions

Conceptualization, Andriani Skopeliti, Leda Stamou, Lysandros Tsoulos; Methodology, Andriani Skopeliti, Leda Stamou, Lysandros Tsoulos; Formal Analysis, Andriani Skopeliti, Leda Stamou, Lysandros Tsoulos; Software, Andriani Skopeliti, Leda Stamou; Writing—Original Draft Preparation, Andriani Skopeliti, Leda Stamou, Lysandros Tsoulos, Shachak Pe’eri; Writing—Review & Editing, Shachak Pe’eri All authors have read and agreed to the published version of the manuscript.

Funding

This research was funded by the University of New Hampshire, award number NA15NOS4000200-Subaward No: 19-020. The APC was funded by the University of New Hampshire.

Conflicts of Interest

The authors declare no conflict of interest. The funders had no role in the design of the study; in the writing of the manuscript, or in the decision to publish the results.

References

  1. IHO (International Hydrographic Organization) S-57 Publication. IHO Transfer Standard for Digital Hydrographic Data, 3.1 ed.; International Hydrographic Organization: Monte Carlo, Monaco, 2000. [Google Scholar]
  2. IHO (International Hydrographic Organization) S-66 Publication. Facts about Electronic Charts and Carriage Requirement, 1.1.0 ed.; International Hydrographic Organization: Monte Carlo, Monaco, 2018. [Google Scholar]
  3. NOAA (National Oceanic and Atmospheric Administration). National Charting Plan. A Strategy to Transform Nautical Charting; Office of Coast Survey, Marine Chart Division: Silver Spring, MD, USA, 2017. Available online: https://nauticalcharts.noaa.gov/publications/docs/draft-national-charting-plan.pdf (accessed on 15 October 2020).
  4. Zhang, X.; Guilbert, E. A multi-agent system approach for feature-driven generalization of isobathymetric line. In Advances in Cartography and GIScience; Springer: Berlin/Heidelberg, Germany, 2011; Volume 1, pp. 477–495. [Google Scholar]
  5. Zoraster, S.; Bayer, S. Automated Cartographic Sounding Selection. Int. Hydrogr. Rev. 2011, 59, 57–61. [Google Scholar]
  6. Yan, J.; Guilbert, E.; Saux, E. An ontology of the submarine relief for analysis and representation on nautical charts. Cartogr. J. 2015, 52, 58–66. [Google Scholar] [CrossRef] [Green Version]
  7. NOAA (National Oceanic and Atmospheric Administration). Nautical Chart Manual; Volume 1—Policies and Procedures; Version 2018.2; U.S. Department of Commerce, Office of Coast Survey: Silver Spring, MD, USA; National Oceanic and Atmospheric Administration: Washington, DC, USA, 2018.
  8. Owens, E.; Brennan, R. Methods to influence precise automated sounding selection via sounding attribution and depth areas. In Proceedings of the CHC The Arctic, Old Challenges New Approaches, Niagara Falls, ON, Canada, 15–17 May 2012. [Google Scholar]
  9. Oraas, S.R. Automated Sounding Selection. Int. Hydrogr. Rev. 1975, 52, 103–115. [Google Scholar]
  10. Tsoulos, L.; Stefanakis, K. Sounding Selection for Nautical Charts: An Expert System Approach. In Proceedings of the 18th International Cartographic Conference, Stockholm, Sweden, 23–27 June 1997. [Google Scholar]
  11. Du, J.; Lu, Y.; Zhai, J. A Model of Sounding Generalization Based on Recognition of Terrain Features. In Proceedings of the 20th International Cartographic Conference, Beijing, China, 6–10 August 2001. [Google Scholar]
  12. Solarić, R. Depth Selection in Nautical Charts Production. In Proceedings of the 22nd International Cartographic Conference, A Coruña, Spain, 9–16 July 2005. [Google Scholar]
  13. Sui, H.; Zhu, X.; Zhang, A. A System for Fast Cartographic Sounding Selection. Mar. Geod. 2005, 28, 159–165. [Google Scholar] [CrossRef]
  14. Yu, W. Automatic Sounding Generalization in Nautical Chart considering Bathymetry Complexity Variations. Mar. Geod. 2017, 41, 68–85. [Google Scholar] [CrossRef]
  15. Kastrisios, C.; Calder, B.; Masetti, G.; Holmberg, P. Towards automated validation of charted soundings: Existing tests and limitations. Geo-Spat. Inf. Sci. 2019. [Google Scholar] [CrossRef] [Green Version]
  16. Lovrinčević, D. The Development of a New Methodology for Automated Sounding Selection on Nautical Charts. NAŠE MORE Znanstveni časopis za more i pomorstvo 2019, 66, 70–77. [Google Scholar] [CrossRef]
  17. Lovrinčević, D. Quality assessment of an automatic sounding selection process for navigational charts. Cartogr. J. 2017, 54, 139–146. [Google Scholar] [CrossRef]
  18. Pe’eri, S.; Dyer, Ν. Automated Depth Area Generation for Updating NOAA Nautical Charts. Available online: https://rb.gy/wjfo44 (accessed on 15 October 2020).
  19. IHO (International Hydrographic Organization). Regulations of the IHO for International (INT) Charts and Chart Specifications of the IHO—Publication S-4 Edition 4.7.0; International Hydrographic Organization: Monte Carlo, Monaco, 2017; p. 452. [Google Scholar]
  20. NOAA Chart 12327. New York Harbor (1:40,000), 109th ed.; NOAA: Silver Spring, MD, USA, 2020.
  21. Rice, G.; Wyllie, K.; Brennan, R.; Koprowski, C.; Wolfskehl, S.; Burnett, Z. The National Bathymetric Source. In Proceedings of the Canadian Hydrographic Conference 2020, Quebec City, QC, Canada, 24–27 February 2020; Available online: https://hydrography.ca/wp-content/uploads/2020/04/The-National-Bathymetric-Source.pdf (accessed on 15 October 2020).
  22. IHO (International Hydrographic Organization). Water Level Information for Surface Navigation—Publication S-104 Edition 0.0.3; International Hydrographic Organization: Monte Carlo, Monaco, 2017; p. 41. [Google Scholar]
  23. IHO (International Hydrographic Organization). Surface Currents Product Specification—Publication S-111 Edition 1.0.0; International Hydrographic Organization: Monte Carlo, Monaco, 2018; p. 108. [Google Scholar]
  24. Dyer, N.; (U.S. Department of Commerce, NOAA Office of Coast Survey, Washington, DC, USA); Pe’eri, S.; (U.S. Department of Commerce, NOAA, Office of Coast Survey, Washington, DC, USA). Personal Communication, 2020.
  25. Skoumas, G.; Pfoser, D.; Kyrillidi, A. On Quantifying Qualitative Geospatial Data: A Probabilistic Approach. In Proceedings of the SIGSPATIAL’13: 21st SIGSPATIAL International Conference on Advances in Geographic Information Systems 2013, Orlando, FL, USA, 5–8 November 2013; Available online: https://0-dl-acm-org.brum.beds.ac.uk/doi/10.1145/2534732.2534742 (accessed on 15 October 2020).
Figure 1. DTM is transformed to a point data set, which is generalized across scales according to the ladder approach.
Ijgi 09 00693 g001
Figure 2. Prime soundings (shoals) selection: (top image) selected soundings based on shoal criteria and (bottom image) retained soundings based on distance criteria.
Ijgi 09 00693 g002
Figure 3. Prime Soundings (deeps) selection (pink—Prime deep, red—Prime shoal): (top image) selected soundings based on deep criteria and (bottom image) retained soundings based on distance criteria.
Ijgi 09 00693 g003
Figure 4. Background soundings selection (blue—Background, pink—Prime deep, red—Prime shoal): (top image) selected soundings based on fill criteria and (bottom image) retained soundings based on distance criteria.
Ijgi 09 00693 g004
Figure 5. Fill shoal soundings selection (green—Fill shoals, pink—Prime deeps, red—Prime shoals, blue—Background): (top image) selected soundings based on shoal criteria and (bottom image) retained soundings based on distance criteria.
Ijgi 09 00693 g005
Figure 6. Fill deep soundings selection (olive—Fill deeps, green—Fill shoals, pink—Prime deeps, red—Prime shoals, blue—Background): (top image) selected soundings based on deep criteria and (bottom image) retained soundings based on distance criteria.
Ijgi 09 00693 g006
Figure 7. Morphology related soundings: sounding 0.5 m results to the deletion of soundings 0.1 m and 2.3 m (in blue) due to short distances between them.
Ijgi 09 00693 g007
Figure 8. Soundings generalization workflow.
Ijgi 09 00693 g008
Figure 9. Case study area (a) NOAA National Center for Environmental Information (NCEI)) bathymetric data viewer (b) NOAA DTM and the area covered by Figure 10, Figure 11 and Figure 12 (red box).
Ijgi 09 00693 g009
Figure 10. Extract from the 1:10 K scale chart (depth contours 2, 3, 4, 5, 6, 7, 8, 10 m).
Ijgi 09 00693 g010
Figure 11. Extract from the 1:20 K scale chart (depth contours 2, 5, 10 m).
Ijgi 09 00693 g011
Figure 12. Extract (a) from the 1:40 K scale chart (depth contours 2, 5, 10 m) and (b) the 1:80 K scale chart (depth contours 5, 10 m).
Ijgi 09 00693 g012
Figure 13. Soundings at 1:10 K scale (in blue) are overlaid to an extract of NOAA ENC US5NYCAE (soundings in black).
Ijgi 09 00693 g013
Table 1. Common principles on soundings generalization.
Principle
Soundings ClassificationMost studies adopt soundings classification and focus on a specific group, e.g., background soundings [5,9,10,13,16]
Depth related criteriaThe shoalest soundings are selected as well as the deep ones [9,10,11,12,13,14]
Auxiliary structuresTriangulated Irregular Network (TIN) or grid sea bed models (DTMs) are utilized [5,10,11,14,16]
Pattern in soundingsA regularly spaced pattern (e.g., triangular, rhomboidal) is considered the ideal solution [9,10,11,12,13]
Anti-clutter tacticsA circular neighbourhood is used to avoid soundings overlap [3,5]
Soundings densitySoundings spacing varies according to depth range and terrain variability [9,10,11,13]
Area segmentationBetter processing is achieved through segmentation of the area under examination by the application of depth range zones, contour zones, ocean bottom features or a regular segmentation (e.g., rectangular grid) [5,11,14]
Table 2. Soundings ranges and corresponding separation distances [9].
Depth Range (m)Min Separation (cm)Max Separation (cm)
0–101.001.25
11–251.251.50
26–751.502.00
>752.002.50
Table 3. Rhombus size and distance between soundings (R = half of the fishnet cell dimension).
ScaleRhombus Cell Size (m)R (m)
1:10 K12562.5
1:20 K250125
1:40 K500250
1:80 K1000500
Table 4. Soundings generalization across scales.
Number of Soundings
Data SetMin Distance (m) Max Distance (m) AllExcluding Dredged AreaDepth Range
0–10 m
Depth Range
10–25 m
Remaining
(%)
Source (DTM)554,039,1543,786,7843,727,25859,526
10 K Scale62.575 91728949223
20 K Scale125150 247824294927.0
40 K Scale250300 7136961727.1
80 K Scale500600 211209229.6
Publisher’s Note: MDPI stays neutral with regard to jurisdictional claims in published maps and institutional affiliations.

