1. Introduction
In recent years, Twitter has become one of the most popular social networking applications in the world, with nearly 100 million active daily users, who post more than 600 million tweets per day [
1]. Twitter is a microblogging platform, through which people can share brief messages, referred to as "tweets", which have the potential to reach millions of users across the globe [
2]. Such a communications tool helps people to disseminate or share information while interacting with one another, and these interactions enable people to build social relationships with friends, or even strangers. Consequently, social media services, like Twitter, hold massive quantities of data, offering insights into human behavior, interests, and activities. Organizations, companies, governments, etc., can, and do, use such data to develop decision-making strategies. Indeed, Twitter is considered a valuable source of information for monitoring the public’s opinions, feelings, or reactions towards events, since the service allows for users to share “what is happening” at almost any location or time, instantaneously, via communication devices, such as smartphones, tablets, and laptops. This creates a huge spatial and temporal corpus of worldwide events.
In 2009, Twitter allowed users to embed geotagged information in their tweets and, ever since that moment, many researchers realized that the resulting massive volume of data could provide spatiotemporal information of great value for a wide variety of research topics. Indeed, such data provide an opportunity for the greater understanding of spatial and temporal patterns in daily human life and behavior. Geo-social media, the georeferenced aspects of social media (e.g., geotagged photos taken with smartphones), have had a particular impact upon our ability to use social networks in an investigative fashion in order to learn how both individual and collective behaviors relate to physical space. While the analysis of available georeferenced data offers great potential for explaining the relationships between human behavior and a given location, many challenges remain. For example, social media data is messy; it contains a great deal of information about events from multiple perspectives and an unnamed variety of groups. Moreover, geosocial media data are highly noisy; it generates massive volumes of data with low levels of accuracy and precision. Furthermore, the simple geographical mapping information that accompanies this georeferenced data is usually limited in scope and usability. Thus, in order to fully understand and make use of the complex sphere of social media, evaluation methods are required that combine data from analyzing Twitter content with sophisticated, spatiotemporal analysis tools. Many studies have combined classification and/or clustering algorithms (e.g., text mining techniques, like sentiment, semantic, or text classification) in order to analyze social media content, which they then follow with the application of spatiotemporal analysis to investigate the spatial and temporal patterns of particular phenomena. Text-mining approaches (e.g., classification and clustering algorithms), which include semantic analysis [
3,
4,
5] and sentiment analysis [
6,
7,
8], have arisen in order to overcome such challenges. Sentiment analysis involves the study of opinion expressed in text to learn a writer’s feelings, whereas semantic analysis infers the structural evaluation of linguistic content within the text.
In the fields of geography or geospatial sciences, Twitter data provide valuable information for exploring people’s reactions towards sudden events, such as disasters [
9,
10,
11,
12,
13,
14] and breaking news [
15,
16]. For instance, Sakaki et al. [
17] used the Latent Dirichlet Allocation (LDA) topic modeling technique, combined with advanced spatiotemporal analysis methods, to detect earthquake locations and hazard trajectories from Twitter data. Additionally, Wang et al. [
18] analyzed the textual content of conversational data from Twitter and fed the results into spatiotemporal analysis tools in order to discover how public conversations changed over time and space during Hurricane Sandy. Clearly, these online messaging platforms serve as a reflection of our collective experiences, perspectives, and views regarding specific events, allowing for us to detect valuable, localized information.
Within the scope of this study, there is a considerable amount of academic literature featuring several different methods for using Twitter data in order to explore people’s topics of interest. These approaches may be divided into four major groups, with the first being the basic investigation of Twitter data topics of interest, though without any subsequent spatial or temporal analysis [
19,
20,
21,
22,
23,
24,
25,
26,
27,
28]. For example, Lee et al. [
20] used the topic classification method to explore top trending topics; results revealing 18 primary topics of interest, such as politics, technology, and art. As already intimated, while this study provided valuable information regarding people’s interests, it failed to yield any spatial or temporal analysis for deeper, more nuanced understanding. However, a second tier of research does provide either temporal [
29,
30,
31] or spatial analysis [
32,
33,
34] regarding topics of interest. In another approach, the researchers performed both spatial and temporal analysis of their data sets [
35,
36,
37,
38], albeit separately (i.e., performing temporal topic analysis, then investigating spatial distributions). While offering richer insight than the first two methods, this third technique is not as comprehensive as the fourth approach, which analyzes time, space, and content simultaneously in order to yield the top Twitter topics of interest.
This latter, less often employed approach can be further divided into three sub-categories. The first of these focuses upon spatiotemporal analysis of trending topics (#Hashtags) in Twitter [
33,
39], while the second involves spatiotemporal analysis of topics of interest by analyzing tweet content [
40]. The third focuses on top topics of interest regarding specific themes [
41,
42]. However, these studies each used pre-queries or search terms in order to find words related to specific themes, such as those that are involved with obesity [
39] or climate change [
33]. While the research described in this paper generally falls into the second category, analyzing time, space, and tweet content simultaneously to investigate general topics of interest (in Kuwait), it differs somewhat from previous work, because it neither analyzes trending topics (#Hashtags) nor uses pre-query words or search queries to collect data related to specific topics. Indeed, few other approaches have so far proposed exploring time, space, and tweet textual content simultaneously in order to identify topics of interest and consequently, this study contributes to the body of literature in this field. More specifically, this effort aimed to provide deeper understanding regarding what topics people actually think about, when they think about them, and where they tweet about them. Furthermore, this research also helped to explain how people’s interests and thoughts change over the course of a week. For example, were people more interested in a specific topic during week days or weekends, or was there a weekday event affecting these levels of interest? Additionally, the analysis also provided an avenue for learning, where people think about a given topic, and whether these places have specific characteristics (e.g., commercial, educational, political, etc.) that affect people’s levels of interest. To address these points, we performed spatial search queries in order to collect tweets (point queries with a radius of 0.5 mile), employed text mining methods to identify the top topics of interest, and used spatiotemporal analysis to explore the spatiotemporal distribution of said topics. By combining the previous methods, we addressed the following research questions:
RQ1: What are the primary topics of interest for Twitter users in Kuwait?
RQ2: What are the spatiotemporal distributions for the typical topics of interest in Kuwait?
RQ3: Are there any spatial patterns on topics of interest distributions across days of the week in Kuwait?
2. Related Work
Many approaches have been proposed in order to explore message content in topic-popularity or interest-related social media data. Three major techniques presently in use involve either analyzing (1) trending topics (#Hashtags) [
19,
20,
21], (2) user profiles [
22,
23], or (3) tweet textual content [
24,
25,
26,
27] to discover people’s topics of interest. Lee et al. [
20] used both text and network-based classification methods to analyze trending topics (#Hashtags). They concluded that people were interested in tweeting about 18 major categories, such as politics, art, technology, sport, etc. Cheong [
21] performed similar research, analyzing the content of trending topics in order to extract themes of interest. He developed a textual survey using a program in Java based upon the Twitter Application Programming Interface (API) and concluded that the trending topics could be classified within 14 major areas, such as activism, entertainment, culture, news, etc. Zubiaga et al. [
28] also introduced a typology to explore news, topics, and events of interest by analyzing trending topics. Alternatively, Volkova et al. [
23] depended upon Twitter-user profiles to discover their potential areas of interest. They also determined relationships between user interests and their psychological and demographical attributes. Further, research conducted by Zhao and his colleagues [
25] focused upon the textual content of tweets, rather than trending topics (#Hashtags) or user profiles. They used text mining methods, e.g., the Twitter-LDA model to explore Twitter topics of interest, and compared these results with traditional media topics. Despite these efforts providing valuable information regarding Twitter topics of interest, they did not conduct any spatial or temporal analysis in order to develop a deeper understanding of the data.
However, some researchers have indeed performed spatial or temporal analysis of Twitter topics of interest. Regarding the latter, Fani et al. [
29] conducted a multivariate time series analysis to explore the temporal behavior of Twitter users regarding their topics of interest. Furthermore, Jiang et al. [
30] adopted a semantic analysis method to explore user interests, and then employed a topic hierarchy tree to track how these interests changed over time. Moreover, Lehmann et al. [
31] investigated the popularity of hashtag topics, discovering the evolution of these topics over time. With respect to the former, some studies have conducted spatial analysis to discover spatial patterns for topics of interest. For example, Lansley and Longley [
32] used unsupervised learning algorithms in order to analyze geo-tagged tweets to explore top topics of interest in London, England. They discovered 20 top topic groups, analyzing their spatial distributions, along with the related socio-economic and demographic attributes of users. However, Zhao et al. [
33] analyzed the geo-textual Twitter data in order to discover user topics of interest. They mapped user interests via two approaches: user behavior models and user preference models. Ghosh and Guha [
34] generated search terms such as “overweight”, “child and obesity”, “food and right”, etc., in order to understand people’s thoughts about the topic of obesity. This topic-modeling approach helps to identify relevant topics that are related to obesity to determine their spatial patterns. While each of the above-mentioned studies analyzed topics of interest from either spatial or temporal perspectives, they did not conduct both analyses simultaneously.
As such, other approaches have emerged to investigate spatial and temporal analysis for exploring the popularity of Twitter topics. For example, Ardon et al. [
35] performed both temporal and spatial analysis. They first investigated the properties of the time-evolving of data, and then they uncovered the geospatial patterns of top popular topics. Kamath et al. [
36] also focused upon studying the spatial patterns and propagation of trending Twitter topics, and subsequently investigated their temporal distribution. Moreover, Hu et al. [
37] analyzed the content of geo-tweets to extract the major topics and then employed sentiment analysis to classify them as being either negative, positive, or neutral. Afterwards, they studied how these topics (e.g., positive, negative, or neutral) may change from month to month over the course of a year. Lastly, they explored the spatial distribution of these topics. Alternatively, Kamath and Caverlee [
38] proposed a model for extracting the top trending topics (#Hashtags) and investigated their spatial distribution over the world. They also investigated how the number of trending topics (and their period of interest) changed over time. Despite the above-mentioned studies conducting both spatial and temporal analysis of Twitter data, such analyses were employed separately, rather than simultaneously.
Few studies, so far, have analyzed the time, space, and textual content of tweets simultaneously in order to perform general exploration regarding Twitter topics of interest. Such studies fall into three major categories. The first of these involves studies that depend upon trending topics (#Hashtags) to explore the top topics and their spatiotemporal patterns, but these studies did not analyze the textual content of tweets. For example, Feng et al. [
39] provided valuable work in spatiotemporal analysis of geo-trending topics (#Hashtags) in Twitter. They first explored events by analyzing associated hashtags and examining the temporal patterns of these events. They then clustered events while using a single-pass algorithm. Finally, they ranked events and determined their location and time frame in order to generate spatiotemporal patterns for them. Furthermore, Zhang et al. [
33] proposed a method to track real-time trending topic detection from geo-tagged tweets. Once they classified the top topics, they applied spatiotemporal clustering for each trending topics group. The second category involves spatiotemporal analysis of topics of interest by analyzing tweet content. Andrienko et al. [
40] integrated term-usage cluster analysis with hands-on approach to identify the top topics of interest in Seattle. They then used the density-based clustering approach to understand the spatiotemporal patterns for the top topics of interest.
However, the third category involves studies that employed a pre-query to collect words related to a specific topic. For example, Arcaini et al. [
41] formulated four major queries: “traffic jam”, “the US OPEN 2013 tennis tournament”, “floods, storms and inundations”, and ”soccer world cup 2014”, by inserting them as hashtags. They collected topics that were related to each theme and divided them between major categories, minor categories, and subcategories, and then analyzed the spatiotemporal clustering of these themes. Dahal et al. [
42] conducted similar work, choosing words related to climate change, before conducting LDA analysis. They applied text mining methods (sentiment analysis with topic modeling) and volume analysis to perform the spatiotemporal analysis of a large volume of tweets geotagged with climate change-related keywords. They found that the overall sentiment regarding the topic was negative, particularly in discussions that involved reactions to political or extreme weather events. With topic modeling, they showed that despite a diverse range of discussion topics related to climate change, a handful of these topics received far more attention from Twitter-users than the others. Climate change discussion in the United States, for example, was found to be far less policy-related than in other countries.
In summary, as already intimated, while the study outlined in this paper falls into the second category that analyze time, space, and tweet content simultaneously to explore general topics of interest (in Kuwait), it differs somewhat from previous research by not analyzing trending Twitter topics (#Hashtags), or using pre-query words or search queries to collect data related to a specific topic. Indeed, few other approaches have so far proposed exploring time, space, and tweet textual content simultaneously to identify topics of interest and, consequently, this study contributes to the body of literature in this field. This effort is aimed to provide deeper understanding regarding what topics people actually think about, when they think about them, and where they tweet about them in Kuwait.
3. Methodology
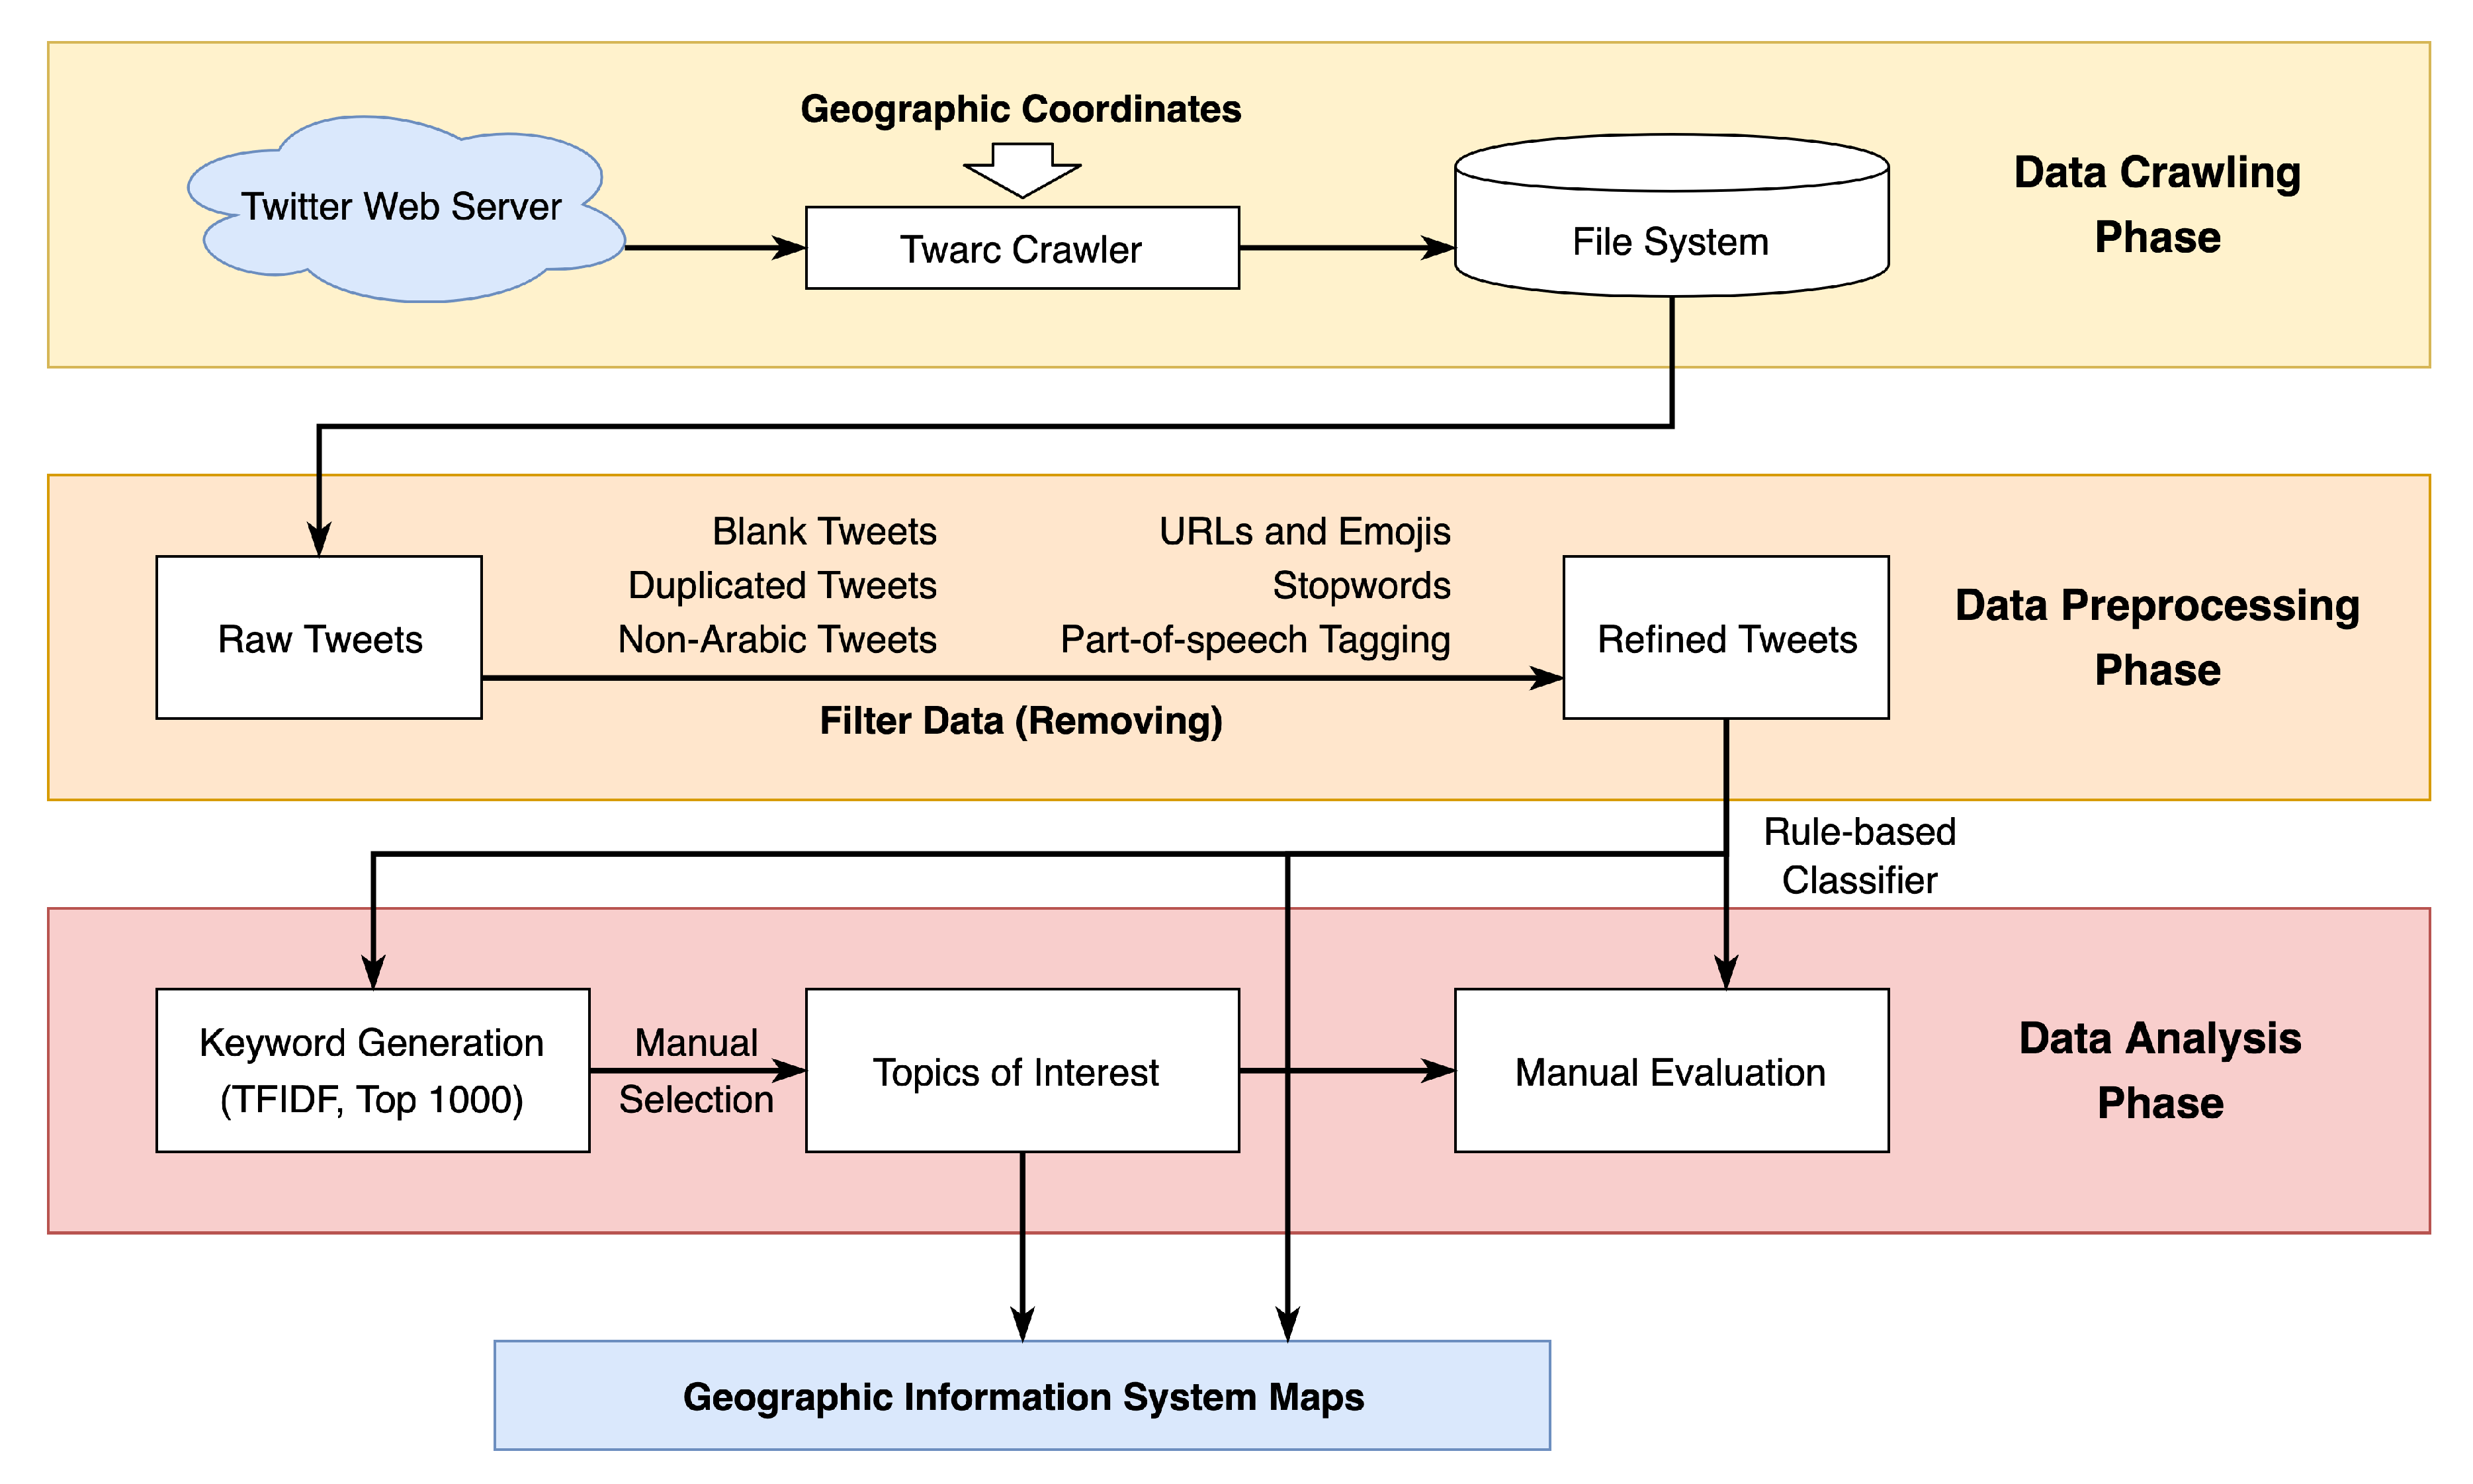
In this section, we first describe the study area, providing general geographical knowledge regarding Kuwait (
Section 3.1). Each phase in the study’s pipeline is presented in
Figure 1: Data Crawling (
Section 3.2), Data Preprocessing (
Section 3.3), and Data Analysis (
Section 3.4). First, we applied Twarc [
43], a command line tool to crawl location-based tweets during data crawling. During data preprocessing, we refined the raw tweet collection and enhanced data quality. Subsequently, we established nine topics of interest and conducted both spatial and temporal analyses on the refined dataset.
3.1. Study Area
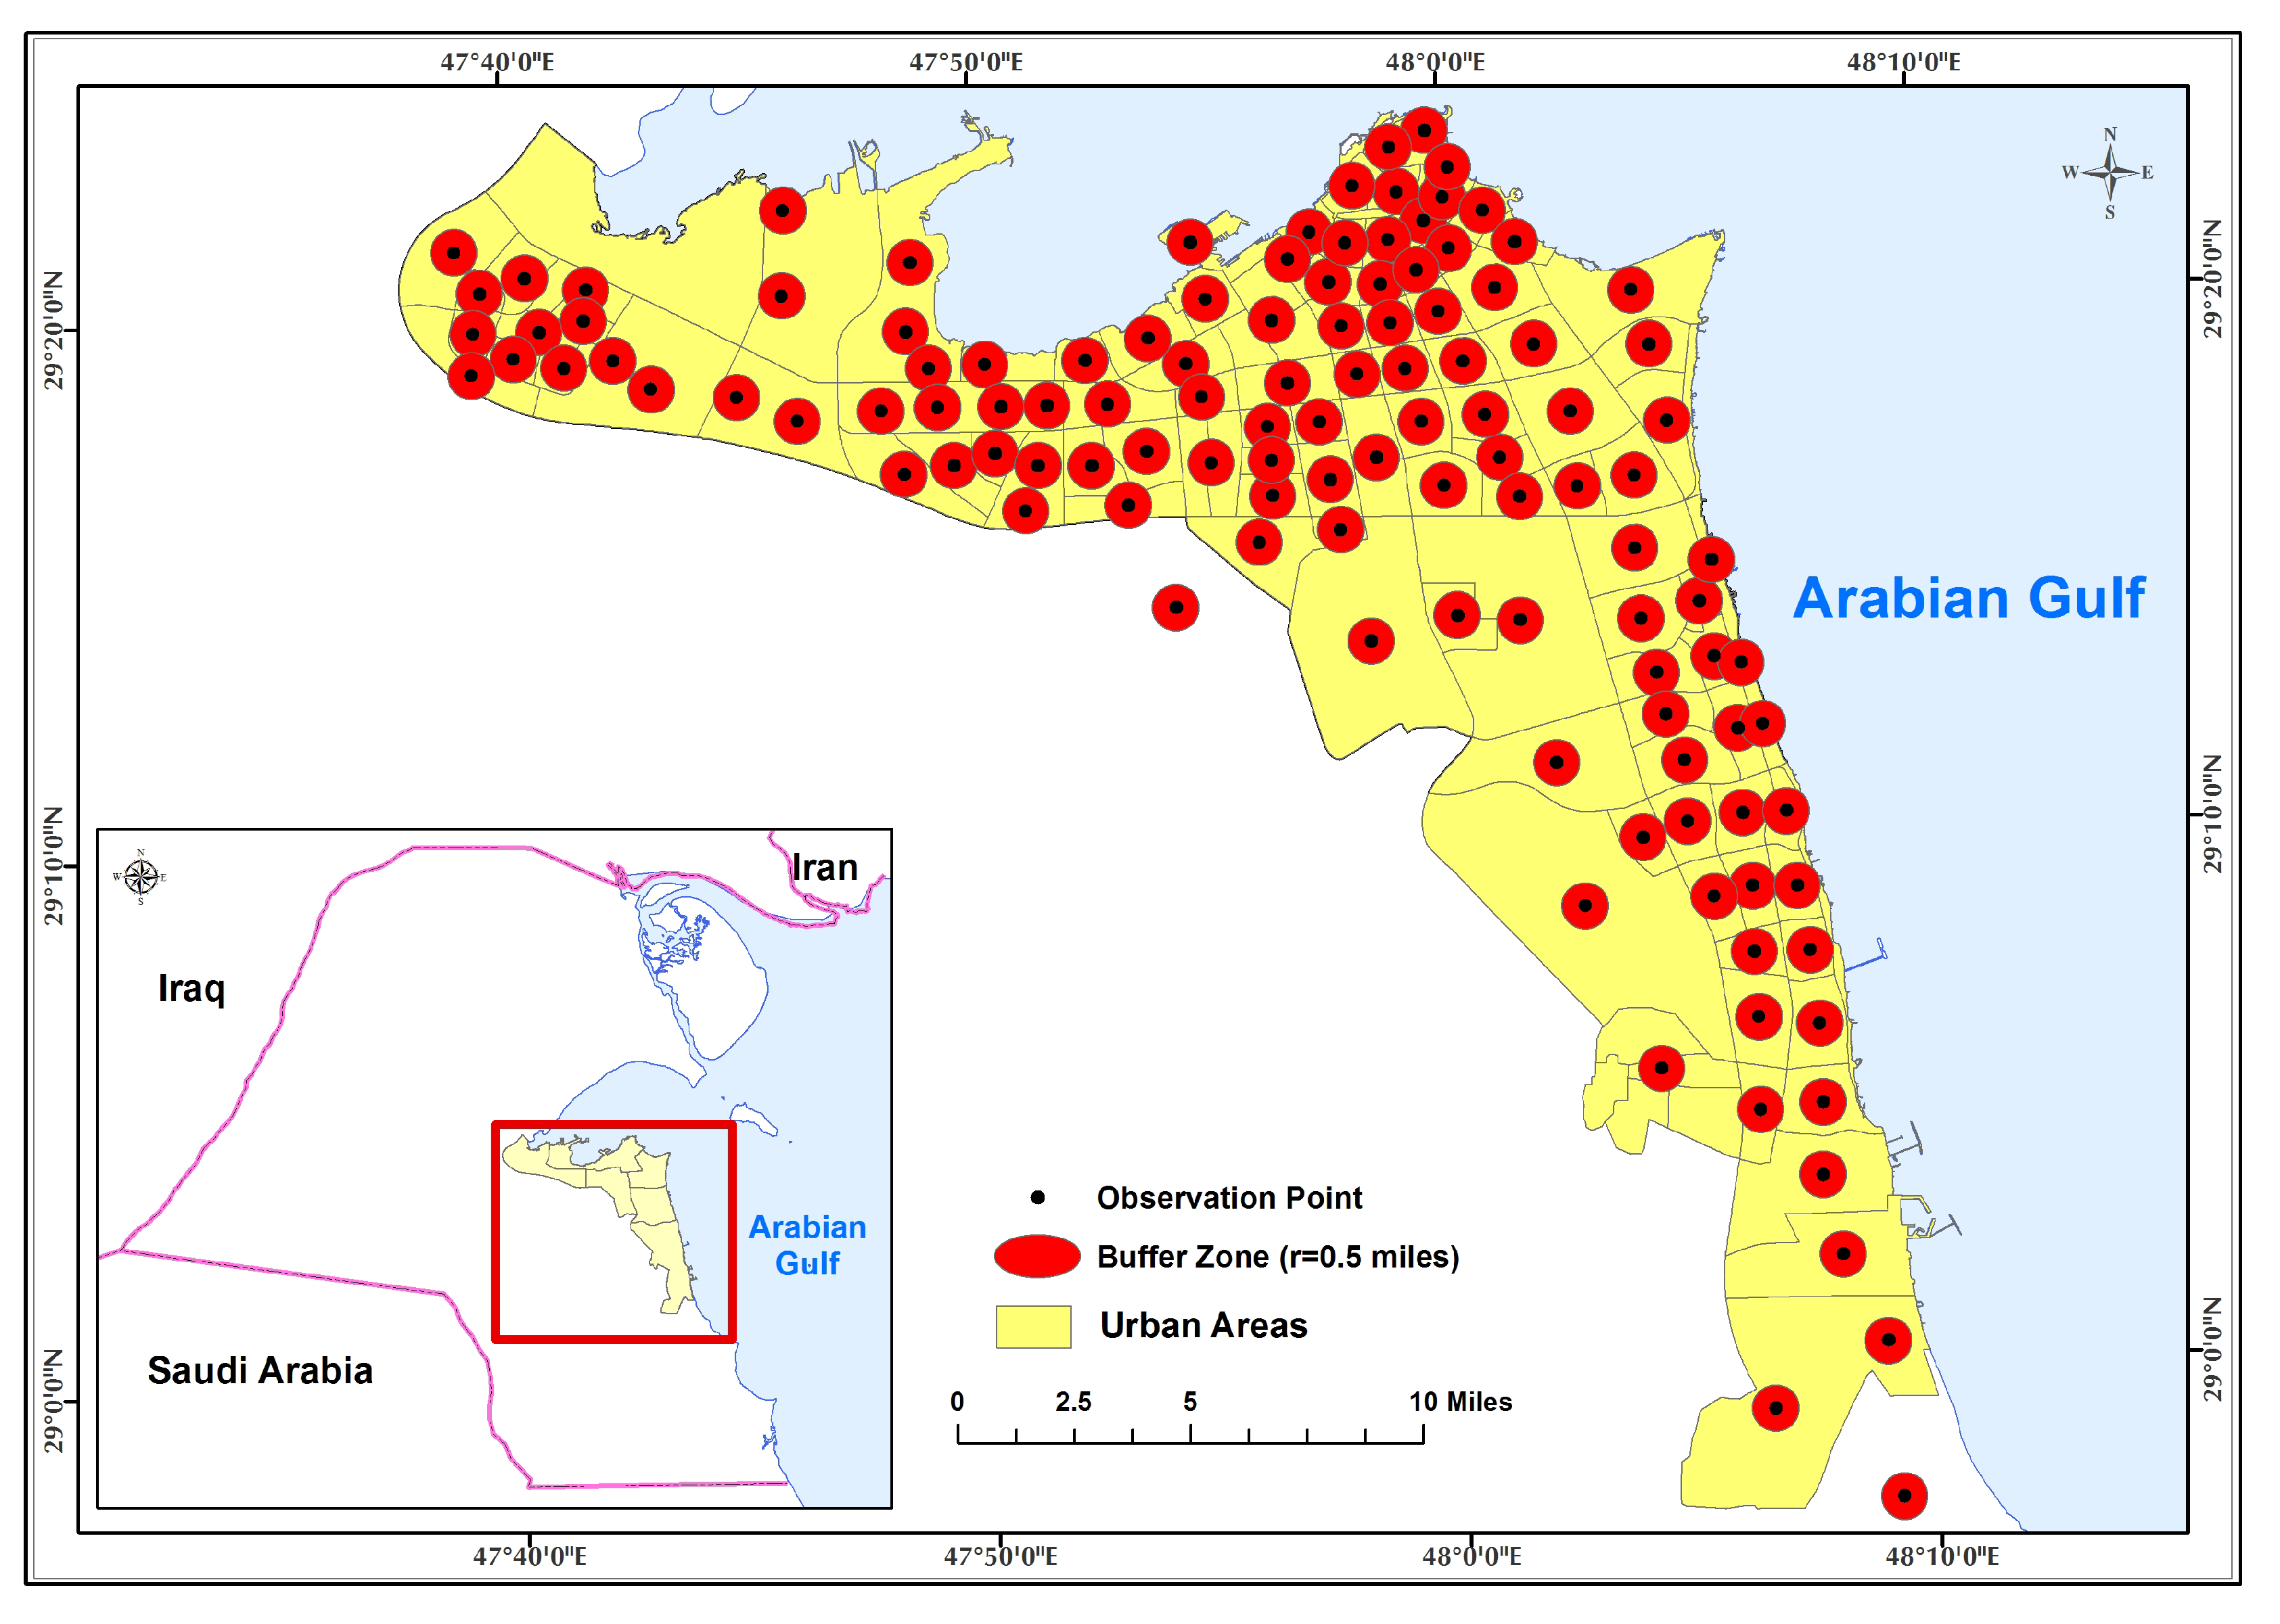
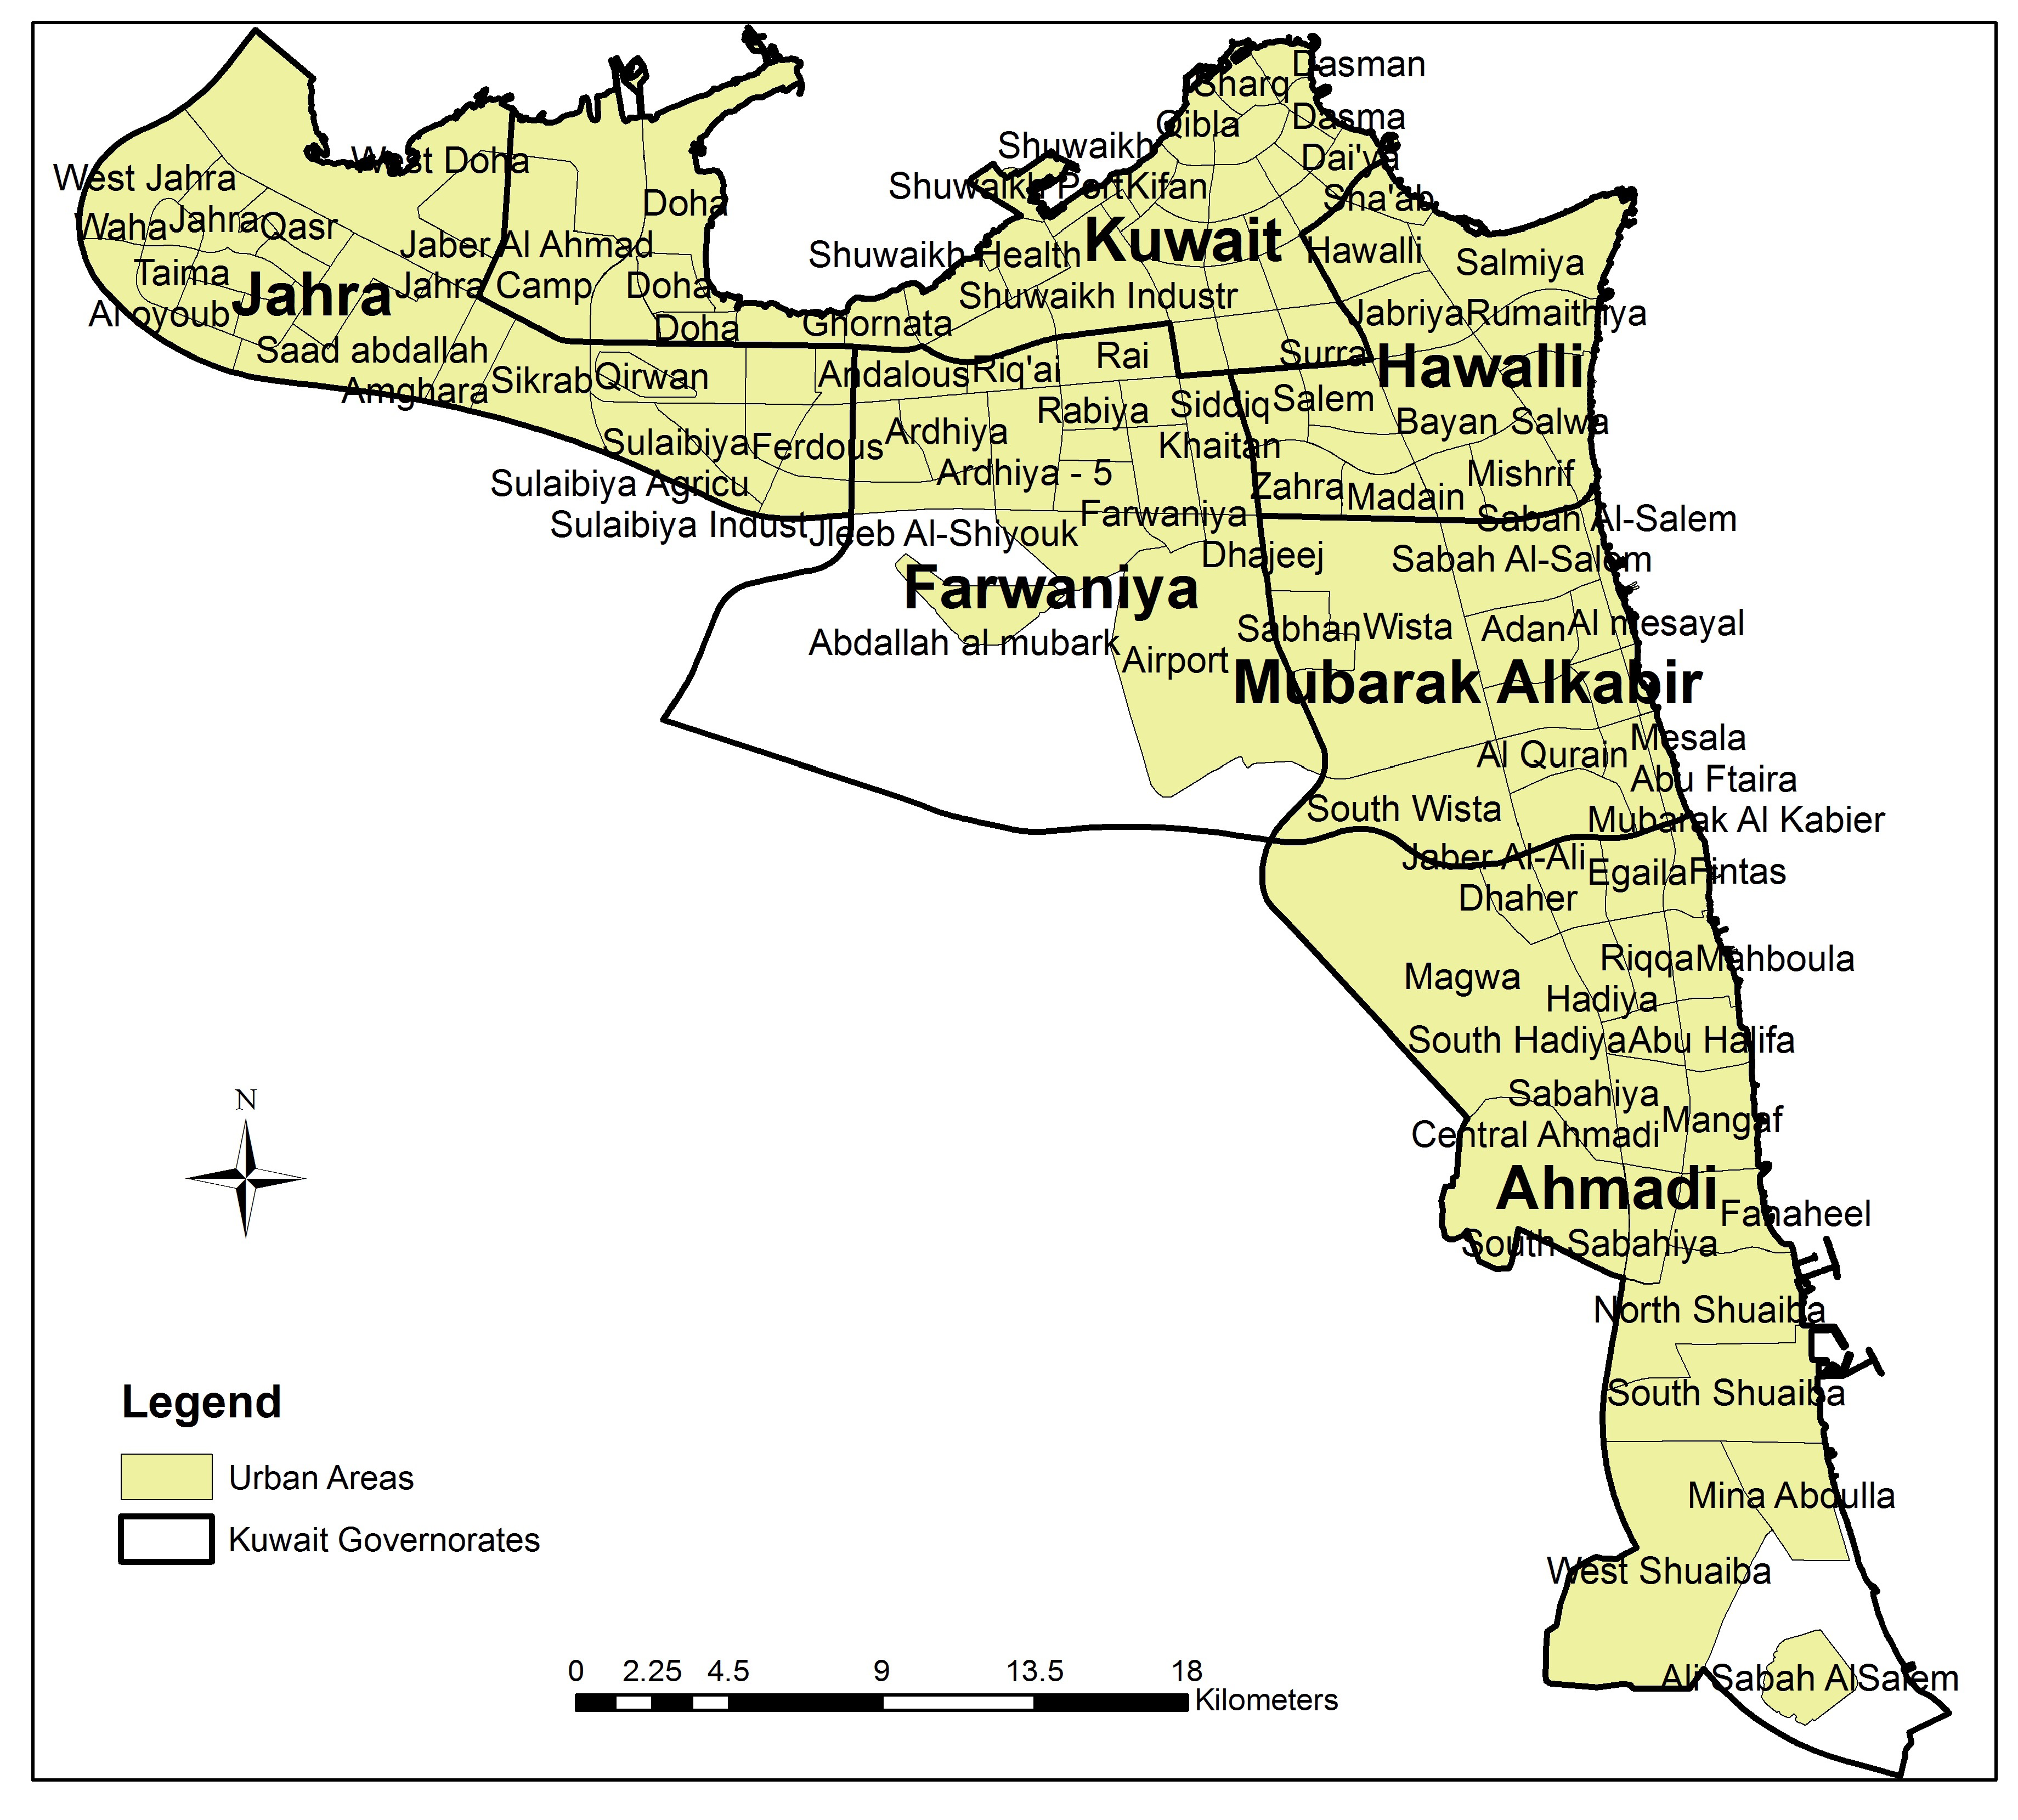
Kuwait is located in the eastern Middle East, bordered to the north and west by Iraq, by Saudi Arabia to the South, and the Arabian Gulf along its eastern boundary. The nation’s geographic coordinates extend between longitudes ( and ) and latitudes ( and ). Like most Arabian Gulf states, desert makes up nearly all of the nation’s approximately 178.18 km2 (≈6880 sq mi) land mass. On a comparative scale, Kuwait is slightly smaller than the U.S. state of New Jersey. The nation is divided into six governing districts, known as governorates: Ahmadi, Farwaniya, Hawalli, Assema, Jahra, and Mubarak Al Kabir.
This study focuses upon the urban areas in Kuwait, which comprise roughly 10% of the nation’s land (see
Figure 2 for a map highlighting this sector). According to a report that the General Authority for Civil Information (PACI) published on 31 December 2019 [
44], Kuwait’s population is 4,776,407, where 1,432,045 are Kuwaiti citizens and 3,344,362 are non-Kuwaitis. Regarding religion, there are a number of religious faiths represented in the State of Kuwait, although Islam is predominant; the number of Muslims being roughly 3,511,490 while there are an estimated 888,668 Christians (with all but a handful being expatriates). Kuwait is one of the more observant Islamic societies, with religion having a significant impact upon daily life, leading to a conservative culture. In terms of education, UNESCO data [
45] for 2017 indicated a literacy rate of 96% for Kuwaitis aged between 25 and 64, although this rises to 99.9% for Kuwaitis aged between 15 and 24. Education is compulsory and provided free to all students aged 6 to 14. In Kuwait, like many nations in the Middle East, the work week extends from Sunday through Thursday, with the weekend comprising Friday and Saturday.
3.2. Data Crawling
Twitter provides two types of API (Application Programming Interface) for tweet crawling: the search API and the streaming API. Although the search API is not meant to be an exhaustive tweet source, it is both more flexible and widely used than the streaming API, which has a limited number of filters. Regarding the specific scenario for this study, it is difficult to create many filters for the areas of interest; however, sampling is an acceptable approach for the analysis task. In this case, we applied the search API with a geocode filter. The parameters for a geocode filter are specified by latitude, longitude, and radius; this helps to define the target areas based upon the center of each area. This study focused upon collecting tweets from within 120 areas, each with a 0.5 mile (0.80 km) radius. Towards this end, we began by manually selecting the latitude and longitude of each urban area’s city center. The coverage radius was then measured based upon the minimum distance between two neighboring areas in order to avoid an overlap of tweets within adjacent areas (i.e., so any specific tweet only applied to one area). A consideration was made in order to ensure that radius selection covered the major parts of an area.
We applied Twarc [
43], a command line tool that archives Twitter JSON data, to crawl geographical tweets using a predefined command built on the above search API. It takes the three values of latitude, longitude, and radius as location parameters in a Twarc query. In total, there were 120 search queries, each of which focused upon one circular, geographical area, and the collected sample of tweets that fell within it.
Figure 2 depicts all 120 geographical areas within Kuwait’s urban region. Because the search API can only request recent tweets within the most recent seven-days period, we also built an automatic script to crawl tweets every week, gathering a set of tweet collections from May 2017 through March 2018. Further, we stored the tweet collection for each area as a single file in JSON format on a local server for further processing and analysis.
3.3. Data Preprocessing
The entire corpus that was generated during the above phase was massive, with a total number of tweets exceeding six million. Therefore, it was necessary to preprocess the corpus in order to remove noisy data, enhance data quality, and improve keyword generation and analysis results.
In this phase, we first removed blank and duplicated tweets and then used “langdetect”, a Python library language checker, to filter out non-Arabic tweets and keep only the Arabic tweets tagged as “ar”. Later, for each tweet, we concentrated upon terms, removing emoji markers and embedded URLs. Meanwhile, we also removed Arabic stopwords—i.e., words that frequently arise in human speech that do not actually provide much meaning. For example, words like و (and), ال (the), and هذا (this) are all stopwords. Such words have a high frequency in a body of text, but they do not provide useful information for the study; removing them can reduce the vocabulary size and noise during keyword generation.
Table 1 lists some typical stopwords in Arabic (and their corresponding English equivalents). We combined both the stopword list from the NLTK [
46] and a predefined stopword list for stopword removal. Furthermore, we filtered out tweets containing two or fewer terms and applied part-of-speech tagging in order to retain nouns and verbs that seemed to be more meaningful to the study’s topics. After performing the above preprocessing steps, the total number of tweets remaining for analysis had fallen by roughly two thirds from over six million to about two million.
3.4. Data Analysis
Even after preprocessing, the dataset remained large, with nearly two million tweets containing words that are both relevant and non-relevant to the study target. We merged all tweets that were posted by each user into a document, and calculated the average Term Frequency–Inverse Document Frequency (TFIDF) score for each word across these documents, taking the top 1000 keywords as good candidates. Subsequently, we manually selected the relevant keywords related to human interests, generating nine topics of interest. Focusing upon tweets that contained these keywords, we carried out spatiotemporal analysis within a GIS application. With tweet latitude, longitude, user ID, and other information as input, the GIS software built a geographic database for the distribution of tweets in the study area.
3.4.1. Keyword Identification
We first identified important words from the tweet corpus, and compared three strategies for keyword extraction: (1) most frequent words, (2) words from Latent Dirichlet Allocation (LDA), and (3) words with high average TFIDF scores. The latter strategy performed best; the TFIDF score is a numeric value for measuring the importance of a word in a document based upon its frequency of use within that document and a given collection of documents, which is calculated, as follows:
where
is the number of occurrences of term
i in document
j,
is the number of documents containing term
i, and
N is the total number of documents [
47].
We used a word cloud tool in order to highlight the top 1000 keywords, and manually cleaned up this set of words by removing those that were unrelated to the study’s purpose. Later, we manually designed the scheme for topics of interest and selected words from the candidate list for each topic. During topic category generation, we also completed a few modifications and additional work to overcome any ambiguity in the Arabic keywords. The Arabic language has a variety of word synonyms, grammatical forms, and variance of word meanings. Additionally, Arabic letters have different shapes, depending upon their position in a word. For example, the letter ج (jaim) has an initial shape جـ, a median shape ــجــ, and a final shape ــج. The Arabic language also has a complex morphology that inflects verbal forms. For instance, the use of the letter ي means “my”, وعاء means “bowl”, and وعائي means “my bowl”. Adding the letter ي changes the verb form, so we write وعائي instead of وعاءي. To address Arabic language inflections and morphology complexity, based upon linguistic knowledge, we applied lemmatization, which is generally defined as “the transformation of all inflected word forms that are contained in a text to their dictionary look-up form” [
48]. The main goal for using the lemmatization technique is to reduce the morphological variations in text, which, in turn, helps to facilitate the analysis process. During topical keywords generation, we lemmatized and generated basic forms (e.g., the infinitive form of verbs) from the inflected words and the masculine singular forms of nouns.
Table 2 shows that different words, such as نلعب, تلعب, يلعب, and لاعب have the same root (لعب) which means “play”. In the second example, the noun مستشفى, meaning “hospital” in English, takes the plural pattern مستشفسات. Nine topics emerged from this effort, along with corresponding, relevant keywords; see
Table 3.
3.4.2. Homonyms in Arabic
In English, homonyms are words that look and/or sound the same, but have multiple meanings [
49]. Many linguists argue that homonyms do not exist in Arabic, because Arabic words have but one meaning, while the rest are metaphorical. For example, the English word “book” has several meanings, with ”text book”, “reserve”, or “official record of the name or personal details”, being just some of the meanings we can infer depending upon context. In Arabic, كتاب represents “text book” while يحجز represents “reserve”—clearly utterly different words. Therefore, each word in
Table 3 is unique and it has no homonym issue.
3.4.3. Relevant Tweet Evaluation
In terms of matching method, we: (1) applied NLTK to tokenize each tweet within the corpus into words; (2) calculated the average TFIDF score for each word across documents (considering all tweets posted by a single user as one document); (3) automatically extracted the top 1000 words as keywords by ranking all words through their TFIDF score, and (4) manually coded these 1000 keywords, with help from domain experts, while also generating a topics scheme where the major keywords related to nine specific topics of interest, as mentioned in
Section 3.4. For instance, if a tweet included the word “law”, it would most closely relate to the “policy” topic, whereas a tweet using “football” likely fell within the “sport” topic. Furthermore, if a tweet contained two keywords relating to two different topics, it was included in both of these topics. A tweet reading “God give me happiness and strangeness”, for example, contains two keywords, with “God” related to the “religion” topic and “happiness” to the “emotion” topic. Consequently, this one tweet would reside in both topics.
To measure the quality of the labeling method, we randomly selected 1000 tweets and manually classified each of them under one (or more) of the nine topics. We considered the results of this process as the labeling “gold standard”. A comparison between this set of results and those that were generated through the term-matching method applied to this same set of tweets would, therefore, measure “to what extent the term-matching method agrees with the gold standard labels”. We tabulated the results from each process; see
Table 4. If the term-matching for a given tweet agreed with its manual classification, then we considered it to be correctly labeled (i.e., 100% correct). Whereas, if term-matching classified a tweet under just one topic, whilst the manual method assigned two, then it was partially correct (i.e., 50%). However, if the two labeling processes generated wholly different results, then we considered it incorrectly labeled (i.e., 0%). The results of these comparisons showed that, out of 1000 randomly selected tweets, 781 had correct labels, whilst 108 were partially correct and 111 were incorrect. Therefore, 78.1% of tweets generated by the term-matching method had correct labels and only 11.1% were incorrect, which, when extrapolated to the entire data set, could serve as reasonable and approximate analysis of the overall results.
3.4.4. Spatiotemporal Analysis
Because the study’s main objective was to explore the spatiotemporal distribution of topics of interest (RQ2) and extract statistically significant spatiotemporal topics of interest clusters from Twitter (RQ3), we employed the following analysis procedures:
Regarding temporal analysis, using the timestamps for each tweet, we divided them into different temporal categories to trace changes in the number of tweets posted each day of the week (Monday to Sunday), and how Twitter users’ topics of interest varied over time. Each day of the week led to an hourly distribution of tweets during the course of that day. We aggregated them for Kuwait’s urban areas (120), in order to determine whether people’s topics of interest were more popular on specific day(s) of the week. The weekly pattern distinguished which topics were more favorable during the week versus weekends, and which days had more tweets that were related to a specific topic. The main advantages of the hourly pattern are to investigate the number of tweets in general, and to determine when people are more likely to use Twitter, i.e., in the morning (work hours) or the evening/night (outside of work hours).
Regarding spatial analysis, to spatially analyze data, we performed the following analysis:
Spatial Visualization. To generally visualize the top four topics of interest distribution, we used the point density map with the “Point Density Tool” from ArcGIS. This tool calculates the density of point features (location of tweets) around each output raster cell. A neighborhood is defined around each raster cell center, and the number of points that fall within the neighborhood is totaled and divided by the area of the neighborhood. We generated seven maps for each topic (one map for each day of the week) for a total of 28 maps for the top four topics of interest in order to help track the temporal changes of the topic distributions in the study area.
Spatial Autocorrelation Analysis. Because one of the research objectives involved extracting statistically significant spatiotemporal and topics of interest clusters from Twitter (RQ3), we needed to analyze the degree of dependency among observations in geo-space. To accomplish this, we employed Global Moran’s I (Moran’s I index, z-score, and P-value) and Getis-Ord Gi* statistic. Global Moran’s I helps to discover whether the spatial autocorrelation for the top four topics of interest is clustered (auto correlated), dispersed, or randomly distributed within the study area. However, Global Moran’s I is unable to derive the precise location of clustering and it cannot provide any information regarding whether the cluster consists of high or low values. For this reason, we employed the Getis-Ord Gi* statistic for further analysis. This statistic is used to indicate whether high or low values are concentrated over the study area and where these values are situated. The results from this test included the z-scores and p-values which indicate whether or not to reject the following null hypothesis: “there is no spatial clustering of the topics of interest across the days of the week in the urban area in Kuwait”. Simply put, Global Moran’s I helps to measure whether or not there is an autocorrelation (cluster), whereas the Getis-Ord Gi* helps to locate where the high or low clustering actually occurs. Both of the measurements were performed multi-temporally to investigate how the spatial autocorrelation of top topics of interest changed each day.
4. Findings and Discussion
We review our results and discussion while answering the research questions in this section, which comprises four major parts: Dataset Overview (
Section 4.1), Top Topics of Interests (
Section 4.2), Visualization (
Section 4.3), and Spatial Autocorrelation (
Section 4.4).
4.1. Dataset Overview
Before answering the research questions, it is important to review details regarding the dataset. Nearly two-million clean tweets were gathered within the 10 month study period in Kuwait (about 6600 tweets per day).
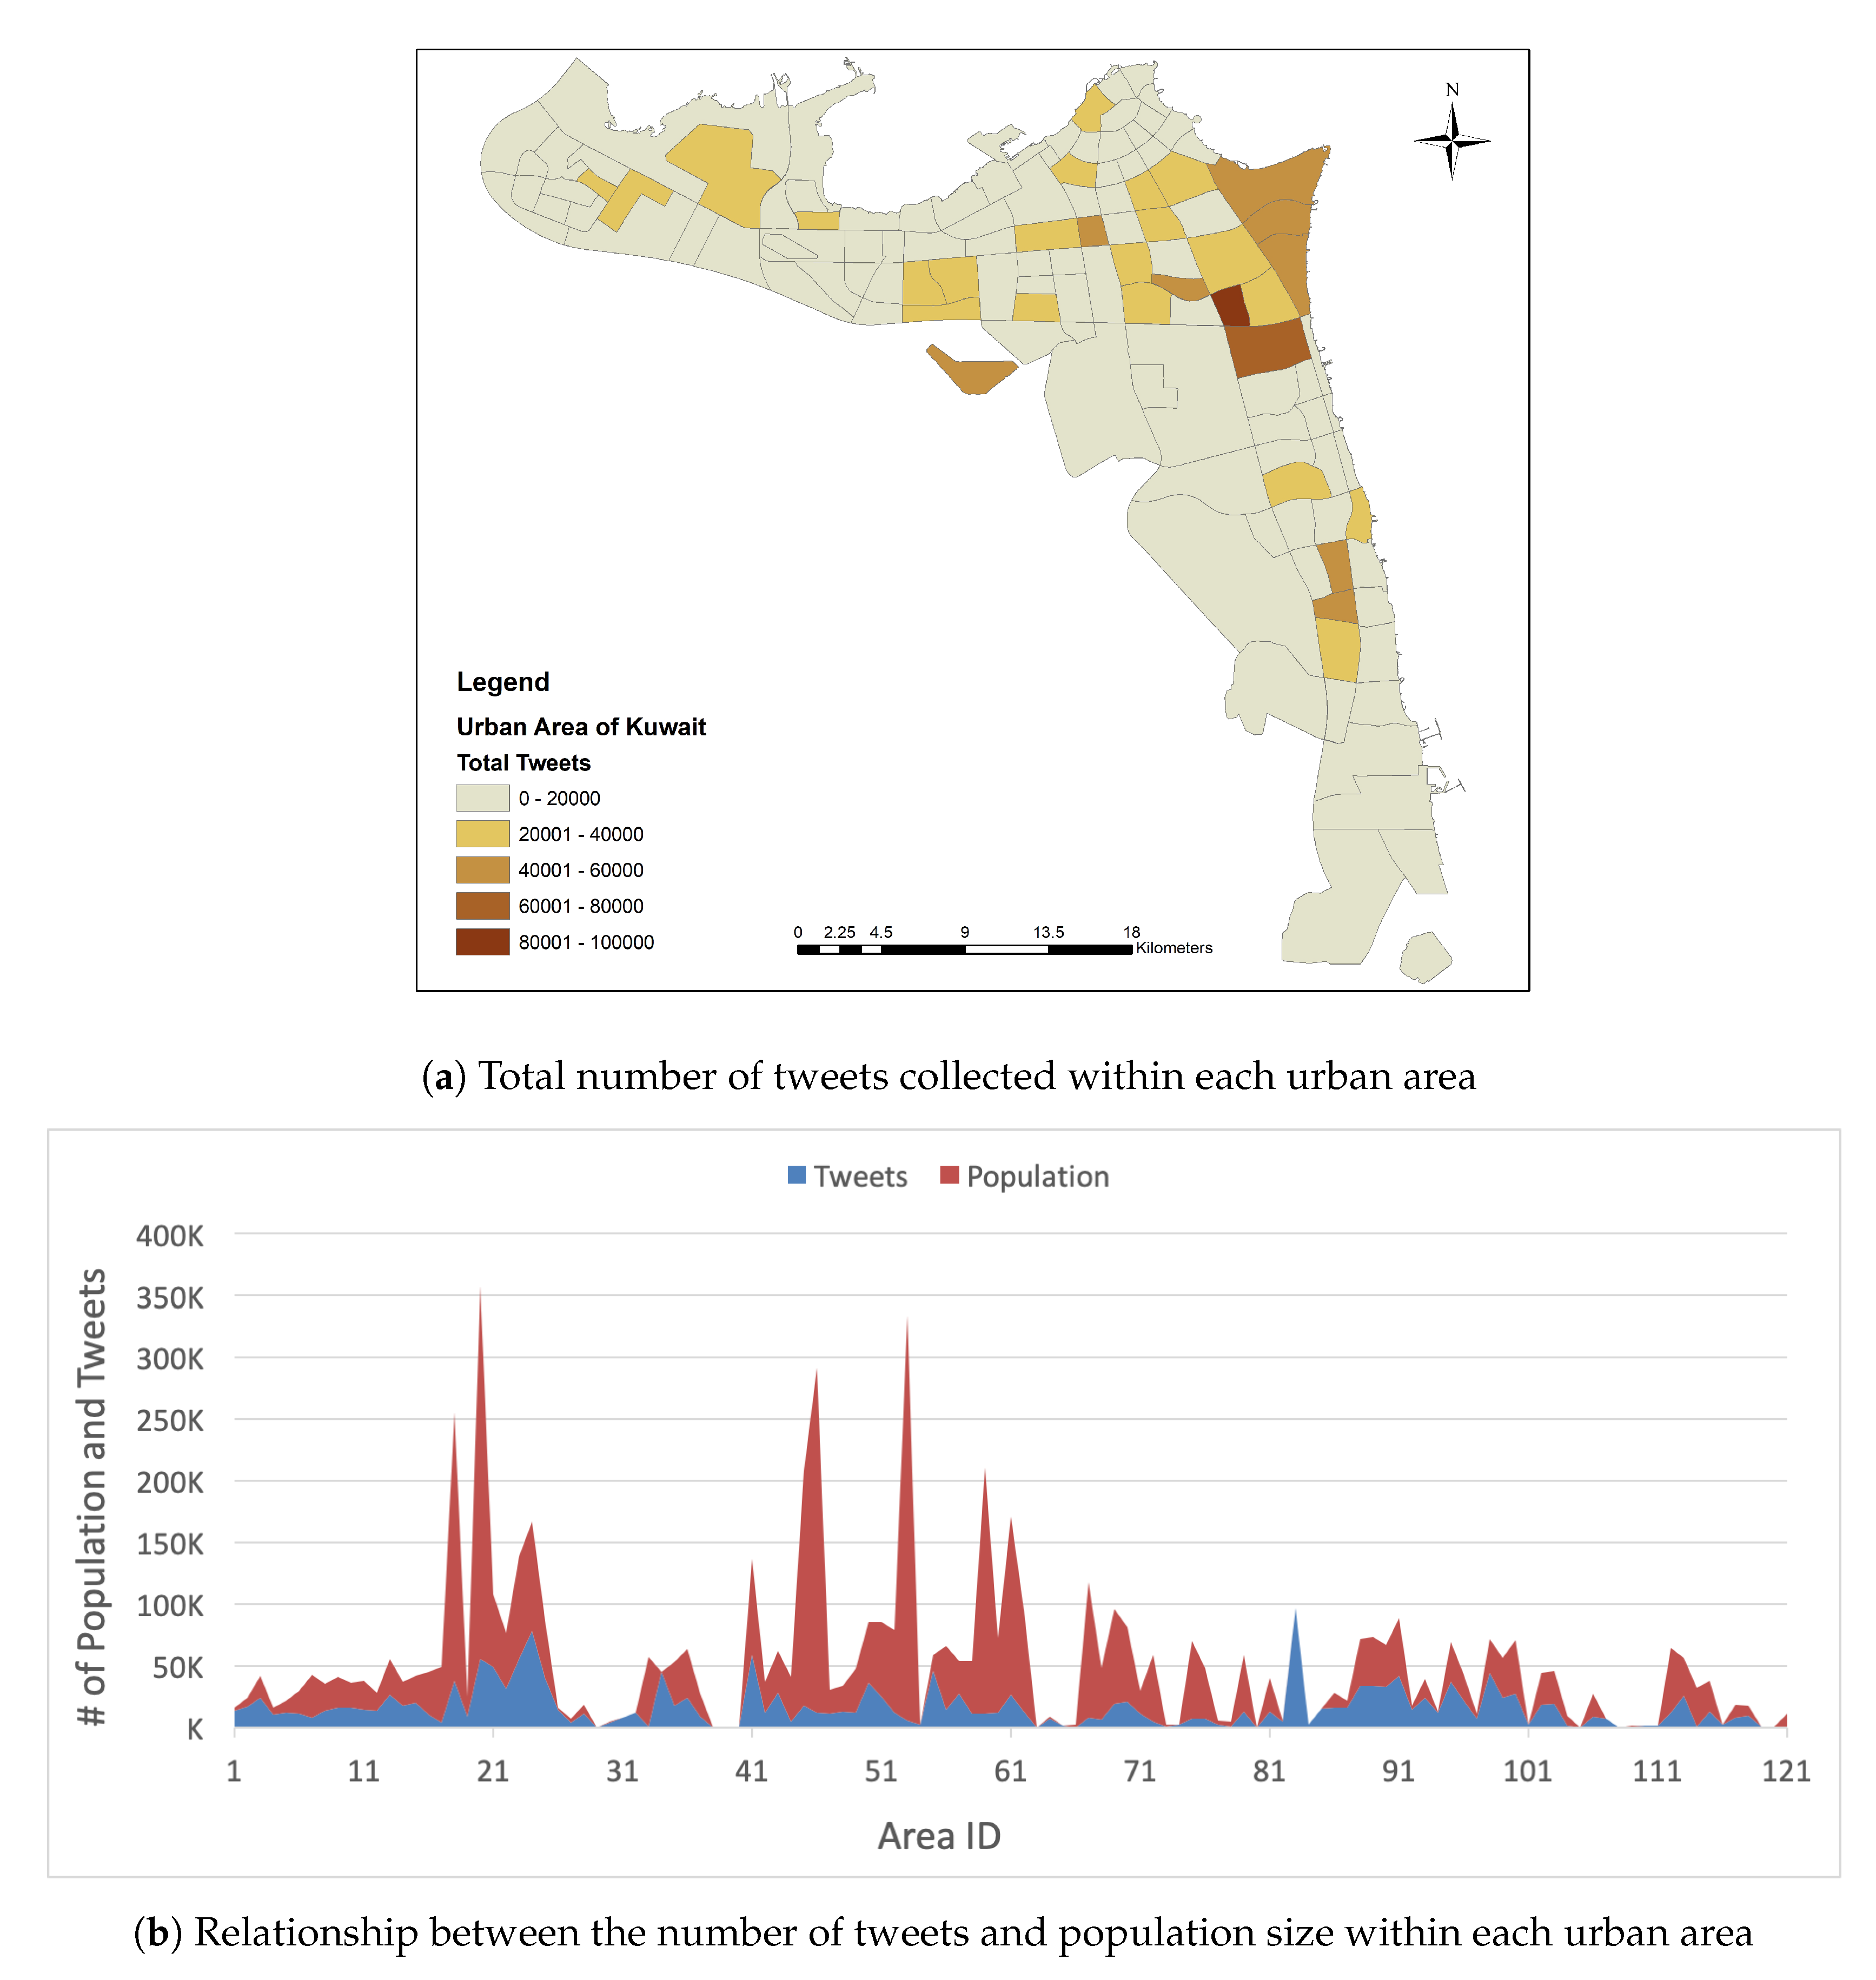
Figure 3a shows the total number of tweets collected within each urban area in Kuwait. It is clear that people posted more tweets in Salmiya, Jabriya, Rumaithiya, Hawalli, Bayan, and Salwa, while, in contrast, fewer tweets were posted in Al Doha, Al Shuaiba, Anjafa, Albeda, and Alsadeeq. The specific areas are listed in
Appendix A. As might be expected, there was a relationship between the number of tweets and the population size in each area. For example, we noted that areas with large populations—such as Jabriya, Salwa, Bayan, and Hawalli—recorded many more tweets than areas with small populations—such as Anjafa, Alsadeeq, and Albeda. In
Figure 3b, the positive relationship between the number of tweets and population size is clearly visible; the number of tweets increased in densely populated areas and decreased in sparsely populated areas.
There may be specific reasons behind the differences in the number of tweets between one area and another. We found that the size of a residential area clearly affects the difference in the number of tweets. The greater the size of an area, the greater the population, and this is reflected in the number of tweets within it. For example, Salwa and Bayan have eleven residential plots, while Albeda only contains one.
Another reason for the apparent number of tweets in some urban areas of Kuwait relative to others may also have to do with the nature of these areas, where ’nature’ refers to the classification of land use (e.g., residential, investment, industrial, commercial, or any combination of these uses). This diversity in land use varies in distribution from one area to another. For example, there are areas, such as the Alsadeeq and the Albeda, which are used exclusively for private housing, while the Hawalli and Jabriya areas include both residential investment (buildings) in addition to private residences, shops, universities and hospitals. Therefore, the nature of an area affects the number of visitors and residents within it, and this is reflected in the uneven number of tweets emanating from within.
Economic aspects, such as land value, office space rental costs per square meter, or residential rental prices, also play a role in tweet volume variation from one city to another, so it is possible to link the higher number of tweets and rental prices, for instance, which result in population increase and a commensurate increase in regional tweets.
Lastly, another reason for the discrepancy in tweet volume from one area to another may be due to the age of each development. Older, more established areas will tend to have larger populations in comparison to newer developments only just starting to build their housing estates, for example. In general, newer areas usually have smaller populations and, hence, produce fewer tweets and vice versa.
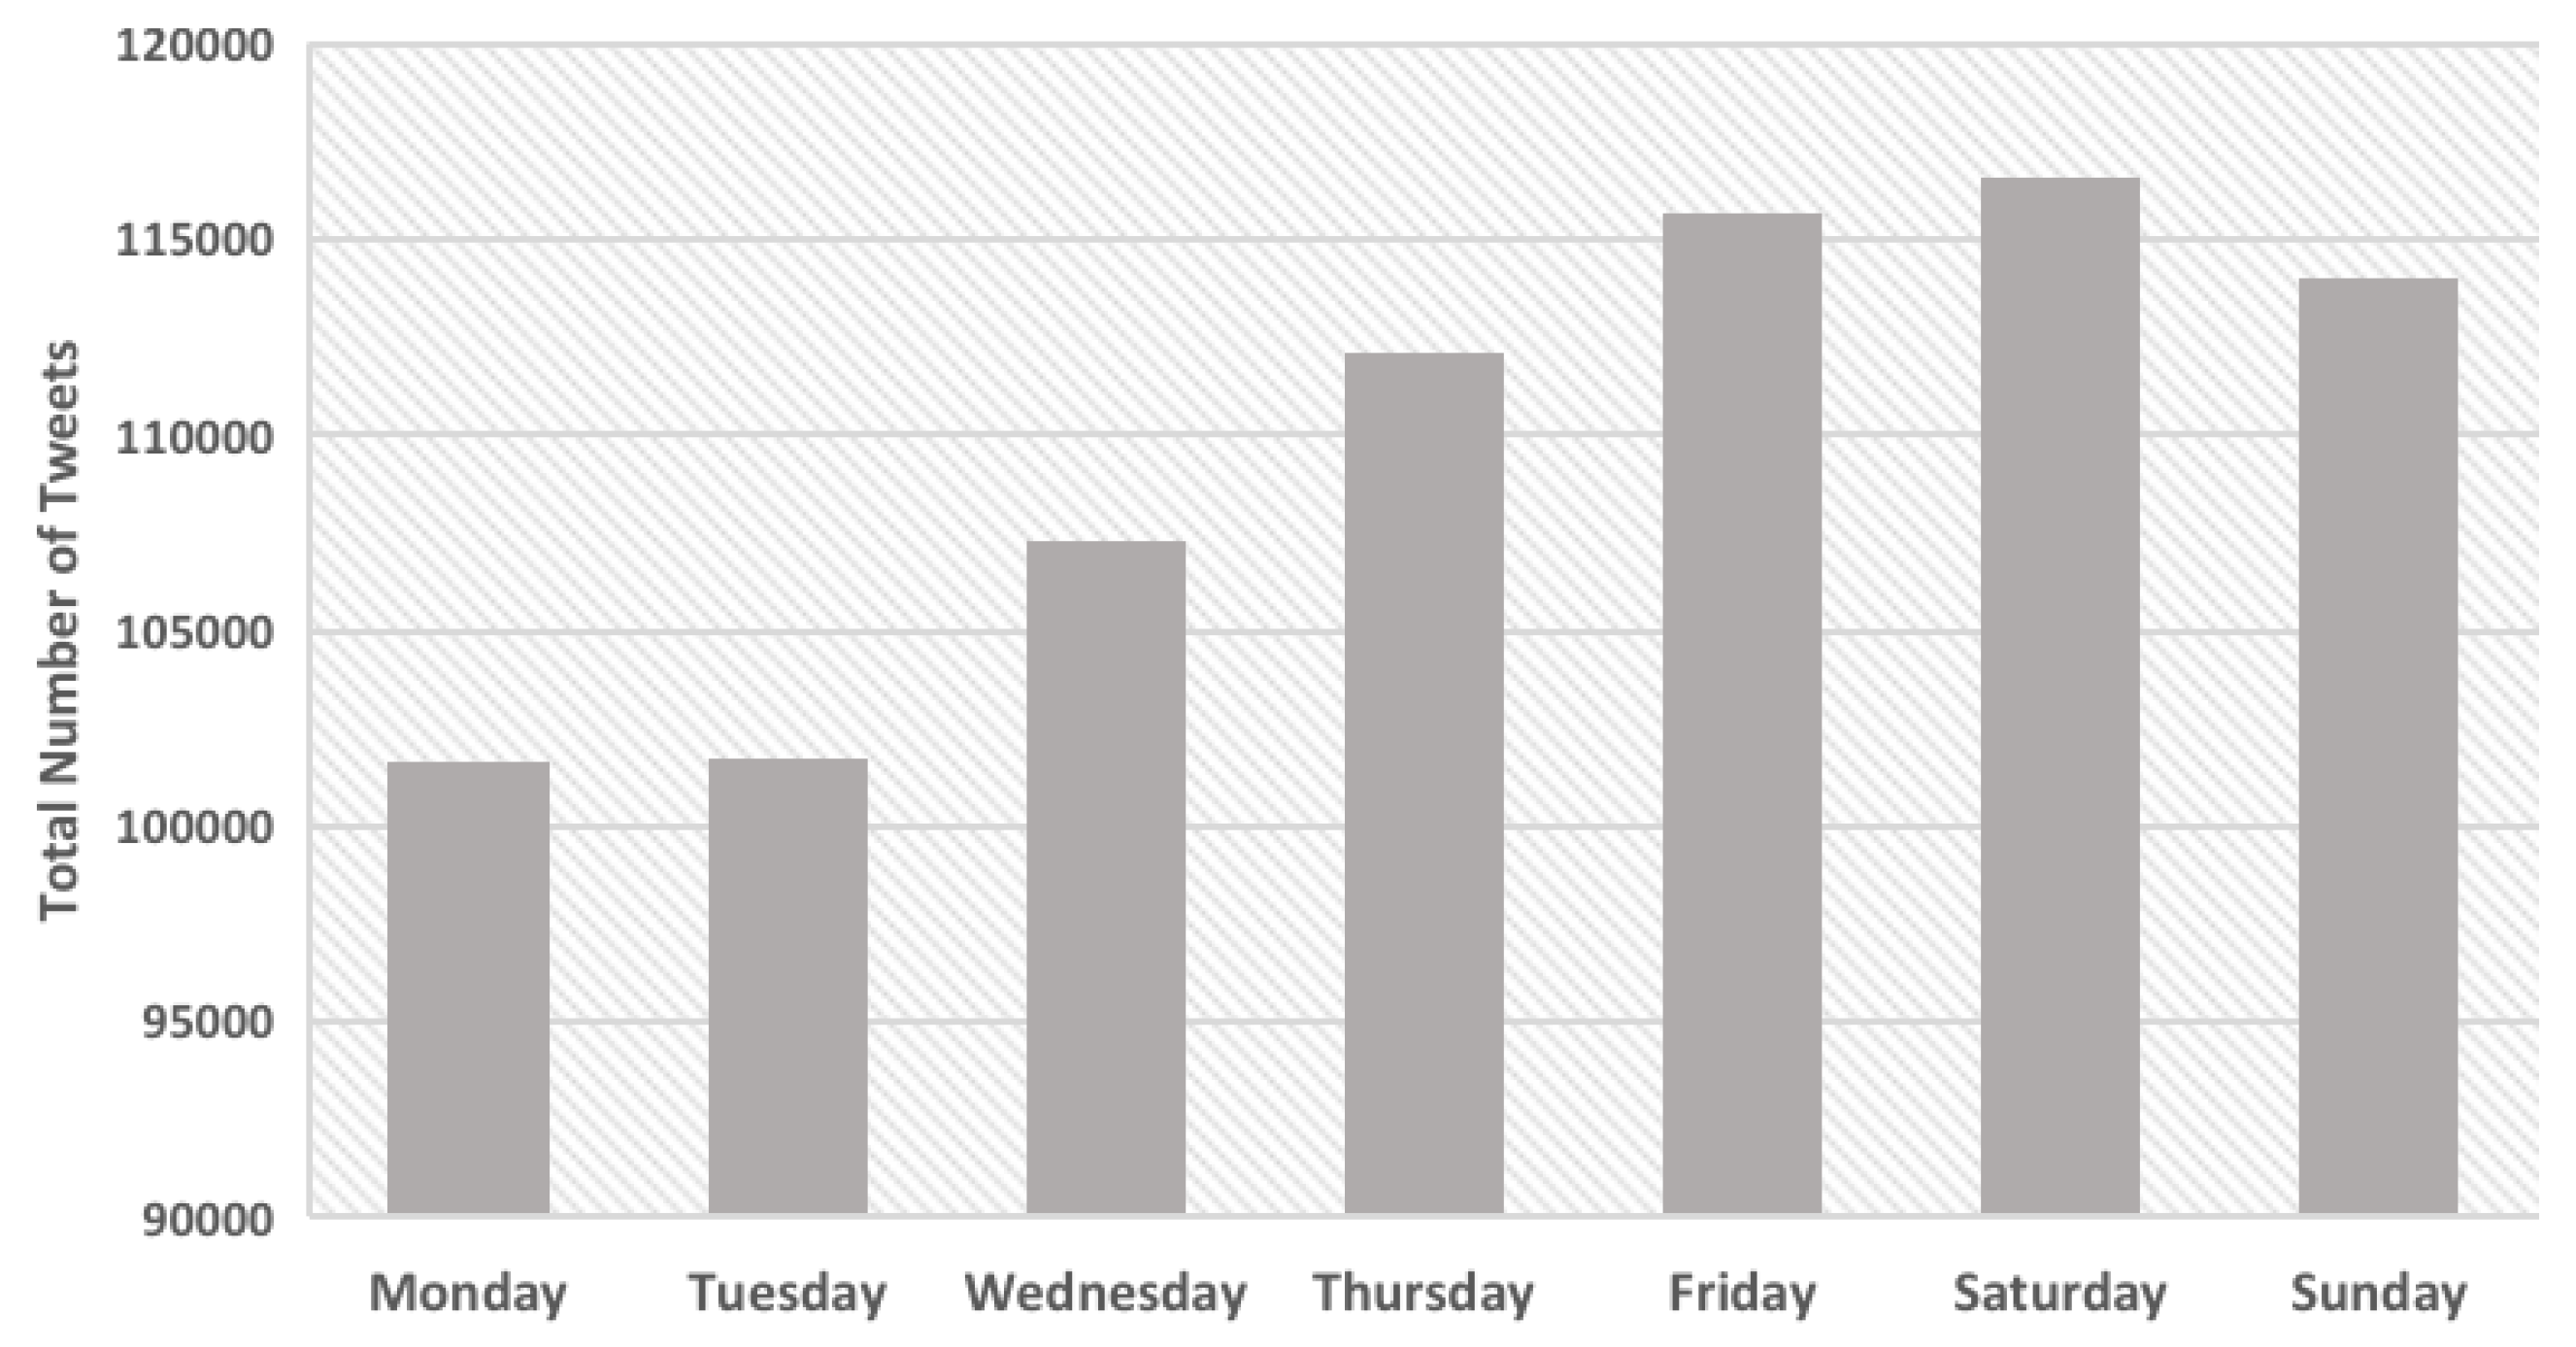
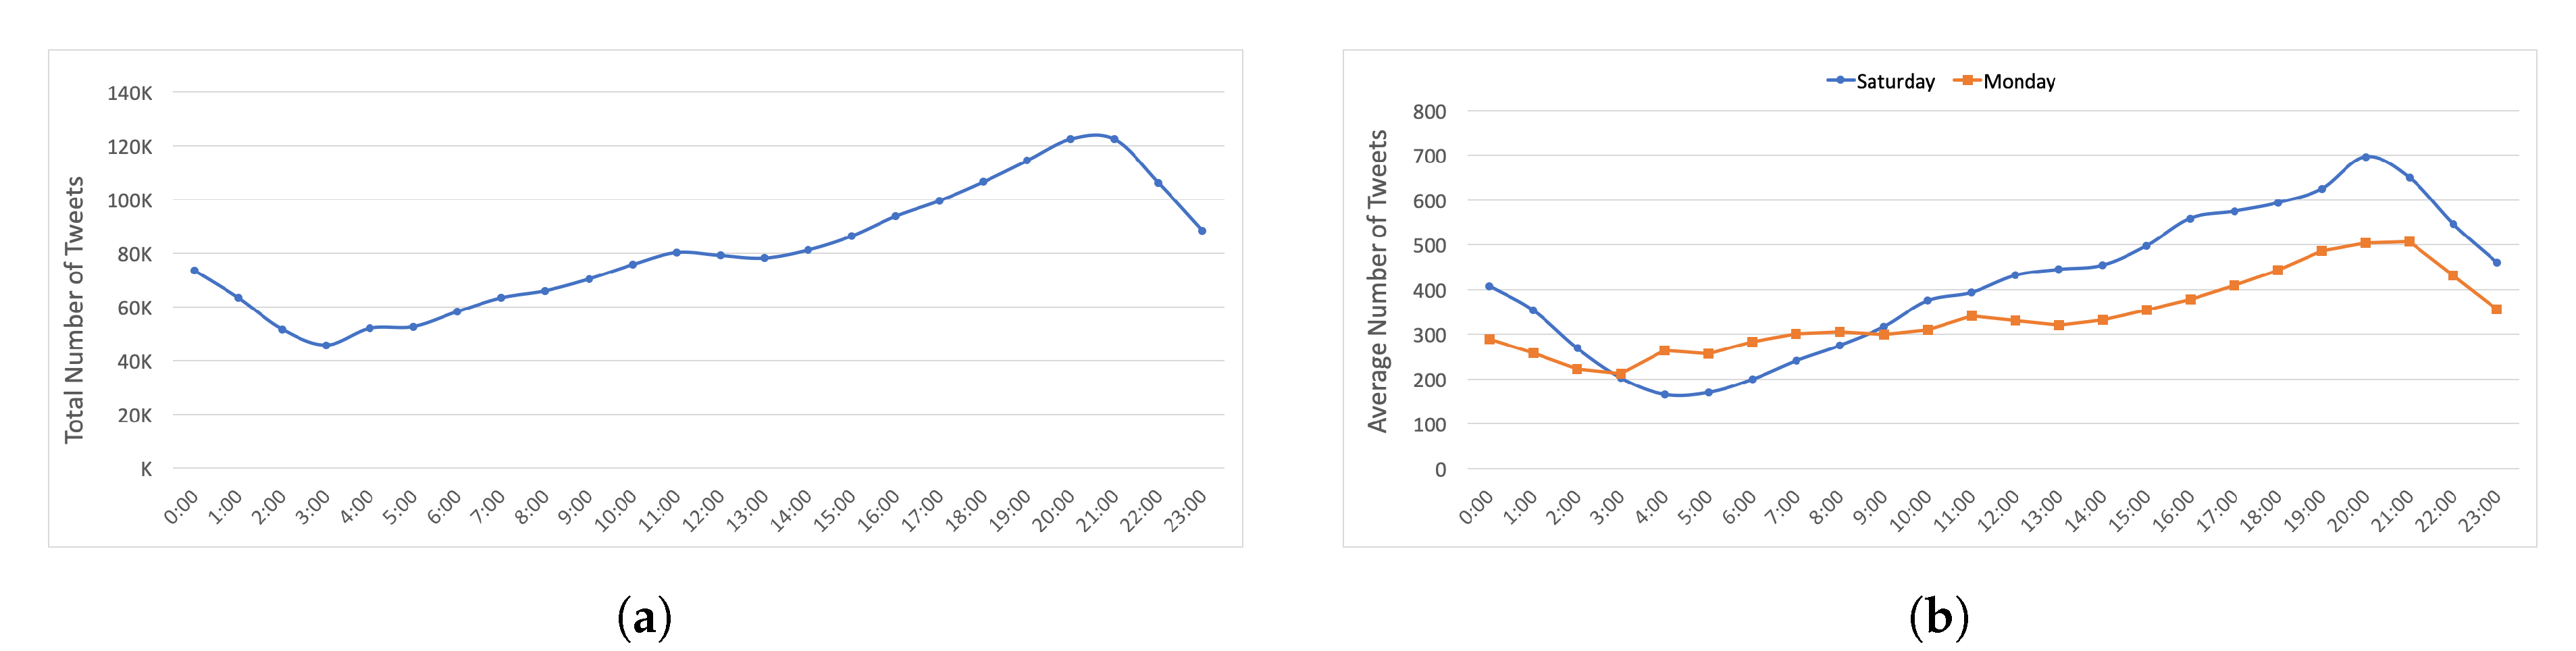
Regarding the temporal dataset,
Figure 4 shows the total number of tweets posted each day. The total number reaches peaks of around 115,000 and 116,000 over weekend days (i.e., Friday and Saturday, respectively) in Kuwait. Meanwhile, the lowest tweet volumes (101,000 and 102,000) appear on Monday and Tuesday, respectively. It is interesting to note that the number of tweets posted on Saturday was approximately 30% higher than for Monday. This indicates a clear tweeting pattern, where Twitter users tend to post more tweets the closer it gets to the weekend. This result supports previous research from Xu and Chawla [
2], who concluded that the number of tweets increased during weekends, with the volume being 40% greater at night than during daytime. A possible explanation for the high activity rate over weekends might be due to more people having more free time to spend on Twitter. Moreover, the number of tweets gradually increased from 1 p.m. to 9 p.m. The reason for the high engagement rate from afternoon to early night is fairly obvious; a majority of people work in the morning and, thus, have more time to post tweets after working hours. Furthermore, people have more free time on Saturday and they are likely to stay up later; consequently, the number of Saturday tweets is greater than for Monday.
Figure 5a shows the total number of tweets posted per hour. In general, the number of tweets gradually increased between 3 a.m. and 9 p.m., which can be further subdivided into 3 a.m.–11 a.m. and 1 p.m.–9 p.m. Focusing on the second segment, people posted nearly 80,000 tweets between 1 p.m. and 2 p.m., peaking at over 120,000 from 9 p.m. to 10 p.m.
Figure 5b compares the tweet average per hour on Monday and Saturday; people posted significantly more tweets from afternoon until early night on Saturday than on Monday.
4.2. Top Topics of Interest in Kuwait
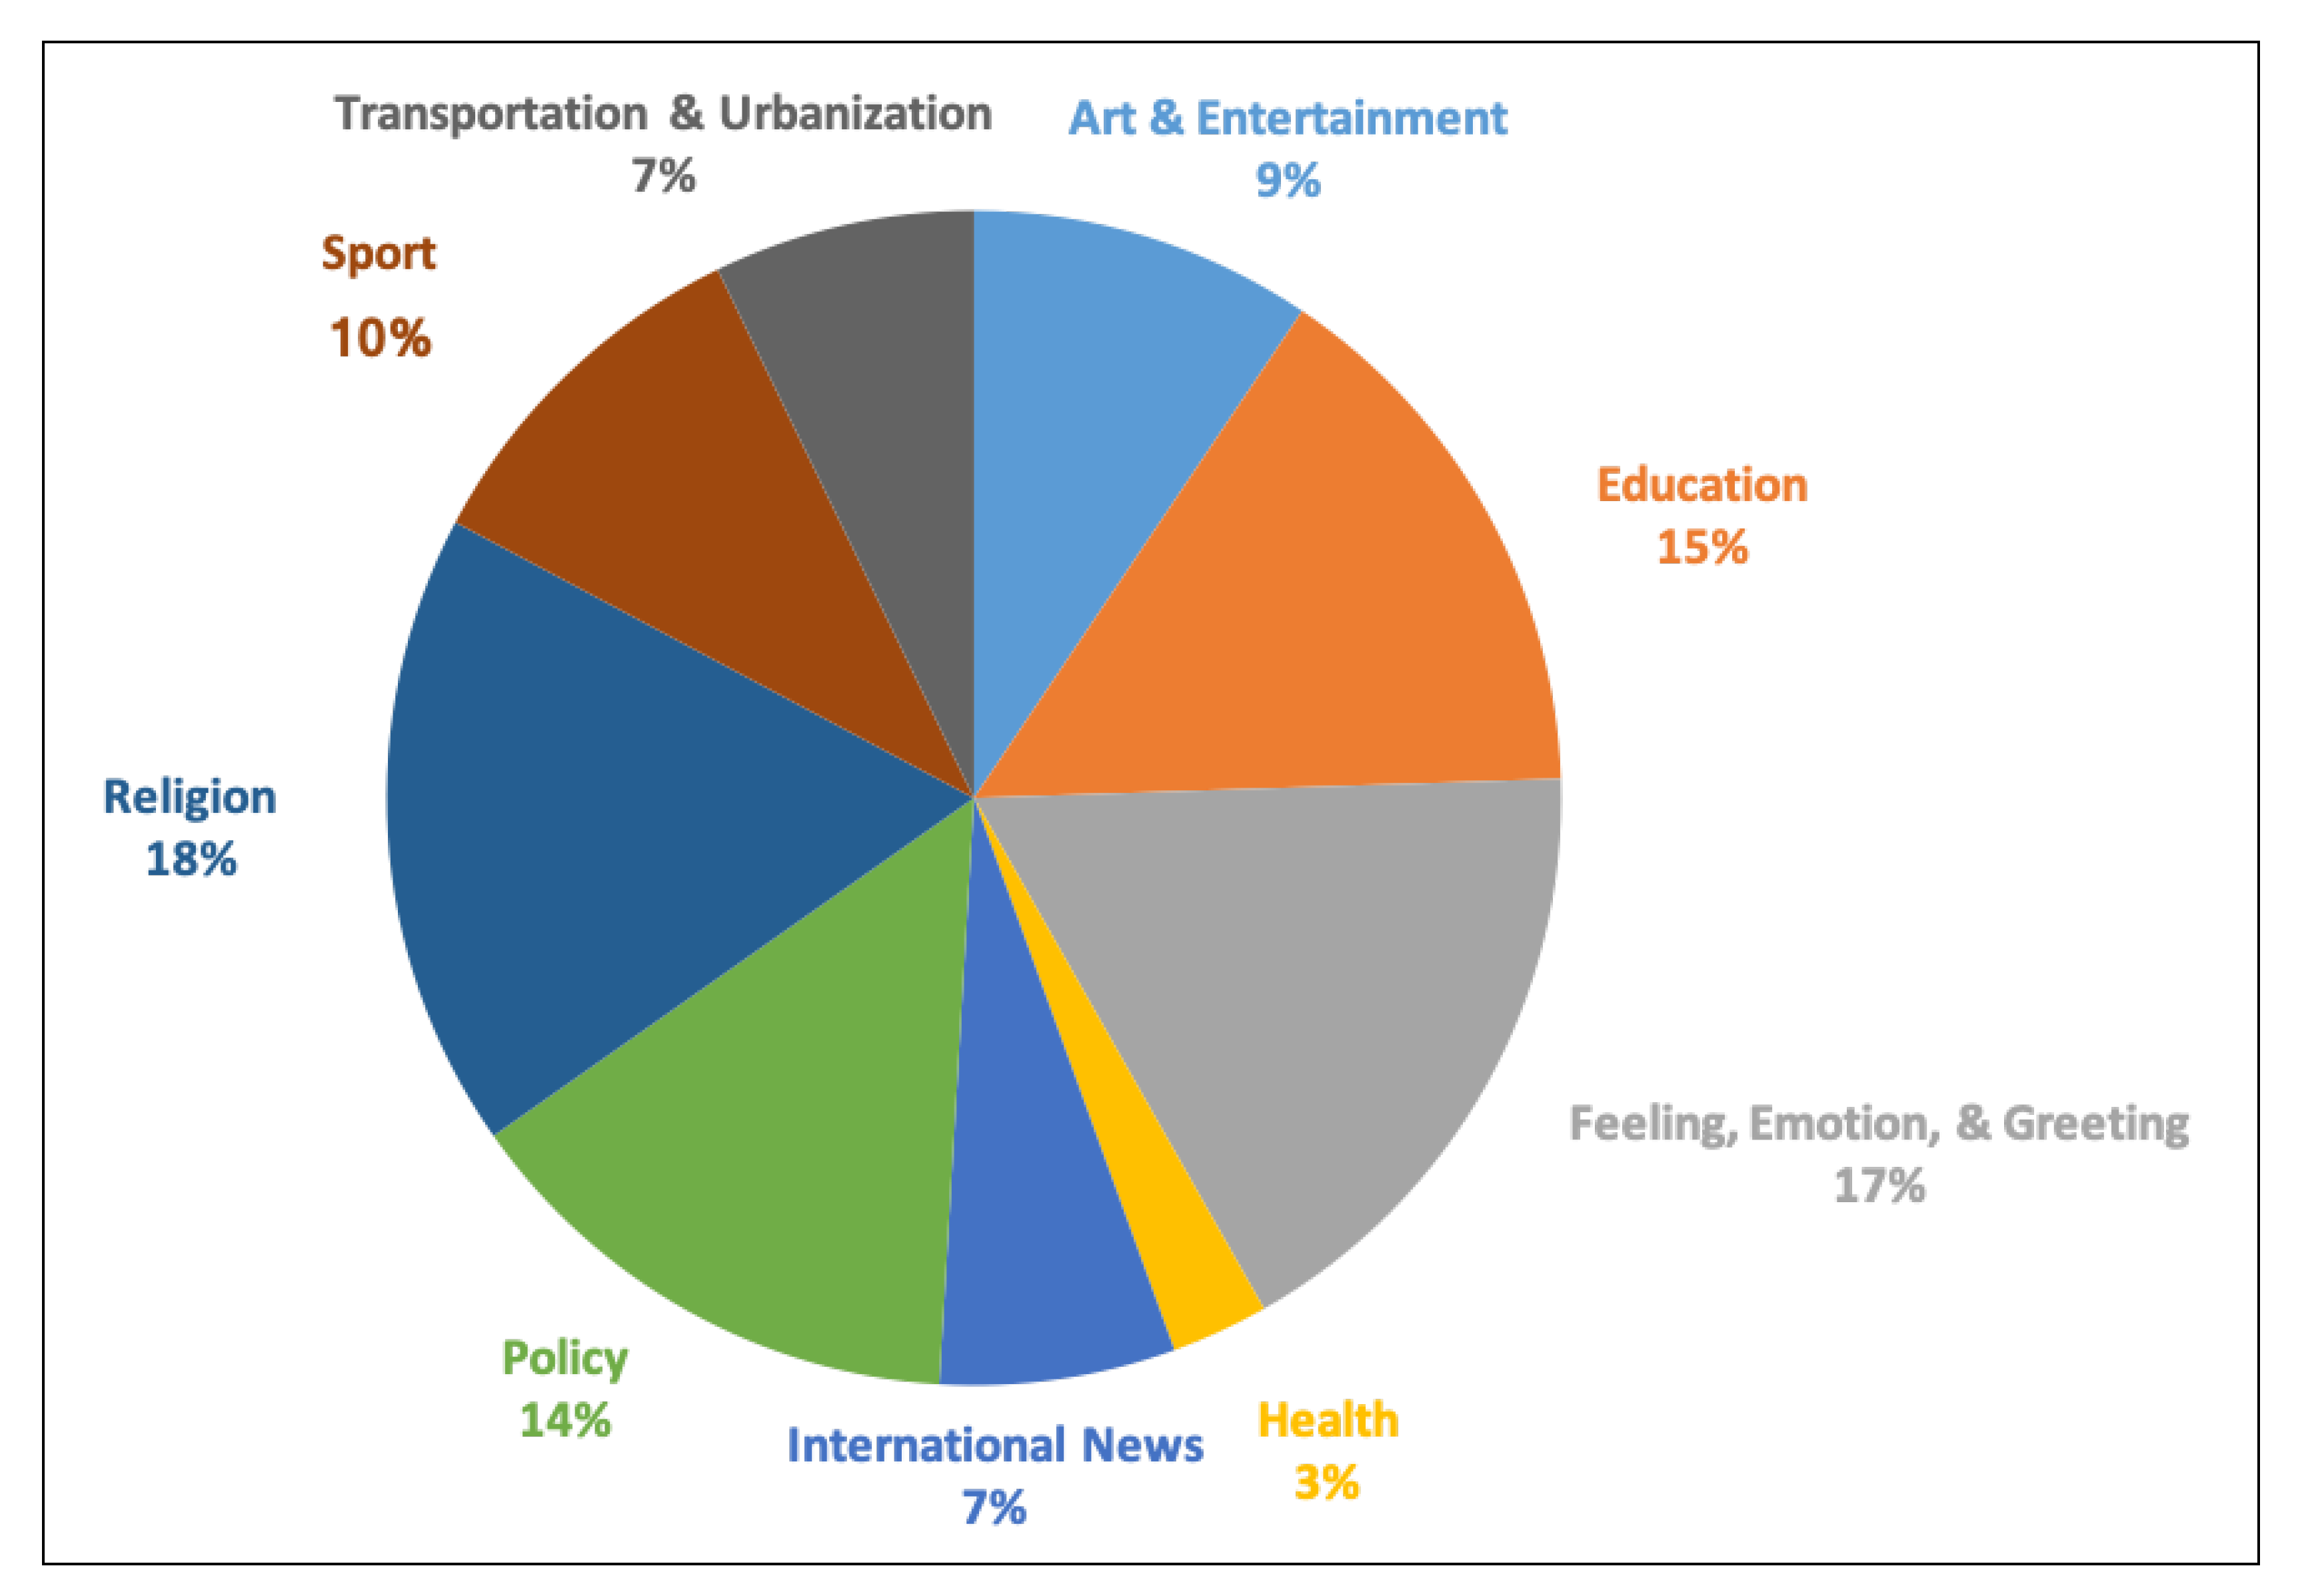
To address RQ1, “what are the top topics of interest of Twitter users in Kuwait?”, keyword identification with TFIDF score calculation methods were used in order to determine the top topics of interest in Kuwait. The results showed that there are about 700,000 tweets classified under the nine topics of interest.
Table 5 shows the number of tweets in each topic, while
Figure 6 illustrates the percentages for the different topics.
Religion is the most popular (18%) across all nine topics, whilst health is the least popular (3%). This is consistent with expectations, since religion plays such a major role in shaping Kuwaiti public life; Islam is the main source for legislation. As a United Nations report [
45] from 2017 indicated, Kuwait’s population is expected to reach 4.2 million in 2020, with more than 75% being Muslim. The estimated number of non-Muslims is expected to be roughly 1.0 million. Given the nature of the Islamic faith, being built as it is around the practice of worship in several ways that include calls to prayer at five different times each day, and the reading of supplications and Dhikr, it is unsurprising that the number of religious tweets is the highest in the study area. It is worth noting that there are many religious Twitter accounts that post reminders to people about the times for prayer, remembrance, and other details. Another factor that may be relevant to the high number of religious tweets recorded during the 10 month study period involves two important Islamic celebrations occurring within it, namely Eid al-Fitr (the holiday after Ramadan) and Eid al-Adha, which comes at the conclusion of the Hajj season. There was an increase in the number of religious tweets surrounding those events.
Following religion, emotional expression ranked next in topic popularity, at 17%, then education at 15%, and public policy, 14%. The topic of emotion includes tweets expressing feelings of happiness, love, greetings, congratulations, etc. It is unsurprising that the emotion topic ranked only just behind the total number of tweets for religion, because users often share their feelings with others in tweets, even if those tweets are ostensibly about other topics. For example, when a user wants to talk about politics, the actual political commentary often ensues after an opening or welcoming tweet, or in response to a political tweet. Expressing emotion is a fundamentally human quality.
Educational tweets were classified as such if they contained keywords, such as college, university, school, student, etc. Education is a central societal pillar in most countries of the world; its efficacy has defined the past and the present, and it will likely also define the future, especially in developing countries. Most societies want to ensure a better future for following generations, especially those in developing nations hoping to provide better lives for their citizens; a quality education is a significant key to achieving this success. Therefore, it should be no surprise to see a high number of tweets that are related to the topic in this study; it bears evidence to people’s awareness of the importance of education. The number of tweets varied from one city to another relative to population size and the locations of schools, universities, and other educational institutions. Geographical location had a clear impact on determining the varied uses of Twitter to talk about education. For example, cities that contain many schools or universities have more tweets about education than do others with fewer such institutions.
Kuwait is one of the only semi-democratic countries in the Middle East, so a high number of public policy-related tweets should be expected. Indeed, Twitter is one of the most frequently used applications in Kuwait for talking about politics, even more so than Facebook and other social media applications. The increase in Twitter usage in the study area may be due to its ease of use in comparison to similar applications; it is easy to quickly express an opinion, suggestion, or political criticism on Twitter. The geographical distribution for the number of political tweets significantly differed from the other Twitter topics, because political participation in Kuwait is limited to male and female citizens over the age 21. Therefore, most of the areas that noted the highest number of political tweets occurred in areas predominantly inhabited by citizens, while religious, emotional, and educational tweets were more evenly spread across the entire population.
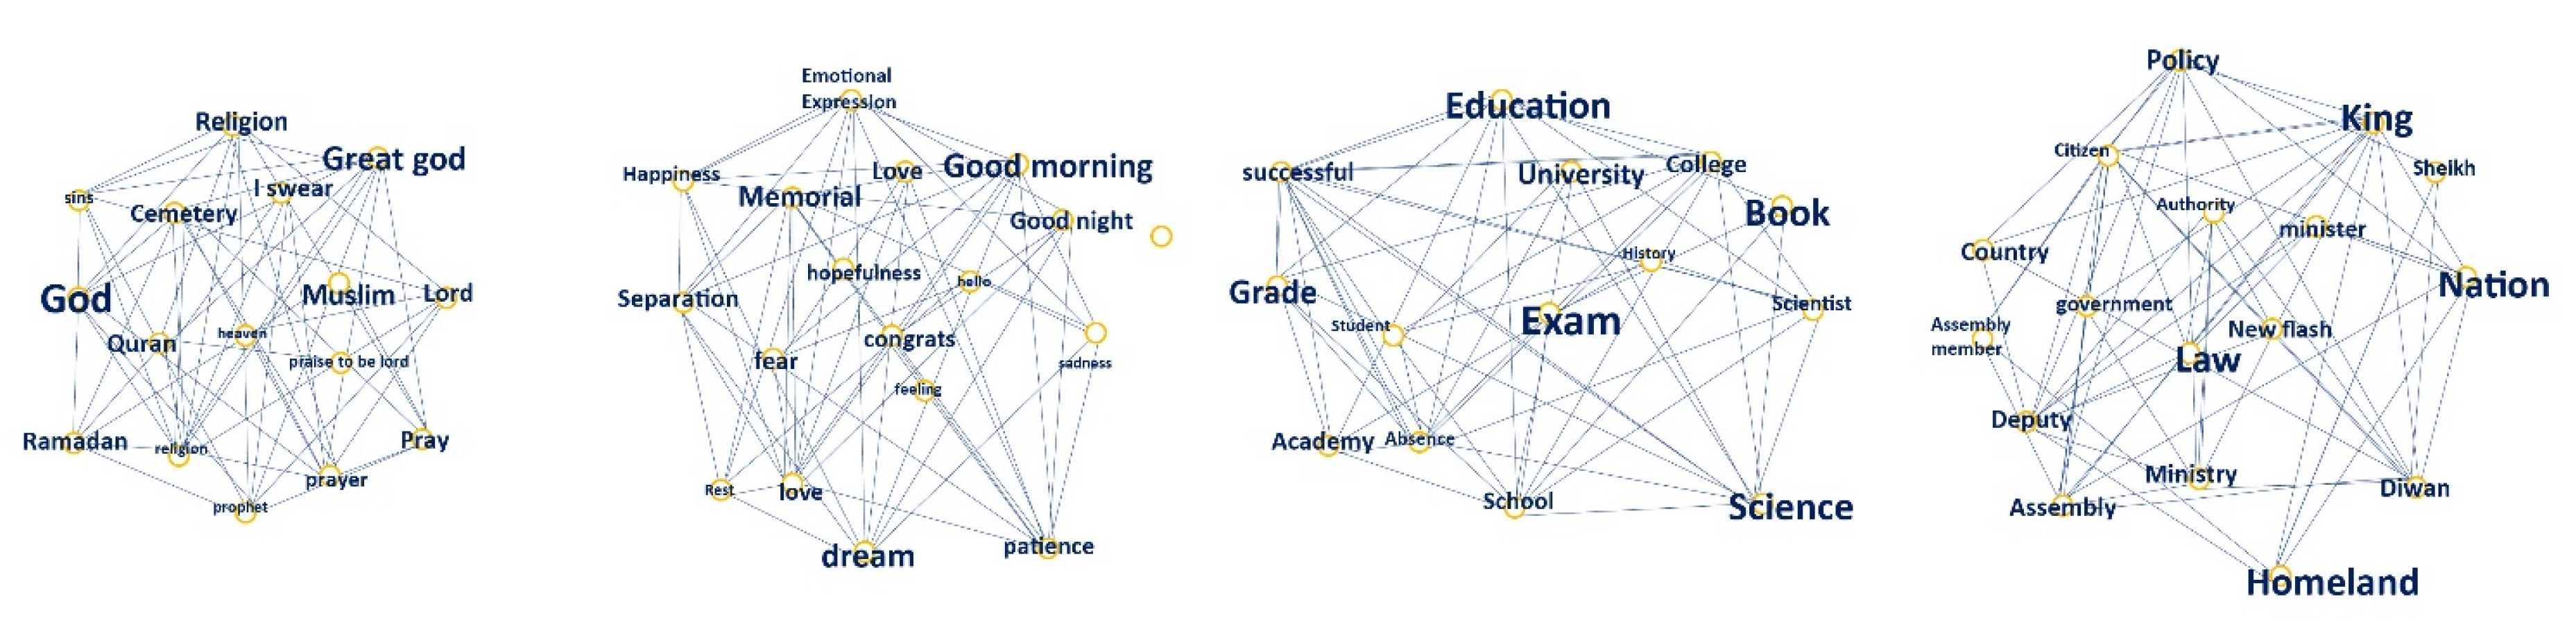
Figure 7 offers a visual representation for the frequency of each word-related topic. The words are correlated to each other and widely used in tweets, with more frequently used words appearing in larger font sizes. For the religion topic, “god”, “great god”, and “Ramadan” are the most frequently tweeted words. For emotional expression, words of greeting, such as “good morning” and “good night” are most common, whereas for education, “exam”, “education”, and “book” were the key words most often in use. Regarding public policy, the words “law”, “nation”, and “king” were the most often employed.
4.3. Visualization of Top Topics of Interest
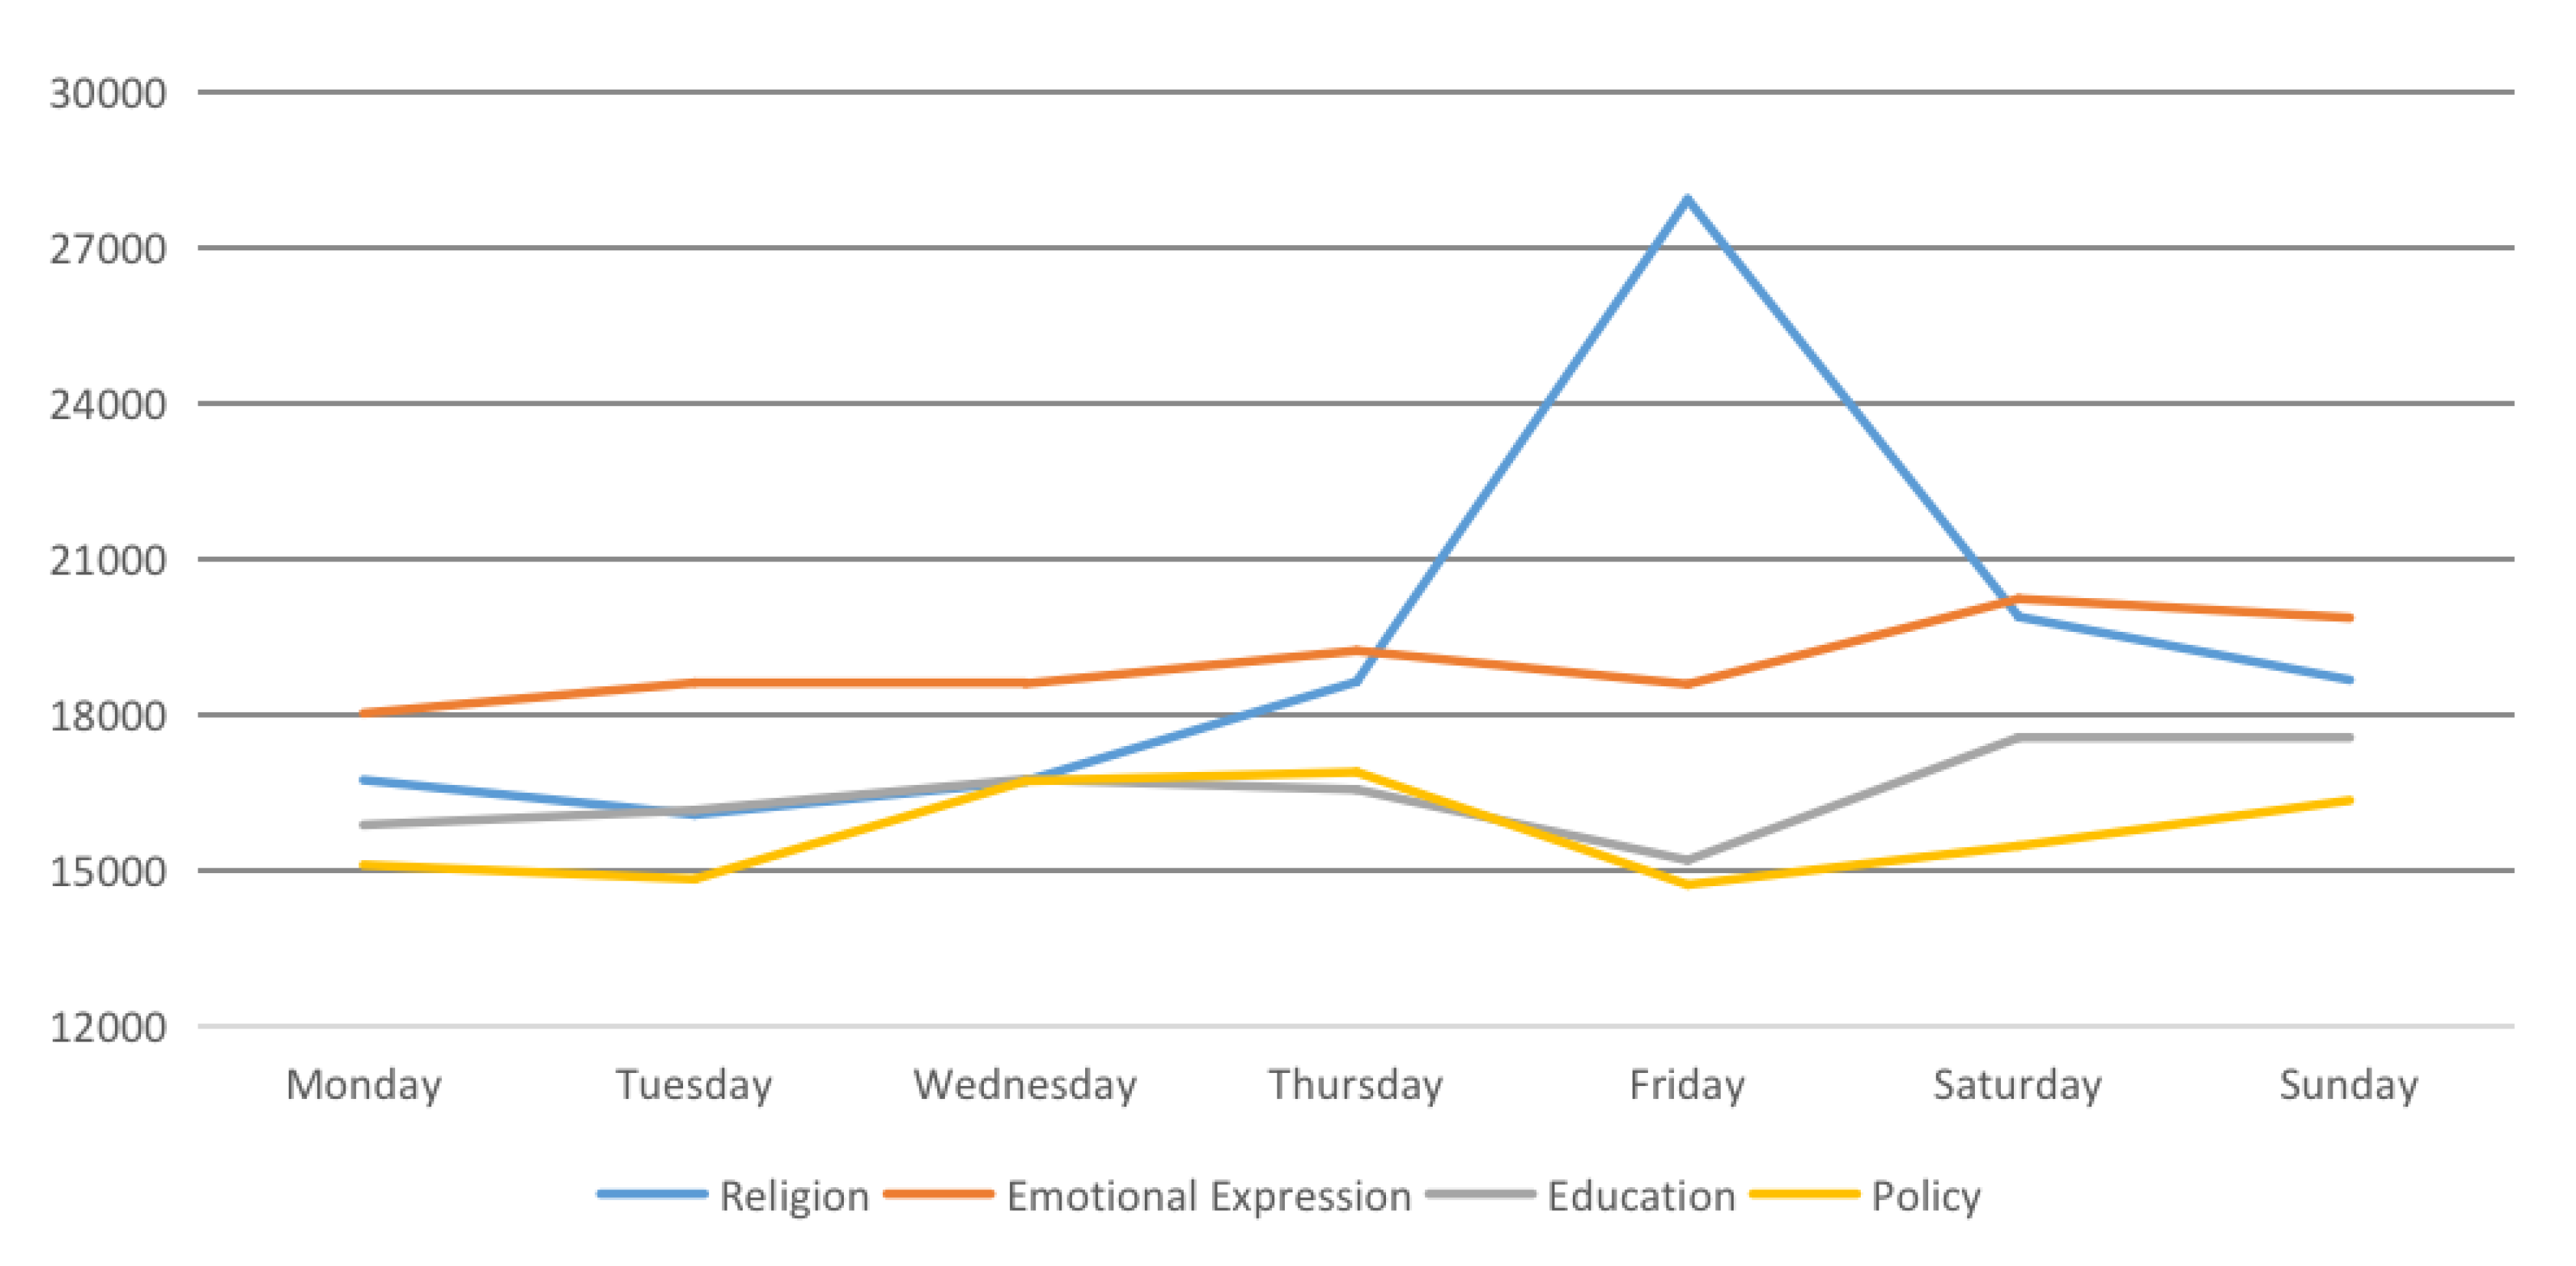
This section aims to address RQ2: “what are the general spatiotemporal distributions of the four top topics of interest in Kuwait?” From a temporal perspective, the line graph and temporal decomposition in
Figure 8 and
Figure 9 visualize the temporal variation of popular topics during the hours and days in a week. The figures show results in the topics of interest when comparing weekdays to weekends. The volumes of educational and political tweets are larger on weekday afternoons than weekends, a reflection of human behavior. During weekdays, many people spend time in educational or governmental places, so it is natural that those people that are employed in an educational or governmental context may engage in related discussions in person and/or on social media when at their workplaces, whilst they may prefer spending time with family or at entertainment locations during weekends.
In contrast, the emotion topic recorded a higher number of tweets on weekends from 4 p.m. until midnight, with the peak being on Saturday. However, this is inconsistent with Farnadi et al. [
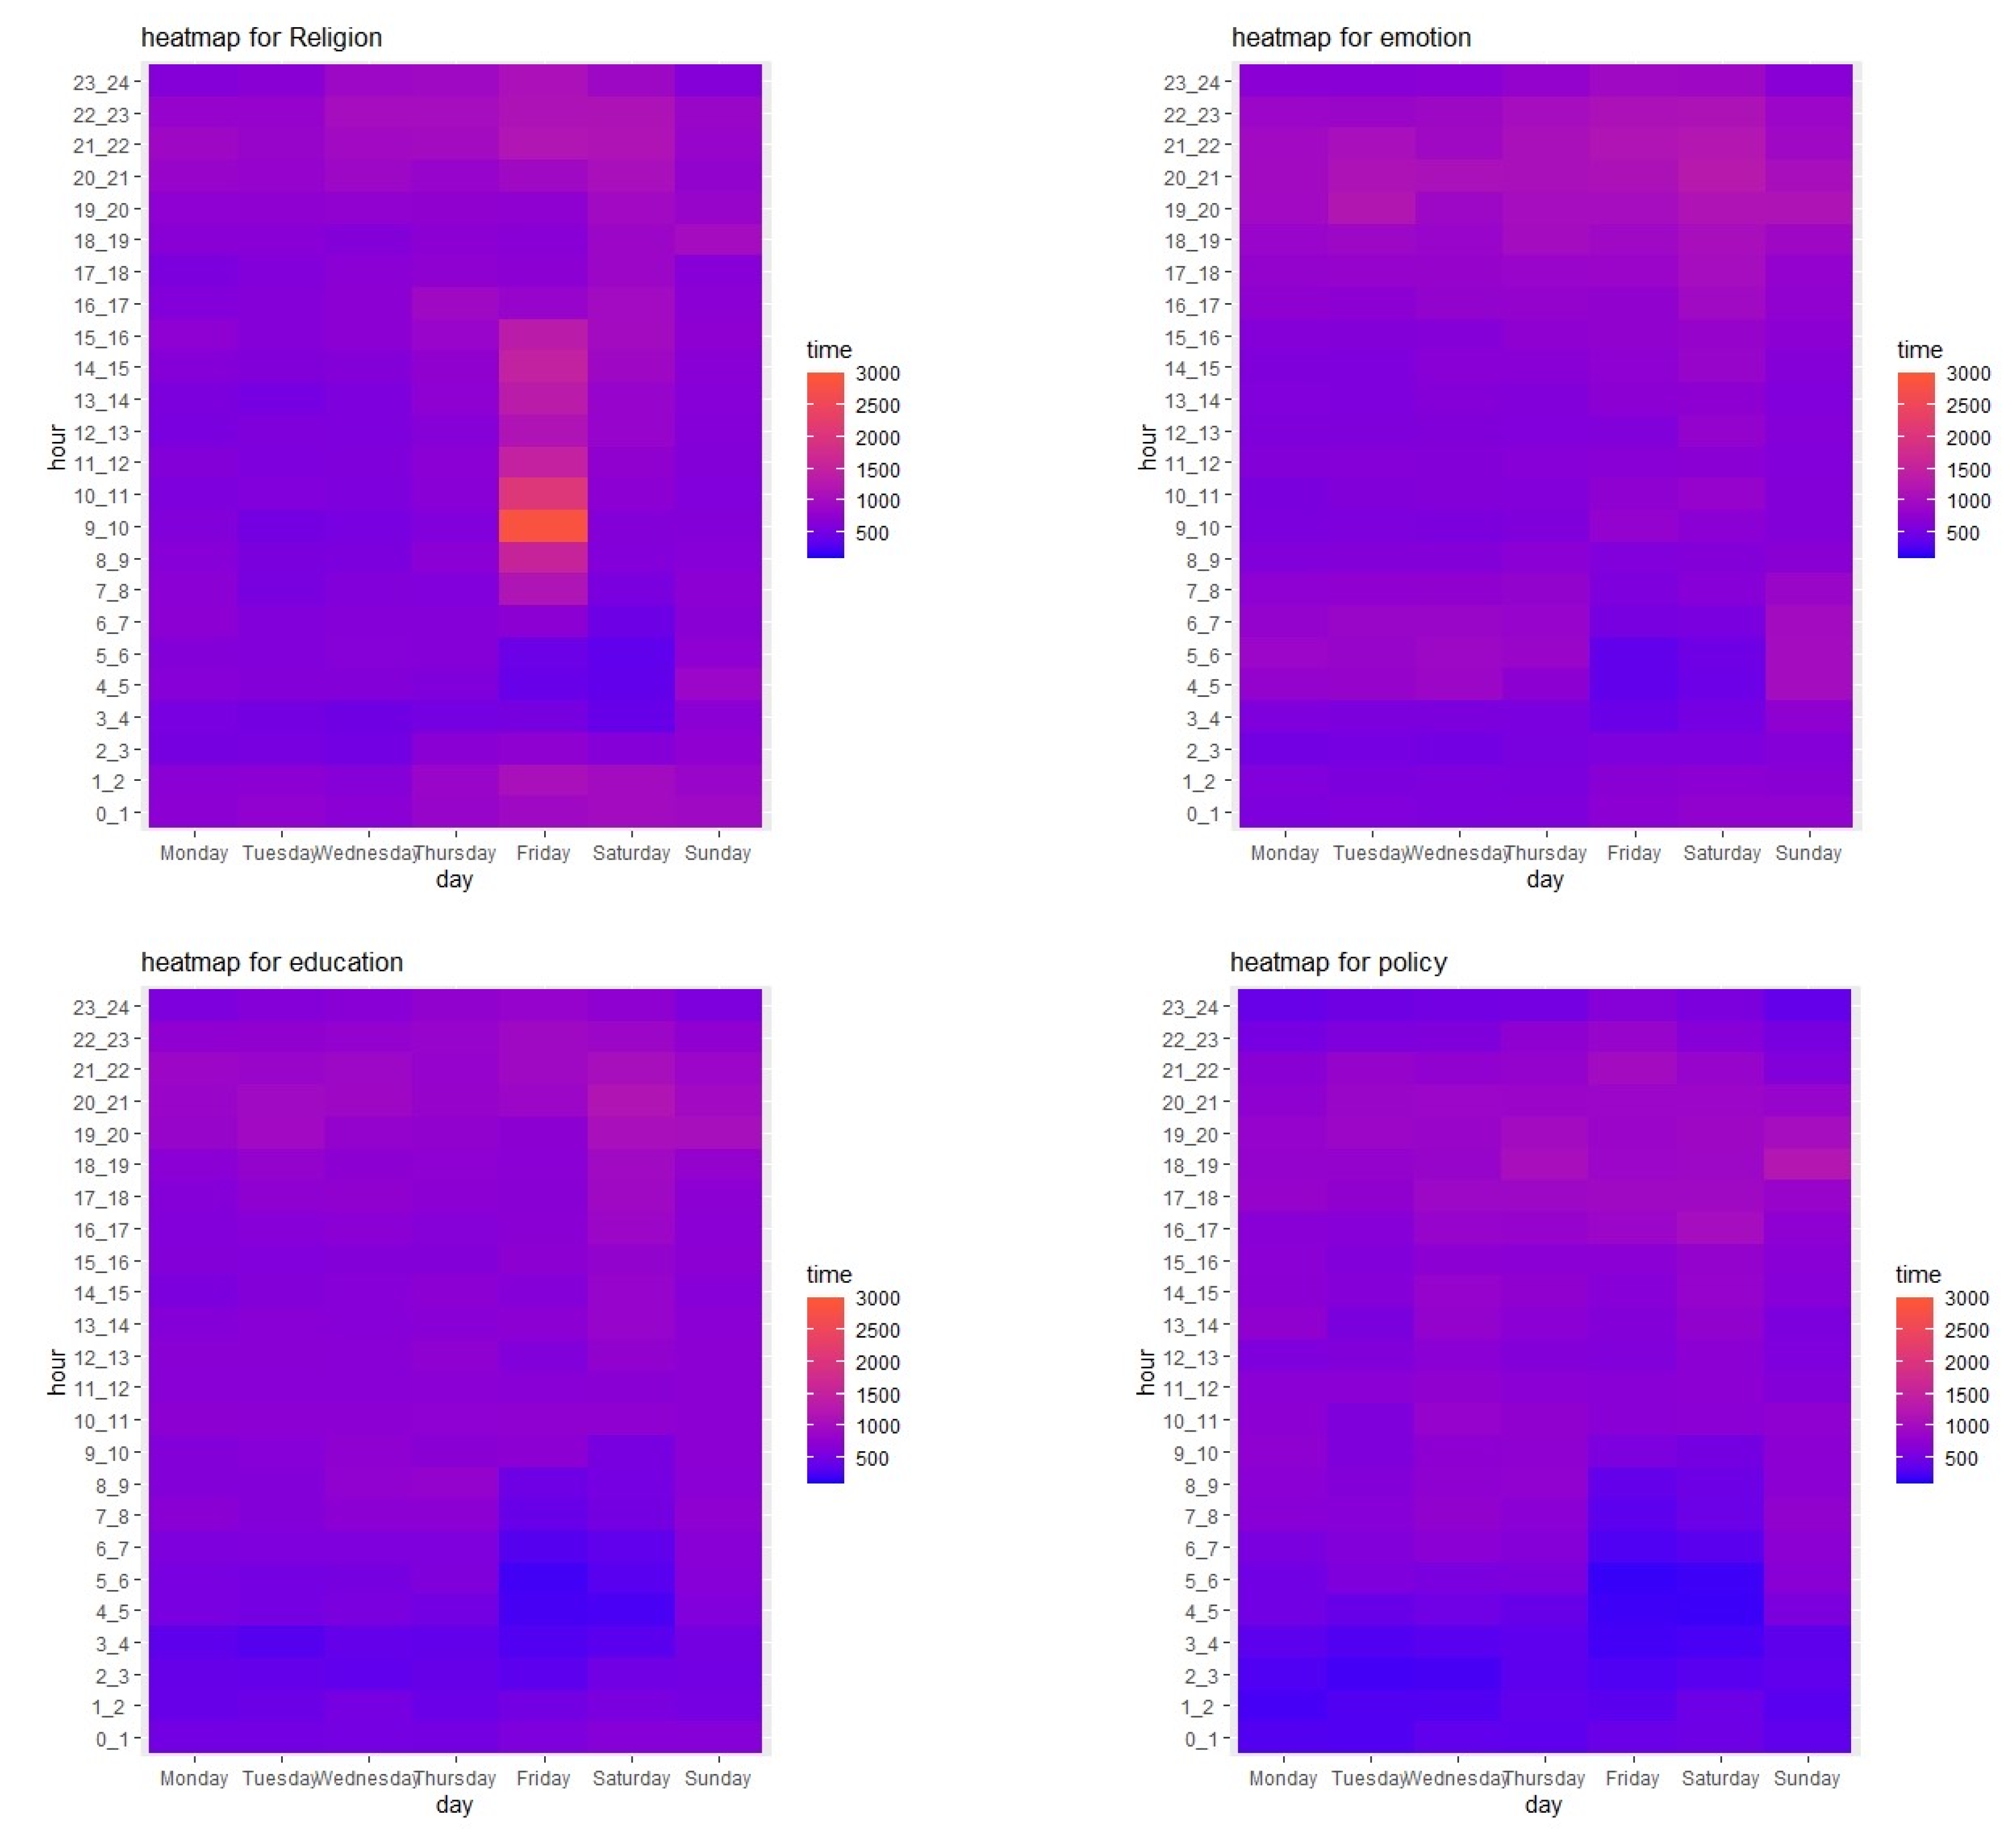
50], whose study showed that people are more likely to express their emotions through social media (in this case, Facebook) on weekdays rather than weekends. This inconsistency might be related to the type of social media platform under evaluation (Facebook vs. Twitter). For example, people interact with their family and real-life friends via Facebook, while, on Twitter, they tend to tweet about specific topics that interest them to whomever might be listening. Therefore, the subtle differences in functional purpose between Facebook and Twitter may account for this inconsistency. Regarding religion, people posted a higher number of religious tweets on Fridays, especially during prayer times (usually the prayer at 12 p.m.) from 6 a.m. to 2 p.m. One possible reason explaining this is that Friday is a Muslim holy day, when Muslims gather to pray alongside their congregation. People tend to post tweets as a reminder to pray or to offer insightful knowledge on Islam. The clustering graphs reveal the most frequently used words in each topic.
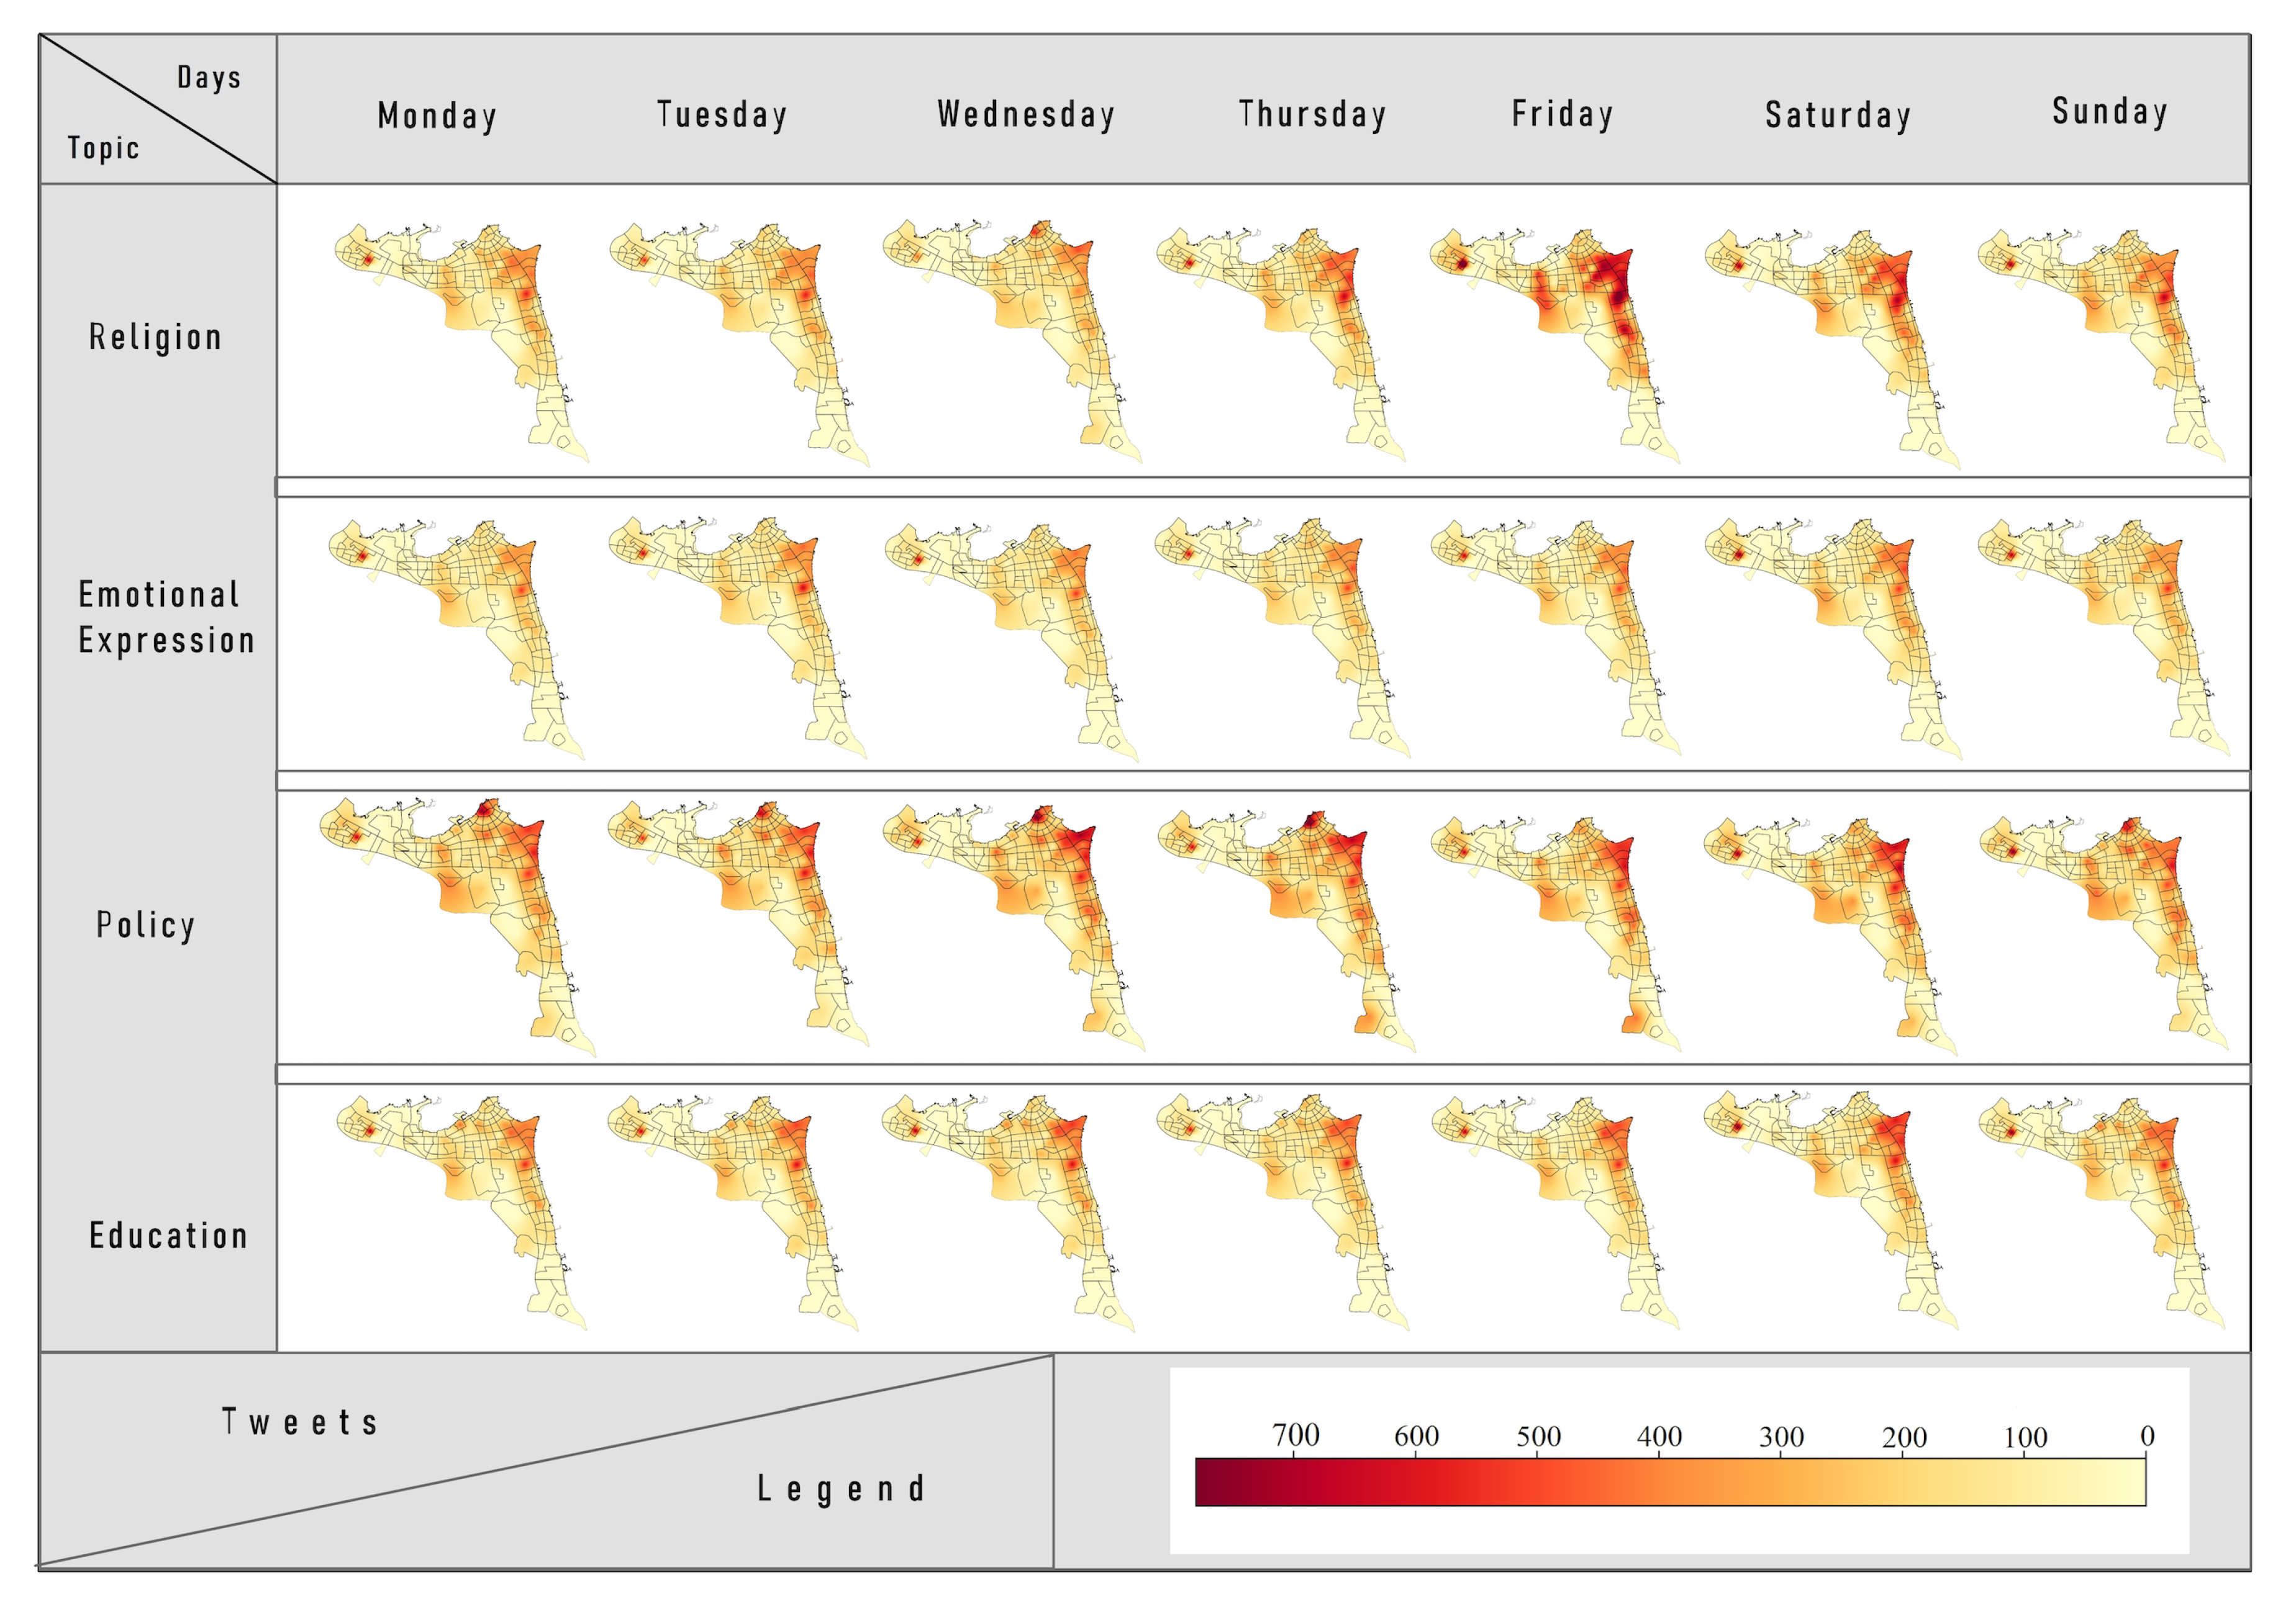
For further analysis, we used ArcGIS in order to visualize the topics in each area for each day.
Figure 10 represents the spatial distribution for the topics of religion, policy, education, and emotion for each day of the week, helping to define the differences in tweet time and space. From the temporal perspective, and as discussed previously regarding
Figure 8 and
Figure 9, it is clear that the volumes of educational and political tweets are higher on weekdays than on weekends, which again reflects human behavior. As noted previously, many people spend time in educational or governmental places on weekdays, and may engage in educational and political discussions, both face-to-face and via social media, within these contexts. However, on the weekend, they likely prefer spending time with family or at places of entertainment.
In contrast, the emotional expression topic recorded a higher number of tweets on weekends, with the peak coming on Saturday, whilst the highest numbers of religious tweets was on Fridays.
From a spatial perspective, the data presented in
Figure 10 indicate that the Hawalli Governorate has the highest numbers of tweets in three topics of interest: emotion, religion, and education. One possible reason is that Hawalli is considered a commercial area, having many shopping malls, cafes, and universities, especially in the Salmiya district. Therefore, people visit Hawalli for both entertainment and educational purposes. Moreover, the Kuwait Governorate (Capital of Kuwait) recorded the highest number of political tweets. This seems to be logical when you consider that this governorate has the highest number of political activities due to the large number of governmental offices, embassies, and even the Kuwait National Assembly buildings, which are present.
4.4. Topic Exploration
The following section will discuss each topic in greater depth:
Religion Topic. As already noted, religious tweets recorded their highest numbers over weekends, peaking on Fridays. On Fridays, the area of Sabah Al Salem recorded an average of more than 800 religious tweets, while in Salmiya, Salwa, Qurain, Jabriya, and Salam, this number approached 800. Mondays and Tuesdays typically recorded the lowest numbers of religious-oriented tweets, with the average number not exceeding 400 in most recording areas except for a few in Hawalli Governorate such as Salam, Abdulla Al Mubarak, Jabriya, Salmiya, and Salwa. Although the Hawalli Governorate is the smallest of Kuwait’s six governorates in terms of area, it is largely residential and the most densely populated. From the data, it was also clear that the Hawalli Governorate recorded the highest number of religious tweets.
Policy Topic. As mentioned earlier, political tweets were posted in their highest numbers on weekdays, and most especially on Thursdays. The lowest numbers occurred on weekends, most notably on Fridays. Furthermore, the highest average for political tweets posted were from within the capital of Kuwait (Alaseema). Indeed, on Thursdays, the capital recorded the highest number of policy tweets, averaging over 600 in the Qibla area. On weekends, political tweet averages are below 400 in most areas.
Educational Topic. Educational tweets occurred in their highest numbers on weekdays, averaging at around 400 in most areas, whilst the lowest numbers posted on Fridays, not exceeding 200 in most areas. It should be noted that the Hawalli Governorate recorded the highest number of educational tweets, especially in Salmiya, Jabriya, and Bayan. Location plays an important role in identifying people’s potential interests [
51], especially when it comes to how the land in a particular area is used. For instance, some cities in the State of Kuwait have an abundance of public and private schools, whilst others do not. This disparity is due to the distribution of land use allocations; areas with significant numbers of schools are more densely populated and they have many tall buildings. The high population numbers obviously result in a greater number of tweets related to education in these areas in comparison to others. For example, in Hawalli, Jabriya, and Salwa, the number of education-related tweets is high, due to the large number of private schools. Students share their experiences and discuss educational hashtags with others on Twitter [
52]. Regarding education, the Hawalli Governorate has the most educational buildings (schools, universities, institutions, and training clubs) and recorded the highest number of educational tweets. Hawalli is also home to many non-Kuwaitis, such as Egyptians, Syrians, Indians, and Nepalese. Consequently, there are many private schools here, including Pakistani, English, and Indian schools. There are also three universities in Hawalli: American University of the Middle East, Gulf University for Science and Technology, and The Australian College of Kuwait. This indicates a high number of students, teachers, and educational staff, who are likely to post education-related tweets.
Emotional Expression Topic. This topic led to a higher number of tweets on weekends, peaking on Saturdays. Furthermore, emotion-related tweets were posted in their highest Saturday numbers in the Hawalli Governorate, with the averages being greater than 600 in the Salmiya, Salwa, and Sabah Al Salem areas. Such tweets averaged between 400 and 600 in the Rumaithya, Jabriya, Salam, Abdulla Al Mubarak, Adan, Qurain, and Egaila areas. These results are inconsistent with Farnadi et al. [
50] whose study showed that people are more likely to express their emotions through social media (Facebook, in this case) on weekdays rather than weekends. As already noted, this inconsistency might be related to the type of social media platform under study: Facebook vs. Twitter. Regarding the spatial distribution, Hawalli recorded the highest numbers of emotional tweets. This is likely explained by Hawalli being a commercial center in Kuwait. Such public spaces play an essential role in offering social contact and allowing relaxed family time. People often want to express their feelings regarding such tourist destinations on Twitter [
53]. In contrast, Mubarak Alkabeer had the lowest number of emotional tweets. This governorate is mostly residential, with the fewest entertainment centers. It is also the most newly-established governorate, only housing about 250,000 people.
4.5. Spatial Autocorrelation of Topics of Interest
Two analysis methods were employed, Moran’s I and Getis-Ord Gi* statistic, to address RQ3: “are there any temporal and spatial patterns for topics of interest in Kuwait?”
Global Distribution Patterns of Topics of Interest. The Global Moran’s Index for the topics of interest for each day of the week were calculated while using the spatial autocorrelation tool (Moran’s I) in ArcGIS.
Table 6 shows the positive Moran’s I values for the different topics of interest and indicates the clustered topics of interest of the spatial distribution in Kuwait. Topics with higher values of Moran’s I mean that areas with the same topic are close to each other. The results show that little differences exist between Moran’s I values for each of the four topics. These values are sorted in descending order, as policy, religion, education, and emotional expression. The Moran’s I values for all topics for all days has a 95% confidence level.
Moreover, the null hypothesis states that: “there is no spatial clustering of the topics of interest across the days of the week in the urban area in Kuwait”. The p-value is 0.002 (0.002 < 0.05), and the absolute value of the Z score is large, which falls outside of the desired confidence level (>1.96). Therefore, we rejected the null hypothesis, concluding that there is indeed a spatial clustering of topics of interest in Kuwait’s urban area. However, the global distribution patterns for all topics is partially spatially clustered, because the Moran’s I ranged from 0.17 to 0.20, which is not high. The variations of clustering between topics or days were insignificant overall.
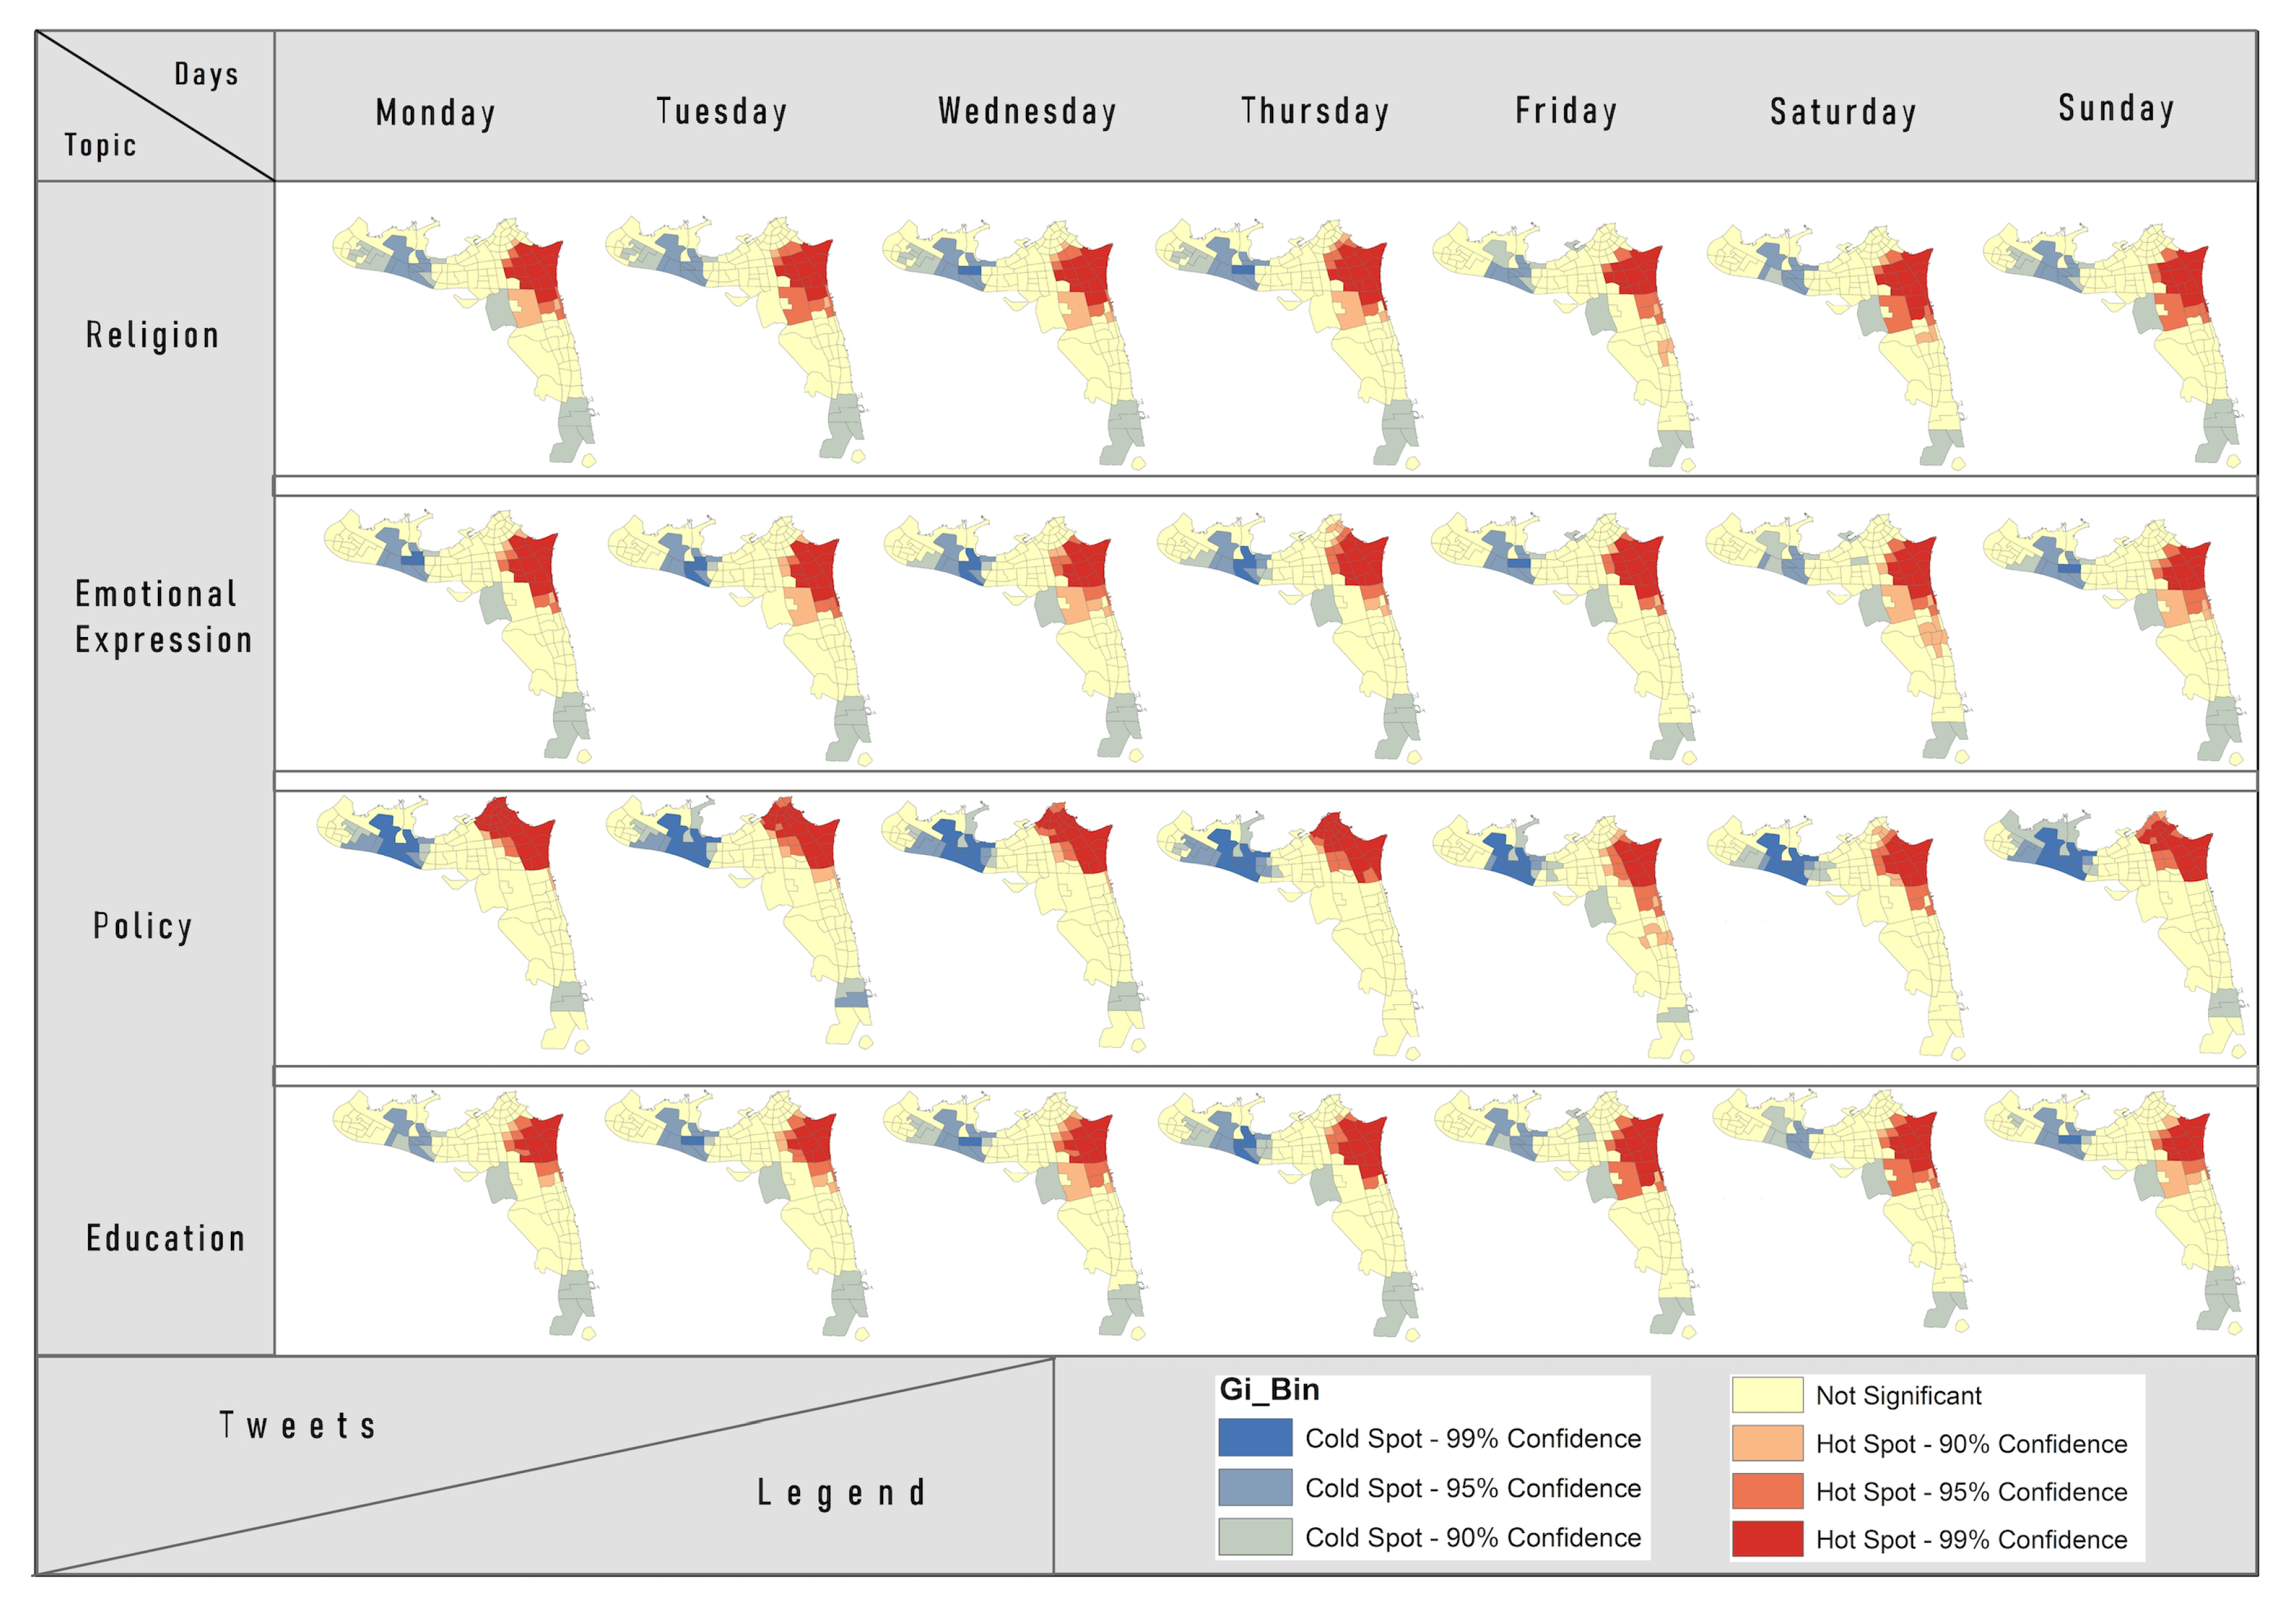
Local Distribution Patterns of Topics of Interest. The Getis-Ord Gi* statistic was used to measure the local spatial autocorrelation of topics of interest to identify the topic distribution pattern in Kuwait. Furthermore, the Getis-Ord Gi* statistic of different days was divided into seven categories: cold spots (99%), cold spots (95%), cold spots (90%), not significant, hot spots (90%), hot spots (95%), and hot spots (99%). The Getis-Ord Gi* helps to look at each topic distribution in each area within the context of neighboring areas. An area with a high value is interesting, but it may not be a statistically significant hot spot. This means that an area recording a statistically significant hot spot has high value surrounding areas as well.
Figure 11 shows the distribution of hot spots and cold spots in the study area.
Table 7 shows the number of areas in hot and cold spots for the top four topics of interest. The geographical distribution of tweet hot and cold spots for these four topics in the study area for each day of the week fall within three confidence levels: 99%, 95%, and 90%. Overall, the policy topic recorded the highest clustering, whilst the education topic had the lowest clustering. The religious, education, and emotional expression topics recorded a high clustering in the North East of the urban area in Kuwait, especially in the Hawalli Governorate, whilst the policy topic observed high clusters in the North East and North in both the Hawalli and Aseema Governorates. The lowest clusters (cold spot areas) were observed in the South East and the North West. All of the high clusters were observed in Kuwaiti residential areas, such as Rumaitheya, Salwa, Bayan, Jabriya, Alsalam, Mushref, Sabah-Alsalem, and commercial areas, such as Salmiya and Hawalli. These areas have higher population densities in comparison to other areas in Kuwait, and the people also have similar demographic and social characteristics, which may explain why these areas recorded high clustering. The low cluster areas were observed in the more sparsely populated areas in the North East, such as Sulibikhat, North Soulibikhat, Doha, and South Doha. The low clusters also appeared in the South East, the agricultural and seaside resort areas (non-residential) where people spend weekends/leisure time. From a temporal perspective, these graphical data depictions show slight variations in the hot and cold spots over the course of the week for all of the topics.
For the religion topic, the high clusters were predominantly observed in the North East in Hawalli Governorate, most especially in Bayan, Mishrief, and Rumaithiya. The cold spot areas (low clustering) are observed in the North West and South East. Moreover, the outputs show slight variations in the hot and cold spots over the course of the week. The high clusters (hot spots) appear on Thursdays (26 areas), Fridays (23 areas), and Saturdays (25 areas), whilst the lowest clusters (cold spots) were observed on Mondays (22 areas).
Regarding the emotional expression topic, the high clusters were predominantly observed in the North East in Hawalli Governorate, especially in Salimiya, Salwa, and Rumaitheya. The cold spot areas (low cluster) appear in the North West and South East. Moreover, the visual data show slight variations in hot and cold spots over the coarse of a week. The high clusters (hot spots) occurred on Thursdays (27 areas).
With respect to the educational topic, the high clusters were observed in the North East in Hawalli Governorate, especially in highly-populated residential areas, such as Salimiya, Salwa, and Rumaitheya. The cold spot areas (low cluster) appear in the North West and South East. From a temporal perspective, there are no significant changes on weekdays. The high clusters came on Saturdays (26 areas).
For the political topic, the spatial clustering was different from the other three topics. The high clusters were observed in the North (Kuwait Capital Governorate) and North East (Hawalli Governorate). From a temporal perspective, the high clusters appeared on Fridays, which included 36 areas and covered parts of the Ahmadi Governorate.
5. Conclusions
The study’s key goal was to investigate the topics of concern and uncover their spatiotemporal distributions and trends. To achieve this, we merged the strategies of text mining with spatiotemporal analysis in order to assess the topics of interest, and studied the spatiotemporal distribution and spatiotemporal autocorrelation of the subject manifestations. Four steps were followed in order to classify the areas of concern. First, to classify relevant terms from the tweet corpus, we used terms with a high average TFIDF score. Following this step, we used a word cloud method to identify the top 1000 keywords, cleaning them manually to create the topic group. The third stage included the calculation of the internal validity of the subject group while using a methodology of manual word matching. Three techniques were employed for spatiotemporal analysis of these topics. First off, we used a point density method for exploring the average distribution over the seven days of the week for the top four subjects. Subsequently, we used the Global Moran’s Index to measure whether spatial autocorrelation in the top four topics of interest was clustered in the study area. Finally, we calculated the Getis-Ord Gi* statistic in order to explore where high and low clustering occurred in the study area.
By situating the study in the context of big data, we addressed the textual content of more than 700,000 tweets to understand the top topics of interest in Kuwait, and explore the spatiotemporal patterns of human interests via social media data. The results reveal that topics that are related to religion, emotion, education, and policy are the four most popular topics of interest in Kuwait. This yields significant insight into the population’s thoughts and interests, further enabling better understanding of human behavior. Firstly, identifying the top Twitter topics of interest in Kuwait helps us to understand the temporal and spatial behavior and activity of people living there. For example, people post more tweets about religion on a Friday, a holy day for Muslims in Kuwait. Moreover, people are more likely to tweet about policy and/or education on weekdays (work days) rather than weekends, which shows that they are more engaged with such topics during the work week. In contrast, people tweet about emotional expression more often during weekends (rest days). From spatial perspectives, the results reveal that there is spatial clustering in topics of interest across the days of the week in Kuwait’s urban areas. The Hawalli governance recorded high numbers of tweets in educational, emotional expression, and religion, whilst the capital of Kuwait recorded the highest number of political tweets. This result helps to explain that location characteristics play a critical role in “what the people think”. For example, the Hawalli governance has the largest population, the most schools, three universities, many malls and restaurants; it is considered the commercial center of Kuwait. This confluence of characteristics may cause the number of educational, emotional expression, and religious tweets to be higher in that region. Whereas, the capital of Kuwait recorded the highest number of political tweets, a likely result of almost all political activities took place there.
Moreover, this study adds to the body of literature investigating people’s behavior through the analysis of social media content. As already mentioned, previous research efforts have employed a number of different approaches in order to investigate topics of interest. Some were relatively basic, applying no spatial or temporal analyses in their work, while others chose one or the other, and sometimes both. However, very few research approaches concentrated on analyzing time, space, and tweet textual content simultaneously in order to explore topics of interest. Comparing the prior studies depended upon trending topics (#Hashtags) or used pre-queries or search terms to investigate specific topics, this study achieves such goals by analyzing tweet textual content itself, independent of hashtags or pre-queries search, in order to discover the topics people were interested in and their spatiotemporal patterns. This is particularly true for our being able to avoid the need to pre-select search terms or examine hashtags or user profiles to generate topics of interest. This removed a level of bias, both from Twitter-users and the innate preconceptions of researchers in their selection of search terms, thus offering a more independent view of what people’s interests actually are via an examination of the textual content of their tweets. Furthermore, by selecting Twitter data from 120 specific areas in Kuwait, with isolation buffers around each of them, we were able to generate more geospatial detail from the Twitter data, above and beyond the very limited number (0.85%) of tweets that actually contained geotag information. While this latter technique might be difficult to employ practically in larger countries, it could be useful when examining a city, province, state, etc. It offers a unique contribution to the field of using Twitter data as a means of exploring the spatiotemporal patterns of people’s interests.
Study Limitations: Geo-social media have provided considerable information that enables us to explore people’s topics of interest in the real world; however, some limitations are to be expected. Social media data has an obvious problem in that it is biased. Social media networks are a relatively new phenomena and more heavily populated by the younger generations in society who have a firmer grasp of modern technology, such as smart phones and tablets. Access to such technology is likewise biased towards more affluent societal sectors. Accordingly, both of these aspects will skew participation away from older members of society and those who are economically disadvantaged, thus limiting the societal representation of the corpus. Furthermore, only around 0.85% of tweets are geotagged, which means that few tweets are posted with longitude and latitude. In this study, besides tweets with geotagging, tweets with self-reported locations are also crawled by applying the geocode filter, leading to an approximate analysis. Additionally, it was not possible to collect all tweets using the search API, so this study used a sampling of tweets. Data biases are also present in temporal and geographical records, since some people use social media in the evening or when they take public transportation, potentially removing them from the event they are commenting upon in time and/or space, thus skewing some of the data away from a more accurate record. Hence, despite the many advantages to exploring social media data to gain insight into society, there are clearly some undesirable characteristics and serious challenges to the process. But if we focus upon the advantages of Twitter, depending upon geographical coverage and location, there are a large number of topics and subjects to explore. Even so, social and behavioral research studies are reticent to pursue this due to many factors that go beyond the simple availability of data, including the types of available data, such as “deep data” (very limited) and “surface data” (copious) [
54].
The macro scale daily trajectory of humans is also available on Twitter. For example, Morstatter et al. [
55] reported that, in 2013, more than 400 million tweets were published each day by over 500 million users. The temporal patterns of people’s interests are available for discovery by analyzing just a small percentage of these data. For technically savvy researchers, it is inexpensive to get these data, but it depends upon the researcher’s coverage and the type of analysis they employ as to whether the data provided via the Twitter API are sufficient for them to find what they need.
Further Research: This work includes an exploratory study of the issues of concern and their dissemination and dynamics in spatiotemporal terms. Many suggestions regarding the reduction of misleading responses and deepening the research study could be considered for future research. With respect to data bias, future research could attempt external validation by employing an online survey in order to measure accuracy for the topics of concern. Comparing the outcomes of these online surveys and text mining analysis could provide further insight into data quality. In terms of expanding interpretation of the thesis, more work in psychological and sociological contexts would be required in order to provide understanding of why individuals with such varying social and demographical characteristics are interested in tweeting about specific subjects.


