Spatial Determinants of Land Conversion for Various Urban Use: A Case Study of Beijing


1
Faculty of Geographical Science, School of Geography, Beijing Normal University, Beijing 100875, China
2
College of Urban and Environmental Sciences, Peking University, Beijing 100871, China
3
Center for Urban Future Research, Peking University, Beijing 100871, China
*
Author to whom correspondence should be addressed.
ISPRS Int. J. Geo-Inf. 2020, 9(12), 708; https://0-doi-org.brum.beds.ac.uk/10.3390/ijgi9120708
Submission received: 22 October 2020
/
Revised: 12 November 2020
/
Accepted: 23 November 2020
/
Published: 26 November 2020
Abstract
:Studying the factors that influence the expansion of different types of construction land is instrumental in formulating targeted policies and regulations, and can reduce or prevent the negative impacts of unreasonable land use changes. Using land use survey data of Beijing (2001 and 2010), an autologistic model quantitatively analyzed the leading driving forces and differences in four types of construction land expansion (industrial, residential, public service, and commercial land types), focusing on the impact of spatial autocorrelation. The results showed that the influencing factors vary greatly for different types of construction land expansion; the same factor may have a different impact on different construction land, and both planning factors and spatial autocorrelation variables have a significant positive effect on the four types. Accordingly, the municipal government should consider the differences in the expansion mechanisms and driving forces of different construction land and formulate suitable planning schemes, observe the impact of spatial autocorrelation on construction land expansion, and guide spatial agglomeration through policies while appropriately controlling the scale of expansion. The methods and policy recommendations of this research are significant for urban land expansion research and policy formulations in other transition economies and developing countries.
1. Introduction
Urban expansion—as a considerable and universal phenomenon and a powerful force—has caused the most irreversible and artificial changes to global land use structures and landscape patterns [1,2]. Rapid urban expansion has improved the level of economic development and profoundly affected the surrounding rural areas, resulting in the transformation of urban–rural relationships and land use structures [3] and a series of problems, such as urban traffic congestion, air pollution, housing shortages, and high housing prices [4,5]. Therefore, for urban planning and land management, a deep understanding of the sources, results, and driving forces of land use change is essential. Studying the driving forces of urban land expansion is extremely significant for formulating effective urban growth management policies and reducing or preventing the negative impact of unreasonable urban land expansion, urban spatial structure, and sustainable development [6,7].
Since the Reform and Opening Up, urban construction land in China has experienced substantial growth. In 2004, construction land totaled 30,781.28 km2 [8] and reached 56,075.90 km2 in 2018 [9], which was an 82.18% increase from 2004, and the average annual growth was 1806.76 km2. Research shows that the growth rate of China’s large cities is much faster than that of small- and medium-sized cities [10,11,12]. The rapid expansion of large cities has caused urban diseases, such as the shortage of urban transportation land and air pollution, alongside the loss of a large amount of high-quality agricultural land, especially arable land [13]. China loses nearly 2000 km2 of cultivated land every year due to urban expansion, producing more than 100 million land-lost farmers [14] and separating rural people from their land, triggering many social conflicts, and deeply affecting national food security. Although central and local governments have adopted land management policies that strictly control the growth of urban construction land through urban and land use planning, urban land still maintains a trend of rapid growth [15,16]. Therefore, the mechanism of urban land expansion and its driving force in the formulation of effective urban land use containment policies are worthy of research.
China’s urban land expansion has become a hot topic within the government and academia [17,18,19,20]. Most studies use remote sensing data to measure the scale of urban expansion and analyze the expansion mode and spatial pattern. The results illustrate that Chinese cities present spatial patterns, such as mononuclear polygon patterns, mononuclear belt patterns, double-nucleated polygon-line patterns, multinuclear polygon patterns, and so on [21,22,23], and some metropolises change from having a single center to multiple centers [24,25,26]. Simultaneously, there is a high degree of temporal and spatial differences among China’s urban expansion. Dynamic expansion models, such as leapfrogging, linear, infilling, and edge expansion appear in different cities, and some large cities even expand using mixed modes, where several modes coexist [27].
The influencing factors of land use changes are usually from a combination of elements, most of which constitute a mixture of natural factors (such as soil, topography, etc.) and human factors (such as economy, population, policy, etc.) [17]. Extant analyses have formed a basic framework for the influencing factors of urban construction land expansion and have investigated the driving forces by assessing the natural conditions, location characteristics, economic factors, social factors, and policy factors, and select suitable variables to explore the influence of the different factors on urban land expansion [28,29]. The natural environment is a carrier of urban development and restricts the direction, scale, and development potential of urban construction land expansion, playing a leading role to some extent. For instance, the expansion of Chicago city—influenced by Lake Michigan—is an example of semicircular expansion [30]. As natural factors that are relatively easy to quantify, topography, geomorphology, and soil are often used to describe the natural conditions of urban land. Among them, altitude and slope factors are the most commonly used factors, and most studies believe that they have a significant restrictive effect on the expansion of construction land [31]. Simultaneously, some studies have also found that the limiting effect of natural conditions on the expansion of Chinese cities is gradually weakening [32]. Moreover, it has been widely acknowledged that geographic location is an indispensable determinant of urban development and expansion. Globally, major cities are primarily distributed in coastal areas because of the advantages of the three types of traffic locations: sea, land, and air. Since accessibility represents the cost of land use decision-making, many studies choose location factors from the perspective of accessibility. The results indicate that there are differences in the direction and force of its impact on construction land expansion. Furthermore, while some studies use travel time to characterize regional accessibility [28], more often investigated factors are the distances to the Central Business District, the road, and public transportation stations [33]. Some studies have selected the distance to important locations in an area according to the characteristics of the study area [34]. In terms of economy, some studies believe that economic growth plays a leading role in the expansion of construction land [35,36]. However, others have pointed out that there are regional differences in the impact of economic factors on the expansion of construction land, as in some regions, economic growth has little impact [2]. Social factors are also considered to be vital in affecting the expansion of construction land, and it is generally believed that there is a positive correlation between changes in population density and size and the expansion of construction land [37]. Economic and social laws behave differently in different places, which is often considered to be the reason that policy factors play a key role. In the process of economic and social transitions, extant studies generally suggest that policy and planning factors have noteworthy control over and a guiding role in China’s urban construction land expansion [36,38,39]. Nevertheless, some studies have summarized that despite China’s strict land management policies, construction land continues to expand rapidly [15,16].
Although numerous studies have examined the spatial pattern, expansion mode, and driving force of urban land expansion in China, little is known about the differences among the different types of construction land expansion [21,35,40,41,42]. This is a common gap existing in global research on this issue. In fact, a city is a multi-functional entity that encompasses living, employment, business, and leisure [28,43]. Different types of construction land expansion are very likely to be affected by different factors. Their expansion mechanism and government control strategies are also different. Therefore, it may cause deviations to only analyze construction land as a whole [44]. For instance, in the past 20 to 30 years, China has adopted differentiated land use policies for corresponding urban land. For the sake of promoting economic development and attracting foreign investment, the central and local governments have established various development zones [45,46]. To attract investment, industrial land is often given to producers for free or even sold for negative land prices [47]. Taking Beijing as an example, the Beijing municipal government, district and county governments, and township governments established more than 470 diverse development zones to attract foreign investment [48]. To compensate for the loss of land rent from industrial land, the government monopolized the land market and used recruitment and auction methods to supply residential land, leading to a rapid increase in the price of residential land. Although the governments also tried to curb the excessive growth of housing prices through various housing purchase restrictions, these have demonstrated little effect [19,47]. Some studies have explored the driving mechanism of one or two types of construction land expansion within a city [28,49,50]. However, a city is an organism that is composed of multiple functions with different requirements for urban location characteristics and land development conditions [51,52,53]. It is thus necessary to explore and compare the spatial patterns and driving mechanisms of the different types of urban land. Only then can we truly construct an effective policy to restrain urban land expansion.
Another research gap in the literature on urban land expansion has been the ignorance of spatial correlation. An agglomeration economy is the fundamental driving force of urban development [54,55]. Different types of urban land have obvious spatial aggregation characteristics [56]. The cluster of similar manufacturers can not only share infrastructure—such as roads, water supply, and power supply—and thus, reduce land use costs, but also share the labor market, various market information, and improve the labor productivity of enterprises [55,57,58]. Previous studies have shown that land development within a city is affected by the adjacent land [59]. Therefore, the influence of spatial correlation on urban construction land expansion cannot be ignored.
In view of these existing deficiencies, this study divides construction land into industrial, residential, public service, and commercial lands. Furthermore, it examines the driving forces and their differences in these four types of construction land expansion, adds spatial autocorrelation to the driving forces, and emphatically analyzes its impact on construction land expansion. Thus, the scientific questions studied herein are: (1) What are the factors that affect the transfer of non-construction land into industrial, residential, public service, and commercial land? Are there any differences between them? (2) Is the distribution of the newly added construction land affected by spatial autocorrelation?
The remainder of this paper is organized as follows. The second section elaborates on the research area, data, and methods in detail. The third section systematically generalizes the results and is divided into two subsections: the spatial pattern and driving force analysis of construction land expansion. The final section presents the conclusions and corresponding policy implications.
2. Study Area, Data, and Methods
2.1. Study Area
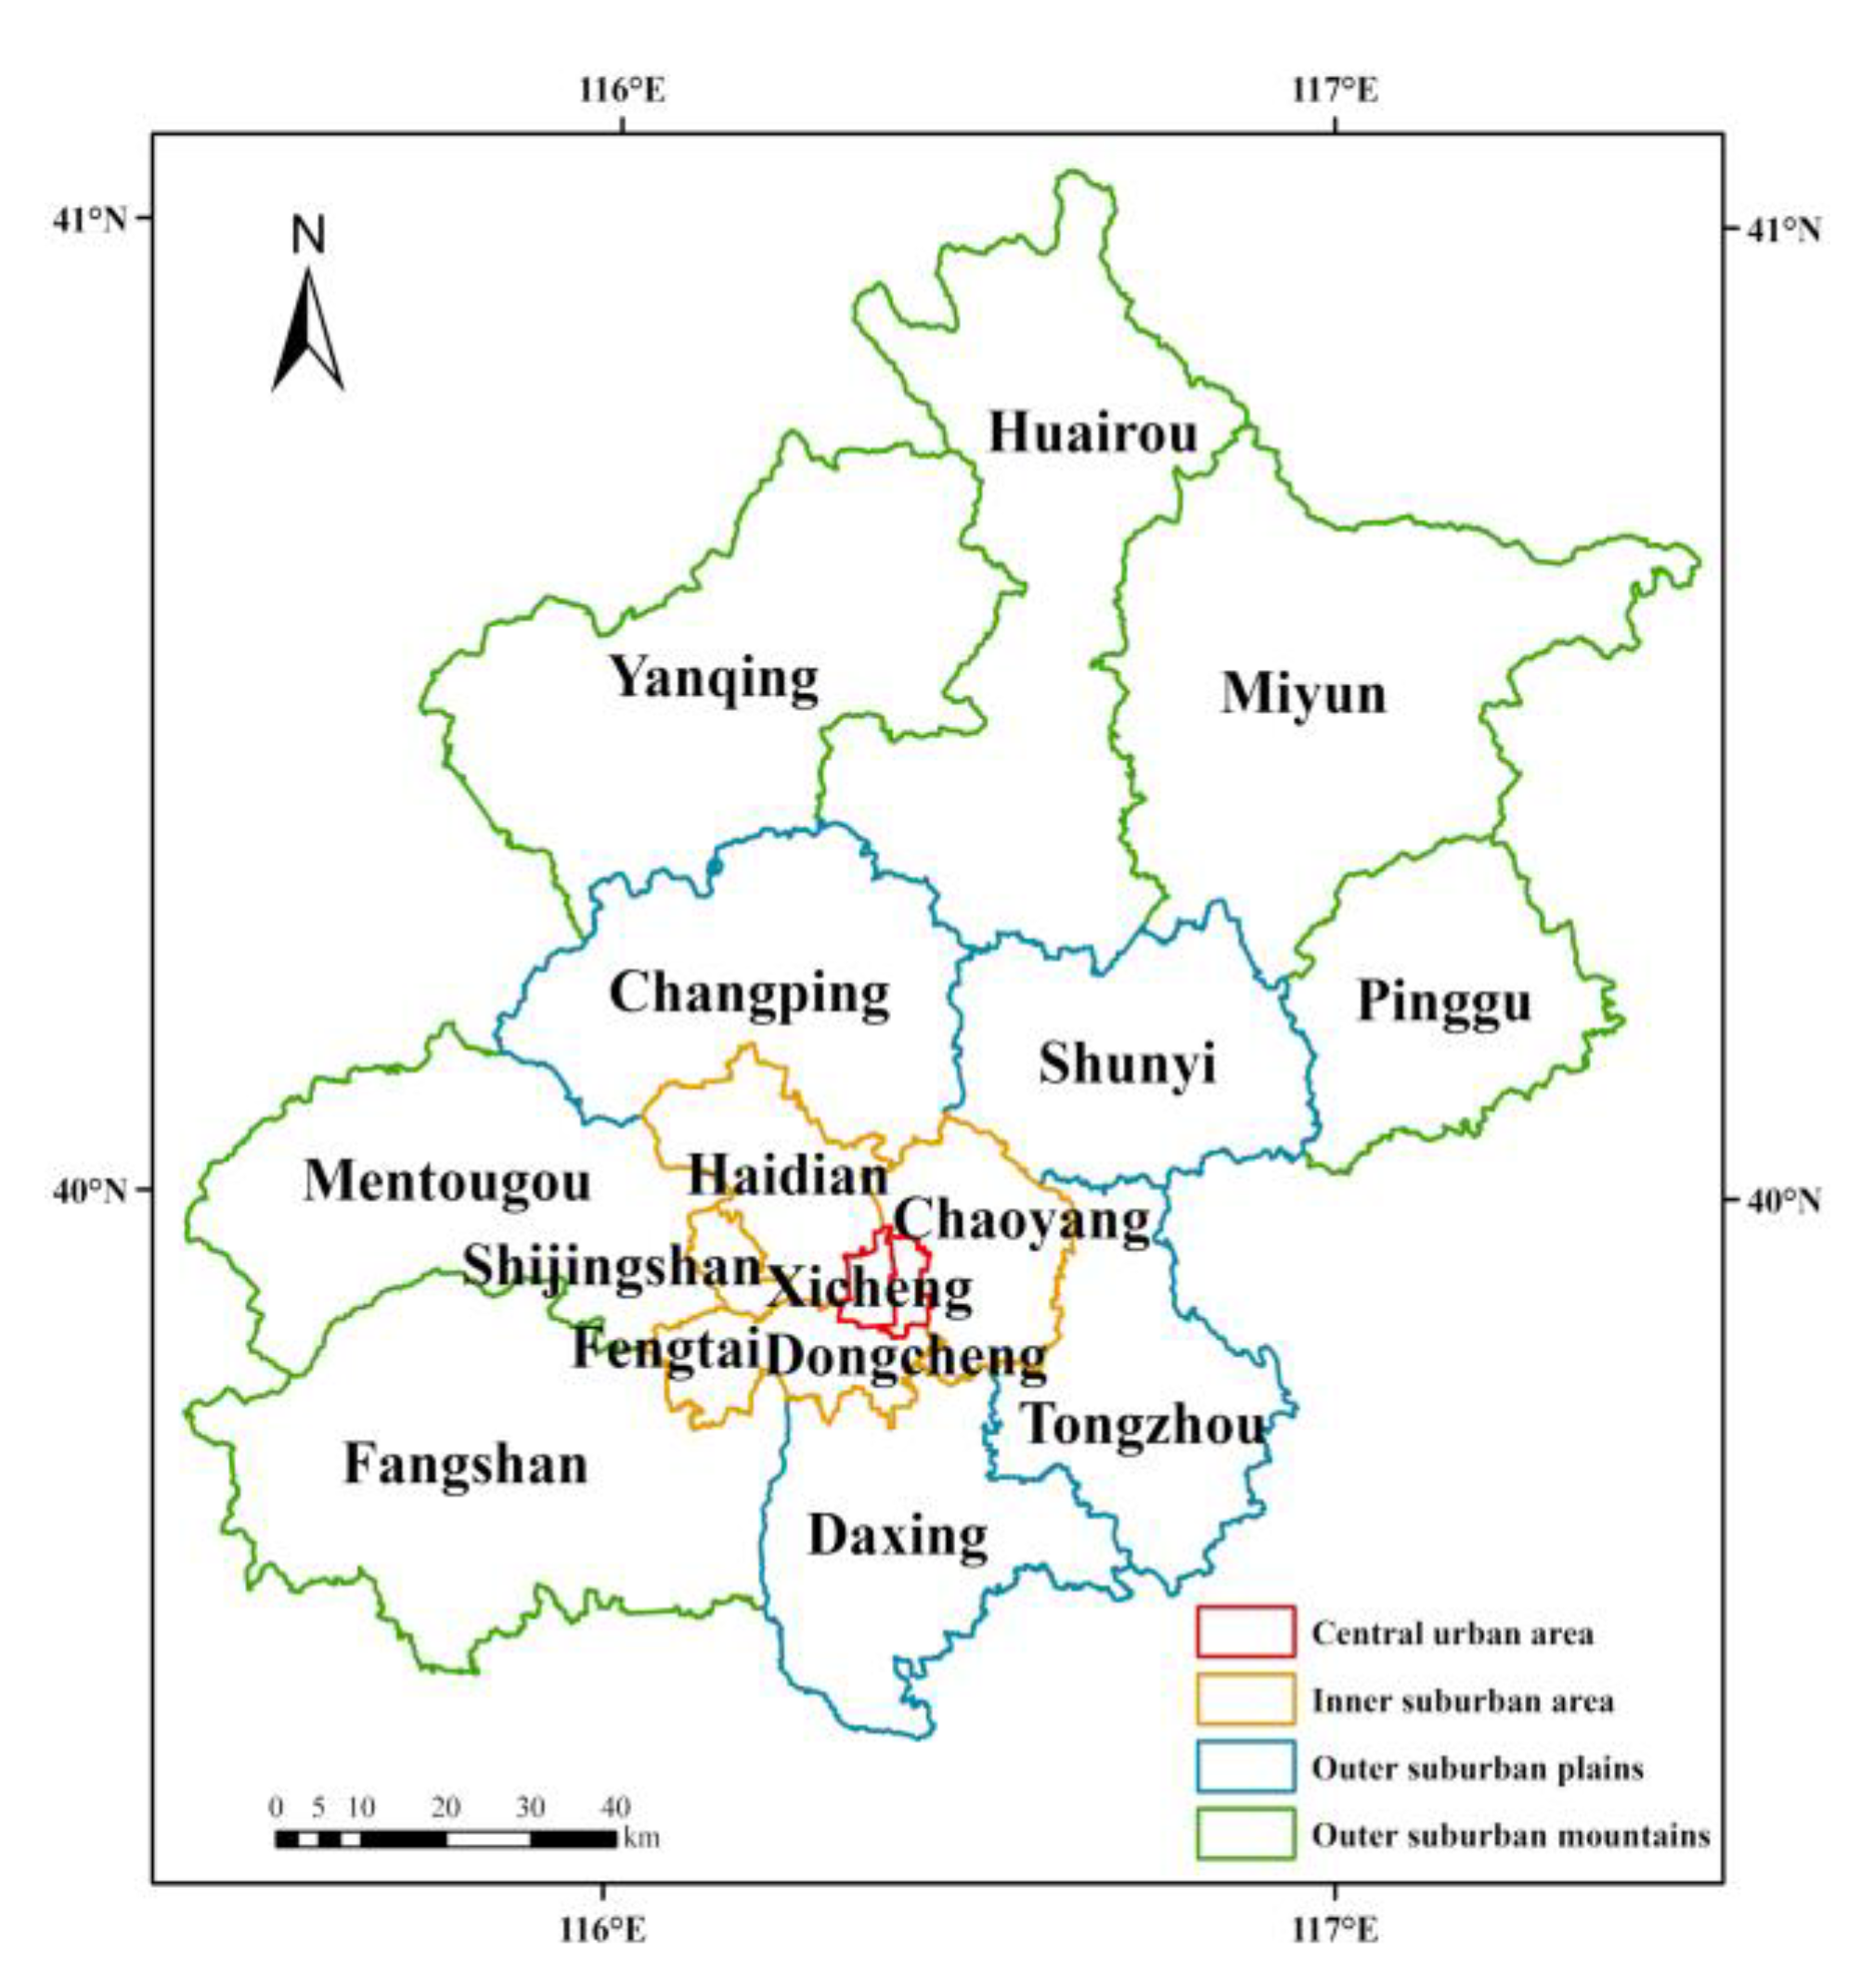
This study chose Beijing as the study area based on the following considerations. First, Beijing is in the northern part of the North China Plain. The mountains in the northwest and the plain in the southeast form a high terrain in the northwest and a low terrain in the southeast, which is relatively typical in northern China. Therefore, a large amount of the literature has used Beijing as an example to study China’s urban expansion [21,23,40,60,61,62,63,64]. Second, as the capital of China and the economic center of North China, Beijing has attracted many migrants. It is one of the fastest growing regions and is also a typical city for urban studies.
In terms of the specific research area, the Dongcheng and Xicheng Districts constitute the central urban areas of Beijing (Figure 1). All land within these two districts has been developed, meaning there is no new construction land. Since the research object of this study is newly added construction land, the Dongcheng and Xicheng Districts were excluded from the research area.
The total area of Beijing is 16,410 km2. In 2001, the city’s construction land accounted for 2858.38 km2. From 2001 to 2010, construction land added 885.46 km2, with an average of 98.38 km2 per year. Thus, the scale of construction land in Beijing has expanded rapidly in the last 10 years. At the end of 2010, there were 19.619 million registered permanent residents in the city, which was an increase of 41.64% from 13.851 million in 2000. The average annual growth of the urban population was 640,900. The proportion of the urban population increased from 78.05% in 2000 to 85.96% in 2010, making it one of the fastest growing cities in China. Simultaneously, there was rapid economic development. In 2010, the city’s GDP was RMB 1411.36 billion, and the per capita GDP was RMB 75,943, which was an increase of 214.76% compared with RMB 24,127 in 2000 [65,66]. Beijing’s tertiary industry is well developed (accounting for 75.11% of industry) and presents a “three-two-one” structure; in other words, the proportion of the three industries is ranked as follows: the tertiary industry, the second industry, and the first industry. Urban development presents characteristics of post industrialization and post urbanization. Therefore, the rapid urbanization of Beijing provides us with an excellent sample to explore the driving forces of construction land expansion.
2.2. Variables and Data
2.2.1. Dependent Variables
In this study, the land use survey data of Beijing in 2001 and 2010 were divided into agricultural, construction, and unused land based on the current land use classifications [67]. Construction land in 2010 was further divided into industrial, residential, public service, and commercial land. Non-construction land was selected as the research object from the land use survey data of Beijing in 2001 and was divided into two types. The value codes were “0” and “1”, where “0” indicates that the land type remained non-construction land during the study period, and “1” indicates that the land changed into newly added construction land. Among the newly developed construction land, this study analyzed and discussed the transformation of non-construction land into industrial, residential, public service, and commercial land.
2.2.2. Independent Variables
Considering the extant research and the comprehensiveness, representativeness, regional differences, and accessibility of data, combined with the actual situation of Beijing, this study selected a total of 12 influencing factors from six aspects: topography, location conditions, accessibility, social economy, policy planning, and spatial correlation (Table 1).
Restricted by topography, construction land usually tends to expand to areas with gentle terrain; therefore, topography is considered an essential natural factor that affects land use change. The impact of terrain on land use change is from the combined effect of various factors, as a single factor cannot fully reflect the influence of terrain on the expansion of construction land. Therefore, this study selected altitude and slope as two independent variables in terms of terrain, where altitude is the vertical distance of a certain point on the ground above sea level, and slope is the degree of steepness of a surface unit.
Location factors play a pivotal role in urban construction land expansion. Different location conditions affect the expansion of different types of construction land to a certain extent. The extant studies generally use the distance to the city center to indicate the advantages and disadvantages of a location’s conditions. Based on the selection of this independent variable, this study also considered the impact of China’s administrative center on the expansion of construction land. In China, the government has great power over urban land expansion; therefore, the expansion of construction land cannot be separated from the government’s regulations. Moreover, different levels of government have different powers, and their impact on construction land is correspondingly different. Currently, the government in China is divided into four levels: municipal government, district government, township government, and village committee. Therefore, this study selected the distance to the administrative center from different governmental levels to reflect the location conditions of construction land.
Traffic conditions have a great impact on the direction of construction land expansion. The construction of traffic infrastructure and the improvement of traffic systems promote the expansion of cities to the surrounding areas. From experience, it can be summarized that the spatial expansion of a city is always distributed along the main traffic lines that have a relatively high traffic accessibility. Different types of construction land have different requirements for traffic accessibility, leading to different expansion directions of construction land. Traffic accessibility is a crucial factor that affects the urban spatial layout. In this study, accessibility was used to represent the traffic conditions of construction land, and two independent variables were selected: the distance to the bus station and that to the road. In the process of urbanization, public transportation provides convenient conditions for the expansion of construction land, and some types of construction land have higher requirements for public transportation accessibility. Considering the availability of data, this study selected the independent variable of the distance to the bus station. Simultaneously, the traffic network also has a significant impact on the expansion of construction land, so the distance to the road was also selected.
The rapid development of urban economy and population growth requires the continuous expansion of urban land areas. The expansion of construction land and economic development is a two-way dynamic process. For instance, while construction land is the carrier of urban economic activities, rapid economic development may lead to the expansion of construction land. To study the impact of economic growth on the expansion of construction land, this study selected the independent variable of economic activity represented by POI density (POI—point of interest refers to economic activity in a certain period). Population is an important driving factor in land use change, and the demand for land caused by population growth is the initial reason for urban expansion. Therefore, the increase in the urban population has a direct and major impact on the expansion of urban construction land. This study selected population density change as an independent variable to reflect urban population growth.
When considering the impact of the Chinese government on the expansion of construction land—aside from the distance to the administrative centers at the different levels of government—the planning policies issued by the government can directly affect the expansion of construction land. Land policies constitute a powerful macro-control method for the land market in China and have a significant impact on the expansion of construction land [68]. This study chose planning factors as an independent variable to indicate whether the research object was within the scope of construction land, as defined in the general land use planning of Beijing from 2001 to 2010. It should be noted that since general land use planning is more binding—and detailed regulatory planning may be adjusted in the future—the planning factors here refer to the plans for construction land rather than the plans for the four specific types of construction land.
Moreover, to eliminate the influence of spatial autocorrelation, this study also calculated the spatial autocorrelation factors of the four types.
2.2.3. Data
Based on the land use survey data of Beijing in 2001 and 2010, the dependent variables were proposed and assigned values after overlaying the analysis using ArcGIS. The data on the influencing factors selected herein were collected from the International Scientific Data Mirror website of the Computer Network Information Center, Chinese Academy of Sciences, Baidu Maps, the overall urban planning of Beijing from 2004 to 2020, and the fifth and sixth national census data [69,70,71]. After the basic data were collected, the spatial vector information was transformed into a 300 × 300 m fishing net. Table 1 explains the definitions and sources of the dependent and independent variables, Table 2 provides descriptive statistics on the variables, and Figure 2 shows the distribution of each variable.
It can be seen from Figure 2 that the distribution of the altitude and slope in Beijing is consistent, showing a high trend in the northwest and a low trend in the southeast. Most district governments are in areas close to the center of Beijing. The number and density of town governments, village committees, and bus stops in the southeast are greater than those in the northwest. The urban roads in the old urban area of Beijing (within the Second Ring Road) are in a chessboard pattern. The central axis of Beijing is composed of Tiananmen Square and the Forbidden City. The roads are horizontal or vertical and densely distributed in the city center, while the suburban areas are scattered and fewer in number. The distribution of the population density change and economic activity is relatively consistent: both are high in the center and low in the periphery. In other words, the population density change and economic activity in the central urban area are significantly higher than that in the peripheral development areas, but the distribution of economic activity is more concentrated. The planned construction land totals 3383.12 km2 and is mostly distributed in the central and eastern parts of Beijing. Shunyi District has the largest planned construction land, with a total area of 435.28 km2.
2.3. Methods
First, considering the spatial distribution map of construction land, the change and distribution characteristics of the newly developed construction land were analyzed to better understand the main features of construction land expansion in Beijing. Next, the influencing factors of the expansion were selected from six aspects: terrain, location conditions, accessibility, social economy, policy planning, and spatial autocorrelation. An autologistic regression model was used to conduct regression calculations, and the driving mechanism of construction land change in Beijing from 2001 to 2010 was quantitatively analyzed.
2.3.1. Spatial Pattern of Construction Land Expansion
To observe the spatial pattern of the newly added construction land in Beijing more clearly, this study used ArcGIS software to draw a spatial distribution map of the four types of new construction land to deeply analyze the spatial change of the land use types and summarize the distribution characteristics of construction land expansion in Beijing.
2.3.2. Regression Model
Land use change models are often used to analyze the interaction between land use changes and driving factors and play an important role in predicting the future development direction of land use systems [72,73]. The most used land use change models in extant research are statistical and empirical models, most of which use correlation analysis and linear regression methods. However, the dependent variable in a linear regression must be continuous, which limits the method in many cases, especially when the dependent variable is categorical and does not have a certain distribution law. Ordinary linear regression or correlation analysis violates many assumptions and thus, leads to inapplicability, while a logistic regression model can solve this problem [74,75,76,77].
When using a logistic regression model, the possible spatial correlation of the geographic data should be considered so as not to violate the model’s assumptions and further affect the regression results [78]. Because similar types of construction land tend to be distributed in the same areas, the expansion of construction land is likely to be affected by the surrounding land; therefore, it is necessary to eliminate the spatial autocorrelation effect. To correct the spatial autocorrelation problem of the logistic regression model, an autologistic model was proposed in 1972 [79]. Based on the original model, the autologistic model adds spatial correlation variables, which greatly improves the accuracy of probability prediction and the versatility of the model.
To compare the applicability of the traditional logistic model and the autologistic model more intuitively, this study used the two to study the driving forces of the four types of construction land expansion. The results showed that the fitting effect of the autologistic model was better, so an autologistic model was adopted for the follow-up study.
An autologistic model was used to calculate the probability that a given grid of non-construction land would be converted into construction land from 2001 to 2010 to better understand the mechanism of construction land expansion and the plots that are more likely to be converted into these four types of construction land. If the land use type of a certain grid changes from non-construction land to type i construction land during the study period, the value of this grid is 1. If it is not converted into construction land of this type, the value of this grid is 0. The specific form of the model is as follows:
where is the probability that the value of equals 1; that is, the probability of non-construction land changing into type i construction land, are the factors affecting land use changes, is a constant term, and are the partial regression coefficients obtained by the model.
is a spatially correlated variable that represents the spatial correlation between plot i and its adjacent plots. It is usually defined as
where is the weight value of plot j acting on plot i, and the weight is generally calculated according to proximity or distance. In the weight calculation based on the proximity relationship, if plot j is adjacent to plot i, their weight value is 1; otherwise, it is 0. In the distance-based weight calculation, the negative correlation of distance is used as the weight, such as . This study chose the latter as it is more widely used and simpler; that is, let .
3. Results
3.1. Spatial Pattern of Land Expansion
3.1.1. Urban Construction Land
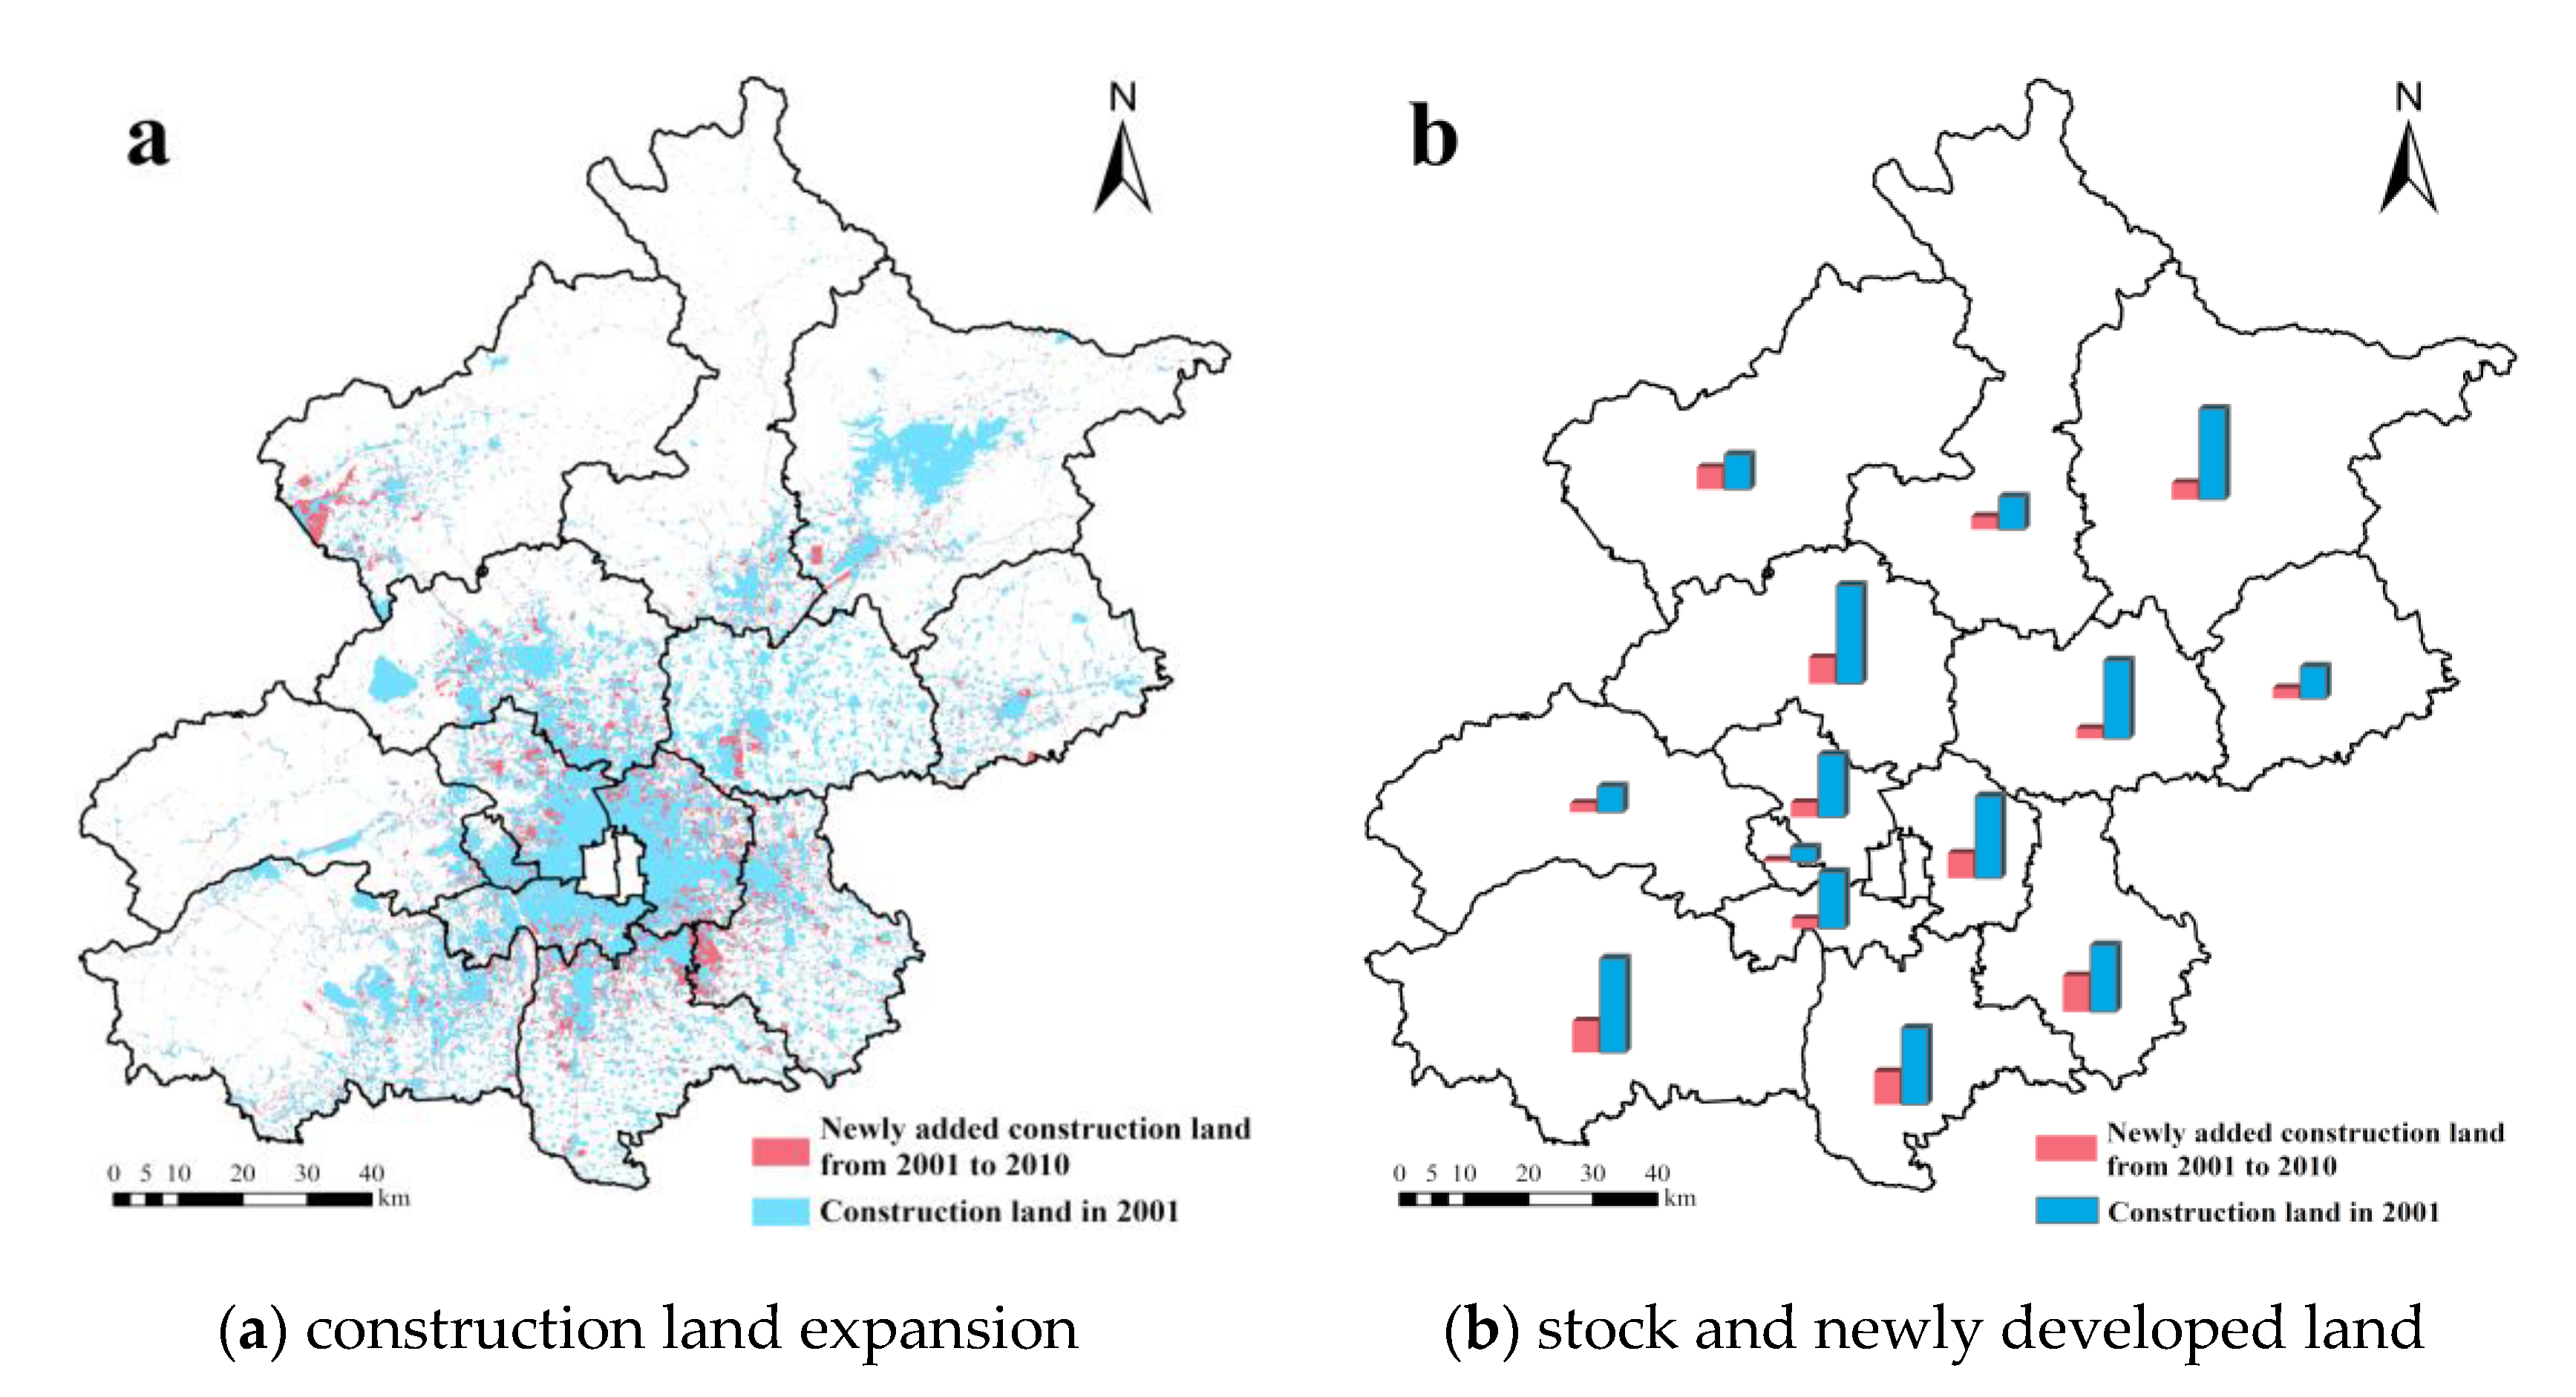
Figure 3a shows the distribution of construction land expansion in Beijing from 2001 to 2010, Figure 3b shows the bar chart of construction land in 2001 and newly added construction land from 2001 to 2010 in each district, and Table 3 shows the statistics of construction land in 2001 and the newly added construction land from 2001 to 2010. In 2001, construction land in Beijing totaled 2858.38 km2. According to Figure 3a, the original construction land is mostly distributed in Changping District, Fangshan District, Miyun County, Chaoyang District, Shunyi District, Daxing District, Tongzhou District, and Haidian District. The construction land area of each district mentioned above is greater than 200 km2, of which the Changping District has the largest (332.99 km2), constituting 11.68% of the total construction land area in Beijing. Among these districts, Miyun County is in the northeast of Beijing, and the construction land in the district is mainly located near the Miyun Reservoir. Except for Miyun County, the other districts are in the central and southern parts of Beijing. Combined with the elevation map, slope map, and road distribution map in Figure 2, we can see that these urban areas are located in plains and have low altitudes and gentle slopes, and the traffic network is relatively dense, which indicates that these factors may have a certain impact on the distribution of construction land. Among them, Chaoyang District and Haidian District are in the suburbs closest to the city center, and the other six districts are new urban development areas in the outer suburbs.
During the study period, the newly developed construction land area in Beijing totaled 885.46 km2 and was mainly distributed in Tongzhou District, Daxing District, Fangshan District, Changping District, Chaoyang District, and Yanqing County. Among them, Tongzhou District has the largest new construction land (122.75 km2), accounting for 13.88% of the total newly added construction land in Beijing. According to Table 3, most of the new construction land is in the suburbs or new urban development areas, indicating that construction land in Beijing is expanding from the center to the periphery. Chaoyang District, as an economically developed area closest to the city center—and with a large amount of new construction land—indicates that economic factors and the distance to the city center may have had an impact on the expansion of construction land. Moreover, from the road distribution map in Figure 2f, most of the new construction land is distributed around the original construction land in 2001 along the traffic network, indicating that the distance to the road and the spatial autocorrelation factors may affect the spatial distribution of the new construction land. As shown in Figure 3a, the expansion of construction land in Beijing mainly presents edge and infilling expansion patterns, while a few areas have expanded in the leapfrogging mode.
3.1.2. Newly Developed Construction Land
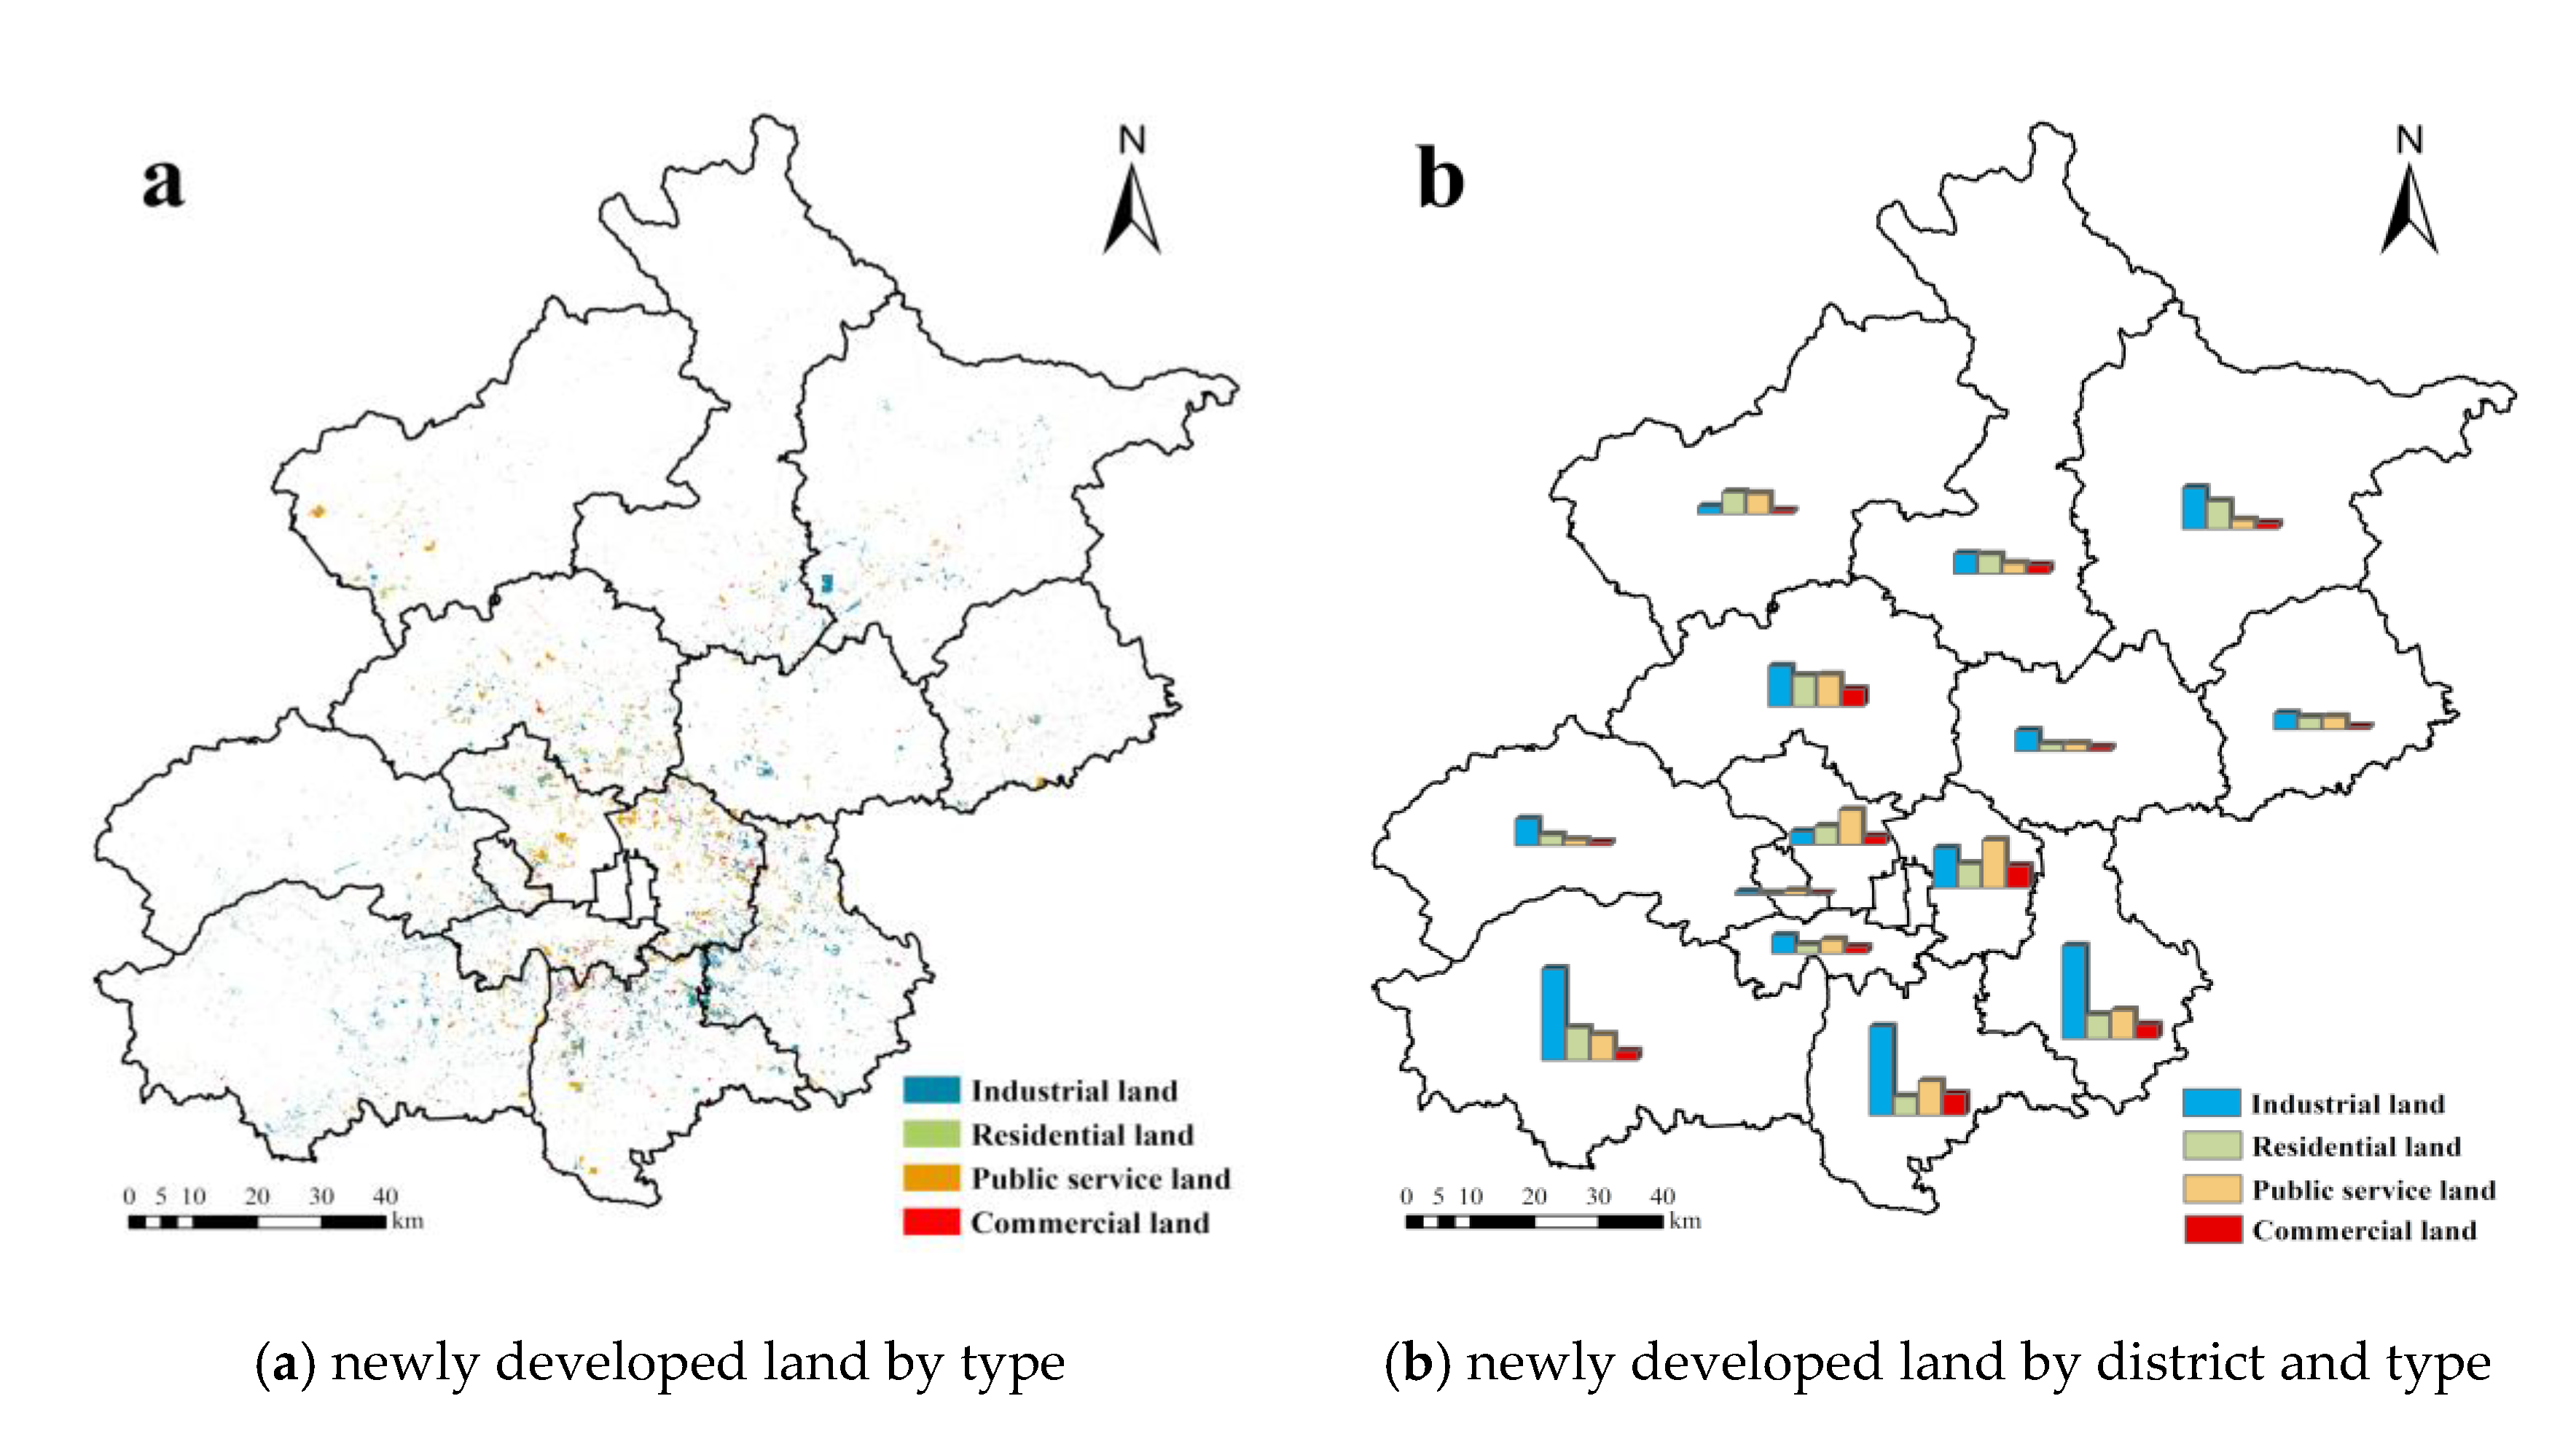
For studying the driving forces of the transformation of non-construction land into different types of construction land, this study divided construction land into several types based on the current land use classifications and then, selected four representative construction land types: industrial, residential, public service, and commercial land. A distribution map of these four newly developed construction land types in Beijing from 2001 to 2010 is shown in Figure 4a. Statistical charts showing the newly added construction land in the different districts are shown in Figure 4b. The statistics of these four types of newly added construction land in Beijing are shown in Table 4, and the detailed statistics of the different districts are shown in Table 5. As can be seen from Table 4, industrial land covers the largest area (239.76 km2), accounting for 27.08% of the total new construction land. Commercial land has the smallest area (59.57 km2), accounting for only 6.73%.
By combining Table 5 and Figure 4a, the newly added industrial land is mainly distributed in Tongzhou District, Fangshan District, and Daxing District. The newly added industrial land in these three urban areas accounts for 52.74% of the total area, and Figure 4a shows that these districts are in the south of Beijing and belong to a new urban development zone that is far away from the central urban area. The newly added residential land is mainly distributed in Fangshan District, Changping District, Miyun County, Tongzhou District, and Chaoyang District. Among them, Fangshan District has the largest newly added residential land area (total area of 15.00 km2), constituting 12.72% of the total area in Beijing. The newly added public service land is mainly distributed in Chaoyang District, Haidian District, Daxing District, Changping District, and Tongzhou District. Chaoyang District has the largest newly added public service land area (total area of 21.94 km2), accounting for 16.76% of the total area in Beijing. The newly added commercial land is mainly distributed in Chaoyang District, Daxing District, Changping District, and Tongzhou District. Chaoyang District has the largest area of newly added commercial land (total area of 10.13 km2), accounting for 17.02% of the total area in Beijing.
3.2. Driving Forces of Construction Land Expansion
To investigate whether spatial autocorrelation has an impact on the goodness of fit of the regression model, two models were used to analyze the driving forces of construction land expansion to compare the applicability of the traditional logistic model and the autologistic model. The goodness of fit of the model was evaluated by comparing all probability predictions, that is, the relative operating characteristic (ROC). The range of the ROC values was 0.51. The higher the value, the better the goodness of fit, and 0.5 represented random distribution probability. Generally, an ROC value greater than 0.7 indicates that the model has good interpretation ability, and 1 represents the best simulation effect. A comparison of the fitting effects of the two models is shown in Table 6.
By taking factors other than the spatial autocorrelation variables as the independent variables, the regression calculation was conducted using the traditional logistic model. The ROC values of industrial, residential, public service, and commercial land were 0.857, 0.853, 0.885, and 0.893, respectively. After adding the spatial autocorrelation variables, an autologistic model was adopted for the regression calculation. The ROC values of the four types of construction land models were 0.907, 0.880, 0.938, and 0.912, respectively. The ROC values of the four models were greater than those of the traditional logistic model—which means that the fitting effect of the autologistic model was better—confirming that there is spatial agglomeration and autocorrelation in the expansion of construction land. Therefore, this study selected an autologistic model to study the factors that influence construction land expansion.
Using the autologistic model, the fitting significance of the four models was less than 0.05, indicating that the model has statistical significance, and the fitting effect is ideal. The regression results of the four types of newly added construction land are shown in Table 7.
3.2.1. Expansion of Industrial Land
From the regression results of the model, the factors that significantly affect the conversion of non-construction land to industrial land from 2001 to 2010 are altitude, slope, distance to the city center, distance to the bus stop, distance to the road, planning factors, and the spatial autocorrelation variable. The probability of conversion from non-construction land to industrial land decreases significantly with the increase in altitude and slope, which means that the probability is negatively correlated with these two factors, and indicates that they limit the expansion of industrial land to a great extent. Therefore, the industrial land in Beijing tends to be distributed in plain areas that have low altitudes and gentle slopes. The probability decreases as the distance to the city center increases, indicating that the newly added industrial land is distributed near the city center. From the current study’s perspective, such a distribution tendency may have been caused by industrial agglomeration. Sun et al. [80] also found that industrial density in Beijing’s city center showed an upward trend from 2000 to 2010 [80]. The probability decreases significantly with the increase in the distance to the bus station and road, indicating that industrial land is mostly distributed in areas with good traffic accessibility and needs to be distributed along the bus station and road networks. The probability is significantly affected by the planning factors. The advantage rate of conversion from land planned for construction to industrial land is 1.86 times that of land planned for non-construction, indicating that land use planning has a great guiding role in the expansion of construction land. Moreover, the expansion of industrial land shows significant spatial autocorrelation.
3.2.2. Expansion of Residential Land
The factors that significantly affect the conversion of non-construction land to residential land are altitude, slope, distance to the district government, distance to the village committee, distance to the bus stop, economic activity, population density change, planning factors, and the spatial autocorrelation variable. The probability of conversion from non-construction land to residential land decreases significantly as the slope increases. According to the model results, the coefficient of the slope is −0.0935 and the estimated occurrence rate is 0.9107, indicating that for every degree of slope increase, the probability of converting non-construction land to residential land decreases by 8.52%. This reflects the tendency of residential land to be distributed in areas with relatively flat terrain. The probability increases with the increase in altitude, and the reason for this result requires further study. The probability increases with the increase in distance to the district government, which may be a result of insufficient land to be developed near the district government. The probability decreases with the increase in the distance to the village committee and the bus station, reflecting the tendency of rural and urban residential land to be located close to the village committee and bus station. The probability increases significantly with an increase in economic activity and population density. Both show a significant positive correlation, indicating that the increase in these two factors may cause an increase in the demand for residential land. Similarly, residential land is also affected by planning factors. The predominance rate of conversion from land planned for construction to residential land is 4.41 times that of the land planned for non-construction. Moreover, the expansion of residential land also shows significant spatial autocorrelation.
3.2.3. Expansion of Public Service Land
The factors that significantly affect the conversion of non-construction land to public service land are slope, distance to the city center, distance to the district government, distance to the town government, distance to the bus stop, planning factors, and the spatial autocorrelation variable. The probability of conversion from non-construction land to public service land decreases with an increase in slope. The probability decreases with the increase in the distance to the city center, the distance to the district government, the distance to the town government, and the distance to the bus stop. The coefficients of the four factors are −0.0183, −0.0274, −0.0261, and −0.3095, respectively, and the estimated occurrence rates are 0.9819, 0.9730, 0.9743, and 0.7338, respectively. This shows that the probability of conversion from non-construction land to public service land decreases by 1.80%, 2.67%, 2.54%, and 22.71%, respectively, for each 1 km increase in distance; therefore, the land for public service is mostly distributed in the areas close to these places. The proximity to governments at different levels is conducive to improving convenience for citizens, while being close to bus stops is helpful for improving accessibility and facilitating commuters. The probability is significantly affected by the planning factors. The advantage rate of conversion from land planned for construction to public service land is 1.73 times that of the land planned for non-construction. Moreover, the expansion of public service land also shows significant spatial autocorrelation.
3.2.4. Expansion of Commercial Land
The factors that significantly affect the conversion of non-construction land to commercial land are altitude, slope, distance to the city center, distance to the district government, distance to the bus stop, population density change, planning factors, and the spatial autocorrelation variable. The probability of conversion from non-construction land to commercial land decreases with an increase in slope—which is in line with common sense—but increases with an increase in altitude. The reason for this result remains to be studied. The probability decreases significantly with an increase in the distances to the city center, district government, and bus station. Commercial land is mostly distributed near the city center and public transport stations, which conforms to general cognition. Commercial land is close to the district government because most commercial centers in urban areas are close to the district government. The probability increases significantly with an increase in population density, which indicates that the expansion of commercial land and population growth are synchronous. The increase in population density reflects an increase in population in the region, which stimulates the occurrence of more business activities and leads to the expansion of commercial land. The probability is significantly affected by the planning factors. The advantage rate of conversion from land planned for construction to commercial land is 1.62 times that of land planned for non-construction. Moreover, the expansion of commercial land also shows significant spatial autocorrelation.
3.3. Discussion on the Heterogeneous Effects of Main Factors
Topography greatly contributes to the expansion of construction land in Beijing. As shown in Table 7, the slope has a significant negative impact on the expansion of the four types of construction land, indicating that the newly added construction land is mainly distributed in areas with lower slopes. This result is in line with that of the previous studies that have widely highlighted the impact of geographic conditions on urban expansion [81]. In addition to public service land, altitude also has a significant impact on the expansion of the other three types of construction land, but in different directions. Industrial land tends to be distributed in lower altitude areas, while residential land and commercial land are distributed in higher altitude areas. This contrast enriches our knowledge of the natural foundation of urban land expansion, given that most of the previous studies treated construction land as a whole and determined a simply negative relationship between the altitude of a land parcel and its probability of being developed [2].
Location conditions have different effects on the expansion of different types of construction land. Except for residential land, the expansion of the other three types is significantly affected by the distance to the city center. The closer it is to the city center, the more conducive it is to the expansion of construction land. Similarly, some studies have also found that the distance to the city center has a significant negative impact on urban expansion [23,82]. In addition to industrial land, the distance to the district government has a significant impact on residential, public service, and commercial land. Closeness to the district government is less conducive to residential land development, but is more conducive to the expansion of public service land and commercial land. The distance to the town government only has a significant negative impact on public service land, while the distance to the village committee only has a significant negative impact on residential land.
In terms of accessibility, the distance to the bus station has a significant impact on the four types of construction land. The direction is the same, but the impact on commercial land is the most significant, which shows that the closer it is to the bus station, the more conducive it is to the expansion of construction land. The distance to the road only has a significant impact on the expansion of industrial land—and the closer it is to the road, the more favorable the expansion of industrial land—indicating that its development requires a high level of regional accessibility. It has also been suggested by Liu, Yue, and Fan [34] that investment in roads and other infrastructure could be an effective means for local governments to promote or restrict urban expansion [34].
From the perspective of the social economy, only residential land is significantly affected by economic activity, and the higher the economic activity, the more conducive it is to the expansion of residential land. Population density change only has a significant impact on residential and commercial land. Both types of construction land tend to be distributed in areas with a high population density. In contrast, some studies have pointed out that socioeconomic factors play a crucial role in affecting the expansion of construction land [63]; Deng et al. [83] have also proven the powerful role of income growth in China’s urban expansion [83]. However, some scholars believe that the impact of economic factors on urban expansion is geographically different, and in some places, the impact is negligible [2]. Policy planning and spatial autocorrelation have the same direction and a great effect on the four types of construction land expansion, indicating that they are key factors that affect the expansion of construction land in Beijing. Similarly, Ma and Xu [84] have also reported that government policies have a certain macro impact on the direction and speed of urban expansion [84].
4. Conclusions and Policy Implications
This study subdivided construction land and quantitatively analyzed the spatial patterns and driving factors of four types of construction land expansion in Beijing from 2001 to 2010 by using an autologistic model. The results showed remarkable differences in the spatial distribution of the four types of newly developed construction land. First, there are significant differences in the expansion area of the four types of construction land. The expansion scale ranks as follows: industrial land > public service land > residential land > commercial land. Second, the newly developed construction land far from the city center is mainly industrial land, while that in areas close to the city center is mainly residential land and commercial land, which indicates the geographical differentiation of different types of construction land expansion. Third, there is significant spatial agglomeration in construction land expansion, though different types of urban land tend to concentrated in different areas.
New knowledge on the driving forces of urban land expansion is further provided: (1) The main influencing factors vary greatly across different types of urban land expansion. The main factors affecting the expansion of industrial land are topography and accessibility. Residential and commercial land expansion is significantly affected by the distance to the district government, the distance to the village committee, population density change, and economic activity. The expansion of public service land is mainly affected by the distance to the governments at the different levels and the bus stops. (2) The same factor may have different impacts on different types of construction land. For instance, the closer the distance to the district government, the more conducive it is to the expansion of public service land and commercial land, but this is not conducive to the development of residential land. Although the distance to the bus station has a significant negative impact on the expansion of the four types of construction land, its effect on the expansion of commercial land is significantly greater than that of the other three types. (3) Both planning and spatial autocorrelation have significant effects on the four types of construction land expansion. General land use planning has a good guiding effect on the expansion of construction land in Beijing. The spatial autocorrelation variables have the greatest impact among all the factors, indicating that the same type of construction land tends to be distributed in geographically close areas to form an agglomeration economy. These two conclusions are suitable for all types of urban land development. These results illustrate the importance of studying the expansion of different types of construction land and highlighted the great impact of spatial autocorrelation on construction land expansion, which provides another novel aspect for relevant research.
Based on the results of this study, the following policy recommendations are proposed. Firstly, different planning schemes should be formulated for different types of construction land. It was found in this study that the distribution characteristics of the different types of construction land and the influencing factors of expansion are significantly different. Therefore, the main driving forces of the different types of construction land expansion should be considered in policymaking to establish appropriate plans for each type. For example, industrial land is greatly affected by the distance to the bus station and the distance to the road, so the development of industrial land should be designated in an area with better accessibility. Residential land tends to be distributed in areas with high population density and economic activity, so appropriate space should be reserved for residential land development when planning.
Secondly, land policy can better serve agglomerative development of urban economy. The spatial agglomeration effect of construction land is beneficial for saving development costs and maximizing resource utilization. For example, the aggregation of public service land can improve the convenience of citizens; the aggregation of residential land is conducive to community management and the construction of supporting facilities. The agglomeration of industrial land is beneficial for reducing the cost of factory construction and raw material transportation, and the agglomeration of commercial land is helpful for the formation of an agglomeration economy. It was proved in this research that expansion of the four types of construction land has a spatial agglomeration effect, and spatial autocorrelation factors have major effects on the distribution of newly added construction land. Therefore, municipal governments can better use land policy to facilitate agglomerative development of the urban economy.
Finally, multiple local conditions can help city governments more effectively manage the expansion of construction land. The expansion of construction land in rapidly developing cities like Beijing has taken up a large amount of land in suburban areas, but not all of it has been used rationally. To adapt the expansion scale of construction land to the speed of urban development, municipal governments should actively adjust the land use structure and plan the urban spatial layout, make full use of the existing construction land, rationally control the expansion of construction land, and promote the sustainable use of land resources. In accordance with local conditions, the government can better formulate urban land use management policies with corresponding regional characteristics. The government should also comprehensively consider the joint effects of the natural and social economic factors in the region and predict suitable types of construction land for urban development according to local conditions. Different cities have different conditions, and the structure of land use is also different. Therefore, in view of these differences among cities, their development status should be combined to formulate land use management policies that conform to their characteristics.
Author Contributions
Conceptualization, Daquan Huang and Tao Liu; methodology, Daquan Huang, Tao Liu, and Erxuan Chu; software, Erxuan Chu; validation, Daquan Huang, Erxuan Chu; formal analysis, Erxuan Chu; resources, Daquan Huang; data curation, Daquan Huang and Erxuan Chu; writing—original draft preparation, Daquan Huang, Tao Liu and Erxuan Chu; writing—review and editing, Tao Liu and Daquan Huang; visualization, Erxuan Chu; supervision, Daquan Huang and Tao Liu; project administration, Daquan Huang; funding acquisition, Tao Liu. All authors have read and agreed to the published version of the manuscript.
Funding
This research was funded by the National Key Research and Development Program of China (2019YFD1100803).
Conflicts of Interest
The authors declare no conflict of interest.
References
- Deng, J.S.; Wang, K.; Hong, Y.; Qi, J.G. Spatio-temporal dynamics and evolution of land use change and landscape pattern in response to rapid urbanization. Landsc. Urban Plan. 2009, 92, 187–198. [Google Scholar] [CrossRef]
- Seto, K.C.; Fragkias, M.; Güneralp, B.; Reilly, M.K. A Meta-Analysis of Global Urban Land Expansion. PLoS ONE 2011, 6, e23777. [Google Scholar] [CrossRef] [PubMed]
- Liu, Y.; Liu, Y.; Chen, Y.; Long, H. The process and driving forces of rural hollowing in China under rapid urbanization. J. Geogr. Sci. 2010, 20, 876–888. [Google Scholar] [CrossRef]
- Rounsevell, M.D.; Pedroli, B.; Erb, K.-H.; Gramberger, M.; Busck, A.G.; Haberl, H.; Kristensen, S.; Kuemmerle, T.; Lavorel, S.; Lindner, M.; et al. Challenges for land system science. Land Use Policy 2012, 29, 899–910. [Google Scholar] [CrossRef]
- Lambin, E.F.; Meyfroidt, P. Global land use change, economic globalization, and the looming land scarcity. Proc. Natl. Acad. Sci. USA 2011, 108, 3465–3472. [Google Scholar] [CrossRef] [Green Version]
- Fuentes, C.M. Urban function and its effect on urban structure: The case of Ciudad Juárez, Chihuahua. J. Borderl. Stud. 2000, 15, 25–43. [Google Scholar] [CrossRef]
- Zhou, G.; Li, C.; Zhang, J. Identification of urban functions enhancement and weakening based on urban land use conversion: A case study of Changchun, China. PLoS ONE 2020, 15, e0234522. [Google Scholar] [CrossRef]
- NBS. National Bureau of Statistics: 2004 Statistical Bulletin of National Economic and Social Development; NBS: Beijing, China, 2005.
- NBS. National Bureau of Statistics: 2018 Statistical Bulletin of National Economic and Social Development; NBS: Beijing, China, 2019.
- Bai, X.; Chen, J.; Shi, P. Landscape Urbanization and Economic Growth in China: Positive Feedbacks and Sustainability Dilemmas. Environ. Sci. Technol. 2012, 46, 132–139. [Google Scholar] [CrossRef]
- Li, H.; Wei, Y.D.; Liao, F.H.; Huang, Z. Administrative hierarchy and urban land expansion in transitional China. Appl. Geogr. 2015, 56, 177–186. [Google Scholar] [CrossRef]
- Tan, M.; Li, X.; Xie, H.; Lu, C. Urban land expansion and arable land loss in China—a case study of Beijing–Tianjin–Hebei region. Land Use Policy 2005, 22, 187–196. [Google Scholar] [CrossRef]
- Lambin, E.F.; Turner, B.; Geist, H.J.; Agbola, S.B.; Angelsen, A.; Bruce, J.W.; Coomes, O.T.; Dirzo, R.; Fischer, G.; Folke, C.; et al. The causes of land-use and land-cover change: Moving beyond the myths. Glob. Environ. Chang. 2001, 11, 261–269. [Google Scholar] [CrossRef]
- Liu, Y. Research on the urban-rural integration and rural revitalization in the new era in China. Acta Geogr. Sin. 2018, 73, 637–650. [Google Scholar]
- Wei, Y.D.; Li, W. Reforms, Globalization, and Urban Growth in China: The Case of Hangzhou. Eurasian Geogr. Econ. 2002, 43, 459–475. [Google Scholar] [CrossRef]
- Wei, Y.D. Zone Fever, Project Fever: Development Policy, Economic Transition, and Urban Expansion in China. Geogr. Rev. 2015, 105, 156–177. [Google Scholar] [CrossRef]
- Zhai, R.; Zhang, C.; Li, W.; Zhang, X.; Li, X. Evaluation of Driving Forces of Land Use and Land Cover Change in New England Area by a Mixed Method. ISPRS Int. J. Geo-Inf. 2020, 9, 350. [Google Scholar] [CrossRef]
- He, C.; Zhou, Y.; Huang, Z. Fiscal decentralization, political centralization, and land urbanization in China. Urban Geogr. 2015, 37, 436–457. [Google Scholar] [CrossRef]
- Lin, G.C. China’s Landed Urbanization: Neoliberalizing Politics, Land Commodification, and Municipal Finance in the Growth of Metropolises. Environ. Plan. A: Econ. Space 2014, 46, 1814–1835. [Google Scholar] [CrossRef]
- Veldkamp, A.; Lambin, E. Predicting land-use change. Agric. Ecosyst. Environ. 2001, 85, 1–6. [Google Scholar] [CrossRef]
- Wu, W.; Zhao, S.; Zhu, C.; Jiang, J. A comparative study of urban expansion in Beijing, Tianjin and Shijiazhuang over the past three decades. Landsc. Urban Plan. 2015, 134, 93–106. [Google Scholar] [CrossRef]
- Fei, W.; Zhao, S. Urban land expansion in China’s six megacities from 1978 to 2015. Sci. Total. Environ. 2019, 664, 60–71. [Google Scholar] [CrossRef]
- Xu, Q.; Zheng, X.; Zhang, C. Quantitative Analysis of the Determinants Influencing Urban Expansion: A Case Study in Beijing, China. Sustainability 2018, 10, 1630. [Google Scholar] [CrossRef] [Green Version]
- Liu, X.; Wang, M. How polycentric is urban China and why? A case study of 318 cities. Landsc. Urban Plan. 2016, 151, 10–20. [Google Scholar] [CrossRef]
- Huang, D.; Liu, Z.; Zhao, X.; Zhao, P. Emerging polycentric megacity in China: An examination of employment subcenters and their influence on population distribution in Beijing. Cities 2017, 69, 36–45. [Google Scholar] [CrossRef]
- Huang, D.; Liu, Z.; Zhao, X. Monocentric or Polycentric? The Urban Spatial Structure of Employment in Beijing. Sustainability 2015, 7, 11632–11656. [Google Scholar] [CrossRef] [Green Version]
- Liu, J.; Zhan, J.; Deng, X. Spatio-temporal patterns and driving forces of urban land expansion in China during the economic reform era. Ambio 2005, 34, 450–455. [Google Scholar] [CrossRef]
- Braimoh, A.K.; Onishi, T. Spatial determinants of urban land use change in Lagos, Nigeria. Land Use Policy 2007, 24, 502–515. [Google Scholar] [CrossRef]
- Yue, W.; Liu, Y.; Fan, P. Polycentric Urban Development: The Case of Hangzhou. Environ. Plan. A Econ. Space 2010, 42, 563–577. [Google Scholar] [CrossRef]
- McDonald, J.F.; Prather, P.J. Suburban Employment Centres: The Case of Chicago. Urban Stud. 1994, 31, 201–218. [Google Scholar] [CrossRef]
- Liu, Y.; Cao, X.; Li, T. Identifying Driving Forces of Built-Up Land Expansion Based on the Geographical Detector: A Case Study of Pearl River Delta Urban Agglomeration. Int. J. Environ. Res. Public Health 2020, 17, 1759. [Google Scholar] [CrossRef] [Green Version]
- Li, G.; Sun, S.; Fang, C. The varying driving forces of urban expansion in China: Insights from a spatial-temporal analysis. Landsc. Urban Plan. 2018, 174, 63–77. [Google Scholar] [CrossRef]
- Prishchepov, A.V.; Müller, D.; Dubinin, M.; Baumann, M.; Radeloff, V.C. Determinants of agricultural land abandonment in post-Soviet European Russia. Land Use Policy 2013, 30, 873–884. [Google Scholar] [CrossRef] [Green Version]
- Liu, Y.; Yue, W.; Fan, P. Spatial determinants of urban land conversion in large Chinese cities: A case of Hangzhou. Environ. Plan. B Plan. Des. 2011, 38, 706–725. [Google Scholar] [CrossRef]
- Deng, X.; Huang, J.; Rozelle, S.; Uchida, E. Economic Growth and the Expansion of Urban Land in China. Urban Stud. 2009, 47, 813–843. [Google Scholar] [CrossRef]
- Zhong, Y.; Lin, A.; He, L.; Zhou, Z.; Yuan, M. Spatiotemporal Dynamics and Driving Forces of Urban Land-Use Expansion: A Case Study of the Yangtze River Economic Belt, China. Remote. Sens. 2020, 12, 287. [Google Scholar] [CrossRef] [Green Version]
- Li, J.; Fang, W.; Wang, T.; Qureshi, S.; Alatalo, J.; Bai, Y. Correlations between Socioeconomic Drivers and Indicators of Urban Expansion: Evidence from the Heavily Urbanised Shanghai Metropolitan Area, China. Sustainability 2017, 9, 1199. [Google Scholar] [CrossRef] [Green Version]
- Deng, X.; Zhan, J.; Chen, R. The patterns and driving forces of urban sprawl in China. In Proceedings of the 2005 IEEE International Geoscience and Remote Sensing Symposium, IGARSS ’05, Seoul, Korea, 29 July 2005; Volume 3, pp. 1511–1513. [Google Scholar]
- Chen, J.; Gao, J.; Yuan, F.; Wei, Y.D. Spatial Determinants of Urban Land Expansion in Globalizing Nanjing, China. Sustainability 2016, 8, 868. [Google Scholar] [CrossRef] [Green Version]
- Zhang, Z.; Li, N.; Wang, X.; Liu, F.; Yang, L. A Comparative Study of Urban Expansion in Beijing, Tianjin and Tangshan from the 1970s to 2013. Remote. Sens. 2016, 8, 496. [Google Scholar] [CrossRef] [Green Version]
- Gong, J.; Hu, Z.; Chen, W.; Liu, Y.; Wang, J. Urban expansion dynamics and modes in metropolitan Guangzhou, China. Land Use Policy 2018, 72, 100–109. [Google Scholar] [CrossRef]
- Schneider, A.; Chang, C.; Paulsen, K. The changing spatial form of cities in Western China. Landsc. Urban Plan. 2015, 135, 40–61. [Google Scholar] [CrossRef]
- Burnell, J.D. Industrial Land Use, Externalities, and Residential Location. Urban Stud. 1985, 22, 399–408. [Google Scholar] [CrossRef]
- Zheng, Q.; Wang, K.; Huang, L.; Abubakar, G.A.; Zheng, Q. Monitoring the Different Types of Urban Construction Land Expansion (UCLE) in China’s Port City: A Case Study of Ningbo’s Central City. Sustainability 2017, 9, 2374. [Google Scholar] [CrossRef] [Green Version]
- Yang, D.Y.-R.; Wang, H.-K. Dilemmas of Local Governance under the Development Zone Fever in China: A Case Study of the Suzhou Region. Urban Stud. 2008, 45, 1037–1054. [Google Scholar] [CrossRef]
- Cartier, C. ’Zone Fever’, the Arable Land Debate, and Real Estate Speculation: China’s evolving land use regime and its geographical contradictions. J. Contemp. China 2001, 10, 445–469. [Google Scholar] [CrossRef]
- Tao, R.; Su, F.; Liu, M.; Cao, G. Land Leasing and Local Public Finance in China’s Regional Development: Evidence from Prefecture-level Cities. Urban Stud. 2010, 47, 2217–2236. [Google Scholar] [CrossRef]
- Deng, F.F.; Huang, Y. Uneven land reform and urban sprawl in China: The case of Beijing. Prog. Plan. 2004, 61, 211–236. [Google Scholar] [CrossRef]
- Kuang, W.; Liu, J.; Dong, J.; Chi, W.; Zhang, C. The rapid and massive urban and industrial land expansions in China between 1990 and 2010: A CLUD-based analysis of their trajectories, patterns, and drivers. Landsc. Urban Plan. 2016, 145, 21–33. [Google Scholar] [CrossRef]
- Huang, Z.; Wei, Y.D.; He, C.; Li, H. Urban land expansion under economic transition in China: A multi-level modeling analysis. Habitat Int. 2015, 47, 69–82. [Google Scholar] [CrossRef]
- Alonso, W. Location and Land Use: Toward a General Theory of Land Rent. 1964. Available online: https://www.cabdirect.org/cabdirect/abstract/19641802976 (accessed on 10 July 2020).
- Heikkila, E.; Gordon, P.; Kim, J.I.; Peiser, R.B.; Richardson, H.W.; Dale-Johnson, D. What Happened to the CBD-Distance Gradient? Land Values in a Policentric City. Environ. Plan. A Econ. Space 1989, 21, 221–232. [Google Scholar] [CrossRef]
- Muth, R.F. Cities and Housing. In The Spatial Pattern of Urban Residential Land Use; University of Chicago: Chicago, IL, USA, 1969. [Google Scholar]
- Rigby, D.L.; Essletzbichler, J. Agglomeration economies and productivity differences in US cities. J. Econ. Geogr. 2002, 2, 407–432. [Google Scholar] [CrossRef]
- Canfei, H.; Zhu, S.-J. Industrial agglomeration and labour productivity in transition: An empirical study of Chinese manufacturing industries. Post-Commu. Econ. 2009, 21, 103–115. [Google Scholar] [CrossRef]
- Huang, D.; Jin, H.; Zhao, X.; Liu, S. Factors Influencing the Conversion of Arable Land to Urban Use and Policy Implications in Beijing, China. Sustainability 2014, 7, 180–194. [Google Scholar] [CrossRef] [Green Version]
- Meng, Y.; Zhang, F.-R.; An, P.-L.; Dong, M.-L.; Wang, Z.-Y.; Zhao, T. Industrial land-use efficiency and planning in Shunyi, Beijing. Landsc. Urban Plan. 2008, 85, 40–48. [Google Scholar] [CrossRef]
- Choy, L.H.; Lai, Y.; Lok, W. Economic performance of industrial development on collective land in the urbanization process in China: Empirical evidence from Shenzhen. Habitat Int. 2013, 40, 184–193. [Google Scholar] [CrossRef]
- Huang, S.-L.; Wang, S.-H.; Budd, W.W. Sprawl in Taipei’s peri-urban zone: Responses to spatial planning and implications for adapting global environmental change. Landsc. Urban Plan. 2009, 90, 20–32. [Google Scholar] [CrossRef]
- Ou, J.; Liu, X.; Li, X.; Chen, Y.; Li, J. Quantifying Spatiotemporal Dynamics of Urban Growth Modes in Metropolitan Cities of China: Beijing, Shanghai, Tianjin, and Guangzhou. J. Urban Plan. Dev. 2017, 143, 04016023. [Google Scholar] [CrossRef]
- Zhao, P. Sustainable urban expansion and transportation in a growing megacity: Consequences of urban sprawl for mobility on the urban fringe of Beijing. Habitat Int. 2010, 34, 236–243. [Google Scholar] [CrossRef]
- He, C.; Okada, N.; Zhang, Q.; Shi, P.; Zhang, J. Modeling urban expansion scenarios by coupling cellular automata model and system dynamic model in Beijing, China. Appl. Geogr. 2006, 26, 323–345. [Google Scholar] [CrossRef]
- Li, X.; Zhou, W.; Ouyang, Z. Forty years of urban expansion in Beijing: What is the relative importance of physical, socioeconomic, and neighborhood factors? Appl. Geogr. 2013, 38, 1–10. [Google Scholar] [CrossRef]
- Jiang, F.; Liu, S.; Yuan, H.; Zhang, Q. Measuring urban sprawl in Beijing with geo-spatial indices. J. Geogr. Sci. 2007, 17, 469–478. [Google Scholar] [CrossRef]
- BBS. Beijing Municipal Bureau of Statistics: Beijing Statistical Yearbook; China Statistics Press: Beijing, China, 2001.
- BBS. Beijing Municipal Bureau of Statistics: Beijing Statistical Yearbook; China Statistics Press: Beijing, China, 2011.
- NSA. National Standardization Administration: Current Land Use Classification; NSA: Beijing, China, 2017. [Google Scholar]
- Wang, J.; Lin, Y.; Glendinning, A.; Xu, Y. Land-use changes and land policies evolution in China’s urbanization processes. Land Use Policy 2018, 75, 375–387. [Google Scholar] [CrossRef]
- CAS Chinese Academy of Sciences: International Scientific Data Mirror Website of Computer Network Information Center. Available online: http://www.gscloud.cn (accessed on 20 July 2020).
- NBS National Bureau of Statistics: Fifth Census Data. Available online: http://www.stats.gov.cn/tjsj/pcsj/rkpc/dwcrkpcsj/ (accessed on 20 July 2020).
- NBS National Bureau of Statistics: Sixth Census Data. Available online: http://www.stats.gov.cn/tjsj/pcsj/rkpc/dwcrkpcsj/ (accessed on 20 July 2020).
- Verburg, P.H.; Kok, K.; Pontius, R.G.; Veldkamp, A. Modeling Land-Use and Land-Cover Change. In Land-Use and Land-Cover Change; Springer: Berlin/Heidelberg, Germany, 2006; pp. 117–135. [Google Scholar]
- Lin, Y.; Chu, H.; Wu, C.; Verburg, P.H. Predictive ability of logistic regression, auto-logistic regression and neural network models in empirical land-use change modeling—A case study. Int. J. Geogr. Inf. Sci. 2011, 25, 65–87. [Google Scholar] [CrossRef] [Green Version]
- Wright, R.E. Logistic regression. In Reading and Understanding Multivariate Statistics; American Psychological Association: Washington, DC, USA, 1995; pp. 217–244. [Google Scholar]
- Stoltzfus, J.C. Logistic Regression: A Brief Primer. Acad. Emerg. Med. 2011, 18, 1099–1104. [Google Scholar] [CrossRef] [PubMed]
- Janzen, F.J.; Stern, H.S. Logistic regression for empirical studies of multivariate selection. Evolution 1998, 52, 1564–1571. [Google Scholar] [CrossRef] [PubMed]
- Tripepi, G.; Jager, K.J.; Dekker, F.W.; Zoccali, C. Linear and logistic regression analysis. Kidney Int. 2008, 73, 806–810. [Google Scholar] [CrossRef] [PubMed] [Green Version]
- Hu, Z.; Lo, C.P. Modeling urban growth in Atlanta using logistic regression. Comput. Environ. Urban Syst. 2007, 31, 667–688. [Google Scholar] [CrossRef]
- Besag, J.E. Nearest-Neighbour Systems and the Auto-Logistic Model for Binary Data. J. R. Stat. Soc. Ser. B (Statistical Methodol. 1972, 34, 75–83. [Google Scholar] [CrossRef]
- Sun, C.; Sun, C.; Yang, Z.; Zhang, J.; Deng, Y. Urban Land Development for Industrial and Commercial Use: A Case Study of Beijing. Sustainability 2016, 8, 1323. [Google Scholar] [CrossRef] [Green Version]
- Batisani, N.; Yarnal, B. Urban expansion in Centre County, Pennsylvania: Spatial dynamics and landscape transformations. Appl. Geogr. 2009, 29, 235–249. [Google Scholar] [CrossRef]
- Huang, D.; Tan, X.; Liu, T.; Chu, E.; Kong, F. Effects of Hierarchical City Centers on the Intensity and Direction of Urban Land Expansion: A Case Study of Beijing. Land 2020, 9, 312. [Google Scholar] [CrossRef]
- Deng, X.; Huang, J.; Rozelle, S.; Uchida, E. Growth, population and industrialization, and urban land expansion of China. J. Urban Econ. 2008, 63, 96–115. [Google Scholar] [CrossRef]
- Ma, Y.; Xu, R. Remote sensing monitoring and driving force analysis of urban expansion in Guangzhou City, China. Habitat Int. 2010, 34, 228–235. [Google Scholar] [CrossRef]
Figure 1.
Study area.

Figure 2.
Distribution map of independent variables.

Figure 3.
Distribution of construction land expansion in Beijing from 2001 to 2010.

Figure 4.
Distribution of the four types of newly added construction land in Beijing from 2001 to 2010.
Figure 4.
Distribution of the four types of newly added construction land in Beijing from 2001 to 2010.


Table 1.
Variables and data sources.
| Variable | Expression | Description | Data Source |
|---|---|---|---|
| Dependent variables | |||
| Change of industrial land | Newly added industrial land (yes: 1, no: 0) | Land use survey data of Beijing in 2001 and 2010 | |
| Change of residential land | Newly added residential land (yes: 1, no: 0) | Same as above | |
| Change of public service land | Newly added public service land (yes: 1, no: 0) | Same as above | |
| Change of commercial land | Newly added commercial land (yes: 1, no: 0) | Same as above | |
| Independent variables | |||
| Altitude | Altitude | Vertical distance from a point on the ground above the sea level | The Computer Network Information Center, CAS |
| Slope | Slope | Steepness of a surface unit | Same as above |
| Distance to the city center | Distance to Tiananmen Square | The coordinate point after geocoding by address information | |
| Distance to the district government | Distance to the district government | Same as above | |
| Distance to the county and town government | Distance to the county and town government | Same as above | |
| Distance to the village committee | Distance to the village committee | Same as above | |
| Distance to the bus stop | Shortest distance to the bus stop | Digital map of Beijing | |
| Distance to the road | Shortest distance to the road | Overall urban planning of Beijing from 2004 to 2020 | |
| Economic activity | POI | Density of points of interest (street as unit) | POI point density from Baidu Maps |
| Population density change | POP | Population density change (street as unit) | Fifth and sixth national census data |
| Planning factor | Plan | Planned construction land (yes: 1, no: 0) | General land use planning of Beijing from 2001 to 2010 |
| Spatial autocorrelation variable of industrial land | Weighted average of in surrounding area | Land use survey data of Beijing in 2001 and 2010 | |
| Spatial autocorrelation variable of residential land | Weighted average of in surrounding area | Same as above | |
| Spatial autocorrelation variable of public service land | Weighted average of in surrounding area | Same as above | |
| Spatial autocorrelation variable of commercial land | Weighted average of in surrounding area | Same as above |
Note: POI refers to economic activity in a certain period of time, and POP refers to population density change.
Table 2.
Descriptive statistics of variables.
| Independent Variables | Type | Unit | Min | Max | Average | Standard Deviation |
|---|---|---|---|---|---|---|
| Altitude | Continuous | m | −118 | 2183 | 415.03 | 360.24 |
| Slope | Continuous | ° | 0.00 | 74.25 | 13.05 | 11.32 |
| Continuous | km | 5.61 | 131.60 | 62.53 | 25.65 | |
| Continuous | km | 0.15 | 83.73 | 25.26 | 15.91 | |
| Continuous | km | 0.02 | 122.57 | 6.18 | 4.40 | |
| Continuous | km | 0.00 | 9.36 | 1.25 | 0.92 | |
| Continuous | km | 0.01 | 13.37 | 1.63 | 1.47 | |
| Continuous | km | 0.00 | 11.15 | 1.76 | 1.72 | |
| POI | Continuous | /km2 | 0.46 | 668.90 | 6.88 | 23.27 |
| POP | Continuous | person/km2 | −48.57 | 142.19 | 1.48 | 7.42 |
| Plan | Binomial (0, 1) | / | 0.00 | 1.00 | 0.10 | 0.29 |
Table 3.
Statistics of construction land in 2001 and newly added construction land from 2001 to 2010.
Table 3.
Statistics of construction land in 2001 and newly added construction land from 2001 to 2010.
| District | Construction Land in 2001 | Newly Added Construction Land from 2001 to 2010 | ||
|---|---|---|---|---|
| Area (km2) | Percentage (%) | Area (km2) | Percentage (%) | |
| Chaoyang | 276.97 | 9.71 | 85.51 | 9.67 |
| Haidian | 211.79 | 7.43 | 50.26 | 5.68 |
| Fengtai | 190.74 | 6.69 | 33.93 | 3.84 |
| Shijingshan | 48.93 | 1.72 | 7.68 | 0.87 |
| Changping | 332.99 | 11.68 | 88.98 | 10.06 |
| Shunyi | 263.17 | 9.23 | 34.27 | 3.87 |
| Tongzhou | 225.06 | 7.89 | 122.75 | 13.88 |
| Daxing | 257.90 | 9.04 | 111.17 | 12.57 |
| Fangshan | 317.23 | 11.12 | 106.92 | 12.09 |
| Huairou | 110.22 | 3.86 | 44.50 | 5.03 |
| Pinggu | 107.48 | 3.77 | 35.83 | 4.05 |
| Miyun | 306.37 | 10.74 | 56.90 | 6.43 |
| Yanqing | 116.63 | 4.09 | 75.17 | 8.50 |
| Mentougou | 86.47 | 3.03 | 30.63 | 3.46 |
Table 4.
Statistics of the newly added construction land in Beijing from 2001 to 2010.
| Land Type | Area (km2) | Percentage (%) |
|---|---|---|
| Industrial land | 239.76 | 27.08 |
| Public service land | 131.06 | 14.80 |
| Residential land | 117.96 | 13.32 |
| Commercial land | 59.57 | 6.73 |
Table 5.
Statistics of the newly added construction land in different districts in Beijing from 2001 to 2010.
Table 5.
Statistics of the newly added construction land in different districts in Beijing from 2001 to 2010.
| Land | Industrial Land | Residential Land | Public Service Land | Commercial Land | |||||
|---|---|---|---|---|---|---|---|---|---|
| Type | Area (km2) | Percent (%) | Area (km2) | Percent (%) | Area (km2) | Percent (%) | Area (km2) | Percent (%) | |
| Chaoyang | 18.32 | 7.64 | 10.95 | 9.28 | 21.94 | 16.76 | 10.13 | 17.02 | |
| Haidian | 5.91 | 2.46 | 8.37 | 7.10 | 15.94 | 12.18 | 3.78 | 6.36 | |
| Fengtai | 8.27 | 3.45 | 3.96 | 3.36 | 6.28 | 4.80 | 3.11 | 5.23 | |
| Shijingshan | 1.48 | 0.62 | 0.77 | 0.65 | 1.90 | 1.45 | 0.75 | 1.25 | |
| Changping | 18.54 | 7.74 | 14.12 | 11.97 | 14.38 | 10.99 | 8.00 | 13.44 | |
| Shunyi | 9.50 | 3.97 | 3.28 | 2.78 | 3.37 | 2.57 | 1.89 | 3.17 | |
| Tongzhou | 43.00 | 17.94 | 10.98 | 9.31 | 13.17 | 10.06 | 6.49 | 10.91 | |
| Daxing | 41.06 | 17.13 | 8.58 | 7.27 | 15.79 | 12.06 | 9.94 | 16.71 | |
| Fangshan | 42.35 | 17.67 | 15.00 | 12.72 | 11.74 | 8.97 | 4.24 | 7.13 | |
| Huairou | 9.18 | 3.83 | 8.73 | 7.40 | 4.69 | 3.58 | 3.97 | 6.66 | |
| Pinggu | 7.38 | 3.08 | 5.50 | 4.66 | 5.74 | 4.39 | 1.33 | 2.23 | |
| Miyun | 19.08 | 7.96 | 12.83 | 10.88 | 4.17 | 3.19 | 2.78 | 4.67 | |
| Yanqing | 3.32 | 1.38 | 9.98 | 8.46 | 9.22 | 7.04 | 1.52 | 2.56 | |
| Mentougou | 12.25 | 5.11 | 4.89 | 4.15 | 2.56 | 1.95 | 1.59 | 2.67 | |
Table 6.
Comparison of the fitting effects of the traditional logistic model and autologistic model.
Table 6.
Comparison of the fitting effects of the traditional logistic model and autologistic model.
| Logistic Model | Autologistic Model | |
|---|---|---|
| Industrial land | 0.857 | 0.907 |
| Residential land | 0.853 | 0.880 |
| Public service land | 0.885 | 0.938 |
| Commercial land | 0.893 | 0.912 |
Table 7.
Regression results of the four types of newly added construction land.
| Dependent | Model 1: Industrial Land | Model 2: Residential Land | Model 3: Public Service Land | Model 4: Commercial Land | |
|---|---|---|---|---|---|
| Variables | |||||
| Altitude | 0.99929 ** | 1.00080 ** | 1.00045 | 1.00087 * | |
| Slope | 0.96551 ** | 0.91070 ** | 0.91889 ** | 0.93166 ** | |
| 0.98282 ** | 1.00007 | 0.98187 ** | 0.97608 ** | ||
| 0.99504 | 1.01333 ** | 0.97296 ** | 0.97798 ** | ||
| 0.99639 | 0.99259 | 0.97426 * | 0.98410 | ||
| 1.08129 | 0.61416 ** | 0.92109 | 0.90783 | ||
| 0.86605 ** | 0.77523 ** | 0.73382 ** | 0.41189 ** | ||
| 0.81750 ** | 1.00910 | 1.07247 | 0.87728 | ||
| POI | 0.99980 | 1.00192 * | 1.00108 | 0.99814 | |
| POP | 0.99998 | 1.00076 * | 1.00001 | 1.00015 ** | |
| Plan | 1.86237 ** | 4.41404 ** | 1.73217 ** | 1.62351 ** | |
| Autocov | 491.00696 ** | 439.03939 ** | 1197.64727 ** | 426.14160 ** | |
| N | 148,489 | 148,489 | 148,489 | 148,489 | |
| Nagelkerke’s R2 | 0.334 | 0.275 | 0.399 | 0.279 | |
Note: ** represents a significant correlation at the level of 0.01 (bilateral); * represents a significant correlation at the level of 0.05 (bilateral).
Publisher’s Note: MDPI stays neutral with regard to jurisdictional claims in published maps and institutional affiliations. |
© 2020 by the authors. Licensee MDPI, Basel, Switzerland. This article is an open access article distributed under the terms and conditions of the Creative Commons Attribution (CC BY) license (http://creativecommons.org/licenses/by/4.0/).
Share and Cite
MDPI and ACS Style
Huang, D.; Chu, E.; Liu, T. Spatial Determinants of Land Conversion for Various Urban Use: A Case Study of Beijing. ISPRS Int. J. Geo-Inf. 2020, 9, 708. https://0-doi-org.brum.beds.ac.uk/10.3390/ijgi9120708
AMA Style
Huang D, Chu E, Liu T. Spatial Determinants of Land Conversion for Various Urban Use: A Case Study of Beijing. ISPRS International Journal of Geo-Information. 2020; 9(12):708. https://0-doi-org.brum.beds.ac.uk/10.3390/ijgi9120708
Chicago/Turabian StyleHuang, Daquan, Erxuan Chu, and Tao Liu. 2020. "Spatial Determinants of Land Conversion for Various Urban Use: A Case Study of Beijing" ISPRS International Journal of Geo-Information 9, no. 12: 708. https://0-doi-org.brum.beds.ac.uk/10.3390/ijgi9120708
Note that from the first issue of 2016, this journal uses article numbers instead of page numbers. See further details here.