Intracity Pandemic Risk Evaluation Using Mobile Phone Data: The Case of Shanghai during COVID-19


1
Transportation Research Institute, Tongji University, 4800 Cao’an Road, Shanghai 201804, China
2
Key Laboratory of Road and Traffic Engineering of the Ministry of Education, Tongji University, Shanghai 201804, China
*
Author to whom correspondence should be addressed.
ISPRS Int. J. Geo-Inf. 2020, 9(12), 715; https://0-doi-org.brum.beds.ac.uk/10.3390/ijgi9120715
Submission received: 23 October 2020
/
Revised: 23 November 2020
/
Accepted: 30 November 2020
/
Published: 1 December 2020
(This article belongs to the Collection Spatial Components of COVID-19 Pandemic)
Abstract
:The coronavirus disease 2019 (COVID-19) pandemic has provided an opportunity to rethink the development of a sustainable and resilient city. A framework for comprehensive intracity pandemic risk evaluation using mobile phone data is proposed in this study. Four steps were included in the framework: identification of high-risk groups, calculation of dynamic population flow and construction of a human mobility network, exposure and transmission risk assessment, and pandemic prevention guidelines. First, high-risk groups were extracted from mobile phone data based on multi-day activity chains. Second, daily human mobility networks were created by aggregating population and origin-destination (OD) flows. Third, clustering analysis, time series analysis, and network analysis were employed to evaluate pandemic risk. Finally, several solutions are proposed to control the pandemic. The outbreak period of COVID-19 in Shanghai was used to verify the proposed framework and methodology. The results show that the evaluation method is able to reflect the different spatiotemporal patterns of pandemic risk. The proposed framework and methodology may help prevent future public health emergencies and localized epidemics from evolving into global pandemics.
1. Introduction
Urban systems require synergistic actions to enhance their resilience and to respond effectively to different risks generated by anthropogenic factors [1] such as pandemics. In 2020, coronavirus disease 2019 (COVID-19) spread rapidly worldwide. The large-scale spread of COVID-19 and its long duration enabled the pandemic to evolve into a global public health threat. The COVID-19 crisis continues to claim lives: 33,563,030 confirmed cases and 1,005,218 deaths have been reported worldwide as of the end of September 2020. Moreover, the COVID-19 pandemic has generated a number of issues and has caused significant disruption in society, the economy, and the environment [2].
This unprecedented public health emergency has also attracted the attention of researchers in different fields. In the early stages, the related research focused on the epidemiologic and clinical features of COVID-19 [3,4]. Based on epidemiological investigations, mathematical models have been formulated to predict the spread of COVID-19, including but not limited to compartmental and machine learning models [5,6,7,8,9]. During the COVID-19 pandemic, individual behavior was affected by self-isolation and social distancing measures—which is another interesting research perspective [10,11,12]. In the post-COVID-19 era, the global pandemic has reshaped our society and forced a deep rethink on how to strengthen urban resilience. Therefore, research has leveraged multisource data to explore the relevant factors that have driven the COVID-19 pandemic in order to improve the ability to manage it [13,14,15,16,17,18].
However, the studies that are currently available still have several notable limitations. First, these studies have mainly analyzed the impact of human mobility on the spread of COVID-19 on a relatively large scale (e.g., countries [19], states/provinces [20], and cities [21]), whereas few studies have focused on the spatial distribution of the risk of spread at the city scale. Second, most previous studies have used. air travel data [22], traffic sensor data [23], and other data from various sources [2] to capture human mobility However, the use of mobile phone data with high spatiotemporal resolution is more practical for small-scale explorations of the link between human mobility and pandemics. Last and most importantly, although a series of studies have performed in-depth analyses of the COVID-19 pandemic and developed sophisticated models to support policy making, systematic regional risk assessment frameworks for the initial stage of the pandemic are rare. As the world moves into a post-COVID-19 era, it is worth rethinking how to better detect the potential risk and prevent future disasters like the COVID-19 pandemic.
To fill these gaps, this study proposes a comprehensive intracity pandemic risk evaluation framework based on mobile phone data. Appropriate prevention can effectively interrupt transmission and thus, has an impact on the development of the different stages of a pandemic. Consequently, exploring the mobility pattern of imported high-risk groups and the spatial-temporal distribution of potential risk is the primary objective of our proposed framework, which focuses on the initial stage of the pandemic.
This paper is structured as follows. In Section 2, we review the research that focuses on human mobility and urban risk, especially the COVID-19 pandemic. The detailed pandemic risk evaluation framework is introduced in Section 3. In Section 4, we present the risk evaluation results for Shanghai during the initial stage of the COVID-19 pandemic to demonstrate the proposed method. The conclusion and future research directions are presented in in Section 5.
2. Literature Review
To better minimize the impact of disasters on urban systems, it is important to understand human mobility during these disasters. For example, research on natural disasters or adverse weather conditions are concerned about evacuation patterns [24,25,26,27,28]. Therefore, studies aim to analyze the changes in human mobility patterns under the influence of disasters to propose more effective evacuation plans and emergency measures to reduce casualties and property losses. However, the relationship between human mobility and pandemics is more complex. Human mobility is not only affected by the outbreak of an infectious disease but may also drive the pandemic.
Because human mobility is considered a critical factor in the spread of infectious disease, researchers have focused on using travel data to characterize human mobility and simulate different scenarios to explore the effect of policies that control travel on the pandemic. Popular travel data include human-made investigation data [29], air travel data [30], mobile phone data [31], and integrated applications of multisource data [32]. Because the resolution of travel data determines the effect of assessment outcomes, fine granular travel data derived from mobile phones are better for research on a city-wide scale, which is employed in this study.
Human mobility is still a major topic of research on the ongoing problem of COVID-19. The relevant research can be divided into two categories because the COVID-19 pandemic is divided into two phases: the COVID-19 era and the post-COVID-19 era. In the early stage of the COVID-19 pandemic, travel-related cases of COVID-19 reflected the infectivity of the novel coronavirus. Therefore, extensive research has focused on predicting trends in confirmed cases [5,6,7,8,9]. Most research aims to provide a theoretical basis for policies that help to reduce the spread of COVID-19. The classical epidemic models previously mentioned and analysis of spatiotemporal data to determine human mobility are frequently used tools. After achieving preliminary control, researchers have become interested in the impact of the COVID-19 pandemic on individual travel behavior. Several fascinating conclusions have been drawn, including: (1) driving frequency declined, and restrictions significantly reduced adolescent driving in the post-COVID-19 period [10]; (2) people who were commuting by private car preferred to use bike-sharing [11]; and (3) during the COVID-19 pandemic, the frequency of travel for consumption declined sharply, but travel frequency for community life increased remarkably [12].
Although previous research on COVID-19 provides quantitative results for risk reduction policy making, big data analytics are needed to help initiate rapid responses to the pandemic in the future. We found two studies that are relevant to our work, which used mobile phones to analyze COVID-19 pandemic risk on a city-wide scale. However, their main goal was to model the effect of human mobility and other factors on the number of infected people [33,34] rather than evaluating the potential risk in order to provide support for decision making. A gap in the research still exists in relation to quantifying regional risk at the beginning of the pandemic based on a general and systematic evaluation framework.
3. Methodology
3.1. Definitions
The terms used in this study are defined as follows.
Pandemics are defined as the worldwide spread of an infectious disease. The infectious disease emerges in particular areas (i.e., high-risk places) and quickly spreads through physical contact and population movement (e.g., COVID-19). Therefore, controlling case importations is an essential approach to blocking transmission during the outbreak period.
High-risk groups are defined as groups of people who have probably been infected. However, it is difficult to accurately detect infected people at the beginning of a pandemic. Therefore, given safety concerns, people who have stayed in high-risk places in the past days ( is the incubation period of the infectious disease, that is, the time between exposure and when symptoms are apparent) are defined as being a high-risk group. Conversely, others belong to non-high-risk groups.
Daily human mobility network is a weighted undirected graph , where is the set of nodes representing equal-size spatial units of a city, is the set of edges representing the daily origin-destination (OD) flow between nodes (details are given in Section 3.3 and Section 3.5), and is the set of edge weights representing the number of daily trips between nodes. The edge weight equals 0 if there is no OD flow between two nodes.
Intranode exposure risk is the type of risk that newly infected people generate when susceptible people stay with high-risk groups in a node. To simplify the problem, people are assumed to be in direct contact each other when they stay in the same grid during the activity period (from 6 a.m. to 9 p.m.). As a result, when more susceptible and more high-risk people simultaneously gather in the same grid this indicates higher risk.
Internode transmission risk is the type of risk that high-risk groups transmit from this node to other nodes during the activity period. In contrast to intranode exposure risk, this type of risk is related to the movement of high-risk groups between nodes in the network instead of the probability of physical contact within a node. Consequently, a node’s transmission risk is related to the number of high-risk people in the node and its spatial interactions with other nodes.
3.2. Framework
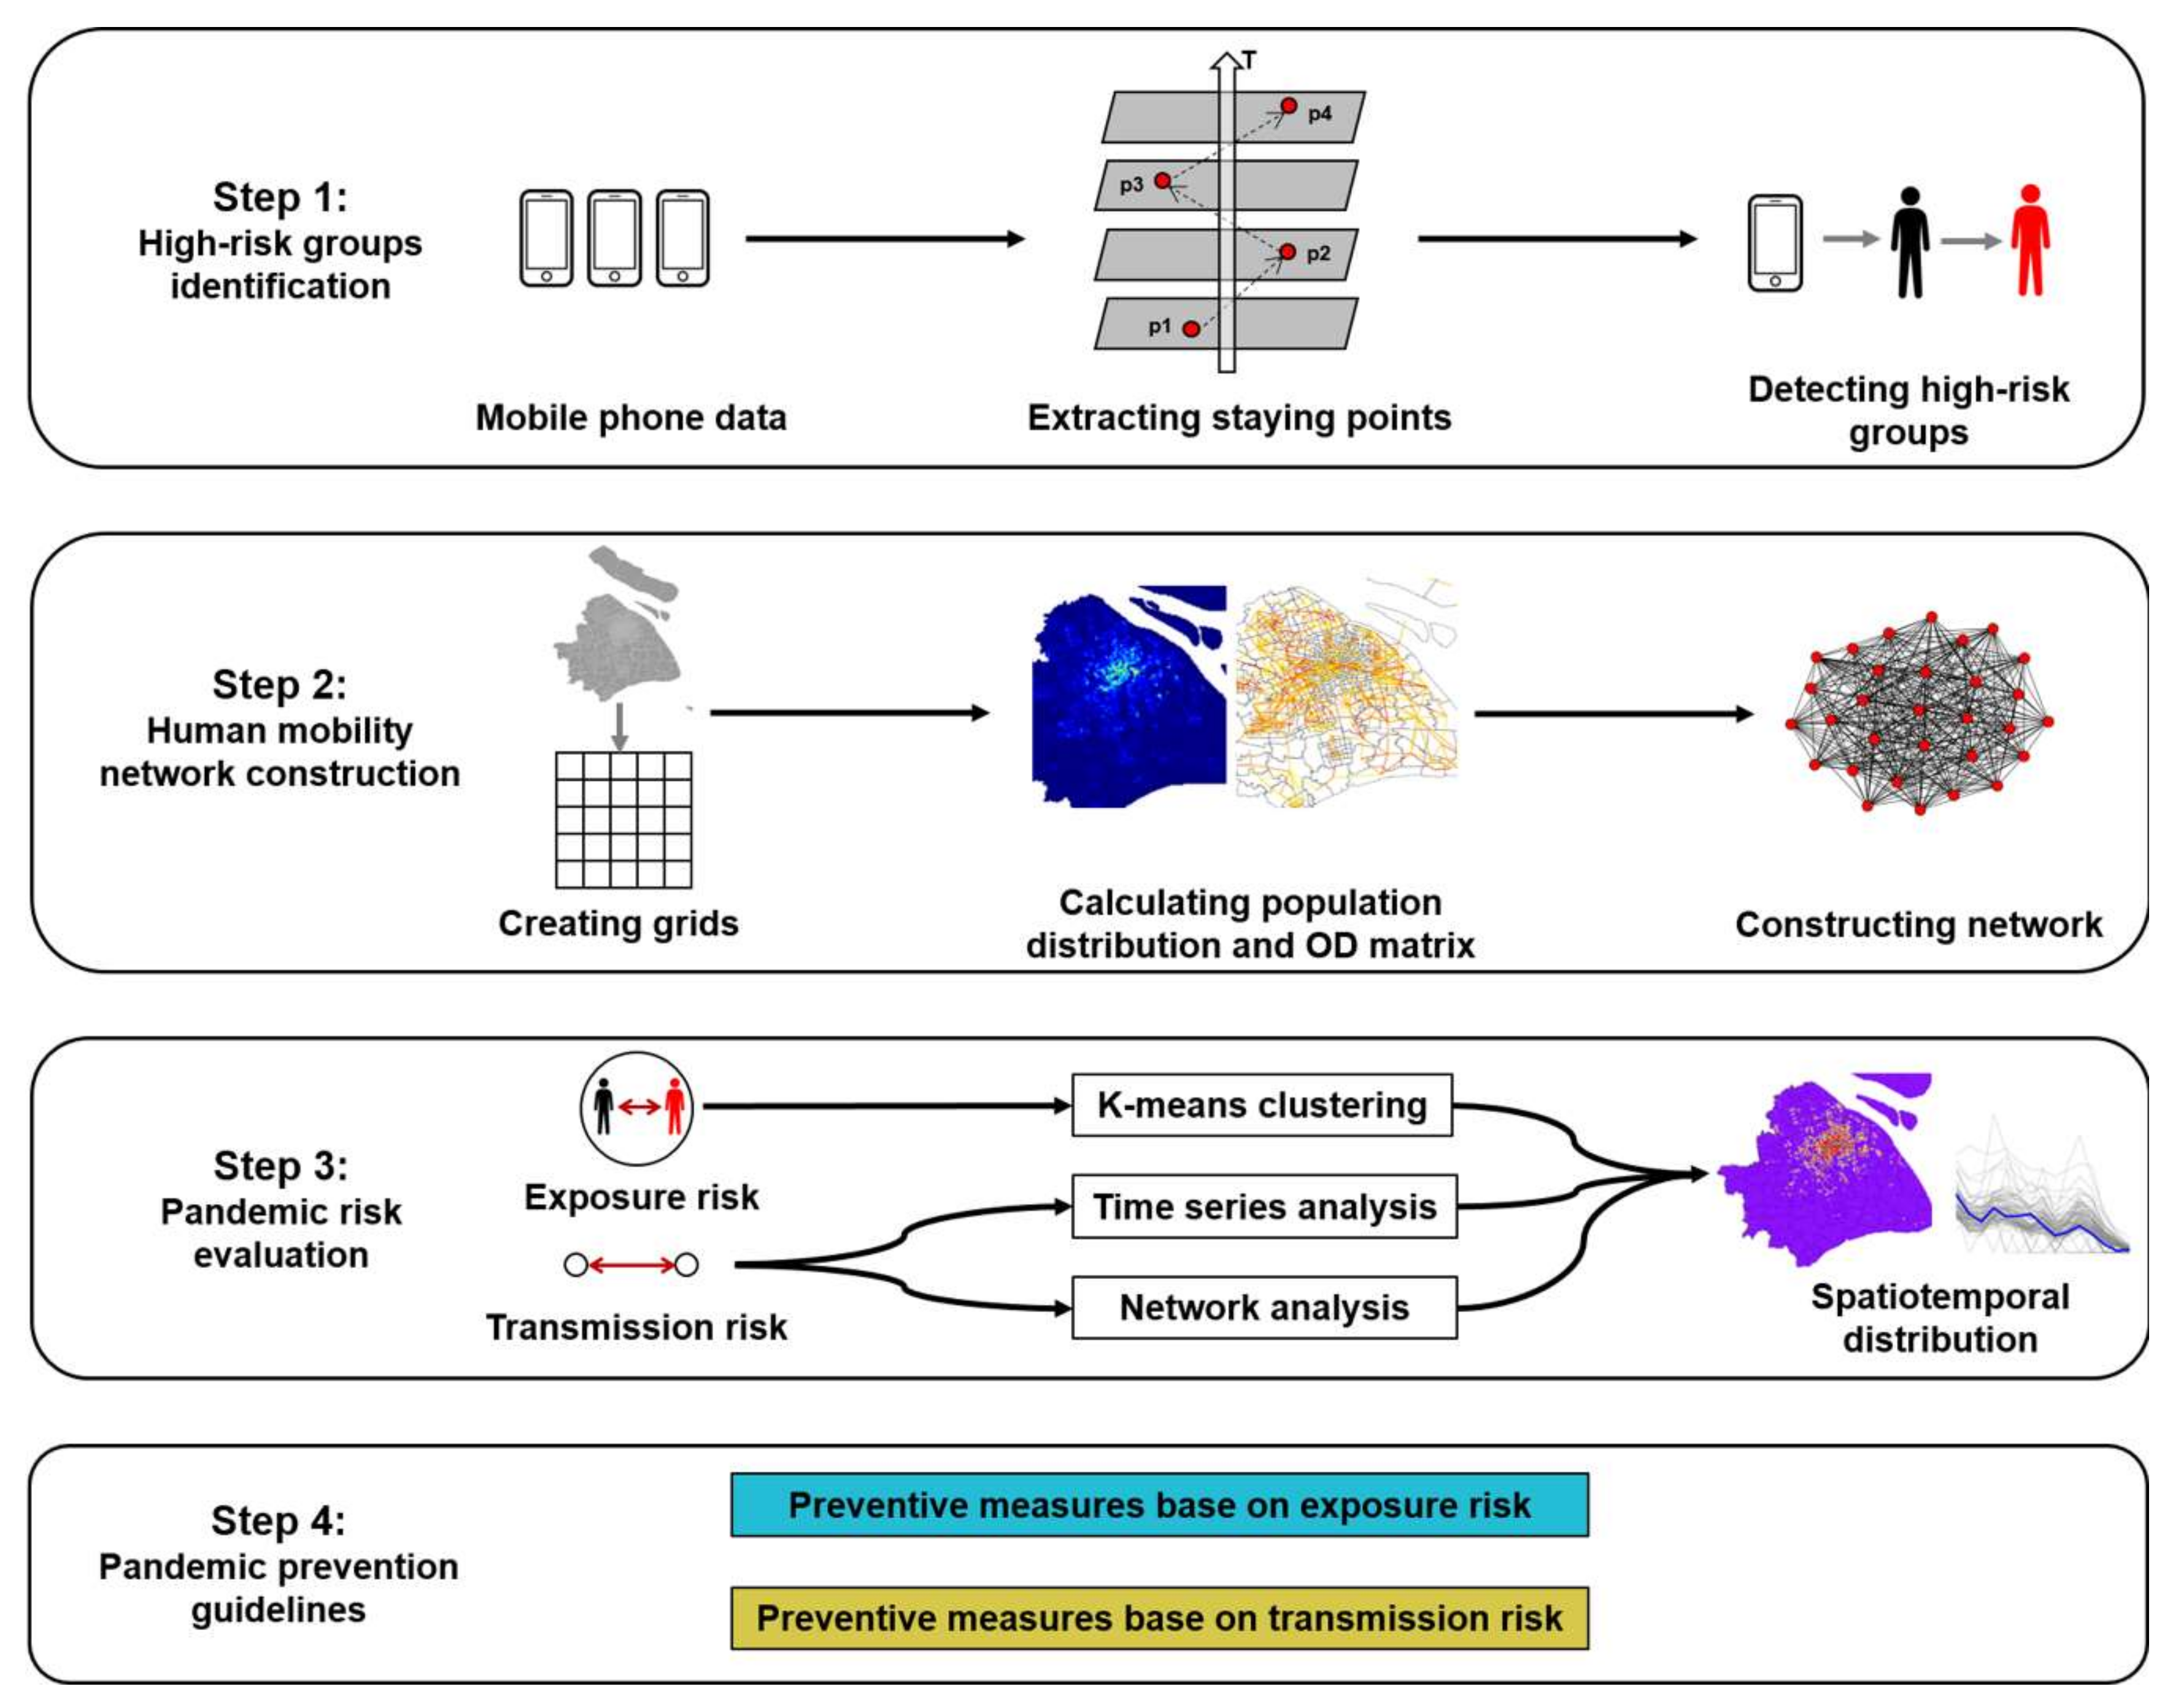
The framework proposed in this study involves four components: (1) identification of high-risk groups, (2) construction of a human mobility network, (3) pandemic risk evaluation, and (4) pandemic prevention guidelines. The specific process is shown in Figure 1. First, the activity points of each mobile phone user were extracted from the raw data, and the high-risk groups were filtered based on several rules. Second, the study area was divided into grids, and each group of people was aggregated into grids based on the location of the stay points. After aggregation, the OD matrix was obtained, and the mobility network was constructed. Third, the regional risk was split into intranode exposure risk and internode transmission risk. Time series analysis, clustering analysis, and network analysis were employed to explore the spatiotemporal patterns of risk. Finally, corresponding policy suggestions were proposed for the different types and different degrees of risk.
3.3. Mobile Phone Data Preprocessing
The primary advantage of mobile phone data in human mobility analysis is that they provide full temporal and population coverage. On the one hand, the locations of mobile phone users are recorded constantly and frequently when the mobile phone is connected to cellular networks [35]. On the other hand, the number of mobile phone users is continuously increasing because mobile phones are affordable and have become a necessity of life.
However, mobile phone data are obtained from telecom companies, and the purpose of data collection is to provide communication services and billing, not human mobility analysis [36]. Therefore, the raw data must be processed. First, invalid records were filtered out to avoid influencing the accuracy of the results. After preprocessing, the mobile phone data were converted into users’ activity data. In the data set, each row records the place, start time, and end time of an activity. A place in which a user stayed more than 0.5 h was labeled as an activity point, and the activity time was then calculated. As a result, a series of multi-day continuous activity records of users were extracted based on the processing rules.
3.4. Identification of High-Risk Groups
After we obtained the activity chain of mobile phone users, the next step was to divide individuals into high-risk and non-high-risk groups, that is, the infected and the susceptible. High-risk groups can be inferred from the spatiotemporal pattern of users’ activities revealed by the processed mobile phone data. As defined in Section 3.1, users were classified into high-risk groups if they had stayed in an area in which the infectious disease had emerged. Therefore, we backtracked users’ activity points to determine whether they had stayed in high-risk areas in the past days. The specific parameter value of varies according to the characteristic incubation period of the infectious disease (e.g., equals 14 for COVID-19).
3.5. Human Mobility Network Construction
Although individual contact networks can be constructed based on the activity records of mobile phone users, this goal is difficult to achieve for the following two reasons: (1) the contact behavior is different for different groups (e.g., sex and age) and different contact locations [37]; and (2) complex contact behavior may result in the simulation consuming significant computing resources. Consequently, the aggregate method was used to count the population and construct the human mobility network to evaluate regional instead of individual risk.
First, the study area was divided into several equal-size grids. The size was set to 500 m 500 m to represent the intensity of users’ activity [38]. Each grid is an independent geographical unit. For each day, the high-risk and non-high-risk groups were aggregated into grids based on activity points by hour. The hourly average value was then calculated as the number of active people within the activity period.
Second, a trip was defined as when users stay in different places in two adjacent activity records (e.g., the origin and destination of a trip are the grids of activity places and if the user stays in at time and stays in at time ). The OD flow between any pair of grids was computed using this rule, and the daily OD matrices were obtained.
In the last step, the daily OD matrix was used to construct a daily human mobility network to reflect the population mobility and spatial interaction between grids. Because the OD matrix is aggregated, the grids are regarded as nodes, and the OD flow between grids is regarded as the network edges. Thus, the edge weights are the number of mobile phone users traveling from one grid to another grid.
3.6. Pandemic Risk Evaluation
3.6.1. Intranode Exposure Risk
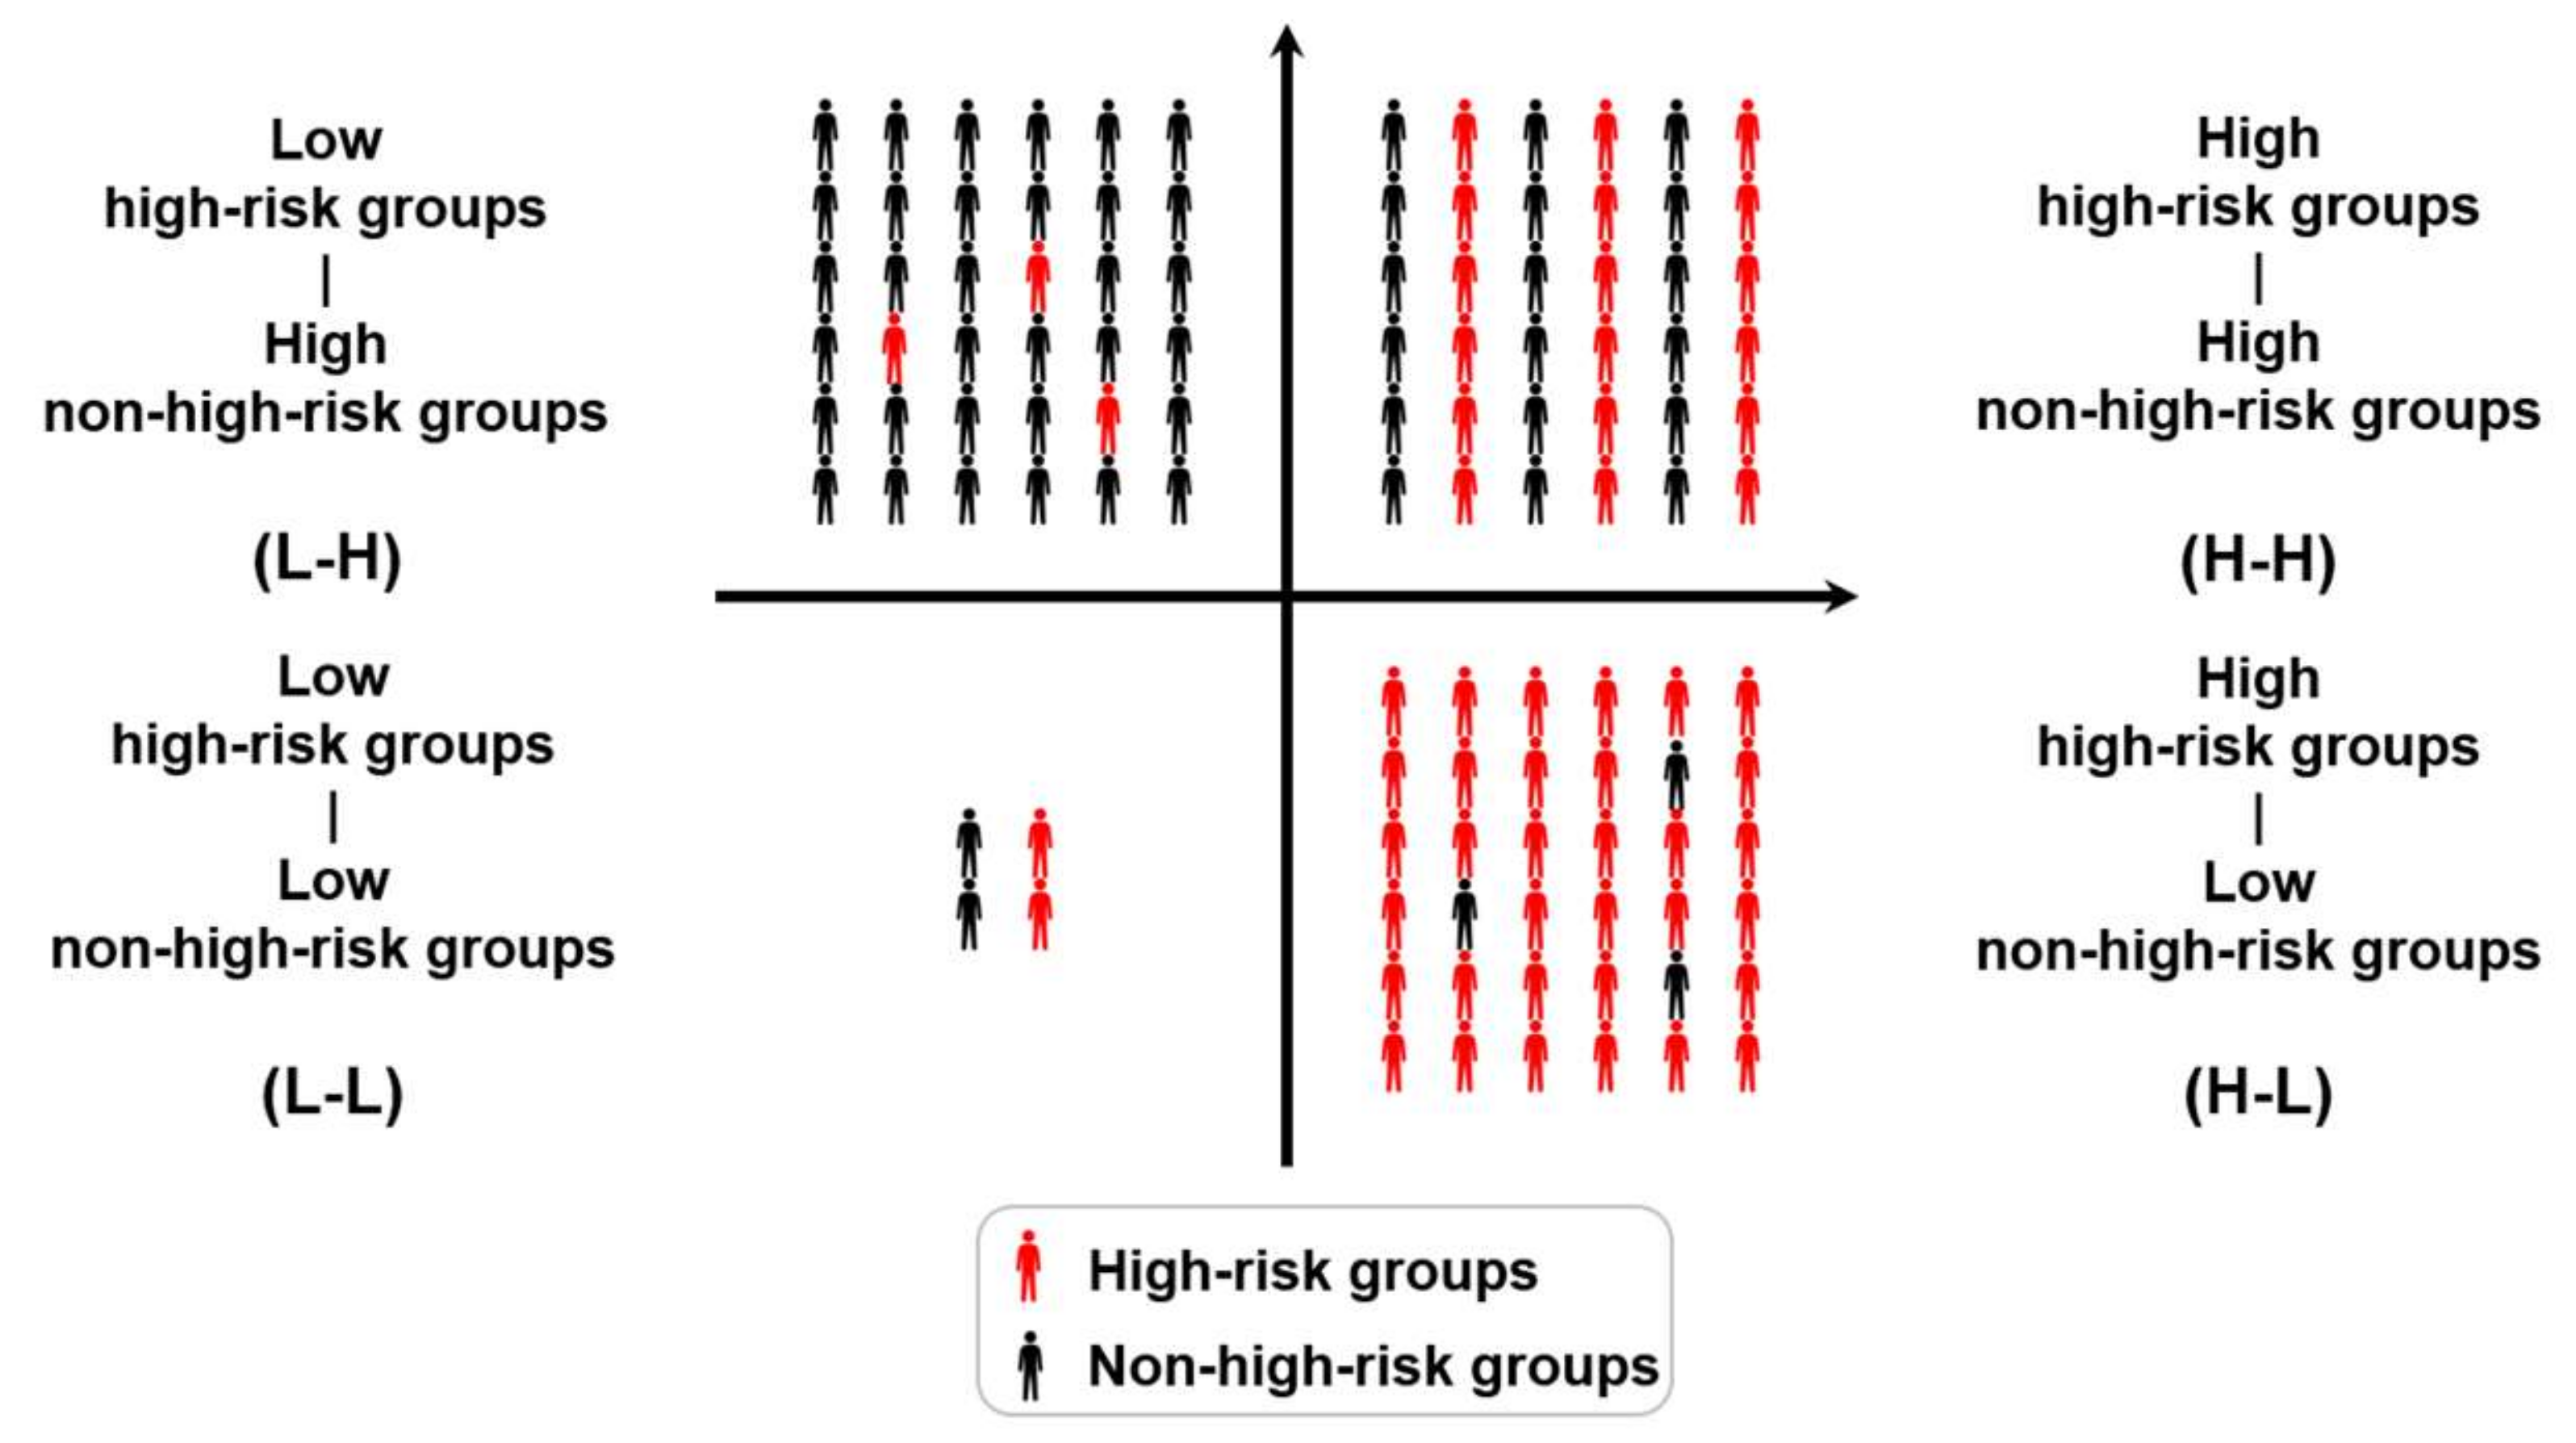
Because the heterogeneity of individual contact behavior was not the focus, the high-risk groups were assumed to contact the susceptible within the same grid. Infection probability increases with the size of high-risk groups. Meanwhile, the number of new infections increases with the size of the susceptible group, which is defined in Section 3.1 as the intranode exposure risk. As shown in Figure 2, the first quadrant generates more new infections, but the fourth quadrant has a higher infection probability. Therefore, the grids were partitioned into several types using the K-means algorithm and the size of the high-risk groups and the size of non-high-risk groups were regarded as two features.
K-means clustering is a simple and popular clustering method in data mining. The goal of K-means was to partition the data into sets and minimize the in-cluster sum of squares. Initially, cluster centers were selected out. In each iteration, the observations were assigned to the closest cluster, and the centroids representing the cluster center were updated until the centroids have stabilized.
After the value of is predefined, the elbow method was used to detect the optimal value. K-means was used to partition the data multiple times and calculate the sum of the squared distances of the samples to their closest cluster center. A curve line can be drawn based on the value and the corresponding distance. The value at the point on the line with maximum curvature [39] is regarded as the optimal .
3.6.2. Internode Transmission Risk
Compared with exposure risk, transmission risk focuses on the ties between nodes in the network instead of an isolated node. Because the infectious disease can spread widely through the movement of high-risk groups and evolves into a pandemic as a result, evaluating internode transmission risk is more critical for early prevention.
In the network analysis, centrality was used to measure the importance of the network nodes. The different understandings of importance result in different definitions of centrality. To evaluate the strength of the linkages between the nodes, a centrality indicator characterized by network flow is appropriate. Therefore, closeness centrality [40] was introduced. Because the daily human mobility network is weighted, and its edge weights are related to the OD flow, distance of edge is defined as follows:
where is the distance of edge i between nodes and , is the number of daily trips of high-risk groups between nodes and
Therefore, closeness centrality is defined by the following equation:
where is the closeness centrality of node , is the number of nodes that can reach node , and is the distance of the shortest path between nodes and . The closeness centrality for each day reflects the chance that high-risk groups move from the current node to other nodes. Additionally, the hourly average number of high-risk groups staying in a node during the activity period is used to quantify potentially infected people. Therefore, the internode transmission risk is defined as follows:
where is the internode transmission risk, is the normalized closeness centrality of node , and is the hourly average number of active high-risk groups staying in node .
The risk assessment result of one specific day fails to reveal the risk trend, and the conclusions may be unreliable. Hence, the internode transmission risk was evaluated for a given period. To identify similarities in the trend in transmission risk, the time series clustering method was introduced.
Based on the time series of the daily transmission risk of nodes, the dynamic time warping (DTW) algorithm [41] was used to measure the similarity between two time series, and the K-means method was used to partition the set of time series into clusters [42,43]. Compared with Euclidean distance, the DTW similarity can capture flexible similarities between time series. In the DTW algorithm, a wrapping function is proposed to turn two nonlinearly aligned temporal sequences into linear sequences, and the optimal match between two sequences is found based on dynamic programming. Recursively, the cost of the optimal alignment is defined as follows [42]:
where is the sequence <>, is the sequence <>, and is the distance between and .
3.7. Pandemic Prevention Guidelines
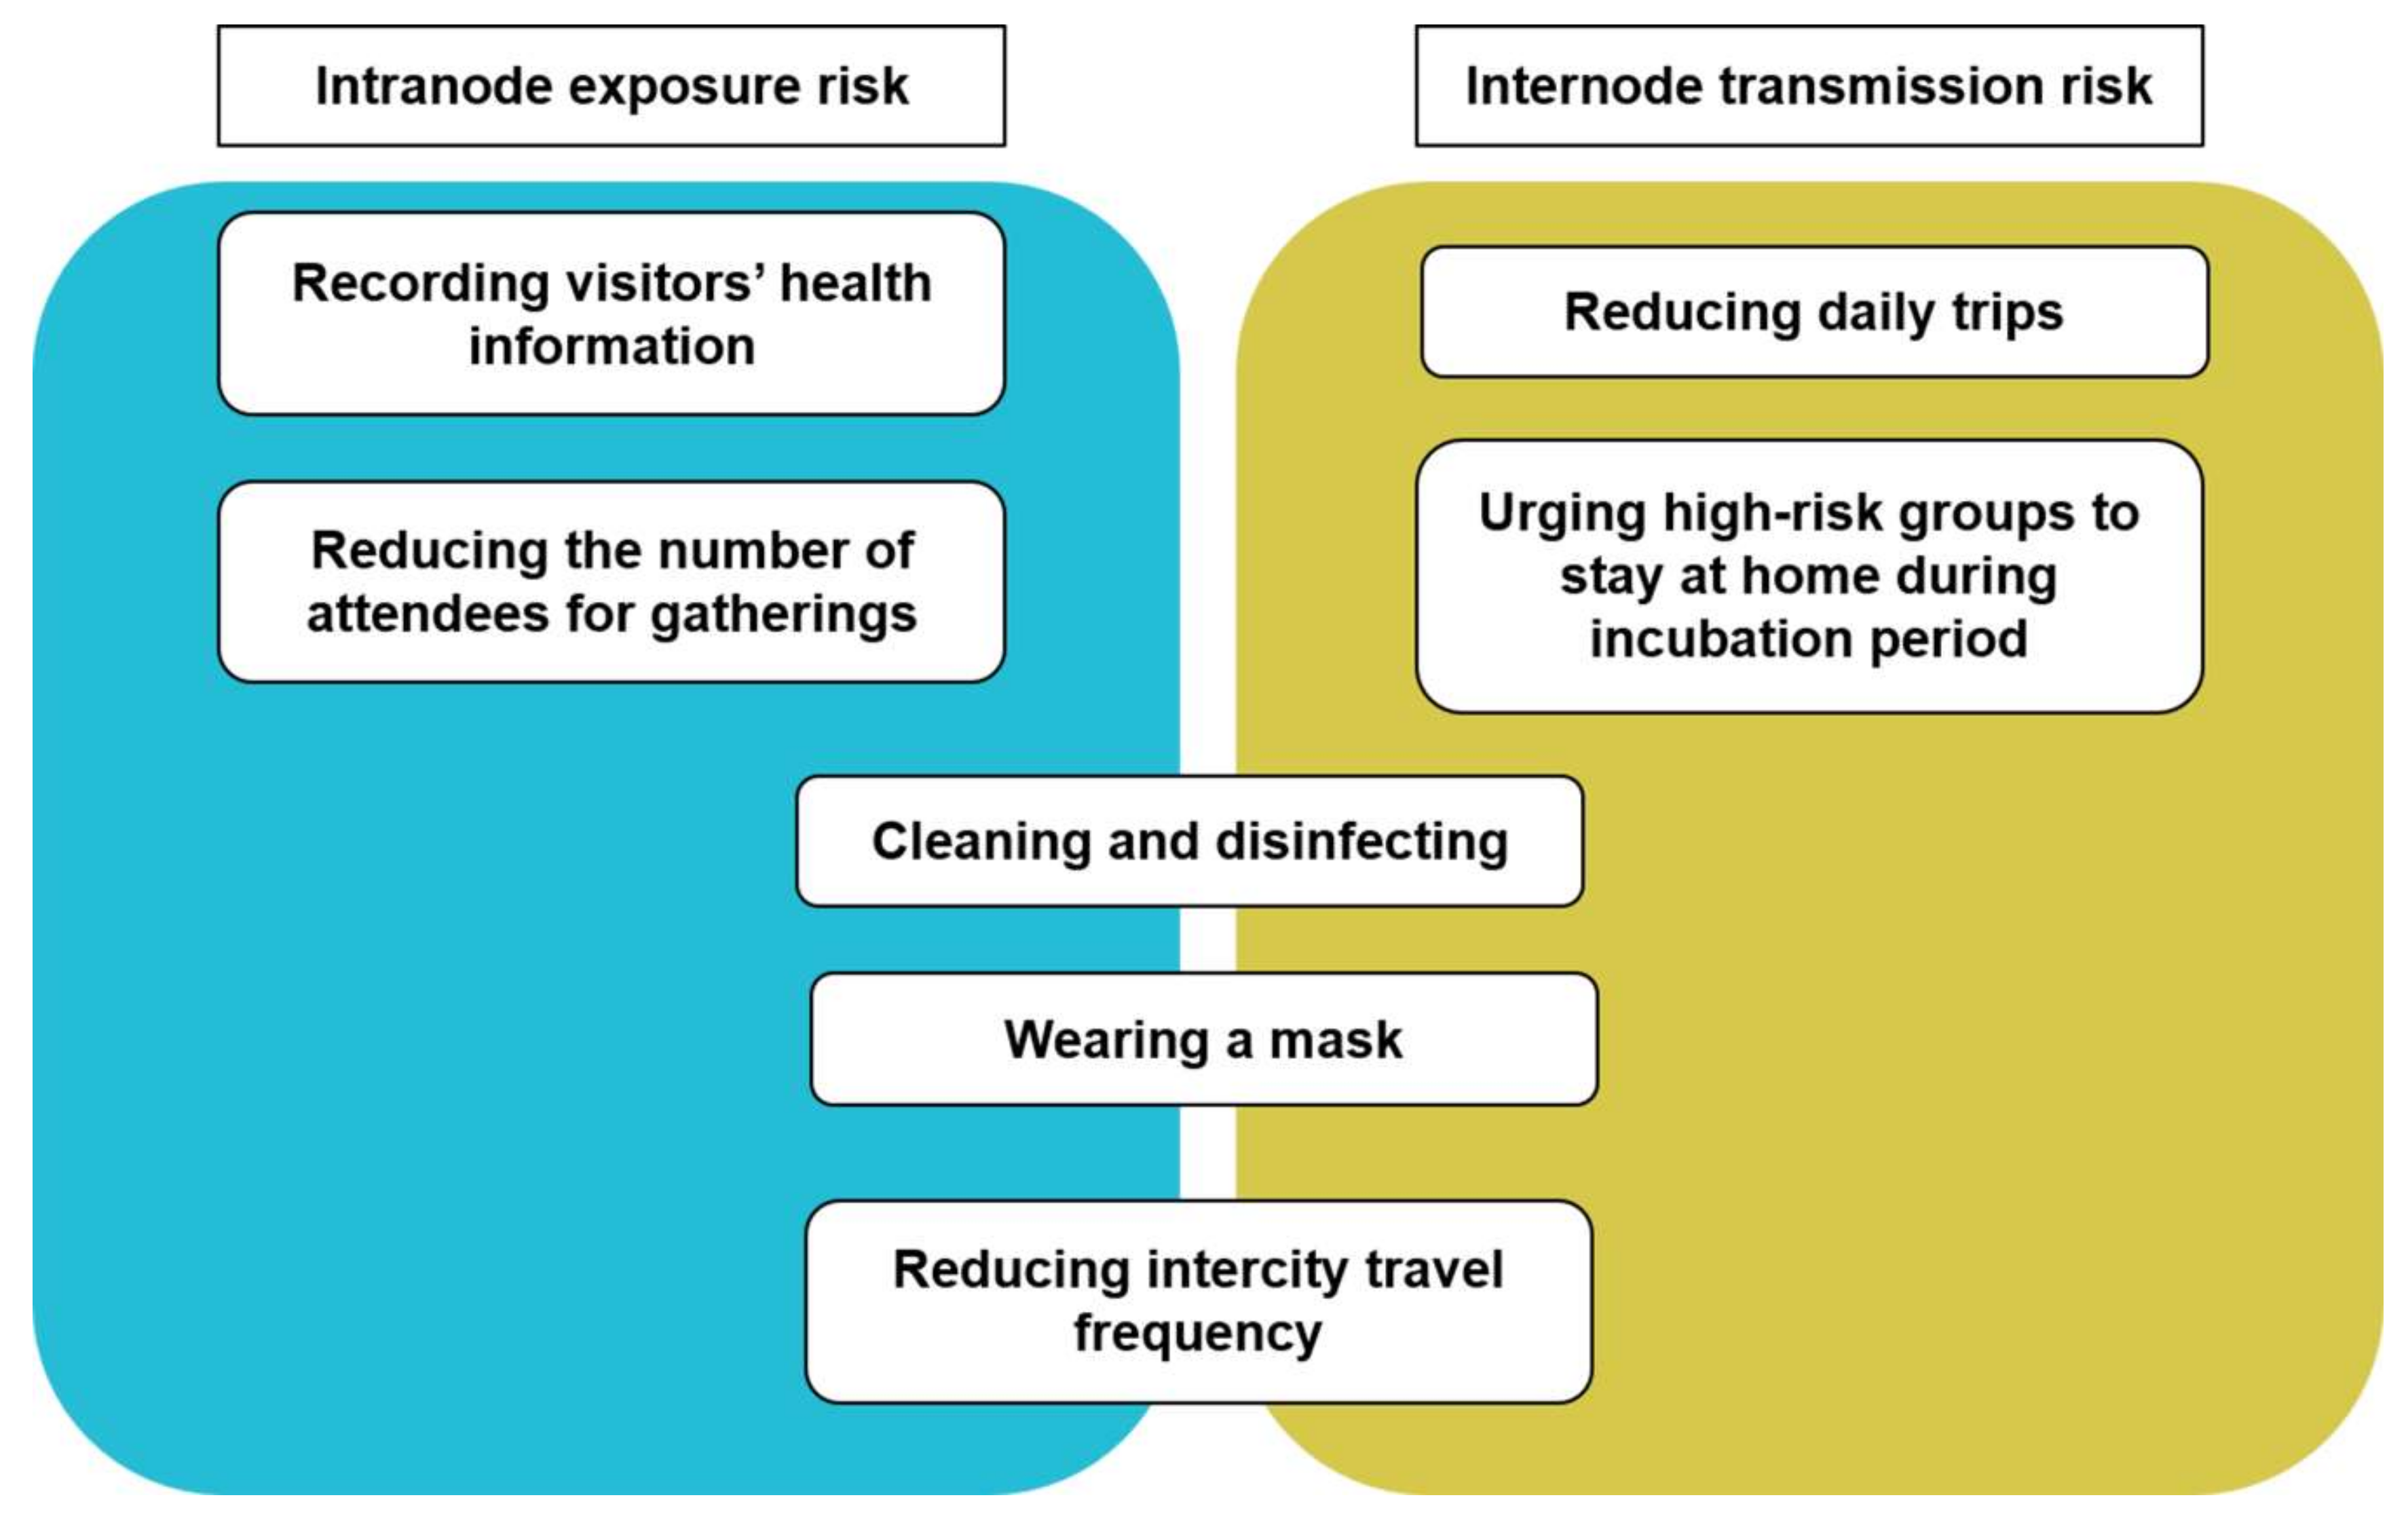
After obtaining the spatiotemporal distribution of pandemic risk, we used this information to propose a series of solutions to reduce risk and spread, as shown in Figure 3. For both exposure and transmission risks, common suggestions are as follows: (1) cleaning and disinfecting frequently to maintain a healthy environment in high-risk public places; (2) strongly encouraging people to use masks in high-risk areas; and (3) reducing intercity travel frequency through self-restriction or transportation management to reduce the number of high-risk groups.
However, several other prevention measures are suggested to cope with different risks. To reduce exposure risk, the main idea is to avoid a large number of susceptible and high-risk groups. On the one hand, reducing the number of attendees or even canceling large-scale gatherings can decrease the probability of contact. On the other hand, visitors’ health information can be recorded using temperature checks or other methods to identify and manage high-risk groups in high exposure risk areas. For transmission risk, we suggest reducing the mobility of high-risk groups within cities. High-risk groups should be urged to stay at home and monitor their health until they are non-high-risk. In addition, susceptible groups should also be encouraged to reduce daily trips during the pandemic.
4. Case Study
4.1. Study Area
The proposed risk evaluation framework is more applicable to densely populated cities because human mobility, which is the focus of the methodology, is more frequent in these cities. In this section, a case study of Shanghai is used to provide a detailed demonstration of the proposed framework. Shanghai is a megacity with high urban density. Additionally, Shanghai is the center of global economic, finance, trade, shipping, and technological innovation in China. In this context, the population is highly concentrated and moving frequently.
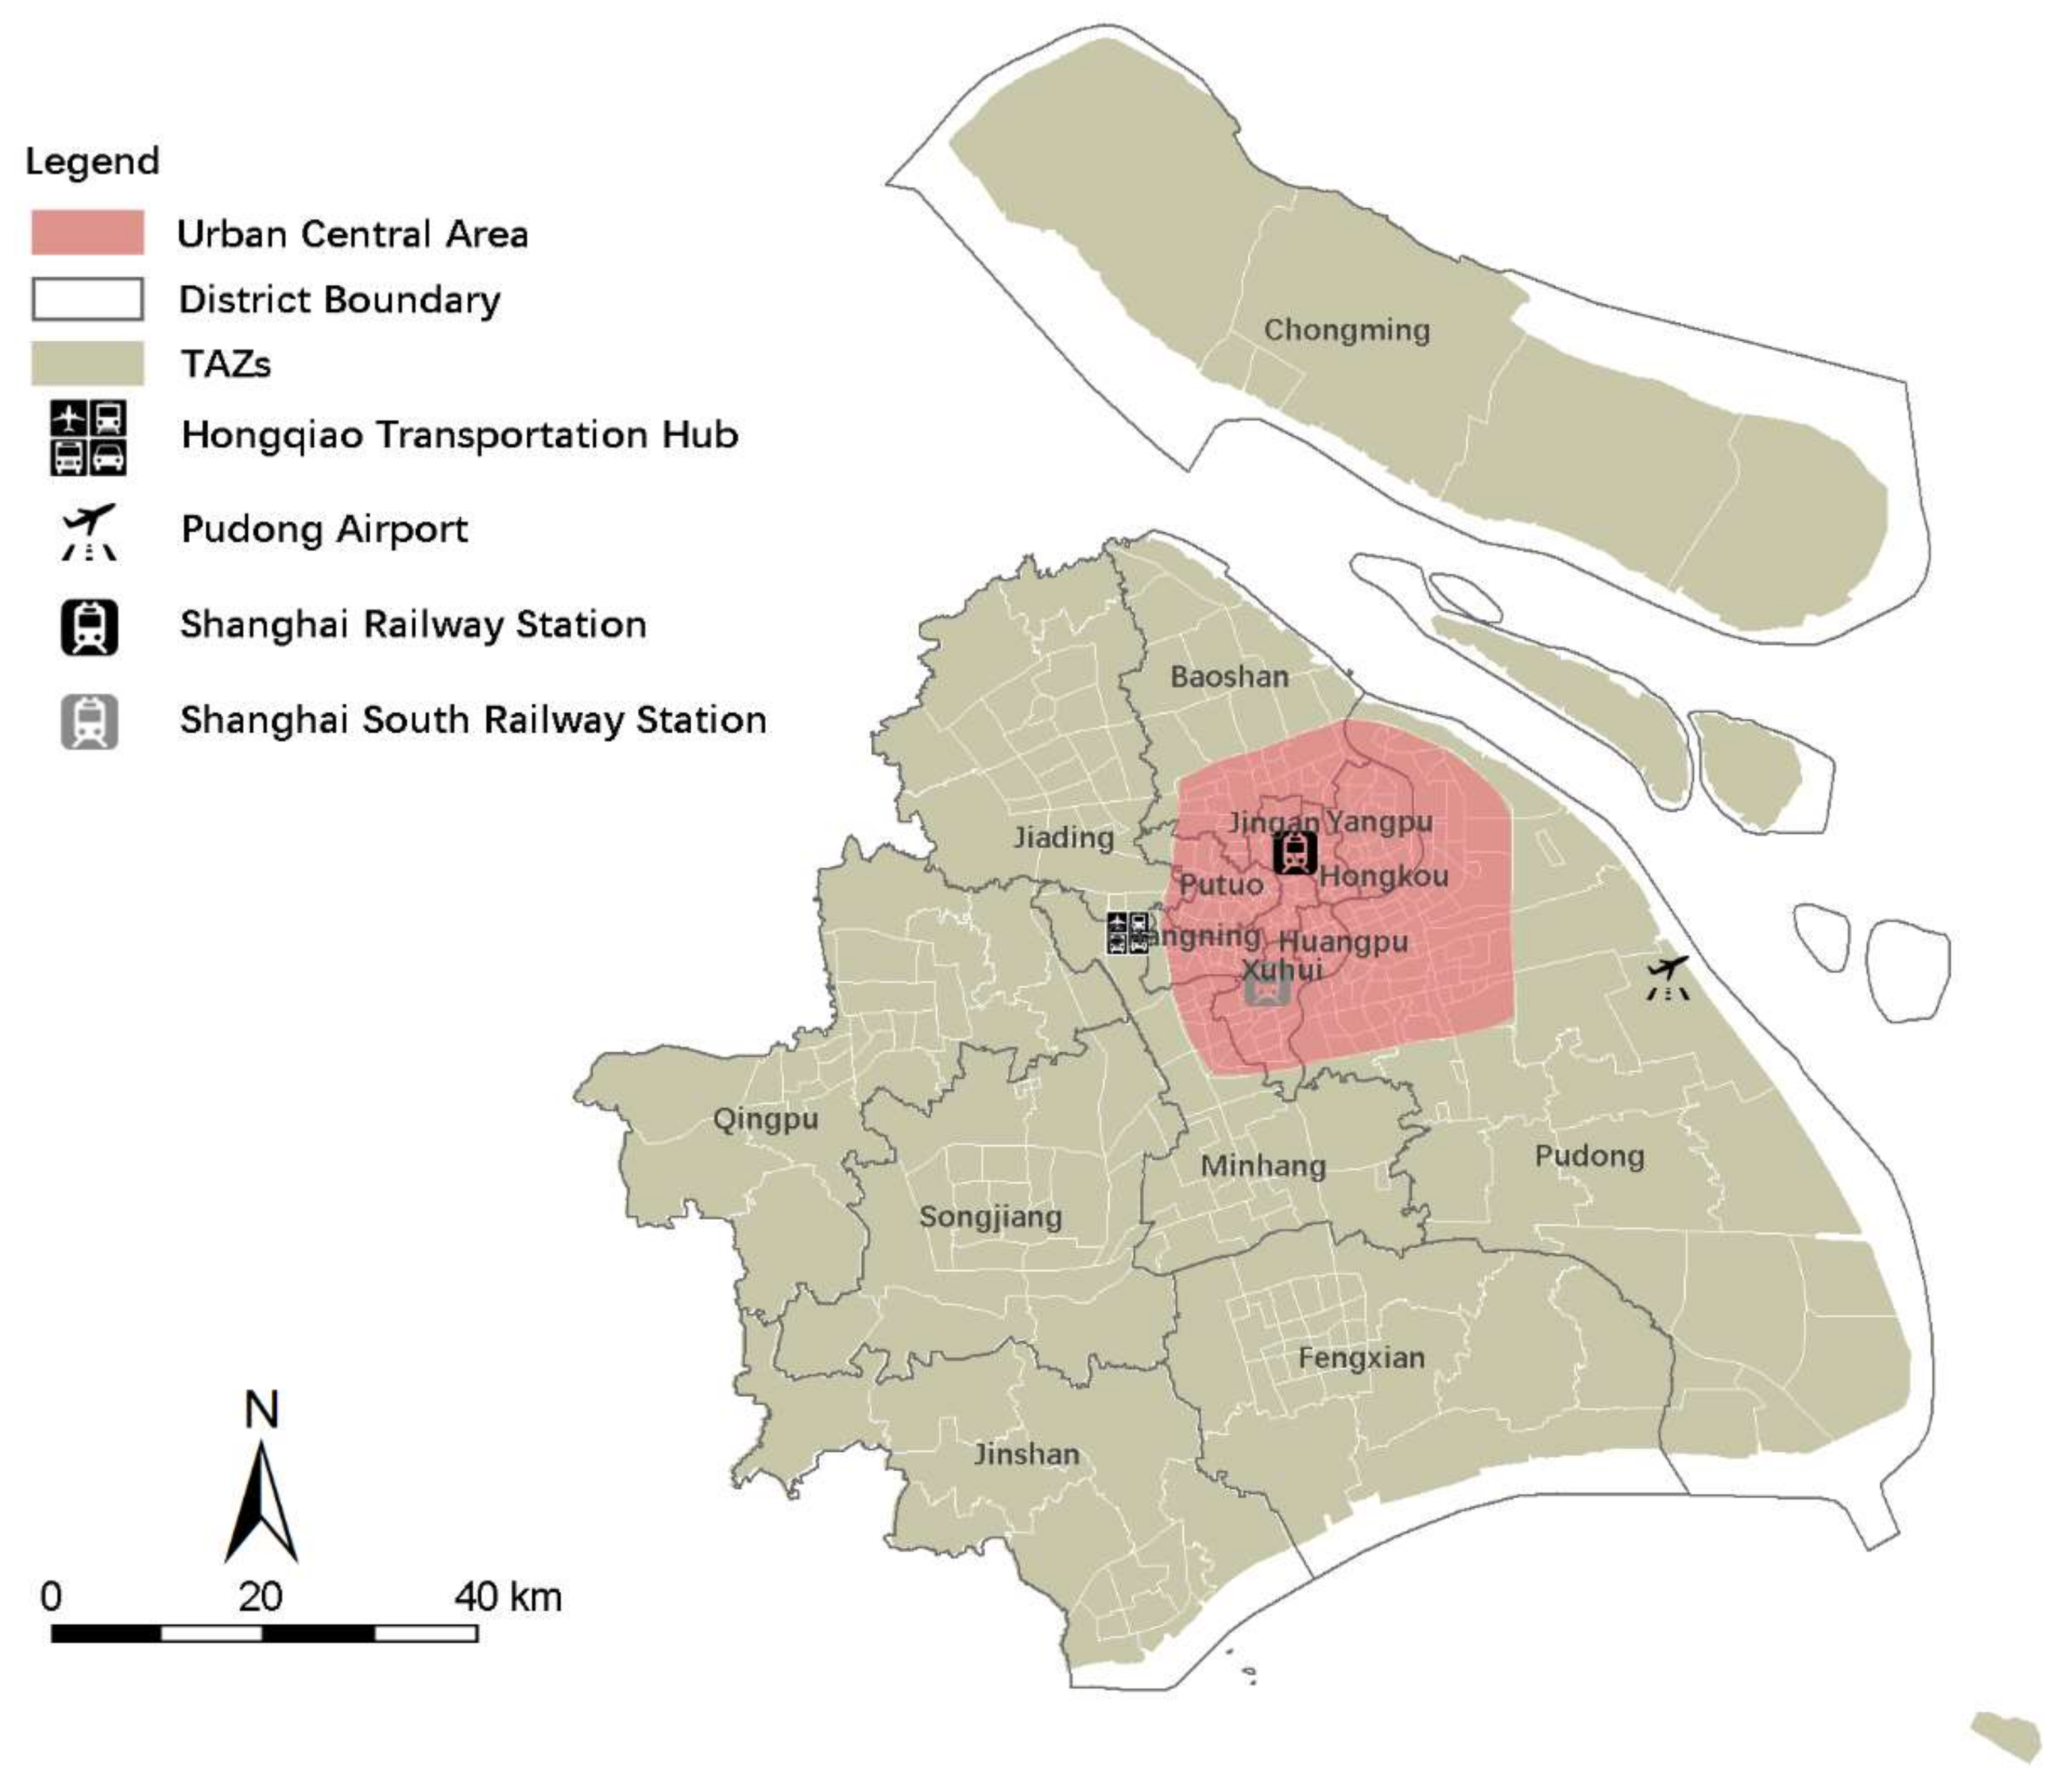
As shown in Figure 4, the territory of Shanghai can be divided into 16 districts and 403 traffic analysis zones (TAZs). The central area of Shanghai, that is, the middle of the city is considered its political, economic, and cultural heart. It is surrounded by an outer ring road (the red zone in Figure 4). In addition to the central area, Shanghai’s external transportation hubs are also crowded places. There are two airports and three main railway stations in Shanghai, which are labeled in Figure 4.
4.2. Study Period
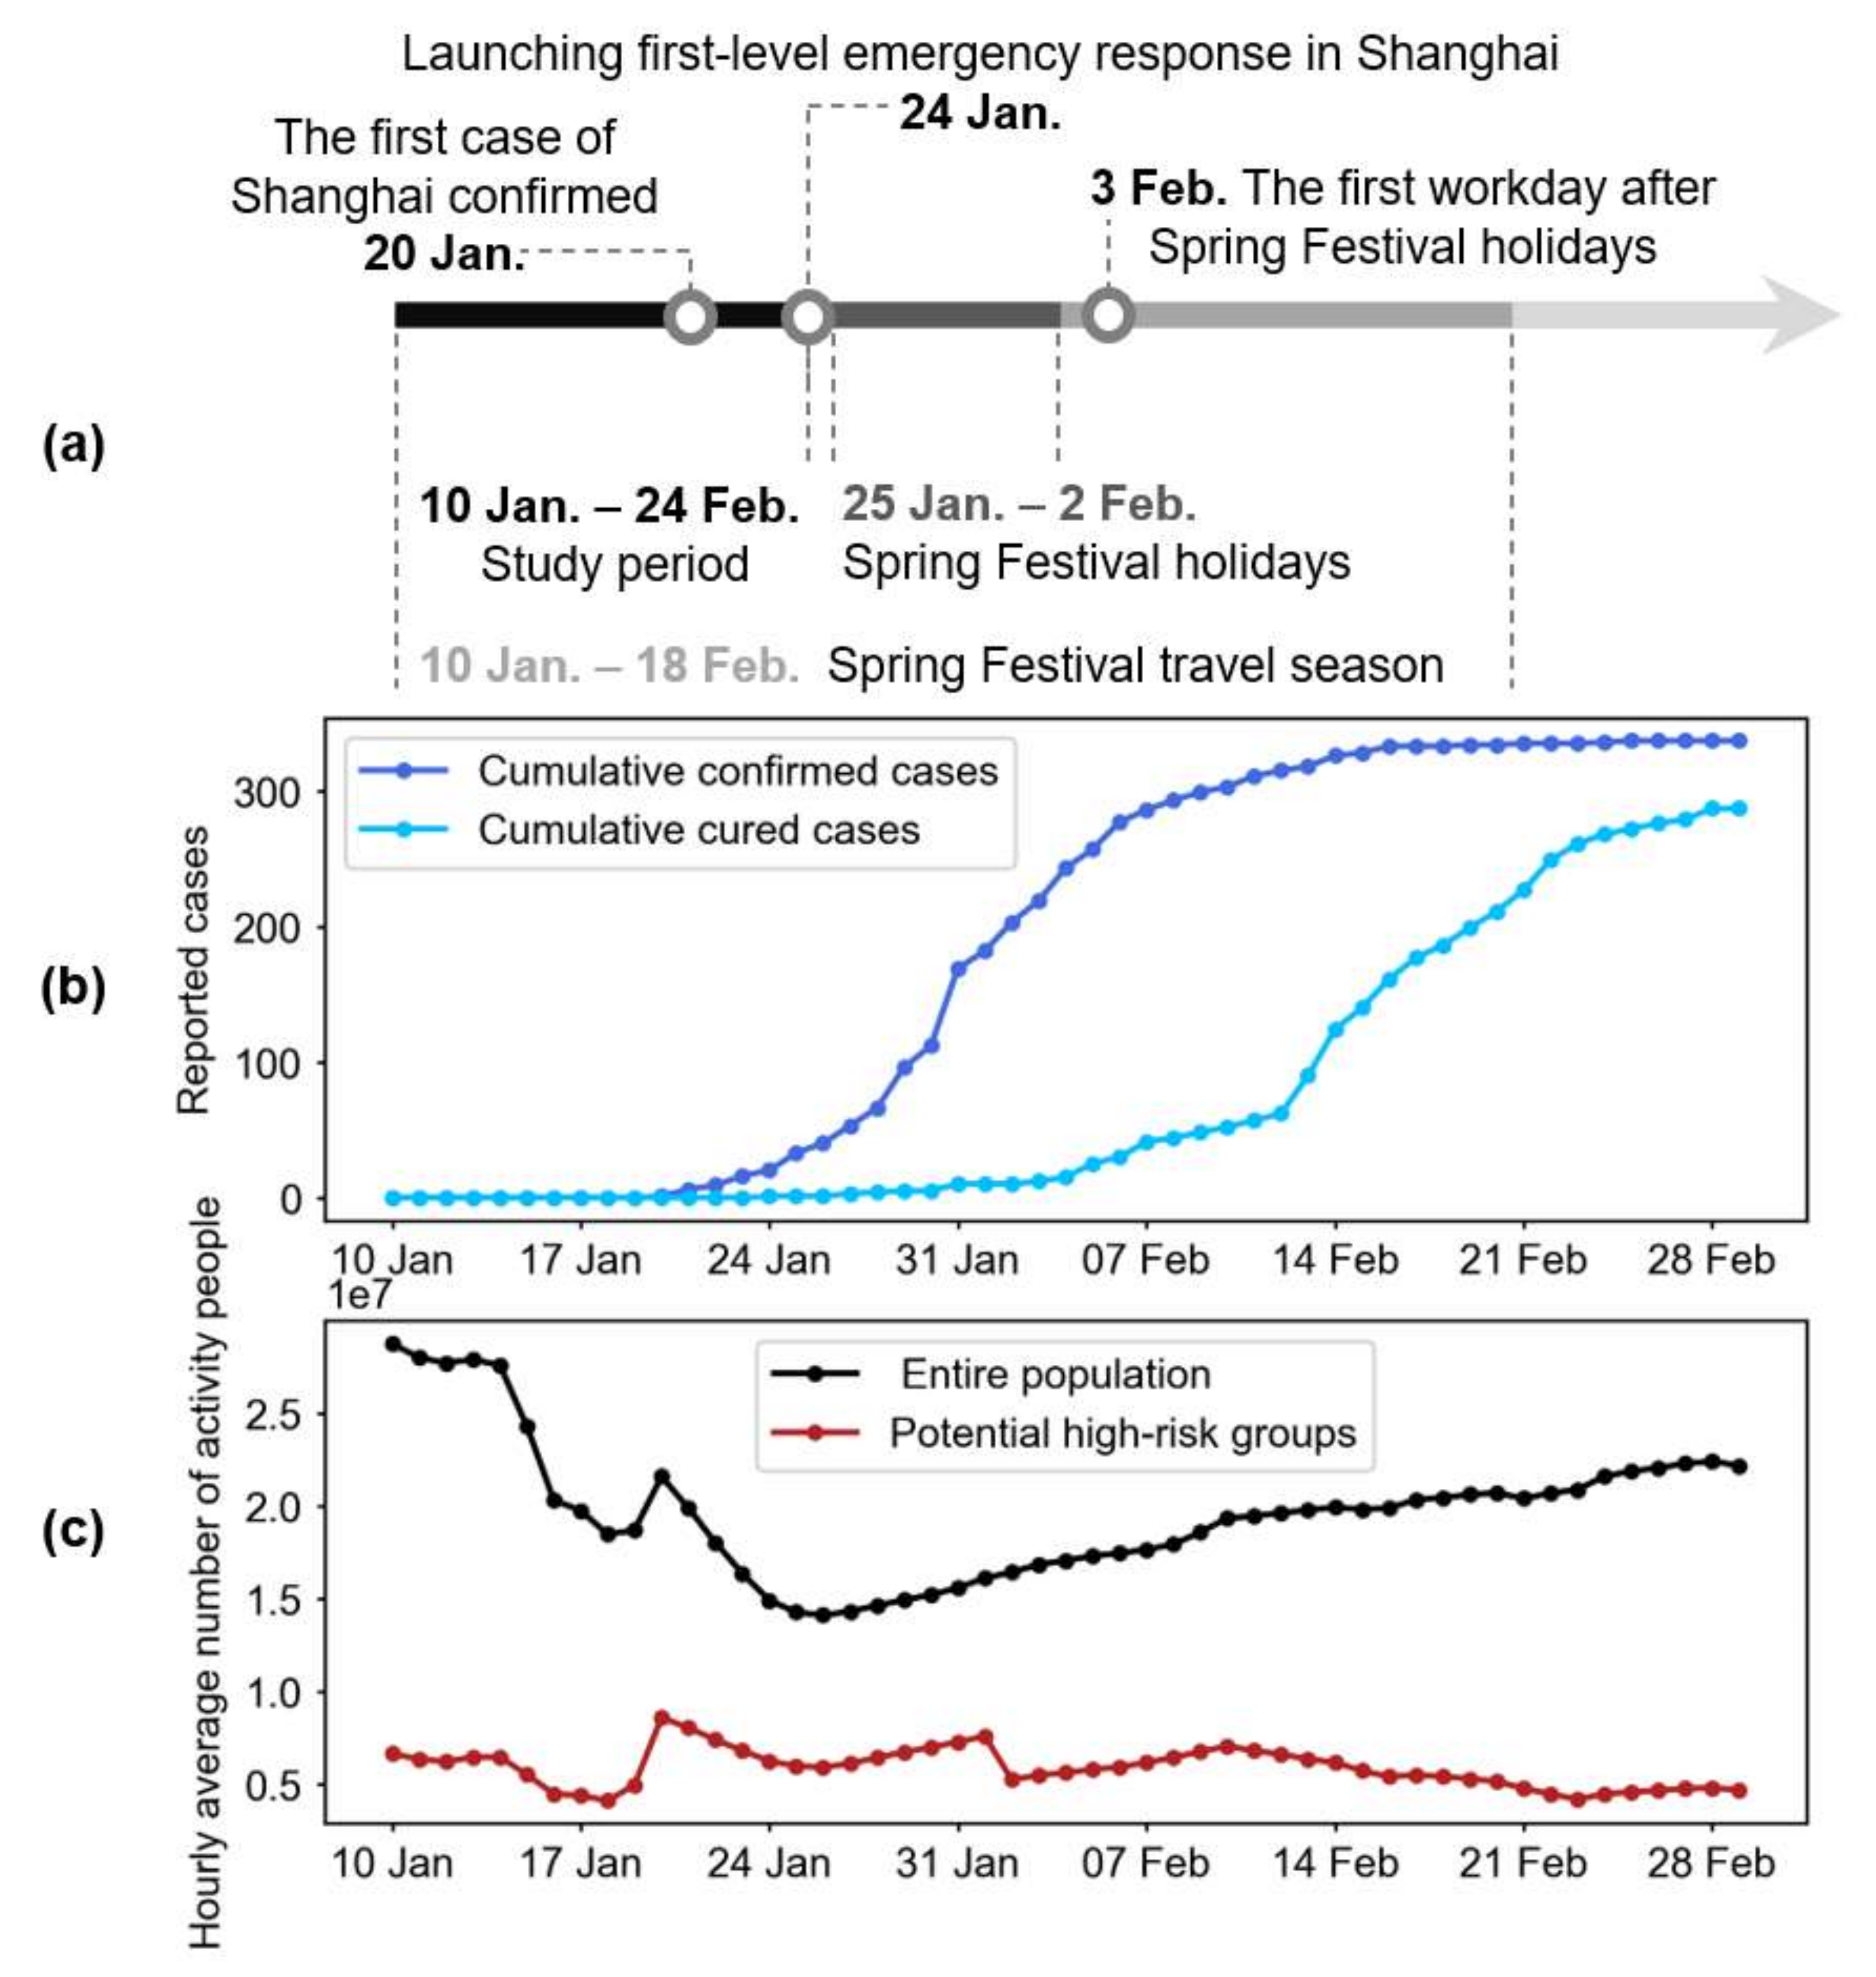
According to the Shanghai Municipal Center for Disease Control and Prevention, the first COVID-19 case in Shanghai was confirmed on 20 January, 2020 (Figure 5a). After that, the number of cases grew continuously until approximately 16 February, 2020 (Figure 5b). If the incubation period is assumed to be 14 days, then the first confirmed case in Shanghai was probably infected on 10 January. Coincidentally, 10 January marks the beginning of the travel season for the Spring Festival, which is the most important traditional Chinese festival. During the Spring Festival, a large number of people travel to reunite with their families. The infection could have been imported to Shanghai through massive migration, and therefore, January is regarded as the beginning of the COVID-19 pandemic in Shanghai.
As shown in Figure 5a, the Spring Festival travel season is divided into three phases. The period before 25 January is the first half of the Spring Festival travel season. A first-level emergency response in Shanghai was launched on 24 January to prevent the pandemic. Thus, the period between 10 January and 24 January is considered the early stage of the COVID-19 pandemic in Shanghai, in which high-risk groups were moving frequently and were in contact with susceptible individuals without targeted prevention. We used the proposed evaluation framework to analyze the potential risk during this period.
4.3. Changes in Dynamic Population
Using mobile phone data, the hourly average real-time changes in population were calculated each day during the study period, and the high-risk groups were extracted. Because the place of origin of COVID-19 has not been accurately identified, regions outside Shanghai were considered risky. Therefore, people arriving in Shanghai from other cities were classified as potential high-risk groups. However, this rule can be adjusted according to the actual situation.
Changes in the population of Shanghai at the beginning of the COVID-19 pandemic are shown in Figure 5c. In general, the number of people engaging in city-wide activity in Shanghai declined from the start of the Spring Festival travel season (10 January 2020) to 25 January, 2020, and then gradually increased. The primary reason for the decline is the large number of migrant workers who left Shanghai and went home to reunite with their families. Similarly, their return home for the Spring Festival resulted in a significant increase in the size of high-risk groups from 18 January 2020, which then remained nearly flat during the Spring Festival holidays. In particular, given the influence of the COVID-19 pandemic, the first workday after the spring holidays (3 February 2020) did not see an increase in the number of high-risk groups, but a decrease.
4.4. Result of Intranode Exposure Risk
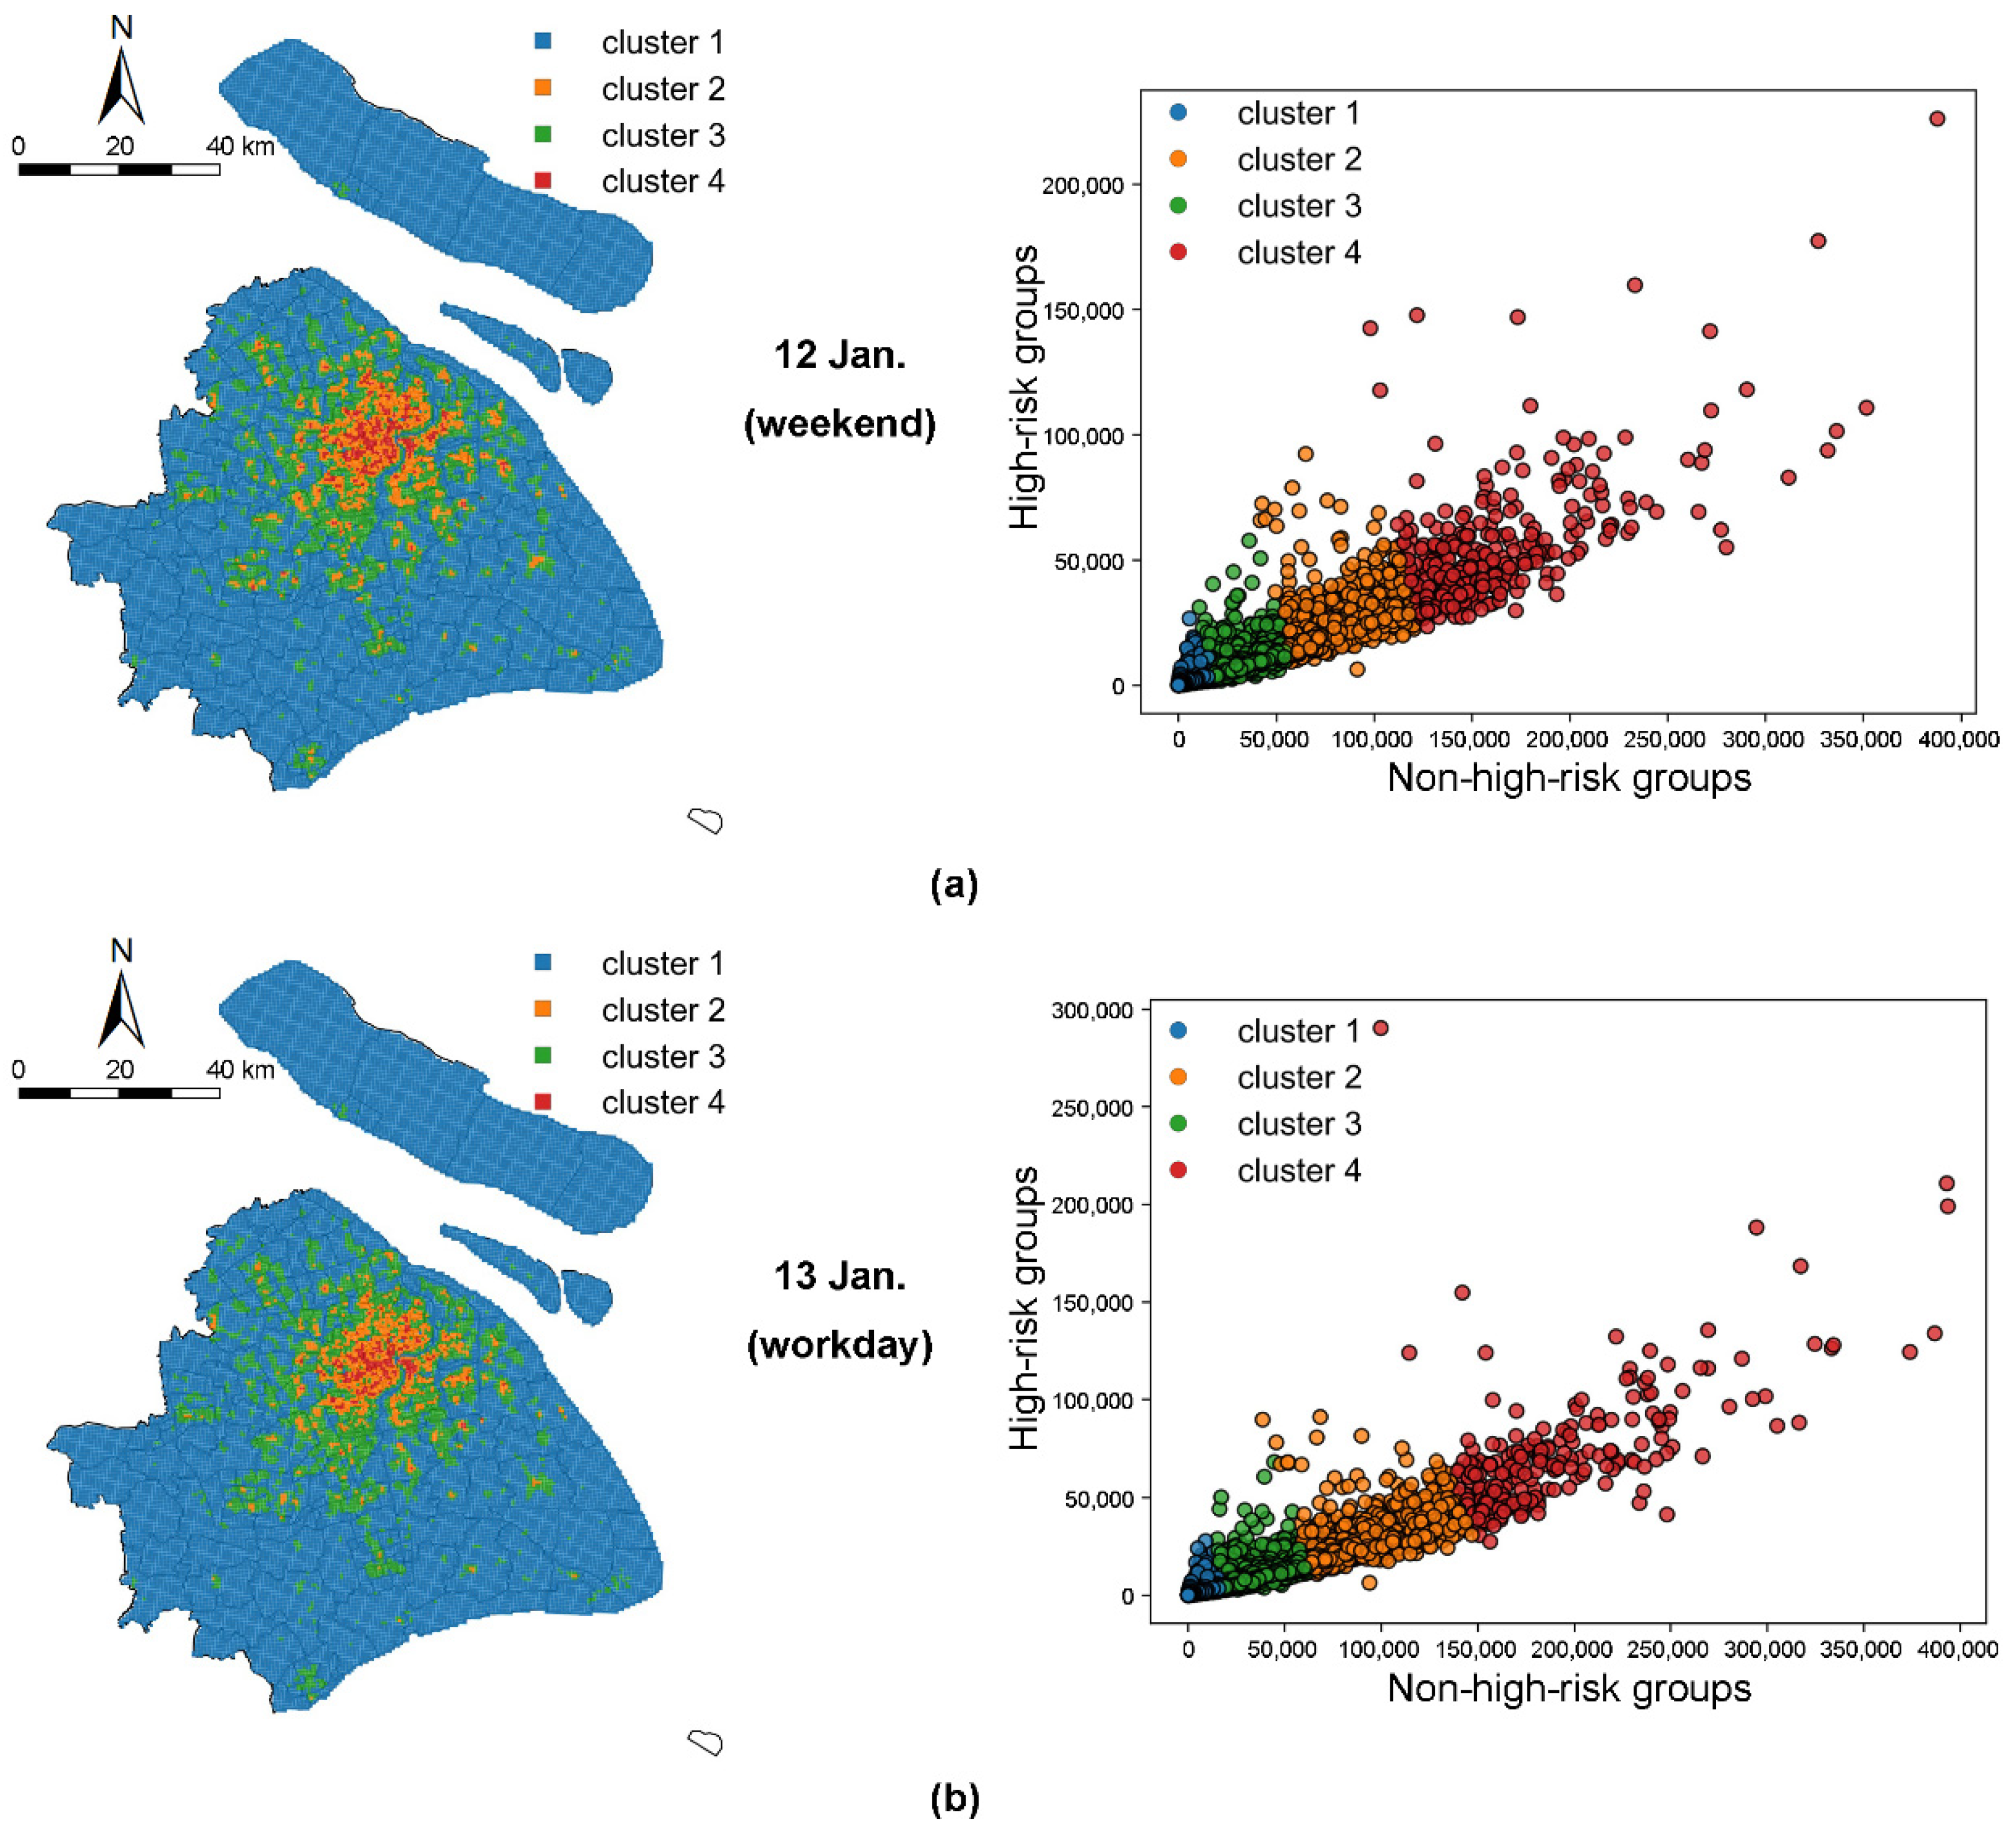
During the study period, the daily dynamic non-high-risk and high-risk groups of each grid were counted, and grids were partitioned into several clusters using K-means clustering. Because the clustering result of each day was substantially unchanged, we selected the results of 12 January (Sunday) and 13 January (Monday) to highlight the differences between workdays and weekends.
The spatial distribution of the clustering results and the scatter plots of the non-high-risk and high-risk groups are shown in Figure 6, with each color representing a different cluster. The scatter plots show a positive relationship between the non-high-risk and high-risk groups in Shanghai. Therefore, the L-H and H-L grids (types in Figure 2) do not appear in the clustering result, and the high-risk groups are concentrated in the grids with large non-high-risk groups.
With regard to spatial distribution, the highest exposure risk grids are classified as cluster 4, which are mostly distributed in the central area, including the high-end financial districts (e.g., Lujiazui) and flourishing business districts (e.g., Nanjing Road). Generally, the exposure risk in the central area is far higher than that in the suburban area, which corresponds to the population distribution. The exposure risk is higher on workdays than on weekends. Although the number of grids in cluster 4 (high-risk grids) on weekends is slightly higher than that on workdays, the threshold of cluster 4 on workdays is significantly higher than that on weekends.
4.5. Results for Internode Transmission Risk
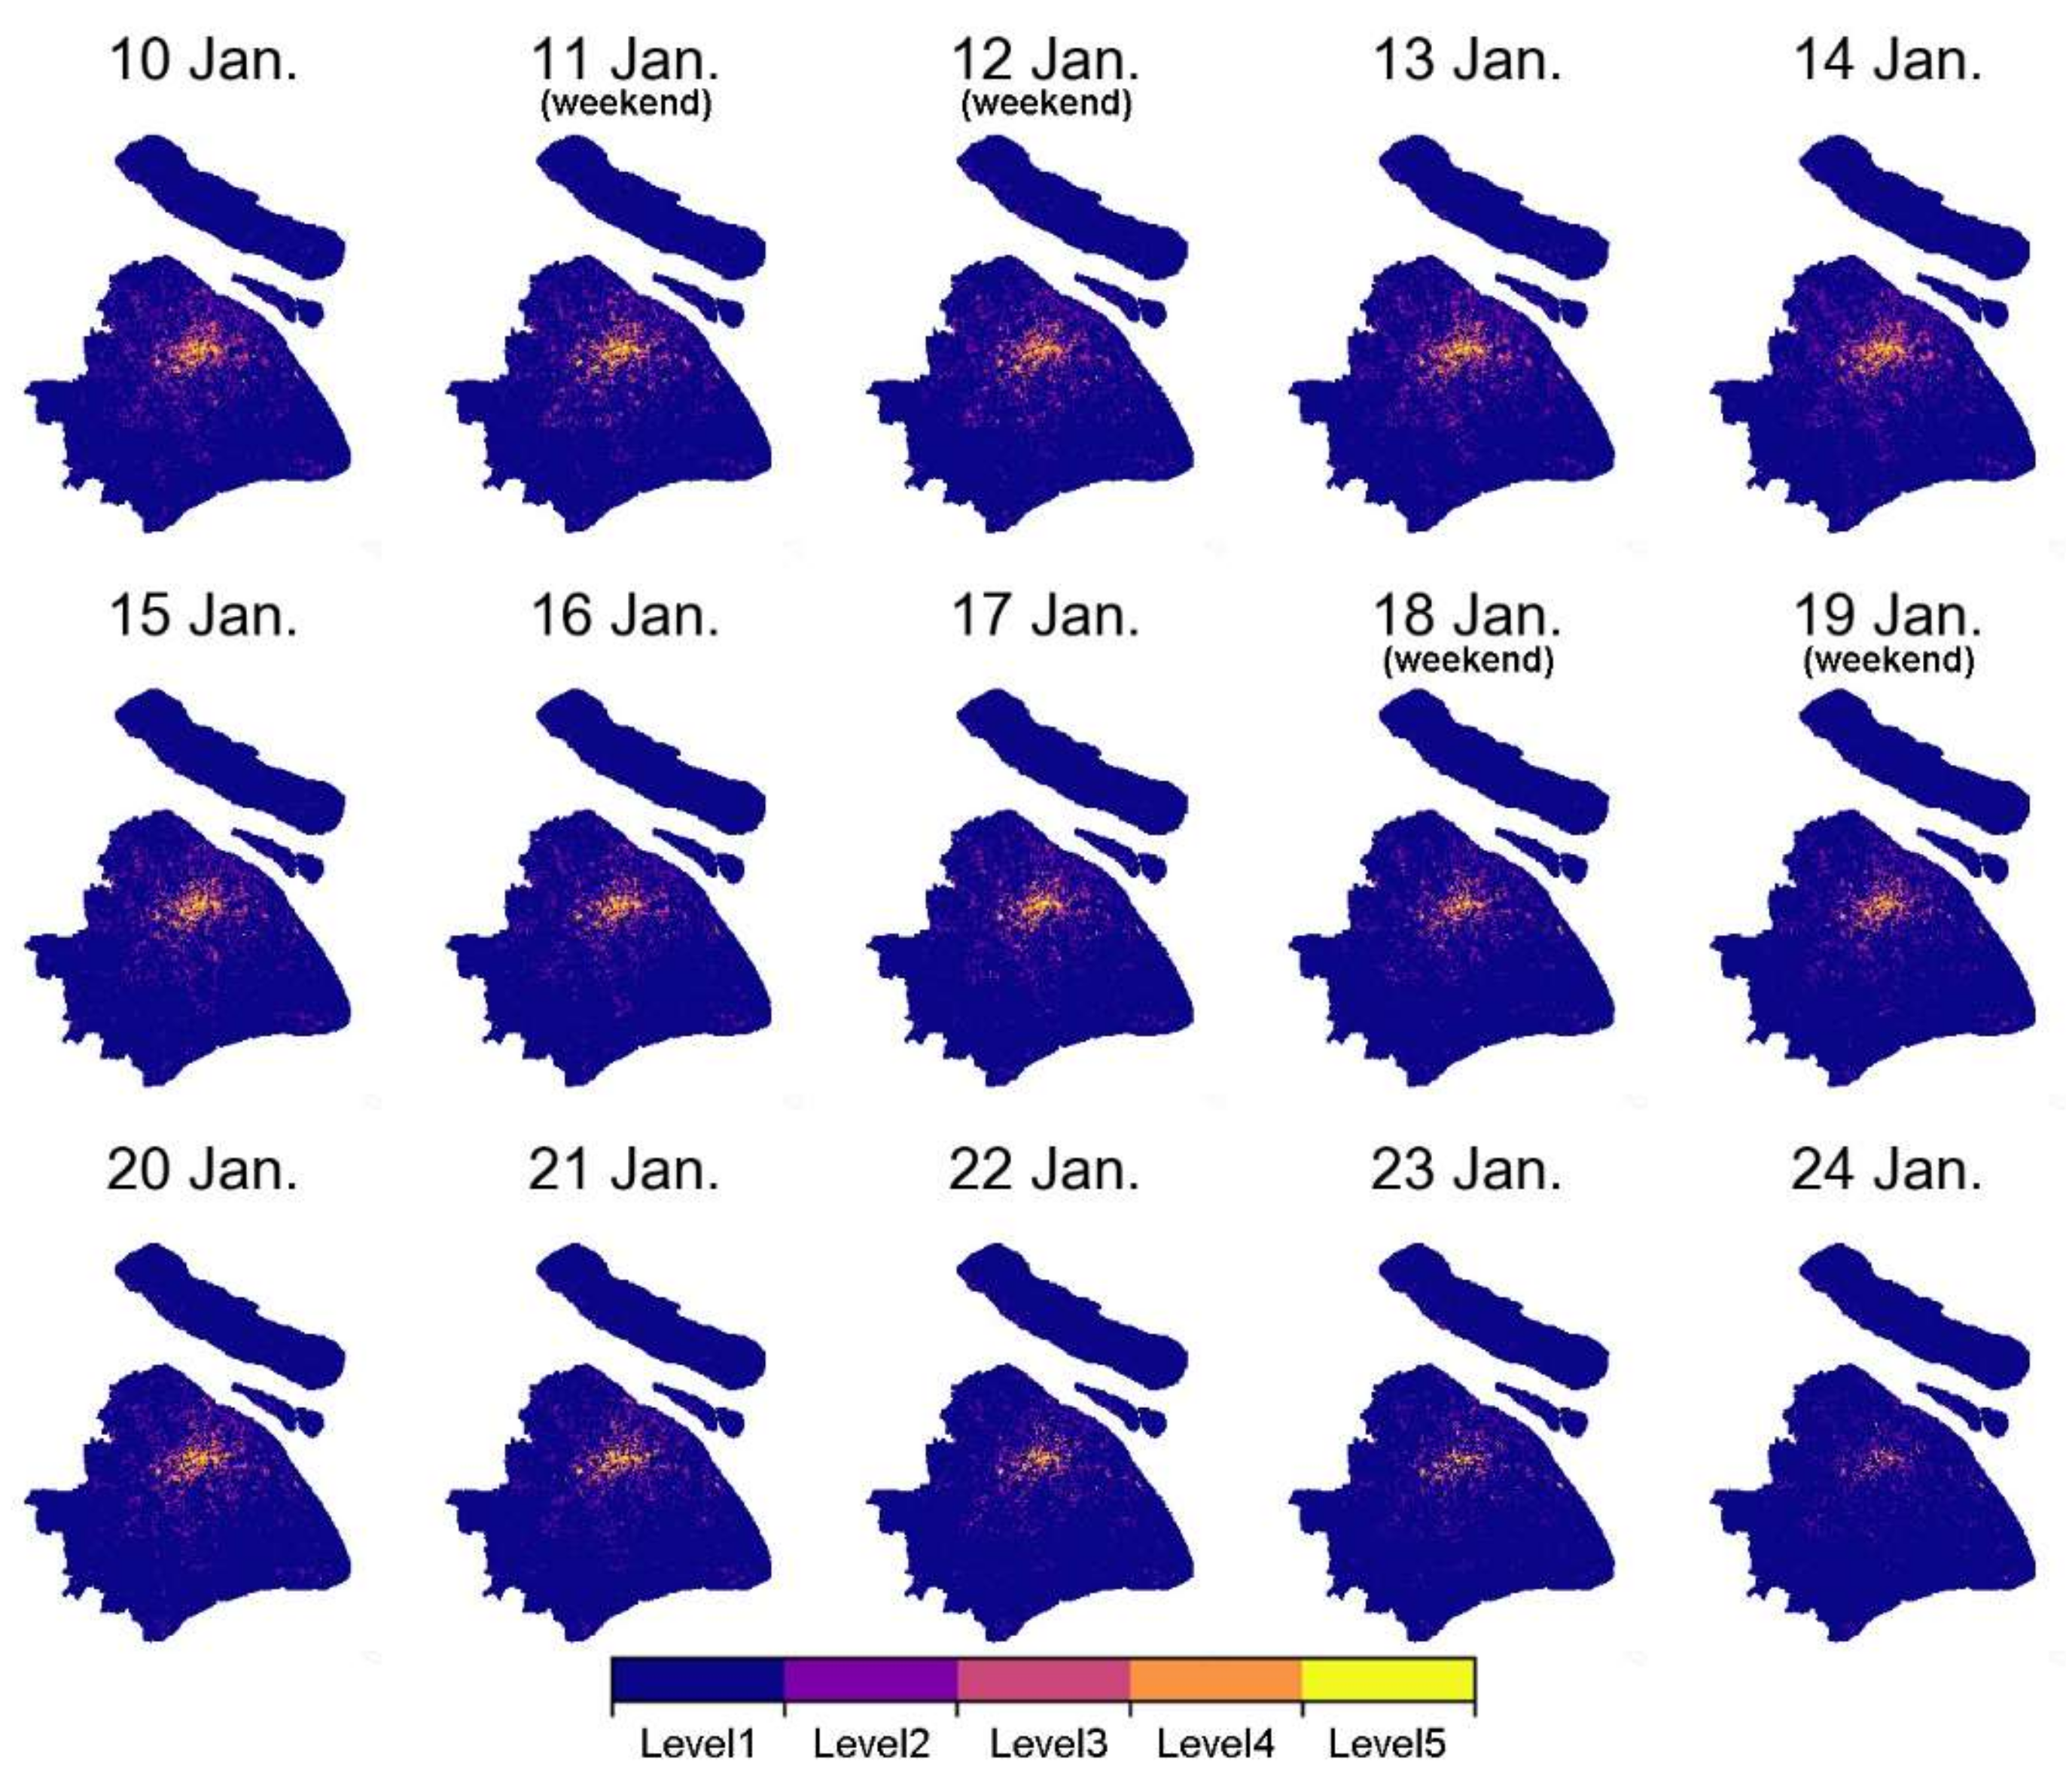
The daily internode transmission risk was assessed using the proposed evaluation method. For better visualization, the grids were classified into five levels using the Jenks natural breaks classification method. Figure 7 shows a noteworthy change in the spatial distribution of transmission risk. The number of high-risk transmission grids decreases significantly from 20 January to 24 January 24. On 24 January, only a small number of high-risk grids are distributed in the center of the city and in several transportation hubs. However, the number of high-risk groups during this period was significantly higher than before (Figure 5c). Because the transmission risk is related to the closeness centrality of the nodes, this reduction indicates that daily trips are decreasing, and thus, node mobility is declining. One possible reason is that the initial preventive measures and related news on the pandemic might have influenced individuals’ travel behavior.
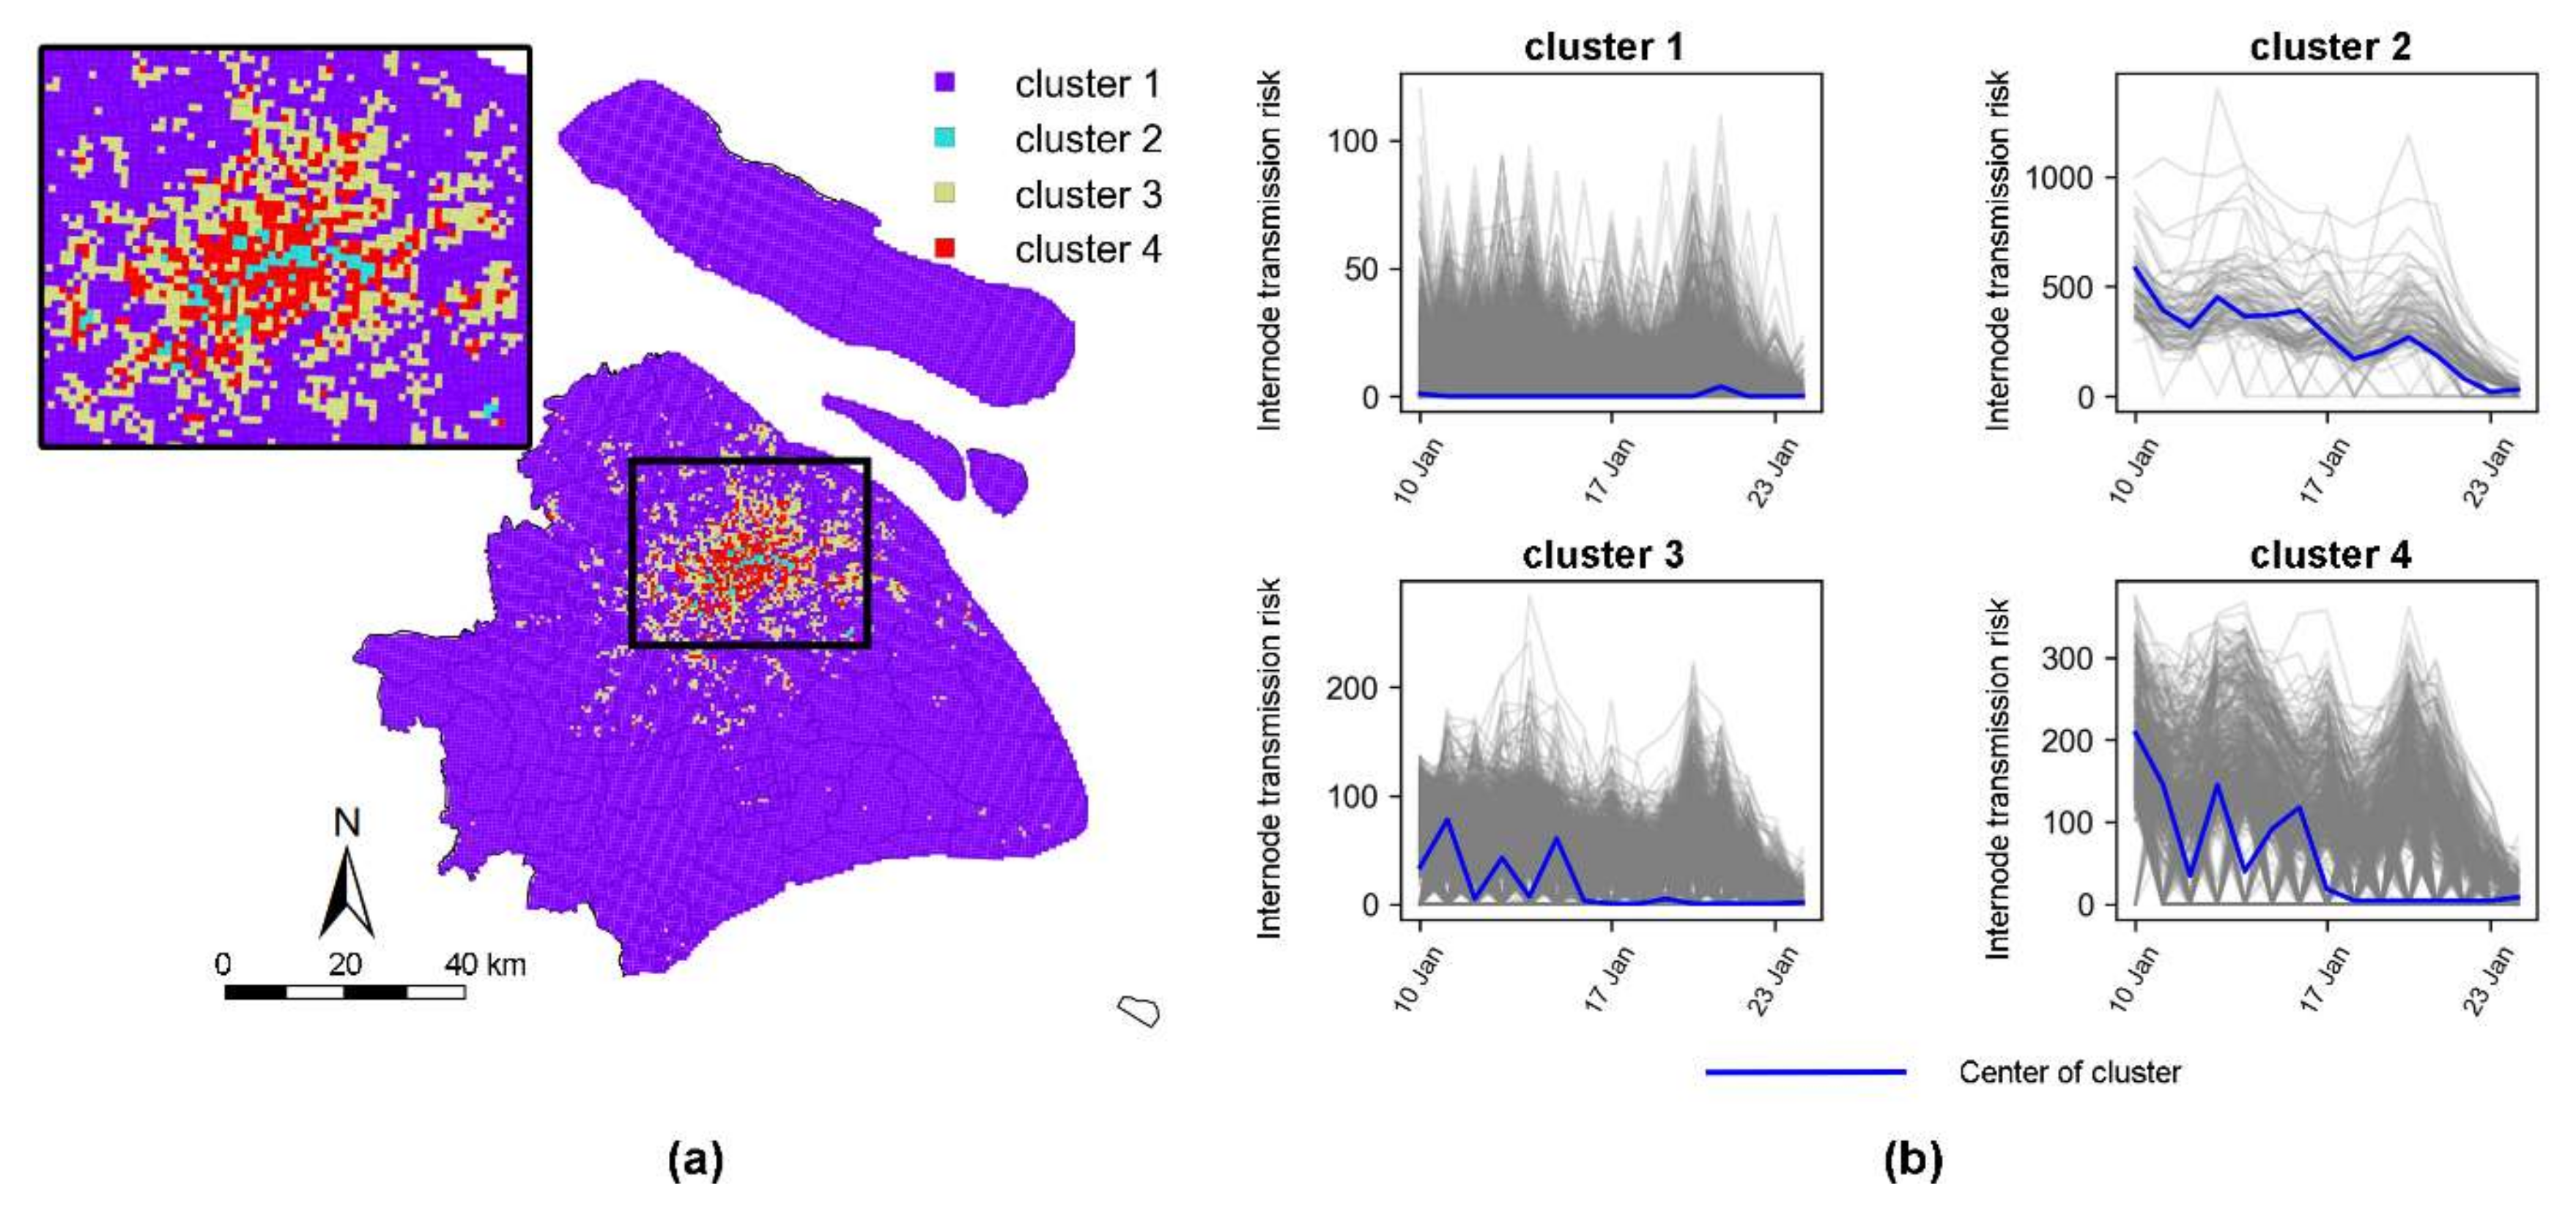
The time series clustering method was further used to analyze the change in transmission risk. Four types of time series are shown in Figure 8, which is the optimal clustering result. Specifically, cluster 2 has high transmission risk, and the risk is long duration. In contrast, in cluster 1, the transmission risk remains constantly low (close to zero). Clusters 3 and 4 are between high and low risk and fluctuate frequently and sharply. Although the temporal characteristics of the grids are different, the transmission risk mainly declines to the lowest point on 24 January, which is the same as our analysis above.
By comparing the spatial distribution of exposure and transmission risks, the following conclusions were drawn: (1) The characteristics of transmission risk are similar to exposure risk in that the number of high-risk grids on workdays is greater than that on weekends, and higher travel intensity due to commuting on workdays may be the main reason. (2) The comparison reveals that the transmission risk at railway stations (labeled in Figure 4) is more significant than the exposure risk. The massive intercity migration that takes place during the Spring Festival travel season enables more high-risk groups to transmit out from the transportation hub. (3) In addition to transportation hubs, Nanjing Road and Lujiazui (the light blue grids in the middle of Shanghai in Figure 8) are areas with high exposure and transmission risks. But these high-risk commercial areas are significantly larger than the transportation hubs.
4.6. Prevention and Control Measures
Most of the risk evaluation results were consistent with expectations, and suggest that high-risk areas should receive more attention. Therefore, the next major problem is how to reduce transmission within cities. In this section, we review the preventive measures that Shanghai put into practice. After the government launched its first-level emergency response, a series of travel strategies for the COVID-19 pandemic was put forward, which partially correspond to our evaluation results and suggested measures.
To reduce transmission risk, travelers who arrive in Shanghai are required to undergo a 14-day centralized quarantine or home quarantine. In addition, temperature checks are employed in railway stations and airports to identify and control people with a fever. In communities, residents are encouraged to stay home, and visitors are refused entry into residential areas. Cultural and tourist facilities and parks are closed in order to minimize the exposure risk. Sports matches and performances are also canceled. Moreover, a “health code” (a type of quick response code) is used to represent the health status and travel history of users with people being required to provide their “health code” when entering public places to avoid contact with potential high-risk groups.
4.7. Discussion
Although the focus of this study is different from that of [33,34], some of the results regarding the COVID-19 pandemic are similar, and our study supplements these existing studies. A previous study [34] indicates that there are heterogeneities in the spread of COVID-19 in regions, which should be considered in policy making. In the current study, we found that the high-risk region was aggregated and that both exposure and transmission risks were also spatially inhomogeneous. Therefore, a corresponding prevention strategy may need to take different regional spread characteristics and potential risks into account. As previously verified [33], mobility restrictions can slow down the spread of COVID-19; for example, locking down two high-risk regions may delay the peak of the epidemic by 4 weeks. Hence, human mobility is considered in our pandemic risk evaluation method. By combining [33] and our study, policy makers could develop the appropriate mobility restrictions and provide diverse transport management measures for different levels of mobility to prevent the spread of the pandemic.
5. Conclusions and Future Work
The COVID-19 pandemic highlights the resilience of cities in the face of an unprecedented global public health crisis. A more specific question that COVID-19 poses is how to establish a risk evaluation and prevention system that offers a quick response during the early stage of a pandemic. In this study, a framework has been proposed to evaluate intracity exposure and the transmission risk of contagious diseases using mobile phone data. Multi-day activity chains of mobile phone users were extracted to identify potential high-risk groups. Daily human mobility networks were constructed by calculating the dynamic population distribution and OD flow from a collective perspective. Based on the human mobility network, intranode exposure risk and internode transmission risk were presented in order to evaluate the comprehensive risk. To verify the practicality of the proposed evaluation method, Shanghai was used as a case study to assess risk during the early days of the COVID-19 pandemic.
The main contributions of this study are as follows:
- The proposed framework and methodology provide a detailed and useful tool to detect potential high-risk groups and capture the mobility pattern of high-risk groups from mobile phone data.
- Pandemic risk evaluation can quantify internal exposure risk and external transmission risk by considering both the activity and travel behaviors of different groups of people.
- The evaluation results are based on dynamic changes in the population and mobility data, which can reflect the changes in the spatiotemporal distribution of intracity pandemic risk and supports the development of preventive strategies.
In this study, the case of Shanghai was used to demonstrate our proposed method. However, the risk evaluation framework not only works with Shanghai but could also be applied to any larger city or megacity, such as Tokyo, Paris, and Los Angeles that has a dense population and high human mobility. Note that the availability and privacy of high-resolution mobility data may be a key issue when applying risk evaluation in other cities or metropolitan agglomerations. Moreover, in this study, map visualization was used to present the spatial distribution of the risk evaluation results. In the future, animated and interactive 3D visualizations based on virtual reality (VR) techniques and systems could be used in practical applications, as they provide highly realistic and immersive experiences that facilitate public perception and reduce the risk of infection [44,45].
In future studies, this work could be broadened and deepened in several directions. First, we plan to use mobile phone data to construct a dynamic mobility and contact network from an individual perspective. Additionally, modeling the transmission of infectious disease between individuals is a potential research direction if information on infected patients is available. Finally, we could attempt to identify susceptible individuals who were probably in close contact with infected individuals based on activity chains and evaluate the individual risk.
Author Contributions
Conceptualization, Weifeng Li and Jian Li; Data curation, Weifeng Li and Jian Li; Investigation, Tian Gan and Linghui He; Methodology, Tian Gan, Weifeng Li and Jian Li; Project administration, Jian Li; Supervision, Jian Li; Writing—original draft, Tian Gan; Writing—review and editing, Weifeng Li, Linghui He and Jian Li. All authors have read and agreed to the published version of the manuscript.
Funding
This research is supported by the National Key R&D Program of China under Grant No. 2018YFB1601100 and National Natural Science of China under Grant No.71601145.
Acknowledgments
The authors want to thank the anonymous reviewers and the editors for their helpful comments and suggestions. The authors would like to thank Junxian Lu and Zhen Huang of Smart Steps Digital Technology Co., Ltd. for processing the mobile phone data.
Conflicts of Interest
The authors declare no conflict of interest.
References
- Moraci, F.; Errigo, M.F.; Fazia, C.; Campisi, T.; Castelli, F. Cities under Pressure: Strategies and Tools to Face Climate Change and Pandemic. Sustainability 2020, 12, 7743. [Google Scholar] [CrossRef]
- Jiang, P.; Fu, X.; Van Fan, Y.; Klemeš, J.J.; Chen, P.; Ma, S.; Zhang, W. Spatial-temporal potential exposure risk analytics and urban sustainability impacts related to COVID-19 mitigation: A perspective from car mobility behaviour. J. Clean. Prod. 2020, 279, 123673. [Google Scholar] [CrossRef] [PubMed]
- Zhu, N.; Zhang, D.; Wang, W.; Li, X.; Yang, B.; Song, J.; Zhao, X.; Huang, B.; Shi, W.; Lu, R.; et al. A novel coronavirus from patients with pneumonia in China, 2019. N. Engl. J. Med. 2020, 382, 727–733. [Google Scholar] [CrossRef] [PubMed]
- Wang, C.; Horby, P.W.; Hayden, F.G.; Gao, G.F. A novel coronavirus outbreak of global health concern. Lancet 2020, 395, 470–473. [Google Scholar] [CrossRef] [Green Version]
- Boldog, P.; Tekeli, T.; Vizi, Z.; Dénes, A.; Bartha, F.A.; Röst, G. Risk assessment of novel coronavirus COVID-19 outbreaks outside China. J. Clin. Med. 2020, 9, 571. [Google Scholar] [CrossRef] [PubMed] [Green Version]
- Tomar, A.; Gupta, N. Prediction for the spread of COVID-19 in India and effectiveness of preventive measures. Sci. Total Environ. 2020, 728, 138762. [Google Scholar] [CrossRef] [PubMed]
- Yang, Z.; Zeng, Z.; Wang, K.; Wong, S.-S.; Liang, W.; Zanin, M.; Liu, P.; Cao, X.; Gao, Z.; Mai, Z.; et al. Modified SEIR and AI prediction of the epidemics trend of COVID-19 in China under public health interventions. J. Thorac. Dis. 2020, 12, 165. [Google Scholar] [CrossRef]
- Arora, P.; Kumar, H.; Panigrahi, B.K. Prediction and analysis of COVID-19 positive cases using deep learning models: A descriptive case study of India. Chaos Solitons Fractals 2020, 139, 110017. [Google Scholar] [CrossRef]
- Fan, C.; Liu, L.; Guo, W.; Yang, A.; Ye, C.; Jilili, M.; Ren, M.; Xu, P.; Long, H.; Wang, Y. Prediction of epidemic spread of the 2019 novel coronavirus driven by Spring Festival transportation in China: A population-based study. Int. J. Environ. Res. Public Health 2020, 17, 1679. [Google Scholar] [CrossRef] [Green Version]
- Stavrinos, D.; McManus, B.; Mrug, S.; He, H.; Gresham, B.; Albright, M.G.; Svancara, A.M.; Whittington, C.; Underhill, A.; White, D.M. Adolescent driving behavior before and during restrictions related to COVID-19. Accid. Anal. Prev. 2020, 144, 105686. [Google Scholar] [CrossRef]
- Nikiforiadis, A.; Ayfantopoulou, G.; Stamelou, A. Assessing the Impact of COVID-19 on Bike-Sharing Usage: The Case of Thessaloniki, Greece. Sustainability 2020, 12, 8215. [Google Scholar] [CrossRef]
- Nian, G.; Peng, B.; Sun, D.J.; Ma, W.; Peng, B.; Huang, T. Impact of COVID-19 on Urban Mobility during Post-Epidemic Period in Megacities: From the Perspectives of Taxi Travel and Social Vitality. Sustainability 2020, 12, 7954. [Google Scholar] [CrossRef]
- Kang, D.; Choi, H.; Kim, J.-H.; Choi, J. Spatial epidemic dynamics of the COVID-19 outbreak in China. Int. J. Infect. Dis. 2020, 94, 96–102. [Google Scholar] [CrossRef] [PubMed]
- Gupta, A.; Pradhan, B.; Maulud, K.N.A. Estimating the Impact of Daily Weather on the Temporal Pattern of COVID-19 Outbreak in India. Earth Syst. Environ. 2020, 1–12. [Google Scholar] [CrossRef]
- Mollalo, A.; Vahedi, B.; Rivera, K.M. GIS-based spatial modeling of COVID-19 incidence rate in the continental United States. Sci. Total Environ. 2020, 728, 138884. [Google Scholar] [CrossRef] [PubMed]
- Liu, Y.; He, Z.; Zhou, X. Space-Time Variation and Spatial Differentiation of COVID-19 Confirmed Cases in Hubei Province Based on Extended GWR. ISPRS Int. J. Geo-Inf. 2020, 9, 536. [Google Scholar] [CrossRef]
- Thakar, V. Unfolding Events in Space and Time: Geospatial Insights into COVID-19 Diffusion in Washington State during the Initial Stage of the Outbreak. ISPRS Int. J. Geo-Inf. 2020, 9, 382. [Google Scholar] [CrossRef]
- Peng, Z.; Wang, R.; Liu, L.; Wu, H. Exploring urban spatial features of COVID-19 transmission in Wuhan based on social media data. ISPRS Int. J. Geo-Inf. 2020, 9, 402. [Google Scholar] [CrossRef]
- Gilbert, M.; Pullano, G.; Pinotti, F.; Valdano, E.; Poletto, C.; Boëlle, P.-Y.; d’Ortenzio, E.; Yazdanpanah, Y.; Eholie, S.P.; Altmann, M.; et al. Preparedness and vulnerability of African countries against importations of COVID-19: A modelling study. Lancet 2020, 395, 871–877. [Google Scholar] [CrossRef] [Green Version]
- Pourghasemi, H.R.; Pouyan, S.; Heidari, B.; Farajzadeh, Z.; Shamsi, S.R.F.; Babaei, S.; Khosravi, R.; Etemadi, M.; Ghanbarian, G.; Farhadi, A.; et al. Spatial modeling, risk mapping, change detection, and outbreak trend analysis of coronavirus (COVID-19) in Iran (days between February 19 and June 14, 2020). Int. J. Infect. Dis. 2020, 98, 90–108. [Google Scholar] [CrossRef]
- Liu, J.; Zhou, J.; Yao, J.; Zhang, X.; Li, L.; Xu, X.; He, X.; Wang, B.; Fu, S.; Niu, T.; et al. Impact of meteorological factors on the COVID-19 transmission: A multi-city study in China. Sci. Total Environ. 2020, 726, 138513. [Google Scholar] [CrossRef] [PubMed]
- Zhuang, Z.; Zhao, S.; Lin, Q.; Cao, P.; Lou, Y.; Yang, L.; He, D. Preliminary estimation of the novel coronavirus disease (COVID-19) cases in Iran: A modelling analysis based on overseas cases and air travel data. Int. J. Infect. Dis. 2020, 94, 29–31. [Google Scholar] [CrossRef] [PubMed]
- Cartenì, A.; Di Francesco, L.; Martino, M. How mobility habits influenced the spread of the COVID-19 pandemic: Results from the Italian case study. Sci. Total Environ. 2020, 741, 140489. [Google Scholar] [CrossRef] [PubMed]
- Li, J.; Ozbay, K. Hurricane Irene evacuation traffic patterns in New Jersey. Nat. Hazards Rev. 2015, 16, 05014006. [Google Scholar] [CrossRef]
- Li, J.; Ozbay, K.; Bartin, B. Effects of Hurricanes Irene and Sandy in New Jersey: Traffic patterns and highway disruptions during evacuations. Nat. Hazards 2015, 78, 2081–2107. [Google Scholar] [CrossRef]
- Kumar, D.; Ukkusuri, S.V. Enhancing demographic coverage of hurricane evacuation behavior modeling using social media. J. Comput. Sci. 2020, 45, 101184. [Google Scholar] [CrossRef]
- Yang, Y.; Mao, L.; Metcalf, S.S. Diffusion of hurricane evacuation behavior through a home-workplace social network: A spatially explicit agent-based simulation model. Comput. Environ. Urban Syst. 2019, 74, 13–22. [Google Scholar] [CrossRef]
- Martín, Y.; Li, Z.; Cutter, S.L. Leveraging Twitter to gauge evacuation compliance: Spatiotemporal analysis of Hurricane Matthew. PLoS ONE 2017, 12, e0181701. [Google Scholar] [CrossRef] [Green Version]
- Huang, C.-Y.; Wen, T.-H.; Fu, Y.-H.; Tsai, Y.-S. Epirank: Modeling bidirectional disease spread in asymmetric commuting networks. Sci. Rep. 2019, 9, 5415. [Google Scholar] [CrossRef] [Green Version]
- Brockmann, D.; Helbing, D. The hidden geometry of complex, network-driven contagion phenomena. Science 2013, 342, 1337–1342. [Google Scholar] [CrossRef] [Green Version]
- Wesolowski, A.; Qureshi, T.; Boni, M.F.; Sundsøy, P.R.; Johansson, M.A.; Rasheed, S.B.; Engø-Monsen, K.; Buckee, C.O. Impact of human mobility on the emergence of dengue epidemics in Pakistan. Proc. Natl. Acad. Sci. USA 2015, 112, 11887–11892. [Google Scholar] [CrossRef] [PubMed] [Green Version]
- Charu, V.; Zeger, S.; Gog, J.; Bjørnstad, O.N.; Kissler, S.; Simonsen, L.; Grenfell, B.T.; Viboud, C. Human mobility and the spatial transmission of influenza in the United States. PLoS Comput. Biol. 2017, 13, e1005382. [Google Scholar] [CrossRef] [PubMed] [Green Version]
- Zhou, Y.; Xu, R.; Hu, D.; Yue, Y.; Li, Q.; Xia, J. Effects of human mobility restrictions on the spread of COVID-19 in Shenzhen, China: A modelling study using mobile phone data. Lancet Digit. Health 2020, 2, e417–e424. [Google Scholar] [CrossRef]
- Hou, X.; Gao, S.; Li, Q.; Kang, Y.; Chen, N.; Chen, K.; Rao, J.; Ellenberg, J.S.; Patz, J.A. Intra-county modeling of COVID-19 infection with human mobility: Assessing spatial heterogeneity with business traffic, age and race. medRxiv 2020. [Google Scholar] [CrossRef]
- Huang, H.; Cheng, Y.; Weibel, R. Transport mode detection based on mobile phone network data: A systematic review. Transp. Res. Part C Emerg. Technol. 2019, 101, 297–312. [Google Scholar] [CrossRef]
- Yu, Q.; Li, W.; Zhang, H.; Yang, D. Mobile Phone Data in Urban Customized Bus: A Network-Based Hierarchical Location Selection Method with an Application to System Layout Design in the Urban Agglomeration. Sustainability 2020, 12, 6203. [Google Scholar] [CrossRef]
- Mossong, J.; Hens, N.; Jit, M.; Beutels, P.; Auranen, K.; Mikolajczyk, R.; Massari, M.; Salmaso, S.; Tomba, G.S.; Wallinga, J.; et al. Social contacts and mixing patterns relevant to the spread of infectious diseases. PLoS Med. 2008, 5, e74. [Google Scholar] [CrossRef]
- Li, W. Analysis on Individuals’ Activity Space Based on Mobile Phone Data; Tongji University: Shanghai, China, 2018. (In Chinese) [Google Scholar]
- Satopaa, V.; Albrecht, J.; Irwin, D.; Raghavan, B. Finding a “kneedle” in a haystack: Detecting knee points in system behavior. In Proceedings of the 2011 31st International Conference on Distributed Computing Systems Workshops, Minneapolis, MN, USA, 20–24 June 2011; pp. 166–171. [Google Scholar]
- Freeman, L.C. Centrality in social networks conceptual clarification. Soc. Netw. 1978, 1, 215–239. [Google Scholar] [CrossRef] [Green Version]
- Sakoe, H.; Chiba, S. Dynamic programming algorithm optimization for spoken word recognition. IEEE Trans. Acoust. Speech Signal Process. 1978, 26, 43–49. [Google Scholar] [CrossRef] [Green Version]
- Petitjean, F.; Ketterlin, A.; Gançarski, P. A global averaging method for dynamic time warping, with applications to clustering. Pattern Recognit. 2011, 44, 678–693. [Google Scholar] [CrossRef]
- Tavenard, R.; Faouzi, J.; Vandewiele, G.; Divo, F.; Androz, G.; Holtz, C.; Payne, M.; Yurchak, R.; Rußwurm, M.; Kolar, K.; et al. Tslearn, A Machine Learning Toolkit for Time Series Data. J. Mach. Learn. Res. 2020, 21, 1–6. [Google Scholar]
- Ma, Y.; Wright, J.; Gopal, S.; Phillips, N. Seeing the invisible: From imagined to virtual urban landscapes. Cities 2020, 98, 102559. [Google Scholar] [CrossRef]
- Edler, D.; Keil, J.; Wiedenlübbert, T.; Sossna, M.; Kühne, O.; Dickmann, F. Immersive VR experience of redeveloped post-industrial sites: The example of “Zeche Holland” in Bochum-Wattenscheid. KN-J. Cartogr. Geogr. Inf. 2019, 69, 267–284. [Google Scholar] [CrossRef] [Green Version]
Figure 1.
Framework of the methodology.

Figure 2.
Overview of the four aggregation patterns of people.

Figure 3.
Preventive measures against pandemics in the early stage.

Figure 4.
Study area.

Figure 5.
Timeline (a), trends in COVID-19 cases (b) and changes in the population (c) of the period from10 January to 29 February 2020.
Figure 5.
Timeline (a), trends in COVID-19 cases (b) and changes in the population (c) of the period from10 January to 29 February 2020.

Figure 6.
Spatial distribution and scatter plots of clustering results for intranode exposure risk on weekends (a) and workdays (b).
Figure 6.
Spatial distribution and scatter plots of clustering results for intranode exposure risk on weekends (a) and workdays (b).

Figure 7.
Spatial distribution of internode transmission risk from 10 January 2020, to 24 January 2020.
Figure 7.
Spatial distribution of internode transmission risk from 10 January 2020, to 24 January 2020.

Figure 8.
Spatial distribution of internode transmission risk (a) and the corresponding time series (b).
Figure 8.
Spatial distribution of internode transmission risk (a) and the corresponding time series (b).

Publisher’s Note: MDPI stays neutral with regard to jurisdictional claims in published maps and institutional affiliations. |
© 2020 by the authors. Licensee MDPI, Basel, Switzerland. This article is an open access article distributed under the terms and conditions of the Creative Commons Attribution (CC BY) license (http://creativecommons.org/licenses/by/4.0/).
Share and Cite
MDPI and ACS Style
Gan, T.; Li, W.; He, L.; Li, J. Intracity Pandemic Risk Evaluation Using Mobile Phone Data: The Case of Shanghai during COVID-19. ISPRS Int. J. Geo-Inf. 2020, 9, 715. https://0-doi-org.brum.beds.ac.uk/10.3390/ijgi9120715
AMA Style
Gan T, Li W, He L, Li J. Intracity Pandemic Risk Evaluation Using Mobile Phone Data: The Case of Shanghai during COVID-19. ISPRS International Journal of Geo-Information. 2020; 9(12):715. https://0-doi-org.brum.beds.ac.uk/10.3390/ijgi9120715
Chicago/Turabian StyleGan, Tian, Weifeng Li, Linghui He, and Jian Li. 2020. "Intracity Pandemic Risk Evaluation Using Mobile Phone Data: The Case of Shanghai during COVID-19" ISPRS International Journal of Geo-Information 9, no. 12: 715. https://0-doi-org.brum.beds.ac.uk/10.3390/ijgi9120715
Note that from the first issue of 2016, this journal uses article numbers instead of page numbers. See further details here.