Article

A Study of User Activity Patterns and the Effect of Venue Types on City Dynamics Using Location-Based Social Network Data

1
School of Communication & Information Engineering, Shanghai University, Shanghai 200444, China
2
Institute of Smart City, Shanghai University, Shanghai 200444, China
3
School of Computer Science, University of Technology Sydney, Sydney, NSW 2007, Australia
4
School of Computer Science and Technology, Huazhong University of Science and Technology, Wuhan 430074, China
5
School of Information Engineering, Huangshan University, Huangshan 245041, China
*
Author to whom correspondence should be addressed.
ISPRS Int. J. Geo-Inf. 2020, 9(12), 733; https://0-doi-org.brum.beds.ac.uk/10.3390/ijgi9120733
Submission received: 28 September 2020 / Revised: 17 November 2020 / Accepted: 18 November 2020 / Published: 7 December 2020
(This article belongs to the Special Issue Geodata Science and Spatial Analysis in Urban Studies)

Abstract

:
The main purpose of this research is to study the effect of various types of venues on the density distribution of residents and model check-in data from a Location-Based Social Network for the city of Shanghai, China by using combination of multiple temporal, spatial and visualization techniques by classifying users’ check-ins into different venue categories. This article investigates the use of Weibo for big data analysis and its efficiency in various categories instead of manually collected datasets, by exploring the relation between time, frequency, place and category of check-in based on location characteristics and their contributions. The data used in this research was acquired from a famous Chinese microblogs called Weibo, which was preprocessed to get the most significant and relevant attributes for the current study and transformed into Geographical Information Systems format, analyzed and, finally, presented with the help of graphs, tables and heat maps. The Kernel Density Estimation was used for spatial analysis. The venue categorization was based on nature of the physical locations within the city by comparing the name of venue extracted from Weibo dataset with the function such as education for schools or shopping for malls and so on. The results of usage patterns from hours to days, venue categories and frequency distribution into these categories as well as the density of check-in within the Shanghai and contribution of each venue category in its diversity are thoroughly demonstrated, uncovering interesting spatio-temporal patterns including frequency and density of users from different venues at different time intervals, and significance of using geo-data from Weibo to study human behavior in variety of studies like education, tourism and city dynamics based on location-based social networks. Our findings uncover various aspects of activity patterns in human behavior, the significance of venue classes and its effects in Shanghai, which can be applied in pattern analysis, recommendation systems and other interactive applications for these classes.
Keywords:
big data; GIS; KDE; LBSN; Weibo

Graphical Abstract

1. Introduction

Mining Location-Based Social Network’s (LBSN) data for useful patterns and insight has become an important and interesting topic among researchers in the recent decades. Because of the huge number of applications based on LBSNs nowadays, an enormous amount of data is generated that is analyzed for extracting valuable information particularly from a practical point-of-view e.g., in areas including public transit flows, rout planning and disaster management [1]. The online features of these applications encourage users to add and share their interests, activities, pictures, videos, etc. with their friends within the network resulting in massive amount of data that enables scholars to identify user activities and preferences more acurately through analysis. The online services provide and store user information along with their real-time locations and the collected data is generally enriched with metadata, text, multimedia and geo-locations that can be applied to perform further research regarding several characteristics of human behavior. The datasets used in previous studies are either based on manually collected datasets for population in different categories such as tourism or using LBSNs data for the general population with no specific application areas. The rich contents of the LBSNs data can prove to be an efficient data source for analysis of human behavior in multiple categories like education, tourism, restaurants and traveling, if categorized properly. Therefore, in this research we address the research gap of using LBSN data in multiple categories by demonstrating the distribution and contribution of the data into ten different categories.
Various studies have been conducted for analyzing and modeling human activities from geo-data. Most of the recent research to find the relationship and obtain patterns among users such as female and male, educated or less educated classes and age groups utilize check-in data collected from internationally renowned LBSNs like Facebook, Twitter and Foursquare [2,3,4,5]. Despite the exponential growth of Facebook, Twitter, etc. worldwide, most of these LBSNs are blocked or have limited use in China, therefore Chinese citizens tend to use national microblogs, i.e., Weibo (Sina Weibo) [6] and hence, check-in data from Weibo may be suitable for LBSNs data analysis here in China. These patterns include activity behavior, mobility and density, and also reproduce functional attributes in the city as well as between different cities [7,8]. The word “Check-in” represents a user confirming her/his location using an LBSN application by performing in an activity or sharing location with somebody in a message [9,10]. Weibo stands famous not only in users, but also in researchers as they carryout numerous types of studies for extracting valuable information from its geo-data e.g., some recent studies are the analysis of road crashes in Shanghai [11], analysis of tourism hotspot’s attraction features [12], investigating growth of urban boundaries of Beijing [13] and spatio-temporal analysis by gender [14]. These studies are mostly based on check-in data analysis for particular users or specified application areas like tourism, road crashes, estimating urban boundaries, spring-festival rush or gender [15]. In order to gain more insights, there is a need to relate these spatio-temporal patterns to the nature of venues from where the users check-in, and to the extent of our understanding, it has not been discussed previously by other researchers. Therefore, we focused on three different aspects of analysis on the Weibo’s check-in data for the period of one year i.e., 1 July 2016 to 30 June 2017 from Shanghai city for uncovering spatio-temporal patterns with venue classification and density estimation. So, the current study presents three key aspects of the analysis as our contribution to the existing knowledge in this area of research.
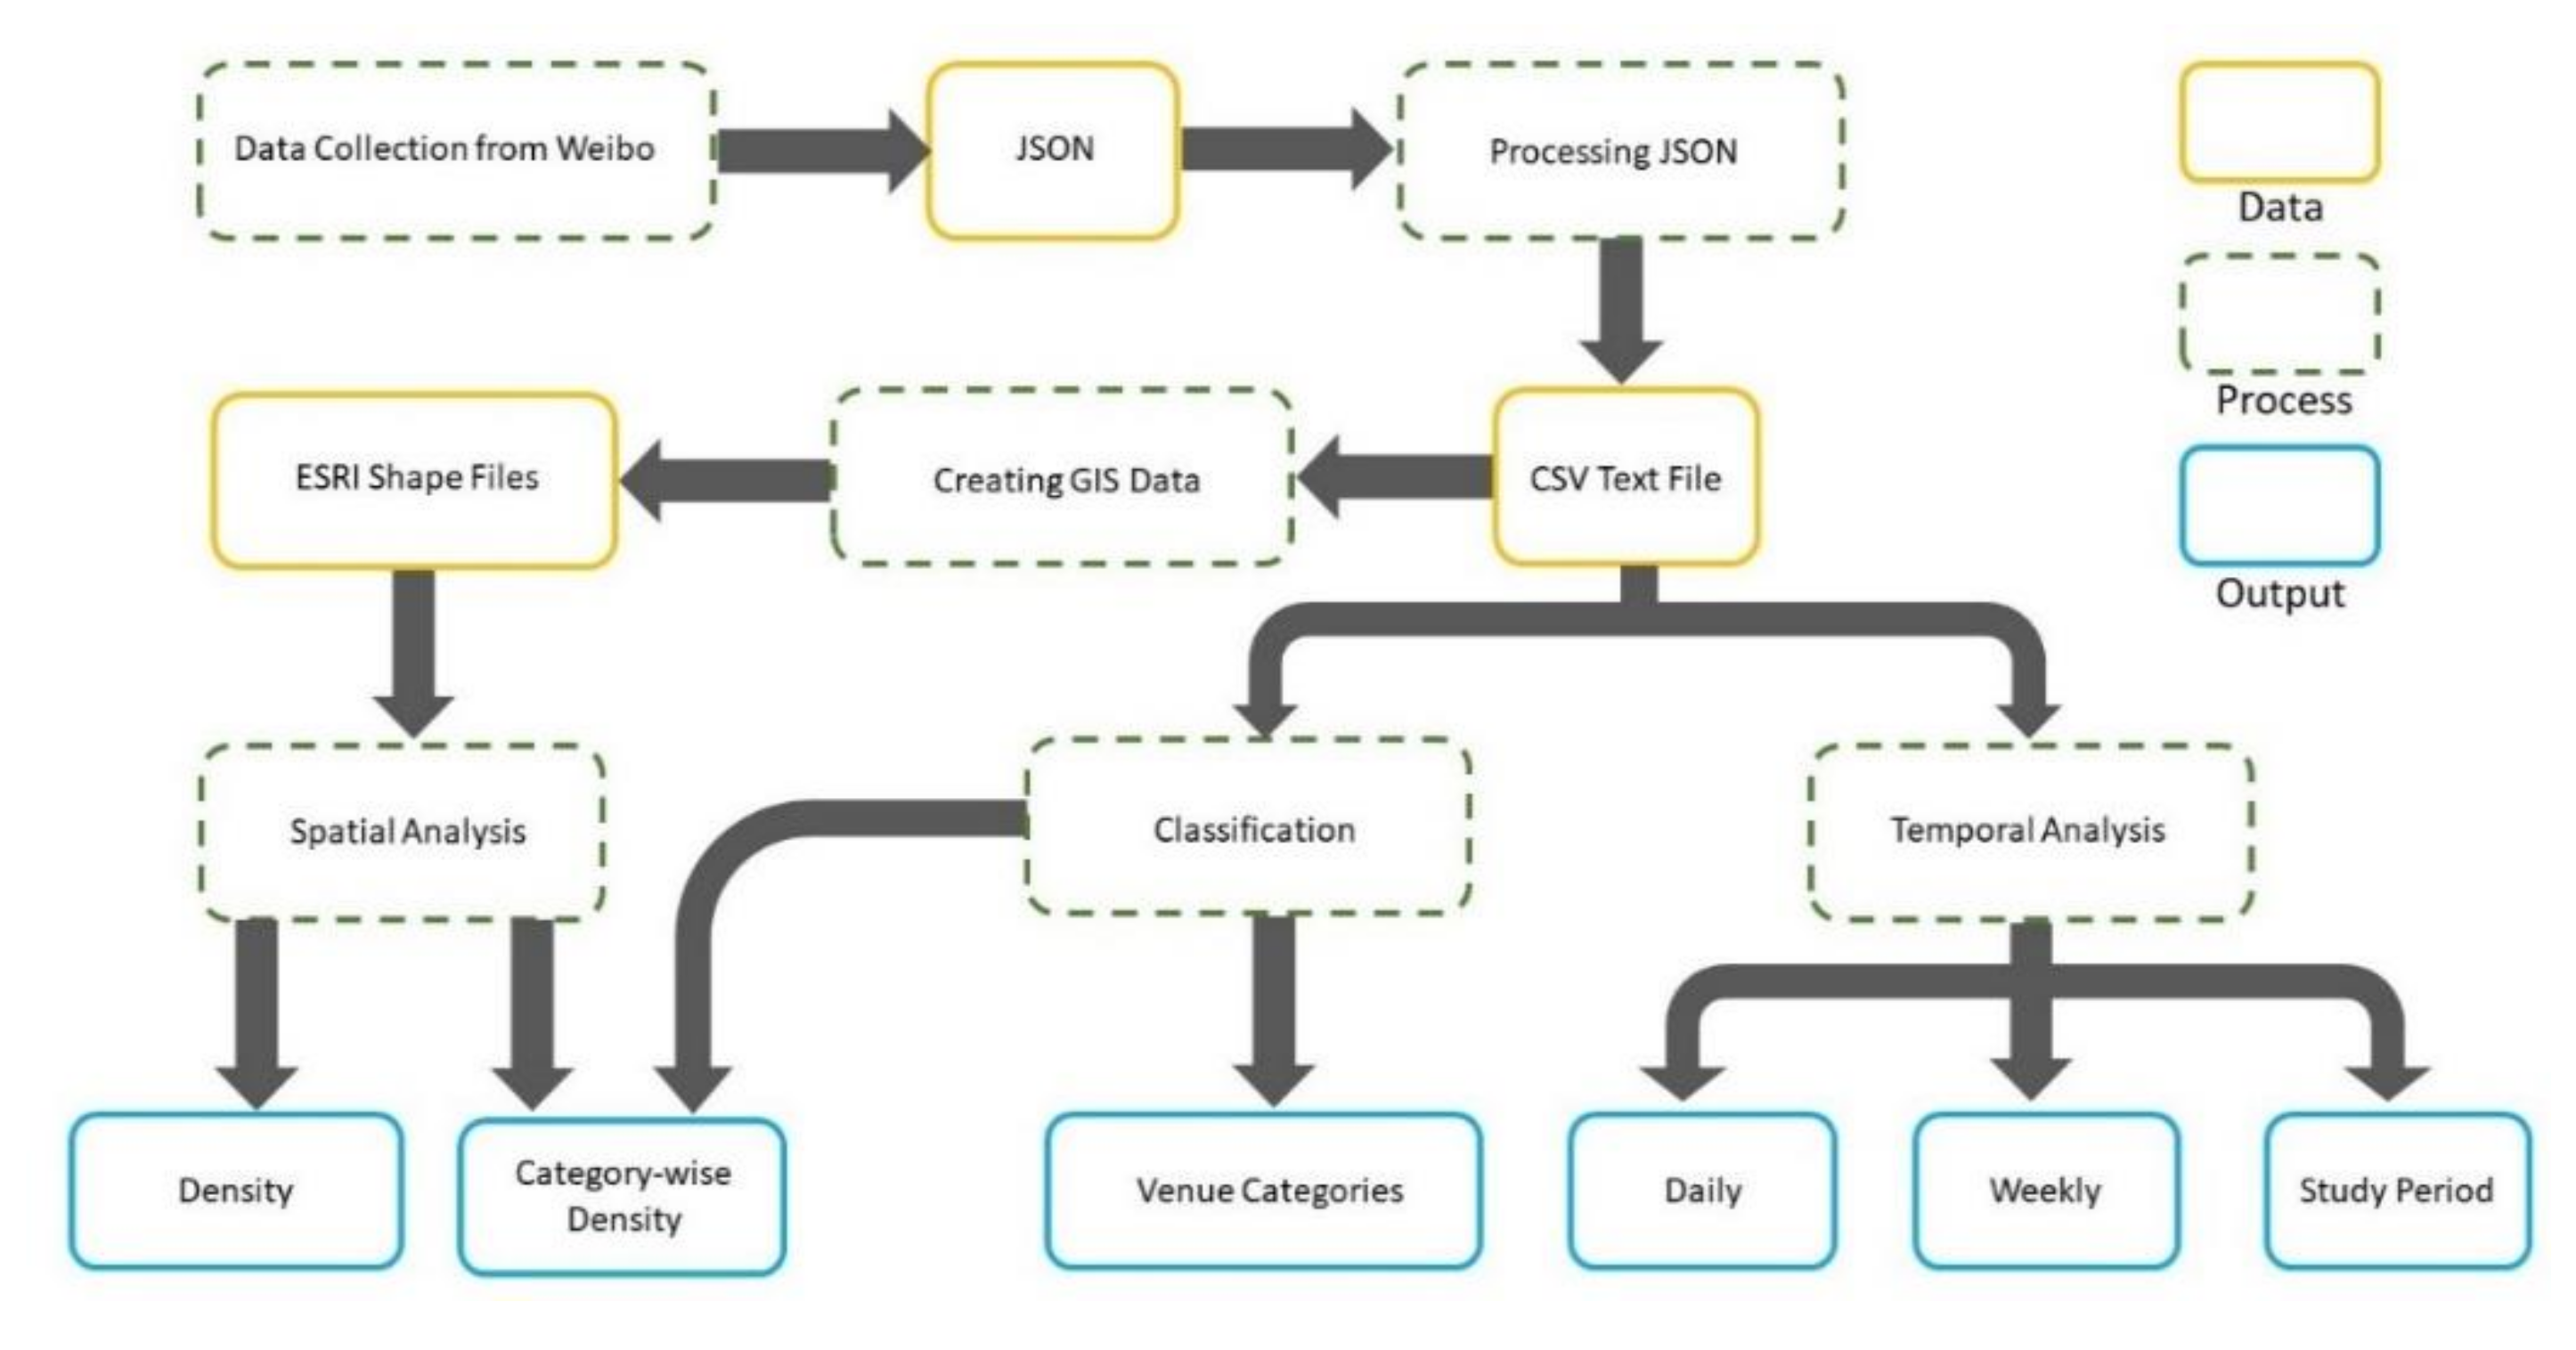
  • Hourly, weekly and daily based (the study period of total 365 days) temporal [16].
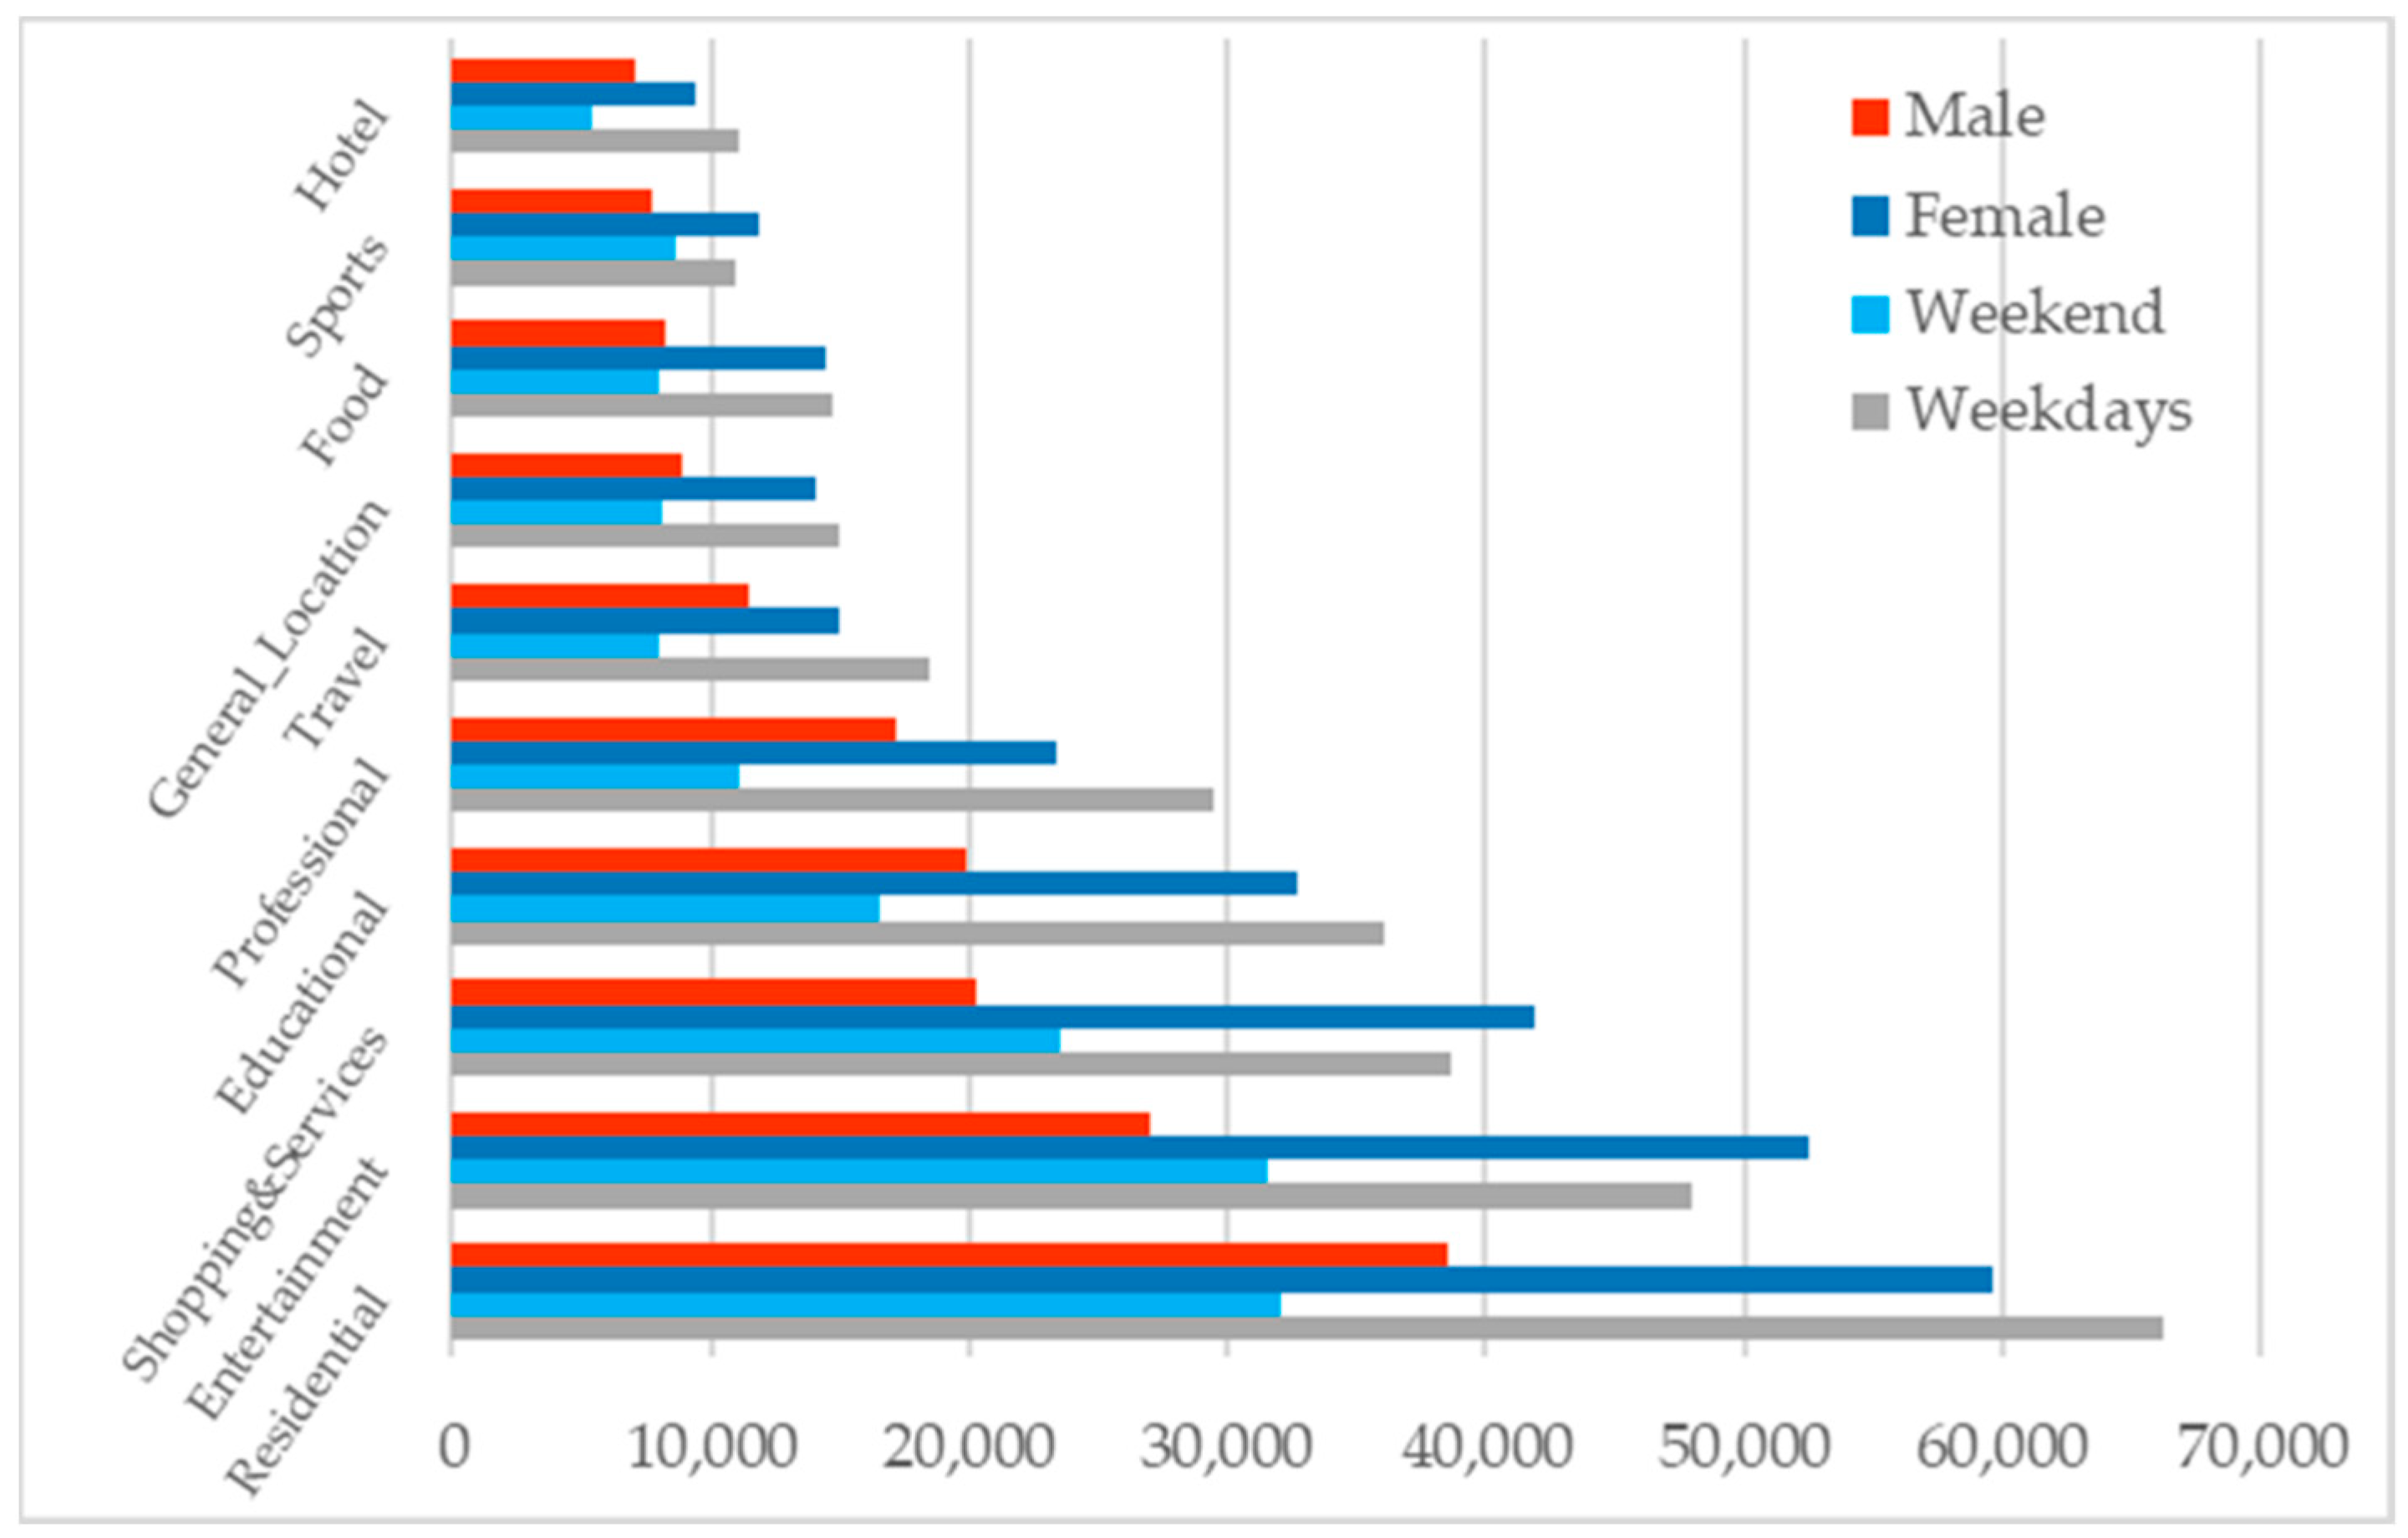
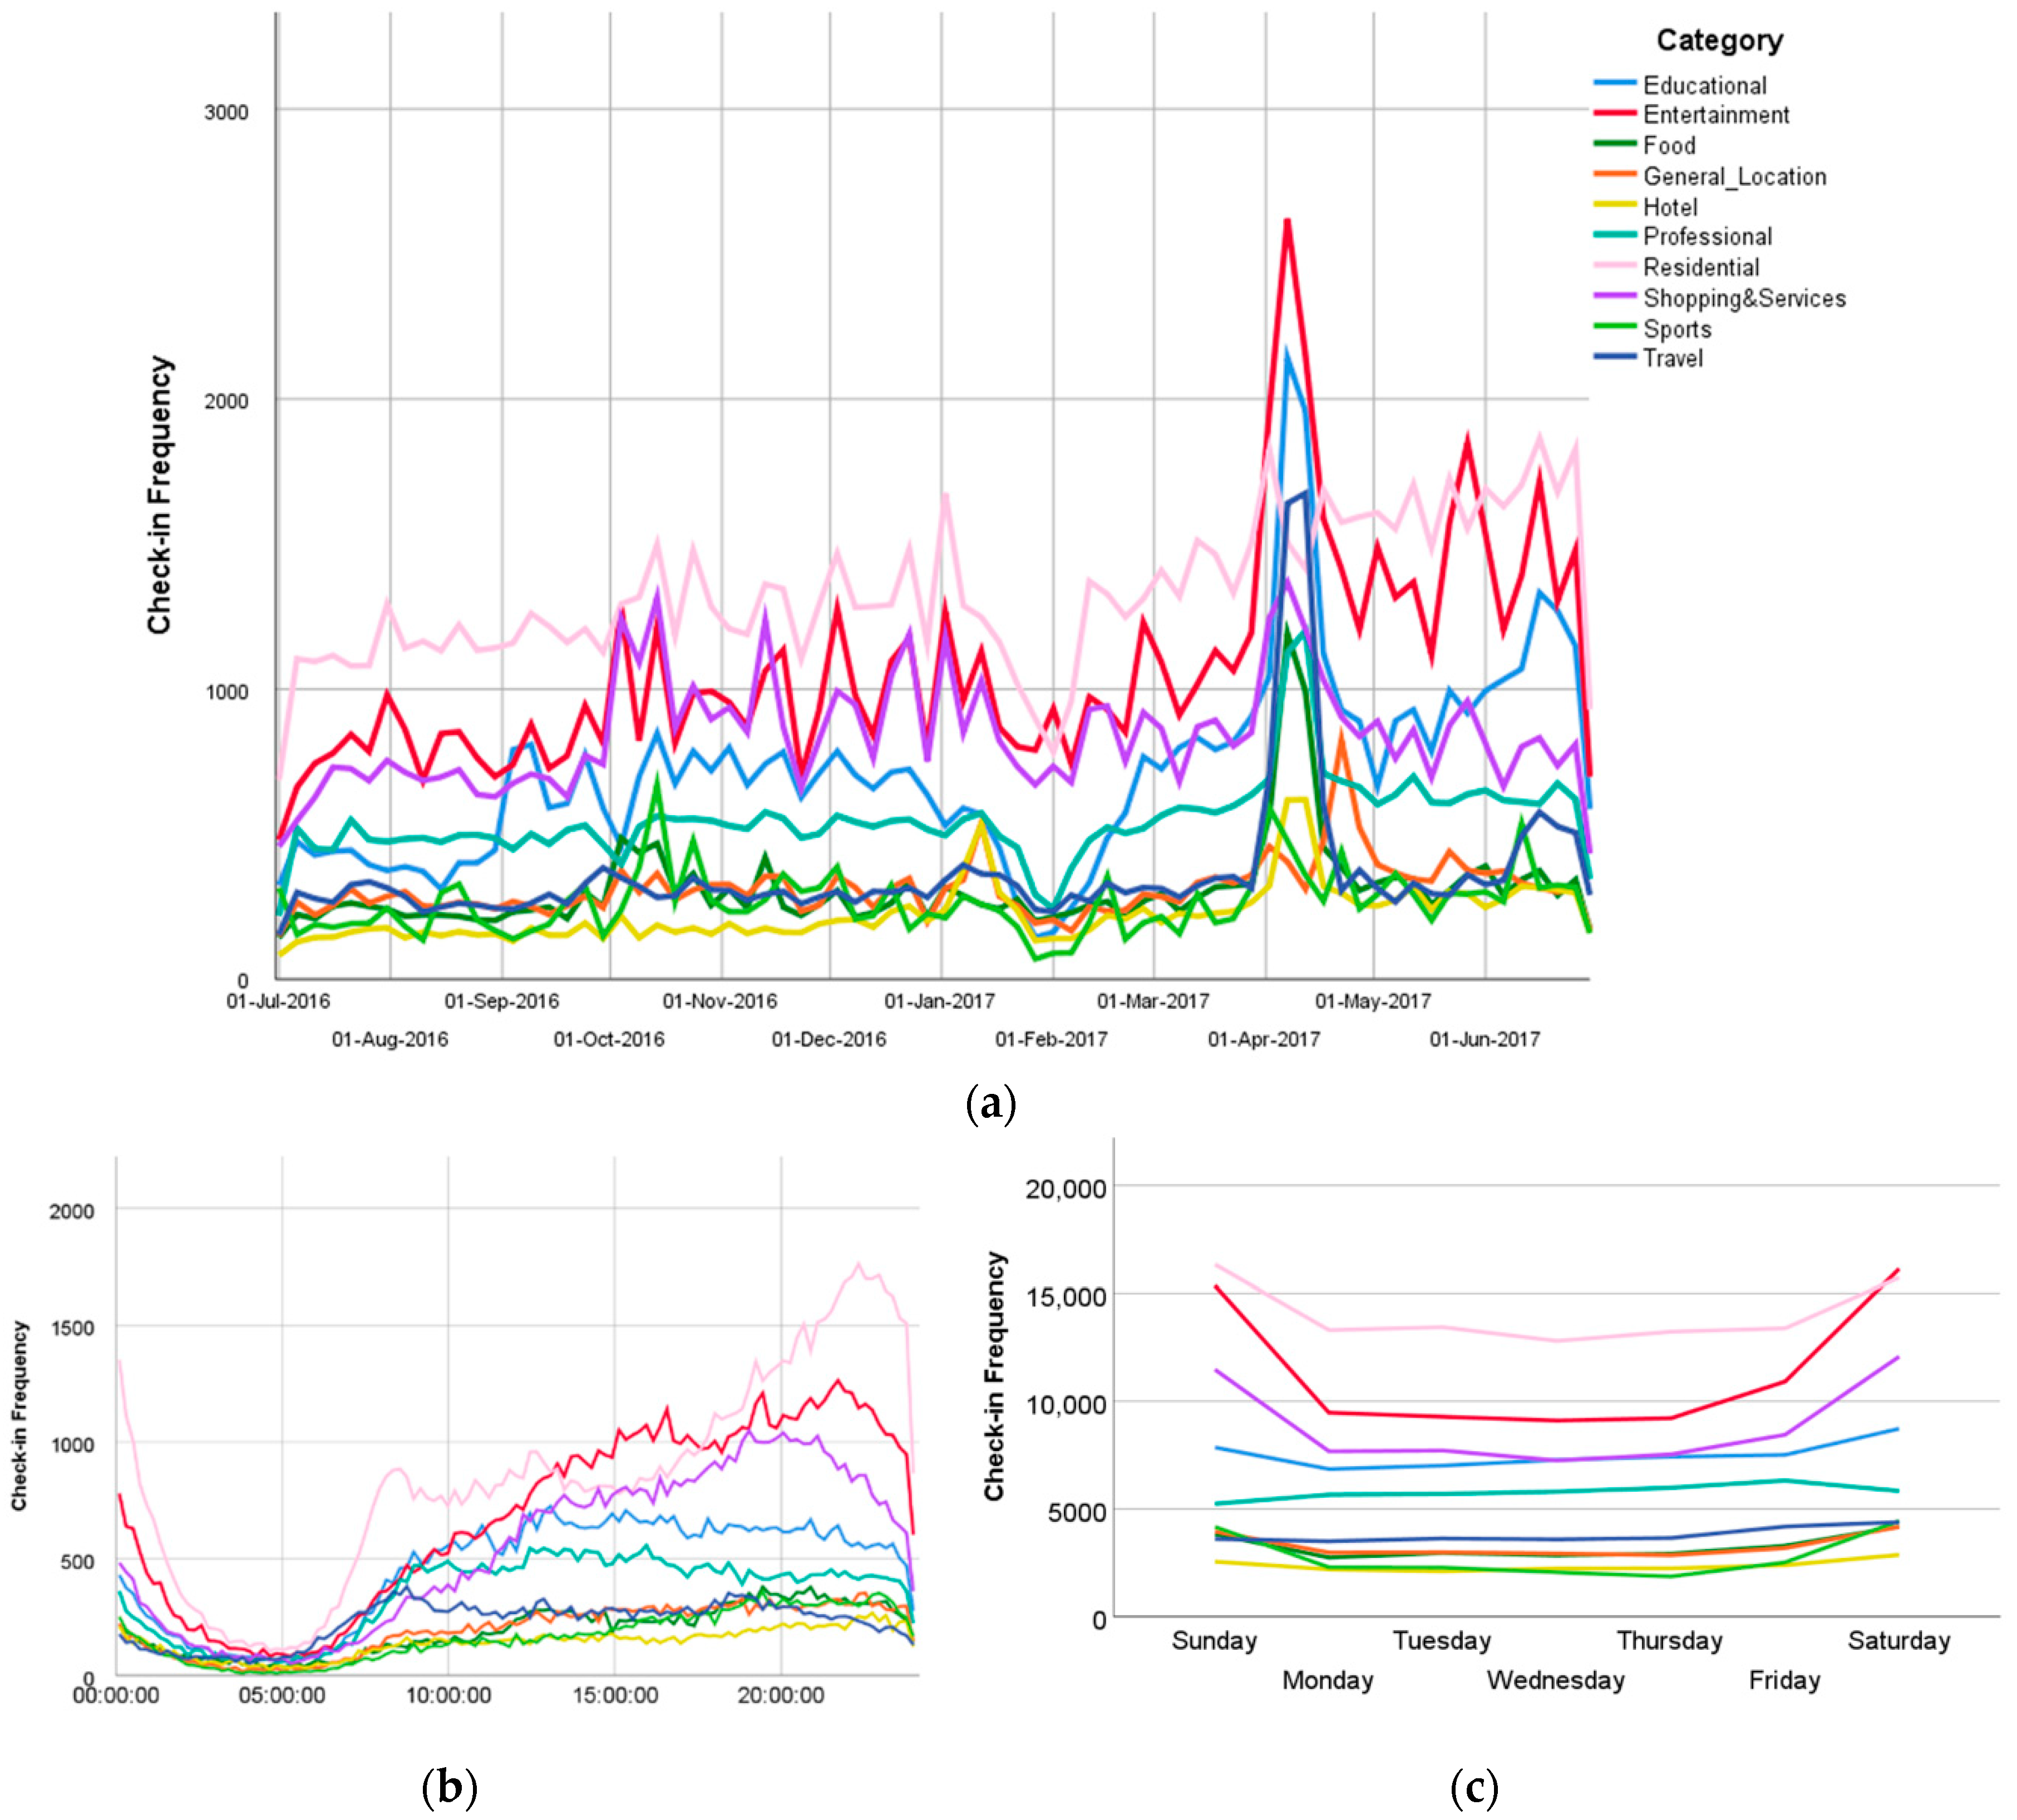
  • Classification of the dataset and study 10 venue categories [17].
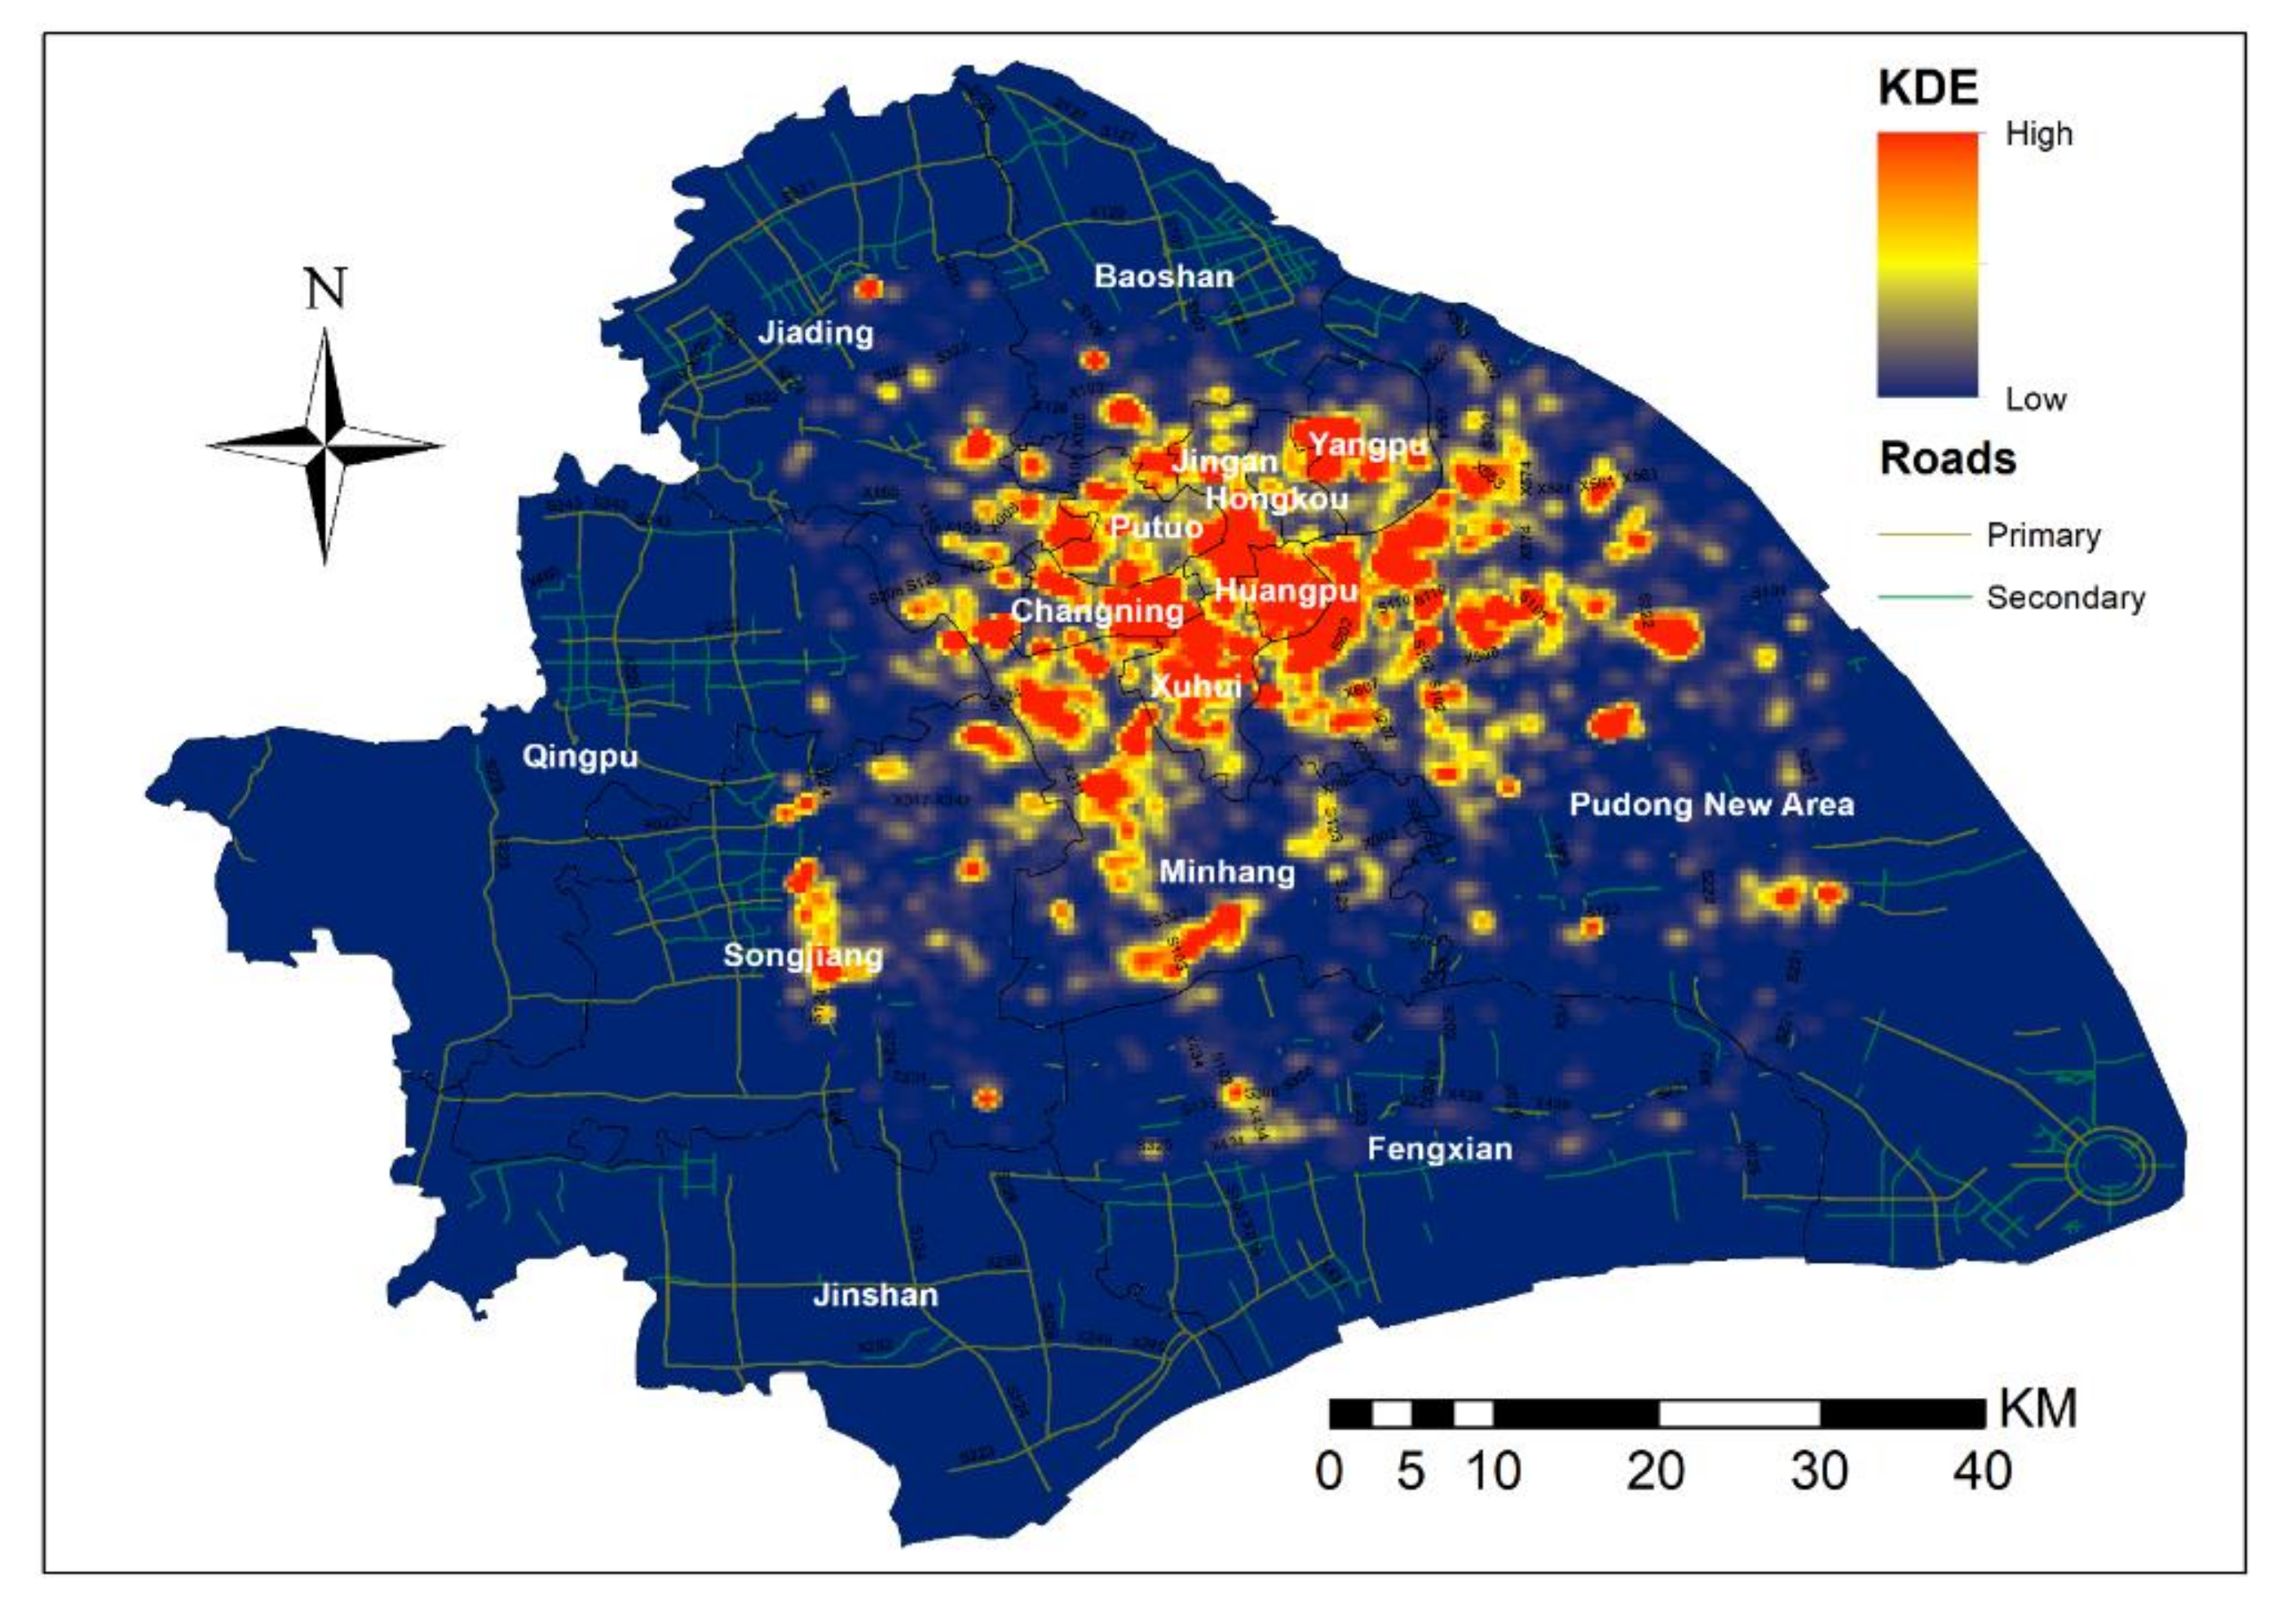
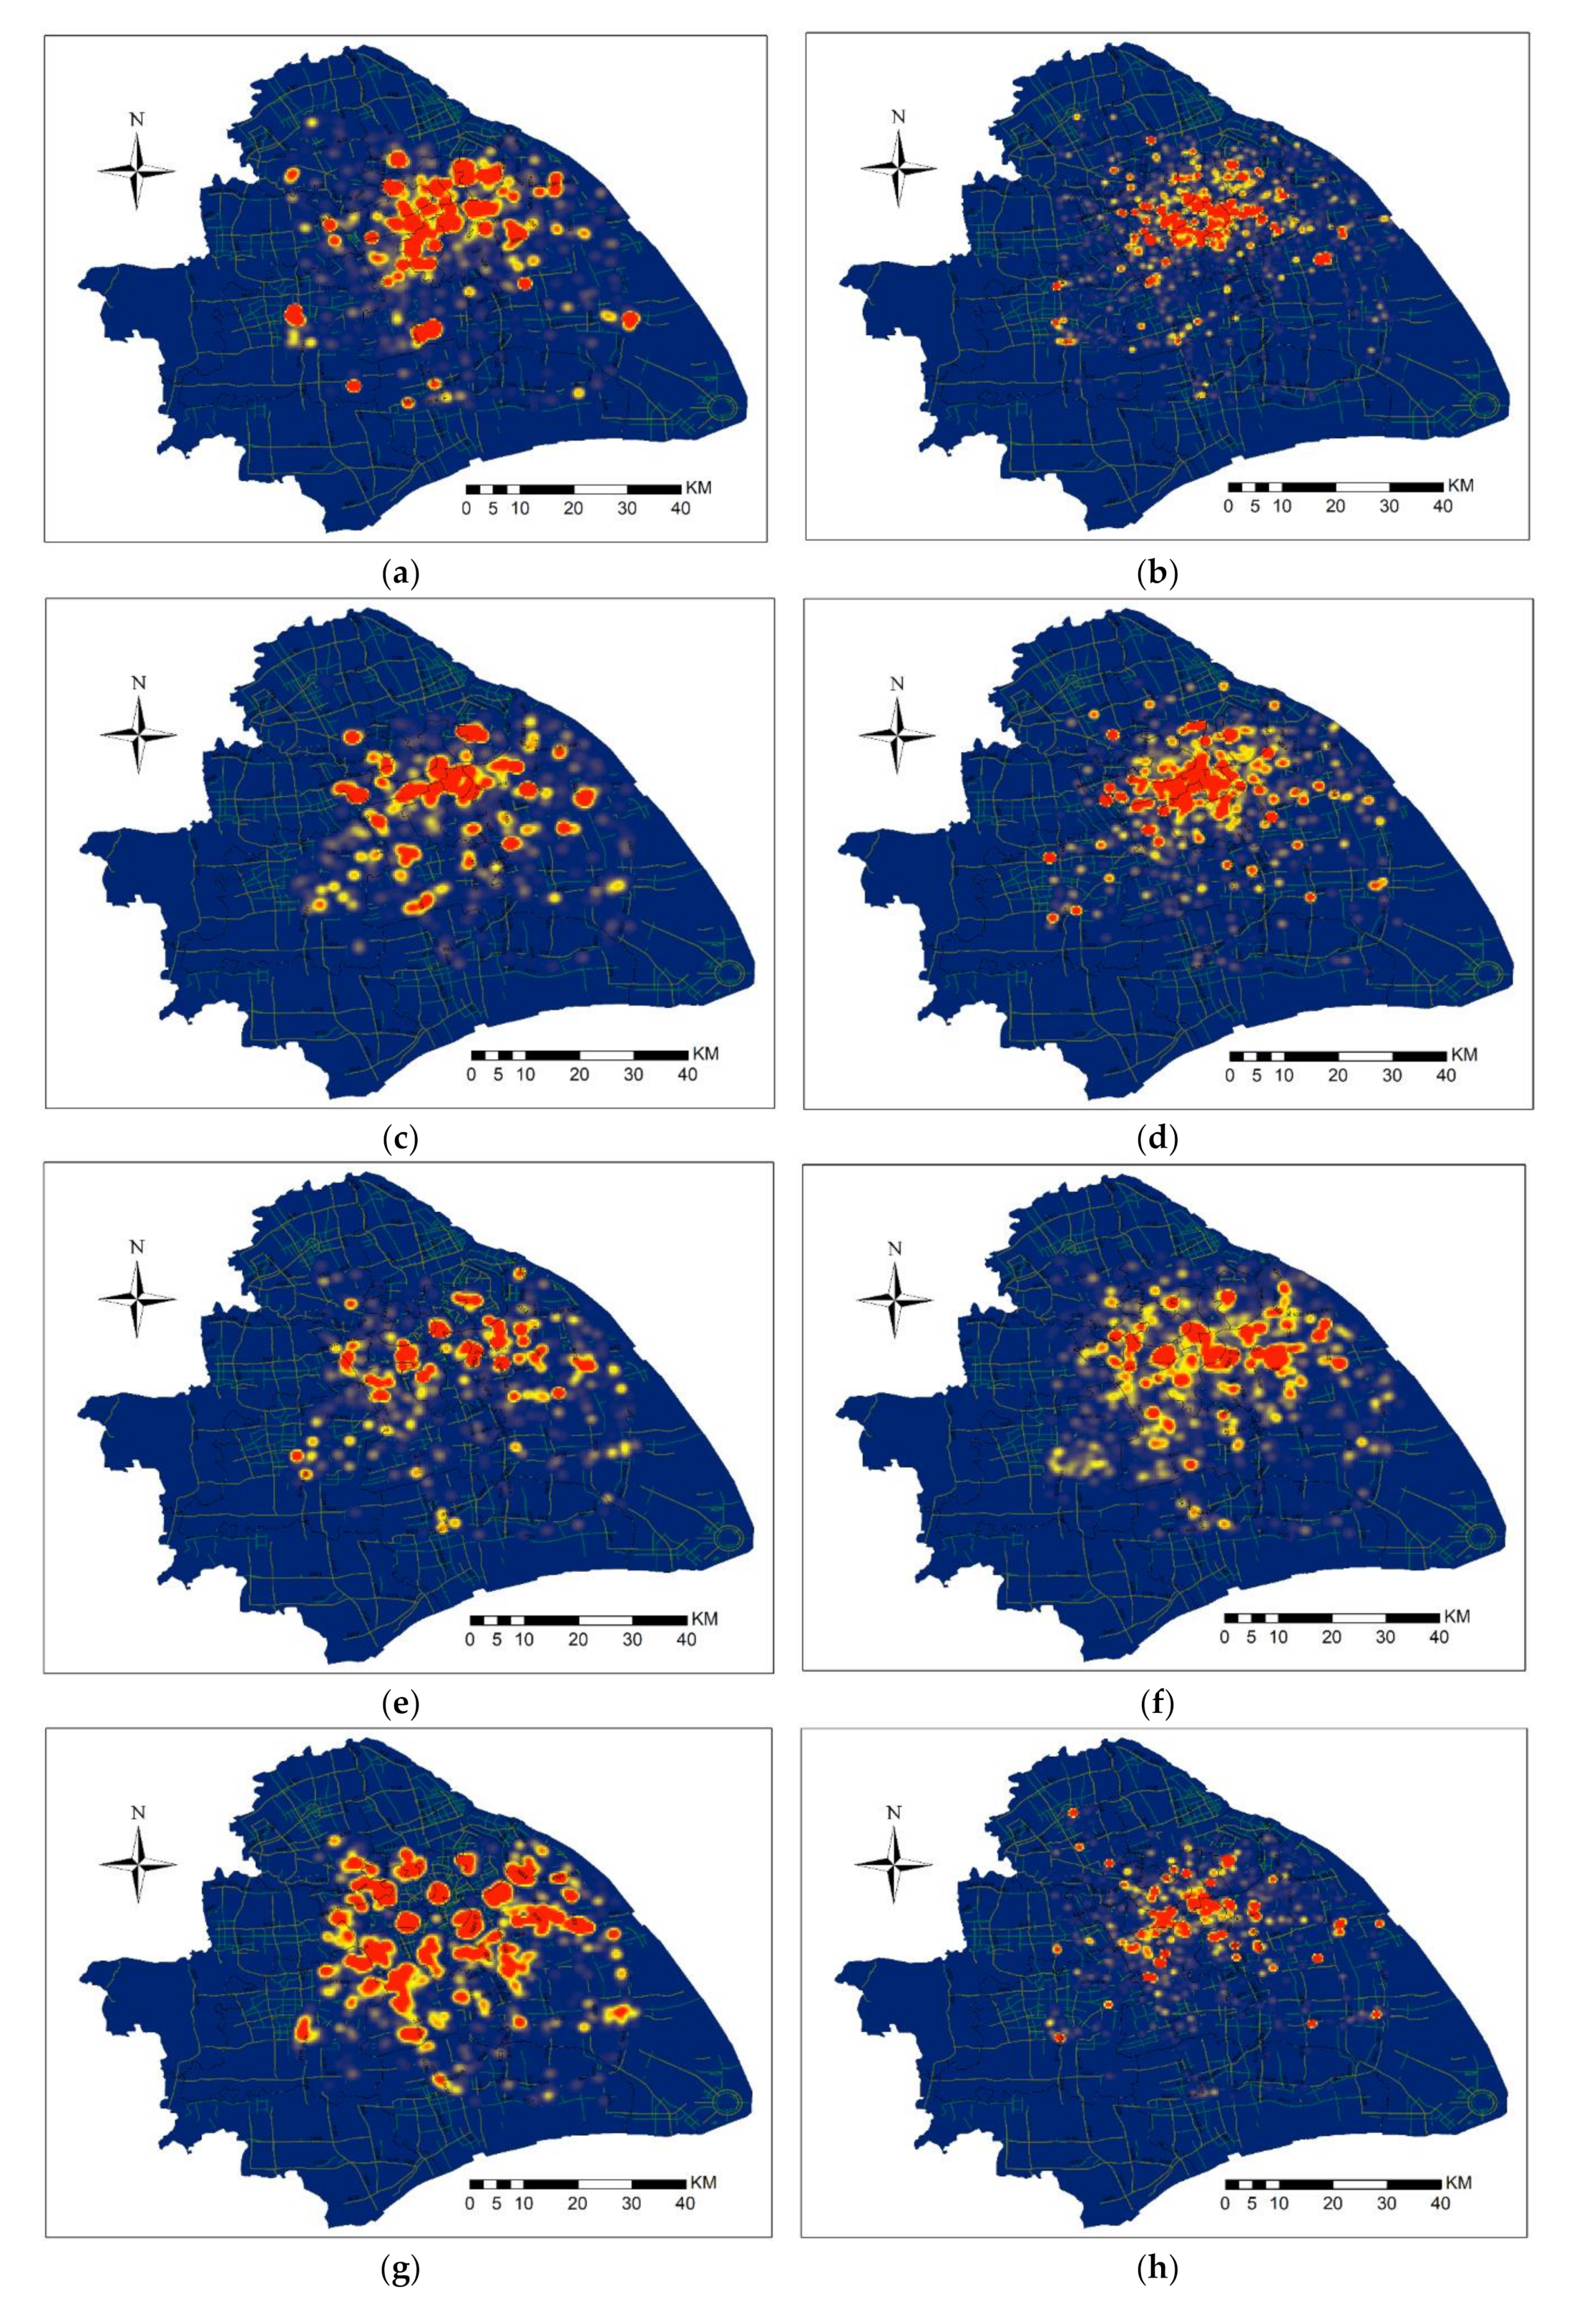
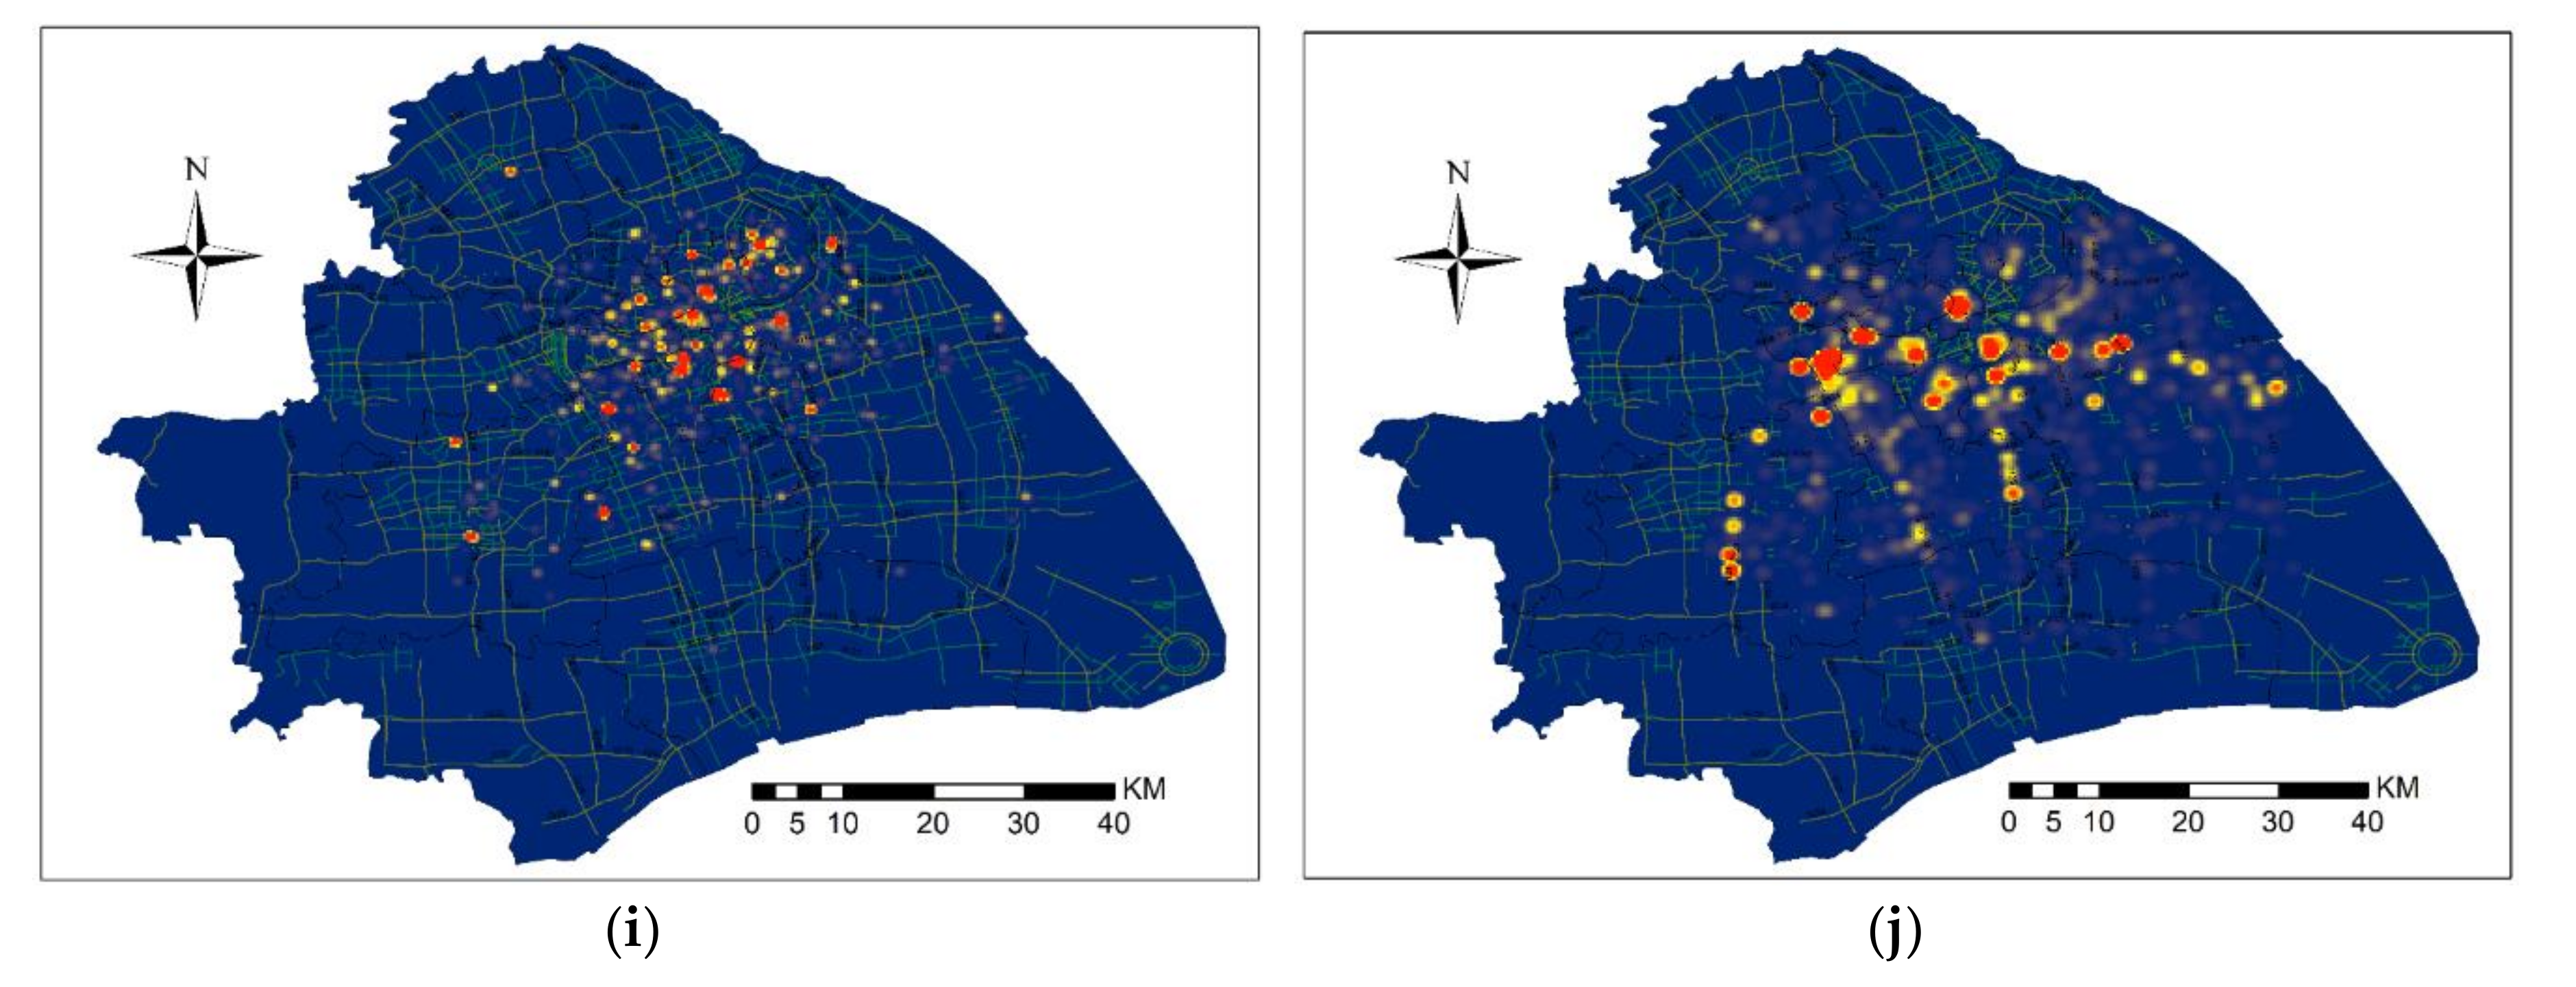
  • Spatial analysis for modeling and density estimation of each category for better understanding of typical check-in concentrations based on each venue category, demonstrating the role of venues in the diversity of users in Shanghai.
One of the most famous statistical analysis platforms among researchers, IBM SPSS Statistics 25 was used to carry out temporal analysis in order to uncover several patterns from the user data in “time” that validates the feasibility of the data for further analysis by portraying common human behavior. We illustrate both statistical tables and graphical charts with detailed descriptions of the findings. The check-in venue classification is done using information about nature, purpose and characteristics of the physical locations in Shanghai and geo-information from the dataset providing baseline for more specialized study in each category. The spatial analysis was done by using Kernel Density Estimation (KDE) through ArcMap of ArcGIS Desktop 10.7.1 with map data from OpenStreetMap (OSM) to show the diversity of the check-ins and contribution of each venue category in city dynamics.
This following paper is organized as; Section 2 contains the related work on bigdata, LBSNs and their important applications in different fields, and articles about the Weibo, Shanghai and China. Section 3 provides an overview of dataset and methodology used for analysis. Section 4 covers the findings and brief discussion of results, and, finally, conclusion of the study is in Section 5 with future work.

2. Literature Review

The research in “Big data” analysis has increased exponentially in the past few years as compared to other areas of Computer Science gaining tremendous attention among many research communities. The term “Big data” and articles like “Big data is opening doors, but maybe too many” [18] and “Big data: the greater good or invasion of privacy?” [19] gives the impression of only volumes however, more elements have to be taken under consideration while defining “Big Data” like behavior, complexity, structure, tools, techniques and technologies used to analyze and process the enormous amount the data [20]. In this regard, the famous three “V’s” representing dimensions of “Big Data” namely velocity, volume and variety of its contents were introduced by Dumbill [21]. Although, Mayer–Schönberger et al. [22] highlighted key challenges of the “Big Data” such as correlation as an alternative of causality, messy in place of clean and populations as a replacement for sample data and Miller et al. [23] argued that “Big Data” is the data that cannot be analyzed using tradition techniques and tools. However, Ovadia [24] proved and emphasized on the significance of “Big Data” for librarians and social-scientists, arguing that “Big Data” is too important to be neglected because most of the research in social sciences require huge amount of data and enormous datasets.
“Big Data” analysis is an important research area and is considered as the center of many research areas like space and time geography, human mobility, user activities and urban functionalities, initially carried out with the help of statistical information based on interviews, surveys, travel diaries, questioner and other manually collected datasets [25,26,27]. These methods may not be sufficient to find the patterns in the data, hence the use of data from mobile phones, Global Navigation Satellite System (GNSS), Smart-cards and location-based online applications contain data with geo-information that are commonly used as efficient resources of data for such studies in recent years [28,29]. With the rapid developments in mobile technologies and excessive use of portable devices, tracking users’ locations and activities became easier, for example, a dataset containing data of 100 thousand users for six months was presented by Gonzalez et al. [30]. Although it included the approximate location to the mobile phones’ base tower where the calls connected, the dataset proved to be effective in approximating the places of users with marginal time, sub-sequentially applied in predictability of user movements [31]. Zhu [32] reviewed various characteristics of GIS (Geographical Information System) and its role in pattern extraction and urban studies by explaining how data can be used to analyze and visualize the spatio-temporal features of recyclable waste, their collection and retrieval. The modern digitized world enables researchers to organize analysis of human activities, patterns and its relevant aspects quantitatively like social contacts, personal preferences and living area [33,34,35]. The research on user activities has been divided into three sections; location prediction, trajectory mining and location recommendation by Fan et al. [36], emphasizing in recognizing the patterns user activities and how can these benefit many application areas like traffic control, mobile marketing, disaster relief, public health and city planning.
There are several levels of “Big Data” processing, storage and analysis. At the organizational level, an important field of “Big Data” is Business Intelligence (BI) which emerged in the late 1990s [37,38]. The BI support decision making process efficiently and effectively by reducing uncertainty through forecasting, ad-hoc queries and reporting based on aggregation, managing structed and unstructured data and systematic integration based on “Big Data” [39,40,41]. The BI systems are composed of multiple tools like Data Warehouse for storing clean, accurate and detailed data from different sources and Online Analytical Processing (OLAP) for real-time multi-dimensional analysis with operations including filtering, aggregation, pivoting and roll-up and drill-down for details [42,43]. OLAP is recognized as one of the most dominant and well-known tools for “Big Data” analysis for decision support in BI systems [44]. BI, Data Warehouse and OLAP are very powerful tools dealing with vast amount of data and various operations, and therefore are also a challenge due to the requirement of massive cost, storage and computational resources [45].
Online Social Networks are proved to be the most significant sources of “Big Data” for the study of human behavior as it has been used and growing rapidly in almost every part of the world [15]. Online services of the LBSNs let the users to post and share activities, interest, their locations and therefore, generate large volumes of data which provides us the opportunities of conducting numerous types of studies in various fields. The studies conducted on analysis methods for human behavior are discussed in detail in articles [46,47,48]. Lindqvist et al. [49] investigated the use of LBSN which is followed by many other research papers such as empirical studies and socio-spatial properties by using LBSNs [3,15,50], and customized geo-social recommendation based on dataset from two separate LBSNs i.e., Gowalla and Foursquare by Zhang et al. [51].
Similar check-in data from LBSN was used by Colombo et al. [52] to improve recommendation systems for two cities of the United Kingdom by collecting frequent users at different venues. In a detailed study conducted by Li et al. [53] which used Foursquare data consisting 2.4 million locations from 14 countries for identifying the features behind popularity of the location. The results of the study uncovered three core causes which influence the fame of a venue i.e., venue profile, venue age and nature of venue. Another study on user behavior at different venue categories focused on “Food” in Riyadh, Saudi Arabia suggested that peoples are more interested to share their experiences while visiting food venues [2]. Check-ins of about 19,000 Swarm users (Foursquare) from three mega cities, i.e., San Francisco, New York and Hong Kong, was used to discuss associations between different venues at different time of a day [54].
Numerous studies have been conducted worldwide to investigate various features of users and check-ins from LBSN data like Foursquare and Twitter over the past few years and used these features in a variety of fields like mobility patterns, venue categorization and urban planing and development [55]. However, a famous LBSN in China named Weibo is used and proved to be efficient for such kind of research. A study for Shanzhen organized by Gu et al. [12] used data from Weibo to analyse attraction features of tourism attractions. Another study for human mobility and activity patterns to analyse urban boundries for Beijing by Long et al. [13] also used check-in from Weibo. Similarly, Shi et al. [55] utilized data from Weibo to study features of tourism sites and conducted analysis along with sentiments from user opinions based on contextual information provided by the LBSN. The check-in data from Weibo was also used Rizwan et al. [56] to investigate behavior and gender differences of users in Shanghai. Similar data and KDE was used by Loo et al. [11] to study and present spatial distribution of road crashes in Shangai, China. Our previous work in [57,58] focused on behavior of male and female users to detect the number of male, female and check-in patterns based on daily and weekly distribution of total Weibo users in Shanghai. Wu et al. [59] explored the spatio-temporal analysis based on hours of the day and difference between weekdays/weekend check-in patterns. Wu et al. [60] also covered check-in analysis around 21 famous lakes in Wuhan. Muhammad et al. [61] carried out check-in analysis on weekend and weekdays with gender for Guangzhou city.
However, to the best our knowledge, there has been no research for the study area of Shanghai including analysis of both spatial and temporal features, and to associate these features with different venue categories based on check-ins from Weibo along with the contribution of these categories in density estimation. The current study initially explores temporal patterns in order to demonstrate some of the most common human behavior in association with nature of the venues, and finally estimate the density of check-in data in different venue categories to show the contribution of each category in overall intensity of users and dynamics of the Shanghai city.

3. Dataset and Methodology

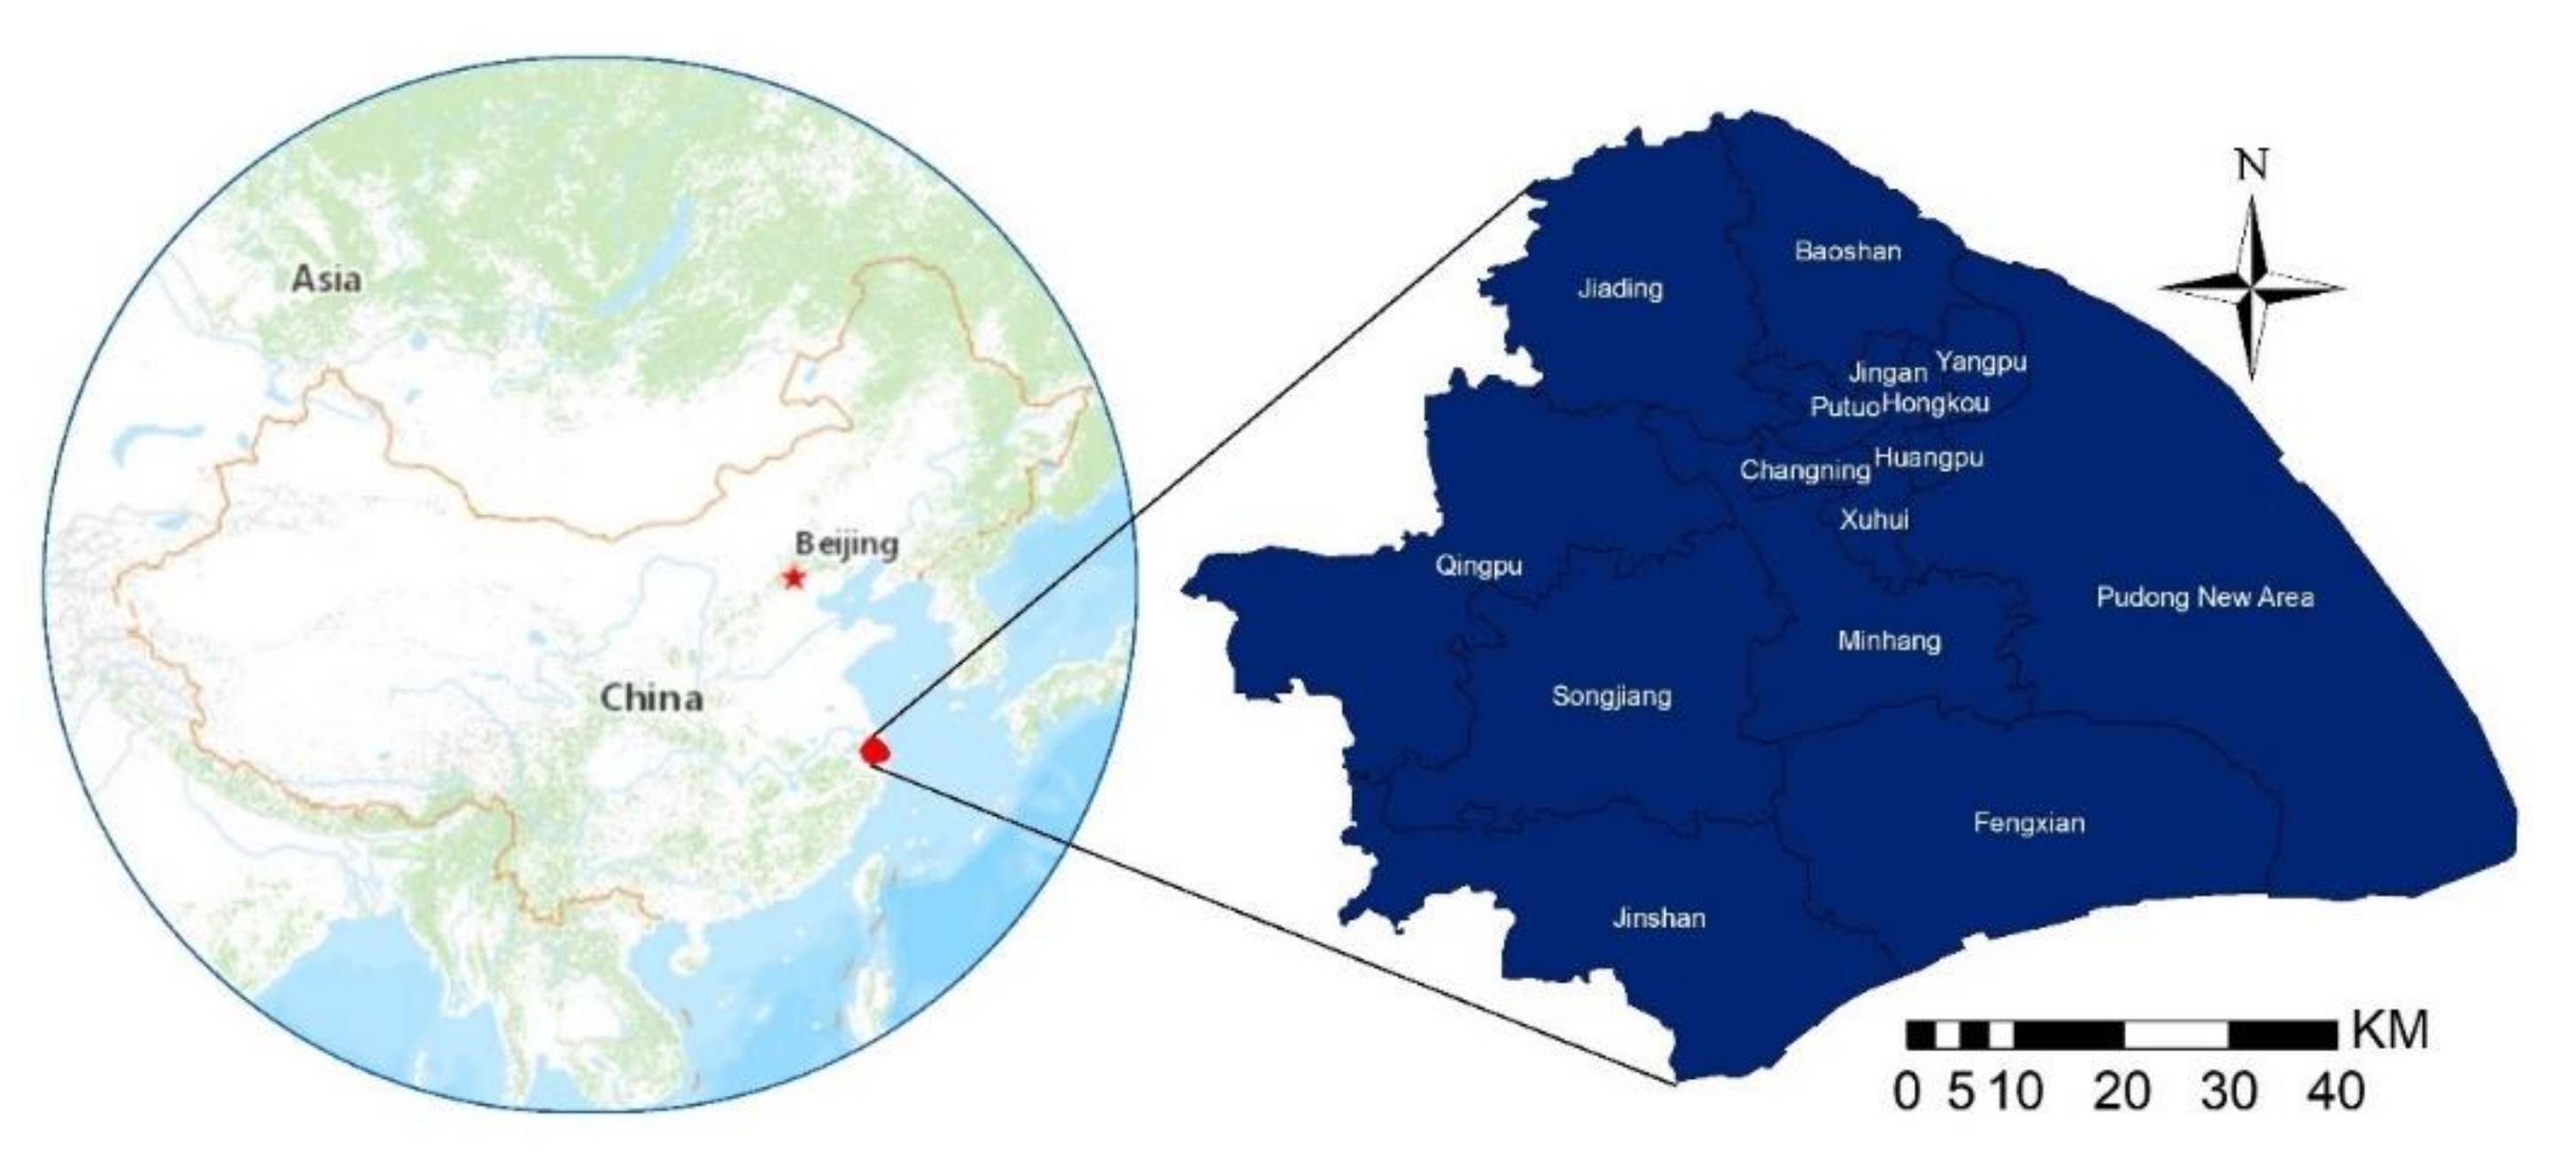
3.1. Study Area and Datasource

The current study was based on data for a very famous city of China, Shanghai which is located on the Yantze River between 30°40′–31°53′ N and 120°52′–122°12′ E with an area of 83592 km. It was divided into one county and 16 districts namely; “Baoshan”, “Chongming”, “Songjiang”, “Changning”, “Fengxian”, “Hongkou”, “Huangpu”, “Jingan”, “Jiading”, “Jinshan”, “Pudong New Area”, “Minhang”, “Putuo”, “Qingpu” and “Xuhui” and “Yangpu” [56]. Shanghai is considered as an economic city with the Gross Domestic Product (GDP) of about 2.7 trillion Yuan and an average growth of 7.4% in the last 5 years, connects China to the global economy. The average population of Shanghai in urban areas is 3854 people per square kilometers and with about 0.66 million annual increase, Shanghai became the first in China and fifth biggest city in the world in population. The main factor in population growth is the huge amount of migrants, about 39% of Shanghai’s total population in year 2010 [62]. The study area is presented in Figure 1.
The dataset was acquired from one of the most dominant LBSNs of China called Weibo which is hybrid of Twitter and Facebook (most popular LBSNs worldwide) launched on 14 August 2009. It is a major microblog where users can share their opinions, preferences, activities, images, audio/video messages and locations through writing posts, check-ins or communication with friends and family. Weibo offers various kinds of geospatial infomation, three of the main resources are; sharing realtime location, places mentioned in posts and user profile location. The total numbers of users increased upto 500 million by the end of 2018, reaching monthly active users to about 462 million and daily 200 million [55]. This study is based on socially collected spatio-temporal check-ins from Weibo in Shanghai for a period of one year i.e., 1 July 2016 to 30 June 2017.

3.2. Data Collection and Preprocessing

The basic interest in using LBSN is sharing activities and comments, leading to create a new close social friendship circle. This enables scientists to uncover various features of human behavior and interests within the geo-data collected by these LBSNs. The data used in this study is acquired from such LBSN called Weibo. We used Weibo API (Application Programming Interface) based on Python for data collection with check-ins in Shanghai city. It was collected during year 2017, consisting about 3.5 million total check-ins of approximately two million users. The collected data, initially downloaded in Java Script Object Notation (JSON), the standard API Java programming format was changed to Comma-Separated Values (CSV) with the help of MongoDB for current study.
The dataset was filtered for relevant data and remove anomalies, missing values and irrelevant attributes. For more significant analysis, venues with more than one check-ins were considered. The filtered dataset used in this study includes 441,471 check-ins by 144,582 users from 20,171 venues. The sample of records contained in the final dataset is provided in the following Table 1.

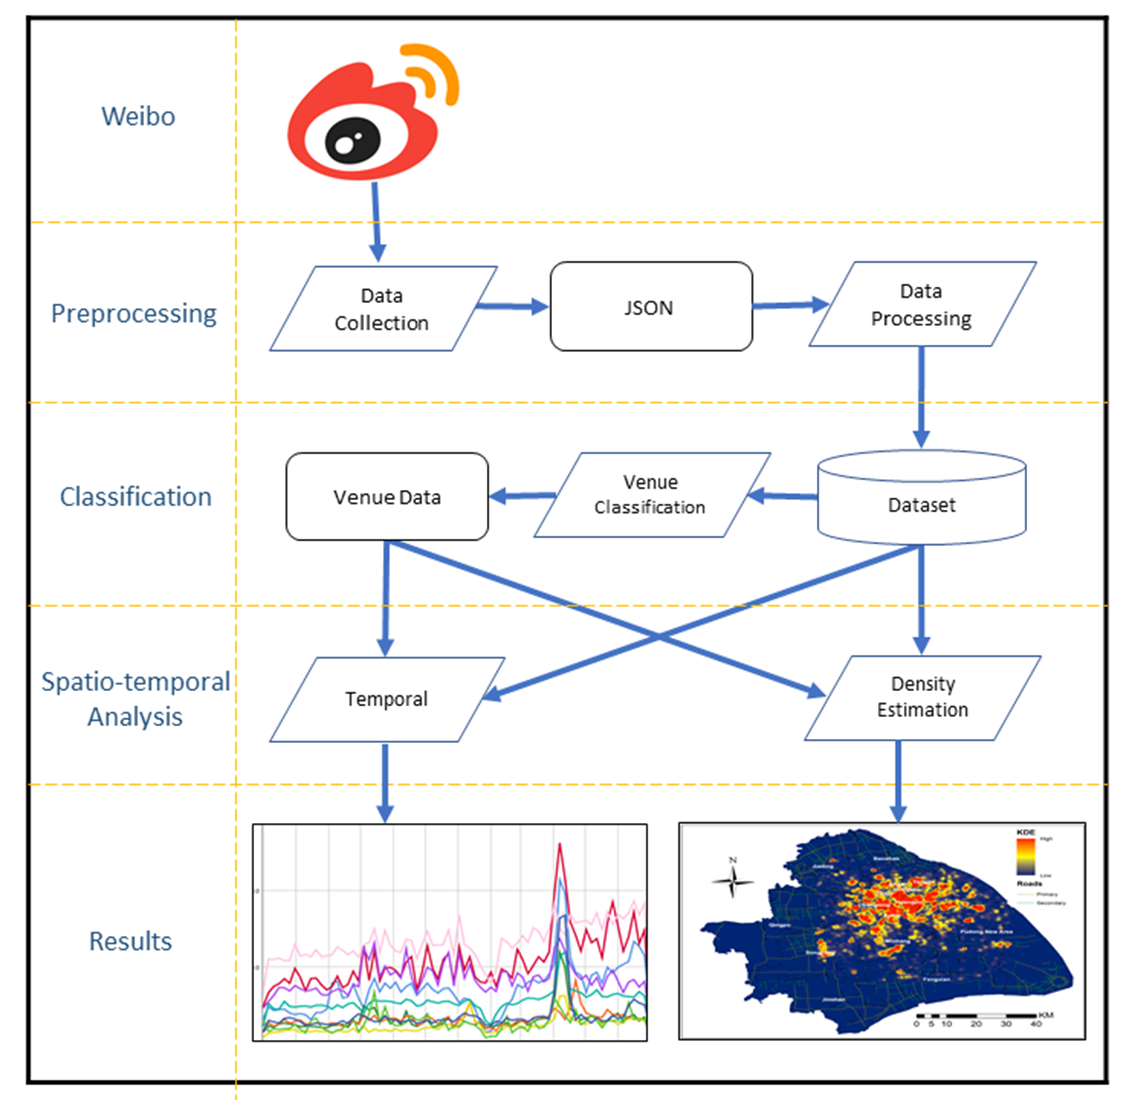
3.3. Analysis Framwork

The data analysis has been divided into three parts; temporal analysis, venue categorization with spatio-temporal analysis of venues and density estimation. Temporal analysis was performed using descriptive statistics over time with SPSS to uncover different patterns in check-ins by users at various hours, days and the whole study period of one year. One of the main reasons of such analysis is to show the validity of the dataset by demonstrating some obvious human behaviors such as less usage of LBSNs after mid night till early morning because of sleeping routine and more check-ins after working hours and weekends because of more social activities during leisure time. Additionally, some interesting patterns are uncovered for both male and female as all the descriptive results include both genders represented in different colors.
The venues were classified by comparison of location names and geo-coordinates with the function of physical locations within the city. The location names have been translated and extracted from the Weibo dataset stated as “Location” attribute as shown in Table 1, and classified according to the functions of these different venues such as a university has been added to “Educational” or a restaurant has been classified as “Food” category and so on. These venues bare highest number of check-ins and therefore, were considered frequently visited and famous locations in Shanghai. Each check-in was added to the category that best suits the nature of the activity performed at that location e.g., food for restaurants and entertainment for cinemas. The flowchart of our methodology is presented in the Figure 2.
The spatial analysis was carried out with the help of map attributes collected from OSM to observe with geo-data on the map of the Shanghai city. The shapefiles of these map attributes were used on ArcMap with build-in Python interface to investigate the density of overall check-ins and the contribution of venue types in density estimation with default parameters of KDE in ArcMap. OSM is a popular geo-information platform with multiple attributes, i.e., districts, streets, metro, etc., used in geo-spatial modeling and research [63]. The KDE method is used for plotting more accurate and smooth density. The KDE can be calculated using the formula at an (x, y) location to predict the density (ArcGIS documentation), Equation (1).
D e n s i t y = 1 r a d i u s 2 i = 1 n 3 π . p o p i ( 1 ( d i s t i r e d i u s ) 2 ) 2
For   d i s t i   <   r a d i u s
where i = 1 , n are the input points, p o p i   is the population field value of point i and d i s t i is the distance between point i and the x , y location. The density calculated using the above formula is then multiplied by the total number of provided points needed to be calculated for each location [64].

4. Results and Discussion

There has been a rapid development in mobile technology, wireless communications, online and location-based services in the past few decades. Therefore, services based on these elements i.e., LBSN such as Twitter, Weibo and Facebook, are drawing more and more scholars to analyze the massive data collected by these services. The analysis proved to be very helpful to extract useful patterns about crucial jobs like crises and disaster management, urban planning, development of smart cities and other fields involving big data. This section discusses three different type of results; temporal analysis, venue classification and density of check-ins with contribution of venue classes in the density estimation.

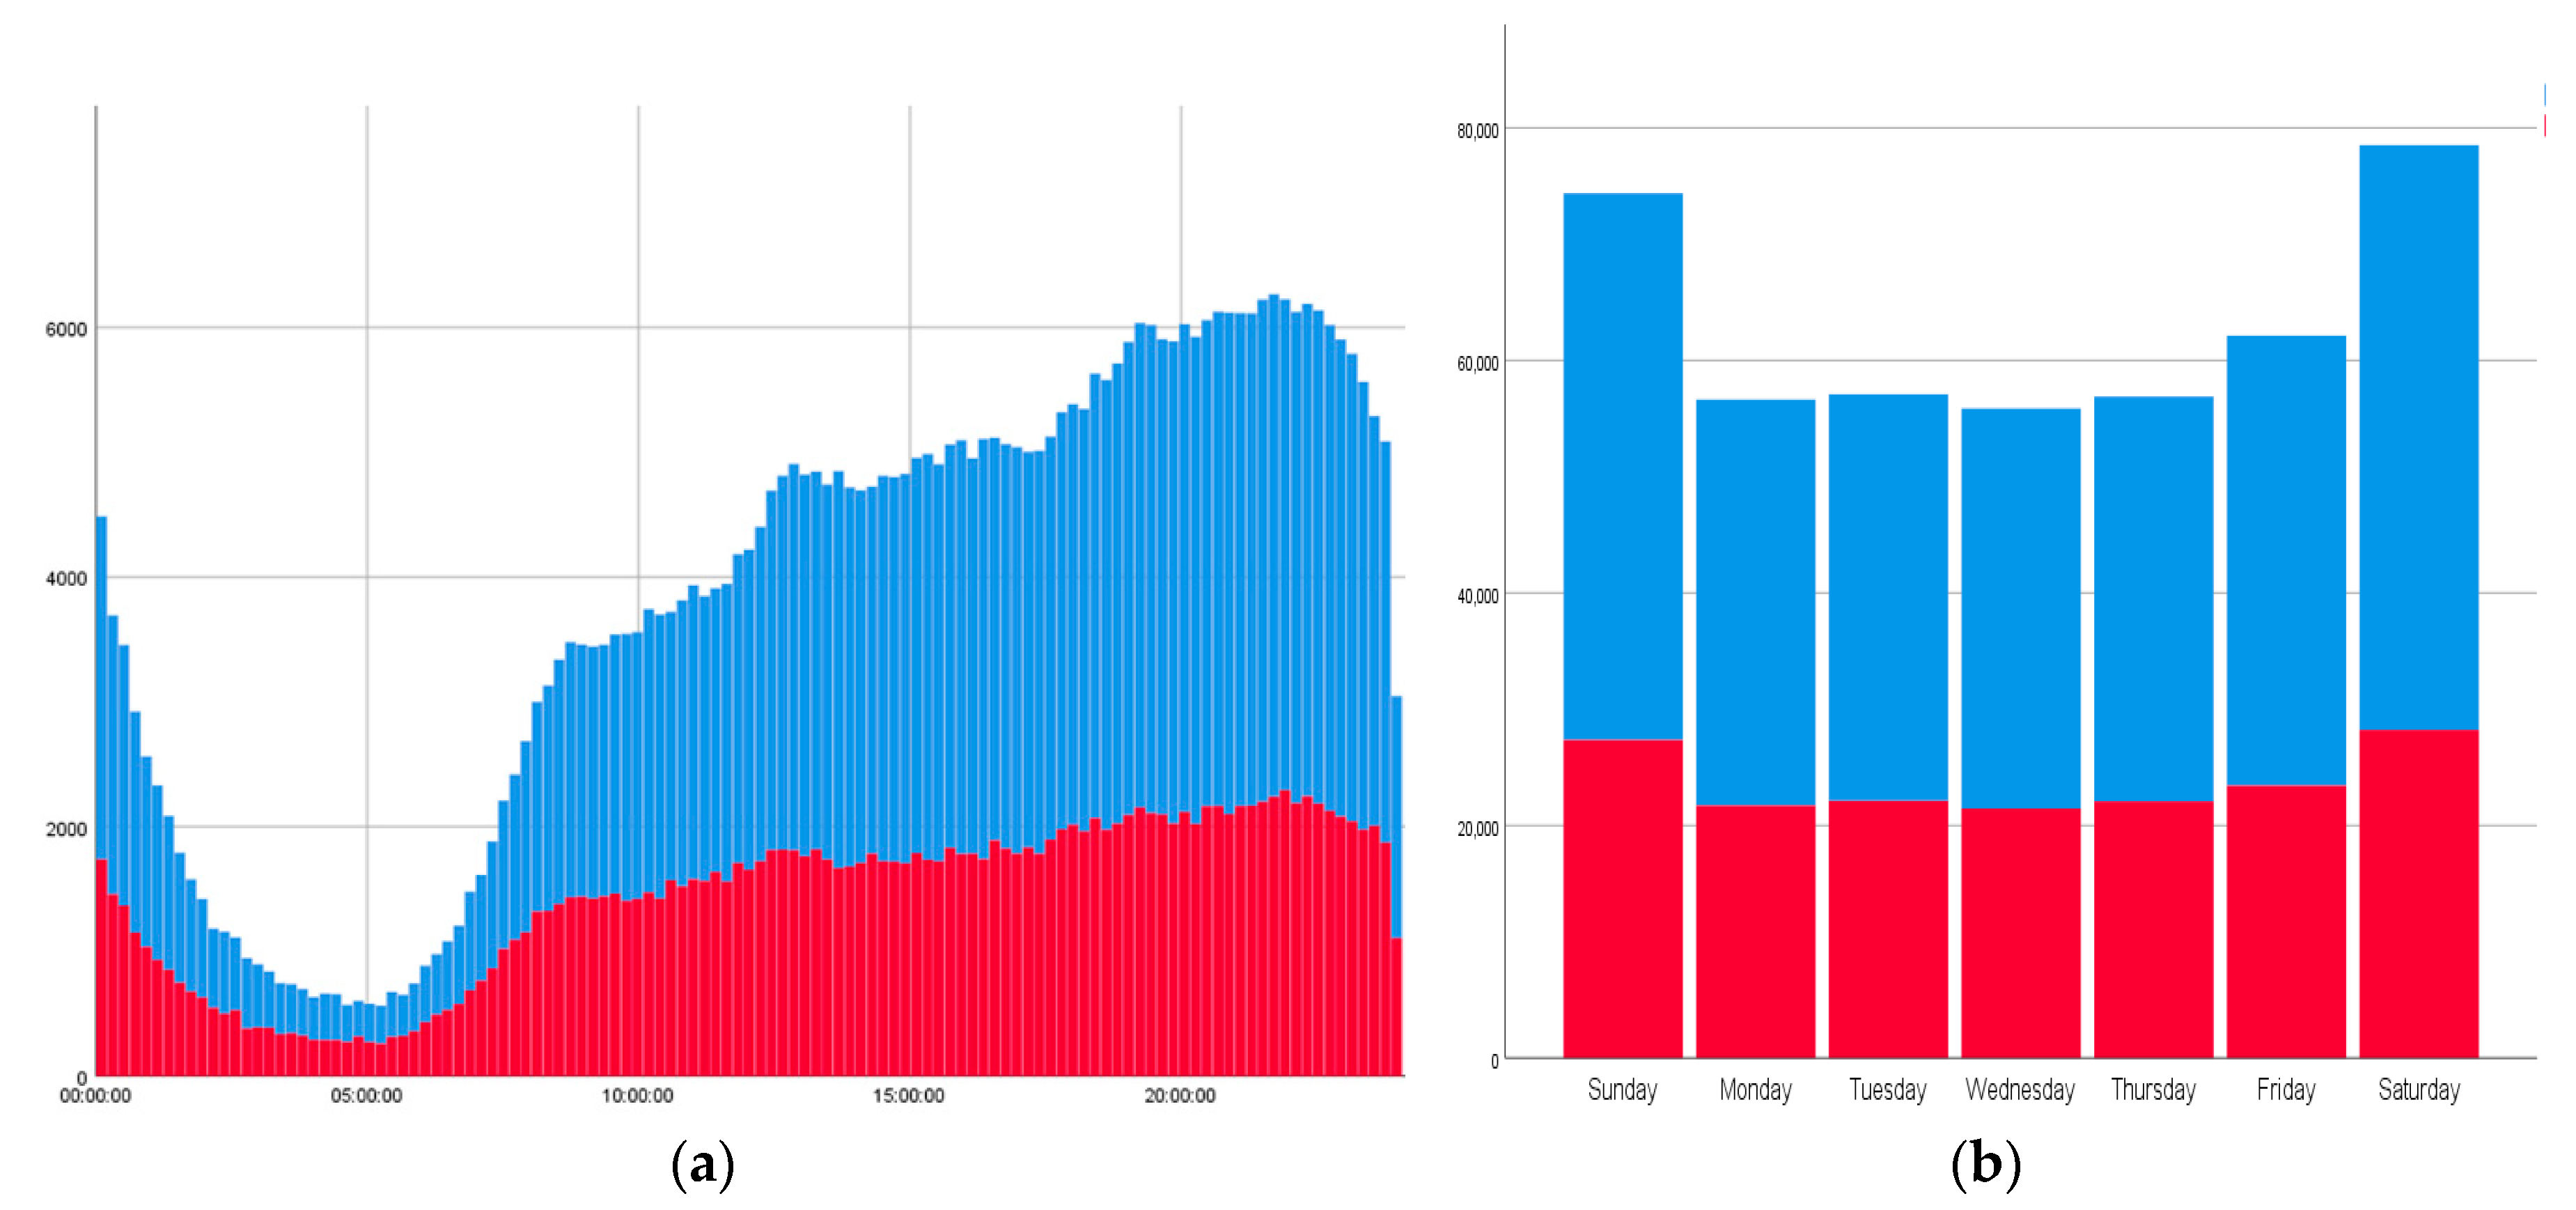
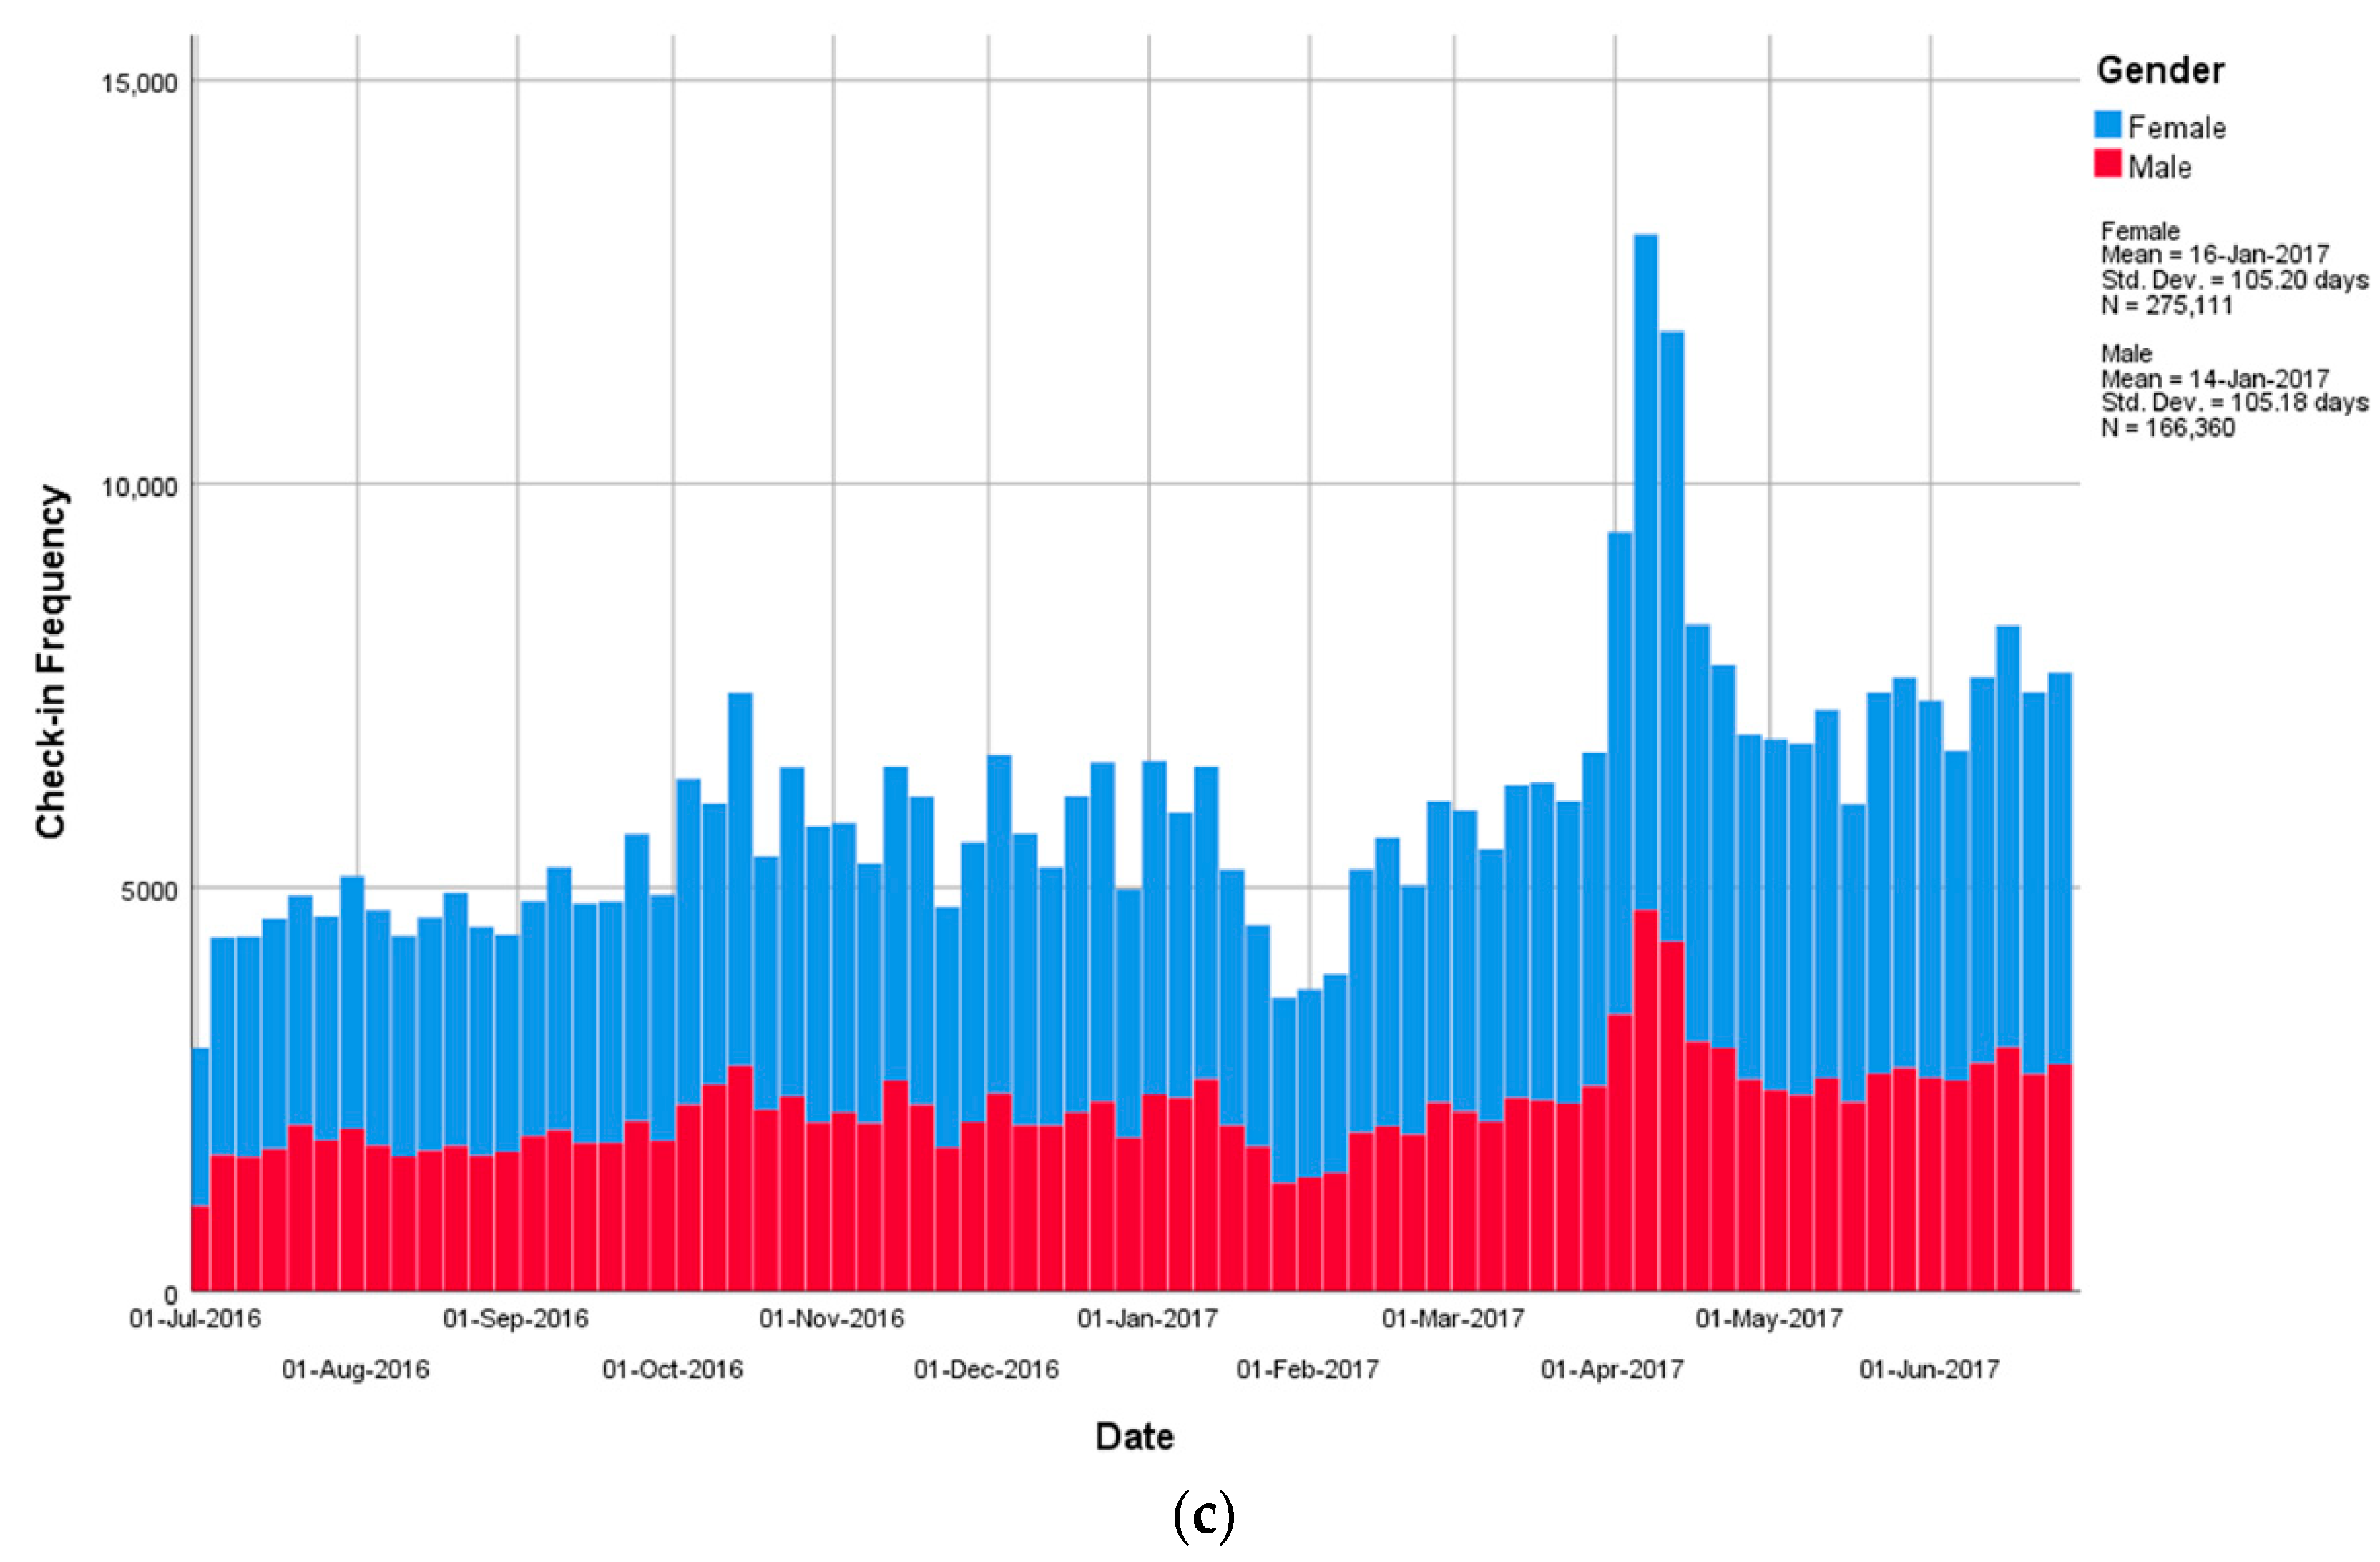
4.1. Temporal Analysis

In this section, we discuss different patterns based on time in order to show the significance of using the dataset starting with daily patterns, followed by weekly and then check-in patterns for the whole year i.e., 1 July 2016 to 30 June 2017. All the results represent male and female in different colors. To demonstrate the most common human behavior (as mentioned earlier), we present the check-in frequency over time in Figure 3.
The above Figure 3a clearly shows the daily routine of common users, i.e., the frequency of check-ins was significantly less after midnight till early morning, whereas considerably high in the evening till late night. On the time scale of 00:00–24:00 h the frequency of check-ins was lowest at 05:00 h and starts rising with reasonable number of check-ins at 09:00 h. After 09:00 h the frequency increased gradually during the official working time and was highest after 17:00 h as users are free of work, offices, educational institutes, etc., because this time is normally less busy and more entertaining and gathering time of human life. The frequency reached its peak at 22:00 h and eventually declined for the night because of the obvious sleeping routine of most people. This behavior was a little different from the Melbourne, Australia, studied by Singh et al. [1], based on check-ins from Foursquare, suggesting that the busiest time is 16:00 to 21:00. While it was much more like New York City, San Francisco and Hong Kong, where most of the check-ins were performed between 16:00 to 20:00 [54]. To discuss the weekly rhythm of users’ check-ins, frequency during the whole week is shown in Figure 3b.
The weekly patterns suggest an interesting fact that although both Saturday and Sunday were holidays, still there were more check-ins on Saturday instead of Sunday. One of the reasons may be because Saturday was followed by another vacation day (Sunday) so people do not have to worry about waking up early in the morning and they can entertain and enjoy all day long till late night. Besides this fact, the remaining days shows normal behavior, i.e., the check-in frequency was relatively low and almost the same on all working days from Monday to Thursday, and increased on Fridays followed by large number of check-ins during weekends. The total check-ins for the whole year (1 July 2016 to 30 June 2017) in Shanghai are shown in Figure 3c representing the frequency of check-ins for both male and female during the study period.
It can be observed that there were minimum check-ins during February, revealing a very interesting fact about the Shanghai city, i.e., the large number of migrants move back to their home cities during the famous Chinese Spring Festival and Chinese New Year. These migrants were 39% (in 2010) of its population, so the movement is considered the greatest human migration on planet earth [65]. The frequency was also low during summer vacations in July, following the same trend. The frequency was highest in April, this may be because of the two mega and famous events in 2017, namely Shanghai Film festival and Formula 1 World Championship. Other contributing factors may include the weather, Qing Ming Jie holidays or cherry festival [17].

4.2. Check-in Venue Categorization

The main edge of LBSNs data usage is identification of the check-in location as every check-in has geo-coordinates recorded in the meta-data. With these geo-coordinates, we can recognize the activity performed at a location and its function as each of these check-ins has the latitude/longitude of an actual location stored in LBSN such as Weibo [66]. The latitude and longitude can be plotted on a geo-reference map to pinpoint the exact location of every check-in which provides the means of extracting information about the function of the venue visited by users. In this section, we categorized these venues according to their functions and types of activities relating to that specific venue.
The most general types of classes have been used for venue categorization containing 10 venue classes namely “Educational”, “Entertainment”, “Food”, “General_Location”, “Hotel”, “Professional”, “Residential”, “Shopping & Services”, “Sports” and “Travel” by comparing the latitude and longitude with function of the locations within Shanghai. Most of these category titles are self-explanatory but the “General_Location” include places like temple, church, waiting bridge and mosque and “Professional” category include venues of hospital, police station, bank, court, factory and industry. The detailed characteristics of dataset based on the venue categorization are given in Table 2.
The total check-in venues considered in this study were 20,165 which were classified based on the criteria yielding the above check-in’s and user’s records.
The total check-ins in “Residential” category was greater than all other categories while “Hotel”, “Food” and “Sports” have minimum check-ins. It is interesting to observe that although the number of locations in “Professional” was more than every other category, but check-ins and users in “Residential” was more than the double of check-ins in “Professional” category. Similar patterns were observed in “Educational”, “Entertainment”, “Shopping & Services” and “Food” categories i.e., the number of venues was almost the same, but the check-ins and users were significantly different in numbers. This reveals an interesting point, i.e., in the second case, it was an obvious fact that people tend to use LBSNs more frequently while having a good time at “Entertainment” and “Shopping & Services” venues e.g., concerts, parks and shopping malls. Similarly, they use LBSNs more at their homes as compared to being at work or professional places, such as instance, hospitals and courts, which represents similar pattern observed in Melbourne [1], New York City, San Francisco and Hong Kong [54]. The overall statistics of the venue categories is provided in Figure 4.
In order to gain more insights about the contribution of these check-in venue categories, we expand our study of categorization with respect to time, week and date as shown in the Figure 5.
The category-wise temporal analysis shows some common behaviors like decline of check-ins frequency in vacations and spikes in almost all categories after vacations in April, along with uncovering that winter vacations (Chinese New Year and Spring Festival) do not have that much effect on “Entertainment” and “Shopping & Services” categories as compared to winter vacations as in Figure 5a. The Figure 5b indicates that the check-ins in “Residential” category start rising earlier in the morning and start declining later at night as compared to other categories (as expected), additionally other categories start declining after working hours but “Entertainment”, “Shopping & Services” and “Residential” check-ins are at peak after working hours until midnight. The weekly analysis in Figure 5c represents that weekends have significant effect on “Professional” category as the check-ins was minimum on weekends and on “Entertainment” and “Shopping&Services” as they were at peak on weekends.

4.3. Density Estimation

Spatial analysis is carried out by density estimation of check-ins on geo-referenced map of Shanghai using map features of OSM i.e., city boundaries, district boundaries, Shanghai metro, highways, etc., enabling us to easily recognize various locations on the map. KDE has been implemented in order to model more accurate and smooth density all over the study area as shown in Figure 6.
The above figure exhibits the density representing the distributions of check-ins in various regions of Shanghai over the map. The highest density is shown in red color while yellow represents the intermediate density that progresses to the base color with minimum density as we are interested in highlighting and analyze the behavior, and concentration of users in the current study. It can be seen that check-ins in “Hongkou”, “Huangpu” and “Jingan”, considered as the city-center (commercial center) of Shanghai, have more density as compared to other districts including, “Baoshan”, “Changning”, “Fengxian”, “Jiading”, “Jinshan”, “Minhang”, “Pudong New Area”, “Putuo”, “Qingpu”, “Songjiang” and “Yangpu”. However, even in other districts, the density was higher near the city center and minimizes as we move to away to the far places. The main reason was that the city-center in any big city is more developed with facilities in almost every aspects of daily life such as transport, government offices, food, shopping malls and nightspot life. In addition, we can observe high densities in some diverse areas mainly due to the diversity of parks, residential apartments and educational institutions in the city. The high density can also be observed in the area near to Shanghai Metro because of the convenience in traveling and moving around within the city.
In order to unveil insights about the effect of activities in different venue categories on the diversity of check-ins, we plot the density of each venue category in Figure 7.
It can be observed from the above Figure 7a–c that check-ins in “Educational” and “Food” were more concentrated as compared to “Entertainment”, suggesting that users visited variety of “Entertainment” venues but went to preferred “Food” venues, and specific “Educational” institutions. Similarly, in Figure 7d,e “General_Location” were more diverse as compared to “Hotel” because they were situated at specific places in the city. It was a common behavior that people barely used LBSNs from “Professional” locations, similar patterns can be seen in Figure 7f having the most average density unlike to all other categories. On the other hand, because of the huge residential apartments in the mega city of Shanghai, Figure 7g demonstrates highly concentrated density of check-ins in “Residential” category. The “Shopping & Services” in Figure 7h (substantial check-ins) and “Sports” in Figure 7i (less check-ins) show diversity in density of check-ins representing interest of users to explore different shopping sites and different kinds of “Sports” venues. The “Travel” category in Figure 7j however, displays the density of check-ins alongside metro lines and metro/bus stops. The concept of chrono urbanism emphasize on building a “time-based urbanism” for efficient reach of verity of urban functionalities especially with respect to time. Easy access to different kinds of resources to enable the optimal situation of social, technical and aesthetic functions within the city [59]. The density of different venues in particular areas shown in 7 represents the same behavior required for smart urbanization.
The contribution of each check-in venue category to the overall check-in density of Weibo data in Shanghai can be elaborated as the locations in “Educational”, “Food”, “Hotel”, “Professional” and “Travel” categories mainly accounts for the concentration of density to these specific places while locations in “Entertainment”, “General_Location”, “Shopping & Services” and “Sports” adds diversity of check-ins in low density areas as observed in Figure 7. However, the fact remains the same that city-center has a more concentrated and denser density as compared to suburban areas. Apart from these specific spatial and temporal patterns, the results clearly demonstrate the feasibility of Weibo as an LBSN dataset by showing the significant contribution of each venue category to the concentration and diversity with respect to time and space, of Shanghai as an example of modern urban city. This gives us the opportunity to use LBSN data as an efficient source of big data analysis instead of the manual data collection, in multiple fields provided the dataset is properly classified into different categories.

5. Conclusions

The check-in data from Weibo for one year (July 2016 to June 2017) was used for spatio-temporal analysis to explore various patterns in different activity categories in Shanghai. The research included analysis of check-in behavior based on time (daily, weekly, annual), check-in venue categorization and temporal analysis of those categories, and the density estimation of check-in data along with the contribution of each check-in venue category in the density. Temporal analysis revealed very interesting patterns such as nearly zero social activities after midnight in a mega city, Shanghai, and maximum social activities on Saturday rather than Sunday. Another key behavior uncovered was the significant effect of vacations and mass migration on the check-in frequency resulting in minimum number of check-ins during this period. The check-in venue classification provided insights about the users of LBSN i.e., maximum number of check-ins from residential, entertainment and shopping areas as compared to check-ins from other venue categories, and an additional fact that shopping and entertainment are not affected that much by summer vacations, Spring Festival or Chinese New Year. The results of density estimation demonstrated that the maximum check-ins are performed at city-center as expected because there is much higher availability of resources. It is further concluded from the findings of modeling density of the check-in venue categories like those containing professional and residential venues contribute to a more concentrated density while the categories similar to shopping and entertainment extend the density of check-ins to suburban areas. All these findings are based on check-in data from Weibo having multiple attributes for Shanghai city, representing it as a chrono-urban adding to more accessible and welcoming city. The study can be beneficial for in developing and development of smart city, recommendation systems, as well as LBSN studies in specialized fields such as transport, tourism and food. There are several limitations to be considered with the current study. Such as limited and maybe biased dataset because the only source of data that has been used was taken from Weibo. This issue can be solved by combining it with other data sources such as WeChat, TripAdvisor and/or other LBSNs in order to obtain more accurate sample sizes and variety of data. In addition, although the data was reviewed, translated and filtered with intension to eliminate non-significant or irrelevant data for the study, it is likely that some data may be missing during this analysis. In future, further research can be carried out by comparing datasets from different LBSNs or from same LBSNs for different cities, or even different countries to explore cultural differences within those cities/countries.

Author Contributions

Conceptualization, Naimat Ullah Khan, Wanggen Wan, Shui Yu, A. A. M. Muzahid, Sajid Khan and Li Hou; Data curation, Naimat Ullah Khan; Formal analysis, Naimat Ullah Khan; Funding acquisition, Wanggen Wan; Investigation, A. A. M. Muzahid, Sajid Khan and Li Hou; Methodology, Naimat Ullah Khan; Project administration, Wanggen Wan and Shui Yu; Resources, Wanggen Wan; Supervision, Wanggen Wan and Shui Yu; Validation, Wanggen Wan; Visualization, Naimat Ullah Khan; Writing—original draft, Naimat Ullah Khan; Writing—review & editing, Wanggen Wan and Shui Yu. All authors have read and agreed to the published version of the manuscript.

Funding

This work is funded by the “National Natural Science Foundation of China” (61711530245) and partially supported by “Shanghai Science and Technology Commission” (18510760300).

Conflicts of Interest

The authors declare no conflict of interest.

Data Availability

Weibo has open geo database and can be downloaded using Weibo API. For more information please visit: https://open.weibo.com/wiki/Index.

References

  1. Singh, R.; Zhang, Y.; Wang, H. Exploring human mobility patterns in Melbourne using social media data. In Proceedings of the Australasian Database Conference, Gold Coast, Australia, 24–27 May 2018; Springer: Cham, Switzerland, 2018; pp. 328–335. [Google Scholar]
  2. Alrumayyan, N.; Bawazeer, S.; AlJurayyad, R.; Al-Razgan, M. Analyzing User Behaviors: A Study of Tips in Foursquare. In Proceedings of the 5th International Symposium on Data Mining Applications, Riyadh, Saudi Arabia, 21–22 March 2018; Springer: Cham, Switzerland, 2018; pp. 153–168. [Google Scholar]
  3. Noulas, A.; Scellato, S.; Mascolo, C.; Pontil, M. An empirical study of geographic user activity patterns in foursquare. In Proceedings of the Fifth International AAAI Conference on Weblogs and Social Media, Barcelona, Spain, 17–21 July 2011. [Google Scholar]
  4. Hollenstein, L.; Purves, R. Exploring place through user-generated content: Using Flickr tags to describe city cores. J. Spat. Inf. Sci. 2010, 1, 21–48. [Google Scholar]
  5. Preston, J.; Stelter, B. How Government Officials Are Using Twitter for Hurricane Sandy. The New York Times, 2 November 2012. [Google Scholar]
  6. Weibo. Available online: http://www.weibo.com (accessed on 2 September 2020).
  7. Wang, B.; Zhen, F.; Wei, Z.; Guo, S.; Chen, T. A theoretical framework and methodology for urban activity spatial structure in e-society: Empirical evidence for Nanjing City, China. Chin. Geogr. Sci. 2015, 25, 672–683. [Google Scholar] [CrossRef]
  8. Bo, W.; Feng, Z.; Zongcai, W. The research on characteristics of urban activity space in Nanjing: An empirical analysis based on big data. Hum. Geogr. 2014, 29, 14–21. [Google Scholar]
  9. Todd, A.W.; Campbell, A.L.; Meyer, G.G.; Horner, R.H. The effects of a targeted intervention to reduce problem behaviors: Elementary school implementation of check in—Check out. J. Posit. Behav. Interv. 2008, 10, 46–55. [Google Scholar] [CrossRef]
  10. Zhen, F.; Cao, Y.; Qin, X.; Wang, B. Delineation of an urban agglomeration boundary based on Sina Weibo microblog ‘check-in’ data: A case study of the Yangtze River Delta. Cities 2017, 60, 180–191. [Google Scholar] [CrossRef]
  11. Loo, B.P.; Yao, S.; Wu, J. Spatial point analysis of road crashes in Shanghai: A GIS-based network kernel density method. In Proceedings of the 19th International Conference on Geoinformatics, Shanghai, China, 24–26 June 2011; pp. 1–6. [Google Scholar]
  12. Gu, Z.; Zhang, Y.; Chen, Y.; Chang, X. Analysis of attraction features of tourism destinations in a mega-city based on check-in data mining—A case study of ShenZhen, China. ISPRS Int. J. Geo-Inf. 2016, 5, 210. [Google Scholar] [CrossRef] [Green Version]
  13. Long, Y.; Han, H.; Tu, Y.; Shu, X. Evaluating the effectiveness of urban growth boundaries using human mobility and activity records. Cities 2015, 46, 76–84. [Google Scholar] [CrossRef]
  14. Lei, C.; Zhang, A.; Qi, Q.; Su, H.; Wang, J. Spatial-temporal analysis of human dynamics on urban land use patterns using social media data by gender. ISPRS Int. J. Geo-Inf. 2018, 7, 358. [Google Scholar] [CrossRef] [Green Version]
  15. Preoţiuc-Pietro, D.; Cohn, T. Mining user behaviours: A study of check-in patterns in location based social networks. In Proceedings of the 5th Annual ACM Web Science Conference, Paris, France, 2–4 May 2013; pp. 306–315. [Google Scholar]
  16. Khan, N.U.; Wan, W.; Yu, S. Location-based social network’s data analysis and spatio-temporal modeling for the mega city of Shanghai, China. ISPRS Int. J. Geo-Inf. 2020, 9, 76. [Google Scholar] [CrossRef] [Green Version]
  17. Khan, N.U.; Wan, W.; Yu, S. Spatiotemporal analysis of tourists and residents in Shanghai based on location-based social network’s data from Weibo. ISPRS Int. J. Geo-Inf. 2020, 9, 70. [Google Scholar] [CrossRef] [Green Version]
  18. Lohr, S. Big Data Is Opening Doors, but Maybe too Many. The New York Times, 24 March 2013; Volume 23. [Google Scholar]
  19. Chatterjee, P. Big Data: The Greater Good or Invasion of Privacy. Guardian, 12 March 2013; Volume 12. [Google Scholar]
  20. Ward, J.S.; Barker, A. Undefined by data: A survey of big data definitions. arXiv 2013, arXiv:1309.5821. [Google Scholar]
  21. Dumbill, E. What Is Big Data? An Introduction to the Big Data Landscape. 2012. Available online: http://radar.oreilly.com/2012/01/what-is-big-data.html (accessed on 19 November 2020).
  22. Mayer-Schönberger, V.; Cukier, K. Big Data: A Revolution that Will Transform How We Live, Work, and Think; Houghton Mifflin Harcourt: Boston, MA, USA, 2013. [Google Scholar]
  23. Miller, H.J.; Goodchild, M.F. Data-driven geography. GeoJournal 2015, 80, 449–461. [Google Scholar] [CrossRef]
  24. Ovadia, S. The role of big data in the social sciences. Behav. Soc. Sci. Libr. 2013, 32, 130–134. [Google Scholar] [CrossRef]
  25. Yanwei, C.; Yue, S.; Zuopeng, X.; Yan, Z.; Ying, Z.; Na, T. Review for space-time behavior research: Theory frontiers and application in the future. Prog. Geogr. 2012, 31, 667–675. [Google Scholar]
  26. Kwan, M.-P.; Lee, J. Geovisualization of human activity patterns using 3D GIS: A time-geographic approach. Spat. Integr. Soc. Sci. 2004, 27, 721–744. [Google Scholar]
  27. Polak, J.; Jones, P. The acquisition of pre-trip information: A stated preference approach. Transp. Res. Part C Emerg. Technol. 1993, 20, 179–198. [Google Scholar] [CrossRef]
  28. Che, Q.; Duan, X.; Guo, Y.; Wang, L.; Cao, Y. Urban spatial expansion process, pattern and mechanism in Yangtze River Delta. Acta Geogr. Sin. 2011, 66, 446–456. [Google Scholar]
  29. Graham, M.; Shelton, T. Geography and the future of big data, big data and the future of geography. Dialogues Hum. Geogr. 2013, 3, 255–261. [Google Scholar] [CrossRef] [Green Version]
  30. Gonzalez, M.C.; Hidalgo, C.A.; Barabasi, A.-L. Understanding individual human mobility patterns. Nature 2008, 453, 779. [Google Scholar] [CrossRef]
  31. Song, C.; Qu, Z.; Blumm, N.; Barabási, A.-L. Limits of predictability in human mobility. Science 2010, 327, 1018–1021. [Google Scholar] [CrossRef] [Green Version]
  32. Zhu, X. GIS and urban mining. Resources 2014, 3, 235–247. [Google Scholar] [CrossRef]
  33. Yuan, J.; Zheng, Y.; Xie, X. Discovering regions of different functions in a city using human mobility and POIs. In Proceedings of the 18th ACM SIGKDD International Conference on Knowledge Discovery and Data Mining, Beijing, China, 12–16 August 2012; pp. 186–194. [Google Scholar]
  34. Wesolowski, A.; Qureshi, T.; Boni, M.F.; Sundsøy, P.R.; Johansson, M.A.; Rasheed, S.B.; Engø-Monsen, K.; Buckee, C.O. Impact of human mobility on the emergence of dengue epidemics in Pakistan. Proc. Natl. Acad. Sci. USA 2015, 112, 11887–11892. [Google Scholar] [CrossRef] [PubMed] [Green Version]
  35. Pappalardo, L.; Simini, F.; Rinzivillo, S.; Pedreschi, D.; Giannotti, F.; Barabási, A.-L. Returners and explorers dichotomy in human mobility. Nat. Commun. 2015, 6, 8166. [Google Scholar] [CrossRef] [PubMed] [Green Version]
  36. Fan, C.; Liu, Y.; Huang, J.; Rong, Z.; Zhou, T. Correlation between social proximity and mobility similarity. Sci. Rep. 2017, 7, 11975. [Google Scholar] [CrossRef] [Green Version]
  37. Chen, H.; Chiang, R.H.; Storey, V.C. Business intelligence and analytics: From big data to big impact. MIS Q. 2012, 36, 1165–1188. [Google Scholar] [CrossRef]
  38. Wixom, B.; Watson, H. The BI-based organization. Int. J. Bus. Intell. Res. 2010, 1, 13–28. [Google Scholar] [CrossRef]
  39. Wieder, B.; Ossimitz, M.-L. The impact of Business Intelligence on the quality of decision making—A mediation model. Procedia Comput. Sci. 2015, 64, 1163–1171. [Google Scholar] [CrossRef] [Green Version]
  40. Grublješič, T.; Jaklič, J. Conceptualization of the business intelligence extended use model. J. Comput. Inf. Syst. 2015, 55, 72–82. [Google Scholar] [CrossRef]
  41. Yoon, T.E.; Ghosh, B.; Jeong, B.-K. User acceptance of business intelligence (BI) application: Technology, individual difference, social influence, and situational constraints. In Proceedings of the 47th Hawaii International Conference on System Sciences, Waikoloa, HI, USA, 6–9 January 2014; pp. 3758–3766. [Google Scholar]
  42. Clark, T.D.; Jones, M.C.; Armstrong, C.P. The dynamic structure of management support systems: Theory development, research focus, and direction. MIS Q. 2007, 31, 579–615. [Google Scholar] [CrossRef]
  43. Bach, M.P.; Čeljo, A.; Zoroja, J. Technology acceptance model for business intelligence systems: Preliminary research. Procedia Comput. Sci. 2016, 100, 995–1001. [Google Scholar] [CrossRef] [Green Version]
  44. Singh, Y.S.; Singh, Y.K.; Devi, N.S.; Singh, Y.J. Easy designing steps of a local data warehouse for possible analytical data processing. Adbu J. Eng. Technol. 2019, 8. [Google Scholar]
  45. Santos, V.; Silva, R.; Belo, O. Towards a low cost ETL system. Int. J. Database Manag. Syst. 2014, 6, 67. [Google Scholar] [CrossRef]
  46. Cheng, C.; Jain, R.; van den Berg, E. Location prediction algorithms for mobile wireless systems. In Proceedings of Wireless Internet Handbook; ACM: New York, NY, USA, 2003; pp. 245–263. [Google Scholar]
  47. Cho, E.; Myers, S.A.; Leskovec, J. Friendship and mobility: User movement in location-based social networks. In Proceedings of the 17th ACM SIGKDD International Conference on Knowledge Discovery and Data Mining, San Diego, CA, USA, 12 August 2011; pp. 1082–1090. [Google Scholar]
  48. Gao, H.; Tang, J.; Liu, H. Exploring social-historical ties on location-based social networks. In Proceedings of the Sixth International AAAI Conference on Weblogs and Social Media, Dublin, Ireland, 4–7 June 2012. [Google Scholar]
  49. Lindqvist, J.; Cranshaw, J.; Wiese, J.; Hong, J.; Zimmerman, J. I’m the mayor of my house: Examining why people use foursquare-a social-driven location sharing application. In Proceedings of the SIGCHI Conference on Human Factors in Computing Systems, Vancouver, BC, Canada, 7 May 2011; pp. 2409–2418. [Google Scholar]
  50. Scellato, S.; Noulas, A.; Lambiotte, R.; Mascolo, C. Socio-spatial properties of online location-based social networks. In Proceedings of the Fifth International AAAI Conference on Weblogs and Social Media, Barcelona, Spain, 17–21 July 2011. [Google Scholar]
  51. Zhang, J.-D.; Chow, C.-Y. iGSLR: Personalized geo-social location recommendation: A kernel density estimation approach. In Proceedings of the 21st ACM SIGSPATIAL International Conference on Advances in Geographic Information Systems, Orlando, FL, USA, 5–8 November 2013; pp. 334–343. [Google Scholar]
  52. Colombo, G.B.; Chorley, M.J.; Williams, M.J.; Allen, S.M.; Whitaker, R.M. You are where you eat: Foursquare checkins as indicators of human mobility and behaviour. In Proceedings of the 2012 IEEE International Conference on Pervasive Computing and Communications Workshops, Lugano, Switzerland, 19–23 March 2012; pp. 217–222. [Google Scholar]
  53. Li, Y.; Steiner, M.; Wang, L.; Zhang, Z.-L.; Bao, J. Exploring venue popularity in foursquare. In Proceedings of the 2013 IEEE INFOCOM, Turin, Italy, 14–19 April 2013; pp. 3357–3362. [Google Scholar]
  54. Lin, S.; Xie, R.; Xie, Q.; Zhao, H.; Chen, Y. Understanding user activity patterns of the swarm app: A data-driven study. In Proceedings of the 2017 ACM International Joint Conference on Pervasive and Ubiquitous Computing and Proceedings of the 2017 ACM International Symposium on Wearable Computers; ACM: New York, NY, USA, 2017; pp. 125–128. [Google Scholar]
  55. Shi, B.; Zhao, J.; Chen, P.-J. Exploring urban tourism crowding in Shanghai via crowdsourcing geospatial data. Curr. Issues Tour. 2017, 20, 1186–1209. [Google Scholar] [CrossRef]
  56. Rizwan, M.; Wan, W.; Cervantes, O.; Gwiazdzinski, L. Using location-based social media data to observe check-in behavior and gender difference: Bringing weibo data into play. ISPRS Int. J. Geo-Inf. 2018, 7, 196. [Google Scholar] [CrossRef] [Green Version]
  57. Rizwan, M.; Wan, W. Big data analysis to observe check-in behavior using location-based social media data. Information 2018, 9, 257. [Google Scholar] [CrossRef] [Green Version]
  58. Rizwan, M.; Mahmood, S.; Wanggen, W.; Ali, S. Location based social media data analysis for observing check-in behavior and city rhythm in Shanghai. In Proceedings of the 4th International Conference on Smart and Sustainable City (ICSSC 2017), Shanghai, China, 5–6 June 2017. [Google Scholar]
  59. Wu, C.; Ye, X.; Ren, F.; Du, Q.J.C. Check-in behaviour and spatio-temporal vibrancy: An exploratory analysis in Shenzhen, China. Cities 2018, 77, 104–116. [Google Scholar] [CrossRef]
  60. Wu, J.; Li, J.; Ma, Y.J.I.I.J.o.G.-I. A comparative study of spatial and temporal preferences for waterfronts in Wuhan based on gender differences in check-in behavior. ISPRS Int. J. Geo-Inf. 2019, 8, 413. [Google Scholar] [CrossRef] [Green Version]
  61. Muhammad, R.; Zhao, Y.; Liu, F.J.S. Spatiotemporal analysis to observe gender based check-in behavior by using social media big data: A case study of Guangzhou, China. Sustainability 2019, 11, 2822. [Google Scholar] [CrossRef] [Green Version]
  62. Liu, C.Y.; Chen, J.; Li, H. Linking migrant enclave residence to employment in urban China: The case of Shanghai. J. Urban Aff. 2019, 41, 189–205. [Google Scholar] [CrossRef] [Green Version]
  63. Zhang, Y.; Li, X.; Wang, A.; Bao, T.; Tian, S. Density and diversity of OpenStreetMap road networks in China. J. Urban Manag. 2015, 4, 135–146. [Google Scholar] [CrossRef] [Green Version]
  64. ArcGIS. How Kernel Density Works. Available online: https://pro.arcgis.com/en/pro-app/tool-reference/spatial-analyst/how-kernel-density-works.htm (accessed on 4 November 2020).
  65. Zhang, J.; Wu, L. The influence of population movements on the urban relative humidity of Beijing during the Chinese Spring Festival holiday. J. Clean. Prod. 2018, 170, 1508–1513. [Google Scholar] [CrossRef]
  66. Hasan, S.; Zhan, X.; Ukkusuri, S.V. Understanding urban human activity and mobility patterns using large-scale location-based data from online social media. In Proceedings of the 2nd ACM SIGKDD International Workshop on Urban Computing, Chicago, IL, USA, 11 August 2013; p. 6. [Google Scholar]
Figure 1. Shanghai (the study area).
Ijgi 09 00733 g001
Figure 2. Research methodology.
Ijgi 09 00733 g002
Figure 3. Check-in frequencies; (a) hourly check-in frequency; (b) weekly check-in frequency; and (c) check-in frequency for study period.
Ijgi 09 00733 g003aIjgi 09 00733 g003b
Figure 4. Venue categorization statistics.
Ijgi 09 00733 g004
Figure 5. Category-wise temporal analysis; (a) date by category; (b) time by category; and (c) weekday by category.
Ijgi 09 00733 g005
Figure 6. Overall Density of Check-ins.
Ijgi 09 00733 g006
Figure 7. Category-wise density; (a) Educational; (b) Entertainment; (c) Food; (d) General_Location; (e) Hotel; (f) Professional; (g) Residential; (h) Shopping&Services; (i) Sport; and (j) Travel.
Ijgi 09 00733 g007aIjgi 09 00733 g007b
Table 1. The sample of attributes in dataset.
User
ID
GenderCheck-in DateCheck-in TimeLocation-IDLatitudeLongitudeLocation
56xxx20f5/8/20172:23:12B2xxx9A31.29164121.31098Nanxiang_Hospital
16xxx62m4/27/201712:17:47B2xxx9331.314793121.45629Lingnan_Park
34xxx42f8/16/201615:44:45B2xxx9B31.281199121.507732Siping_Cinema
15xxx44m1/2/201715:22:32B2xxx9831.28861121.537Yanji_Library
Table 2. Attributes of categories.
CategoryNumber of Locations%Total Check-insAverage Check-ins by LocationGenderTotal Number of Users
FemaleMale
Educational253512%52,64520.7672611,948695518,902
Entertainment254719%79,47131.2018116,750796424,714
Food26754%22,7478.503551323517464981
General_Location11198%23,03320.58356528030848364
Hotel11014%16,56815.04814318925235712
Professional30307%40,52713.375257760526413,024
Residential294524%98,22133.3517819,49111,91931,410
Shopping & Services226312%62,15527.4657516,494731023,804
Sports5944%19,59032.9798330931655474
Travel13627%26,51419.46696472834698197
Publisher’s Note: MDPI stays neutral with regard to jurisdictional claims in published maps and institutional affiliations.

