Article

Correlation between Geochemical and Multispectral Patterns in an Area Severely Contaminated by Former Hg-As Mining

by
Carlos Boente
1,2,
Lorena Salgado
1,
Emilio Romero-Macías
2,
Arturo Colina
1,
Carlos A. López-Sánchez
3 and
José Luis R. Gallego
1,*
1
Environmental Biogeochemistry & Raw Materials Group and INDUROT, Campus de Mieres, University of Oviedo, C/Gonzalo Gutiérrez Quirós. S/N, 33600 Mieres, Spain
2
Department of Mining, Mechanical, Energetic and Civil Engineering, University of Huelva, 21819 Huelva, Spain
3
SMartForest Group, Department of Organisms and Systems Biology, Polytechnic School of Mieres, University of Oviedo, 36000 Mieres, Spain
*
Author to whom correspondence should be addressed.
ISPRS Int. J. Geo-Inf. 2020, 9(12), 739; https://0-doi-org.brum.beds.ac.uk/10.3390/ijgi9120739
Submission received: 24 October 2020 / Revised: 27 November 2020 / Accepted: 9 December 2020 / Published: 10 December 2020
(This article belongs to the Special Issue Integrating GIS and Remote Sensing in Soil Mapping and Modeling)

Abstract

:
In the context of soil pollution, plants suffer stress when exposed to extreme concentrations of potentially toxic elements (PTEs). The alterations to the plants caused by such stressors can be monitored by multispectral imagery in the form of vegetation indices, which can inform pollution management strategies. Here we combined geochemistry and remote sensing techniques to offer a preliminary soil pollution assessment of a vast abandoned spoil heap in the surroundings of La Soterraña mining site (Asturias, Spain). To study the soil distribution of the PTEs over time, twenty-seven soil samples were randomly collected downstream of and around the main spoil heap. Furthermore, the area was covered by an unmanned aerial vehicle (UAV) carrying a high-resolution multispectral camera with four bands (red, green, red-edge and near infrared). Multielement analysis revealed mercury and arsenic as principal pollutants. Two indices (from a database containing up to 55 indices) offered a proper correlation with the concentration of PTEs. These were: CARI2, presenting a Pearson Coefficient (PC) of 0.89 for concentrations >200 mg/kg of As; and NDVIg, PC of −0.67 for >40 mg/kg of Hg. The combined approach helps prediction of those areas susceptible to greatest pollution, thus reducing the costs of geochemical campaigns.

1. Introduction

Mining and industrial activities commonly release contaminants, which in turn affect the quality of environmental compartments [1,2]. In this regard, pollution has been reported not only in urban zones [3,4] but also in more rural or natural areas, where the quality of sensitive ecosystems is being seriously compromised [5]. Although industries are not usually located in rural areas, this is not true for mining operations as the ores of interest are commonly found in these areas. In the case of mining activities in hilly regions and subsequent waste disposal, residues are exposed to hard weathering and a challenging geomorphology. Therefore, pollutants can be widely dispersed, and the costs and uncertainties of geochemical campaigns may be very high [6].
Given these considerations and in the context of soil pollution studies, there is a need to find appropriate non-invasive approaches that reduce the cost and time required for these campaigns. Remote sensing techniques are widely used in natural environment research, such as studies on forest studies [7,8,9], relative climate change [10,11,12], topography [13,14,15,16,17], and precision agriculture [18,19], among others. Of note, in recent years, some studies have combined techniques of remote sensing and geochemistry, especially in areas affected by heavy metal pollution, either with satellites or high-altitude manned aircrafts [20,21,22,23] or unmanned aerial vehicles (UAVs) [24,25,26,27,28]. Remote sensing uses electromagnetic radiation to obtain information about an object or phenomenon without involving physical contact [29]. Data are gathered through measurements of electromagnetic reflectance and different frequencies [30]. Within this discipline, UAVs are one of the supports used for the development of remote sensing tools for soil applications, with most of the required information being collected by means of optical sensors, which have also been recently used in geological applications [31,32].
To date, studies addressing the electromagnetic spectrum have been based on the use of proximal or airborne sensors. However, several authors have recently used proximal aerial sensors, also known as UAVs, for this purpose, due to the advantages they present over satellite, and high-altitude manned aircrafts, such as short revist time and high spatial resolution [33]. This approach has also found applications in soil contamination research [33,34]. The direct study of contaminants in soil through remote sensing is complex; therefore, indirect techniques are used, among which vegetation as a bioindicator of soil condition stands out [30]. One of the most common ways to analyze vegetation with multispectral remote sensors is through vegetation indices, which are simple algebraic operations between the different bands of the electromagnetic spectrum [35,36,37]. In this regard, Shabou et al. [38] used the NDVI and MIR indices over test fields to achieve bare soil measurements from satellite images.
With respect to target pollutants, metal mining is a frequent source of potentially toxic elements (PTEs). These elements are characterized not only by their toxicity, but also by their capacity to bioaccumulate, biomagnify and persist in the food chain [39], giving rise to multiple health and environmental problems [40]. Among PTEs, mercury (Hg) is highly toxic to organisms, even at very low concentrations, especially when present in methyl-Hg form [41]. In this context, in 2005, the EU promoted an initiative to reduce the emissions of this element. Later, in 2017, the Minamata Convention, a global treaty to regulate the emissions and distribution of this toxic element, was approved. This treaty encourages countries to reduce and monitor the different sources of Hg pollution [42]. Since then, various studies have addressed the environmental impact of Hg mining [43,44,45].
Historically, Spain has been one of the world’s largest producers of Hg, especially the Almadén district [46], the largest Hg deposit in the world. In the case of Asturias (NW Spain), numerous cinnabar deposits have been mined, the remains of which are now scattered throughout the region mainly as spoil heaps enriched in Hg-As waste. The impact of some of these mining operations has been examined in detail. As shown in the studies carried out at the mines of El Terronal [47] and Caunedo [43], and at the Muñón-Cimero complex (Soterraña), which is the focus of the present study [48,49]. Here we describe an innovative approach that combines a classical geochemical campaign and a UAV-based multispectral airborne camera to monitor the impact of Hg-As spoil heaps. The main objective of this study is a first approach to the possibility of evaluating As or Hg levels in soil polluted areas through low-cost multispectral sensors.

2. Materials and Methods

In order to summarize and synthetize the procedures followed, the different steps carried out along the study (data collection, geochemistry and remote sensing techniques, statistical analysis, etc.) are shown in Figure 1.

2.1. Context of the Study Area: Activity in La Soterraña, Geology and Vegetation

The main activity of the Hg mountain mine of La Soterraña (Asturias, Spain. Figure 2) took place between the 1940s and the mid-1970s, the latter decade marking the crisis of the Hg sector. During its time of operation, ore mining and processing were carried out onsite. The room and pillar mining method was used on a low temperature hydrothermal epigenetic type deposit, in which the main mineral paragenesis comprised cinnabar, realgar and oropiment, with important deposits of arsenopyrite, marcasite and pyrite hosted in fractured limestones and shales [48]. Once the materials had been extracted, the ore was treated at La Soterraña mine itself, together with the material of other smaller mines located in the province. For this purpose, rotary kilns, condensers and coolers were used, as well as other equipment typical of Hg metallurgy.
The tailings generated by ore mining and processing were indiscriminately dumped in a spoil heap, which is the principal focus of pollution. At present, the mechanical dispersion of this material is the main cause of pollutant distribution in the surrounding soils, in addition to the processes of oxidation and leaching. This main spoil heap is located over layers of limestone and shale, along an average slope of 30°. There is virtually no vegetation on the heap due to the high concentrations of metals and its steep slope. Downstream of the heap, herbaceous colonies of Centaurea nigra and Equisetum telmateia predominate. These species are of special interest due to their capacity to bioaccumulate Hg and As [49,50]. In fact, E. telmateia and C. nigra showed notable Bioaccumulation Indices (BAC); BACAs = 14.39 and BACHg = 76.95, and BACAs = 2.30 and BACHg = 4.84 respectively [51]. In the surroundings of the spoil heap, there are also notable tree species, including Betula celtibérica, Quercus robur and Castanea sativa.

2.2. UAV Flight, Sampling, Preparation and Chemical Determinations

The first step consisted of designing the coverage of UAV flights. For the purpose of this study, we selected a surface area of 25 ha downstream of the spoil heap (Figure 1), which is the area most affected by erosion and washing by surface runoff.
The UAV flight was carried out with a BlueGrass Multiespectal model UAV (Parrot SA, Paris, France) which incorporates a Parrot Sequoia plus camera. This camera includes a multispectral sensor, with four spectral bands: green, red, red edge and near infrared, and a sunlight sensor, which provides absolute reflectance measurements without the need of calibration. The use of this camera with the software PIX4D Mapper (Pix4D S.A. Prilly, Switzerland) allowed to obtain the optimal results, as reflected by other authors [52,53,54]. With this procedure, a reduction in the time of the photogrammetric survey and data processing is achieved. The photogrammetric survey is carried out with a transversal and longitudinal reception of 70%, due to the strong orography, and with an average height of 90 m. The date of the flight was chosen based on the vegetation conditions during the early spring of 2019 in order to obtain radiometric information of the herbaceous vegetation when younger; in addition, in this period of the year soil was not affected by extreme weather conditions such as droughts, or alterations due to agro-livestock activities such as mowing or cattle grazing.
In turn, a geochemical campaign composed of a total of 27 soil samples was designed. The samples were gathered randomly. Ten of these samples were collected within the limits of the area covered by the UAV flight (Figure 2), while the others were gathered outside this area in order to assess the degree of pollution in the surroundings for future research purposes. Each sample comprised five increments of the first 20 cm of the soil by means of a Dutch Edelman probe, forming a 1-m edge square and its central point to improve representativeness.
Sample preparation started with in-situ sieving of the soil through 20-mm mesh to remove large particles. The finer fraction was then placed in sterilized plastic bags and stored at 4 °C until being taken to the laboratory. Here, the fractions were air-dried at room temperature to prevent the evaporation of Hg and quartered to maintain sample representativeness. Finally, for each sample, 1 g was ground in an agate mortar to a particle size of < 100 μm and sent to an ISO 9002 and ISO-17025 accredited laboratory in Vancouver (BC, Canada). The concentrations of the following PTEs were determined after aqua regia extraction and ICP-MS (in parenthesis, their respective detection limits): As (0.5 ppm); Cd (0.1 ppm); Co (0.1 ppm); Cr (1 ppm); Cu (0.2 ppm); Hg (0.01 ppm); Mn (1 ppm); Mo (0.1 ppm); Ni (0.1 ppm); Pb (0.1 ppm); Sb (0.1 ppm); Tl (0.1 ppm); V (2 ppm); and Zn (1 ppm).

2.3. Statistical Analysis and Graphical Representations

The geochemical data were analyzed by means of descriptive statistics and compared with the official Risk-Based Soil Screening Levels (RBSSLs) [55]. Moreover, Pearson’s Coefficient between elements was also calculated. These operations allowed us to identify the main pollutants in the study area. Additionally, the concentration of As and Hg for the whole area was mapped by means of ordinary kriging, applying log-transformation to improve normality [56]. Apart from providing an estimation of the distribution of elements in the soil, the interpolations are also useful to establish graphical comparisons between distribution and the maps showing the vegetation indices. All map representations and graphical information were treated through Geographical Information Systems (GIS), using a licensed copy of ArcMap version 10.2.1. (ESRI, Redlands, CA, USA).

2.4. Multi-Spectral Analysis Tools: Vegetation Index

The multispectral images used were obtained from a Sequoia + multispectral camera mounted on a UAV Parrot Bluegrass Fields. The camera had a spectral resolution of four bands—green, (550 nm ± 40 nm), red (660 nm ± 40 nm), red edge (735 nm ± 10 nm) and near infrared (790 ± 40 nm)—all with a high spatial resolution of 16 cm.
The first step of multispectral analysis was the achievement of a raster dataset from each band, which was carried out with software PIX4D Mapper using all photograms per each spectral resolution. The second step consisted in obtaining a new raster dataset with information derived from an algebraic operation between the bands obtained in first step. These new raster datasets are known as vegetation indices, due to their widespread use for determining vegetation status. Up to a total of 55 different vegetation indices were tested with the aim to obtain the best correlations.
The list of the 55 vegetation indices used was extracted from a remote sensing index database [57]. Initially all of them were studied, adapted to the available data and tested. Those found with the greatest correlation with the available analytical data were the Chlorophyll Absorption Ratio Index 2 (CARI-2), and the Normalized Difference Vegetation Index-green (NDVIg).
The CARI2 index was defined by Kim [58] to study leaf area index (LAI), absorbed photosynthetically active radiation, and primary production. It is described by Equation (1):
C A R I 2 = | ( a · | R e d | + | R e d | + b ) | a 2 + 1 · R e d   E d g e R e d
where:
a = ( [ R e d   E d g e ] [ G r e e n ] ) / 150 b = [ G r e e n ] ( a   · [ G r e e n ] )
In contrast, NDVIg is a modification of the classical NDVI index that uses absorbance of green light (550 nm), which is more sensitive to a wide range of chlorophyll-a concentrations than red light [56]. It is defined using Equation (2):
N D V I g = N e a r   I n f r a r e d G r e e n N e a r   I n f r a r e d + G r e e n

3. Results and Discussion

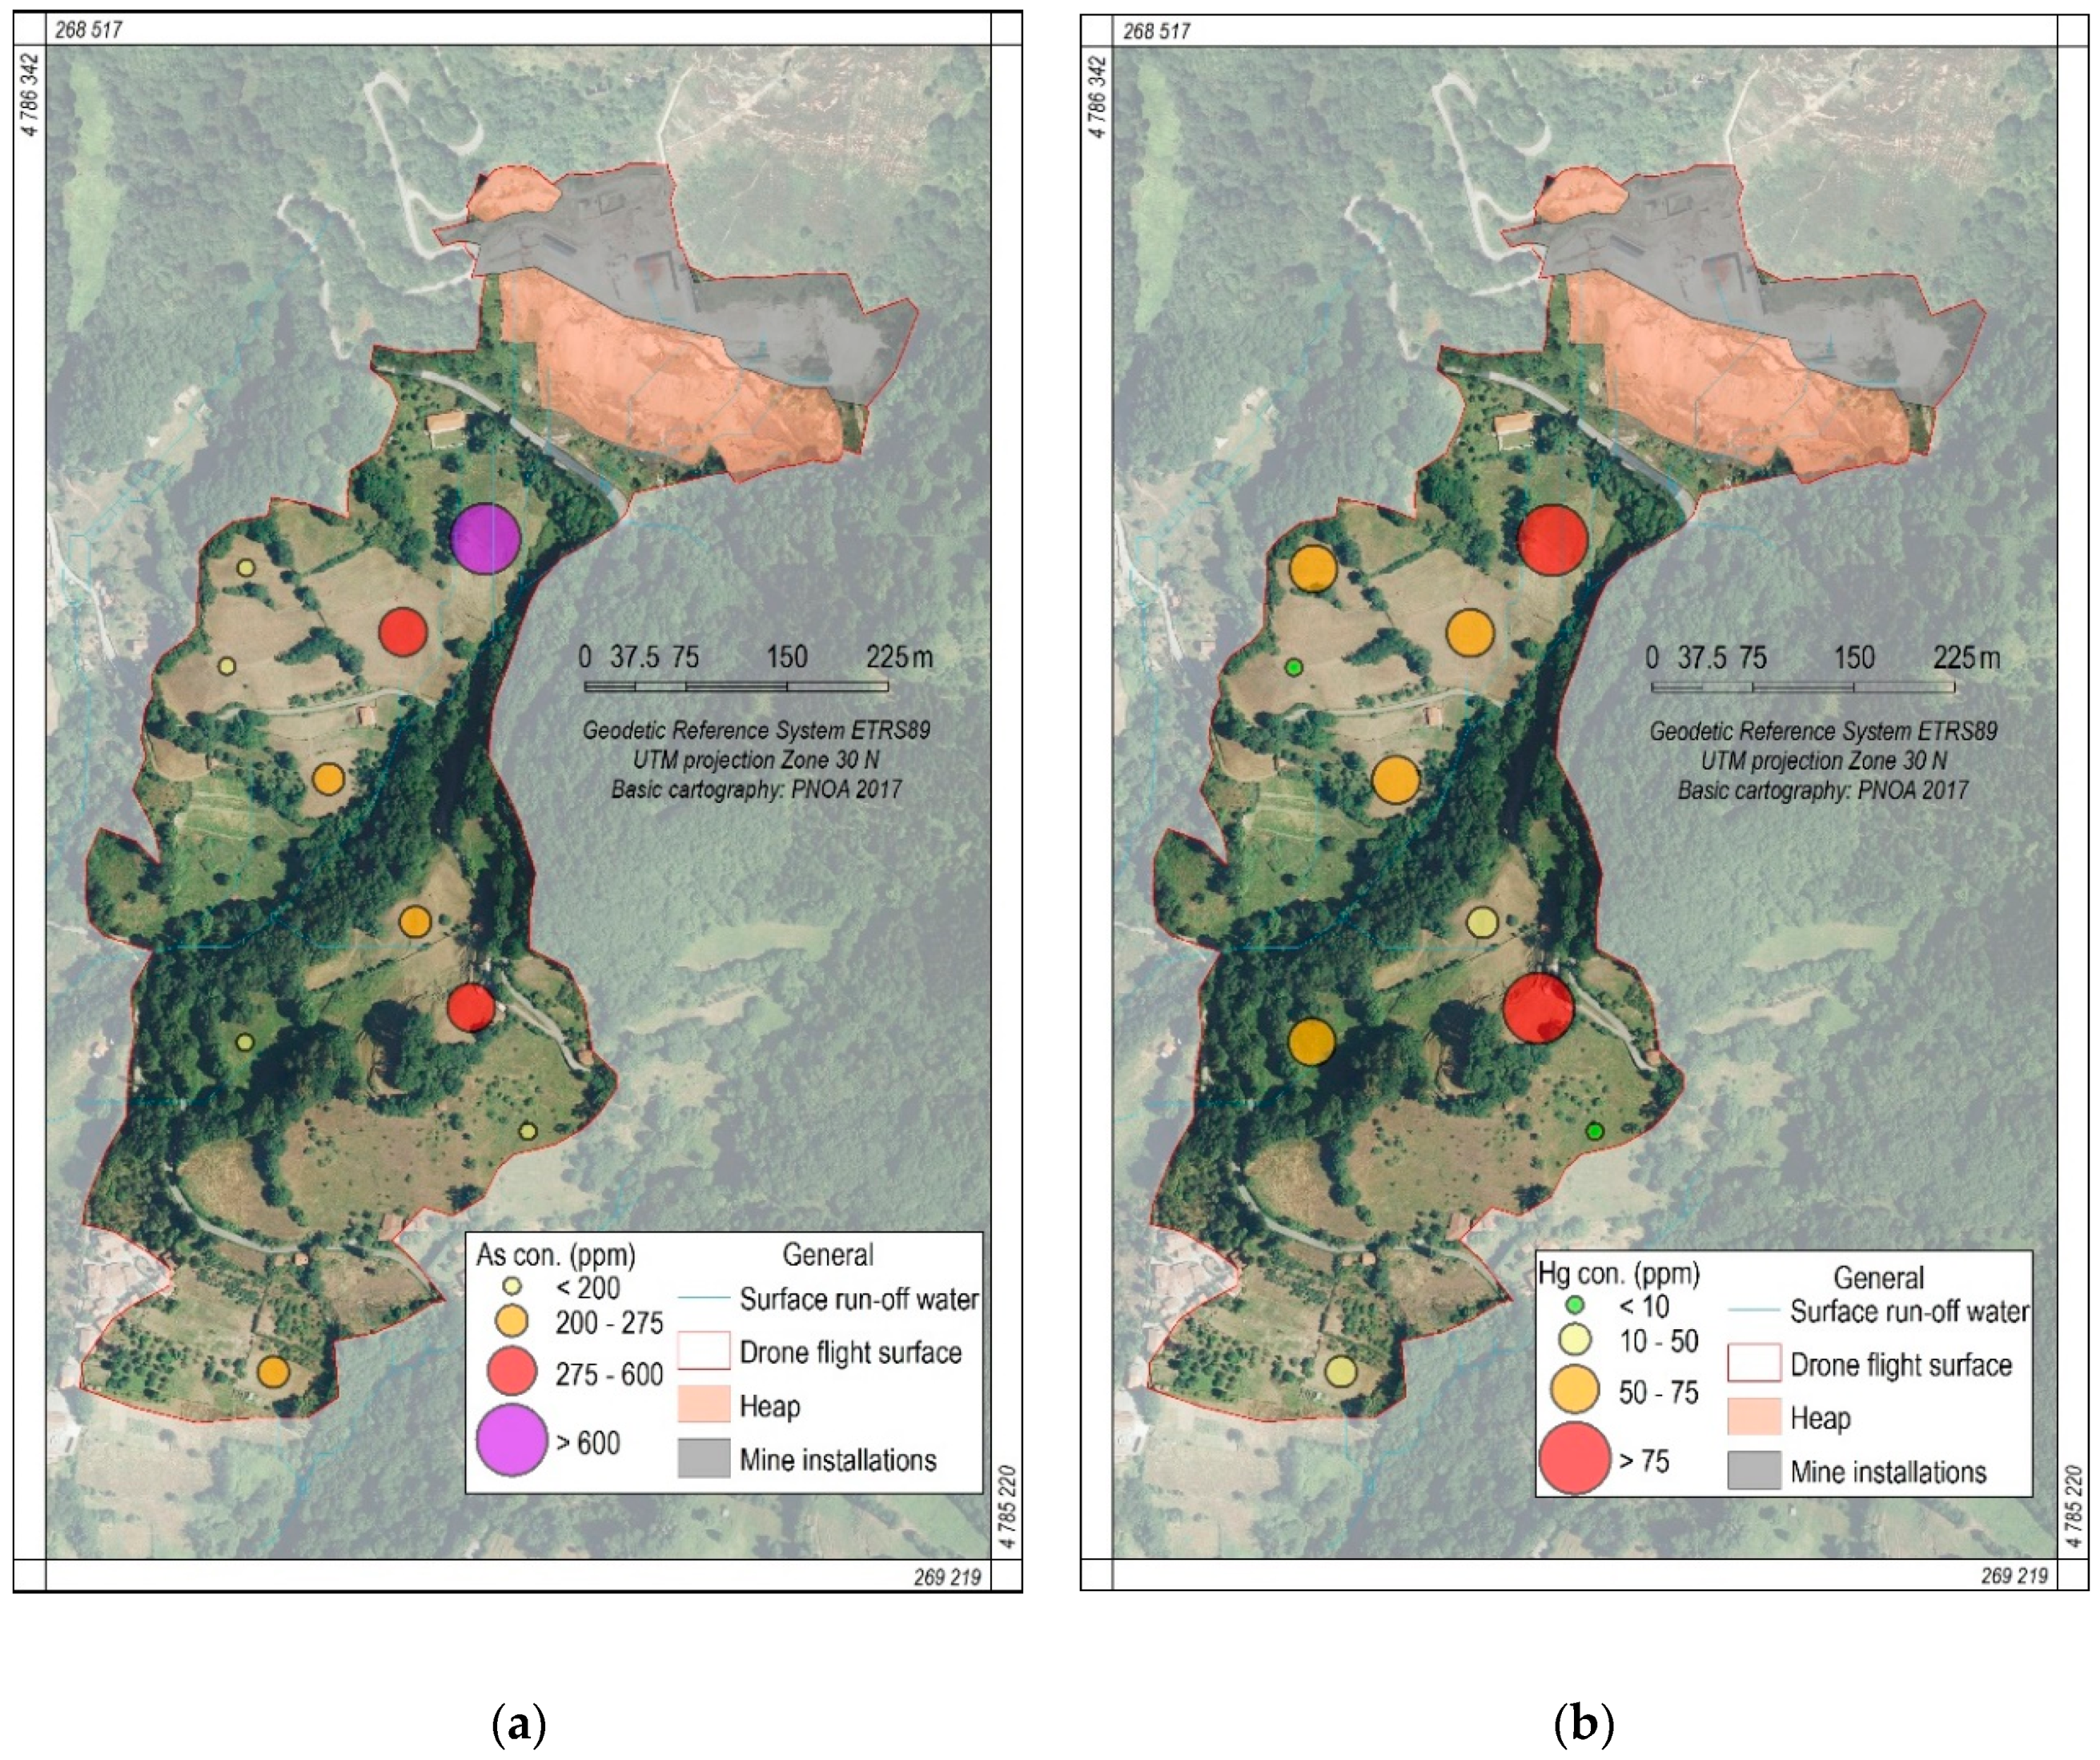
3.1. Geochemical Characterization

A previous study by Fernández et al. [59] reported maximum total concentrations of 23,000 mg/kg of As and 6000 mg/kg of Hg, corresponding to the mining waste of the spoil heap. As a consequence of spoil heap weathering, the soils of the area showed extremely high concentrations of both elements, as reflected in the descriptive statistics (Table 1) corresponding to the chemical analyses of the 27 soil samples taken downstream of the heap. Table 1 also includes the official Risk-Based Soil Screening Levels (RBSSLs) or threshold values in force for the use of soil [55].
The differences between the mean and the median, or the high coefficients of variation (CV), strongly suggest Hg and As as the main pollutants in the area as they present irregular distributions. All the samples exceeded the RBSSL for Hg (1 mg/kg) and As (40 mg/kg) [46], values that correspond to the category “Other Uses”, to which the soil of study currently belongs because it is located in agricultural areas dedicated to pasture or crop cultivation.
Furthermore, most of the samples were also above the soil-chemical background levels of the area determined in pristine areas by Loredo et al. (4.18 mg/kg for Hg and 39 mg/kg for As) [48]. Although the enrichment of these elements was consistent with the mineral paragenesis of the zone described in Section 2.1, the extremely high concentrations detected revealed a gradual degradation of the spoil heap over time due to weathering processes. These are attributable mainly to water erosion by surface and subsurface runoff, which circulates throughout the heap during the months of flooding (Figure 2 and Figure 3). In this regard, higher concentrations of Hg and As were observed in areas close to the runoff, thereby contributing to the dispersion of these pollutants downstream.
With respect to the rest of the PTEs, Sb also appeared in an anomalous form, although to a lesser extent than Hg and As, as revealed by its range or high CV, although the similarity between average and median reveals more normality of the Sb distribution. In this regard, Sb appeared to be linked to As (metalloids usually geochemically associated) [60]. The rest of the PTEs presented stable values and were not hazardous for the environment in this case. The highest concentrations of As and Hg were recorded within the UAV flight zone and in the two samples to the north, near the mining area (Figure 3). Outside the area covered by the UAV, although the concentrations of both contaminants were substantially lower for most samples, they continued to be high. Given this observation, it would be advisable for future studies to collect more samples outside this area in order to better delimit the extent of contamination. Finally, bivariate correlations revealed high correlations between Hg and Cr (0.777), V (0.736) and Pb (0.697). In contrast, As showed an almost full correlation only with Sb (0.991). Of note, there was a low correlation between As-Hg (0.270), reflecting independence between variables. This observation can be explained by the highly irregular distribution of As and Hg and their very different behaviors.

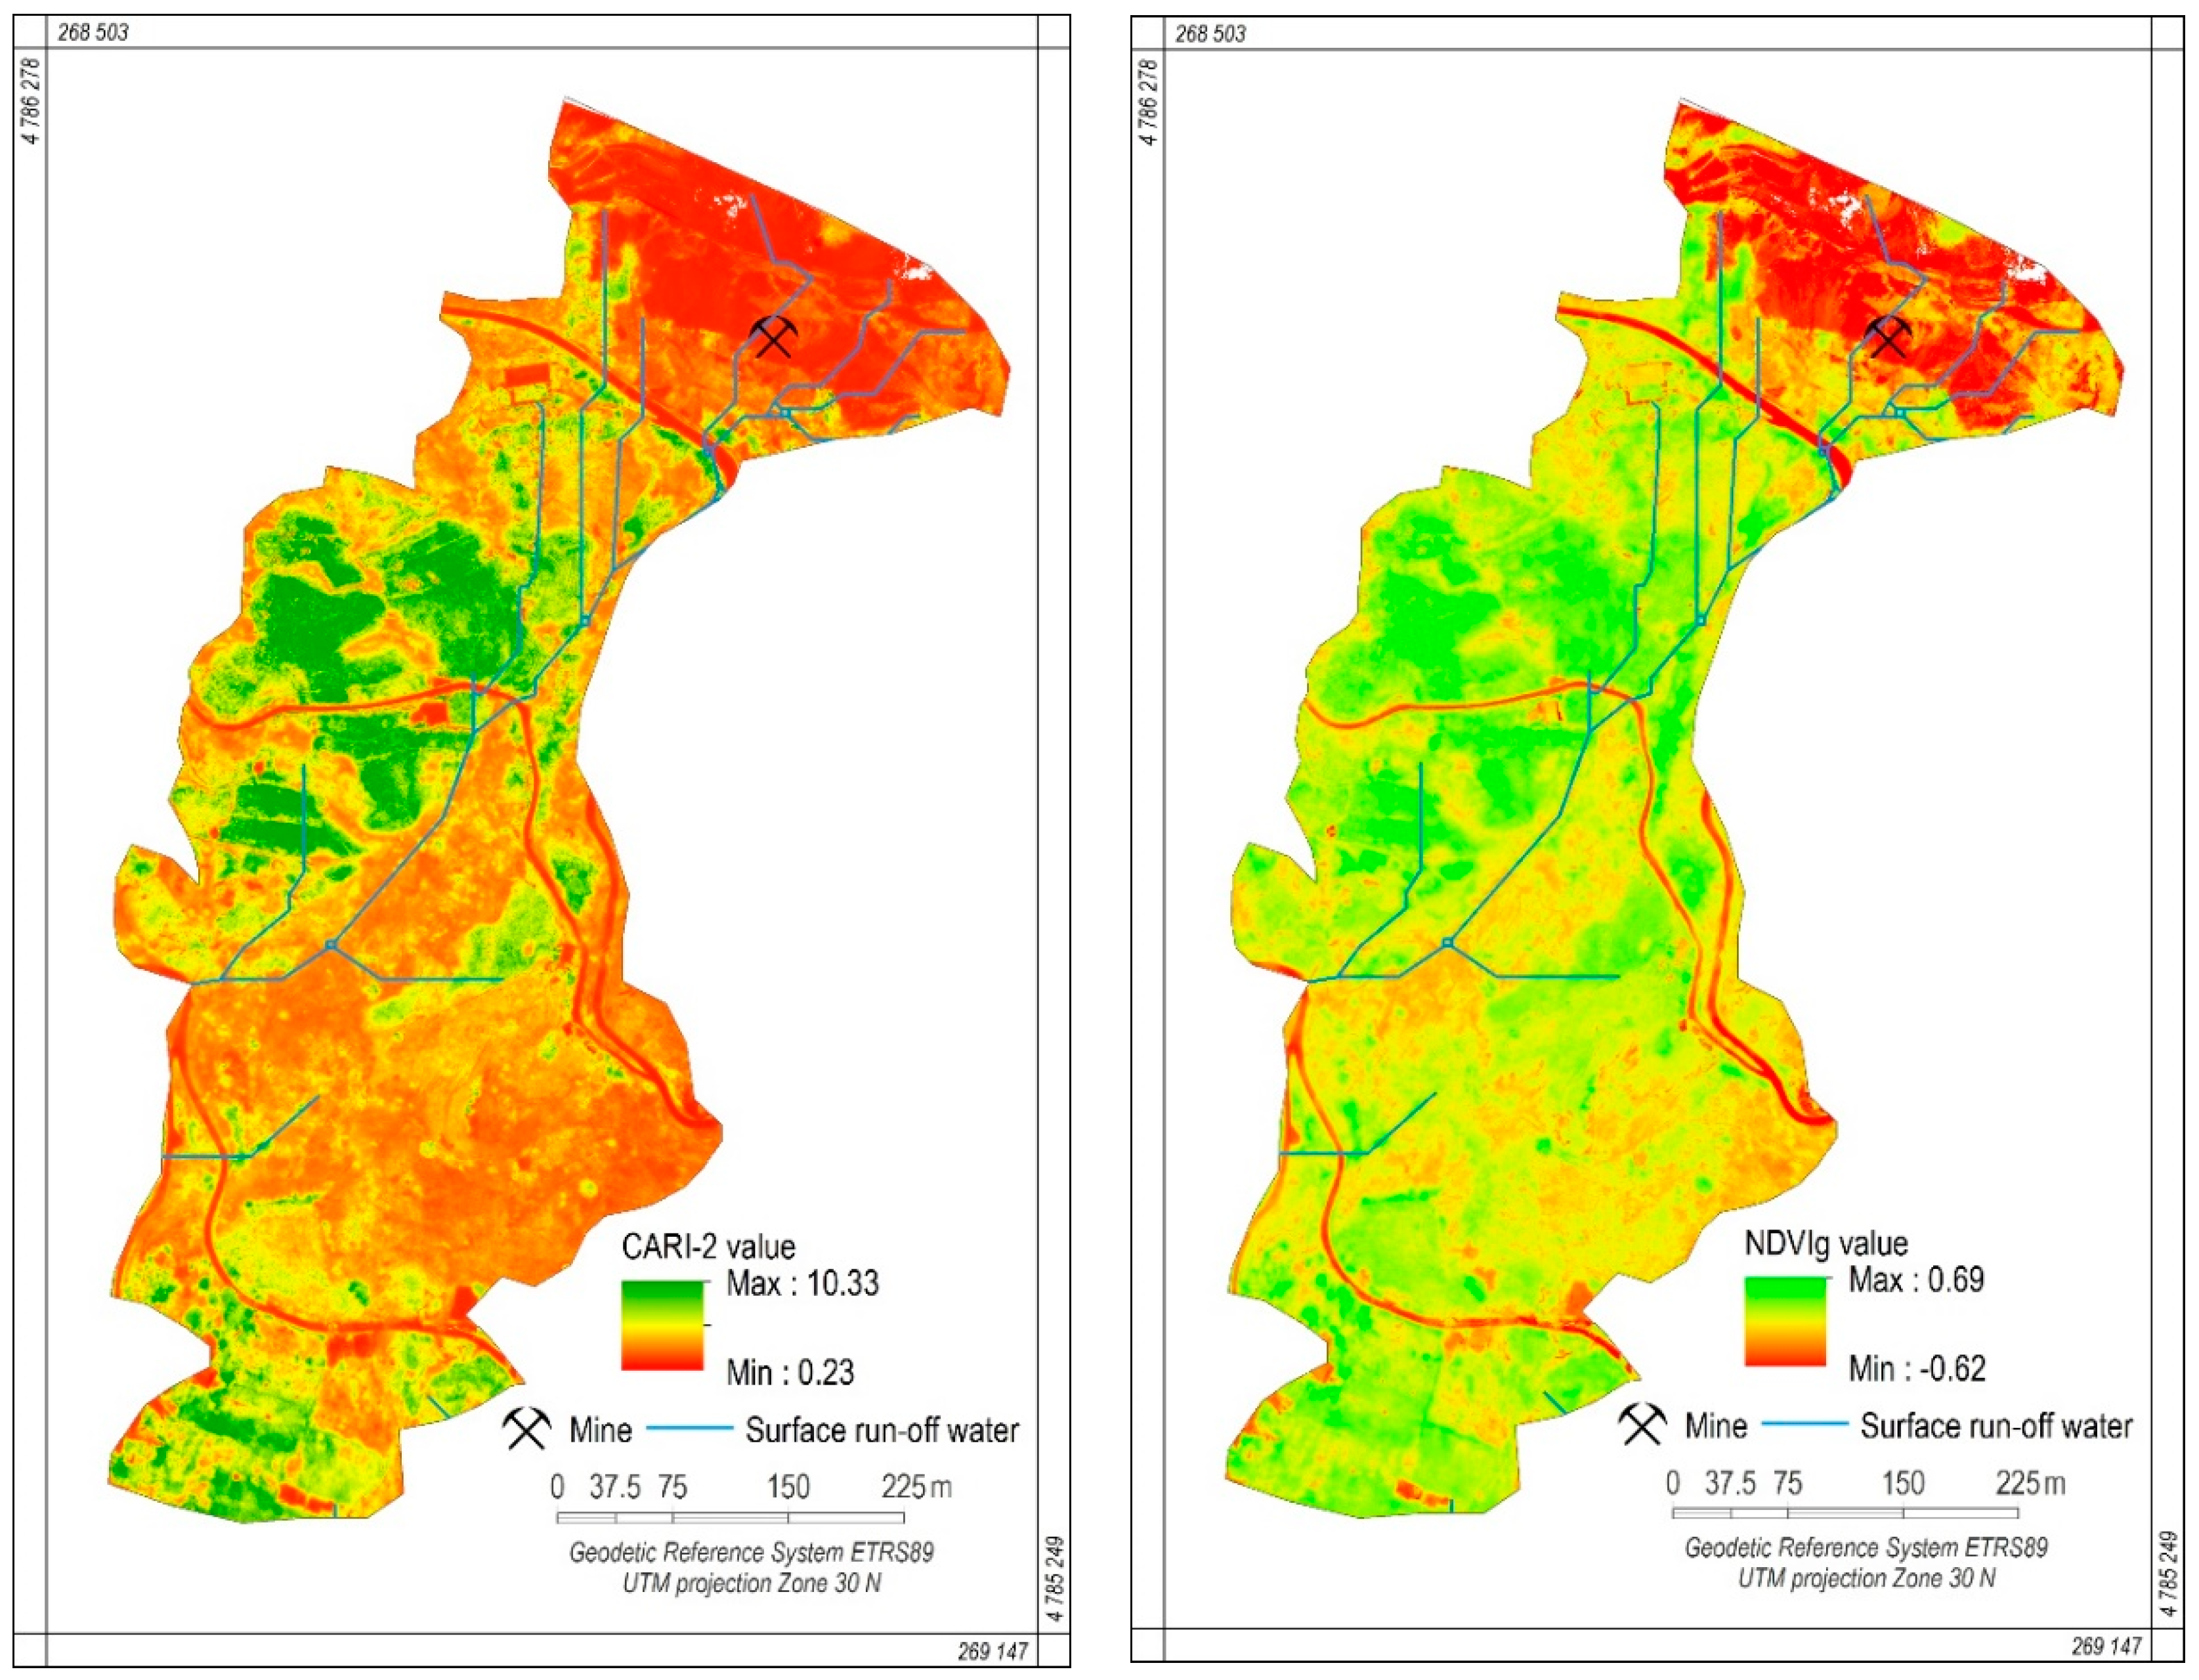
3.2. Mutispectral Analysis

The results presented in Section 3.1 revealed the severe contamination present within the UAV flight area, the main contaminants being Hg and As. Therefore, it is feasible that such high concentrations affect the physiology of plants in the zone. Of the 55 indices tested, those with the greatest correlation with the available analytical data were CARI-2 and NDVIg for As and Hg, respectively. These indices are shown in Figure 4.
The correlations between the concentrations of Hg and As obtained by chemical analysis and the vegetation indices were established by means of Pearson’s coefficient and are shown in Figure 5. The results obtained showed that the higher the concentration, the higher the correlation, in absolute value. In the case of As, it was revealed a significant correlation starting with Pearson value’s of 0.732 (corresponding to concentrations above 117 ppm) up to 0.970 (close to 400 ppm). Hg also showed a significant correlation above 40 ppm (−0.670 Pearson coefficient), up to −0.730 (70 ppm).
The CARI-2 index correlated better with geochemical values for As, maintaining a logarithmic (increasing) correlation that reached stabilization at 200 ppm (Pearson’s Coef. = 0.89). The positive correlation reflects a direct relationship, that is, the higher the concentration, the greater the stress present in plants. However, when the concentration reached 200 ppm, the plants reach the limit of tolerance for the vegetation described in Section 2.1.
Similarly, the NDVIg index presented an optimal correlation with Hg by means of an exponential (decreasing) function whose stabilization was achieved at 40 ppm, a concentration under the industrial limit and above the limits for residential and recreational uses, but unlike As, with a negative correlation (Pearson’s Coef. = −0.67). This implies that the higher the concentration, the lower the value of the NDVIg index. This finding allowed us to identify a direct alteration of the vegetation with increasing concentrations of Hg, since the definition of the index itself shows that the lower its value, the less photosynthetic activity occurs [61].
In any case, it can be said that the results of the vegetation indices presented high reliability for As and acceptable reliability for Hg at the points where the concentrations of these two pollutants were very high. All things considered, the mapping of the CARI2 and NDVIg indices (Figure 4) allows prediction of where the concentrations of As and Hg, respectively, will be highest, thus reducing the costs of sampling campaigns.

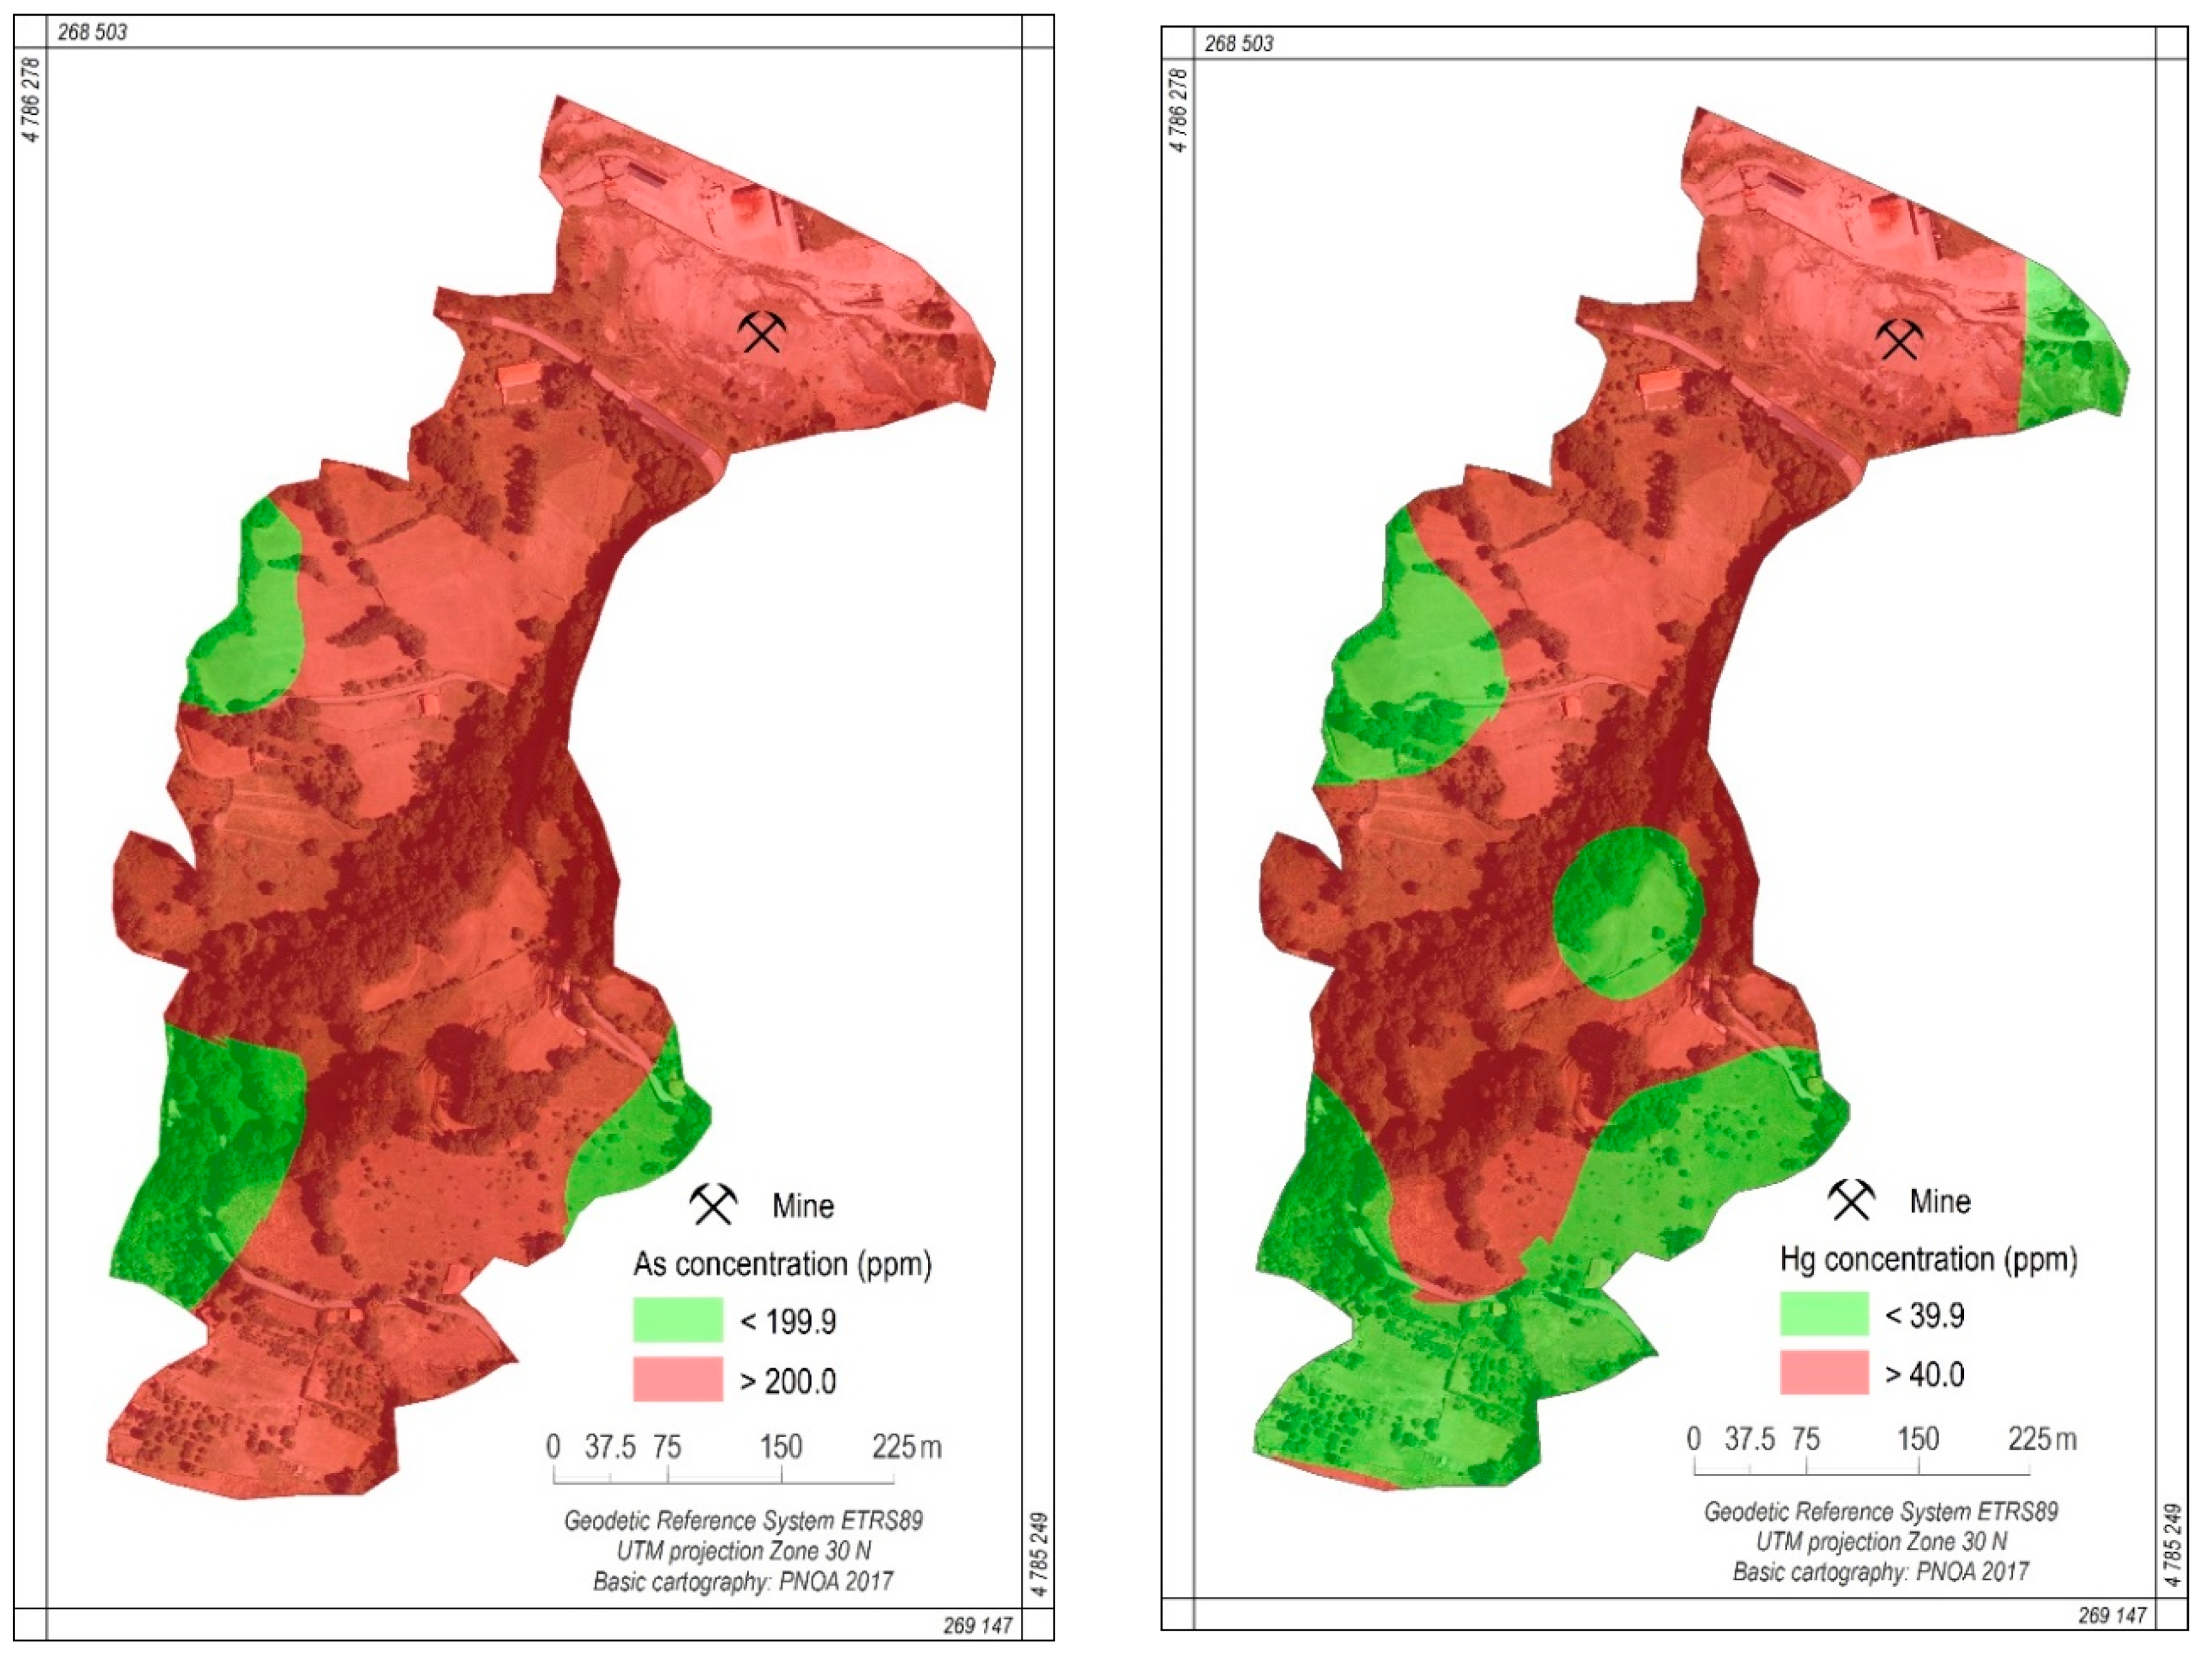
3.3. Geostatistical Analysis

Figure 6 shows the geostatistical interpolations obtained by ordinary kriging. As anticipated in the statistical analysis, the distribution of As and Hg was highly irregular along the UAV flight area. Extremely polluted zones near the spoil heap alternated with others downstream presenting lower concentrations of these heavy metals, although always exceeding RBSSLs. However, for academic purposes, such alternation is not necessarily negative as the differences in concentrations allowed us to test the reliability of the vegetation indices at a range of concentrations.
Our results also revealed that Hg showed less mobility than As in soils, a property that was addressed in previous studies [62,63,64]. This was appreciable since changes in concentration were far greater for Hg, or in other words, the bullseye was more easily identifiable. The lower mobility of Hg also contributes to explaining why Pearson’s Coefficient was lower for this heavy metal. In this case, low normality hampered the estimation. Nevertheless, even under this circumstance, the correlation obtained was acceptable.

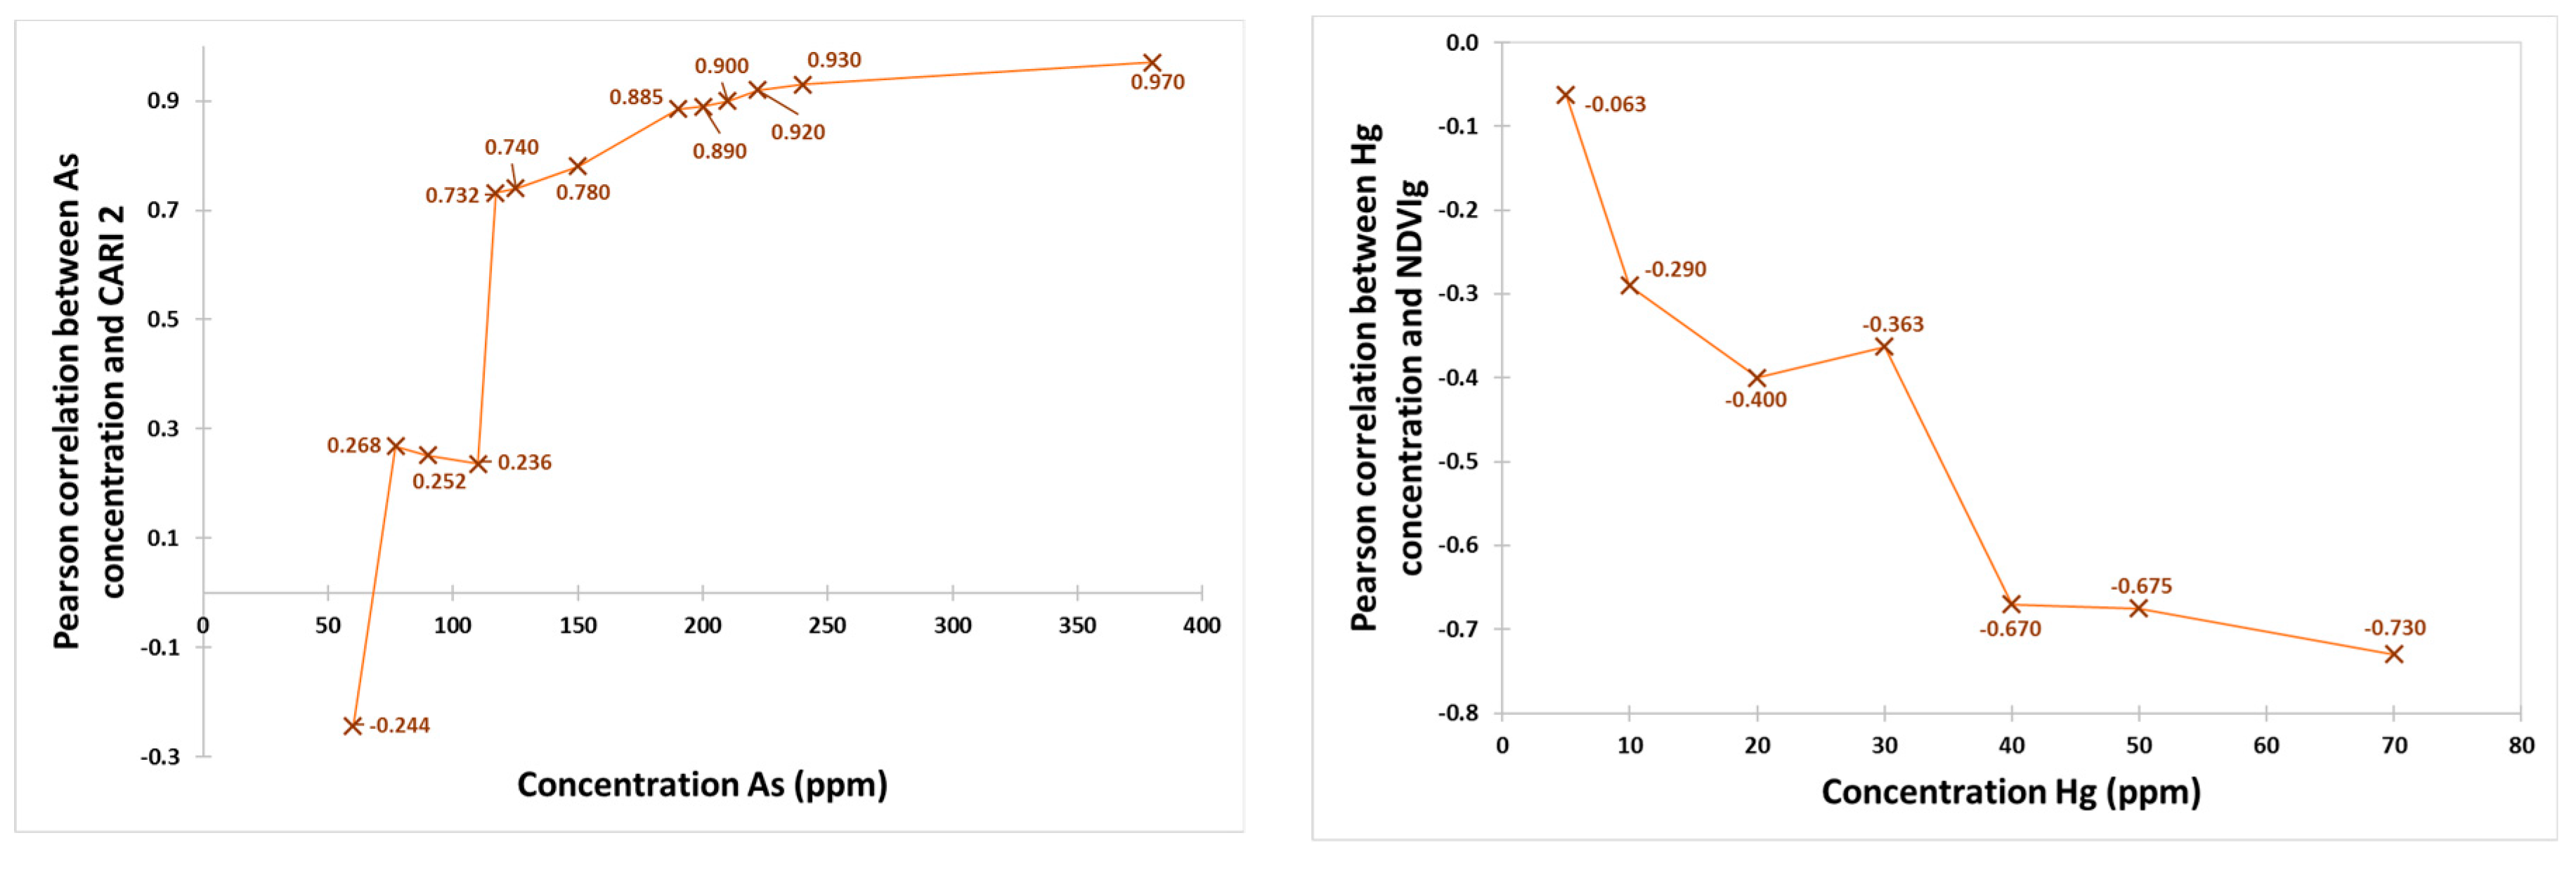
3.4. Synergy between Multispectral Data and Geostatistical Analysis

Figure 7 aims to synergize the geostatistical results (Figure 6) and the multispectral analysis (Figure 4). Areas in red correspond to concentrations of As and Hg exceeding the thresholds described in the previous section (>200 mg/kg for As and >40 mg/kg for Hg). Our findings imply that, in these locations, it is possible to use multispectral techniques to predict the extent to which the pollution affects plants and subsequently predicting the degree of pollution. More specifically, around 89% of reliability was achieved for As and 67% for Hg on the basis of Pearson’s Coefficient (Figure 5).
We also observed that most of the area lent itself to study; although results are more reliable for As than for Hg. This finding could be attributable to the previously mentioned higher mobility of As, which reached higher concentrations than Hg far from the spoil heap. In contrast, the areas with low concentrations of Hg and As are shown in green, where there was no correlation between the pollution levels and the CARI2/NDVIg results.

4. Conclusions

Hg-As mining spoil heaps pose an environmental risk due to their highly toxic load. Therefore, it is important to monitor their evolution in order to evaluate the dispersion of the contaminants. Here we examined the impact of weathering on the As- and Hg-rich spoil heap of the former La Soterraña mine. To this end, the synergy between classical geochemical tools and remote sensing methodologies using a UAV-based airborne multispectral camera was explored.
First, the geochemical campaign confirmed severe As and Hg pollution of soils downstream of the spoil heap, and to a lesser extent the presence of Sb, in concentrations several orders of magnitude above RBSSLs. On the basis of the high level of pollution found, we reasoned that the vegetation of the area would be affected. This notion was confirmed by remote sensing techniques involving a multispectral camera mounted on a UAV. Algebraic operations with remote sensing data, also called vegetation indices, revealed reliable results between As and the CARI-2 index, and between Hg and the NDVIg index, the former giving better results.
In this regard, our results demonstrated a very high correlation between plant stress and high concentrations of As (0.89 correlation when As concentration > 200 ppm) and Hg (0.67 correlation when Hg concentration > 40 ppm). These findings pave the way for new studies that combine classical geochemical tools and remote sensing.
The dispersion of the contaminants is attributable to the physical-chemical weathering of the spoil heap, mainly through solid waste leaching processes, which results in the distribution of As and Hg towards lower levels of the heap. However, thanks to the high correlations between the concentrations of the two contaminants and the CARI-2 and NDVIg indices, the mapping of these indices facilitates the identification of pollution hotspots in areas particularly affected by contamination, thereby reducing the costs of geochemical characterization. On the whole, this study emphasizes the potential of combining geochemical tools and remote sensing technology for soil pollution research. However, future research efforts are expected to bring about the fine tuning of both the geochemical aspects and the multispectral information.

Author Contributions

Conceptualization, Carlos Boente, Lorena Salgado & José Luis R. Gallego; Methodology, Lorena Salgado, Arturo Colina & Carlos A. López-Sánchez; Software, Arturo Colina & Lorena Salgado; Validation, José Luis R. Gallego, Arturo Colina & Emilio Romero-Macías; Formal Analysis, Carlos Boente, Lorena Salgado & Carlos A. López-Sánchez; Investigation, Carlos Boente & Lorena Salgado; Data Curation, Lorena Salgado & Carlos Boente; Writing-Original Draft Preparation, Carlos Boente, Lorena Salgado & Emilio Romero-Macías; Writing-Review & Editing, Arturo Colina & José Luis R. Gallego; Visualization, Lorena Salgado & Carlos Boente; Supervision, José Luis R. Gallego; Project Administration, José Luis R. Gallego; Funding Acquisition, José Luis R. Gallego & Emilio Romero-Macías. All authors have read and agreed to the published version of the manuscript.

Funding

This research received no external funding.

Conflicts of Interest

The authors declare no conflict of interest.

References

  1. Jacobson, M.Z. Review of solutions to global warming, air pollution, and energy security. Energy Environ. Sci. 2009, 2, 148–173. [Google Scholar] [CrossRef]
  2. Horvat, M.; Nolde, N.; Fajon, V.; Jereb, V.; Logar, M.; Lojen, S.; Jacimovic, R.; Falnoga, I.; Liya, Q.; Faganeli, J.; et al. Total mercury, methylmercury and selenium in mercury polluted areas in the province Guizhou, China. Sci. Total Environ. 2003, 304, 231–256. [Google Scholar] [CrossRef]
  3. Wołejko, E.; Wydro, U.; Jabłońska-Trypuć, A.; Butarewicz, A.; Łoboda, T. The effect of sewage sludge fertilization on the concentration of PAHs in urban soils. Environ. Pollut. 2018, 232, 347–357. [Google Scholar] [CrossRef] [PubMed]
  4. Biasioli, M.; Barbieris, R.; Ajmonemarsan, F. The influence of a large city on some soil properties and metals content. Sci. Total Environ. 2006, 356, 154–164. [Google Scholar] [CrossRef] [PubMed]
  5. Li, P.; Feng, X.B.; Qiu, G.L.; Shang, L.H.; Li, Z.G. Mercury pollution in Asia: A review of the contaminated sites. J. Hazard. Mater. 2009, 168, 591–601. [Google Scholar] [CrossRef]
  6. Gallini, L.; Ajmone-Marsan, F.; Scalenghe, R. The contamination legacy of a decommissioned iron smelter in the Italian Alps. J. Geochemical Explor. 2018, 186, 121–128. [Google Scholar] [CrossRef]
  7. Prada, M.; Cabo, C.; Hernández-Clemente, R.; Hornero, A.; Majada, J.; Martínez-Alonso, C. Assessing Canopy Responses to Thinnings for Sweet Chestnut Coppice with Time-Series Vegetation Indices Derived from Landsat-8 and Sentinel-2 Imagery. Remote Sens. 2020, 12, 3068. [Google Scholar] [CrossRef]
  8. Novo-Fernández, A.; Franks, S.; Wehenkel, C.; López-Serrano, P.M.; Molinier, M.; López-Sánchez, C.A. Landsat time series analysis for temperate forest cover change detection in the Sierra Madre Occidental, Durango, Mexico. Int. J. Appl. Earth Obs. Geoinf. 2018, 73, 230–244. [Google Scholar] [CrossRef]
  9. Barrio-Anta, M.; Castedo-Dorado, F.; Cámara-Obregón, A.; López-Sánchez, C.A. Predicting current and future suitable habitat and productivity for Atlantic populations of maritime pine (Pinus pinaster Aiton) in Spain. Ann. For. Sci. 2020, 77, 1–19. [Google Scholar] [CrossRef]
  10. Thomas, I.A.; Jordan, P.; Mellander, P.-E.; Fenton, O.; Shine, O.; Ó hUallacháin, D.; Creamer, R.; McDonald, N.T.; Dunlop, P.; Murphy, P.N.C. Improving the identification of hydrologically sensitive areas using LiDAR DEMs for the delineation and mitigation of critical source areas of diffuse pollution. Sci. Total Environ. 2016, 556, 276–290. [Google Scholar] [CrossRef] [Green Version]
  11. Woodruff, L.; Cannon, W.F.; Smith, D.B.; Solano, F. The distribution of selected elements and minerals in soil of the conterminous United States. J. Geochemical Explor. 2015, 154, 49–60. [Google Scholar] [CrossRef] [Green Version]
  12. Wang, X.; Dan, Z.; Cui, X.; Zhang, R.; Zhou, S.; Wenga, T.; Yan, B.; Chen, G.; Zhang, Q.; Zhong, L. Contamination, ecological and health risks of trace elements in soil of landfill and geothermal sites in Tibet. Sci. Total Environ. 2020, 715, 136639. [Google Scholar] [CrossRef] [PubMed]
  13. Roces-Díaz, J.V.; Cabo, C.; Prendes, C.; Ordoñez, C.; Santín, C. Automatic delineation of forest patches in highly fragmented landscapes using coloured point clouds. Forests 2020, 11, 198. [Google Scholar] [CrossRef] [Green Version]
  14. Polat, N.; Uysal, M. An Experimental Analysis of Digital Elevation Models Generated with Lidar Data and UAV Photogrammetry. J. Indian Soc. Remote Sens. 2018, 46, 1135–1142. [Google Scholar] [CrossRef]
  15. Bhattacharya, A.; Arora, M.K.; Sharma, M.L. Usefulness of adaptive filtering for improved Digital Elevation Model generation. J. Geol. Soc. India 2013, 82, 153–161. [Google Scholar] [CrossRef]
  16. Aguilar, F.J.; Mills, J.P.; Delgado, J.; Aguilar, M.A.; Negreiros, J.G.; Pérez, J.L. Modelling vertical error in LiDAR-derived digital elevation models. ISPRS J. Photogramm. Remote Sens. 2010, 65, 103–110. [Google Scholar] [CrossRef]
  17. Reutebuch, S.E.; Mc Gaughey, R.J.; Andersen, H.E.; Carson, W.W. Accuracy of a high-resolution lidar terrain model under a conifer forest canopy. Can. J. Remote Sens. 2003, 29, 527–535. [Google Scholar] [CrossRef]
  18. Khanal, S.; Fulton, J.; Shearer, S. An overview of current and potential applications of thermal remote sensing in precision agriculture. Comput. Electron. Agric. 2017, 139, 22–32. [Google Scholar] [CrossRef]
  19. Mulla, D.J. Twenty five years of remote sensing in precision agriculture: Key advances and remaining knowledge gaps. Biosyst. Eng. 2013, 114, 358–371. [Google Scholar] [CrossRef]
  20. Pascucci, S.; Belviso, C.; Cavalli, R.M.; Palombo, A.; Pignatti, S.; Santini, F. Using imaging spectroscopy to map red mud dust waste: The Podgorica Aluminum Complex case study. Remote Sens. Environ. 2012, 123, 139–154. [Google Scholar] [CrossRef]
  21. Liu, M.; Wang, T.; Skidmore, A.K.; Liu, X. Heavy metal-induced stress in rice crops detected using multi-temporal Sentinel-2 satellite images. Sci. Total Environ. 2018, 637–638, 18–29. [Google Scholar] [CrossRef] [PubMed]
  22. Zhang, Z.; Liu, M.; Liu, X.; Zhou, G. A New Vegetation Index Based on Multitemporal Sentinel-2 Images for Discriminating Heavy Metal Stress Levels in Rice. Sensors 2018, 18, 2172. [Google Scholar] [CrossRef] [PubMed] [Green Version]
  23. Wu, Y.; Zhang, X.; Liao, Q.; Ji, J. Can Contaminant Elements in Soils Be Assessed by Remote Sensing Technology. Soil Sci. 2011, 176, 196–205. [Google Scholar] [CrossRef]
  24. Tan, K.; Wang, H.; Chen, L.; Du, Q.; Du, P.; Pan, C. Estimation of the spatial distribution of heavy metal in agricultural soils using airborne hyperspectral imaging and random forest. J. Hazard. Mater. 2020, 382, 120987. [Google Scholar] [CrossRef]
  25. Shi, T.; Chen, Y.; Liu, Y.; Wu, G. Visible and near-infrared reflectance spectroscopy—An alternative for monitoring soil contamination by heavy metals. J. Hazard. Mater. 2014, 265, 166–176. [Google Scholar] [CrossRef] [PubMed]
  26. Kemper, T.; Sommer, S. Use of airborne hyperspectral data to estimate residual heavy metal contamination and acidification potential in the Guadiamar floodplain Andalusia, Spain after the Aznacollar mining accident. In Remote Sensing for Environmental Monitoring, GIS Applications, and Geology IV; Ehlers, M., Posa, F., Kaufmann, H.J., Michel, U., De Carolis, G., Eds.; International Society for Optics and Photonics: Bellingham, WA, USA, 2004; p. 224. [Google Scholar]
  27. van der Meij, B.; Kooistra, L.; Suomalainen, J.; Barel, J.M.; De Deyn, G.B. Remote sensing of plant trait responses to field-based plant–soil feedback using UAV-based optical sensors. Biogeosciences 2017, 14, 733–749. [Google Scholar] [CrossRef] [Green Version]
  28. Gholizadeh, A.; Kopačková, V. Detecting vegetation stress as a soil contamination proxy: A review of optical proximal and remote sensing techniques. Int. J. Environ. Sci. Technol. 2019, 16, 2511–2524. [Google Scholar] [CrossRef]
  29. Elachi, C.; Zimmerman, P.D. Introduction to the Physics and Techniques of Remote Sensing. Phys. Today 1988, 41, 126. [Google Scholar] [CrossRef]
  30. Gholizadeh, A.; Saberioon, M.; Ben-Dor, E.; Borůvka, L. Monitoring of selected soil contaminants using proximal and remote sensing techniques: Background, state-of-the-art and future perspectives. Crit. Rev. Environ. Sci. Technol. 2018, 48, 243–278. [Google Scholar] [CrossRef]
  31. Erol, S.; Özögel, E.; Kuçak, R.A.; Erol, B. Utilizing Airborne LiDAR and UAV Photogrammetry Techniques in Local Geoid Model Determination and Validation. ISPRS Int. J. Geo-Inf. 2020, 9, 528. [Google Scholar] [CrossRef]
  32. Balková, M.; Bajer, A.; Patočka, Z.; Mikita, T. Visual Exposure of Rock Outcrops in the Context of a Forest Disease Outbreak Simulation Based on a Canopy Height Model and Spectral Information Acquired by an Unmanned Aerial Vehicle. ISPRS Int. J. Geo-Inf. 2020, 9, 325. [Google Scholar] [CrossRef]
  33. Vågen, T.-G.; Winowiecki, L.A.; Tondoh, J.E.; Desta, L.T.; Gumbricht, T. Mapping of soil properties and land degradation risk in Africa using MODIS reflectance. Geoderma 2016, 263, 216–225. [Google Scholar] [CrossRef] [Green Version]
  34. Choe, E.; van der Meer, F.; van Ruitenbeek, F.; van der Werff, H.; de Smeth, B.; Kim, K.W. Mapping of heavy metal pollution in stream sediments using combined geochemistry, field spectroscopy, and hyperspectral remote sensing: A case study of the Rodalquilar mining area, SE Spain. Remote Sens. Environ. 2008, 112, 3222–3233. [Google Scholar] [CrossRef]
  35. Ferencz, C.; Bognár, P.; Lichtenberger, J.; Hamar, D.; Tarcsai, G.; Timár, G.; Molnár, G.; Pásztor, S.; Steinbach, P.; Székely, B.; et al. Crop yield estimation by satellite remote sensing. Int. J. Remote Sens. 2004, 25, 4113–4149. [Google Scholar] [CrossRef]
  36. Rouse, J.W.; Haas, R.H.; Schell, J.A.; Deering, D.W. Monitoring the vernal advancement and retrogradation (green wave effect) of natural vegetation. Prog. Rep. RSC 1978, 1973, 112. [Google Scholar]
  37. Clarke, T.R.; Moran, M.S.; Barnes, E.M.; Pinter, P.J.; Qi, J. Planar domain indices: A method for measuring a quality of a single component in two-component pixels. In Proceedings of the International Geoscience and Remote Sensing Symposium (IGARSS), Sydney, Australia, 9–13 July 2001; Volume 3, pp. 1279–1281. [Google Scholar]
  38. Shabou, M.; Mougenot, B.; Chabaane, Z.L.; Walter, C.; Boulet, G.; Aissa, N.B.; Zribi, M. Soil clay content mapping using a time series of Landsat TM data in semi-arid lands. Remote Sens. 2015, 7, 6059–6078. [Google Scholar] [CrossRef] [Green Version]
  39. Reimann, C.; Filzmoser, P.; Garrett, R.G. Background and threshold: Critical comparison of methods of determination. Sci. Total Environ. 2005, 346, 1–16. [Google Scholar] [CrossRef] [PubMed]
  40. He, Z.L.; Yang, X.E.; Stoffella, P.J. Trace elements in agroecosystems and impacts on the environment. J. Trace Elem. Med. Biol. 2005, 19, 125–140. [Google Scholar] [CrossRef]
  41. Syversen, T.; Kaur, P. The toxicology of mercury and its compounds. J. Trace Elem. Med. Biol. 2012, 26, 215–226. [Google Scholar] [CrossRef]
  42. Evers, D.C.; Keane, S.E.; Basu, N.; Buck, D. Evaluating the effectiveness of the Minamata Convention on Mercury: Principles and recommendations for next steps. Sci. Total Environ. 2016, 569–570, 888–903. [Google Scholar] [CrossRef]
  43. Boente, C.; Albuquerque, M.T.D.; Gerassis, S.; Rodríguez-Valdés, E.; Gallego, J.R. A coupled multivariate statistics, geostatistical and machine-learning approach to address soil pollution in a prototypical Hg-mining site in a natural reserve. Chemosphere 2019, 218, 767–777. [Google Scholar] [CrossRef] [PubMed]
  44. Kulikova, T.; Hiller, E.; Jurkovič, Ľ.; Filová, L.; Šottník, P.; Lacina, P. Total mercury, chromium, nickel and other trace chemical element contents in soils at an old cinnabar mine site (Merník, Slovakia): Anthropogenic versus natural sources of soil contamination. Environ. Monit. Assess. 2019, 191, 263. [Google Scholar] [CrossRef] [PubMed]
  45. Forján, R.; Baragaño, D.; Boente, C.; Fernández-Iglesias, E.; Rodríguez-Valdes, E.; Gallego, J.R. Contribution of fluorite mining waste to mercury contamination in coastal systems. Mar. Pollut. Bull. 2019, 149, 110576. [Google Scholar] [CrossRef] [PubMed]
  46. Jiménez-Moreno, M.; Barre, J.P.G.; Perrot, V.; Bérail, S.; Rodríguez Martín-Doimeadios, R.C.; Amouroux, D. Sources and fate of mercury pollution in Almadén mining district (Spain): Evidences from mercury isotopic compositions in sediments and lichens. Chemosphere 2016, 147, 430–438. [Google Scholar] [CrossRef]
  47. González-Fernández, B.; Rodríguez-Valdés, E.; Boente, C.; Menéndez-Casares, E.; Fernández-Braña, A.; Gallego, J.R. Long-term ongoing impact of arsenic contamination on the environmental compartments of a former mining-metallurgy area. Sci. Total Environ. 2018, 610–611, 820–830. [Google Scholar] [CrossRef]
  48. Loredo, J.; Ordonez, A.; Alvarez, R. Environmental impact of toxic metals and metalloids from the Muñón Cimero mercury-mining area (Asturias, Spain). J. Hazard. Mater. 2006, 136, 455–467. [Google Scholar] [CrossRef]
  49. Matanzas, N.; Sierra, M.J.; Afif, E.; Díaz, T.E.; Gallego, J.R.; Millán, R. Geochemical study of a mining-metallurgy site polluted with As and Hg and the transfer of these contaminants to Equisetum sp. J. Geochem. Explor. 2017, 182, 1–9. [Google Scholar] [CrossRef]
  50. Fernández, S.; Poschenrieder, C.; Marcenò, C.; Gallego, J.R.; Jiménez-Gámez, D.; Bueno, A.; Afif, E. Phytoremediation capability of native plant species living on Pb-Zn and Hg-As mining wastes in the Cantabrian range, north of Spain. J. Geochem. Explor. 2017, 174, 10–20. [Google Scholar] [CrossRef]
  51. Moreno-Jiménez, E.; Peñalosa, J.M.; Manzano, R.; Carpena-Ruiz, R.O.; Gamarra, R.; Esteban, E. Heavy metals distribution in soils surrounding an abandoned mine in NW Madrid (Spain) and their transference to wild flora. J. Hazard. Mater. 2009, 162, 854–859. [Google Scholar] [CrossRef]
  52. Handique, B.K.; Goswami, C.; Gupta, C.; Pandit, S.; Gogoi, S.; Jadi, R.; Jena, P.; Borah, G.; Raju, P.L.N. Hierarchical classification for assessment of horticultural crops in mixed cropping pattern using UAV-borne multi-spectral sensor. ISPRS Int. Arch. Photogramm. Remote Sens. Spat. Inf. Sci. 2020, XLIII-B3-2, 67–74. [Google Scholar] [CrossRef]
  53. Franzini, M.; Ronchetti, G.; Sona, G.; Casella, V. Geometric and Radiometric Consistency of Parrot Sequoia Multispectral Imagery for Precision Agriculture Applications. Appl. Sci. 2019, 9, 5314. [Google Scholar] [CrossRef] [Green Version]
  54. Cubero-Castan, M.; Schneider-Zapp, K.; Bellomo, M.; Shi, D.; Rehak, M.; Strecha, C. Assessment of the Radiometric Accuracy in a Target Less Work Flow Using Pix4D Software. In Proceedings of the 2018 9th Workshop on Hyperspectral Image and Signal Processing: Evolution in Remote Sensing (WHISPERS), Amsterdam, The Netherlands, 23–26 September 2018; IEEE: Piscataway, NJ, USA, 2018; pp. 1–4. [Google Scholar]
  55. BOPA Generic Reference Levels for Heavy Metals in Soils from Principality of Asturias, Spain. 2014. Available online: http://sede.612asturias.es/bopa/2014/04/21/2014e06617.pdf (accessed on 25 November 2020).
  56. Oliver, M.A.; Webster, R. A tutorial guide to geostatistics: Computing and modelling variograms and kriging. CATENA 2014, 113, 56–69. [Google Scholar] [CrossRef]
  57. A Database for Remote Sensing Indices. Available online: https://www.indexdatabase.de/db/i.php (accessed on 25 November 2020).
  58. Kim, M.S. The Use of Narrow Spectral Bands for Improving Remote Sensing Estimations of Fractionally Absorbed Photosynthetically Active Radiation. Ph.D. Thesis, University of Maryland, College Park, MD, USA, 1994. [Google Scholar]
  59. Fernández, B.; Lara, L.M.; Menéndez-Aguado, J.M.; Ayala, J.; García-González, N.; Salgado, L.; Colina, A.; Gallego, J.L.R. A multi-faceted, environmental forensic characterization of a paradigmatic brownfield polluted by hazardous waste containing Hg, As, PAHs and dioxins. Sci. Total Environ. 2020, 726, 138546. [Google Scholar] [CrossRef] [PubMed]
  60. Gitelson, A.; Szilagyi, F.; Mittenzwey, K.-H. Improving quantitative remote sensing for monitoring of inland water quality. Water Res. 1993, 27, 1185–1194. [Google Scholar] [CrossRef]
  61. Okkenhaug, G.; Zhu, Y.-G.; He, J.; Li, X.; Luo, L.; Mulder, J. Antimony (Sb) and Arsenic (As) in Sb Mining Impacted Paddy Soil from Xikuangshan, China: Differences in Mechanisms Controlling Soil Sequestration and Uptake in Rice. Environ. Sci. Technol. 2012, 46, 3155–3162. [Google Scholar] [CrossRef]
  62. Gil-Díaz, M.; Rodríguez-Valdés, E.; Alonso, J.; Baragaño, D.; Gallego, J.R.; Lobo, M.C. Nanoremediation and long-term monitoring of brownfield soil highly polluted with As and Hg. Sci. Total Environ. 2019, 675, 165–175. [Google Scholar] [CrossRef]
  63. Baragaño, D.; Boente, C.; Rodríguez-Valdés, E.; Fernández-Braña, A.; Jiménez, A.; Gallego, J.R.; González-Fernández, B. Arsenic release from pyrite ash waste over an active hydrogeological system and its effects on water quality. Environ. Sci. Pollut. R. 2020, 27, 10672–10684. [Google Scholar] [CrossRef]
  64. Gallego, J.R.; Ortiz, J.E.; Sánchez-Palencia, Y.; Baragaño, D.; Borrego, A.; Torres, T. A multivariate examination of the timing and accumulation of potentially toxic elements at Las Conchas bog (NW Spain). Environ. Pollut. 2019, 254, 113048. [Google Scholar] [CrossRef]
Figure 1. Research workflow.
Ijgi 09 00739 g001
Figure 2. Location of the study area and sampling design.
Ijgi 09 00739 g002
Figure 3. Concentrations of: (a) As and (b) Hg, in the study area.
Ijgi 09 00739 g003
Figure 4. Results of the vegetation indices Left: CARI2; good correlation with As and Right: NDVIg; good correlation with Hg.
Ijgi 09 00739 g004
Figure 5. Pearson’s coefficients between the concentration of As and CARI-2 vegetation index (left) and Hg and NDVIg vegetation index (right).
Ijgi 09 00739 g005
Figure 6. Kriging interpolation. Left: As; and Right: Hg.
Ijgi 09 00739 g006
Figure 7. In red, areas that lend themselves to study by means of multispectral remote sensing techniques with a high degree of reliability. Left: As; right: Hg.
Ijgi 09 00739 g007
Table 1. Descriptive statistics for the 27 soil samples analyzed. Concentrations expressed as mg/kg.
PTERBSSLRangeMeanMedianTypical DeviationCV
As4044–9920632.1150.01876.4296.8
Cd20.2–0.90.40.50.240.3
Co252.7–1713.413.43.022.1
Cr10,00018–5726.925.08.029.6
Cu5511–9833.228.818.856.6
Hg11.95–86068.029.2158.0232.4
Mn2135251–1270707.2704.0248.335.1
Mo60.4–3.61.11.00.661.6
Nor6510–4228.928.06.522.5
Pb7024–7437.534.011.229.8
Sb50.2–443.42.08.1238.0
Tl10.1–21.22.00.974.1
V5020–8338.935.012.632.4
Zn45565–214121.3113.029.724.5
Publisher’s Note: MDPI stays neutral with regard to jurisdictional claims in published maps and institutional affiliations.

