Virtual Touring for the Puglia Regional Museum Directorate


Construction Technologies Institute, National Research Council of Italy, via P. Lembo 38/B, 70124 Bari, Italy
*
Author to whom correspondence should be addressed.
ISPRS Int. J. Geo-Inf. 2020, 9(12), 741; https://0-doi-org.brum.beds.ac.uk/10.3390/ijgi9120741
Submission received: 3 November 2020
/
Revised: 27 November 2020
/
Accepted: 5 December 2020
/
Published: 11 December 2020
(This article belongs to the Special Issue Cultural Heritage Mapping and Observation)
Abstract
:The article describes the design process carried out to deliver a tool for the virtual fruition of the resources of the Puglia Regional Museum Directorate through multimedia content, within the frame of the Vi.S.T.A. (Virtual and Social heritage Touring Application) project. Identifying the virtual tour as the most suitable technology to achieve the promotion and exploitation needs of the Directorate’s museums, the project envisages the realization of an integrated system, conceived as a dedicated IT platform including a specific virtual touring section, for a selected pilot case. The article focuses on the design study for the virtual tour interface and the selection of the most appropriate functions for it, and describes the collaborative approach adopted. After the description of the project objectives and context, the design study and the related methodology are presented. Then, the results of the design activity are presented and discussed.
1. Introduction
The Puglia Regional Museum Directorate in Southern Italy recently expressed, through the Apulian Regional “Living Labs” platform, the need to offer its local and enlarged community specific tools for the virtual fruition of its artistic, cultural and historical heritage. With specific reference to sites not easily accessible either in economic and logistic terms, the Directorate has called upon the research community to conceive and deliver technological innovations allowing not only the access, through multimedia content and social-value features, to those assets, but also the interconnection among visitors through functionalities typical of virtual social communities.
Among the proposals submitted to the call “Innolabs” to answer those needs, the project “ViSTA—Virtual and Social Touring Application” (Project partners: Tecnosoft Srl (lead partner), System Project Srl, Tinada Srl, CNR—ITC Bari, University of Foggia) was selected, aimed at the delivery of an integrated technological system for the virtual and social touring of the Apulian artistic and cultural heritage.
The main goals of the ViSTA project are the promotion and implementation of more inclusive models of access to local cultural resources, by reducing the existing economic, architectural and geographical barriers to the fruition of resources.
Another peculiar feature of the project is the active involvement of the client in the design phase and of potential final users in the testing of technological solutions, in order to deliver tools that are as close as possible to the users’ needs and preferences in terms of usability and content structuring.
The project focuses on the delivery of an integrated system conceived as a technological platform with social touring and virtual touring sections; the latter has three components (Figure 1), each navigable both inside the map and independently (having their own URL): (a) an interactive map with link to virtual tours, 3D models viewer and internal images viewer [1]; (b) a virtual tour, containing 3D models viewer [2]; and (c) a 3D model viewer.
Our Institute is currently committed in the development of the “Virtual Touring” section of the ICT platform, illustrated in the result paragraph; Technosoft and System Project are developing the “Social Touring” section and will develop the user-testing phase.
The article focuses on the design stage for the setting out of an innovative virtual tour interface; in the following section, the study context is introduced and the importance and strategic role that cultural tourism and dedicated tools play for the region are described. Then, the objectives, materials and methods for the design task are illustrated. Finally, the results of the design activity are presented and discussed in relation to the original objectives of end users’ inclusion and involvement.
2. Cultural Tourism and Virtual Tours
2.1. Cultural Tourism in the Local Context
The importance of cultural tourism in the economic and occupational development of territories and the key role of the local administrations have long emerged at the community and national level. From the pronouncements of the European Economic and Social Committee in 2007 to the National Strategic Framework 2007–2013, earmarking considerable financial resources for the creation of tourism products in less competitive regions, up to the “2007 Draft Law on support measures for the promotion of small municipalities” [3], this awareness was clearly readable.
Moreover, the economic courses undertaken by many administrations testify to a strong awakening of local identities [4].
In general, the strengthening of the powers delegated by the regions to the municipalities in the tourist economy and above all the recognition, in all the regional laws, of their strategic contribution in the promotion of integrated tourist offers and in the creation of public–private cooperation networks, together with the performance of supervisory and control functions on tour operators, facilities and travel agencies, represent extremely promising preconditions.
However, already with the Framework Law n.135/2001 and the establishment of “Sistemi Turistici Locali” (the main governance instrument for local tourist development, gathering local bodies, private operators and other public entities), the goal of developing the tourist offering has led to the outlining of a new role for small municipalities as protagonists, triggering the culture of ‘local governance’ of processes and preparing the ground for virtuous relationships between new public and private subjects, often with small dimensions and great motivations. Municipalities are therefore called upon to play the major part in composite partnerships in the framework of initiatives that can be funded at the regional and EU level.
The repercussions of the recent economic crisis have subsequently led to a reduction in the endowments for heritage protection and enhancement programs, and prospects of unification of small municipalities may result in a limitation to concrete actions at the local level. In this scenario, the opportunities to support the socio-economic and occupational development and the competitive growth of the territory through the participation in cross-border cooperation programs and the rewarding of ‘good practices’—especially if incentive initiatives at national level are lacking or suspended—are therefore increasingly vital.
Their loss would represent a very serious waste, especially in the Apulian context. Here, alongside the strengthening of municipal competences, an active and ‘strong’ role of the regional administration, in particular through the Puglia Promo Agency, can represent, in terms of coordination and stimulus, a further guarantee of success for individual initiatives, in synergy with the significant commitment of ANCI, the National Association of Municipalities (see the many initiatives such as “Res Tipica Association”, “Salvalarte”, “Orange Flag”, and “Small Great Italy”). In other words, all the conditions exist for the creation of winning integrated tourism offers and truly effective network systems.
These new responsibilities require, among other things, entrepreneurial projects that can involve private and public actors, virtuous networks with the main stakeholders in the field of territorial promotion (Local Development Agencies, Tourist Promotion Utilities, Pro Loco institutions), tourist service systems (information, reception and support), as well as innovative fruition models and the ability to build and communicate the image of places.
It is, therefore, essential for local authorities to address these opportunities with a technological equipment that can facilitate the reduction of investment costs with simple, low-cost, effective and easy-to-manage solutions. The awareness of their own cultural heritage, expressed through effective actions of enhancement and communication, puts local administrations in a potentially winning position, since visibly able to act also as “drivers” for their overseas counterparts, less equipped and skilled in the field.
Among the means made available by the ICT sector, one of the most effective solutions for communicating environmental and cultural resources is the virtual reproduction and use of scenes and sites through virtual tours, a technology with considerable social value.
One of its many outcomes, for example, is the possibility to enrich educational activities and applications for special-needs users of tourist services, through the delivery of useful descriptive information on all relevant details such as door measurements, the dimensions of physical objects, and the available services, based on virtual explorations with multimedia contents such as photos and videos.
2.2. The Virtual Tour Technology
The term “Virtual tour” is used often to identify multimedia products containing descriptions, floor plans, photo and video galleries or even just videos, as for example the “Access the virtual tour” entry in the “Virtual tour” page of the municipality of Asti [5].
The virtual tour is, instead, made up of one or more “immersive photos”—photographic reconstructions of a scene that the user, virtually placed at its center, can explore in all directions with the aid of the mouse, also performing enlargement and reduction functions. The sensation experienced is comparable to the normal experience of “looking around” when being in a given physical place.
The production of a virtual tour therefore requires the representation of the real scene (spatial) through a flat image; usually the software that reproduces the space scene uses an equirectangular format of the image—height/width ratio equal to 1/2. This image can be constructed by “stitching” a series of photographs taken by a camera mounted on a “panoramic head”, making different acquisitions with different angles.
There are many excellent packages for this purpose as Kuula, HoloBuilder, Cupix, Tourweaver 7, Arcsoft Panorama Maker, PTGUI, 3Dvista, Virtual Tour Suite, Tourwizard, Virtualtour Easy, Panotour, 3DVista Virtual Tour, Capterra [6].
Google Street View is, for example, an online application that use immersive photos produced using a camera mounted on a vehicle—Dodeca 2369 is the commonly used camera, which takes 11 images at time, producing equirectangular images with a 13,312 × 6656 pixel resolution [7].
This is a time-consuming process both in the shooting and in the processing phase; sometimes the results are not satisfactory (due, for example, to differences in the exposures of contiguous frames) and it is, therefore, necessary to repeat the shots with further commitment of resources.
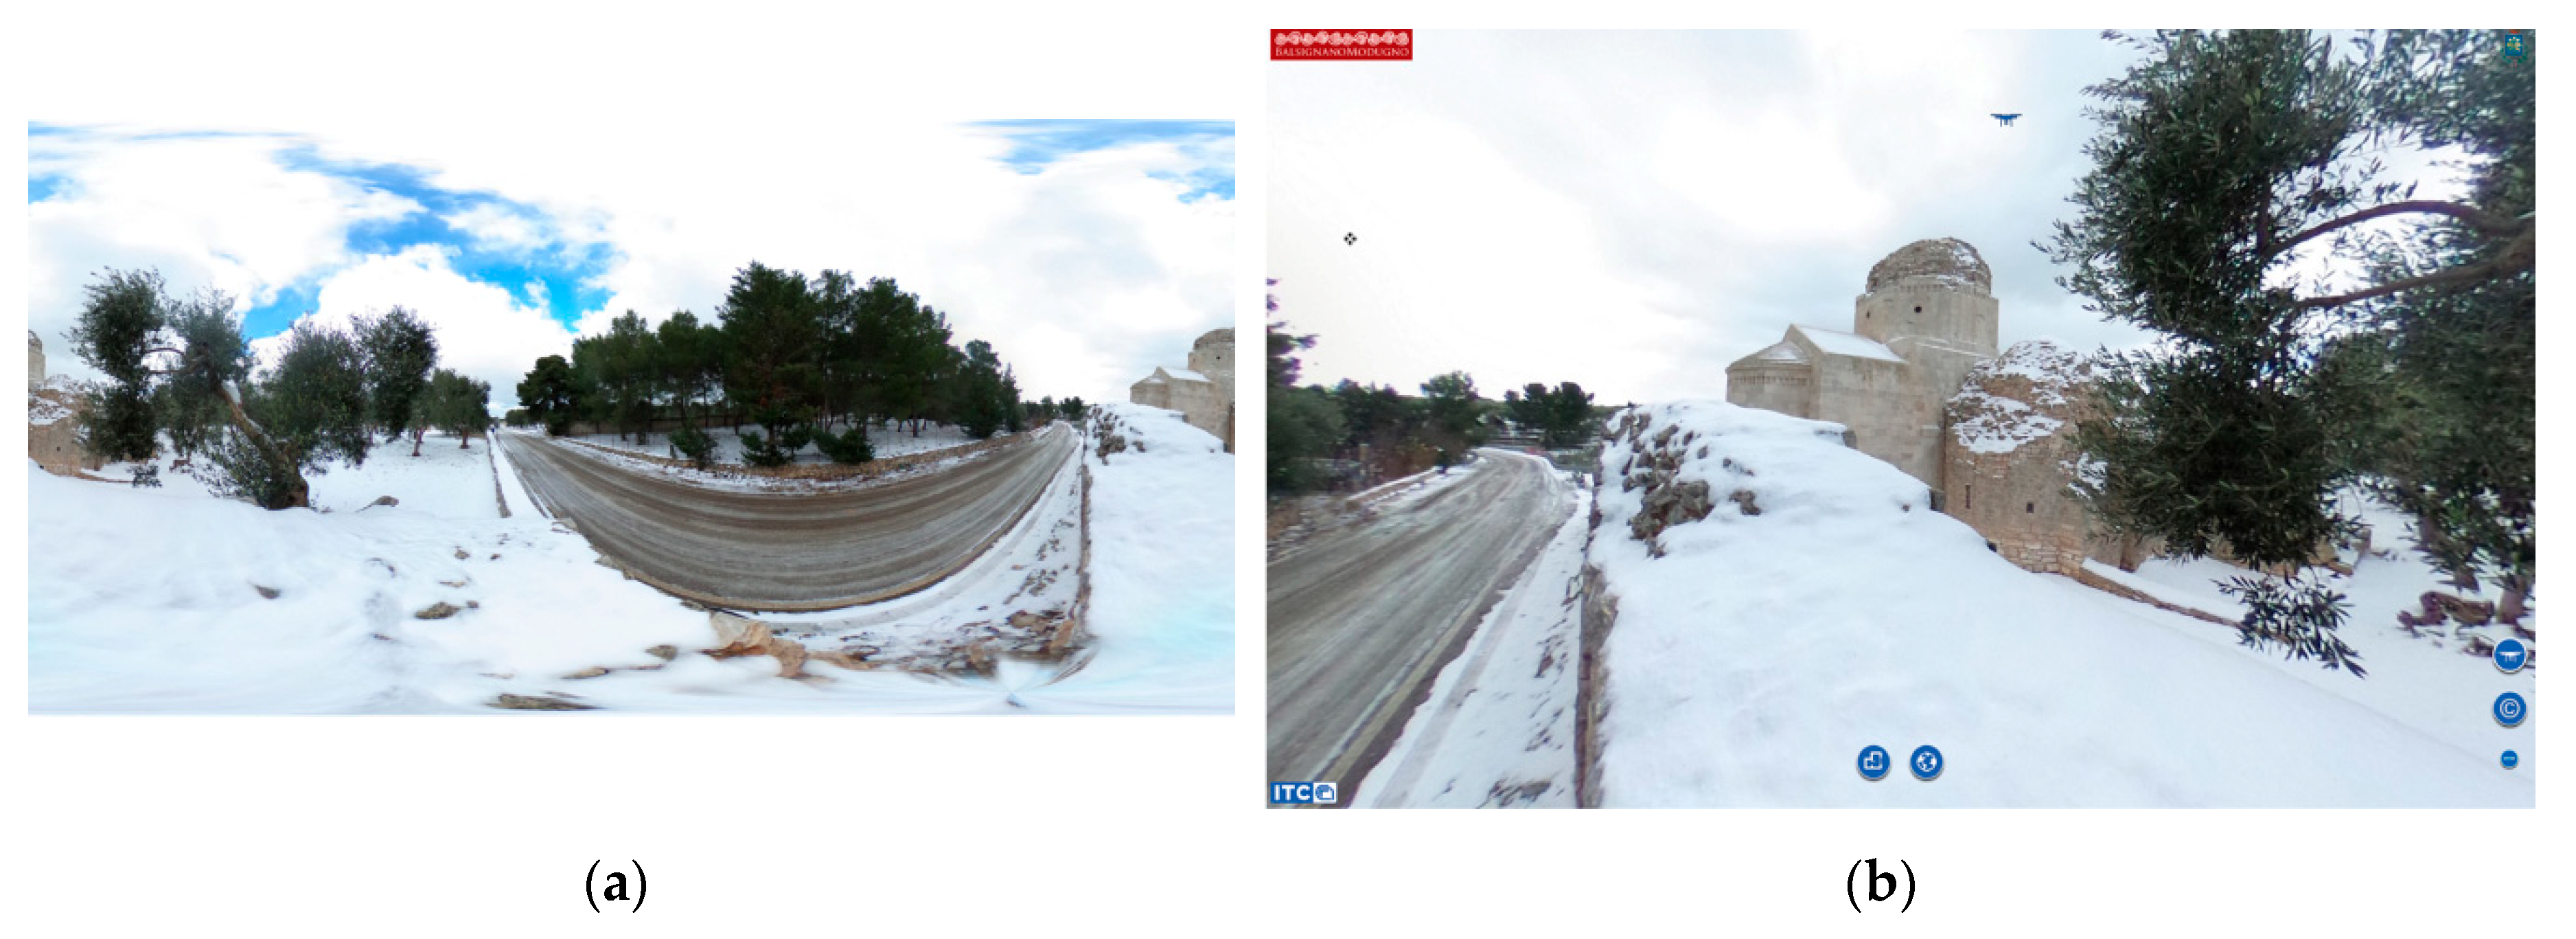
Nowadays it is possible to use cameras with two or more integrated fish-eyes lenses that produce directly equirectangular images (Figure 2a) that can be used immediately to create virtual tours (Figure 2b), but also 360° videos that can be uploaded on YouTube and Facebook.
The results are immediately visible in a connected smartphone and therefore the shooting can be performed again and immediately, if the result is not satisfactory [8].
These cameras are handy, low in price, and provide a graphic quality suitable for applications in the tourism sector [9].
Despite the importance of tools based on virtual tour technology and its increasing production, applications are not yet taking full advantage of its potentialities; moreover, there seem to be few studies available to evaluate UI and user experience issues, as reported in the next paragraph.
In the Virtual Environment field, however, “there are no interface standards and not even a good understanding of the usability of various interface types”; furthermore, the user target evaluating an application in a virtual environment may not be known or well understood and, if research staff participate in it, the results may be biased [10].
The most widely applied methodologies are those based on experts and those based on users, as we will see in the next paragraph. The former are economical and efficient, but only the latter can provide robust information about the interface.
Unfortunately, users cannot tell you everything you might want to know; moreover, part of what they will tell you is useless: for various reasons, users are often unable to provide a reasonable explanation for what happened or why they acted a certain way [11].
3. Related Works
A first study [12] on four virtual tours with similar functionalities (use of interactive floor plans and built-in hotspots to navigate with; additional information relevant to the user’s position) but different sizes (over 40 nodes—Sydney Opera House and Questacon Science Center; under 7 nodes—Wroxton Abbey and Richard Strauss House) was done involving twelve unspecified people.
Two qualitative methods (TAP—Think-Aloud Protocol and Jakob Nielsen’s usability Heuristic Evaluation) were used, and usability issues were grouped into four categories:
- Functionality: difficult interaction with objects; limited freedom of movement; lack of distinct functions between novice and experienced users.
- Interaction: difficulty in navigation and in determining the position; limited use of navigation aids.
- Appearance: image quality; location and size of hotspots.
- Comments: to be able to view objects in greater detail and to move through the shooting points as if they were walking.
The conclusion of the study, not fully supported by images of the virtual tours examined, stated that the TAP was more convenient, and that the investigation resulted in new design guidelines, without specifying them.
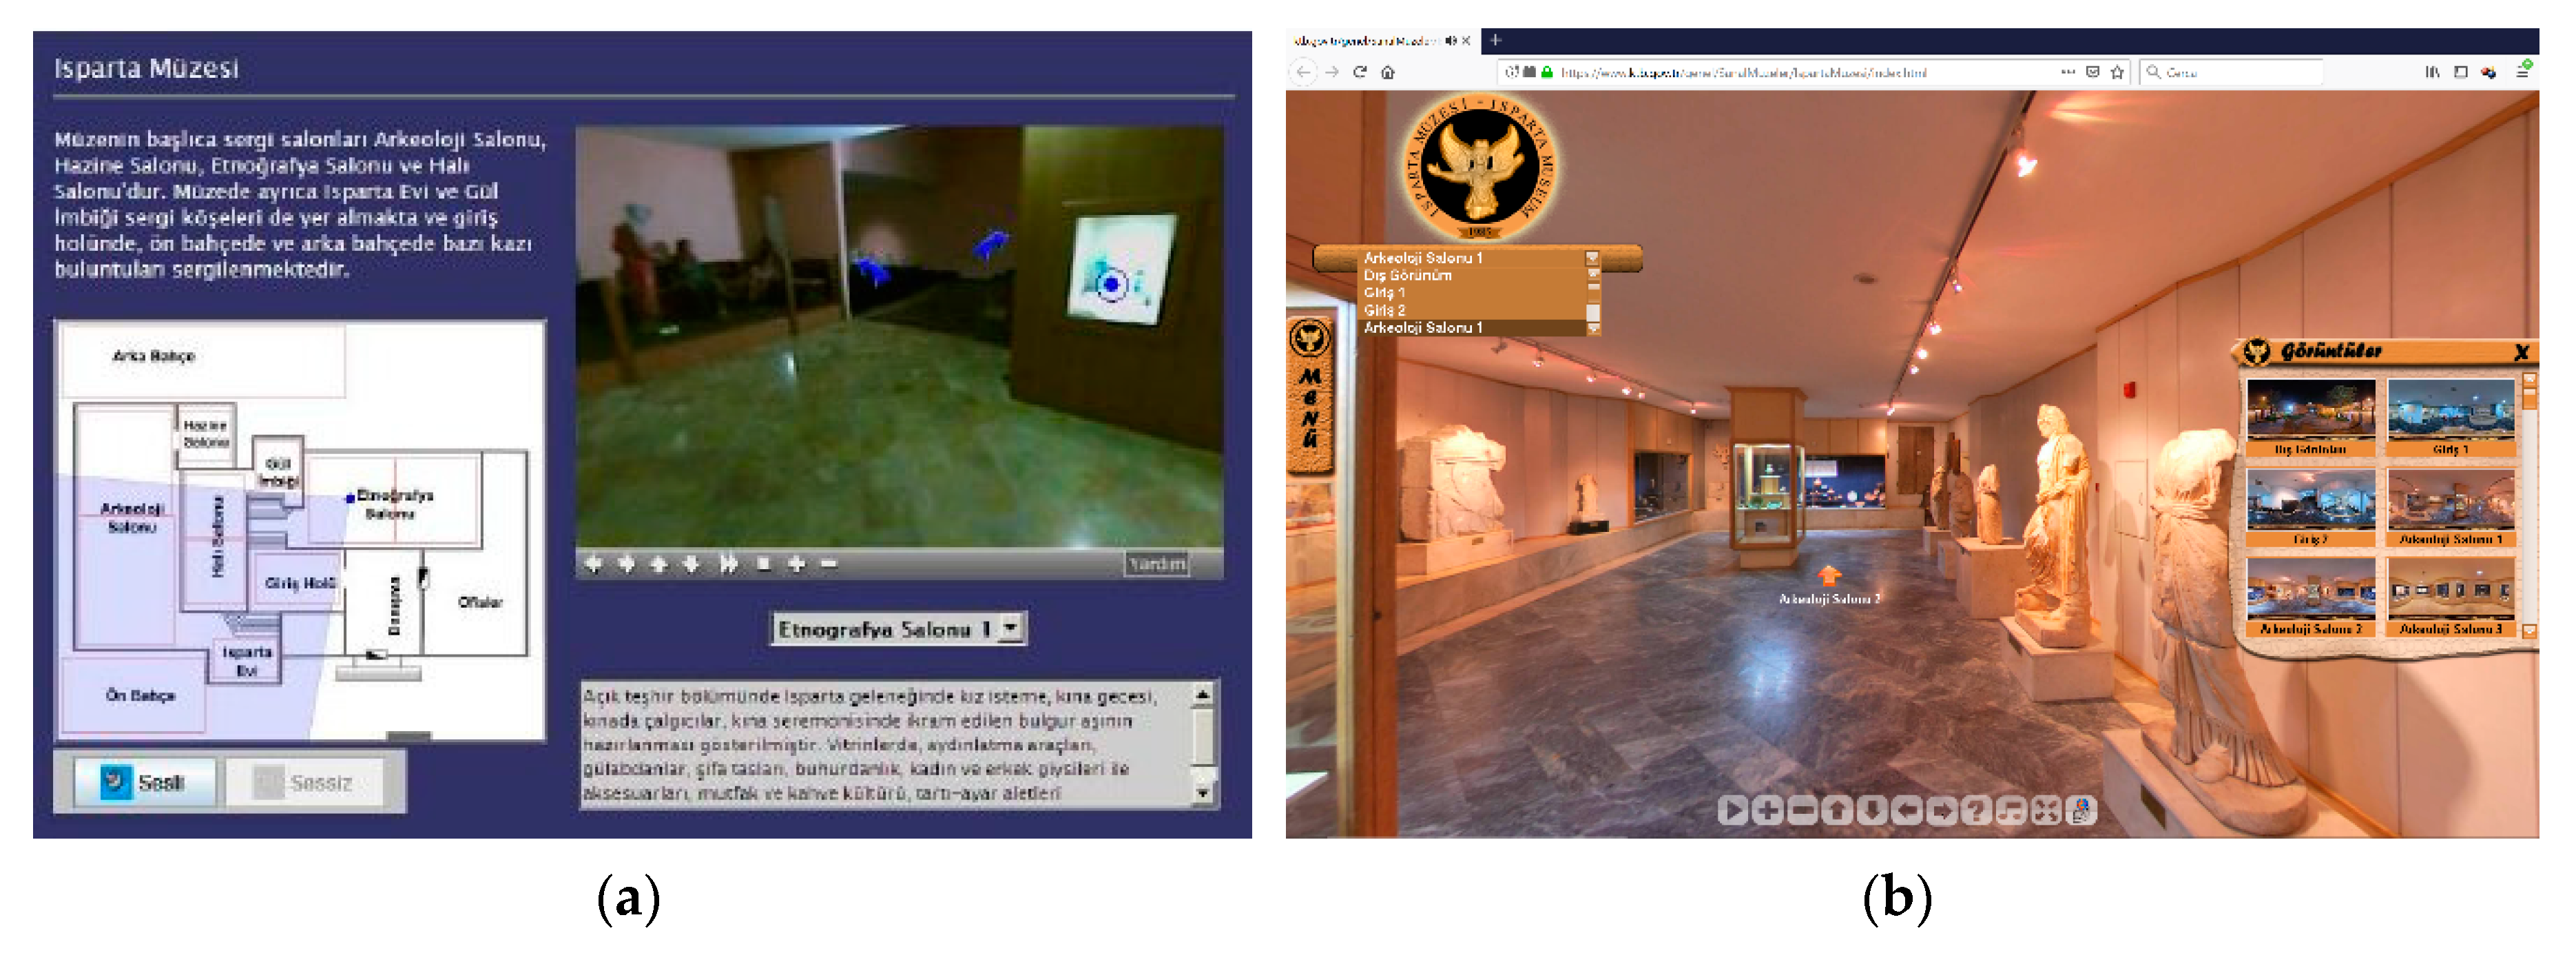
In another study [13], 15 people (graduate students from positive sciences or engineering department) participated in a usability evaluation test of the Isparta Museum Virtual Tour (Figure 3a), organized in two phases.
First, they were invited to freely discover the virtual tour tools and functions; later they were asked to find information about specific artworks, available as follows:
- By clicking on a hotspot placed on the artwork.
- Reading the information in a textbox.
- Listening to an audio track available on request.
Three navigation functions are available for the user: (1) clicking on arrows in the viewing windows to change the scene; (2) clicking a scene in the floor plan; (3) select a scene from a pull-down menu.
Additional properties provided are: (1) textbox with information about a Museum section; (2) audio information (spoken form of the text in the textbox); (3) hotspot on artworks, opening a new window with detailed artwork information; (4) help page; (5) zoom in/out; (6) changing view direction; (7) viewed direction and angle of field of view (FOV) shown on the floor plan.
The usability assessment was performed using the TAP method and eye-tracking data. Some test results are shown in Table 1.
Suggested improvements were: (a) to enhance the navigation using a 3D view of the building; (b) to use the same content for text and audio; (c) to use a larger viewing window; (d) to highlight the clickable scene in the floor plan; and (e) to offer help at the beginning.
The virtual tour available nowadays seems to not adopt these suggestions; moreover, the floor plan and the hotspots on the artifacts have been canceled (Figure 3b).
More recently, a study aimed at establishing which information allows the virtual tour user to feel as if they were actually in the real environment—therefore increasing effectiveness and usability—was conducted with the involvement of 20 universities, local and foreign [15], using the interview method. The results can be summarized as follows: (a) menu easy to find and not complicated; (b) navigation easy to access and use; (c) interaction using floor plan with hotspot; (d) availability of a tour guide avatar and audio help; (e) compatibility with both desktop and mobile.
Later, a set of 16 Italian museums’ virtual tours were tested using a combination of two multi-criteria decision making theories, involving as evaluators four researcher skilled in Virtual Reality, pattern recognition, software engineering and cultural heritage conservation, who had been suitably trained in advance [16]. The criteria adopted fell into four categories: VR experience, presence perception, navigation and learning aspects, usually adopted for virtual environments. For example, the navigation rules to be evaluated were:
- Faithful viewpoints (Fv): the naturalness of change between viewpoints.
- Navigation and orientation support (No): naturalness in orientation and navigation (Is it clear where they are and how they return?).
- Clear entry and exit points (Ce): clearness of entry and exit points.
- Consistent departures (Cd): consistency of departure actions.
The linguistic evaluation parameters were: ‘Low’ (used in 32% of all rates), ‘Medium’, High’ and ‘Very High’. Most of the virtual tours showed a medium-low naturalness of the change between nodes. Additional problems identified concern: (a) navigation functionalities; (b) interactivity with exhibitions; (c) communicating information methods. The result was a virtual tour ranking list.
Finally, a recently developed campus virtual tour [17] was evaluated by five experts, university IT professors with a great deal of experience (10–15 years), using five criteria (system status visibility; match with the real world; user control and freedom; consistency and standard; flexibility and minimalist design; help and documentation; error control), rating it on the basis of a 5-point Likert Scale—Strongly Disagree (1) to Strongly Agree (5).
For each usability criterion, there was more than one question. For example, in system status visibility: (1) Has each screen a descriptive title? (2) Is it clear where to go from current location? (3) Is there a match between the given information and those requested? The score was higher than 4.0 for all the criteria, Moreover, the heuristic evaluation allowed experts to give comments for improving the virtual tour.
The score was greater than 4.0 for all criteria except for the error control criteria, probably due to the fact that the app does not display error messages. Among the requests for improvements was the addition of a 2D map to the homepage so users could refer to it to visualize the buildings exact locations. Virtual tour images in the article seems not giving adequate support to the exposed aspects.
The above studies show the need to give experts specific samples of virtual tour issues to avoid aspects deemed important being overlooked; leaving experts the freedom to view and compare different virtual tours could lead to difficulties in highlighting the same functionality in different interfaces. Moreover, user comments and suggestions give useful information about the specific features to be taken into consideration in testing phase. Finally, it is necessary to highlight the changes in the interface occurring because of the user testing, going beyond the simple presentation of issues.
In addition to the above studies, observation on techniques used in several virtual tours available through the Internet has also been made; taking into account that the several interfaces being used in the industry propose quite similar solutions [18], the virtual tour interface overview was delimited to our country focusing on how the functions have been applied.
4. Virtual Tour Interfaces in Italy
Italy is the seventh biggest country in the world for the development of virtual tours; the technology of spherical photos made to create virtual tours is rapidly moving towards the business sector, and particularly local operators interested in showing users virtual previews [19].
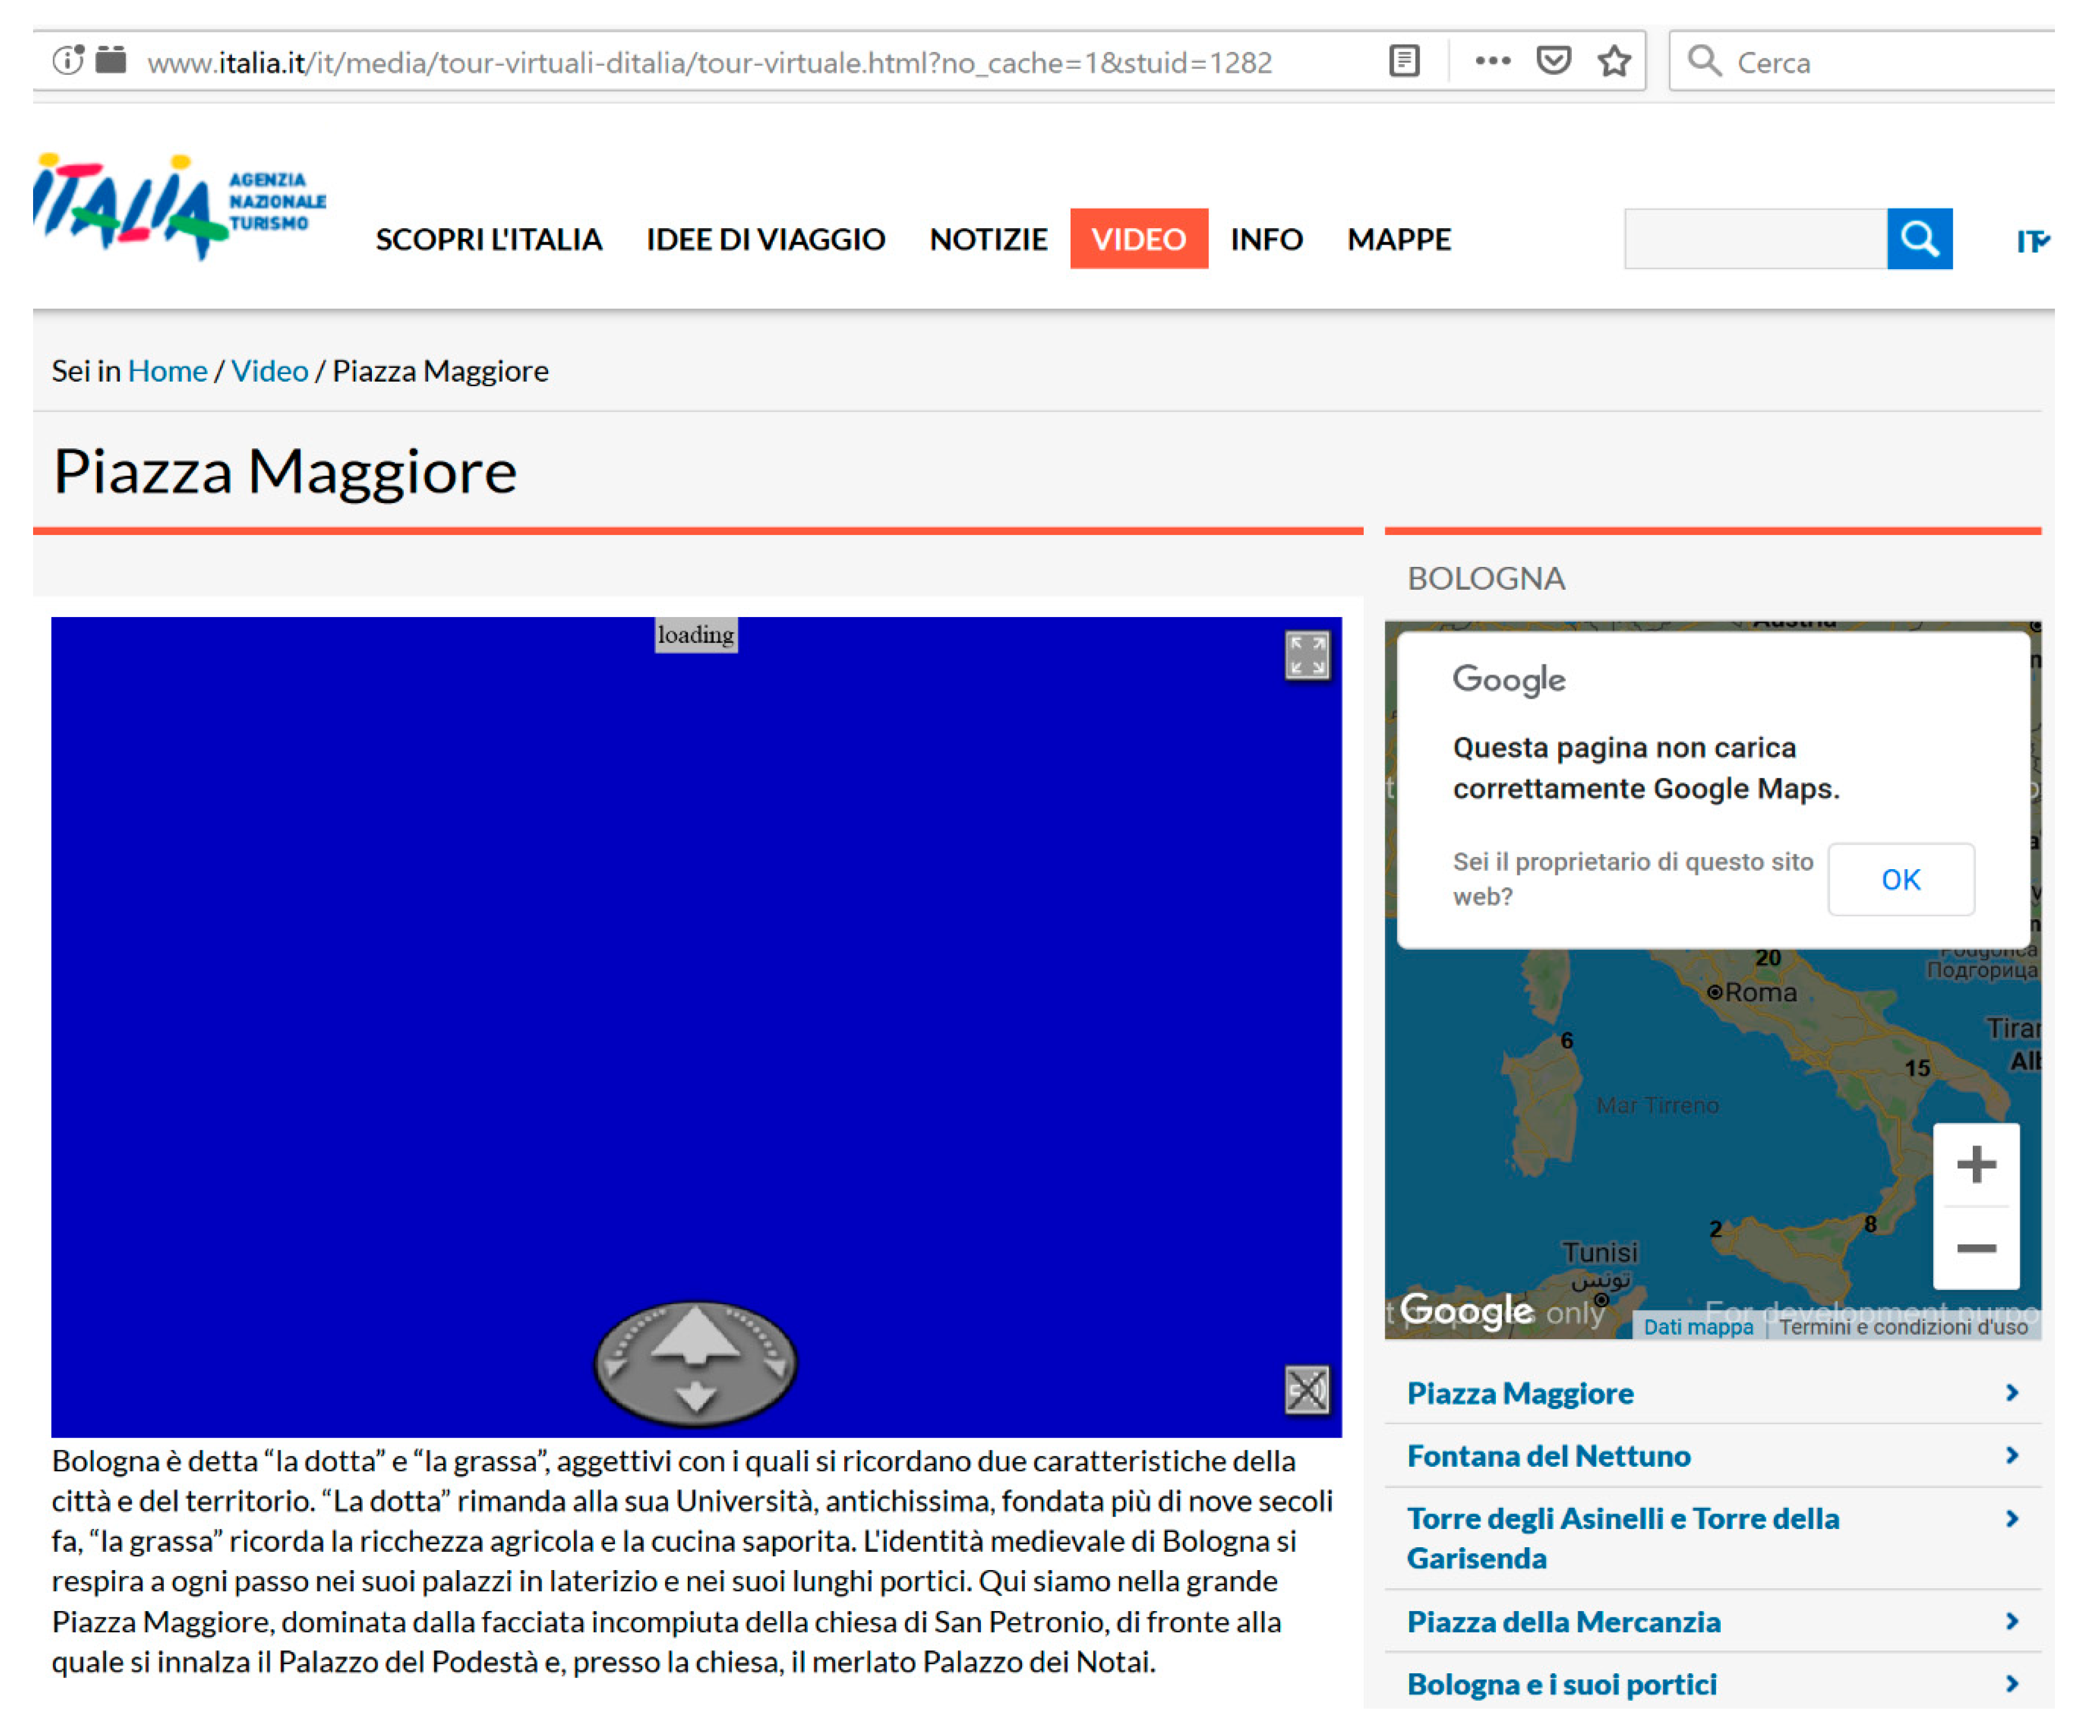
Virtual tours have long been featured on the official website of the main public institution for Italian tourism (Agenzia Nazionale per il Turismo), with an interface that is not immediately understandable and is sometimes outdated.
Now, the interface presents problems that hinders both the consultation of the virtual tour (only using Firefox browser) and its location on the map, as in Figure 4, for “Piazza Maggiore” [20].
At the regional level, the Department of Tourism, Sports and Entertainment of the Sicily Regional Administration, within the tourist districts [21], acknowledges virtual tours as a function of support for the knowledge of cultural and environmental resources.
Despite the good premises in terms of acknowledgment and at the development level, this technology is not widely present on the websites of local public administrations, if we exclude the cases of products developed by private parties and recalled merely for advertising purposes. In fact, the Italian County Towns using virtual tours are:
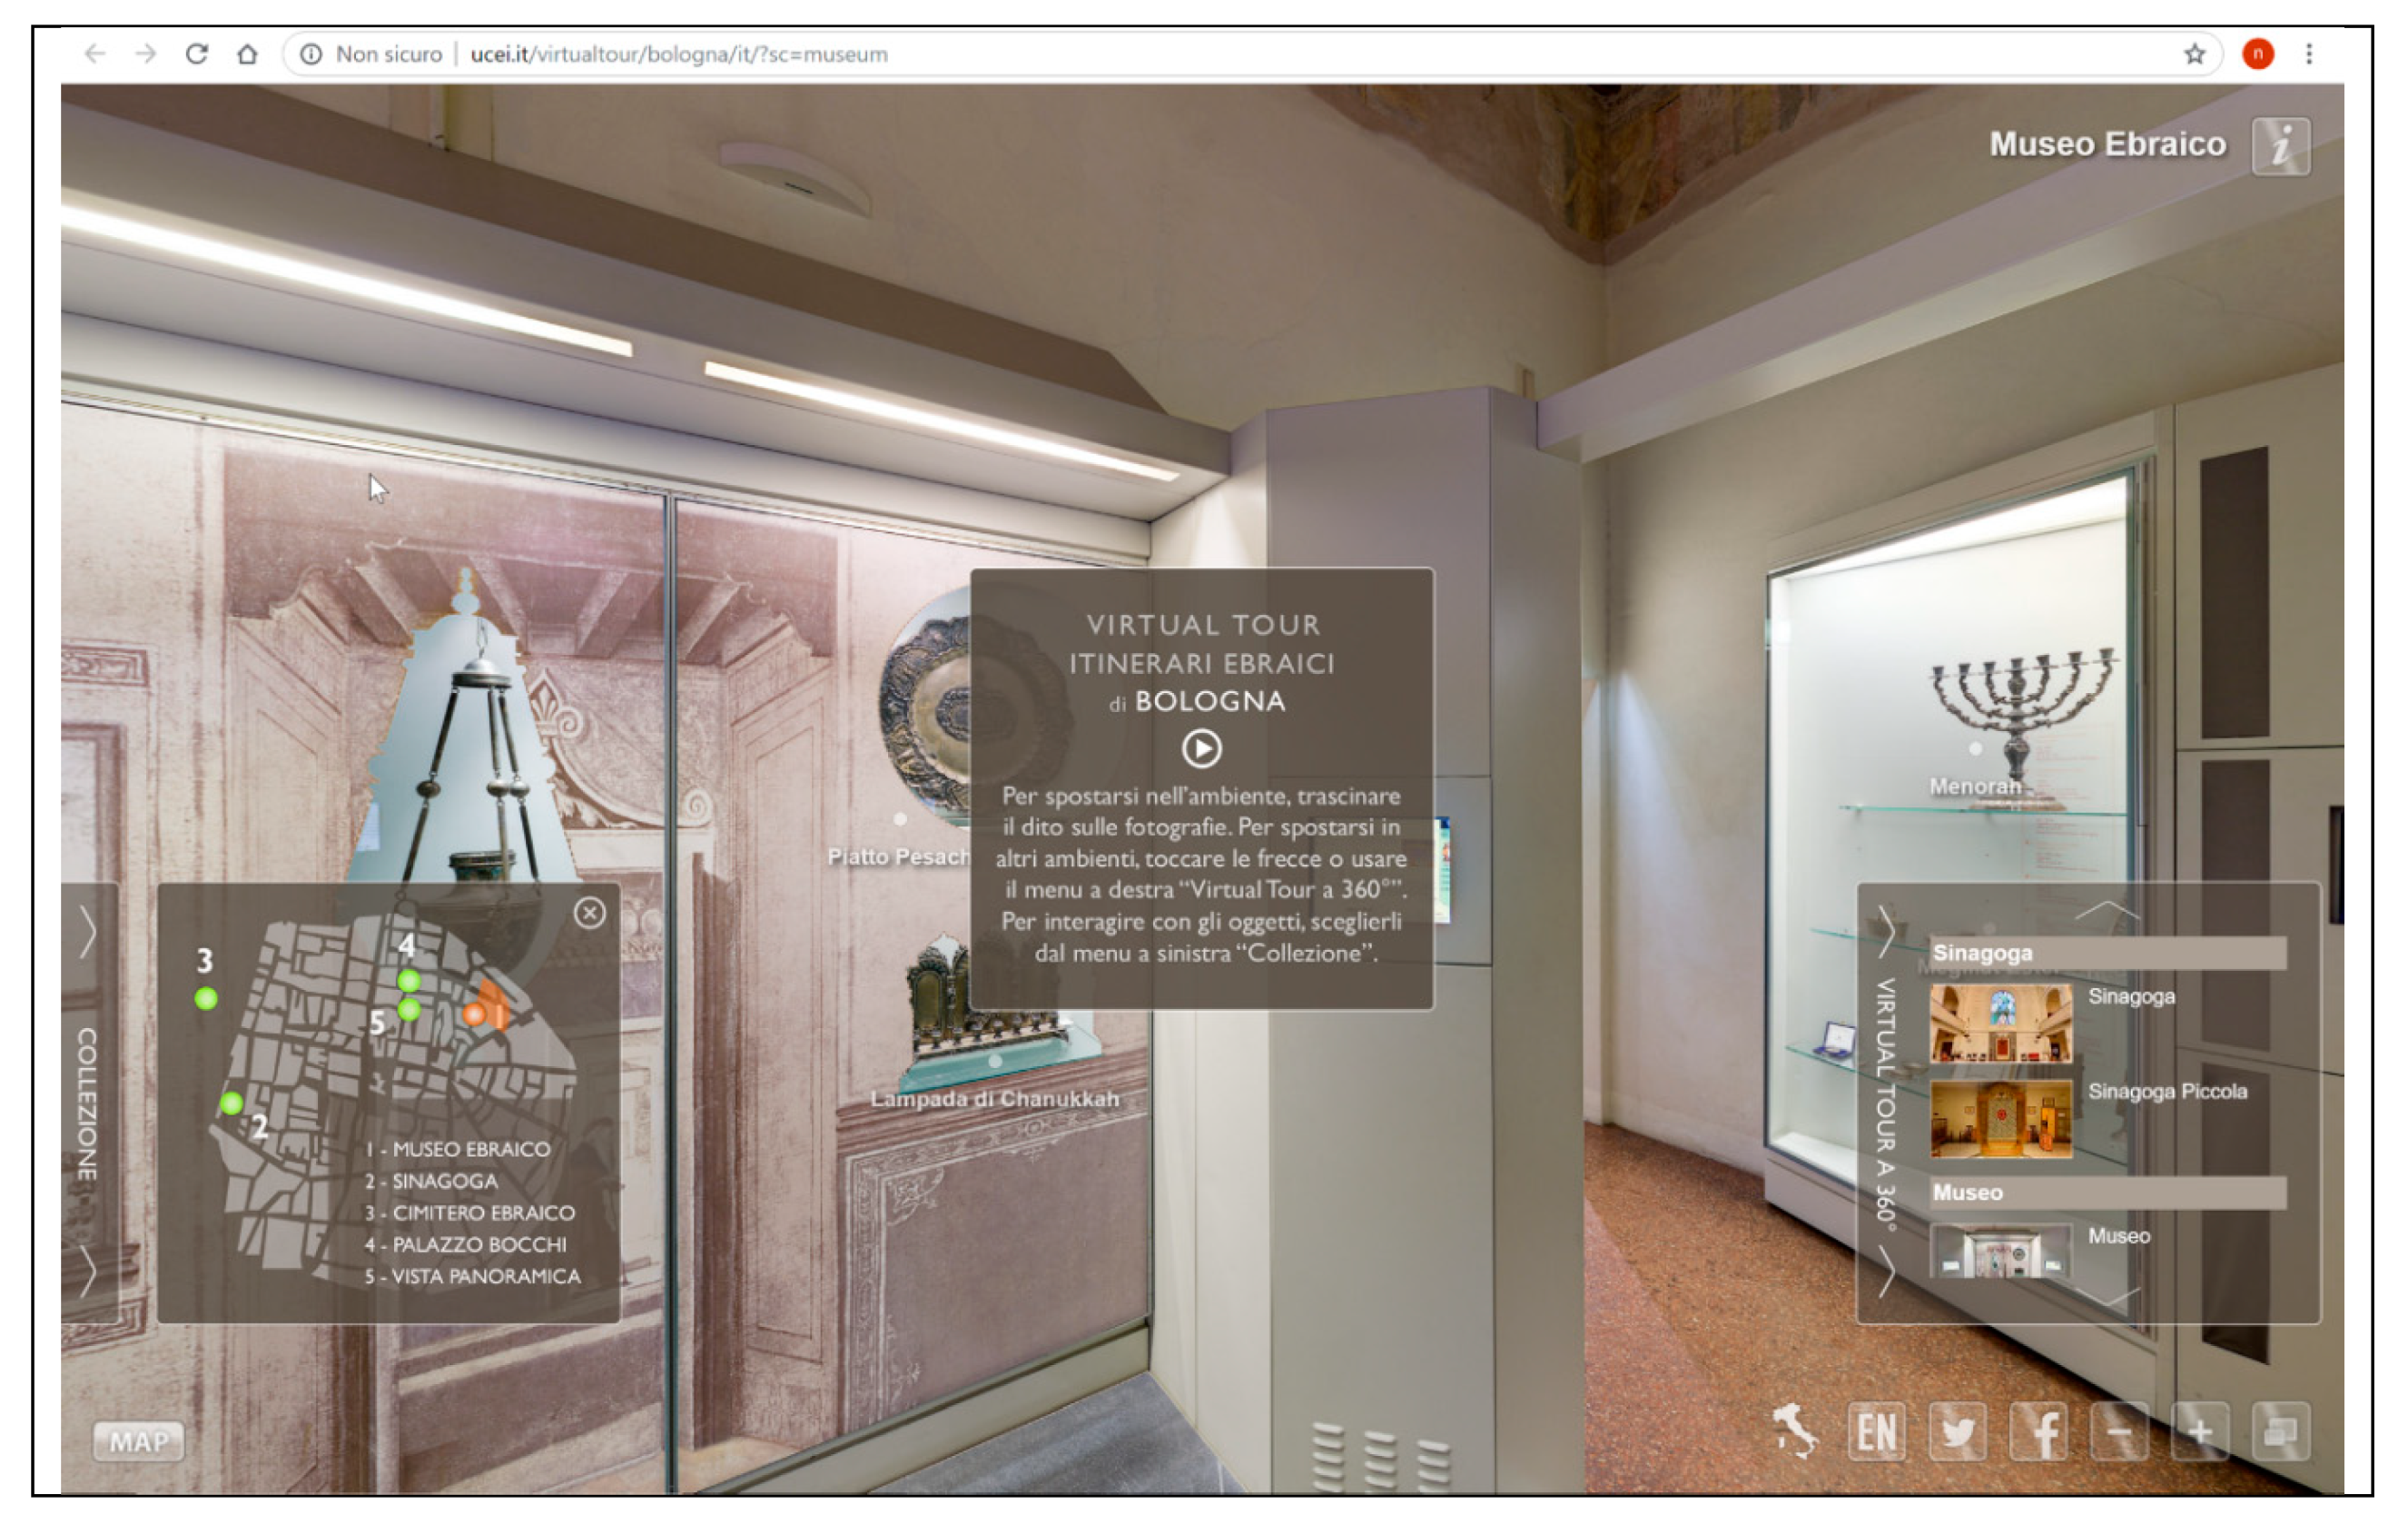
Among the Italian museums, the virtual tour interface (Figure A8) created for the “Union of Italian Jewish Communities” [30] is interesting with respect to several features:
- The presence of a gallery of the objects in the collection; clicking on one of the objects opens the scene of the virtual tour in which it is present, precisely focused on the selected object
- The possibility of sharing the page on social media
- The presence of virtual tours in different areas of the city, as shown on the map
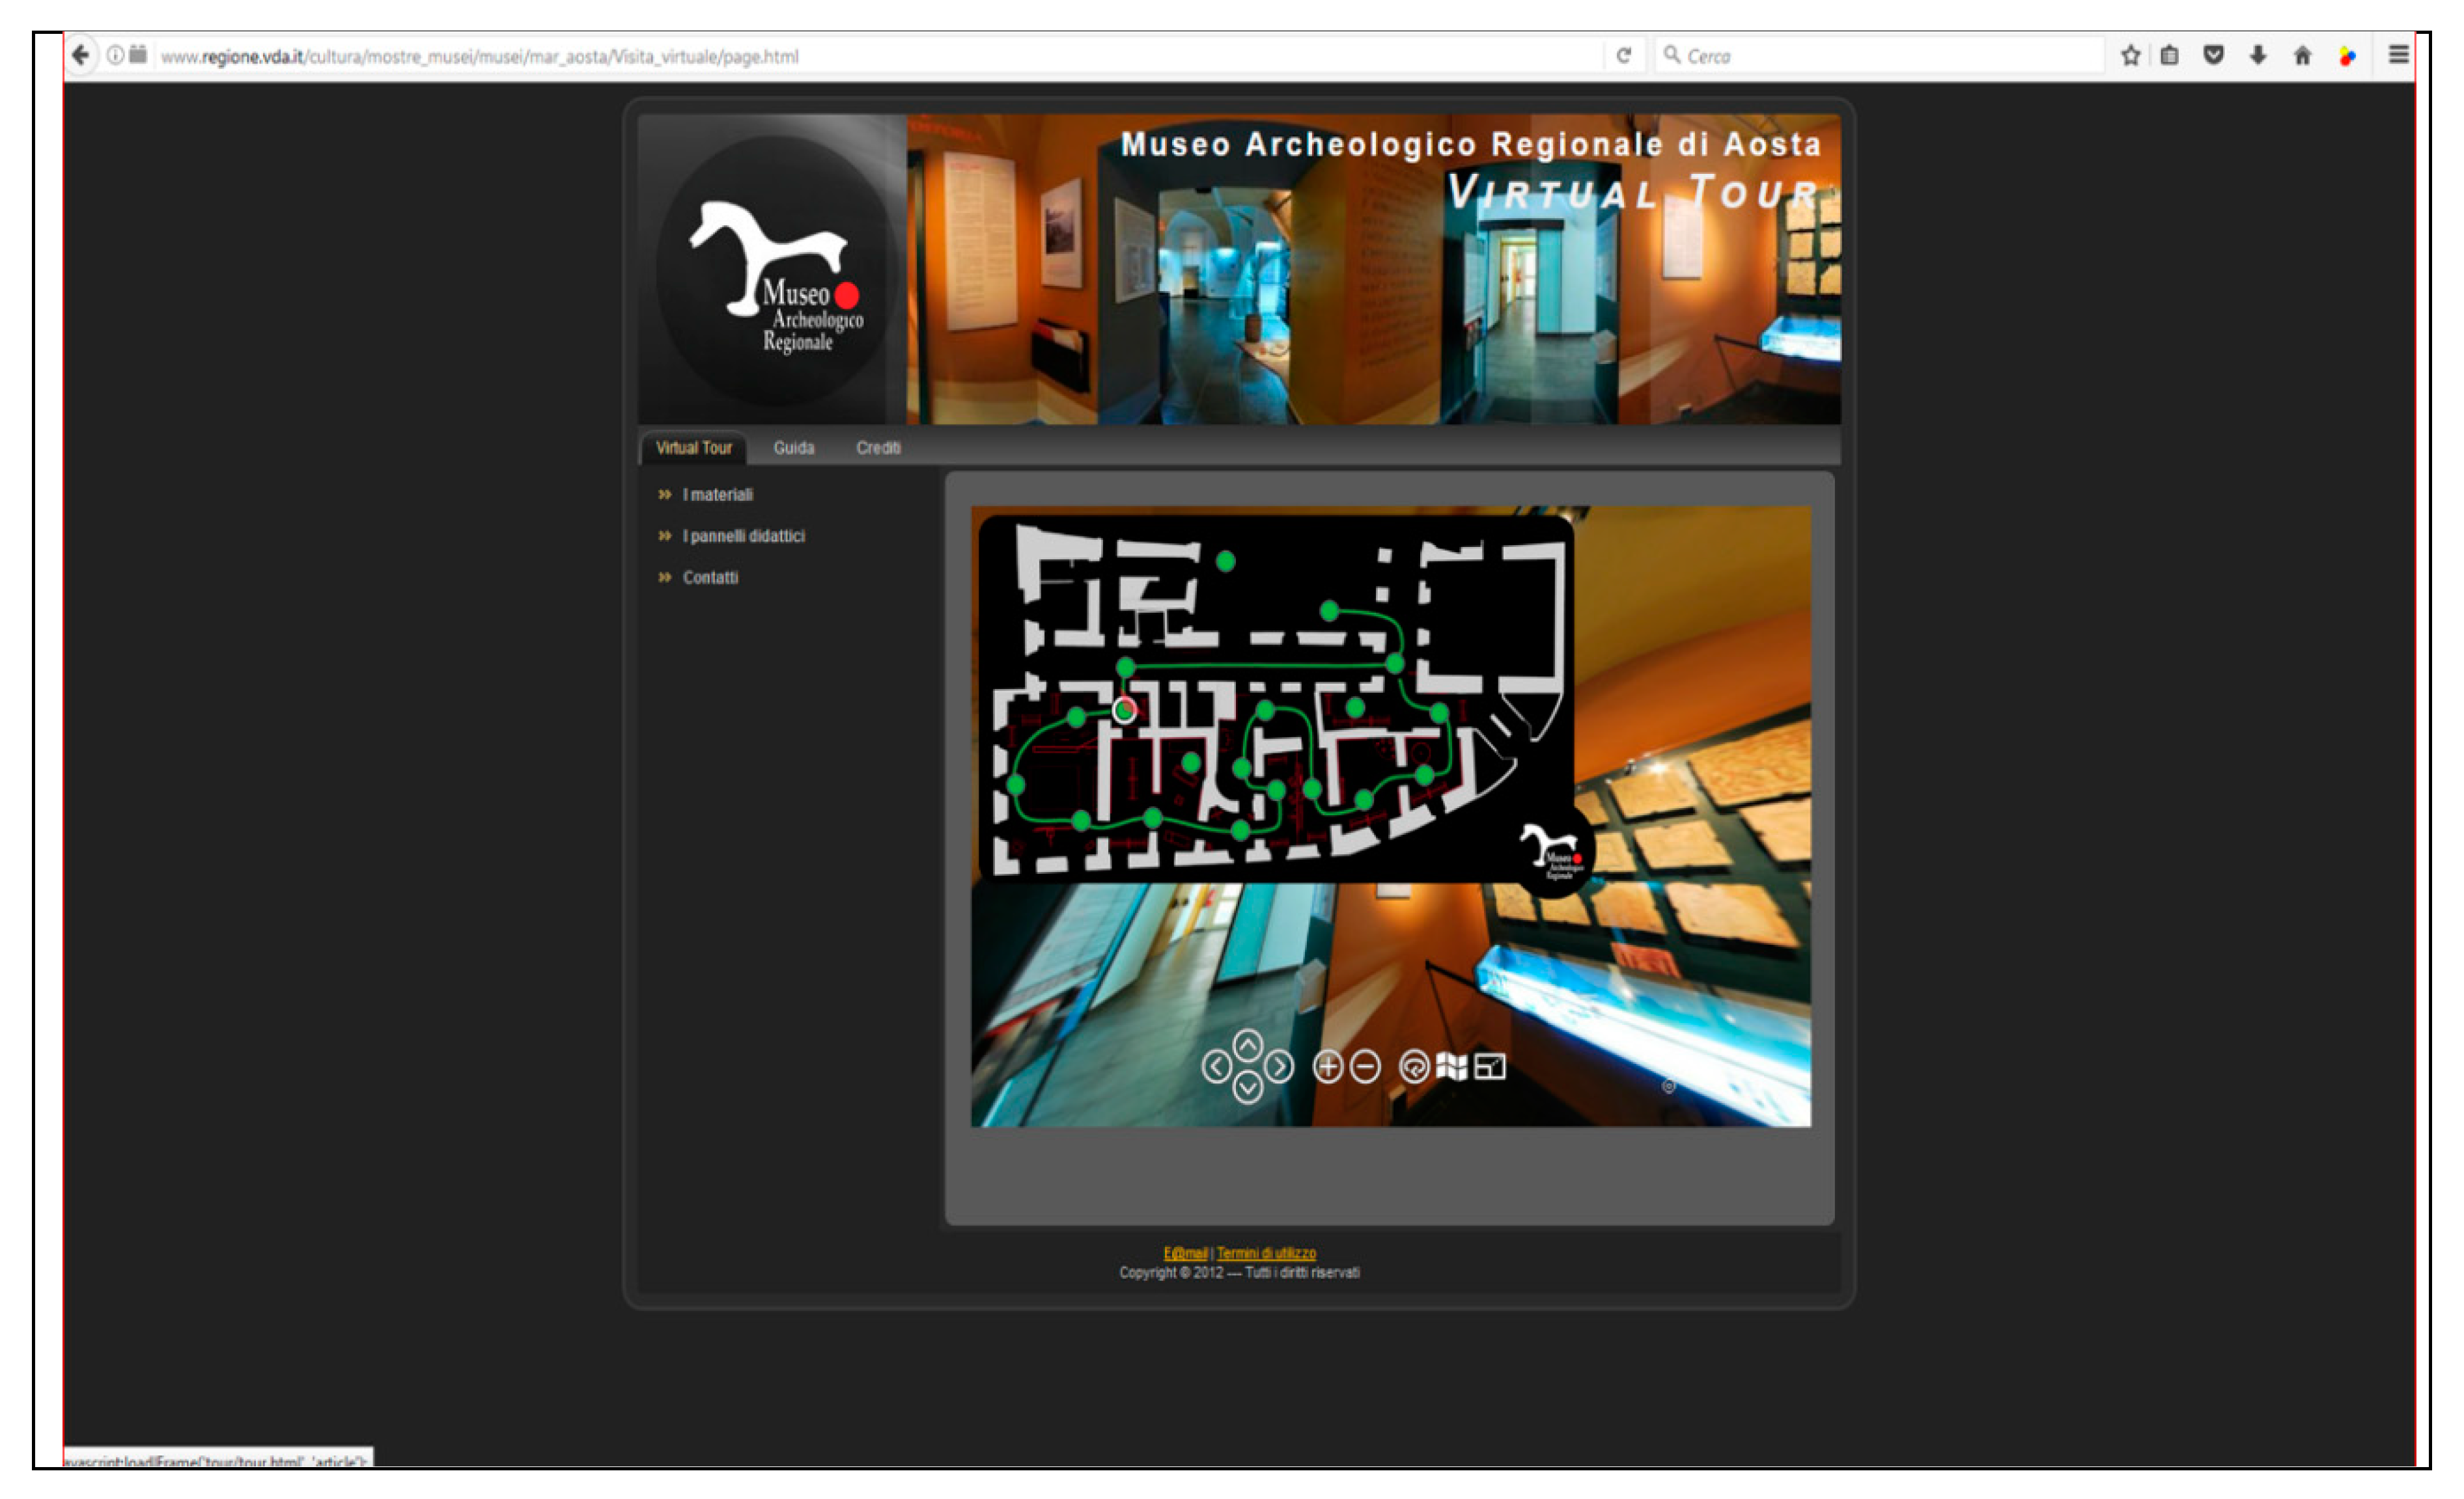
Another interesting example is the Regional Archaeological Museum of Aosta [31], not only for the interface of the virtual tour (Figure A9), but, much more, for the presence of connection hotspots to two types of applications that allow differentiated views based on the nature of the object:
- Rotation on a vertical axis for three-dimensional objects
- Enlargement for two-dimensional objects
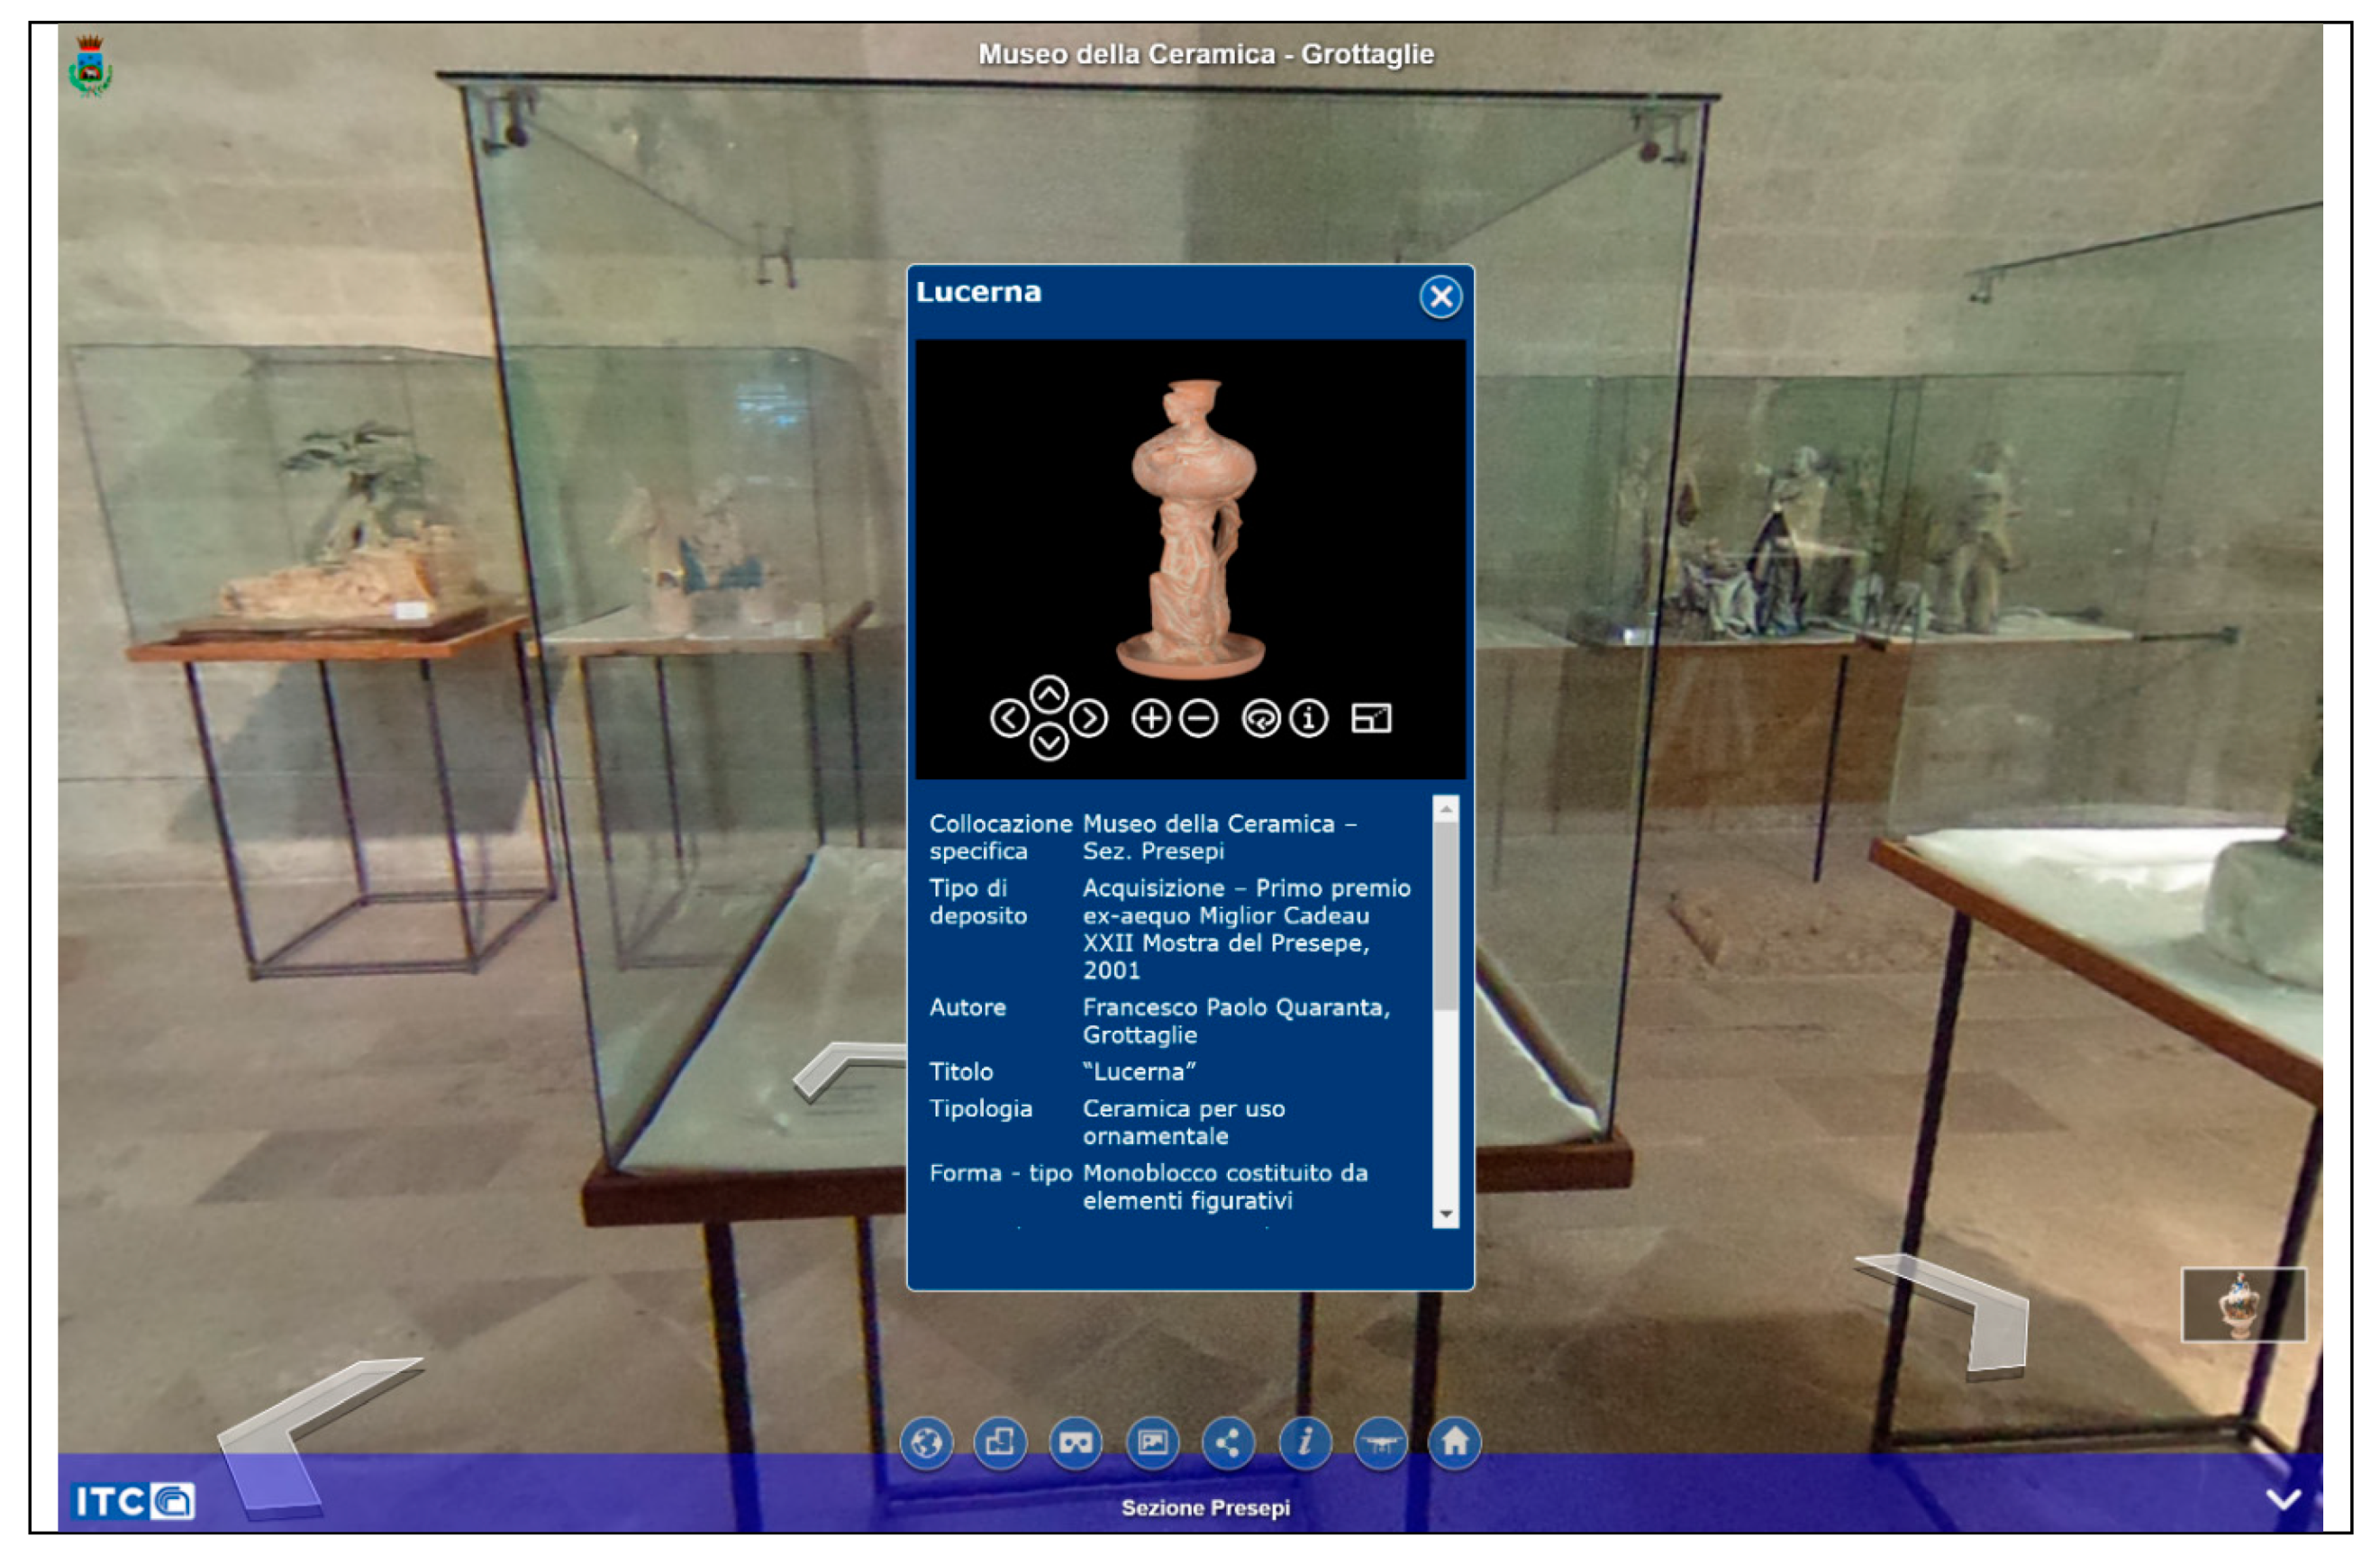
ITC-CNR recently realized a virtual tour for the Museum of Grottaglie (County of Taranto) with views from the ground and from a drone [32]. As for the Regional Museum of Aosta, the virtual tour presents hotspots connecting three-dimensional objects that rotate on a vertical axis (Figure A10) with related information; the objects can be enlarged to full screen with a considerable level of detail.
5. The Design Study for the Museum of Altamura: Materials and Method
In the context described above, the Vi.S.T.A. Project has its main interlocutor in the Regional Directorate of Apulia Museums, within the frame of the Italian Ministry for Cultural Heritage and Activities and Tourism (MiBACT), through a team from the Archaeological museum of Altamura, acting as expert. The Directorate is committed in the management, at the regional level, of a conspicuous heritage of artistic and historic value, with a variegated wealth of cultural legacies. The method adopted for the design of the new tool for the virtual fruition of the Directorate’s assets involved experts in a first phase and users in a second phase.
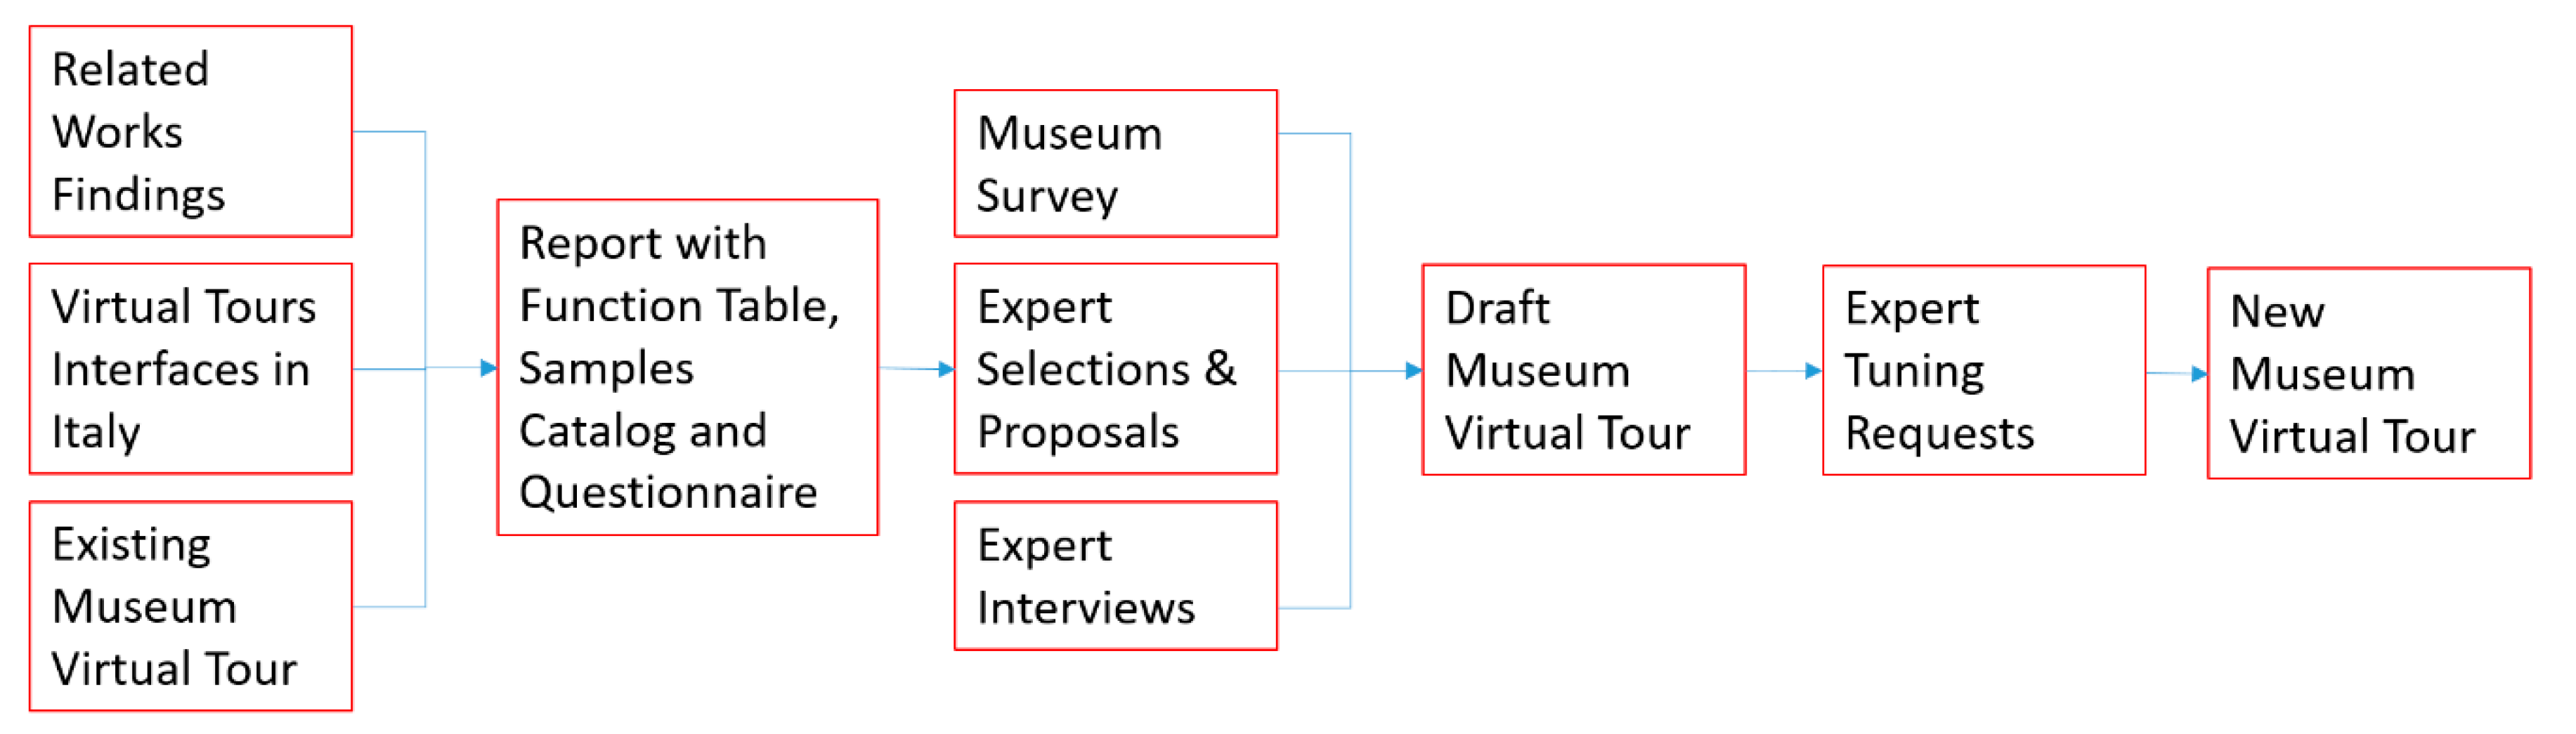
The materials used as “starting data” for expert evaluation are represented by a report (based on the related work findings, the analysis of the virtual tour interfaces developed in Italy, and the analysis of the existing virtual tour for the same museum (assumed to be the starting point for a straightforward readability of points of weaknesses in its resource promotion) with functions table, samples catalog and a questionnaire [33]. A first version of the Museum Virtual Tour was developed, based on the expert selections and interviews as well as the museum survey (Figure 5), giving users only a refined application to avoid them getting confused. In a second phase, which will be taken care of by the project leader, not yet started due to Covid19 restrictions, 120 representatives of all the identified stakeholders will be involved in the experimentation stage for testing of the first version of the virtual tour developed according the expert evaluation.
5.1. The Design Method for the New Tool
The Vi.S.T.A. Project is based on the development of a design cooperation approach aimed at intersecting the real needs and preferences of those who will benefit from the developed technology. Such an approach allows actions to be oriented towards the realization of custom tailored, user-oriented services. Activities are then centered on the final user and enabling technologies, paying special attention to the definition of the reference frame of variegated users’ exigencies and to the exploitation of open-source potentialities. The user engagement pattern of the Vi.S.T.A. Project follows the Business Community model and considers partnerships involvement through a dedicated staff from the Museum acting as experts (in the field of cultural resource communication) in the first phase, which this article focuses on, and through different stakeholders acting as users in a second phase, which will be addressed later and managed by Technosoft and System Project. At the same time, the project partnership will activate dedicated social media pages in order to rely on an ongoing exchange of ideas and allow for communication of further needs.
5.2. The Case Study
The cultural sites and assets entrusted to the management of the Puglia Regional Museum Directorate consist of 13 reference buildings and/or complexes, distributed across the Counties of the region:
- Antiquarium and archaeological site of Canne della Battaglia, Barletta (County of Barletta-Andria-Trani)
- “Castel del Monte” (castle), Andria (County of Barletta-Andria-Trani)
- Angevin castle, Copertino (County of Lecce)
- Suevian castle, Bari
- Suevian castle, Trani (County of Barletta-Andria-Trani)
- Cloister of the Monastery of St. Domenico, Taranto
- “Girolamo e Rosaria Devanna” National Gallery of Apulia, Bitonto (County of Bari)
- National Archaeological Museum, Gioia del Colle (County of Bari)
- National Archaeological Museum and archaeological site of Egnazia, Fasano (County of Brindisi)
- National Archaeological Museum, Altamura (County of Bari)
- National Archaeological Museum, Manfredonia (County of Foggia)
- “Jatta” National Museum, Ruvo di Puglia (County of Bari)
- “Sinesi” Palace, Canosa di Puglia (County of Barletta-Andria-Trani)
Among these, the National Archaeological Museum of Altamura was selected as the pilot case for the development of the virtual tour with 3D models, due to specific exigencies expressed by the Directorate. The National Archaeological Museum of Altamura was employed with the aim of gathering the many archaeological findings of the whole territory, from prehistory to the Middle Ages. The exhibit represents the populating process of the Alta Murgia area and forms a synthesis of the Peucetian civilization across the inland up to the borders between Apulia and Basilicata regions.
During a series of excavation campaigns, since the early post-war period and during the years of reconstruction, exactly in the area that hosts the Museum today, a segment of Peucetian built-up fabric came to light. The museum building was officially inaugurated in 1993, in concurrence with some important findings of the nineties, such as the Neanderthal skeleton of the “Man of Altamura”, brought to light in a karstic cavern, and a paleontological site with dinosaur footsteps within a quarry, representing further attractors of public interest. The structure where the museum collection can be visited today dates back to the end of 1960, when the two-story building was built close to the historic center of the town. Inaugurated in 2017, the current setting is articulated through a multimedia itinerary with a didactic slant. On the first floor, the exhibit is dedicated to the different civilizations that followed one another in the Alta Murgia area, from pre- and proto-history up to late antiquity, with objects from residential settlements and necropolis of the surroundings. The second floor is totally dedicated to the European Paleolithic age, with specific deepening on central-southern Italy. A wide area hosts the exhibition “Prehistory of food. At the origins of bread”, originating from the willingness to recreate the strong connection with the agricultural vocation of the territory.
5.3. The Existing Virtual Tour of the National Archaeological Altamura Museum
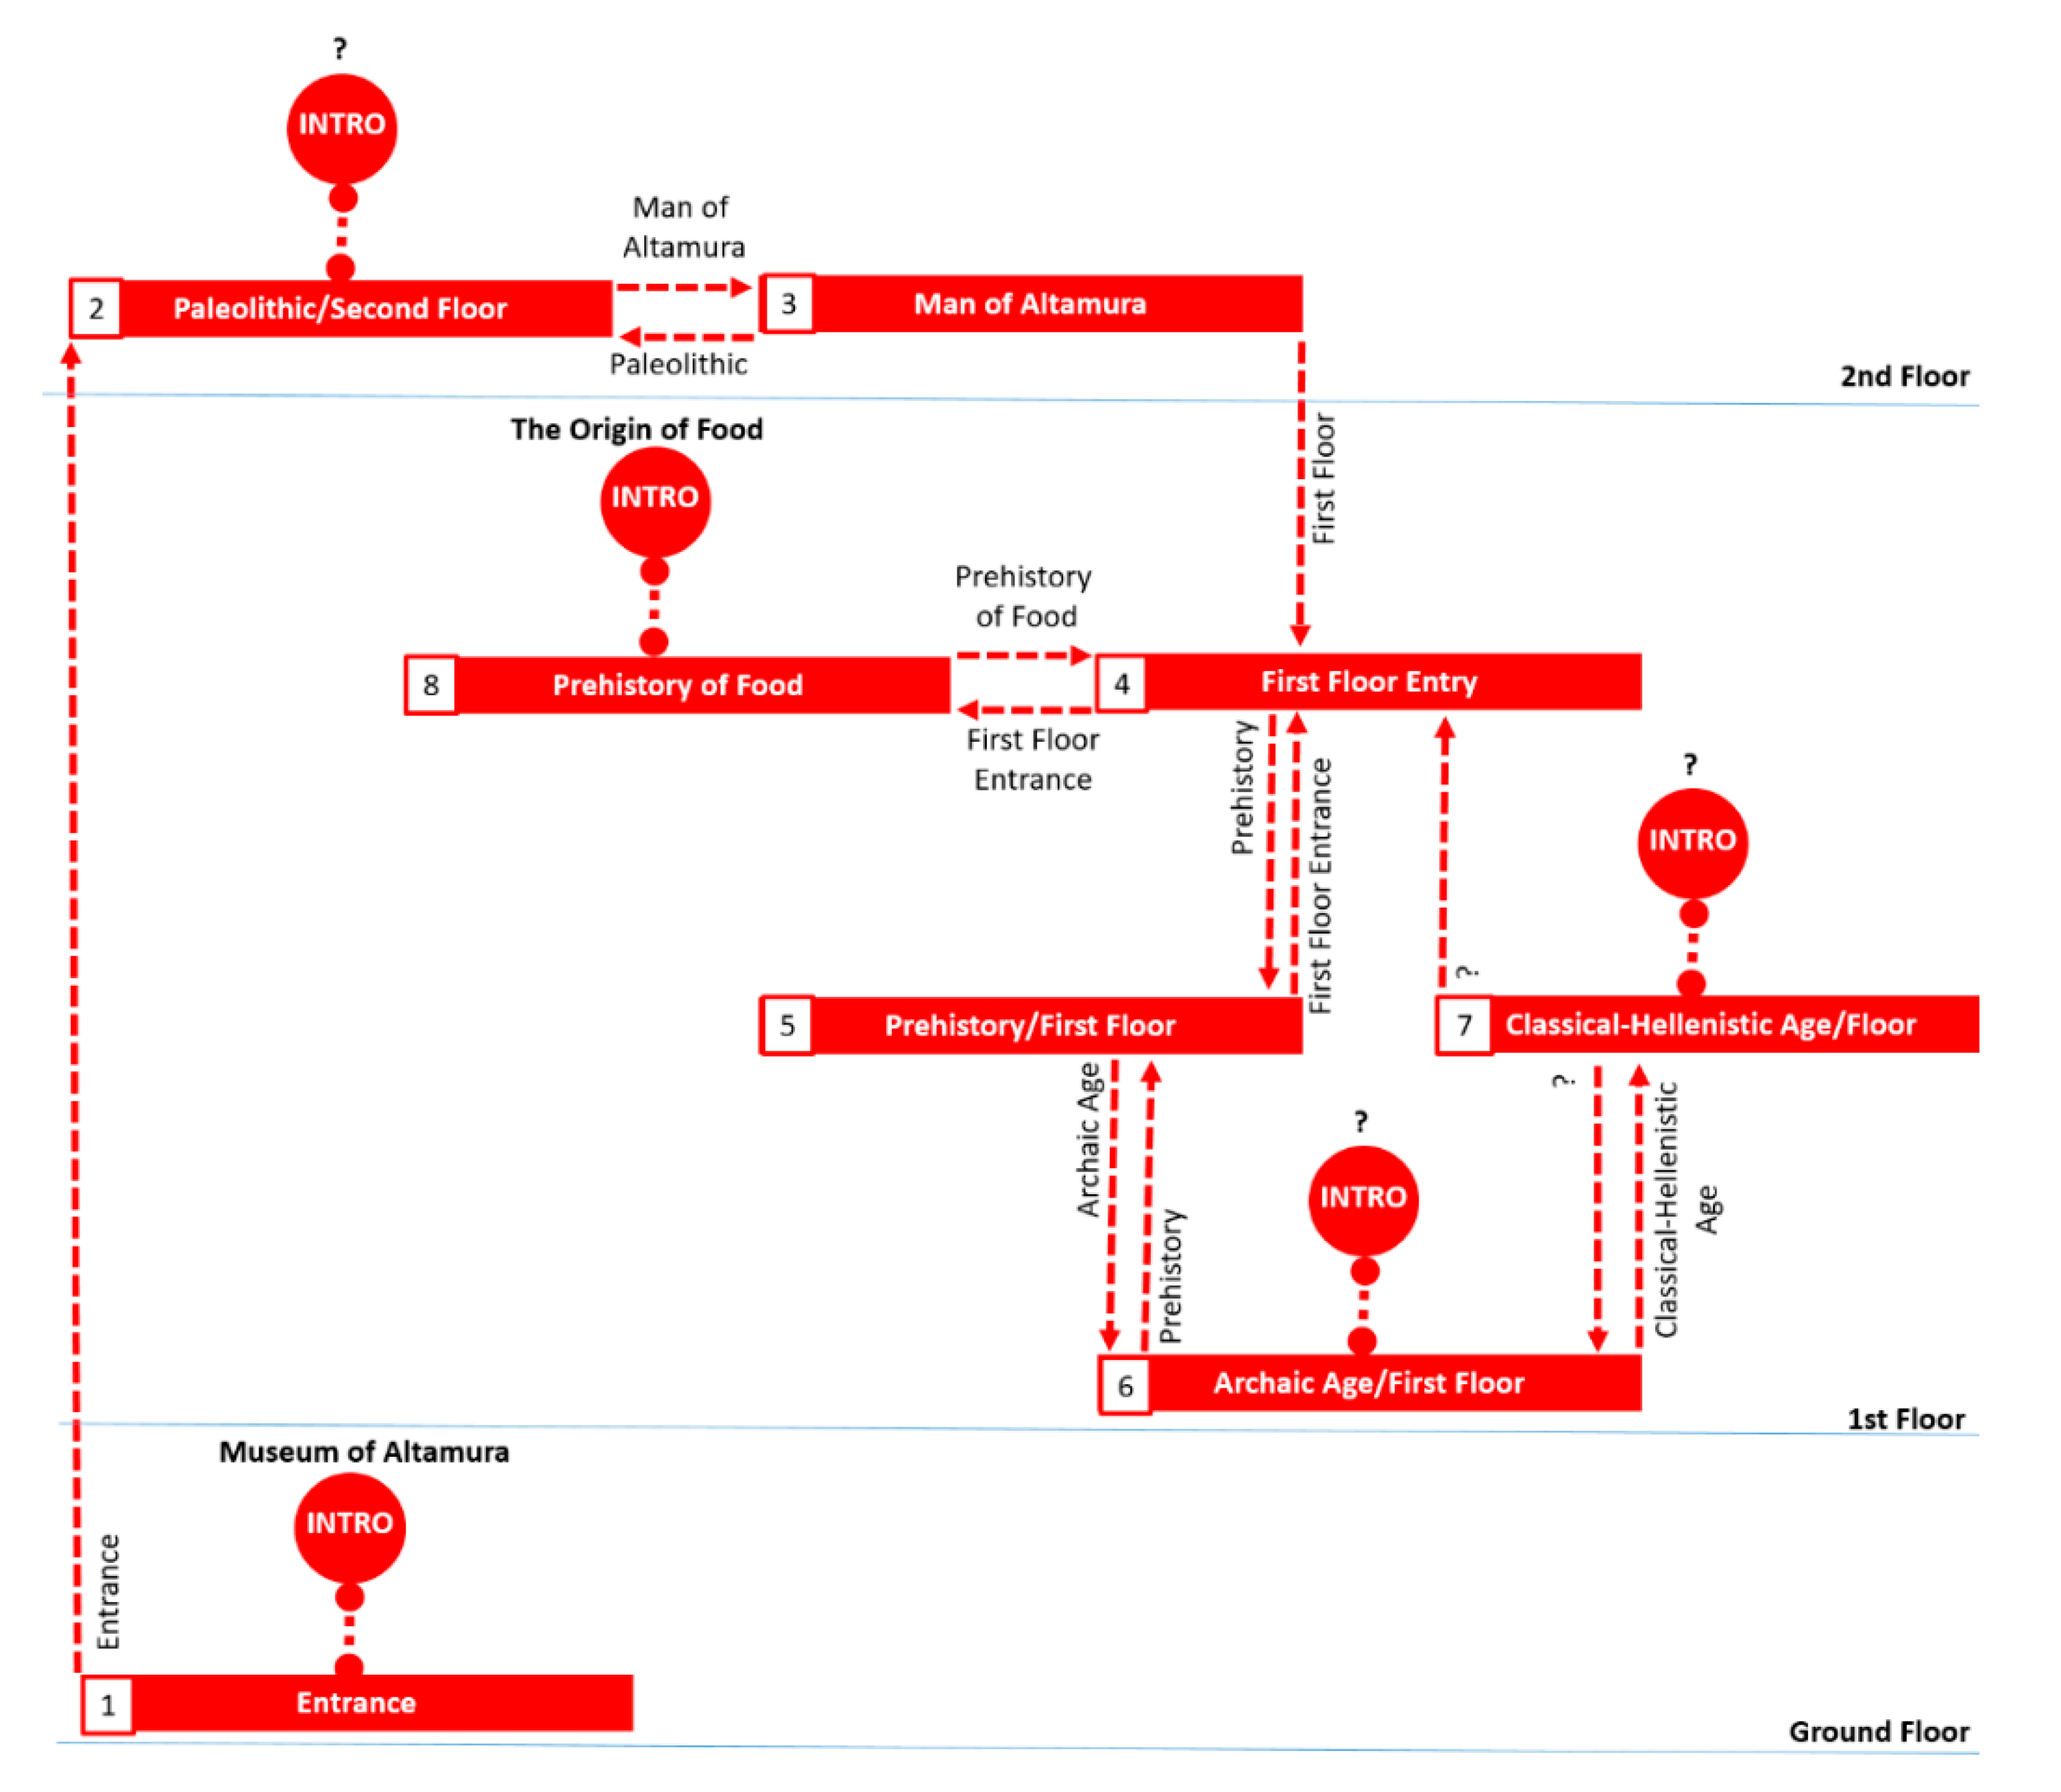
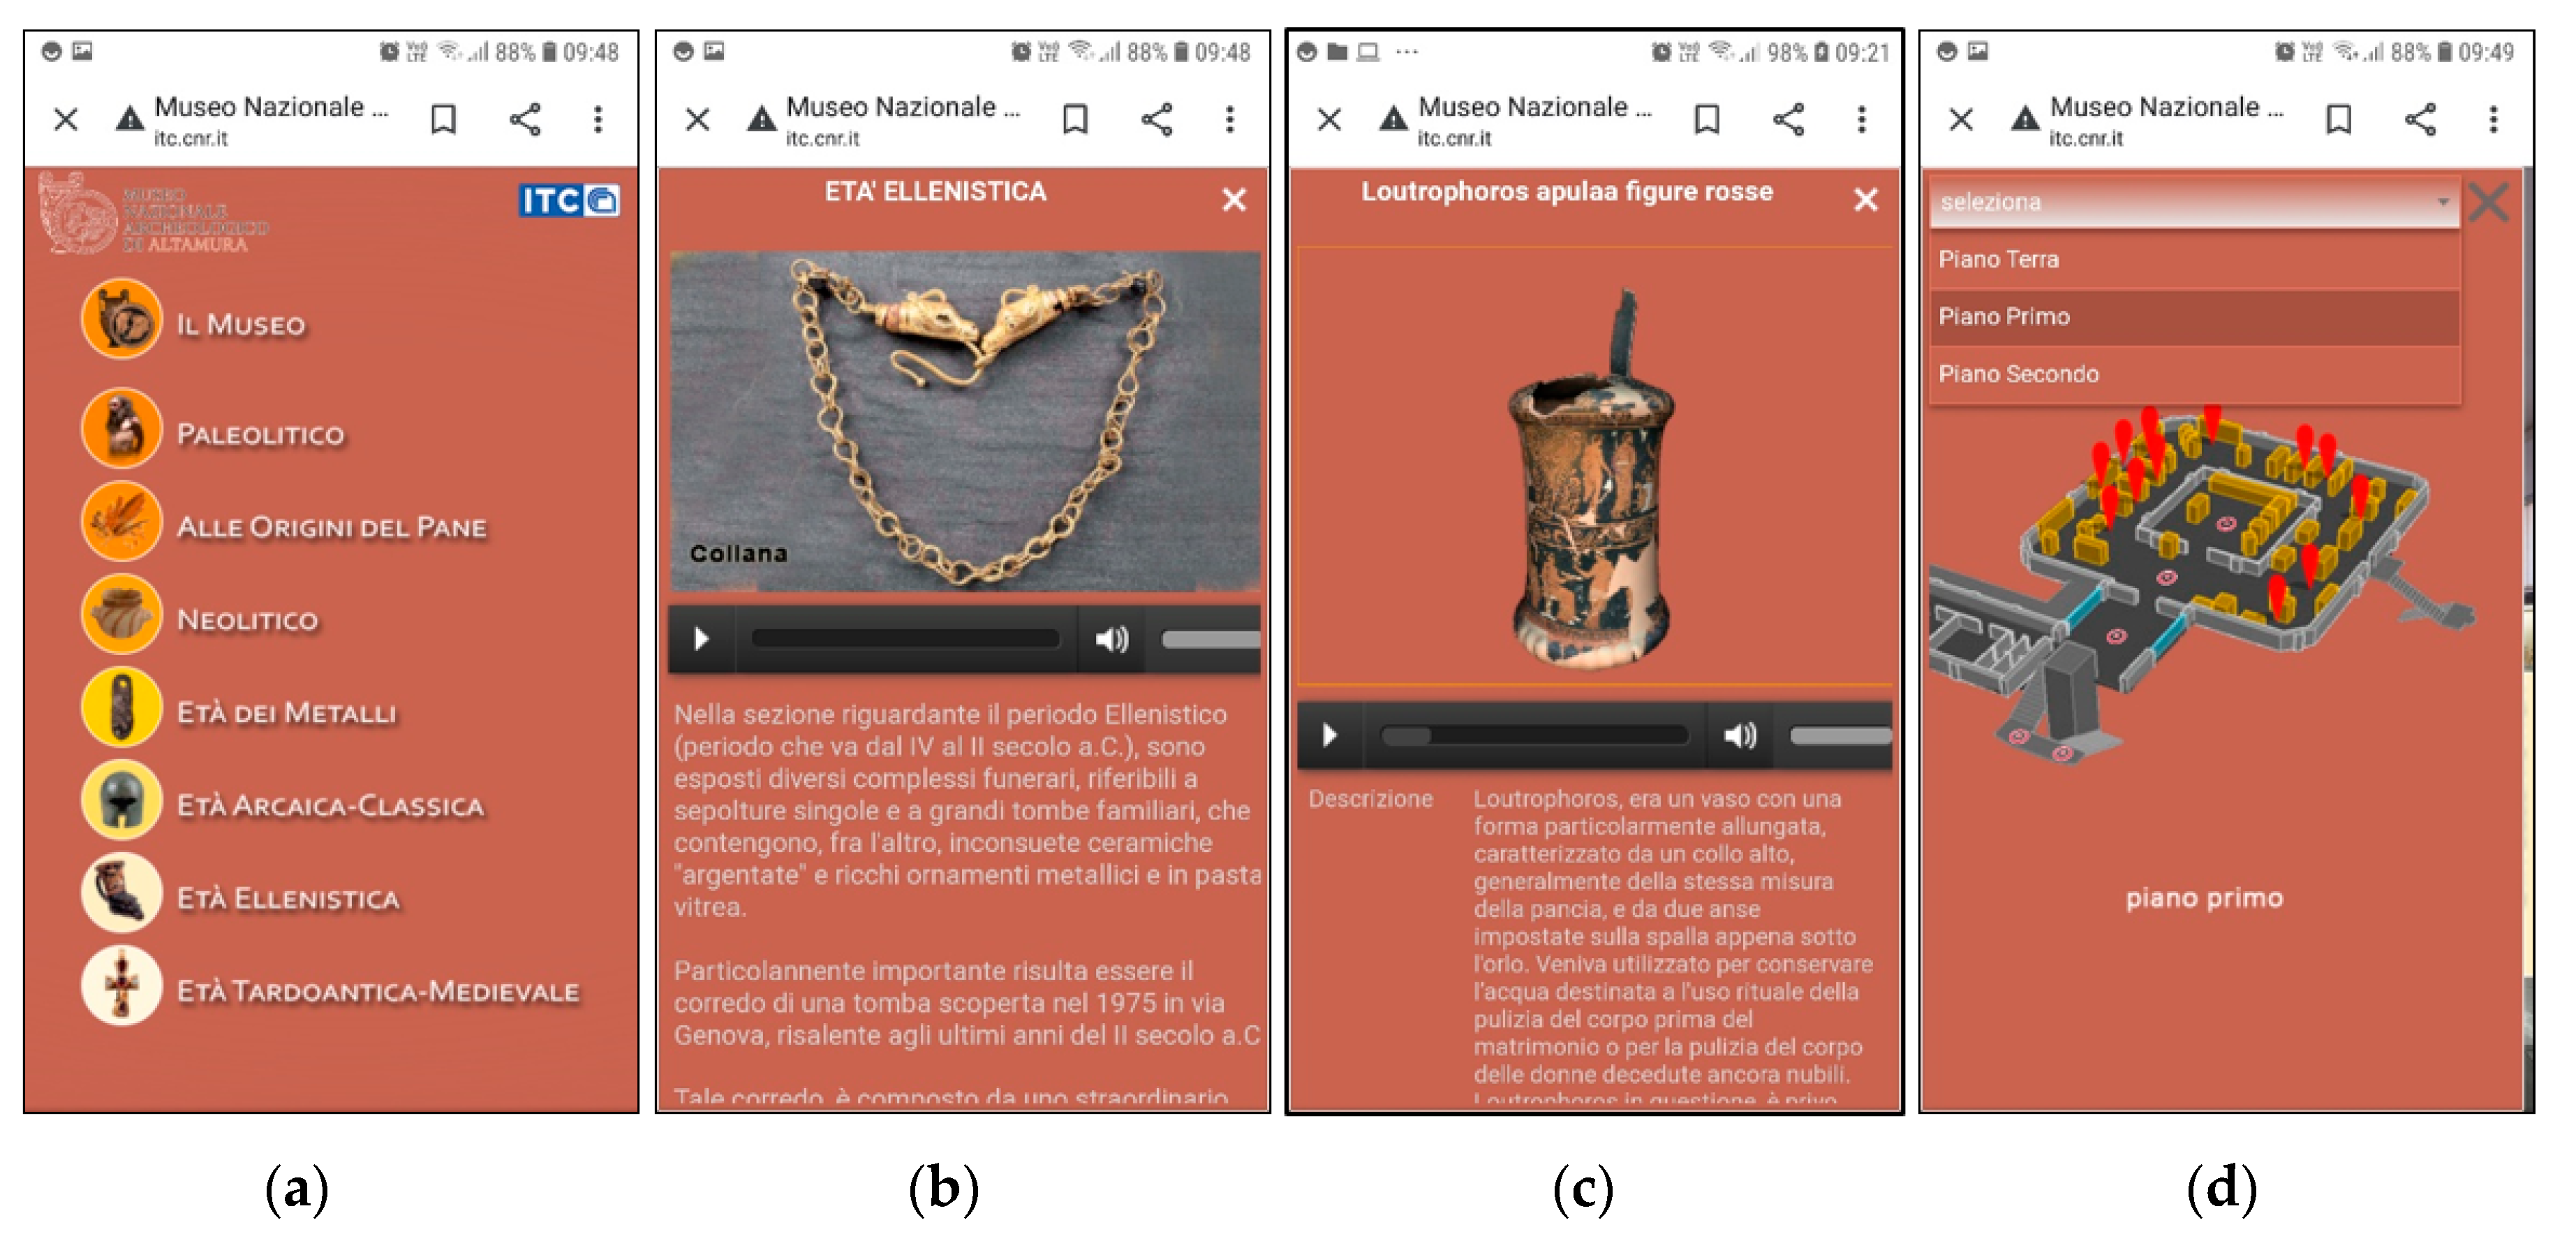
After the selection of the case study, the starting phase of the design process consisted of the analysis of a virtual tour previously developed for the museum, no longer available online. The interface was examined in order to gain a better knowledge of existing lacks and improvement potential for developing the new version. The virtual tour, developed in 2012, is organized into eight main scenes, corresponding to the sections of the museum (Figure 6):
- One on the ground floor (1. “Entrance”)
- Five on the first floor (4. “First Floor Entry”; 5. “Prehistory/First Plan”; 6. “Archaic Age/First Floor”; 7. “Classical-Hellenistic Age/Plan”; 8. “Prehistory of Food”)
- Two on the second floor (2. “Paleolithic/2nd floor”; 3. “Man of Altamura”)
The tour also contains six information windows about the scenes: “The museum”; “The Man of Altamura”; “Prehistory of food”; “Prehistory”; “Archaic Age”; “Classical Hellenistic Age”.
The information windows can be opened at the center of the interface by clicking on a hotspot represented in the scenes by a large red circle with the word “Intro”; they are closed by clicking on the red “X” character placed at the end of the text. In some cases, this character is placed on the edge of the window, or outside.
The hotspots are labeled only for two sections (“Museum of Altamura” and “The Origin of Food"); moreover, the text in the label is not the title in the information window.
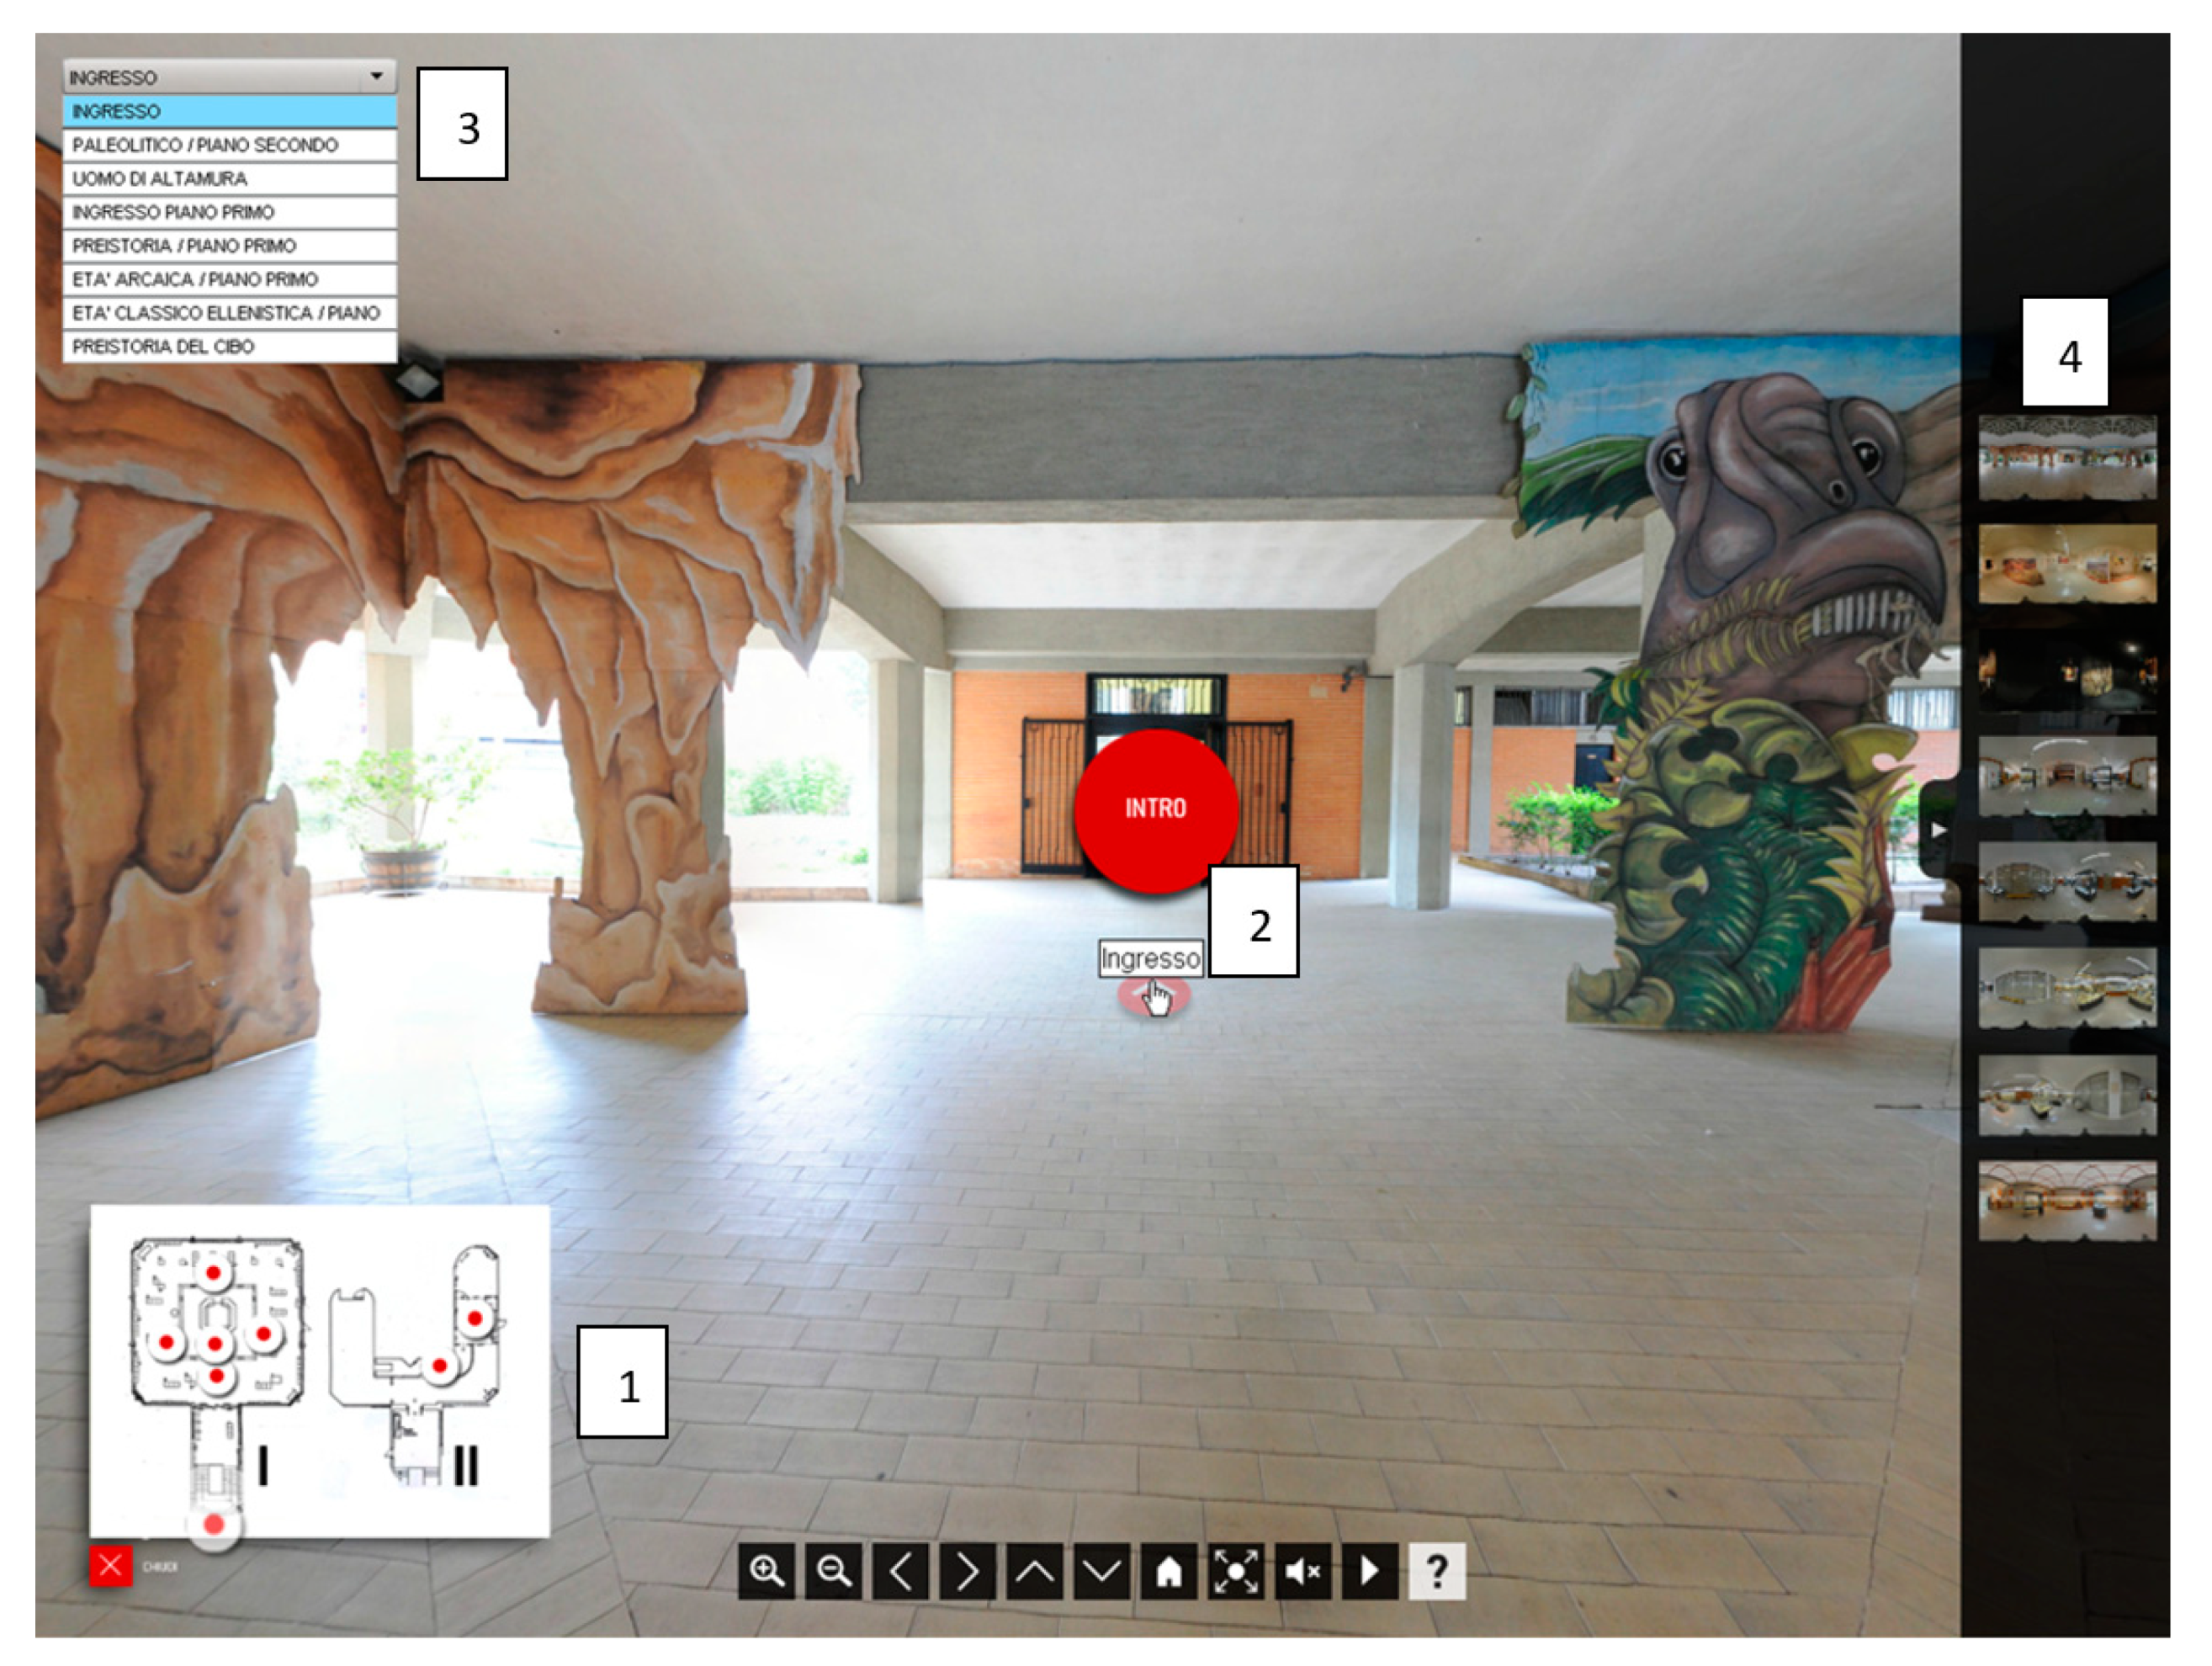
Four ways are provided to navigate among the sections:
- By clicking on a point of interest represented in the floor plans through a white circle with a red dot in the center (Figure 7-1).
- By clicking on an “arrow” hotspot (a small red circle with a centered white arrow), usually labeled with the name of the section that will be opened (Figure 7-2).
- By selecting the title of a museum section from the drop-down menu (Figure 7-3); when the drop-down menu is closed, the title of the section is displayed.
- By clicking on one of the equirectangular image of the scenes in a window (Figure 7-4).
Within the museum’s virtual tour, it was possible to observe areas of improvement and formulate possible solutions as follows:
- The floor plans and scenes preview windows have different kinds of interaction; solution: unify the methods of interaction, using the “tab” to open/close the window as for the scenes preview
- The scene preview uses equirectangular photos with strong distortions; solution: use a screenshot of the virtual tour in the initial frame
- The hotspots in the floor plans have no labels to identify their linked scene; solution: label them with the name of the scene, like in the “arrow” hotspots
- The label of link 1-2 is incorrect; solution: update
- labels in “arrow” hotspots correspond to scene names only for links 2-3; 5-4; 8-4; 4-8; solution: use the same criteria for all hotspots
- Labels are not always defined (links 6-7 and 7-4); the title of the connected scene must be assigned to the “arrow” hotspot label
- The links 2-1 and 4-2 are not bi-directional; solution: provide a return between scenes physically connected
- The link 4-7 between scenes physically connected is missing; solution: add
- “Intro” hotspots are present at opening the initial scene (“Home”) and scenes 1, 2 and 8; instead, it is necessary to navigate to find it in scenes 5, 6 and 7; solution: display the "Intro" hotspot at opening the scene to give user information promptly
- Not all “Intro” hotspots have a label; solution: assign the title of the information window to the “Intro” hotspot label
- The label of the “Intro” hotspots and the title of its information window do not match; solution: match label and title
- The hotspot of the entrance scene of the ground floor is located on the first-floor plan; solution: display hotspot in the proper floor plan
- The use of the uppercase character in the titles of the scenes together with the textual indication of the plan saturates the available space; solution: use texts in lowercase and replace texts indicating the plan with numbers (e.g., floor 1 instead of first floor)
- Not all titles indicate the plan; solution: include always the floor plan in the title to allow users a better orientation
- The entrance on the ground floor is linked to a scene located on the second floor; solution: provide links between scenes physically connected, or use a different hotspot type to “jump” to scenes not physically connected
- The credits window is displayed only at the beginning of the virtual tour; solution: provide a “Credits” button in the command bar
- Information on the artifacts of the collections is not available; solution: provide information about the most important pieces of the collection.
5.4. The Functional Analysis
After the recognition of the virtual tours interface in Italy (Section 4) and taking into account the issues in the related works section (Section 3), a comparative table with the functions implemented was built (Table 2).
The examination of the case studies reveals that there is no standard in the types of available functions; moreover, the interface developed by our Institute already for the case studies of Siracusa and Grottaglie is more articulated, as shown in Table 2.
The use of scene previews is theoretically very useful for having an overall idea and being able to properly select a scene.
However, the software uses equirectangular images, which, although essential for producing the virtual tour, provide a poorly understood representation of the scene in question, being a flat representation of a spatial environment.
Therefore, previews using scene photos should be preferred, which would, however, require additional work, without providing a substantial help to users.
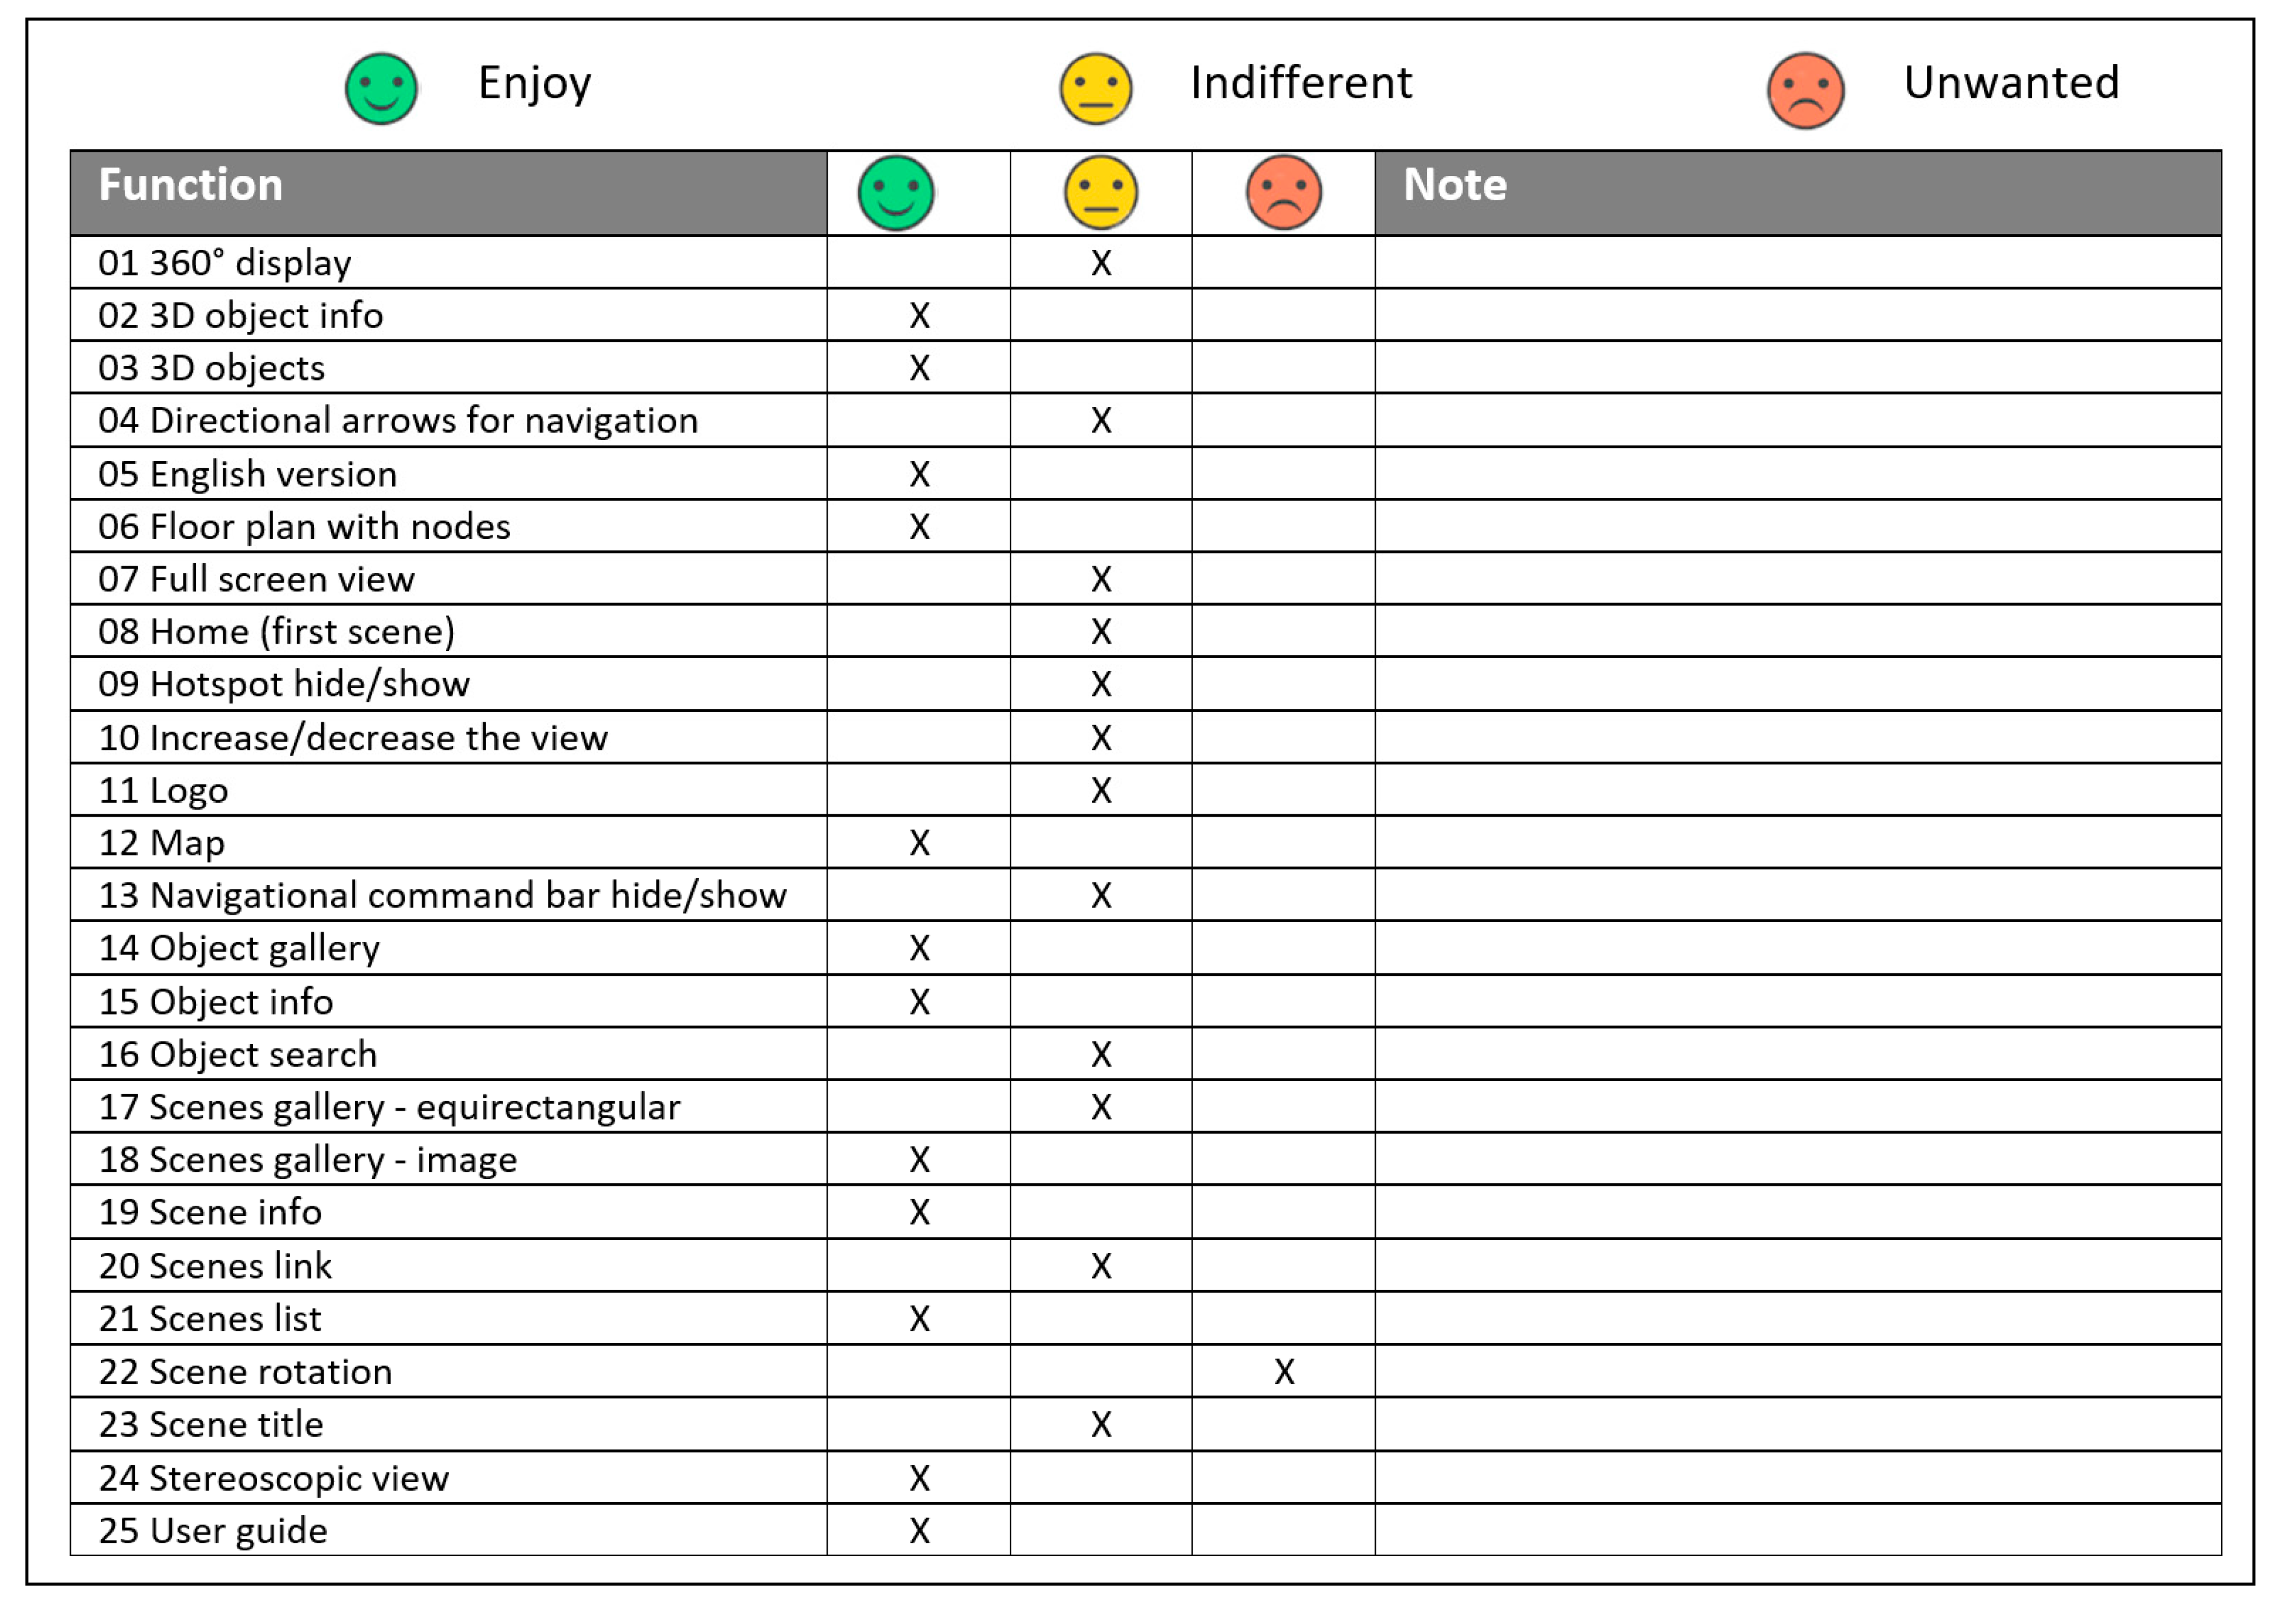
The Archeological Museum of Altamura then received the aforementioned report [33], including the data in Appendix A and a catalog with a sample (Figure 8) of the virtual tour functions reported in Table 2 in order to select the most suitable function needed, giving suggestions where needed.
Their staff, already involved in the creation of the existing museum virtual tour, offered their knowledge about the museum’s context and requirements, as well as about the visitors’ needs by filling in the questionnaire with the list of functions (Figure 9).
6. Results
The virtual touring section, as previously mentioned, has three components: an interactive map of the Regional Directorate of Apulia Museums, a virtual tour of the National Archaeological Altamura Museum and 3D models viewer of its main artifacts.
6.1. The Multimedia Interactive Map
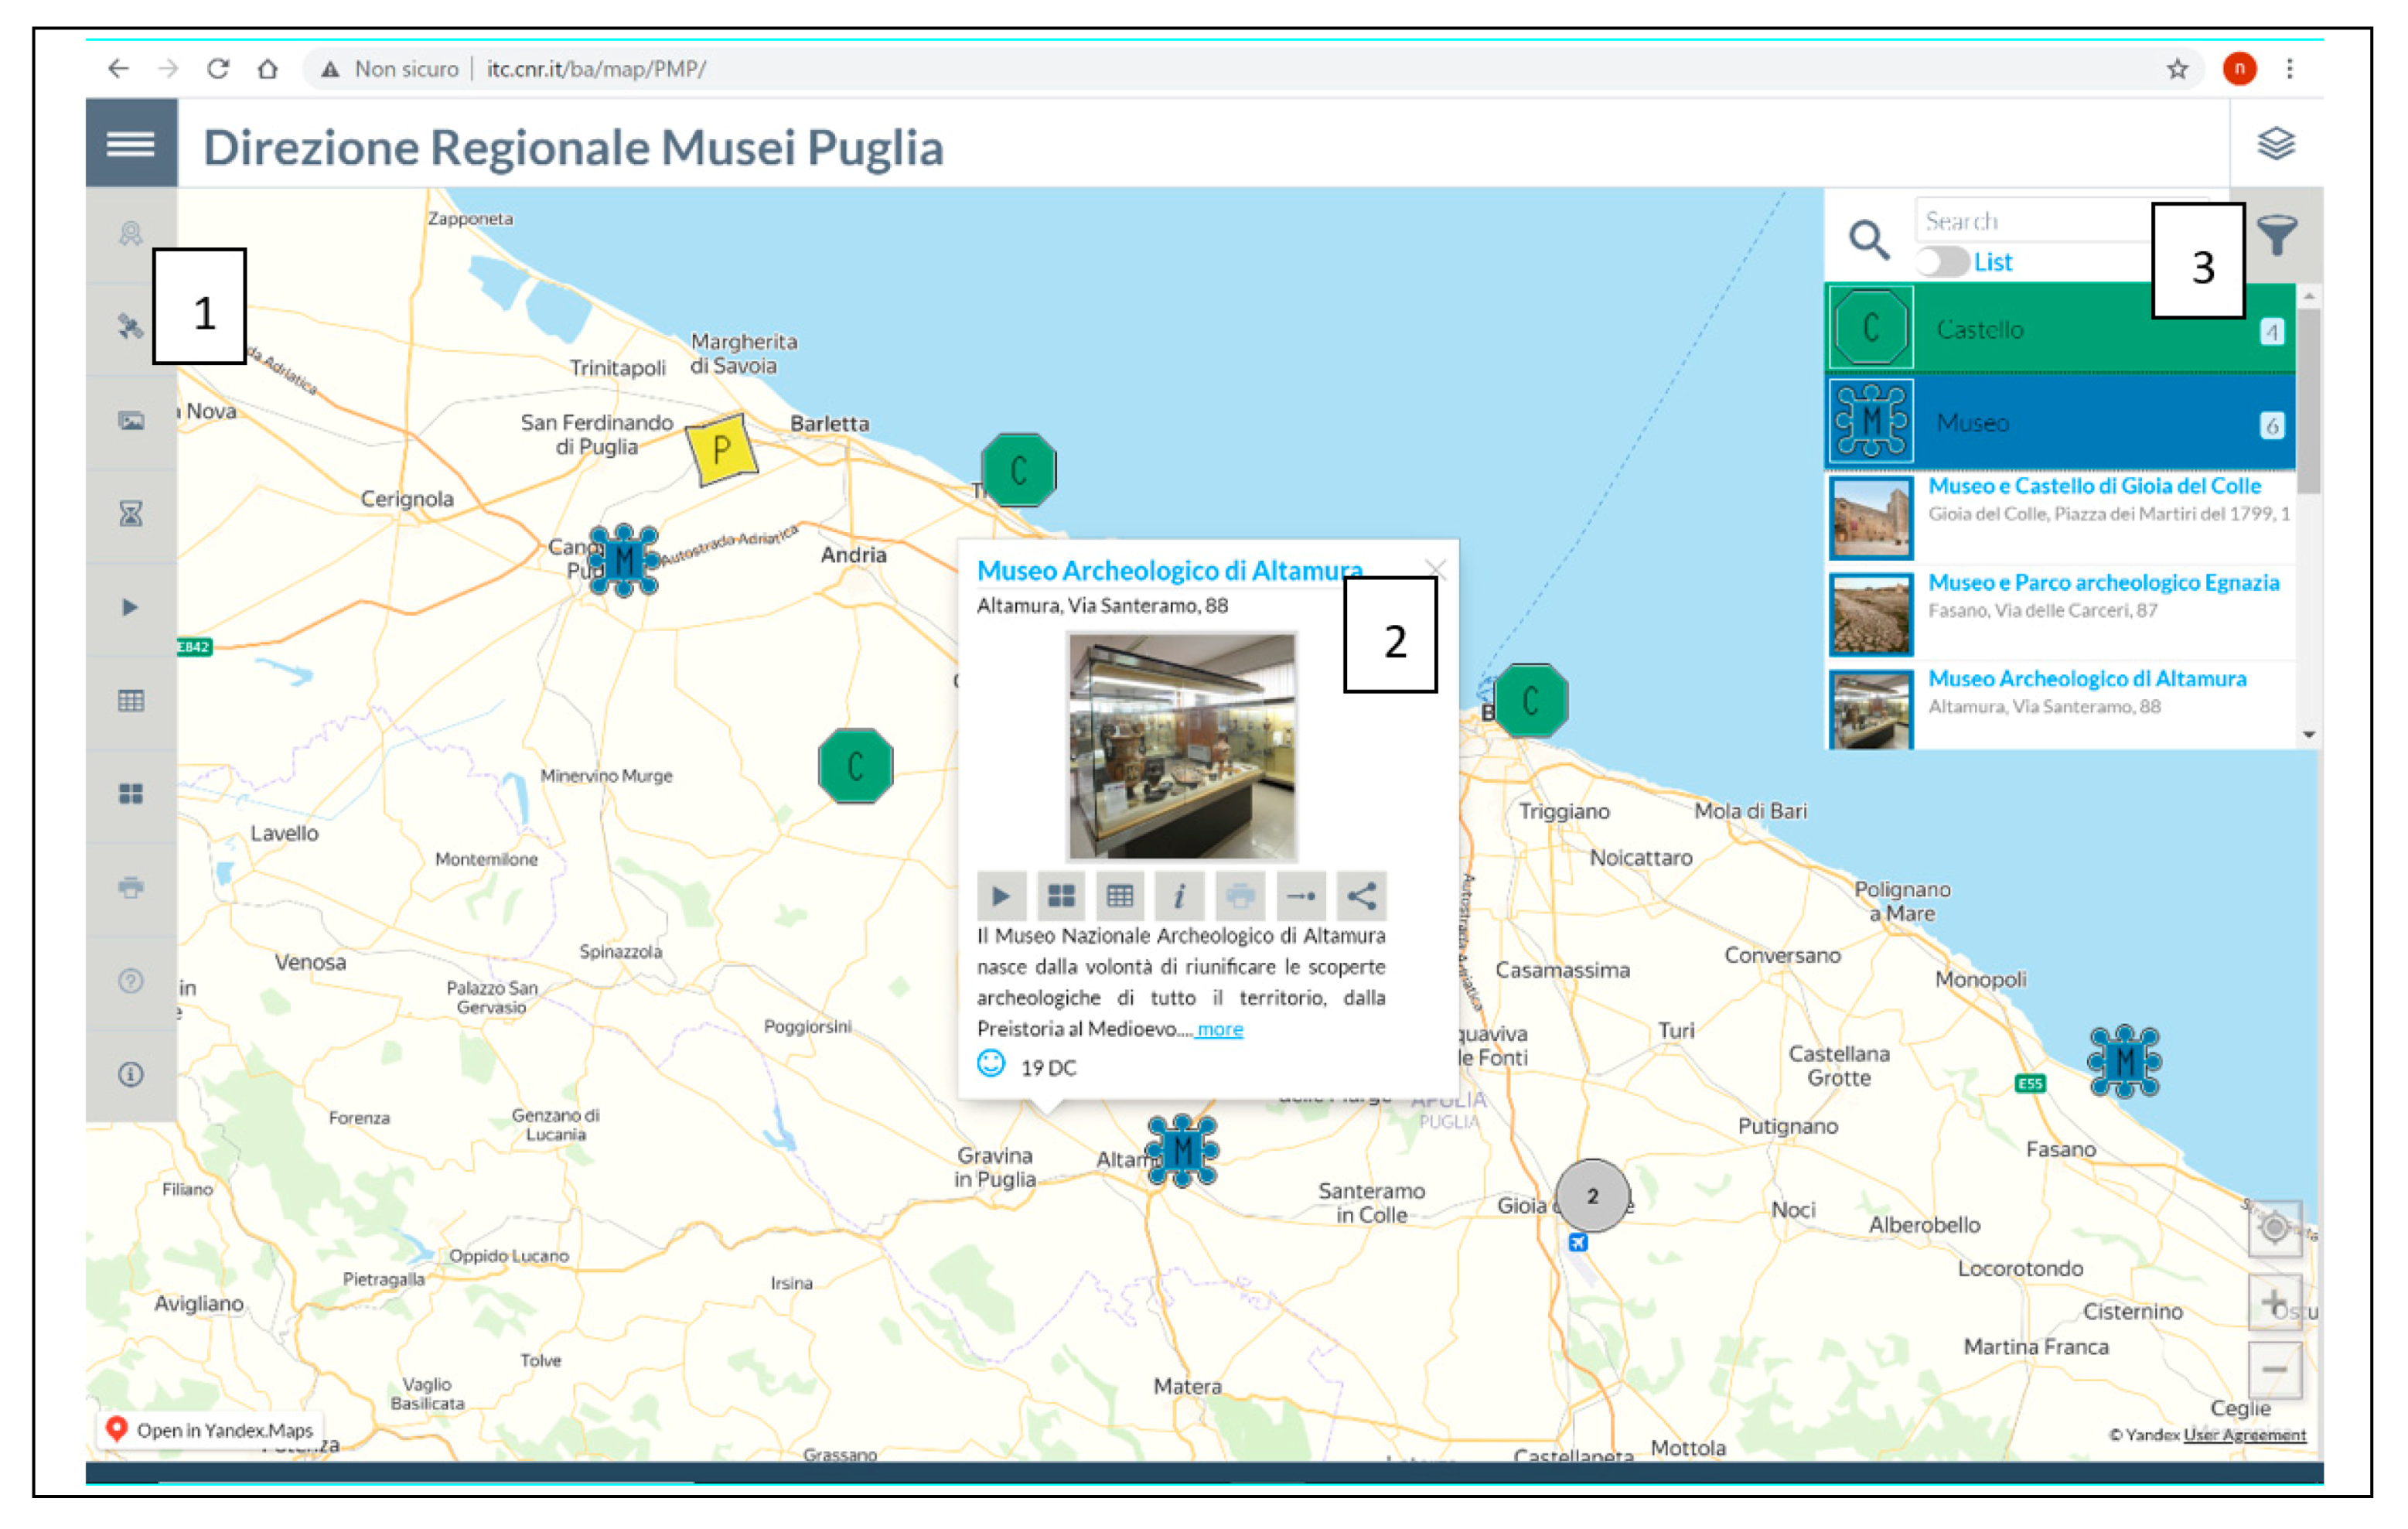
The multimedia interactive map of the Regional Directorate of Apulia Museums contains information about their 13 resource sites (reference buildings and/or complexes) and their collections in the form of multimedia objects such as images, video, webpages, virtual tours, 3D models. The map was built using an authoring system developed at our Institute [34] and has three main components: ‘menu’, ‘callout’ and ‘sidebar’ (Figure 10). Usually in web applications, a tap into an image produces its view in a larger window or a launch of an application; moreover, on mobile platforms it is possible to locate previously geotagged images on Google Maps.
These functionalities were grouped and extended, giving our work a unique feature: the connection among multimedia objects’ preview images and the places they refer to on the map. Users can select one of the resources not only by navigating on the map or using the multifunction sidebar (Figure 10-3), but also by interacting with multimedia previews which could be examined through three functions available both in the menu (Figure 10-1) for all the resources, and in the callout (Figure 10-2) for the selected resource: ‘Gallery’, ‘Table’ and ‘Tile’.
The function ‘Tile’ in the menu opens a window showing the image previews of multimedia object pertaining all the resources (Figure 11); with a mouse over an image preview, two function buttons appear:
- A link button to the pertaining application (in the example, the virtual tour of the of the National Archaeological Altamura Museum);
- A locate button zooming in on the map to the resource which the multimedia objects refer to.
Those functions are also available for the multimedia object preview images in the ‘Gallery’ window and for multimedia object items listed in the ‘Table’ window. Better accessibility is achieved for the map by visualizing the resources in the map using markers with different shapes, colors and text. The undoubtedly unconventional markers used in the map respond to the need to be easily recognized by users: better discrimination means more efficient visual processing and fewer misinterpretations [35]. It must be considered that the shape is the most important visual variable (‘Primacy of Shape’ [36]), and the use of text to differentiate symbols—using unique values for at least one visual variable—is recommended [37], and that a redundant symbolization resulted in subjects responding more quickly and accurately [38]. Then, our application uses two visual variables (shape and color) to symbolize the resource category, and a text to identify a subcategory. Therefore, the web application “Marker Maker” was developed to build markers by selecting a shape among a 36-item list, choosing the color, and entering up to two characters; a colorblind barrier-free pallet, printable with similar color on both screen and printers, was adopted [39].
However, the markers, even when they are few, overlap when the zoom level is minimized; therefore, to make viewing the map easier, when the user zooms out, the overlapped markers are represented through a “cluster” marker. According to [40], its shape is circular and contains the number of clustered resources; it has only one color (gray), instead of different colors according to the clustered quantities, avoiding confusion with the other markers, as in other web-maps [41].
The Sidebar (Figure 10-3) is a powerful and unconventional tool. It seems to be only a map legend regarding resource categories, allowing users to hide/show in the map all the markers for a category selected by tapping on the ‘marker button’ on the left (subsequently, its color changes to the grey/default color, according to its status). However, differently from the legends in the web-maps [42,43], it has additional features: a search textbox to find resources according to the typed letters, showing the results in the sidebar; a filter window; a switch to see the resources in alphabetical order (Figure 11); a display with the number of resources of each category, beside its name. Moreover, tapping on the category name, a list of resources pertaining to it opens, showing the resource boxes with their info (image, name and address); tapping on a resource box, the map zooms on it, opening the selected resource callout.
The callout (Figure 10-2) is itself another powerful tool with not only the aforementioned functions ‘Gallery’, ‘Table’ and ‘Tile’, but also ‘Info’ (a link to a webpage), ‘Destination’ (a link to the google tool to show the path to reach the resource) and ‘Share’ (to past the link to the resource anywhere).
In addition to the aforementioned functions ‘Gallery’, ‘Table’ and ‘Tile’, the menu (Figure 10-1) allows users to activate the satellite layer and to show the resource gallery, useful for totem installations. ‘Best Site’, ‘Print’, ‘Help’ and ‘Info’ functions will be activated in the final version in Italian language—the English version was cancelled due to the unavailability of official resource descriptions.
6.2. The Virtual Tour with 3D Model Viewer
The virtual tour interface, compliant with the above-mentioned questionnaire, was designed by the ICT team of our Institute based on the functionalities of Panotour [44], a Graphical User Interface program for Krpano code.
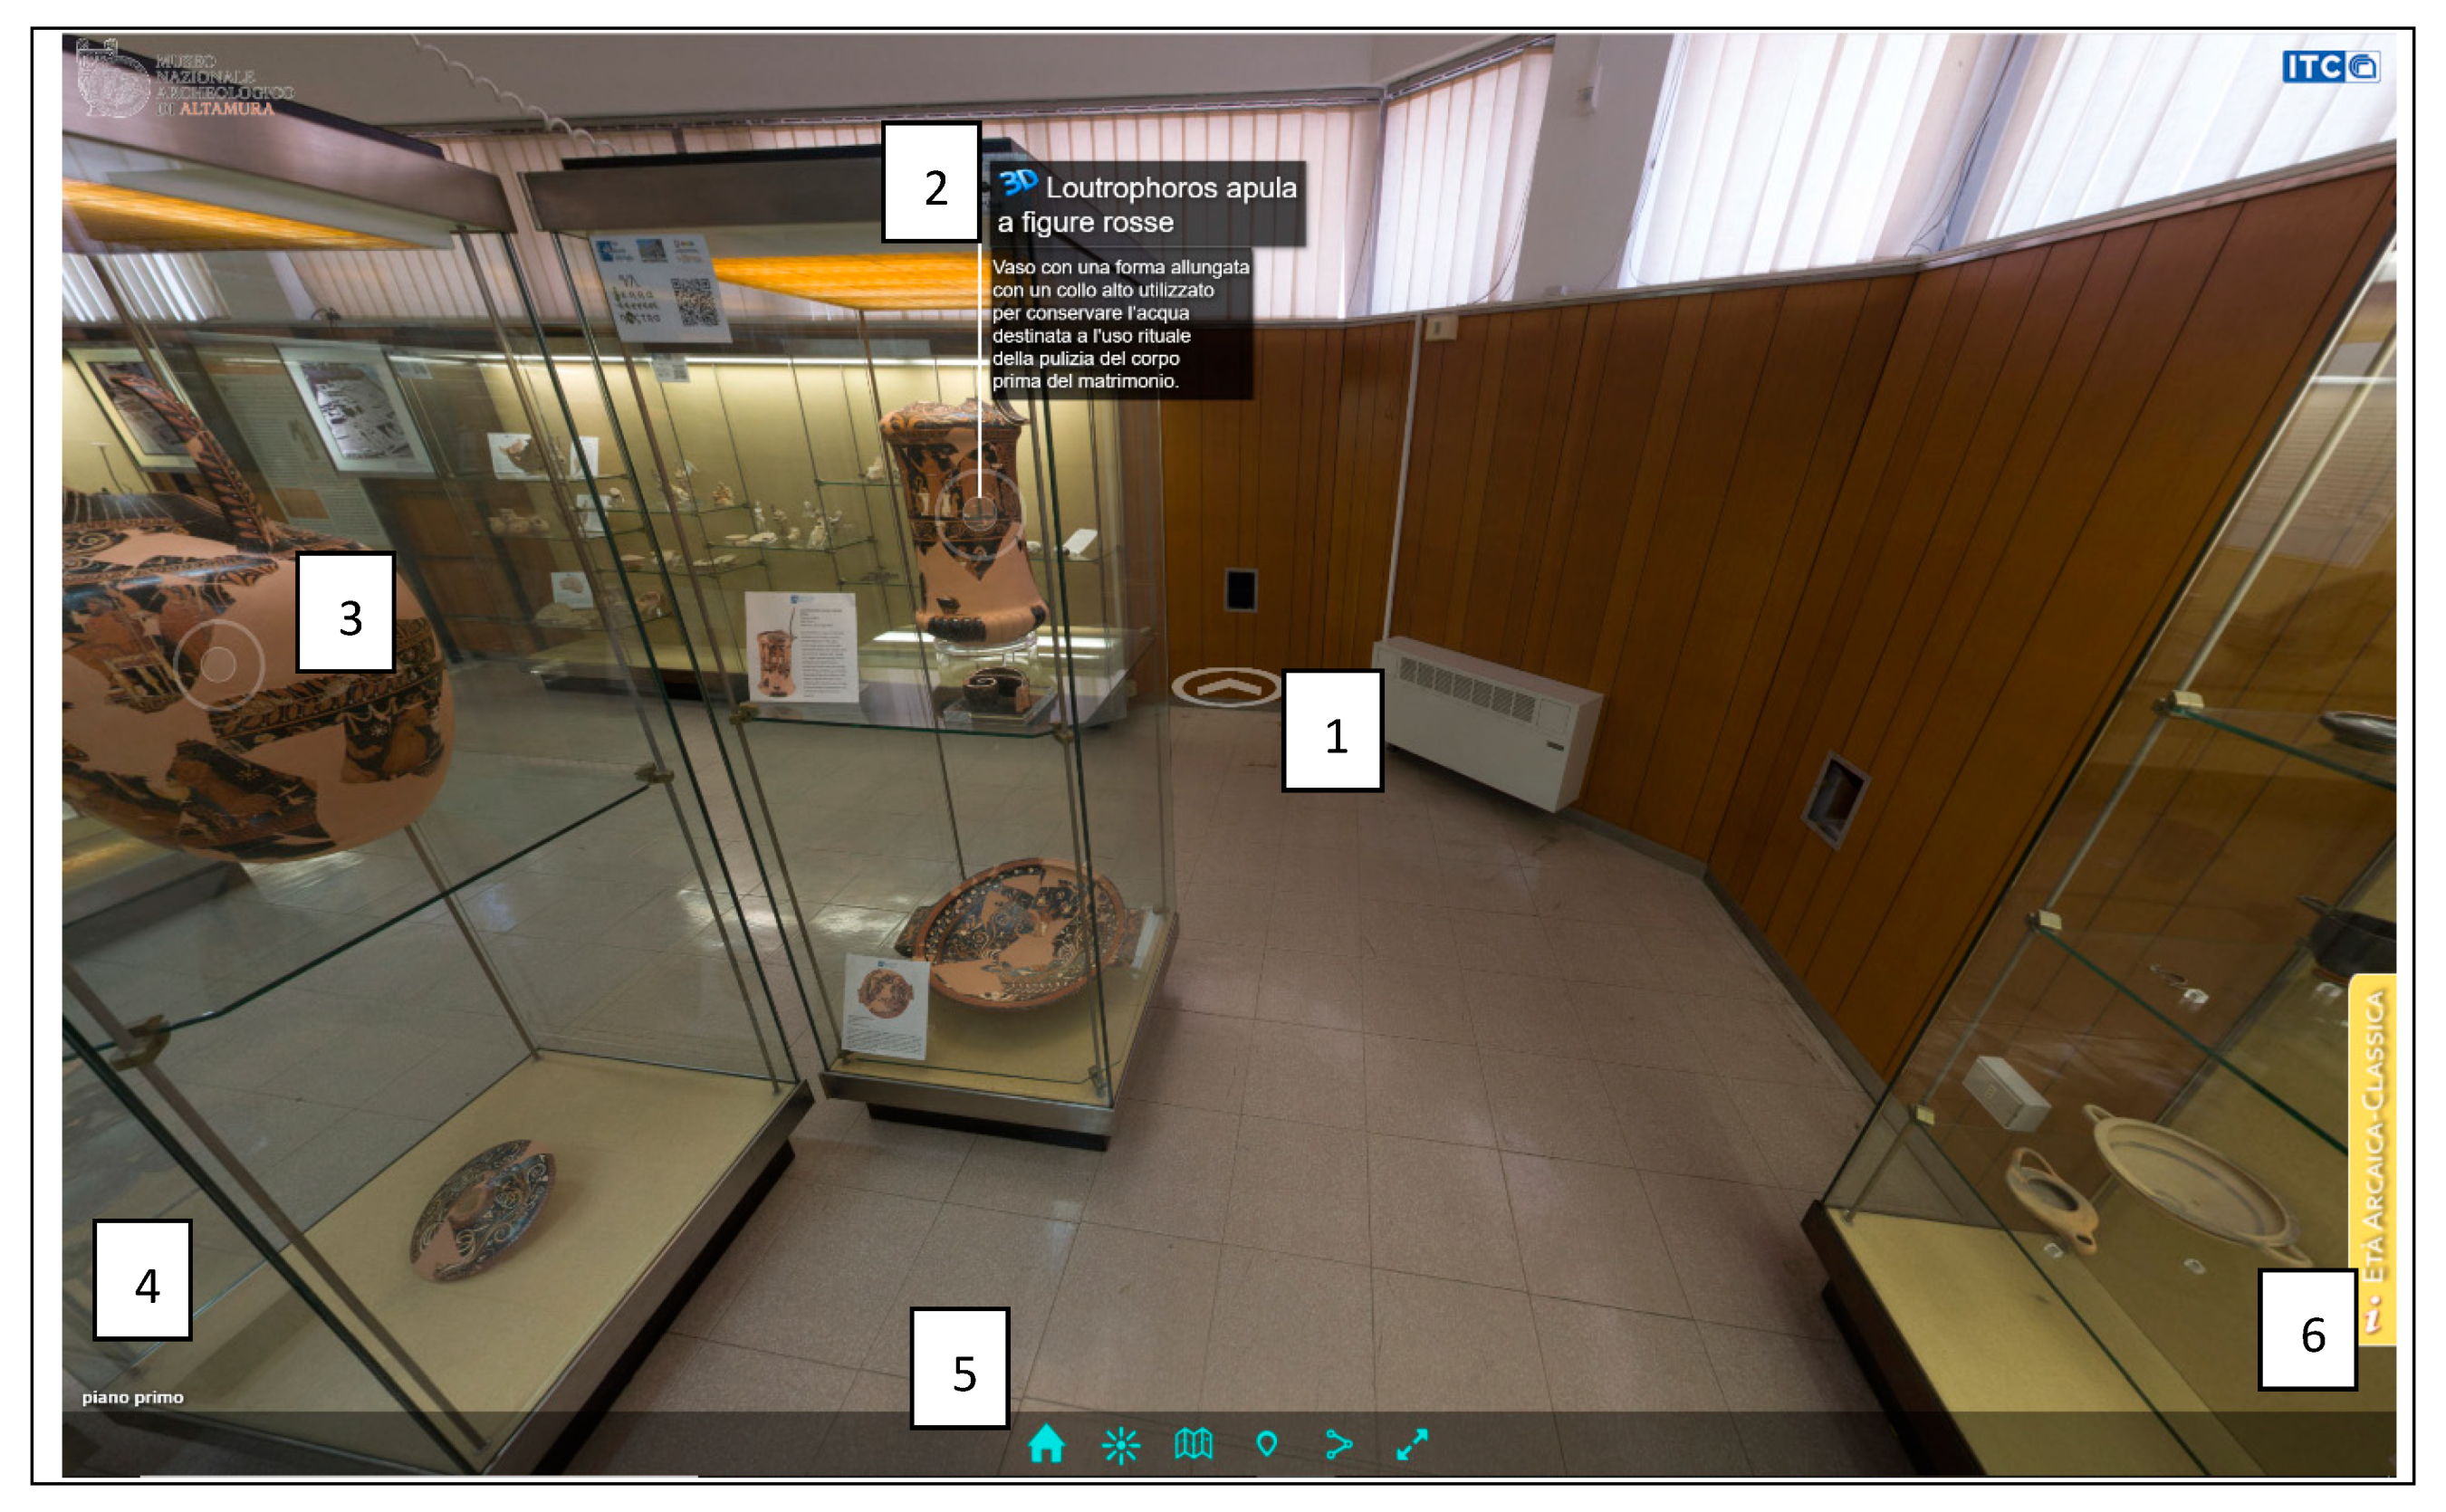
After an introductory splash screen, users can choose a section to visit (Figure 12a); then a virtual tour scene is opened according to the section selected (Figure 13), opening a section information window (Figure 12b). It has a section title, an image carousel of selected artifacts belonging the chosen section, and a description in written and audio form.
The content of this window changes depending on the section explored; it can be always opened through a tab on the right of each scene (Figure 13-6).
Navigational arrows allow users to enter a new scene (Figure 13-1), encountering closed hotspot (Figure 13-3); when a hotspot enters the scene central area, it opens (Figure 13-2), showing the artifact title, a short description and a link to the artifact information window (Figure 12c).
The artifact window (Figure 12c) shows the artifact title, an area to manipulate its 3D model and a section with a description in written and audio form; another section with the artifact’s data is being developed, updating the description area with two tabs (‘description’ and ‘data’).
A command bar (Figure 13-5) has buttons for home (Figure 12a), hide/show hotspots and arrows, floorplan show/hide (Figure 12d), map with the museum position show/hide, share the tour, full screen enter/exit. On the right, a tab (Figure 13-6) opens the Museum Section information window (Figure 12a).
Users can change the building level and understand their position through a window with a 3D floor plan (Figure 12d) with levels in a pull-down menu and a display node with different shapes: a high number of nodes was used to maintain visual consistency when moving from one to another. Therefore, a reverse drop characterizes the nodes opening a scene with artifacts, while a circle was used for all the other (“consistency”) nodes.
In the design of this first version, all the functions listed in Table 2 were considered, with the following clarifications:
- English version (#05). The team is working to add a tab in the artifacts information windows to use the official English description delivered by the Museum staff.
- Logo (#11). It is displayed in the splash screen: usually it is used to hide the tripod trace in the bottom of the scene, but it is not needed in our application, because we used a camera with a very little trace, successfully masked.
- Object gallery (#14). It is displayed as an image carousel in each museum section information window. Moreover, a new tab will be introduced in the virtual tour, close to the museum section information window, showing a window with the gallery of 3D models of artifacts, with a search box. This kind of approach—inside the virtual tour—is more user friendly with respect to those requiring an interaction between virtual tour and external page with artifacts list.
- Scenes gallery—image (#18). It will no longer be produced due to the lack of a corresponding real place: the sections of the museum are only partially identified by posters.
- Stereoscopic view (#24). The team is still working on it—a function key in the command bar on mobiles is already provided.
- User guide (#25). It will be provided at the end of the work; however, a video about this first virtual tour use has been already developed and will be added to the home page.
The virtual tour’s distinguishing features are:
- An enhanced understanding of the whole content of the museum through the Museum Section list in the home page.
- An extensive section presentation through their multimedia information windows with a main artifacts image carousel and artifact descriptions in written and audio form.
- A deeper knowledge of artifacts through their multimedia information windows, which have an area to manipulate the artifact 3D model, a description in written and audio form, and a data sheet.
- A faster way to locate main artifacts by selecting their location highlighted in the floor plan, having—moreover—a 3D view.
- A better understanding of the user position thanks to the 3D views of each floor of the building, labelled in the scene.
- A more natural way to move scene by scene using additional nodes to maintain the visual consistency when moving from one to another.
- An improved user interaction due to the minimalist command line and due to the information window organization and position.
Last but not least, the interface has full compatibility on both desktop and mobile devices, and additional software installation is not required.
This first version of the virtual tour was approved by the Directorate and is included in the “Gran Virtual Tour. Travel in Heritage” web page of the “MIBACT—Ministero per i beni e le attività culturali e per il turismo” [45].
6.3. The 3D Models Viewer
According to [46], the environment used to build the 3D models consists of a fixed camera and a turn-table, rotated in controlled phases. The background has a solid color to facilitate the segmentation of the real object, which—positioned on the turn-table—was illuminated using a controlled group of lights. Sets of photographs had both horizontal and vertical offset to have the best overlap possible, so building a higher quality 3D model, according to [47]; proprietary software called Agisoft PhotoScan was used for the reconstruction process.
For the 3D model viewer, 3DHOP (3D Heritage Online Presenter) was used (Figure 14): it is an open-source framework for the creation of interactive web presentations of high-resolution 3D models, oriented towards the Cultural Heritage field [48], developed by ISTI—Institute for Information Science and Technologies “Alessandro Faedo”.
7. Discussion and Conclusions
In recent years, virtual tour technologies have been proving their potential and their efficacy as representation and communication tools in several sectors. In the field of cultural heritage promotion, in particular, such technology presents many potentialities in terms of inclusiveness of a public that is increasingly shaping up as a “consumer”, than as a “spectator” of cultural resources.
In the first place, just as an instrument for virtual visit, this technology is, in general, able to bring a wide range of potential users closer to heritage who have, up until now, been excluded from having a direct and concrete relationship to cultural resources due to their inaccessibility in different respects.
On one hand, the tool makes it possible to overcome physical barriers, related not only to the incompatibility of their hosting contexts with users’ different abilities (in the first place, mobility impairments among the elderly as well as young people), but also to the inaccessibility of resources for different reasons. These may range from the temporary unavailability of collections for restoration activities to restructuring works in the hosting structures for a specific sensitivity and vulnerability of objects, or of the context itself, with respect to the physical flows of visitors or to structural safety problems.
In the system conceived by our Institute, beyond the goal of access to resources, other objectives were also specifically pursued, such as the enrichment of the communication efficacy and the customizability of the virtual visit – or experience – of the collections hosted in the museum selected as pilot case.
As a matter of fact, on one hand, the designed interface proves, when compared to the other tools examined, much more articulated and rich, thanks to the numerous functionalities—rather infrequent in the local context—implemented in the system, such as the presence of information about objects, the visualization of 3D objects, and scene previews.
On the other hand, the information search functionalities, the possibility of visualizing the interactive map, and the availability of floor plans with the indication of station points, allow potential users to take advantage of virtual tours both as a substitute and in the planning stage for physical visits to the site. In fact, those functionalities support the possibility of defining paths for the visit, then for a totally customizable knowledge of the resources that is not tied to the linearity of visit routes predefined by managers and event curators but, rather, developed according to users’ specific interests.
The specific care towards the provision of links among scenes amplifies this possibility and also allows, together with a livelier visit experience, an appreciable saving of time.
During real visits, as a matter of fact, the possibility of physically returning to specific points of interest can require a large amount of time, or may even be totally precluded due to the need to proceed along the paths indicated by the curators or the guides.
Moreover, all of these functionalities exemplify the feature that strongly distinguishes the tool produced by CNR-ITC in respect to numerous applications, even complex and sophisticated ones, centered around the concept of a thoroughly and detailed “reconstruction” of a physical reality, that results in a plain “view” of environments.
The interface designed for the virtual tour allows, on the contrary, a dynamic experience, highly customizable and, ultimately, strongly enabling, since it transfers to the final users the perception of a high level of autonomy in the visit.
As a consequence, it distinguishes itself for its greater ability to stimulate attention and interest towards heritage resources, potentially increasing their “consumption”.
Ultimately, the element that, more than others, marks out the conceived interface is the quite novel interpretation of the concept of users’ (visitors’ and mangers’) engagement at its basis, meaning not only with respect to when the development comes to fruition (of the technological tool as well as of the cultural resources), but above all during its design and delivery phases.
On a technical level, the added value of the work presented, compared to mainstream virtual tour realizations for museums, lies in the integration of more technological solutions—the virtual touring platform, the map, the 3D model viewer—in an articulated and flexible system, with two important implications. In the first place, such a system gives the museum-managing institution the possibility of focusing adaptably on one or tool or the other, according to users’ needs and to the peculiar nature of the collection to promote each time and the specific communication strategies conceived for it. Furthermore, the system can be employed by the Directorate in the management of all its museums, thus supporting networked strategies and the design of promotion initiatives involving more structures and sites together.
The map, in particular, is not meant for simply locating the museum for access-related information on its website (‘Getting here’). Users generally plan their visit to each museum or site by locating its position in the territory and separately exploring the multimedia contents available on the Internet. The integration of an interactive multimedia map makes it possible to offer the Directorate a tool that can be enriched by highlighting possible connections (in terms of physical proximity and of relevance of contents) in order to support the promotion of resources from within a ‘network’ perspective. This can facilitate a less episodic and more extensive and lasting experiential relation between heritage and visitors, where every visited site can inspire users to continue exploration elsewhere and discover other resources by arousing interest and curiosity.
Actually, in the local context, establishments such as cultural districts and museum networks embody an enduring incongruence, since the network ‘mode’ is typically limited to the management of administrative and organizational issues or of structural actions (equipping, infrastructuring) for cost optimization. A joint definition of interconnected cultural offers among museums is generally missing, often in favor of competitive strategies at junctures marked by limited public financial support. Lacking a concrete realization of the connection among locally diffused cultural resources, institutions often fail in presenting themselves as a real local ‘system’ to the general audience of variegated real and potential users.
Preliminarily to the starting of the testing phase, an integrated version of the system, with the functions under development (as mentioned in the ‘Results’ section) will be published, with specific reference to the gallery of artifacts, for which 3D models with search and stereoscopic view were realized by our institute.
The testing phase, carried out by Technosoft and System Project, will also be rather innovative, since it will involve a variegated sample of stakeholders as potential users, rather than relying on students or academic staff, as is frequently done (as described in the ‘Related Work’ section). Stakeholders’ engagement will also address the other tool developed by the project partners, an app for onsite fruition of museum resources based on Augmented Reality. Our institute is currently committed, together with the other project partners, to the definition of collection object sheets, based, among other things, on usability principles, as highlighted in [50].
Throughout the design process, the staff of the Archaeological Museum of Altamura interacted with the virtual tour interface developers and, on the other hand, potential users will actively contribute to the system’s refinement through their testing experiences, leading to an outcome that is really the result of shared preferences and interests.
The underlying expectation is that this sharing and engagement can, in turn, be transferred to the relation with cultural resources and translate itself also into a similar sense of belonging of heritage itself to the community, contributing to bring the public closer to the museum and the resources hosted in it. To this end, the ability of museum managers to fully exploit and take advantage of the potentialities of the technology to define innovative and attractive cultural offers will prove decisive.
Author Contributions
1. Introduction, 2. Cultural Tourism and Virtual Tours, 5. The design study for the museum of Altamura: Materials and Method, 5.1. The design method for the new tool, 5.2. The case study, 7. Discussion and Conclusion: Antonella Lerario; 3. Related Works, 4. Virtual tour interfaces in Italy, 5.3 The existing virtual tour of the National Archaeological Altamura Museum, 5.4 The functional analysis, 6. Results: Nicola Maiellaro. All authors have read and agreed to the published version of the manuscript.
Funding
This research was funded by Apulia Region, grant number RFS13G5-1 (Project A0104.164: ViSTA – Virtual and Social heritage Tour Application).
Acknowledgments
Archeological Museum of Altamura: Elena Saponaro (Director) for virtual tour function evaluation and testing; Rosa Anna Crivelli for images and data. Construction Technologies Institute: Salvatore Capotorto and Antonietta Varasano for ICT issues; Salvatore Capotorto for virtual tour graphics; Salvatore Capotorto, Vittorio Leandro, Maria Lepore and Marina Zonno for survey and multimedia content development for virtual tour; Vincenzo Battista for technical support. Nicola Maiellaro is the coordinator of the research; Antonella Lerario (research unit responsible) carried out research finalization.
Conflicts of Interest
The authors declare no conflict of interest.
Appendix A
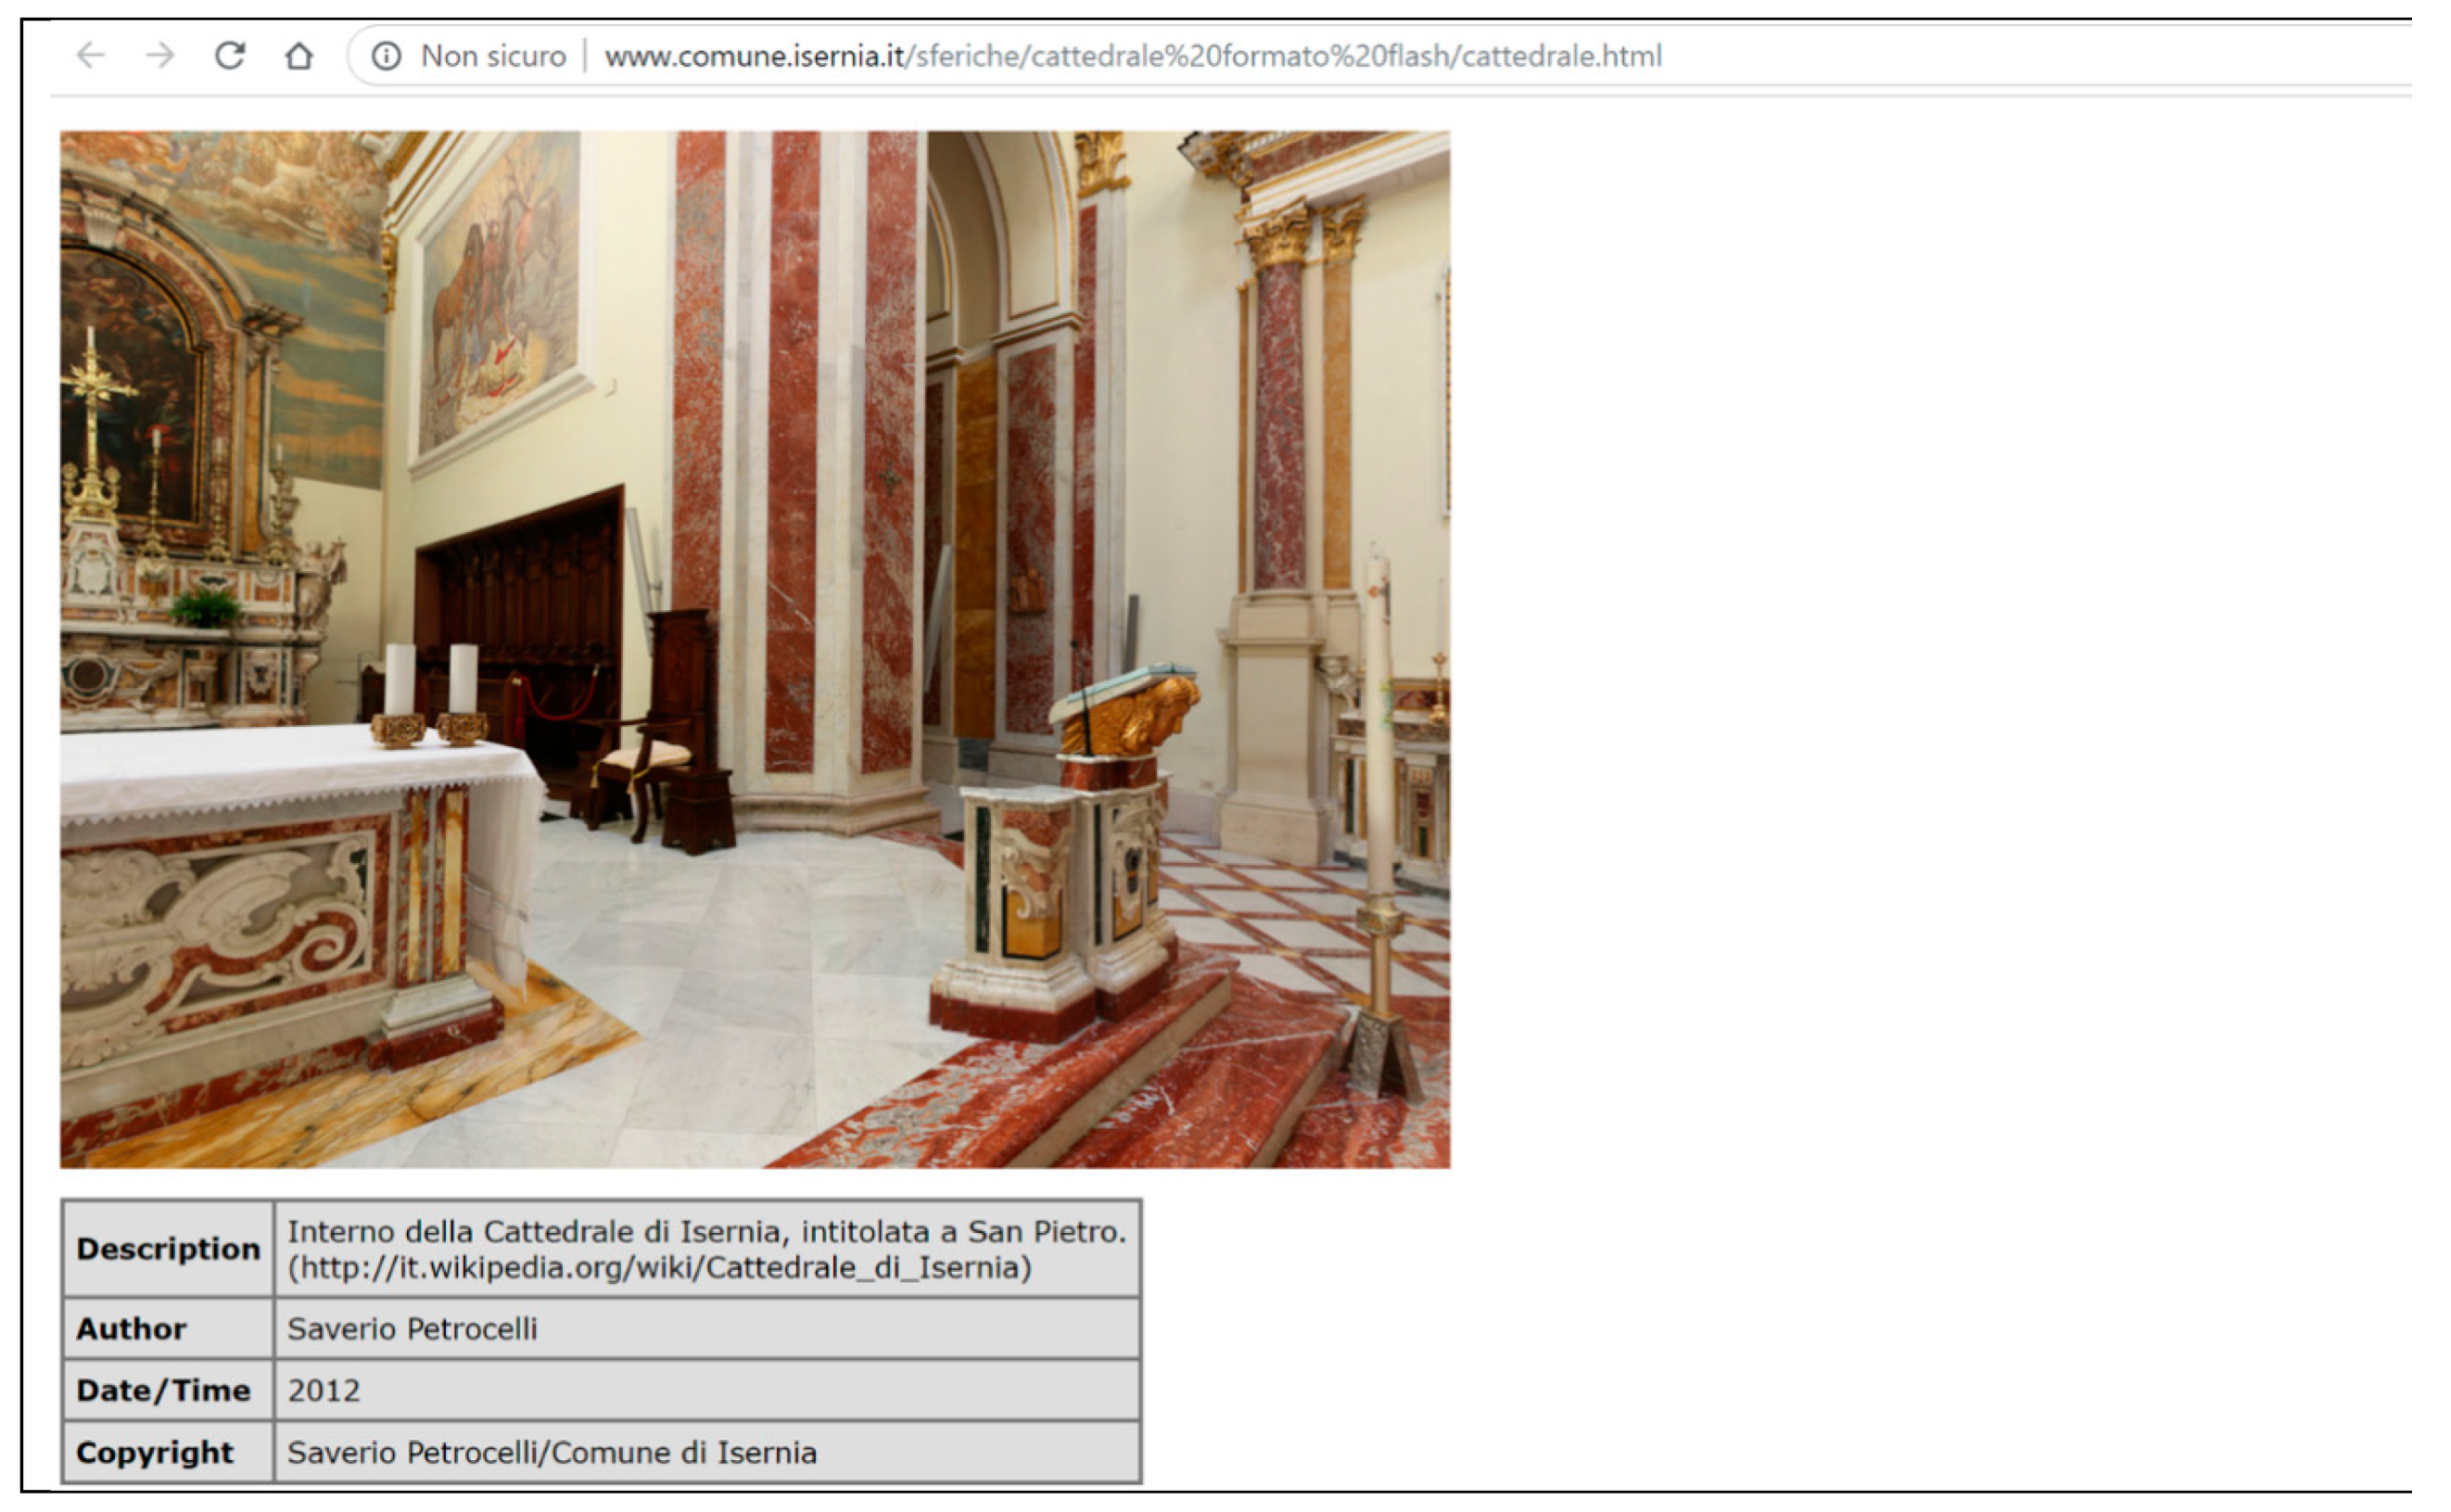
Figure A1.
“Interno della Cattedrale di Isernia”. Mouse only navigation (any command bar), information window outside the virtual tour [22].
Figure A1.
“Interno della Cattedrale di Isernia”. Mouse only navigation (any command bar), information window outside the virtual tour [22].

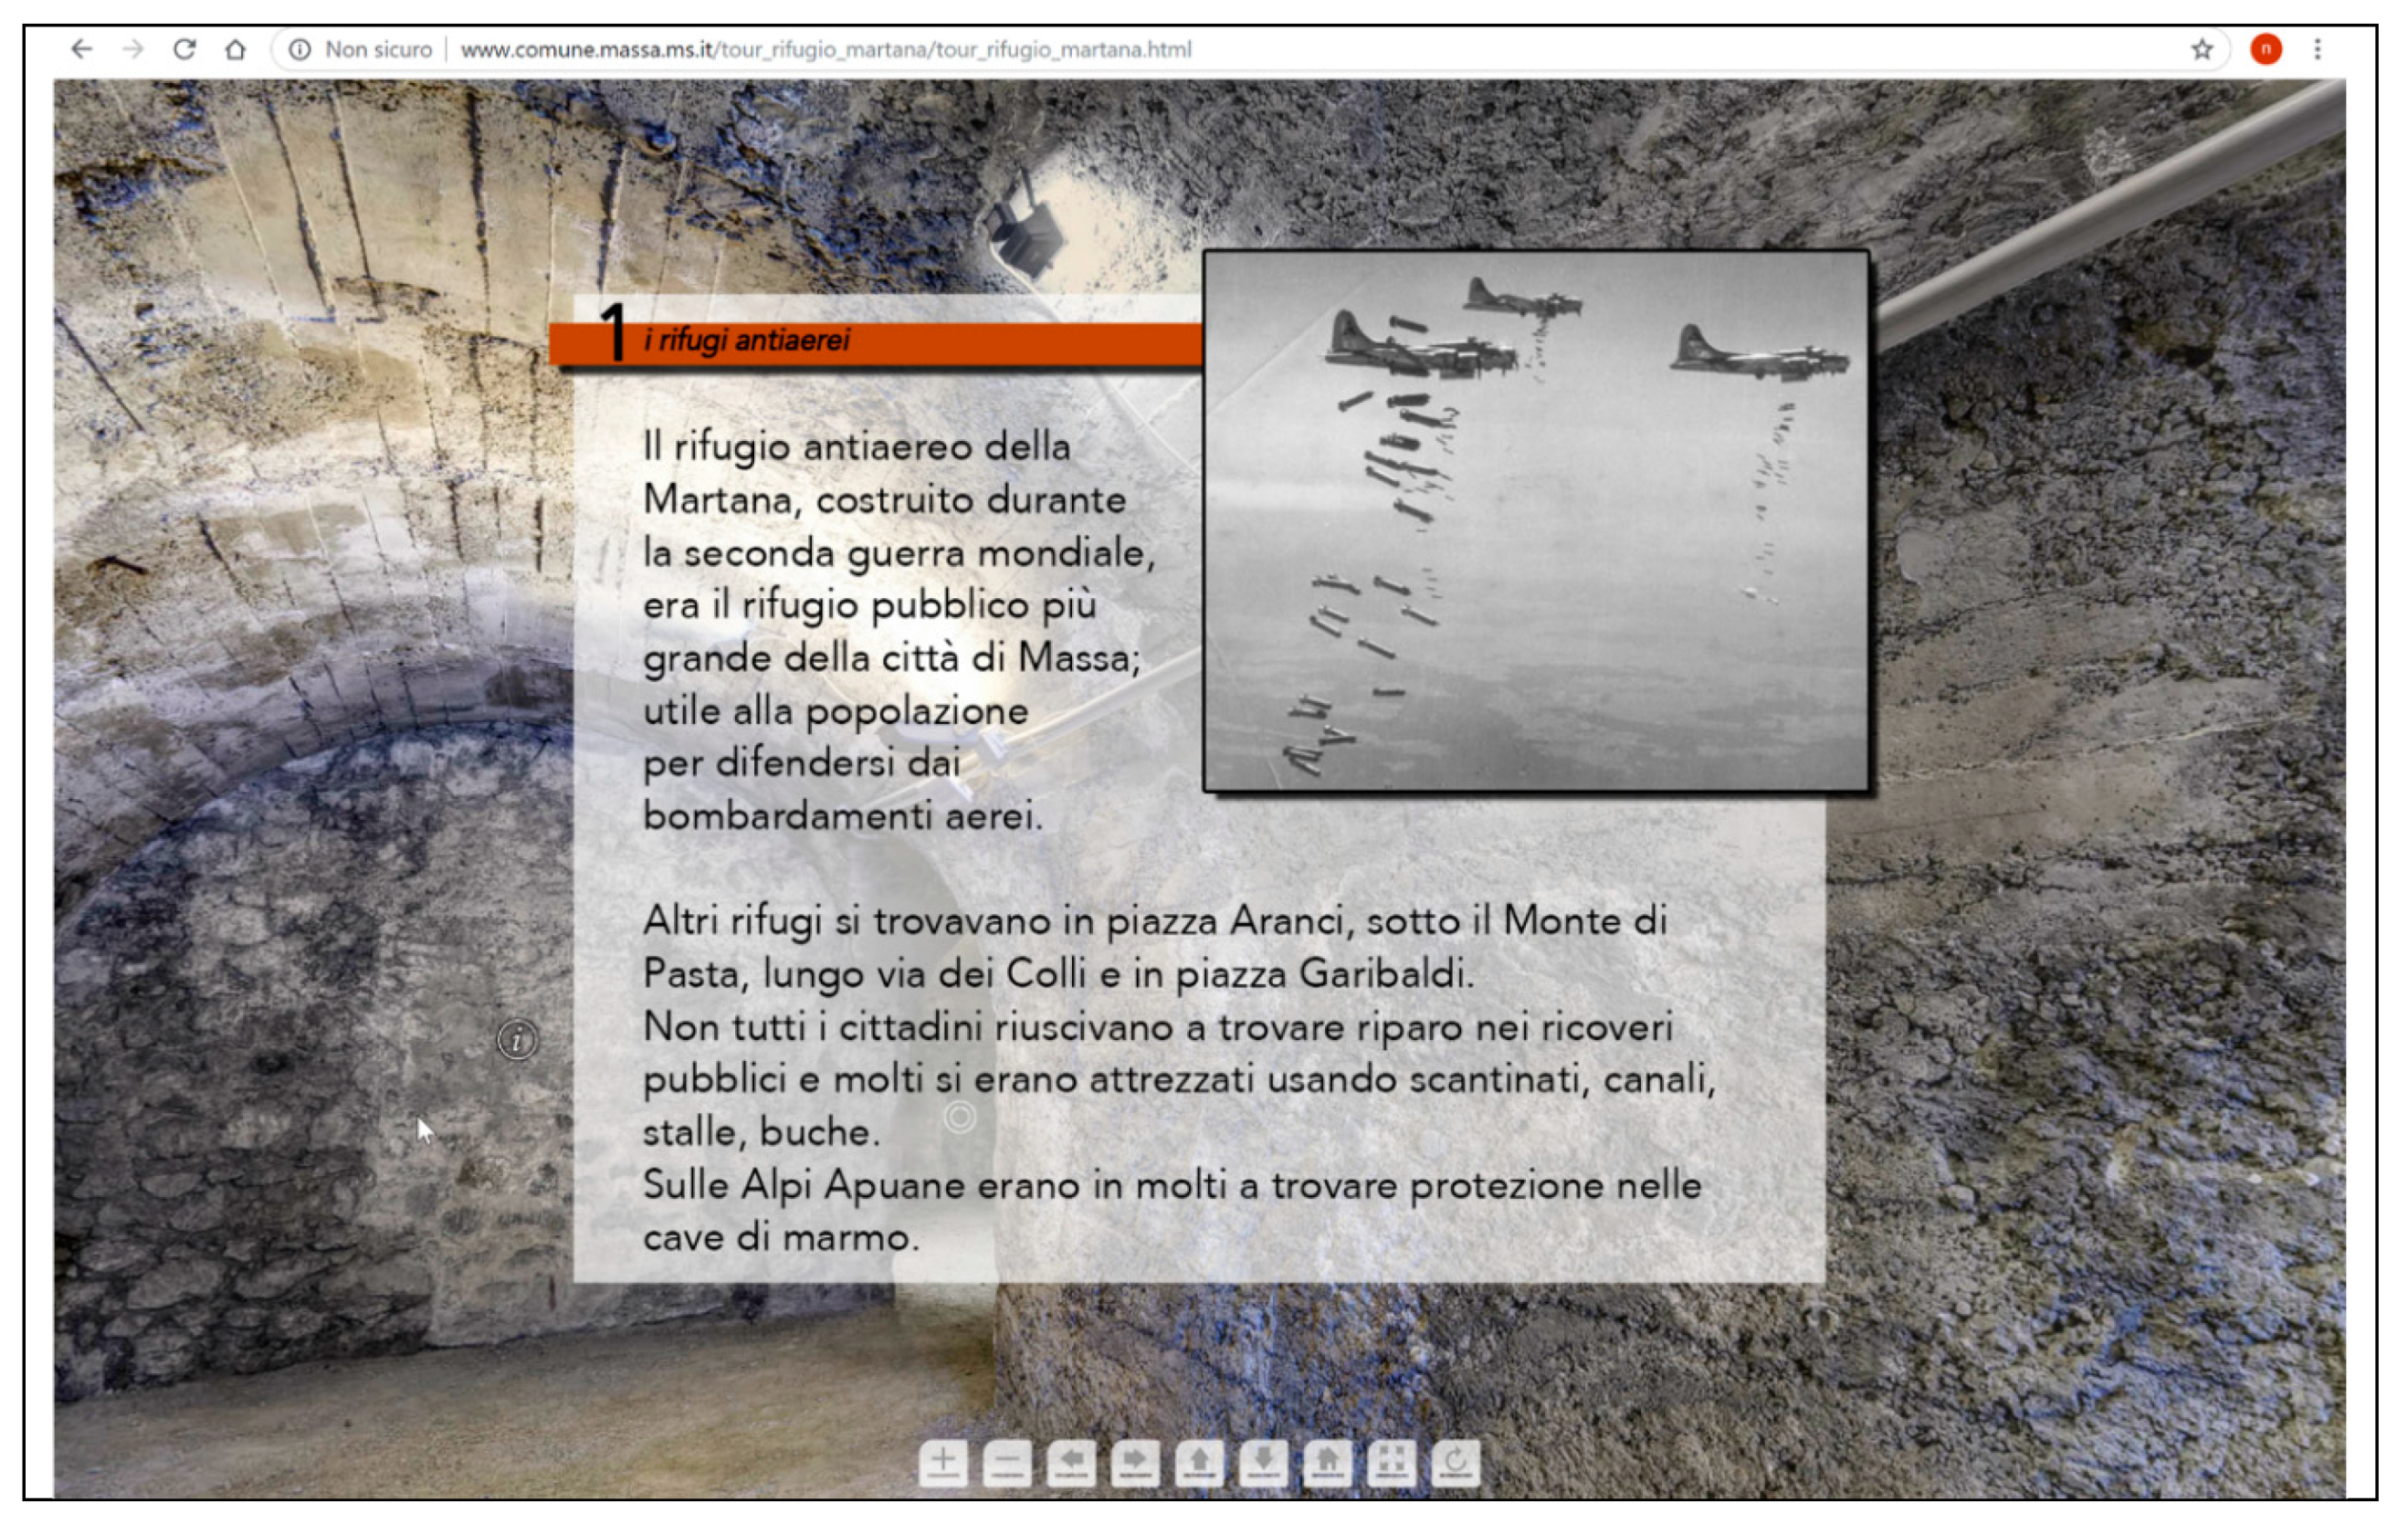
Figure A2.
“Tour virtuale. Rifugio antiaereo della Martana” (Massa). Command bar, link among scenes, hotspots, information window [23].
Figure A2.
“Tour virtuale. Rifugio antiaereo della Martana” (Massa). Command bar, link among scenes, hotspots, information window [23].

Figure A3.
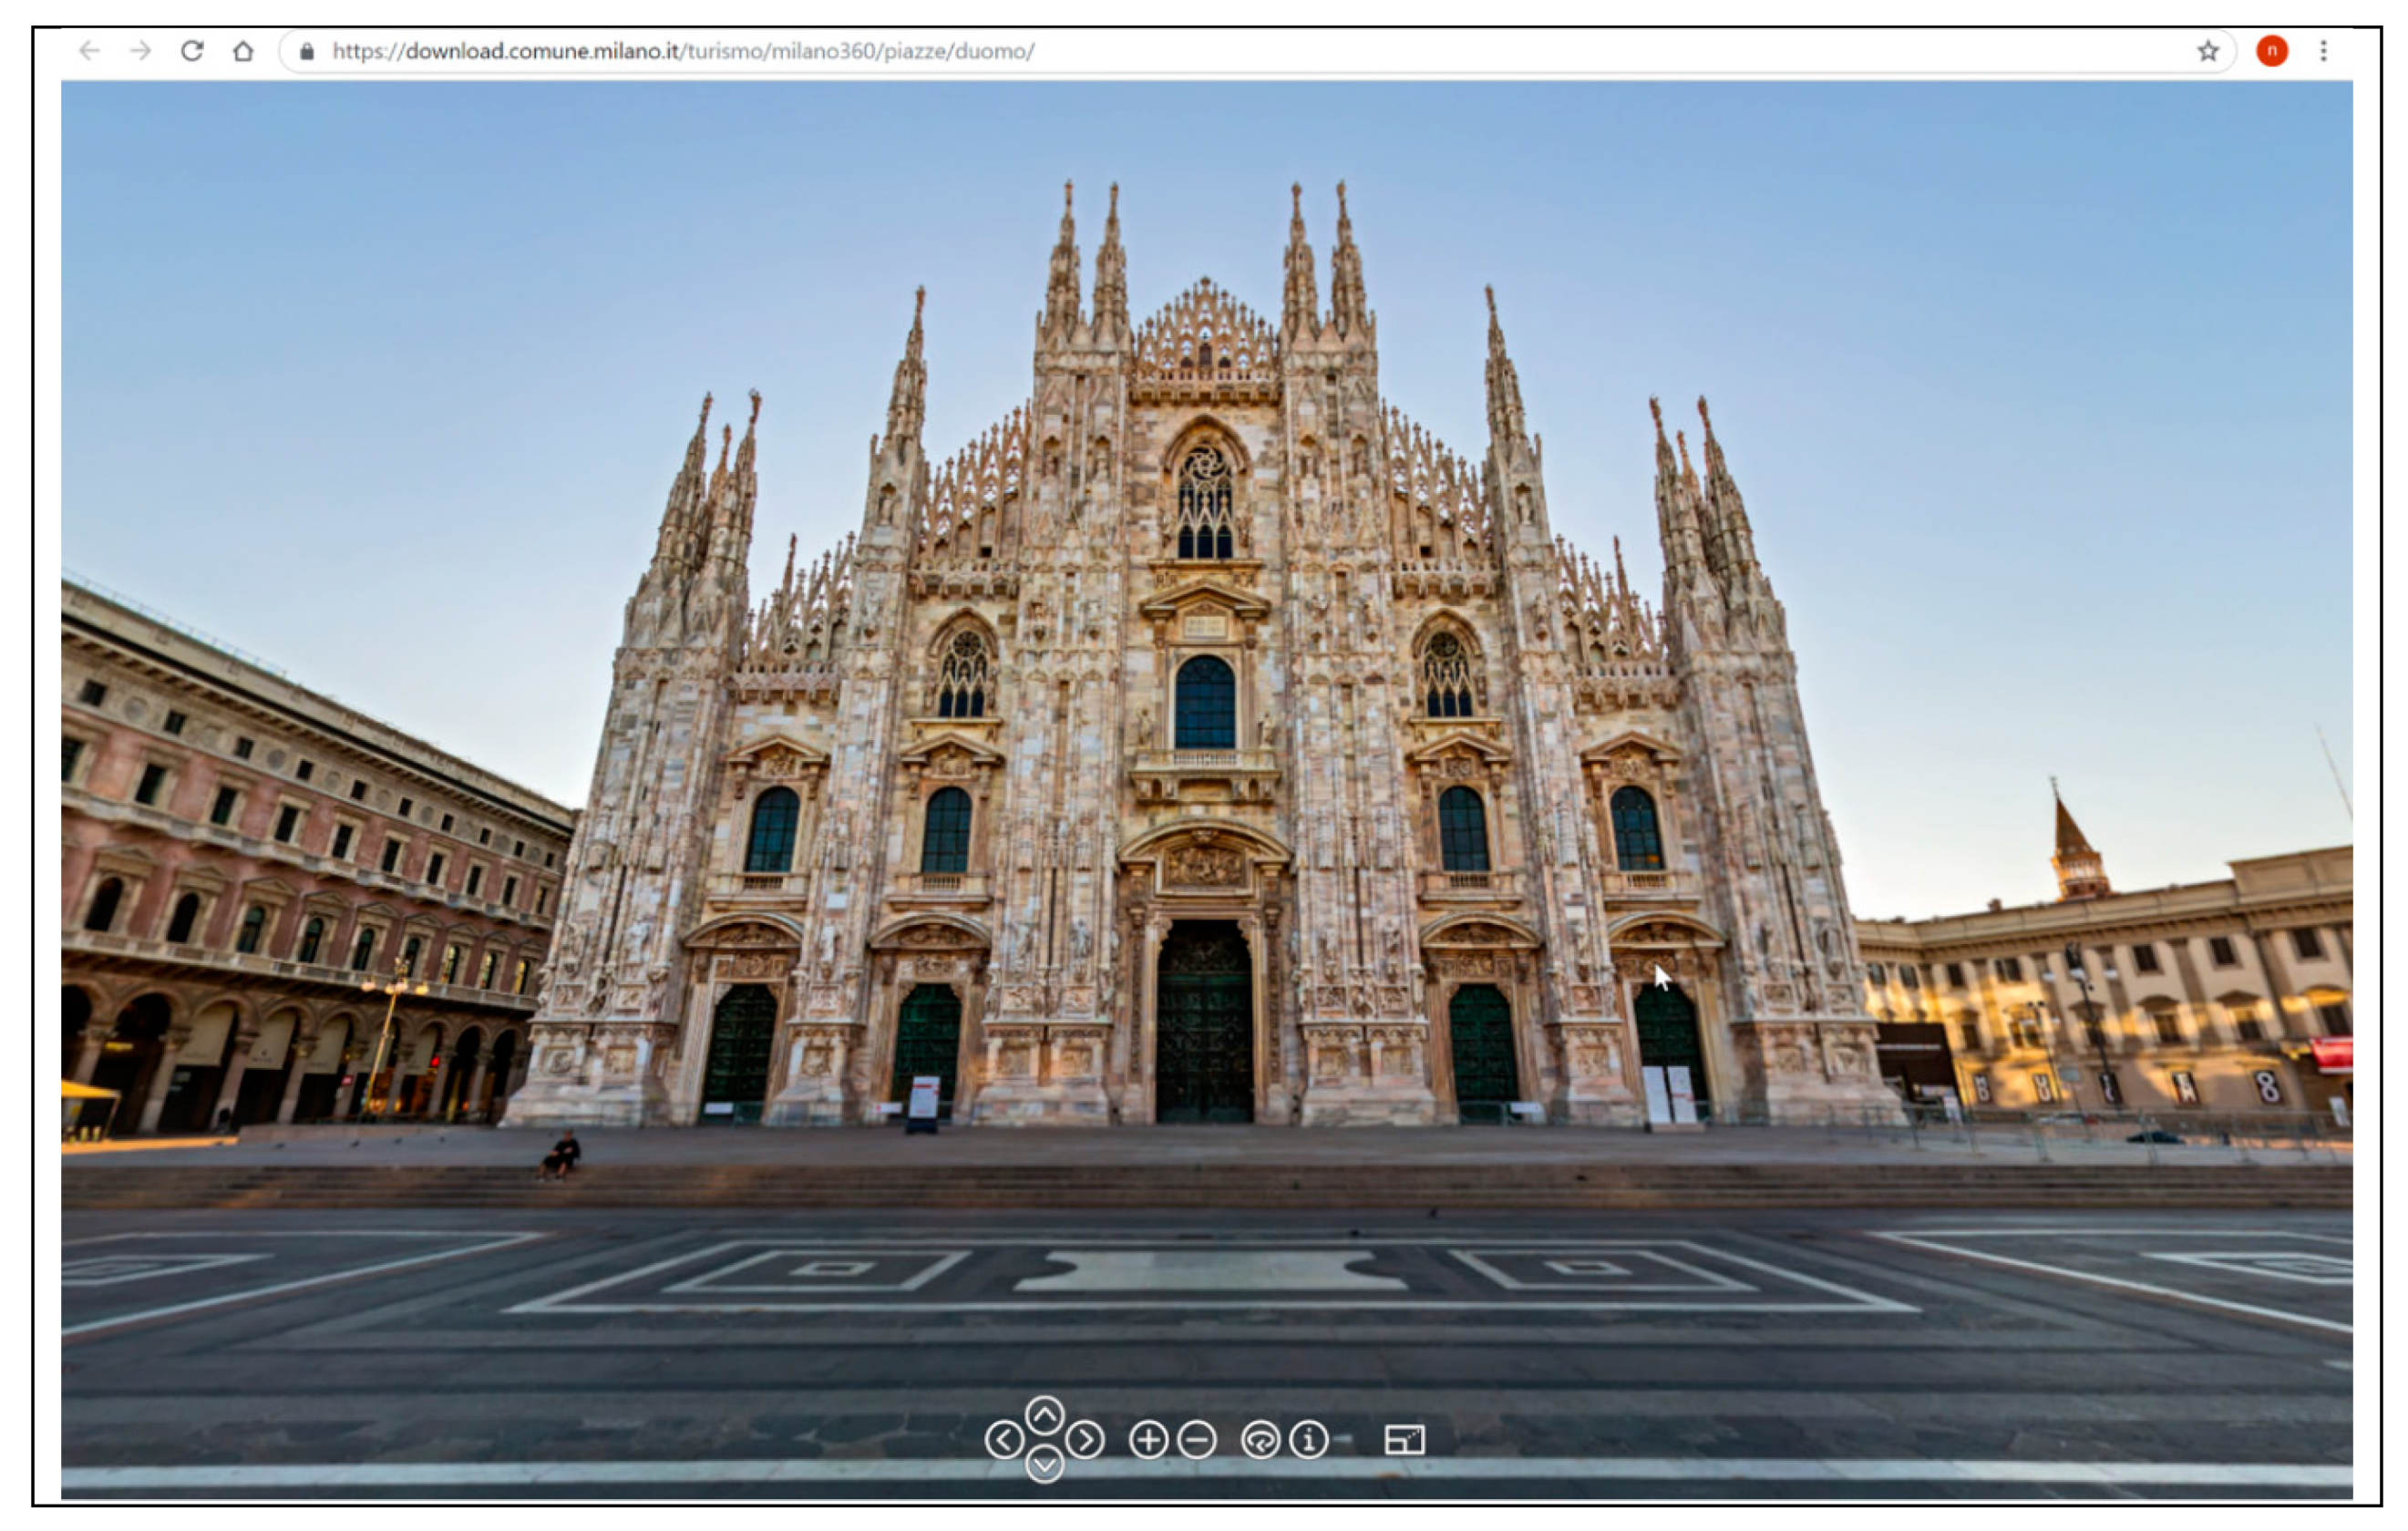
Milano @ 360—Duomo Square. Navigational command bar only [24].
Figure A3.
Milano @ 360—Duomo Square. Navigational command bar only [24].

Figure A4.
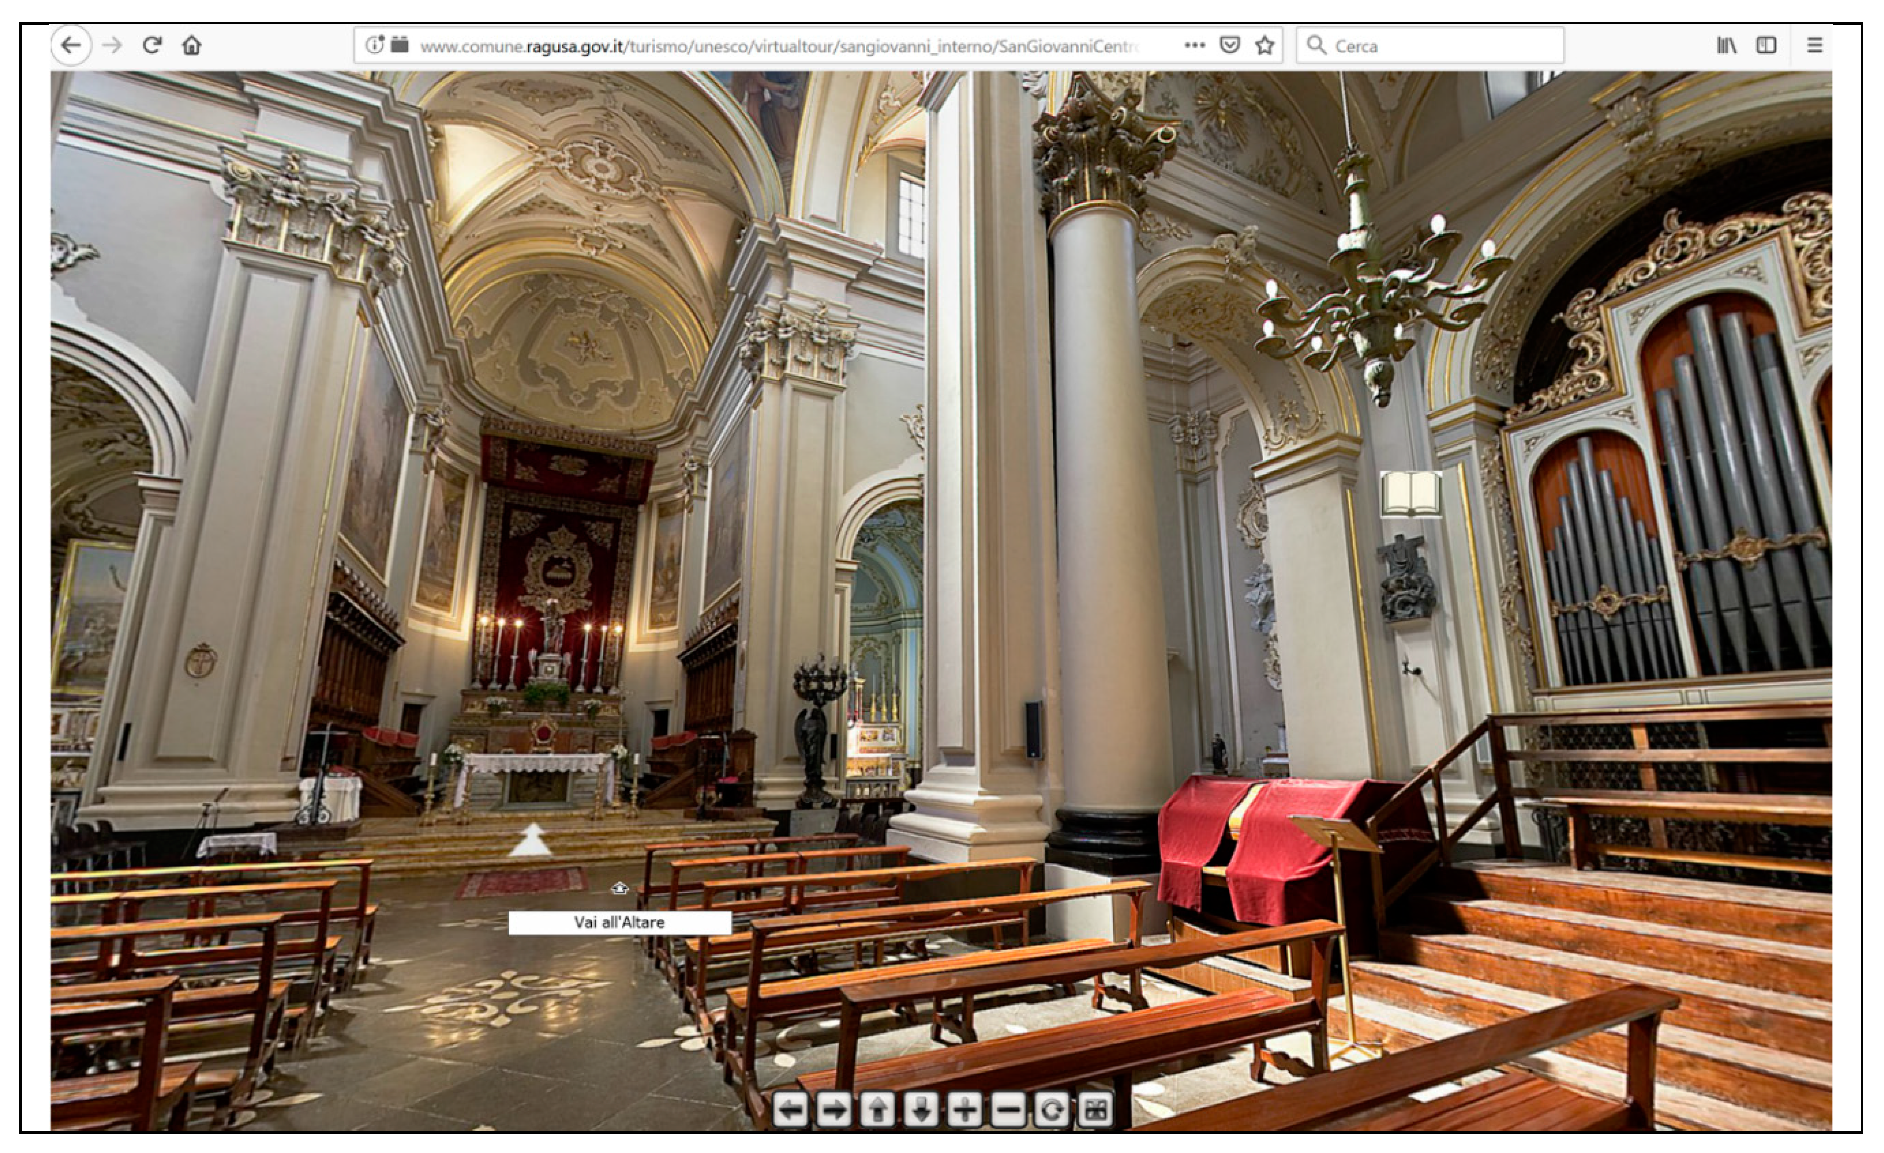
“I Monumenti del tardo barocco di Ragusa: Cattedrale di San Giovanni”. Command bar, link among scenes, hotspots—link for swf file downloading [25].
Figure A4.
“I Monumenti del tardo barocco di Ragusa: Cattedrale di San Giovanni”. Command bar, link among scenes, hotspots—link for swf file downloading [25].

Figure A5.
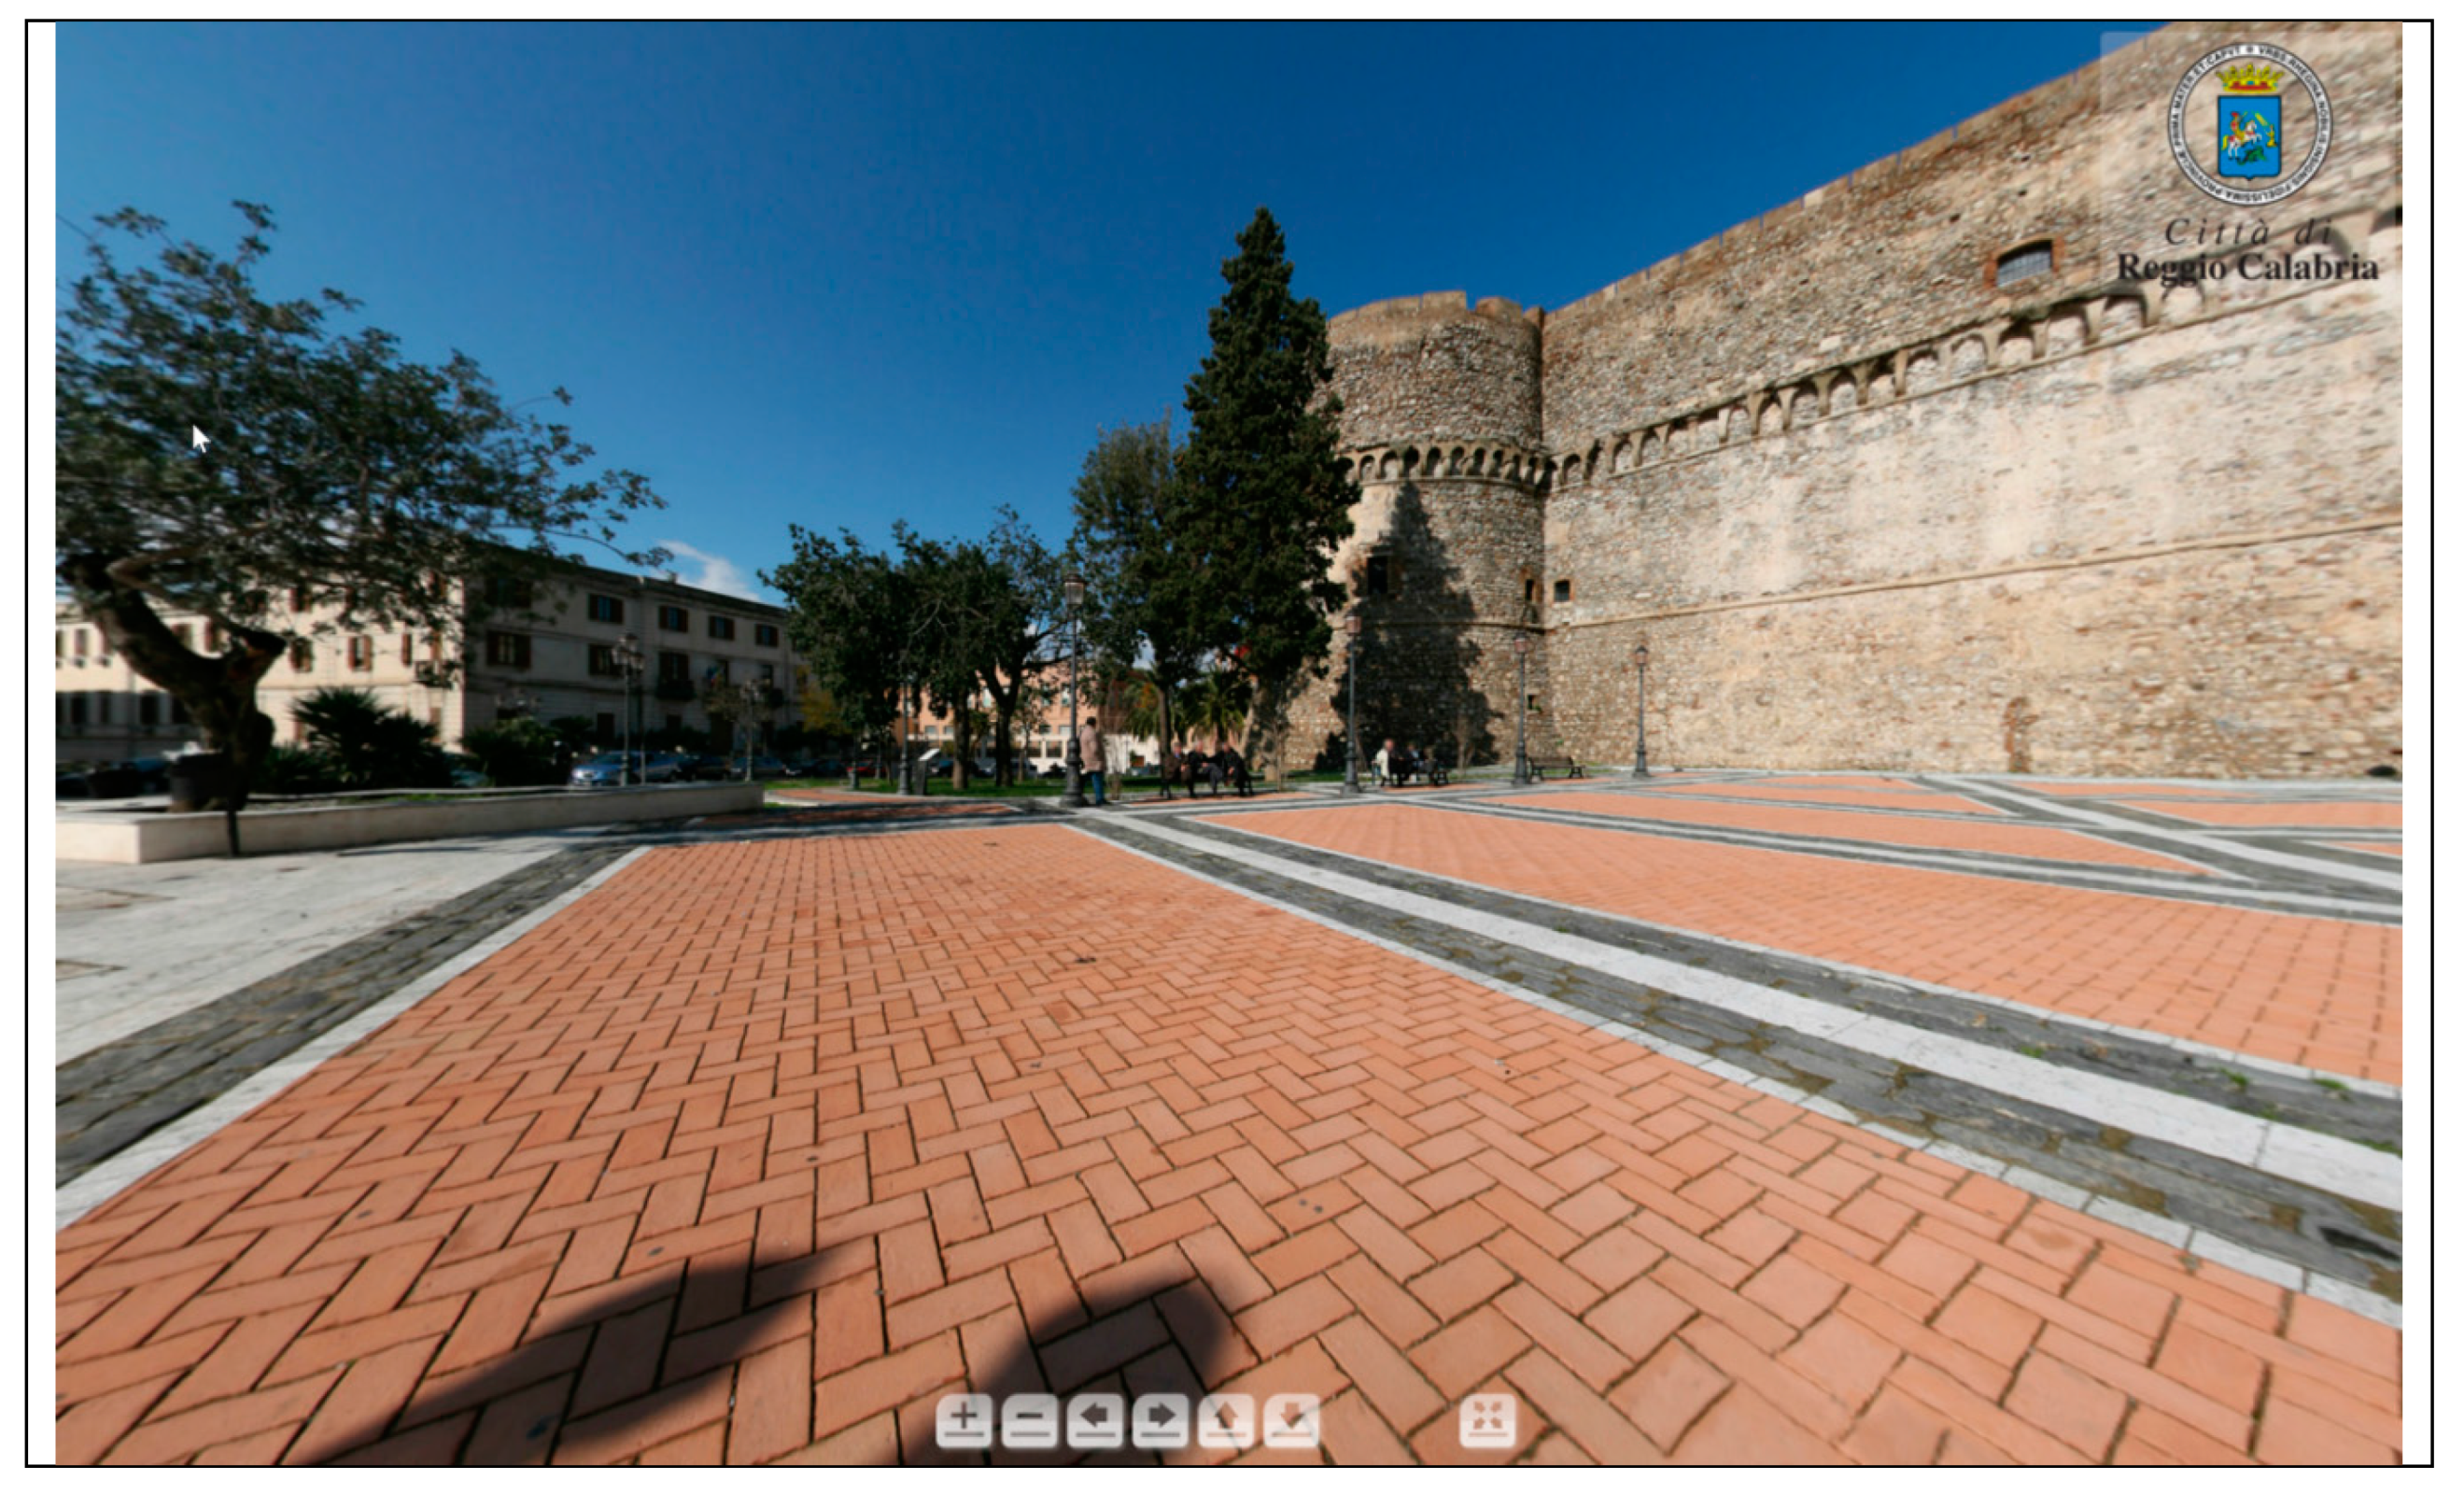
“Castello Aragonese—Reggio Calabria”. Command bar only [26].
Figure A5.
“Castello Aragonese—Reggio Calabria”. Command bar only [26].

Figure A6.
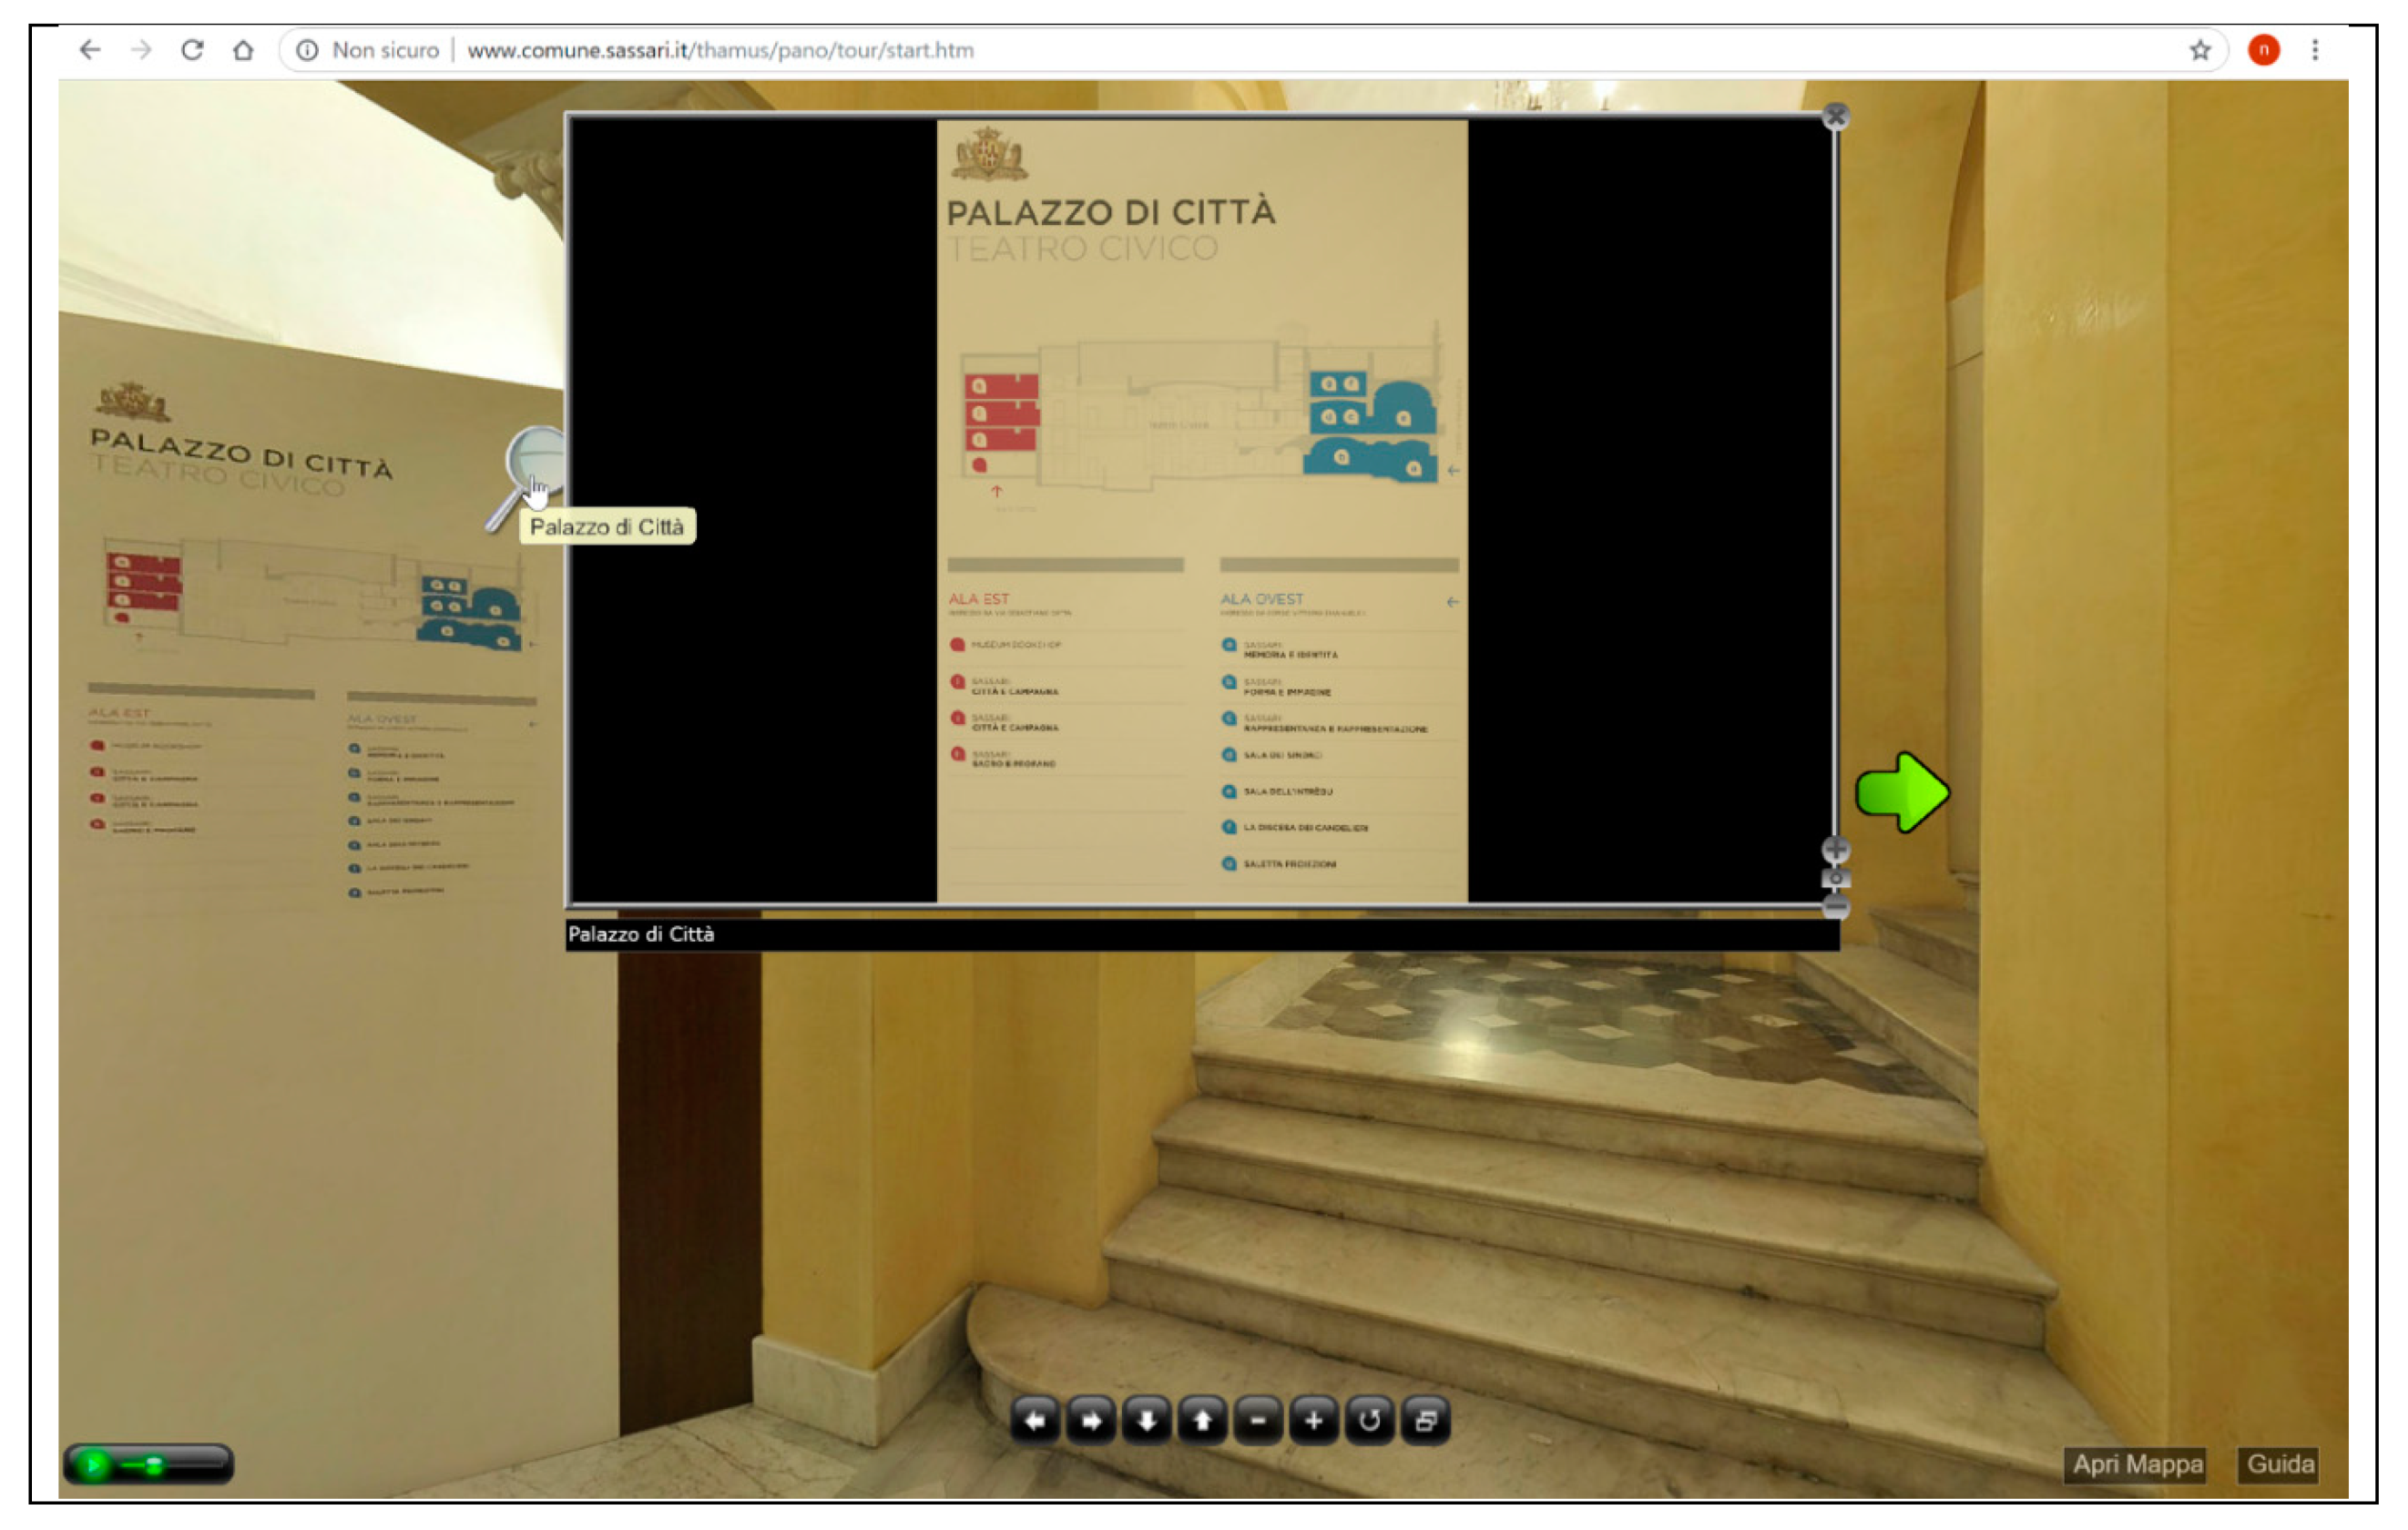
“Palazzo di Città—Teatro Civico (Sassari)”. Command bar, scenes preview, hotspots, link among scenes, floor plan [27].
Figure A6.
“Palazzo di Città—Teatro Civico (Sassari)”. Command bar, scenes preview, hotspots, link among scenes, floor plan [27].

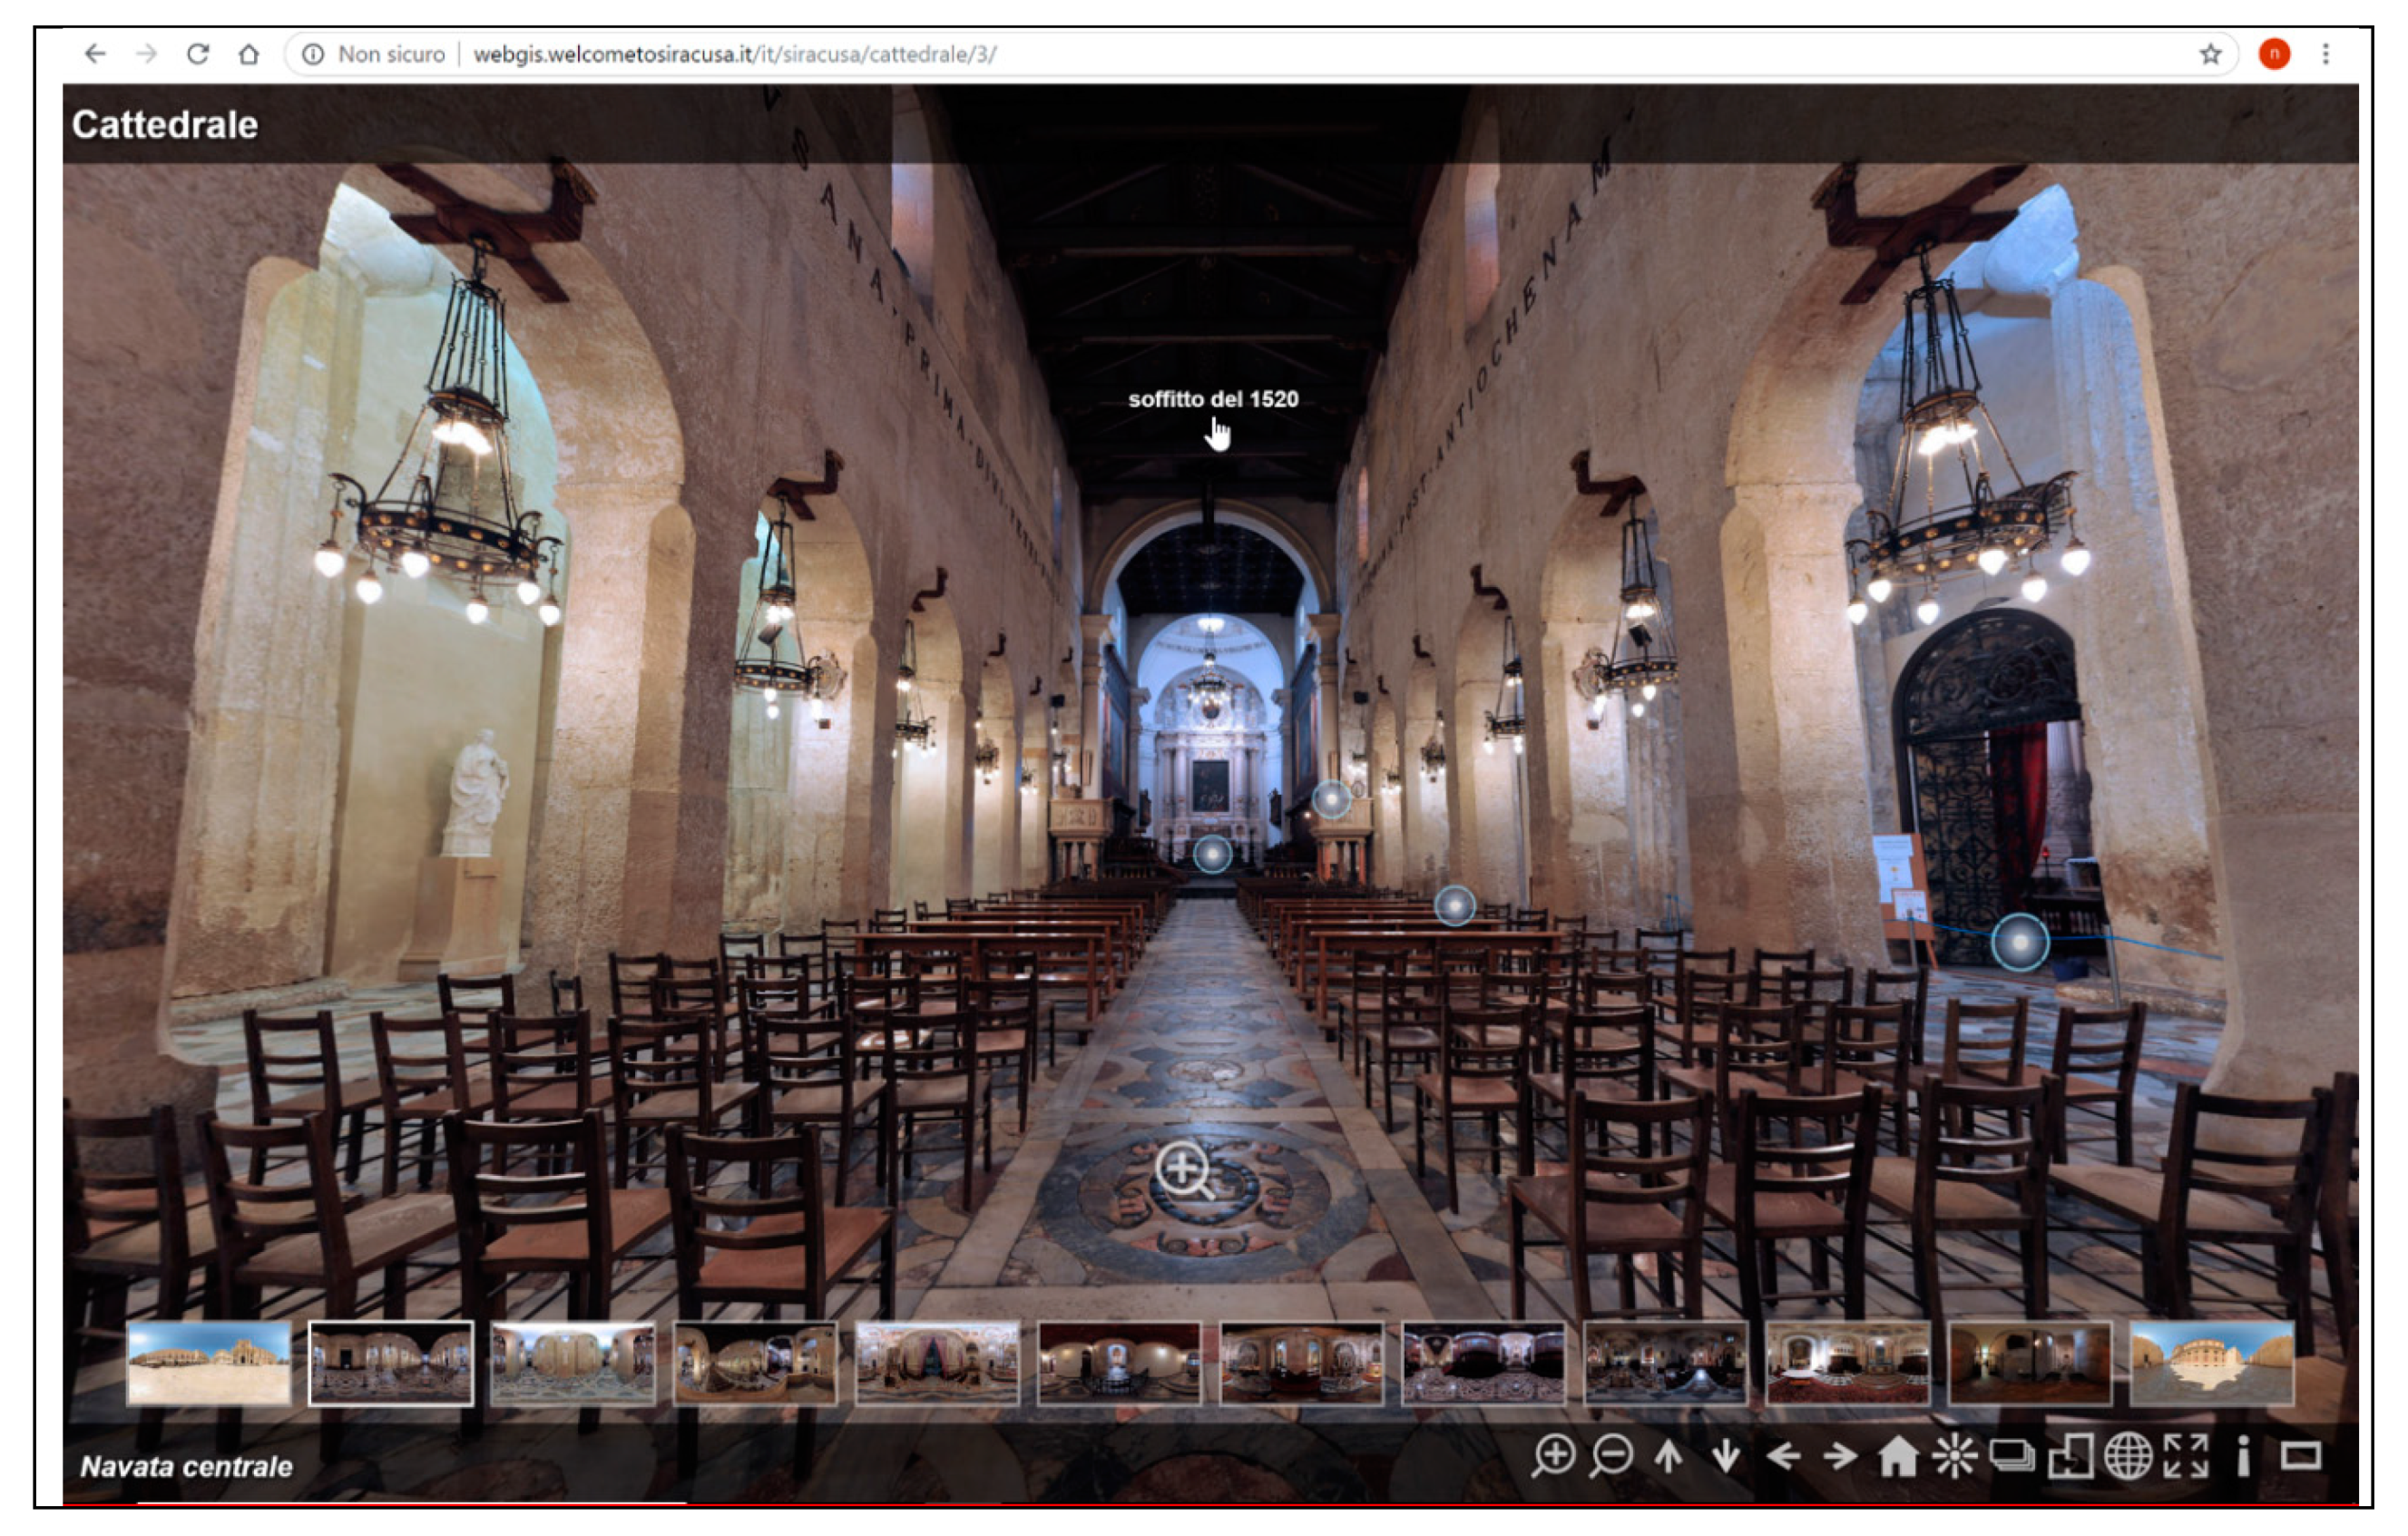
Figure A7.
“Duomo di Siracusa”. Command bar, scene previews, hotspots, link among scenes, floor plan, map [28].
Figure A7.
“Duomo di Siracusa”. Command bar, scene previews, hotspots, link among scenes, floor plan, map [28].

Figure A8.
“Virtual Tour Itinerari Ebraici di Bologna—Museo Ebraico”. Command bar, scenes preview (on right), objects preview (show/hide on left), link among scenes, information window, map, social media [30].
Figure A8.
“Virtual Tour Itinerari Ebraici di Bologna—Museo Ebraico”. Command bar, scenes preview (on right), objects preview (show/hide on left), link among scenes, information window, map, social media [30].

Figure A9.
“Museo Archeologico Regionale (Aosta)”. Command bar, floor plan, 3D objects [31].
Figure A9.
“Museo Archeologico Regionale (Aosta)”. Command bar, floor plan, 3D objects [31].

Figure A10.
“Museo delle Ceramiche (Grottaglie)”. Command bar, scene previews, object previews, info and 3D, link among scenes; information window, map, stereoscopic view [32].
Figure A10.
“Museo delle Ceramiche (Grottaglie)”. Command bar, scene previews, object previews, info and 3D, link among scenes; information window, map, stereoscopic view [32].

References
- Direzione Regionale Musei Puglia—Interactive Map. Available online: http://www.itc.cnr.it/ba/map/PMP/ (accessed on 25 September 2020).
- Museo Nazionale Archeologico di Altamura—Virtual tour. Available online: http://www.itc.cnr.it/ba/vt/altamura/museo_nazionale_archeologico/ (accessed on 25 September 2020).
- Assemblea del Senato 2017. Misure per il sostegno e la valorizzazione dei piccoli comuni. Available online: https://www.camera.it/leg17/522?tema=sostegno_e_valorizzazione_dei_piccoli_comuni#m (accessed on 25 September 2020).
- ANCI Ricerche. Una Risorsa Strategica Per lo Sviluppo Dei Piccoli Comuni: Il Turismo Delle Identità. 2007. Available online: https://www.cittalia.it/utility/la-fondazione/pubblicazioni/una-risorsa-strategica-per-lo-sviluppo-dei-piccoli-comuni-il-turismo-delle-identita-3/ (accessed on 25 September 2020).
- Virtual Tour. Available online: https://www.comune.asti.it/pagina799_virtual-tour.html (accessed on 25 September 2020).
- Abdelhamid, T. Digital Techniques for Cultural Heritage and Artifacts Recording. Resourceedings. 2019, Volume 2, pp. 72–112. Available online: https://press.ierek.com/index.php/Resourceedings/article/downloadSuppFile/606/295 (accessed on 25 September 2020).
- Paris, L.; Calvano, M.; Nardinocchi, C. Web Spherical Panorama for Cultural Heritage 3D Modeling. In New Activities for Cultural Heritage; Ceccarelli, M., Cigola, M., Recinto, G., Eds.; Springer: Cham, Germany, 2017. [Google Scholar] [CrossRef]
- Maiellaro, N.; Varasano, A.; Capotorto, S. Digital Data, Virtual Tours, and 3D Models Integration Using an Open-Source Platform. In VR Technologies in Cultural Heritage; Duguleană, M., Carrozzino, M., Gams, M., Tanea, I., Eds.; VRTCH 2018; Communications in Computer and Information Science; Volume 904; Springer: Cham, Germany, 2019; Available online: https://0-link-springer-com.brum.beds.ac.uk/chapter/10.1007/978-3-030-05819-7_12 (accessed on 25 September 2020).
- Pereira, R.E.; Moud, H.I.; Gheisari, M. Using 360-Degree Interactive Panoramas to Develop Virtual Representation of Construction Sites. Lean and Computing in Construction Congress (LC3): Volume I Ð. In Proceedings of the Joint Conference on Computing in Construction (JC3), Heraklion, Greece, 4−7 July 2017; pp. 775–782. Available online: https://itc.scix.net/pdfs/LC3_2017_paper_122.pdf (accessed on 25 September 2020).
- Bowman, D.A.; Gabbard, J.L.; Hix, D. A Survey of Usability Evaluation: Classification and Comparison of Methods. Presence, Volume 11, No. 4. August 2002, pp. 404–424. Available online: https://www.researchgate.net/publication/200772718 (accessed on 17 November 2020).
- Karoulis, A.; Sylaiou, S.; White, M. Usability Evaluation of a Virtual Museum Interface. Informatica. 2006, Volume 17, No. 3. pp. 363–380. Available online: https://www.researchgate.net/publication/220073949 (accessed on 17 November 2020).
- Villanueva, R.; Moore, A.; Wong, W.B.L. Usability evaluation of non-immersive, desktop, photo-realistic virtual environments. SIRC 2004—The 16 Annual Colloquium of the Spatial Information Research Centre University of Otago, Dunedin, New Zealand 29−30 November 2004. Available online: https://www.researchgate.net/publication/228976477 (accessed on 17 November 2020).
- Bastanlar, Y. User Behaviour in Web-Based Interactive Virtual Tours. In Proceedings of the ITI 2007 29th International Conference on Information Technology Interfaces, Cavtat, Croatia, 25−28 June 2007; Available online: https://www.researchgate.net/publication/4266065 (accessed on 17 November 2020).
- Isparta Museum. Available online: https://www.ktb.gov.tr/genel/SanalMuzeler/IspartaMuzesi/index.html (accessed on 17 November 2020).
- Wook, T.S.; Zairon, I.Y.; Idris, M.; Zin, N.A.; Judi, H.M.; Jailani, N. Campus Virtual Tour Design to Enhance Visitor Experience and Interaction in a Natural Environment. Int. J. Multimed. Its Appl. 2018, 10, 77–92. Available online: https://aircconline.com/ijma/V10N3/10318ijma07.pdf (accessed on 17 November 2020). [CrossRef]
- Kabassi, K.; Amelio, A.; Komianos, V.; Oikonomou, K. EvaluatingMuseum Virtual Tours: The Case Study of Italy. Information 2019, 10, 351. Available online: https://0-www-mdpi-com.brum.beds.ac.uk/2078-2489/10/11/351 (accessed on 17 November 2020). [CrossRef] [Green Version]
- Osman, A.; Iskak, N.I.; Wahab, N.A.; Ibrahim, N. Interactive Virtual Campus Tour using Panoramic Video: A Heuristic Evaluation. J. Comput. Res. Innov. 2020, 5, 4. Available online: https://crinn.conferencehunter.com/index.php/jcrinn/article/view/160/125 (accessed on 17 November 2020).
- Capterra. Virtual Tour Software. 2018. Available online: https://www.capterra.com/virtual-tour-software (accessed on 17 November 2020).
- JustPRO. Virtual Tour: Esplode il Business in Italia. 2017. Available online: www.justpro.it/news/357-virtual+tour.html (accessed on 25 September 2020).
- Agenzia Nazionale Turismo. Home—Video—Piazza Maggiore. Available online: www.italia.it/it/media/tour-virtuali-ditalia/tour-virtuale.html?no_cache=1&stuid=1282 (accessed on 25 September 2020).
- Bortoletti, F. The Tourist Districts of the Sicilian Region between Genesis and Management. In Proceedings of the Workshop AI & Cultural Heritage, Palermo, Italy; Bordoni, L., Ed.; 2011; pp. 17–20. [Google Scholar]
- Città di Isernia. Foto Sferiche Della Città. Available online: www.comune.isernia.it/sferiche/cattedrale%20formato%20flash/cattedrale.html (accessed on 25 September 2020).
- Tour Virtuale. Rifugio Antiaereo Della Martana. Available online: www.comune.massa.ms.it/tour_rifugio_martana/tour_rifugio_martana.html (accessed on 25 September 2020).
- Milano @ 360—Duomo Square. Available online: https://download.comune.milano.it/turismo/milano360/piazze/duomo/ (accessed on 25 September 2020).
- I Monumenti del Tardo Barocco di Ragusa. Available online: www.comune.ragusa.gov.it/turismo/unesco/virtualtour/index.html (accessed on 25 September 2020).
- Castello Aragonese, Reggio Calabria. Available online: http://turismo.reggiocal.it/VirtualTour.aspx?id=200 (accessed on 25 September 2020).
- Palazzo di Città—Teatro Civico (Sassari). Available online: http://www.comune.sassari.it/thamus/pano/tour/start.htm (accessed on 25 September 2020).
- Duomo di Siracusa. Available online: http://webgis.welcometosiracusa.it/it/siracusa/cattedrale/3 (accessed on 16 November 2018).
- Lerario, A.; Maiellaro, N. Mappe interattive per la promozione turistico-culturale. SCIentific RESearch and Information Technology. Mu.S.A. Must See Advis. 2014, 4, 85–98. Available online: http://www.sciresit.it/article/viewFile/10939/10122 (accessed on 25 September 2020).
- Virtual Tour Itinerari Ebraici di Bologna—Museo Ebraico. Available online: https://ucei.it/virtualtour/bologna/it/?sc=museum (accessed on 25 September 2020).
- Museo Archeologico Regionale (Aosta). Available online: http://www.regione.vda.it/cultura/mostre_musei/musei/mar_aosta/Visita_virtuale/page.html# (accessed on 25 September 2020).
- Museo Delle Ceramiche (Grottaglie). Available online: http://www.itc.cnr.it/ba/vt/grottaglie/museo_della_ceramica (accessed on 25 September 2020).
- Maiellaro, N.; Lerario, A. Studio preliminare per la progettazione della componente “Virtual Touring”. Bari. 12 April 2019. [Google Scholar]
- Maiellaro, N.; Varasano, A. The Albanian Cultural Heritage on the Internet. SCIentific RESearch and Information Technology. 2013, Volume 3. Available online: http://www.sciresit.it/article/view/10177 (accessed on 25 September 2020).
- Roast, C.; Uruchurtu, E. Reflecting on the Physics of Notations applied to a visualisation case study. In MexIHC ’16: 6th Mexican Conference on Human-Computer Interaction; Cornjo, R., Mayora Ibarra, O., Eds.; Association for Computing Machinery: New York, NY, USA, 2016; Available online: https://shura.shu.ac.uk/12901/7/ (accessed on 17 November 2020).
- Störrle, H.; Fish, A. Towards an Operationalization of the “Physics of Notations” for the Analysis of Visual Languages. In Model-Driven Engineering Languages and Systems. MODELS 2013; Moreira, A., Schätz, B., Gray, J., Vallecillo, A., Clarke, P., Eds.; Springer: Berlin/Heidelberg, Germany, 2013; Available online: https://www.researchgate.net/profile/Harald_Stoerrle/publication/263239475 (accessed on 17 November 2020).
- Moody, D.L. The “Physics” of Notations: Towards a Scientific Basis for Constructing Visual Notations in Software Engineering. IEEE Trans. Softw. Eng. 2010, 35, 756–779. Available online: https://www.researchgate.net/publication/224090141 (accessed on 17 November 2020).
- Dobson, M. Visual Information Processing and Cartographic Communication: The Utility of Redundant Stimulus Dimensions. In Graphic Communication and Design in Contemporary Cartography; Fraser , D.R., Taylor, D.R.F., Eds.; John Wiley and Sons: Hoboken, NJ, USA, 1983; pp. 149–176. [Google Scholar]
- Krzywinski, M.; Birol, I.; Jones, S.; Marra, M. Getting Into Visualization of Large Biological Data Sets. 20 Imperatives of Information Design. 2012. Available online: http://mkweb.bcgsc.ca/biovis2012/krzywinski-visualizing-biological-data.pdf (accessed on 25 September 2020).
- Google Maps Android Marker Clustering Utility. Available online: https://developers.google.com/maps/documentation/android-sdk/utility/marker-clustering (accessed on 17 November 2020).
- La Carta dei Beni Culturali Pugliesi. Available online: http://cartapulia.it/ (accessed on 17 November 2020).
- Visit Malta. Available online: http://www.visitmalta.com (accessed on 17 November 2020).
- Visit Cyprus. Available online: https://maps.geomatic.com (accessed on 17 November 2020).
- Bucalossi, L.; Nobile, A. Tour Virtuali (Panotour Pro). Available online: http://www.geomaticaeconservazione.it/corsoperfezionamento2011/docs/05_tour_virtuale.pdf (accessed on 17 November 2020).
- Gran Virtual Tour. Travel in Heritage. MIBACT—Ministero Per i Beni e le Attività Culturali e Per il Turismo. Available online: https://www.beniculturali.it/virtualtour (accessed on 17 November 2020).
- Fitzgibbon, A.W.; Cross, G.; Zisserman, A. Automatic 3D Model Construction for Turn-Table Sequences. In Structure and Motion from Multiple Images in Large—Scale Environments, Lecture Notes in Computer Science; Van Gool, L., Koch, R., Eds.; Springer: Berlin, Heidelberg, 1998; pp. 154–169. Available online: https://www.robots.ox.ac.uk/~vgg/publications/1998/Fitzgibbon98a/fitzgibbon98a.pdf (accessed on 17 November 2020).
- Reljić, I.; Dunđer, I. Application of Photogrammetry in 3D Scanning of Physical Objects. TEM J. 2019, 8, 94–101. Available online: http://www.temjournal.com/content/81/TEMJournalFebruary2019_94_101.pdf (accessed on 17 November 2020).
- About 3DHOP. Available online: http://vcg.isti.cnr.it/3dhop (accessed on 17 November 2020).
- Museo Nazionale Archeologico di Altamura—3D model of a Kantharos. Available online: www.itc.cnr.it/ba/3D/altamura/kantharos.html (accessed on 17 November 2020).
- Pérez, Y.; Berres, S.; Rodríguez, E.; Rodríguez, S.; Antúnez, G.; Mercado, A.; Soledad, M.; Jara, C.; Ulloa, M. Usability principles for the design of virtual tours. In Proceedings of the 21st International Congress on Modelling and Simulation, Gold Coast, Australia, 29 November–4 December 2015; Available online: https://www.mssanz.org.au/modsim2015/K2/perez.pdf (accessed on 17 November 2020).
Figure 1.
Virtual touring section overview: multimedia objects of museums in the map could be viewed in the map itself through their preview images and the associated applications (virtual tour, 3D model viewer, image viewer); it is also possible to access directly the virtual tour and the 3D model viewer through their own URL.

Figure 2.
Exteriors of the church of San Felice (“Casale di Balsignano”): (a) Equirectangular image built via firmware using the two lenses Ricoh Teta S camera; (b) Virtual tour scene based on the aforementioned equirectangular image.
Figure 2.
Exteriors of the church of San Felice (“Casale di Balsignano”): (a) Equirectangular image built via firmware using the two lenses Ricoh Teta S camera; (b) Virtual tour scene based on the aforementioned equirectangular image.

Figure 3.
Isparta Museum Virtual Tour. (a) The interface shows a floor plan window on the left and a viewing window on the right; pull-down menu described in [13] seems absent; (b) the new interface version available nowadays [14] seems not to adopt usability assessment suggestions; moreover, the floor plan and the hotspots on the artifacts have been canceled.

Figure 4.
Example of virtual tour on the official Italian website for tourism.

Figure 5.
Production steps of the virtual tour of the archaeological Museum of Altamura (expert contribution phase).
Figure 5.
Production steps of the virtual tour of the archaeological Museum of Altamura (expert contribution phase).

Figure 6.
Existing virtual tour of the National Archaeological Altamura Museum: the graph.

Figure 7.
Virtual tour of the National Archaeological Altamura Museum. The interface shows: floor plans; scenes list and preview; link to “Paleolithic/second floor” scene (arrow with label “Ingresso”).
Figure 7.
Virtual tour of the National Archaeological Altamura Museum. The interface shows: floor plans; scenes list and preview; link to “Paleolithic/second floor” scene (arrow with label “Ingresso”).

Figure 8.
Virtual tour functions sample catalog.

Figure 9.
Questionnaire for virtual tour functions.

Figure 10.
Multimedia interactive map of the “Directorate” [1]: (1) Menu; (2) Callout with information about the selected resource; (3) Sidebar with search box, filter and resource list by type or by name.
Figure 10.
Multimedia interactive map of the “Directorate” [1]: (1) Menu; (2) Callout with information about the selected resource; (3) Sidebar with search box, filter and resource list by type or by name.

Figure 11.
Multimedia interactive map of the Puglia Regional Museum Directorate [1]. The function tiles in the menu open a window showing the image previews of multimedia object pertaining all the resources. With a mouse over a preview, two function buttons are visualized: (1) Link to the relevant application (in the example, the virtual tour of the of the National Archaeological Altamura Museum); (2) Zoom in on the map to the resource the multimedia objects refer to.

Figure 12.
Virtual tour of the National Archaeological Altamura Museum [2] on mobile. (a) Homepage with Museum Section list. (b) Museum section window with an image carousel of section artifacts and a description (text and audio). (c) Artifact window with an area for 3D model manipulation. (d) 3D floorplan.

Figure 13.
Virtual tour of the National Archaeological Altamura Museum [2] on desktop: (1) scene with navigational arrows; (2) artifact hotspot; (3) hotspot not yet opened; (4) floor level; (5) command bar (6) tab to open the Museum Section information window.
Figure 13.
Virtual tour of the National Archaeological Altamura Museum [2] on desktop: (1) scene with navigational arrows; (2) artifact hotspot; (3) hotspot not yet opened; (4) floor level; (5) command bar (6) tab to open the Museum Section information window.

Figure 14.
A 3D model viewer of a Kantharos (National Archaeological Altamura Museum) [49].
Figure 14.
A 3D model viewer of a Kantharos (National Archaeological Altamura Museum) [49].


Table 1.
Usability assessment results.
| Navigation Options | Function | Effectiveness of the Navigation | ||||||
|---|---|---|---|---|---|---|---|---|
| Not Recognized | Recognized but Not Used | Seldom Used | Frequently Used | Not Needed | Can be Used Seldom | Effective | ||
| 3 | 0 | 2 | 10 | Floor map | 0 | 0 | 15 | |
| 0 | 1 | 6 | 8 | Arrows in viewing window | 5 | 4 | 6 | |
| 0 | 5 | 9 | 1 | Pull-down menu | 4 | 11 | 0 | |
Table 2.
Functions in virtual tour interfaces in county towns and in a selection of museums.
| Functions | Isernia | Massa | Milano | Ragusa | Reggio Calabria | Sassari | Siracusa | Museum of Bologna | Museum of Aosta | Museum of Grottaglie | Museum of Altamura | |
|---|---|---|---|---|---|---|---|---|---|---|---|---|
| 01 360° display | X | X | X | X | X | X | X | X | X | X | ||
| 02 3D object info | X | |||||||||||
| 03 3D objects | X | X | ||||||||||
| 04 Directional arrows for navigation | M | X | X | X | X | X | X | M | X | M | ||
| 05 English version | X | |||||||||||
| 06 Floor Plan with nodes | X | X | X | X | X | |||||||
| 07 Full screen view | X | X | X | X | X | X | X | |||||
| 08 Home (first scene) | X | X | X | |||||||||
| 09 Hotspot hide/show | X | |||||||||||
| 10 Increase/decrease the view | X | X | X | X | X | X | X | X | M | X | ||
| 11 Logo | X | X | X | X | X | X | ||||||
| 12 Map | X | |||||||||||
| 13 Navigational command bar hide/show | X | X | ||||||||||
| 14 Object gallery | X | E | X | |||||||||
| 15 Object info | E | X | X | X | X | |||||||
| 17 Scenes gallery - equirectangular | E | X | X | X | ||||||||
| 18 Scenes gallery - image | E | X | X | |||||||||
| 19 Scene info | X | X | X | |||||||||
| 20 Scenes link | X | X | X | X | X | X | X | |||||
| 21 Scenes list | X | X | ||||||||||
| 22 Scene rotation | X | X | X | X | X | X | ||||||
| 23 Scene title | X | X | ||||||||||
| 24 Stereoscopic view | X | |||||||||||
| 25 User guide | X | X | X | X | ||||||||
| Additional sw requested | yes | yes | no | yes | yes | yes | no | no | yes | no | no | |
| E: Function external to the virtual tour; M: function provided using the mouse; X: function available | ||||||||||||
Publisher’s Note: MDPI stays neutral with regard to jurisdictional claims in published maps and institutional affiliations. |
© 2020 by the authors. Licensee MDPI, Basel, Switzerland. This article is an open access article distributed under the terms and conditions of the Creative Commons Attribution (CC BY) license (http://creativecommons.org/licenses/by/4.0/).
Share and Cite
MDPI and ACS Style
Lerario, A.; Maiellaro, N. Virtual Touring for the Puglia Regional Museum Directorate. ISPRS Int. J. Geo-Inf. 2020, 9, 741. https://0-doi-org.brum.beds.ac.uk/10.3390/ijgi9120741
AMA Style
Lerario A, Maiellaro N. Virtual Touring for the Puglia Regional Museum Directorate. ISPRS International Journal of Geo-Information. 2020; 9(12):741. https://0-doi-org.brum.beds.ac.uk/10.3390/ijgi9120741
Chicago/Turabian StyleLerario, Antonella, and Nicola Maiellaro. 2020. "Virtual Touring for the Puglia Regional Museum Directorate" ISPRS International Journal of Geo-Information 9, no. 12: 741. https://0-doi-org.brum.beds.ac.uk/10.3390/ijgi9120741
Note that from the first issue of 2016, this journal uses article numbers instead of page numbers. See further details here.