1. Introduction
Urbanization is a general trend of current societies. Megacities, defined as having more than 10 million people, are one result of this trend [
1]. It is estimated that the world will have 43 megacities by 2030, mostly in developing regions [
2]. Unsurprisingly, urbanization brings many developmental opportunities, but also reveals many negative issues that need to be addressed such as environmental pollution, urban sprawl, and traffic congestion. Alongside such developments, the global population reached 7.7 billion by the middle of 2019 and is expected to reach 9.7 billion by 2050 [
3]. Even though the global population has continued to rise, the actual growth rate continues to fall. From 2015, the growth rate had fallen below 1.1% and is projected to further decline. An aging population is another trend currently faced. In 2019, the population of people aged 65 years or older was 703 million, and it is estimated that that this number will reach 1.5 billion by 2050 [
4]. Globally, the proportion of people aged 65 years or older globally increased from 6% in 1990 to 9% in 2019 and is estimated to rise to 16% by 2050. By that time, one out of every six people will be aged 65 years or older. Beijing is a megacity, the population of which has a very high life expectancy, reported in 2017 to be 82.2 years [
5]. It is a megacity with a fast rate of urbanization and faces aging population challenges. Hence, Beijing was chosen as the study area for this research.
Transport is a basic need for city dwellers. A well planned and operated city, where population and urbanization trends together with people’s basic corresponding needs are well accommodated, will have the potential for vibrant sustainability. The elderly are, obviously, a constant part of such a society. Their physical mobility naturally tends to deteriorate and could detract from the natural or designed cohesion of a well-organized sustainable city. Therefore, it is important to understand well the mobility behavior characteristics of the elderly and their relationship with that of other age groups. Thus, for communal harmony, a city should be planned and operated to fully take care of the transport needs of different age groups. Public transport is one of the most promising strategies to facilitate the sustainable development of modern societies. In fact, public transport is the main transport means especially in developing countries and in megacities. Public transport is affordable both for the elderly and other age groups. Effective public transport planning and traffic management not only benefits society as a whole but also provides travel independence for all who need it. As regards transport, the elderly, in many circumstances, such as physical and financial, are potentially the most disadvantaged. Hence, in the possible interests of harmonious sustainability, the mobility characteristics of the elderly form a key interest as regards the general topic of this research, efficient transport being a contributory element to harmonious living. Big data are increasingly available thanks to advances in the Internet of Things (IoT) and information and communication technology (ICT) such as smart card data that are automatically collected when passengers tap in/out of a bus. This ICT-based sensing data brings new opportunities to shed new light on human mobility with unprecedented resolution.
In this study, a large volume of smart card data was used to investigate the public transport travel behavior of the elderly in Beijing, China. Different from previous studies that relied on questionnaire data, the characteristics of the elderly, traveling in space and time, were examined down to the hour. Further, the temporal and spatial travel behavior of the elderly and adults were compared to identify the manner of their relationship and in what ways they may affect each other. The elderly people were objectively identified as long, medium, and short bus-travelers according to their objective mobility characteristics from a complex system perspective, which provides natural and optimized policy implications. The findings shed new light on public transport policies and could potentially benefit future work as a pilot study using massive smart card data at a megacity scale.
2. Literature Review
The rapid development of human mobility analytics in recent decades has been stimulated by two factors: (1) the ability to collect large quantities of data from a variety of sources, such as new sensors for transport data [
6] and social media [
7], and (2) initiatives and in many areas for applications of new data mining technologies. Big data analytics and new technological methods have laid the foundation for a better understanding of human mobility behavior. In particular, it has been noted that such behavior involves spatial and temporal regularities regarding individual mobility [
8]. For instance, citizens usually require a high frequency of round trips such as travel from home and the workplace. It is possible to use models built based on these discovered regularities to predict sequences of common human mobility needs [
9,
10]. These types of studies reveal the scaling and small-world property of general human mobility from the perspective of complex systems.
Compared with general human mobility patterns, previous studies have explored particular aspects of the elderly’s travel behavior and their underlying factors, especially in terms of travel modes. For instance, Cui et al. [
11] after reviewing the travel characteristics of the elderly in a car-dependent society, pointed out that, in old age, the need of private cars increases [
12,
13,
14]. According to the 2001 National Household Travel Survey of The United States, 89.3% of the elderly over 65 took a personal vehicle, such as car or van, for their daily trips [
15]. Nevertheless, when the low-income elderly cannot afford a car, walking is the choice for most of them [
16]. A high frequency use of public transport by the elderly was found by those living close to important stations [
17]. Some studies have investigated factors affecting the travel characteristics of the elderly, examples include complex weather conditions [
18], the travel propensity of the elderly [
19], the travel purposes of the elderly [
20], the socio-demographic and land use factors [
21], personal and household characteristics [
22], and the built environment [
23]. The analytical results from these types of studies showed that social and culture settings have important impacts on the travel decisions of the elderly. Despite the abovementioned studies revealing the travel characteristics of the elderly and the potential influencing factors, most were limited to small-scale survey data. In particular, the travel characteristics of the public transport of the elderly were not fully discussed with spatiotemporal big data in high spatiotemporal resolutions.
Some recent studies, using both survey data and sensed big data, have begun focusing on the travel characteristics of those elderly who choose to travel by public transport. For example, household survey data in Beijing were used to explore the travel patterns of the elderly. It was found that the policy of free fare has little effect on the travel patterns of the elderly during the morning peak hours [
24]. In Hong Kong, household interview survey data were used to identify the travel patterns of the elderly [
25]. Such patterns included travel frequency, travel distance, travel time, and travel purpose. The spatial distribution patterns in administration areas were also analyzed. The research findings were helpful for policymaking. However, the questionnaire-based survey data may be limited in sample size and spatiotemporal granularity. The increasingly available human sensing data (e.g., smart card data) has been able to shed new light on human mobility patterns with unprecedented resolutions. For instance, Chen et al. [
26] by using smart card data were able to analyze the temporal characteristics of the traffic flow of the elderly in Qingdao. Shao, et al. [
27] used smart card data in Qingdao to compare the spatiotemporal characteristics between the elderly and the adults during weekdays and weekends. The spatial and temporal characteristics of the mobility of the elderly were able to be analyzed from these studies. However, most of the studies mixed all public transport modes together, despite the bus being the most preferred public transport mode of the elderly. Thus, a thorough analysis of bus travel characteristics of the latter using smart card data were able to provide deeper insights, especially from the perspective of complex systems.
It is of interest to note, however, that although there are a number of studies on the mobility characteristics of the elderly in both developing and developed countries, there is still room for further development. Firstly, very few studies have focused on the travel behavior of the elderly regarding the bus transport mode, it being the third most popular transport mode for the elderly in megacities such as Beijing [
28]. Secondly, few studies have explored the temporal and spatial characteristics of the elderly’s travel behavior systematically and precisely based on smart cart data, in particular from the perspective of complex systems. However, smart card data can further support the elderly transport analysis: (a) with a much larger sampling size, say up to the million-individual sample size compared to the 1000 to 10,000 level of survey data, (b) in near real time which is essential for transport management, and (c) with a much higher accuracy such as up to a meter level accuracy, for instance at the 500 m level, for spatial location compared to a district level accuracy. Thirdly, a study of a developing megacity with a high level of aging population and a unique urban structure of ring roads, such as in Beijing, China, will provide empirical insights. Thus, the aim of the research presented in this paper was to study the precise temporal and spatial travel behavior characteristics of the elderly for a bus transport model in megacities based on smart card data.
Specifically, four characteristics of the elderly’s mobility behavior when travelling by bus in a megacity were identified as the research problems discussed in this paper: (a) What is the distance traveled by the elderly? (b) What is the travel departure and arrival times of the elderly and spatial distribution of the corresponding stops? (c) What is the travel frequency of the elderly and spatial distribution of the stops most visited? (d) What is the travel duration of the elderly? To answer these queries, a study was conducted including proposing the research methodology, collecting spatial big data, conducting a temporal and spatial analysis, and analyzing the policy implications.
4. Mobility Behavior Characteristics
In this Section, five mobility behavior characteristics of the elderly travelling by bus are examined. They include temporal distribution, travel distance, travel duration, travel frequency, and spatial distribution.
4.1. Temporal Distribution Characteristics
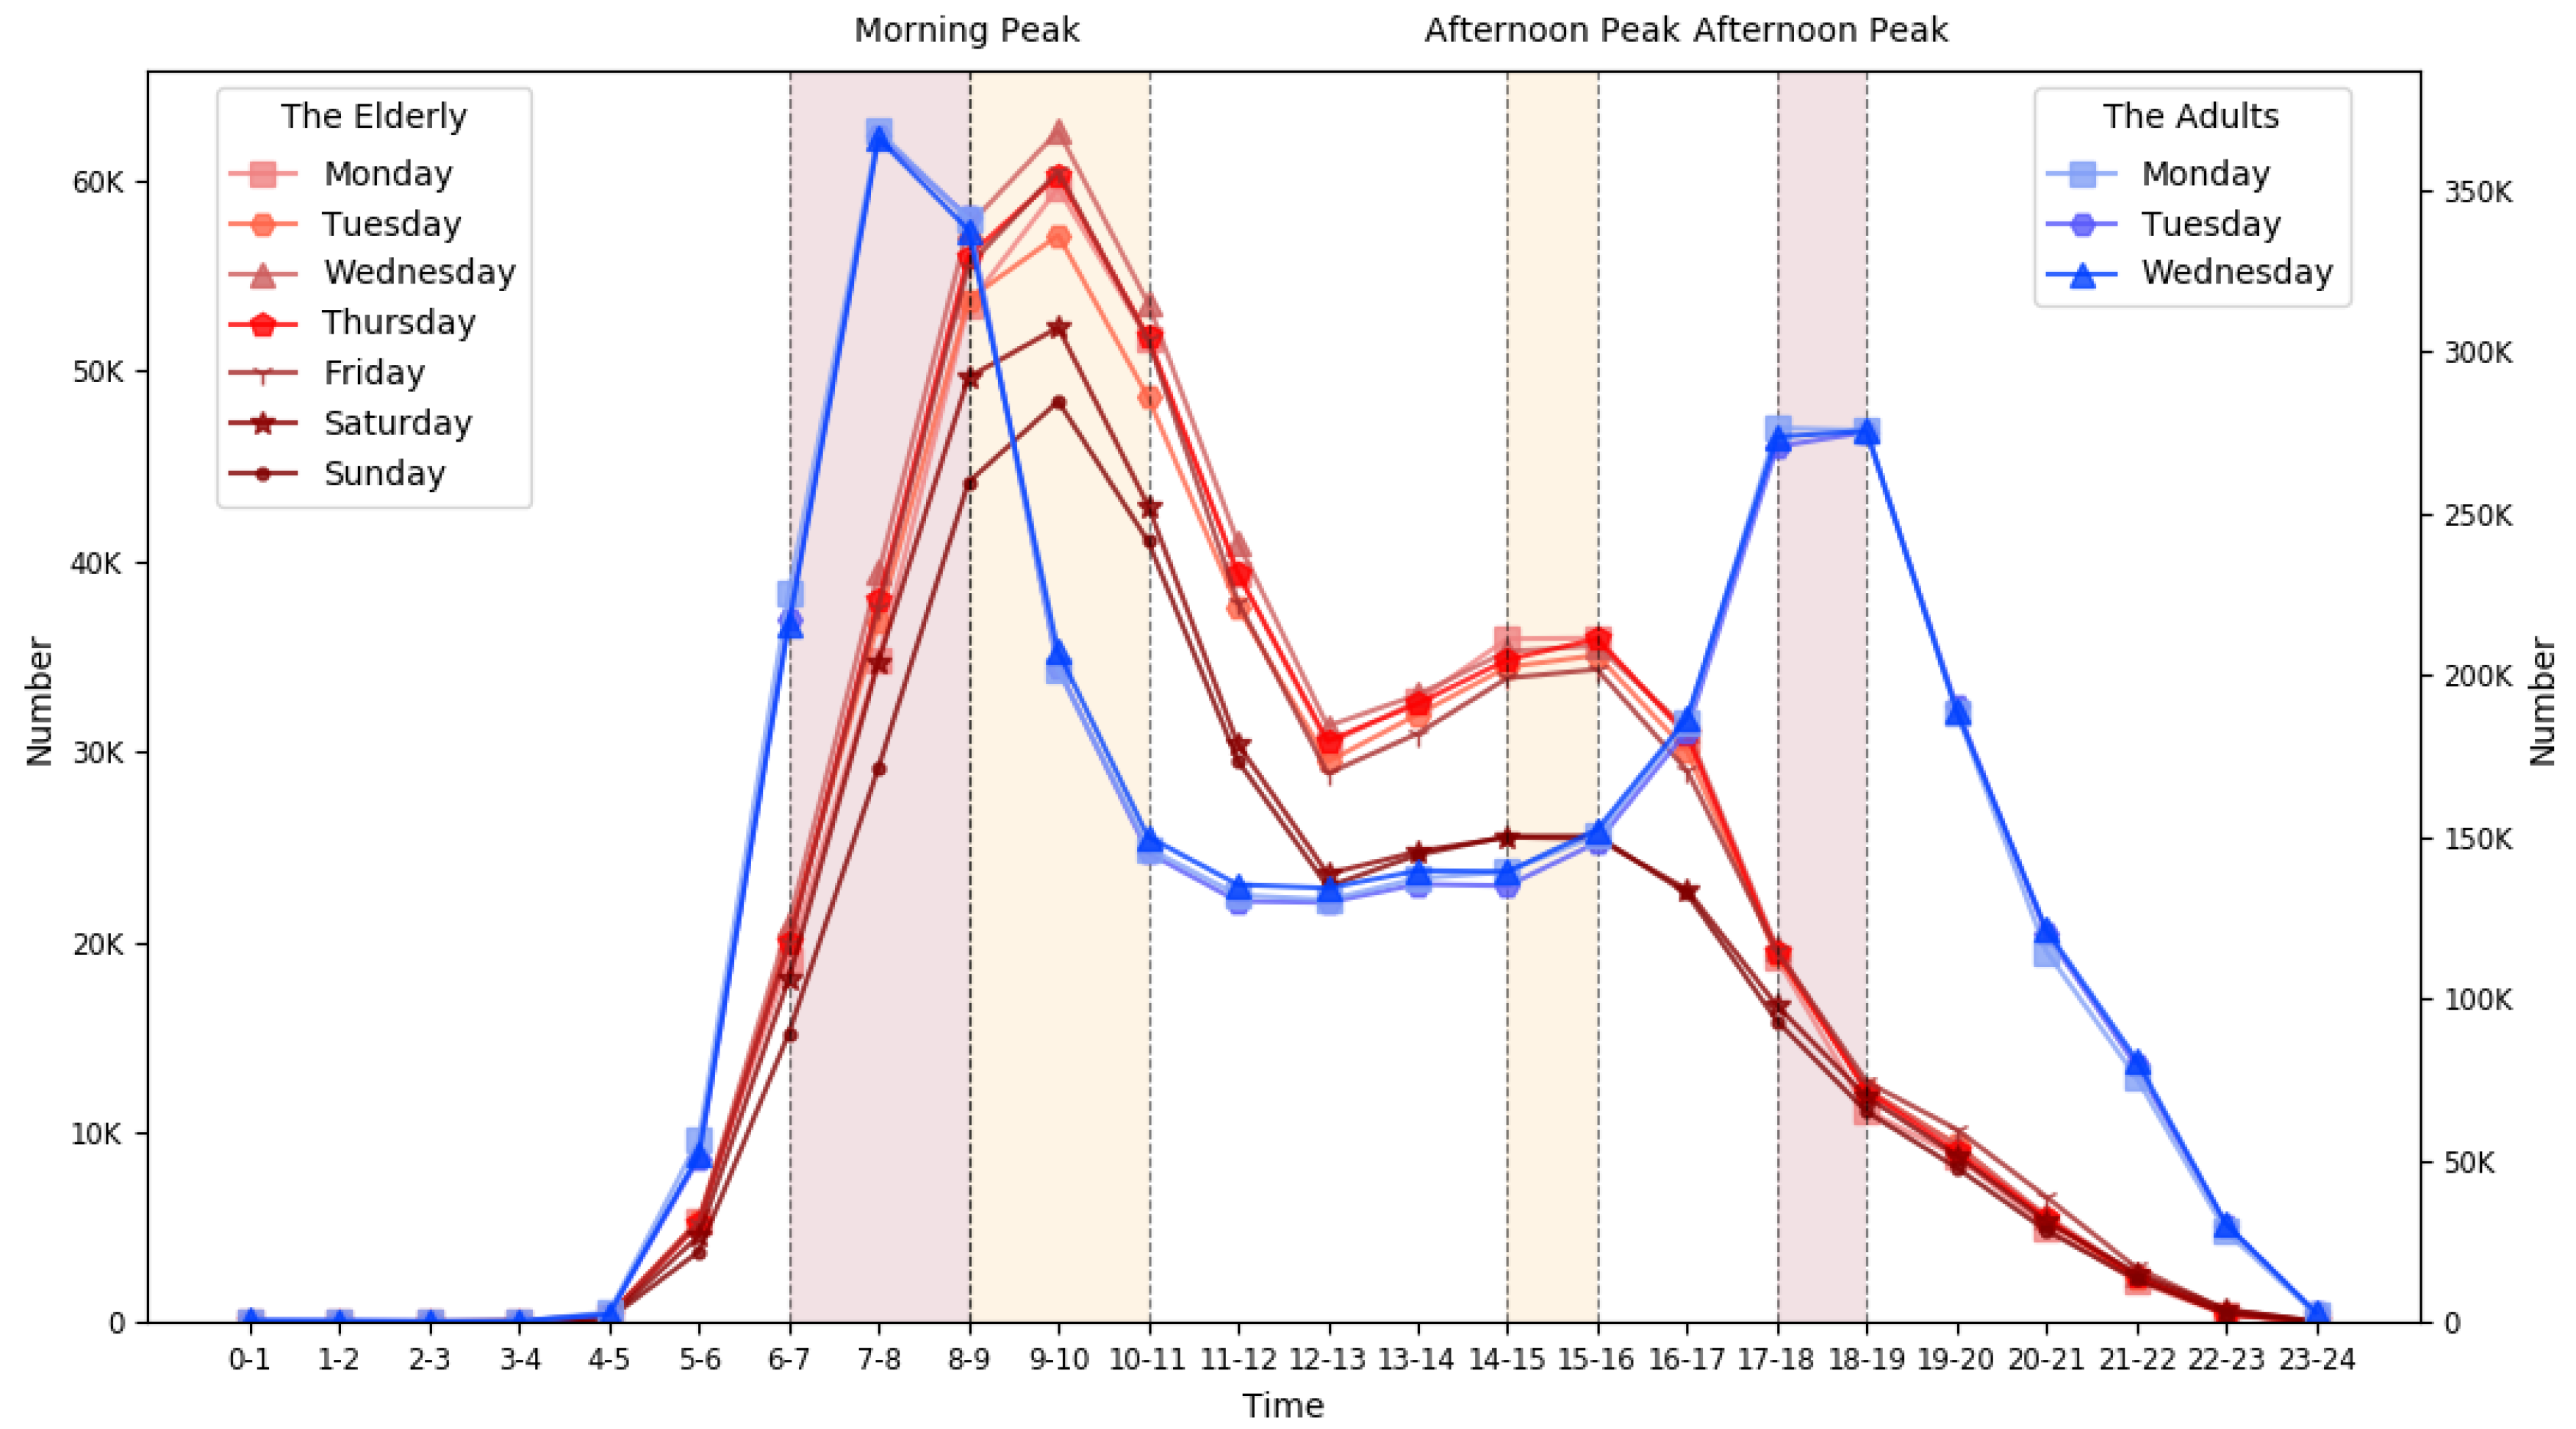
Mobility characteristics have a strong relationship with time attributes. Temporal characteristics are essential measurements for human mobility behavior. Temporal distribution and patterns of the elderly and the adults, on an hourly basis, are shown in
Figure 2. In
Figure 2, the series of lines in red represent the temporal distribution for the elderly referring to the left
y-axis (in terms of total number of bus travel) from Monday to Sunday, while the lines in blue represent the temporal distribution for adults referring to the right
y-axis. Noticeably, the number of adults traveling was approximately five times more than that of the elderly. The legends with various symbols from light to dark represent different dates. The colored parts of the background show the peak hours of the elderly and the adults in light yellow and light pink, respectively.
At first glance, the trends of the blue and red lines are different, indicating the temporal distribution characteristics between the elderly and the adults are distinct. For the elderly, there was a slight change in the number travelling from Monday to Friday. However, on the weekend, the number of trips were obviously fewer than during weekdays, especially during the morning. Although the number of elderly traveling during weekdays was greater than on weekends, the temporal trend showed the same pattern. The rush hours in the morning are from 8:00 AM to 11:00 AM, and there was only one clear peak seen in the morning for the elderly which is was between 9:00 AM and 10:00 AM. In the afternoon, a small increase in trip trends by the elderly occurred from 1:00 PM to 4:00 PM, with another rush hour from 2:00 PM to 3:00 PM. However, there was no clear peak hour in the afternoon. After 4:00 PM, the number quickly decreased to a low level. For the adults, the temporal distribution was obviously different from that of the elderly. Two time periods were noted as the main rush hours: 6:00 AM to 9:00 AM in the morning and 5:00 PM to 7:00 PM in the afternoon. Except for these two rush hours, the travel numbers maintained a low level. This illustrates the habit of adults going to work in the morning and returning back home in the afternoon within a relatively concentrated period. In the morning, there was a clear rush hour from 7:00 AM to 9:00 AM. The number of adults who travelled then decreased to a low level until 11:00 AM. After 3:00 PM, the numbers increased until the rush hour period, then decreased to zero after 7:00 PM.
A comparison of the temporal distribution between the elderly and the adults can be observed. Even though the peak hours for the elderly were different from those of the adults, in terms of the time periods, during the morning the time period overlapped from 8:00 AM to 9:00 AM. In the afternoon, there was no clear overlap during similarly caused rush hours. Therefore, to avoid rush hour traffic congestion, the elderly should avoid traveling from 7:00 AM to 9:00 AM. Travel by bus by 9:00 AM or after the general rush hours enables the avoidance of congestion.
Thus, as regards the daily travel patterns of the elderly:
- (a)
The number of the elderly travelling on the weekend was less than the number travelling on weekdays, and even fewer travel on Sunday morning;
- (b)
The travel peak hour for the elderly during the week was from 9:00 AM to 10:00 AM, and there was no clear peak in the afternoon. However, a relatively high number of departures were made between 2:00 PM and 4:00 PM;
- (c)
The morning peak hour for the elderly was 2 h later than that for adults;
- (d)
The elderly and adults had more travel activities in the morning than in the afternoon.
The behaviors and temporal distributions of elderly travel in Beijing, as revealed in this study, were different from those in other cities in China [
25,
27]. In Qingdao, the peak hour of departure in the morning was 8:00 AM on weekdays and 9:00 AM on weekends, which is one hour earlier than Beijing and the same as Beijing, respectively. There was a clear peak hour in the afternoon in Qingdao, but there was no clear afternoon peak hour in Beijing. The temporal distributions of elderly travelers in Hong Kong were somewhat different for different age groups, but overall the elderly in Hong Kong had a later morning peak hour than both Beijing and Qingdao and also tended to travel more in the evening.
4.2. Statistical Analysis of Travels
4.2.1. Travel Distance
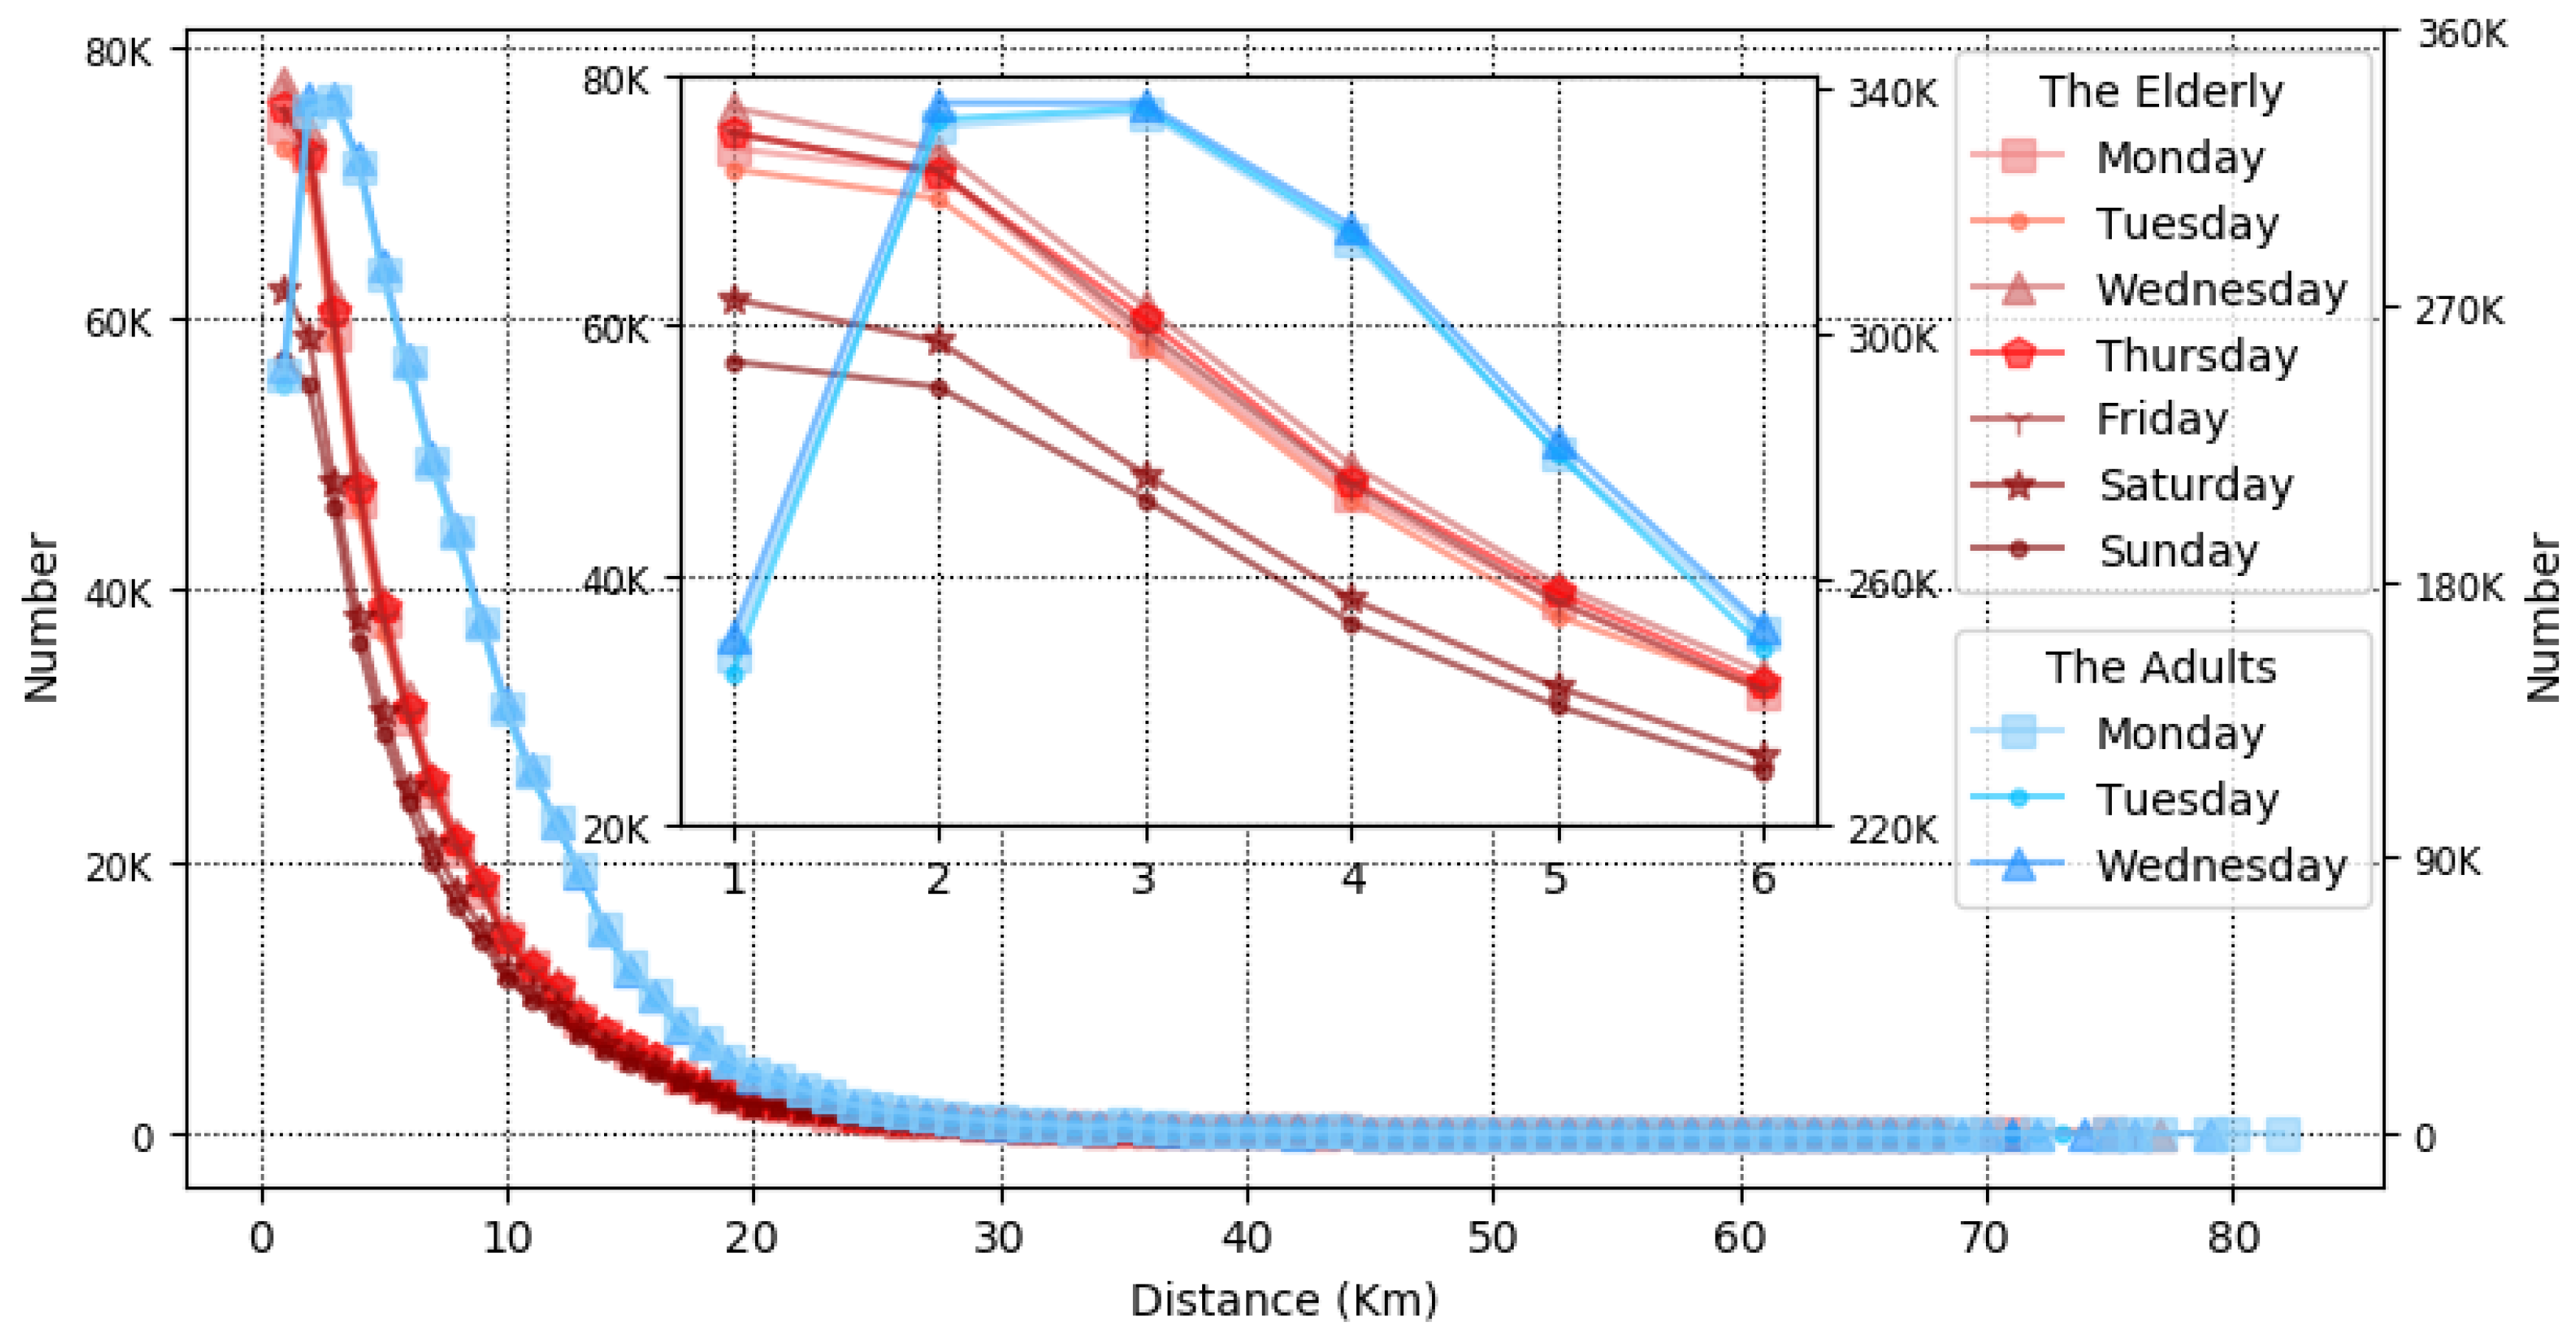
In this study, the travel distance between the departure and arrival stops along the standard routes was calculated as the travel distance. Specifically, this was defined as the distance between the departure or original bus stop (O) and the arrival or destination bus stop (D) for a person using that bus trip along a bus route network in the city. The respective travel distance of each O–D pair was calculated for (a) the elderly and (b) for the adults. The statistical analysis of the travel of the two groups is illustrated in
Figure 3. The lines in red show the statistical characteristics of the travel distance for the elderly, and the lines in blue show the travel distance for adults.
The sub-figure represents the travel distance of both the elderly and the adults ranging from 1 km to 6 km. For the elderly, the travel distance distributions were different (in terms of the number of travels) between weekdays and weekends, in terms of travel amount. The travel distance distribution during weekdays was similar on a daily basis. Most of the elderly travelled 1 km, the number then decreased gradually as the distance increased. For the adults, the number of trips increased from 1 km to 2 km dramatically. There was no large difference in travel numbers between travel distance 2 km and 3 km. However, a sharp decrease in the number of the adults’ trips was then seen from that of 3 km. It should be noted that the number adult journeys at the same distance was around 5 times greater than those of the elderly.
On average, the adults travelled for longer periods than those of the elderly (
Table 3). Based on the observations and analysis above, it can be concluded that (a) the adults travelled for longer periods than the elderly. Health problems could be one reason for this difference; (b) most of the adults travelled less than 4 km, while most of the elderly travelled 1 km.
Figure 4a is the fitted curve for the elderly’s travel distance, and
Figure 4b is the fitted curve for the adults’ travel distance. The black dots represent the travel distance data, and the red and blue lines represent the respective fitted curves for the elderly and the adults, respectively. Both of them follow the exponential distribution. It is obvious that the “heavy-tailed” distribution indicates scaling and small-world property from the perspective of complex systems. The spatial distribution of travel distance is in good agreement with previous studies in terms of complex systems, i.e., most journeys are short, while only a few trips are long. Hence, the indication is an imbalanced structure and scaling property of bus travel behavior from the perspective of a complex system.
Table 3 shows the parameters and goodness of fit. The SSE is the sum of squares due to error, RMSE is the root mean squared error, and
R2 is the coefficient of determination. In this case, for the distribution, the goodness-of-fit
R2 value reached 0.9959, indicating that the exponential distribution function fit the travel distance characteristics of the elderly well, in accordance with the smart card data. The regularity of the travel distance of the adults was also studied at the same time by the function fitting method. Again, by testing the possible distribution functions, it was found that the exponential function was also the best fit model for the travel distance distribution of adults and, thus, followed a Gaussian distribution with an
R2 of 0.9991.
Because of the indicated scaling and small-world property, the head/tail break rule [
29,
30] can be applied to divide the travel distance into different levels. Specifically, the mean value of the travel distance can be calculated to divide the whole travel records into “the head that greater than the mean value and the tail less than the mean value” (Level 1 in
Table 4). The process was then repeated to further divide the head at the first level into head and tail again (Level 2 in
Table 4). The average travel distances of the elderly was 6.1 km and 12.4 km at levels 1 and 2, respectively. In this way, the elderly can be naturally divided into three groups: short-distance travelers (less 6.1 km, with 67% of the total), middle-distance travelers (greater than 6.1 km and less 12.4 km, with 21% of the total), and long-distance travelers (greater than 12.4 km, with 12% of the total). Such objective grouping of the elderly, according to their travel distance, provides an important and natural classification of the elderly that is very useful for policy makers to provide better bus service strategies. For example, this research can support to resolve the following issues:
Where are the long-distance travelers located?
What is the percentage of each of the three groups?
What size subsidies should be offered by local governments to each of these three groups of elderly according to their travel distances?
4.2.2. Travel Duration
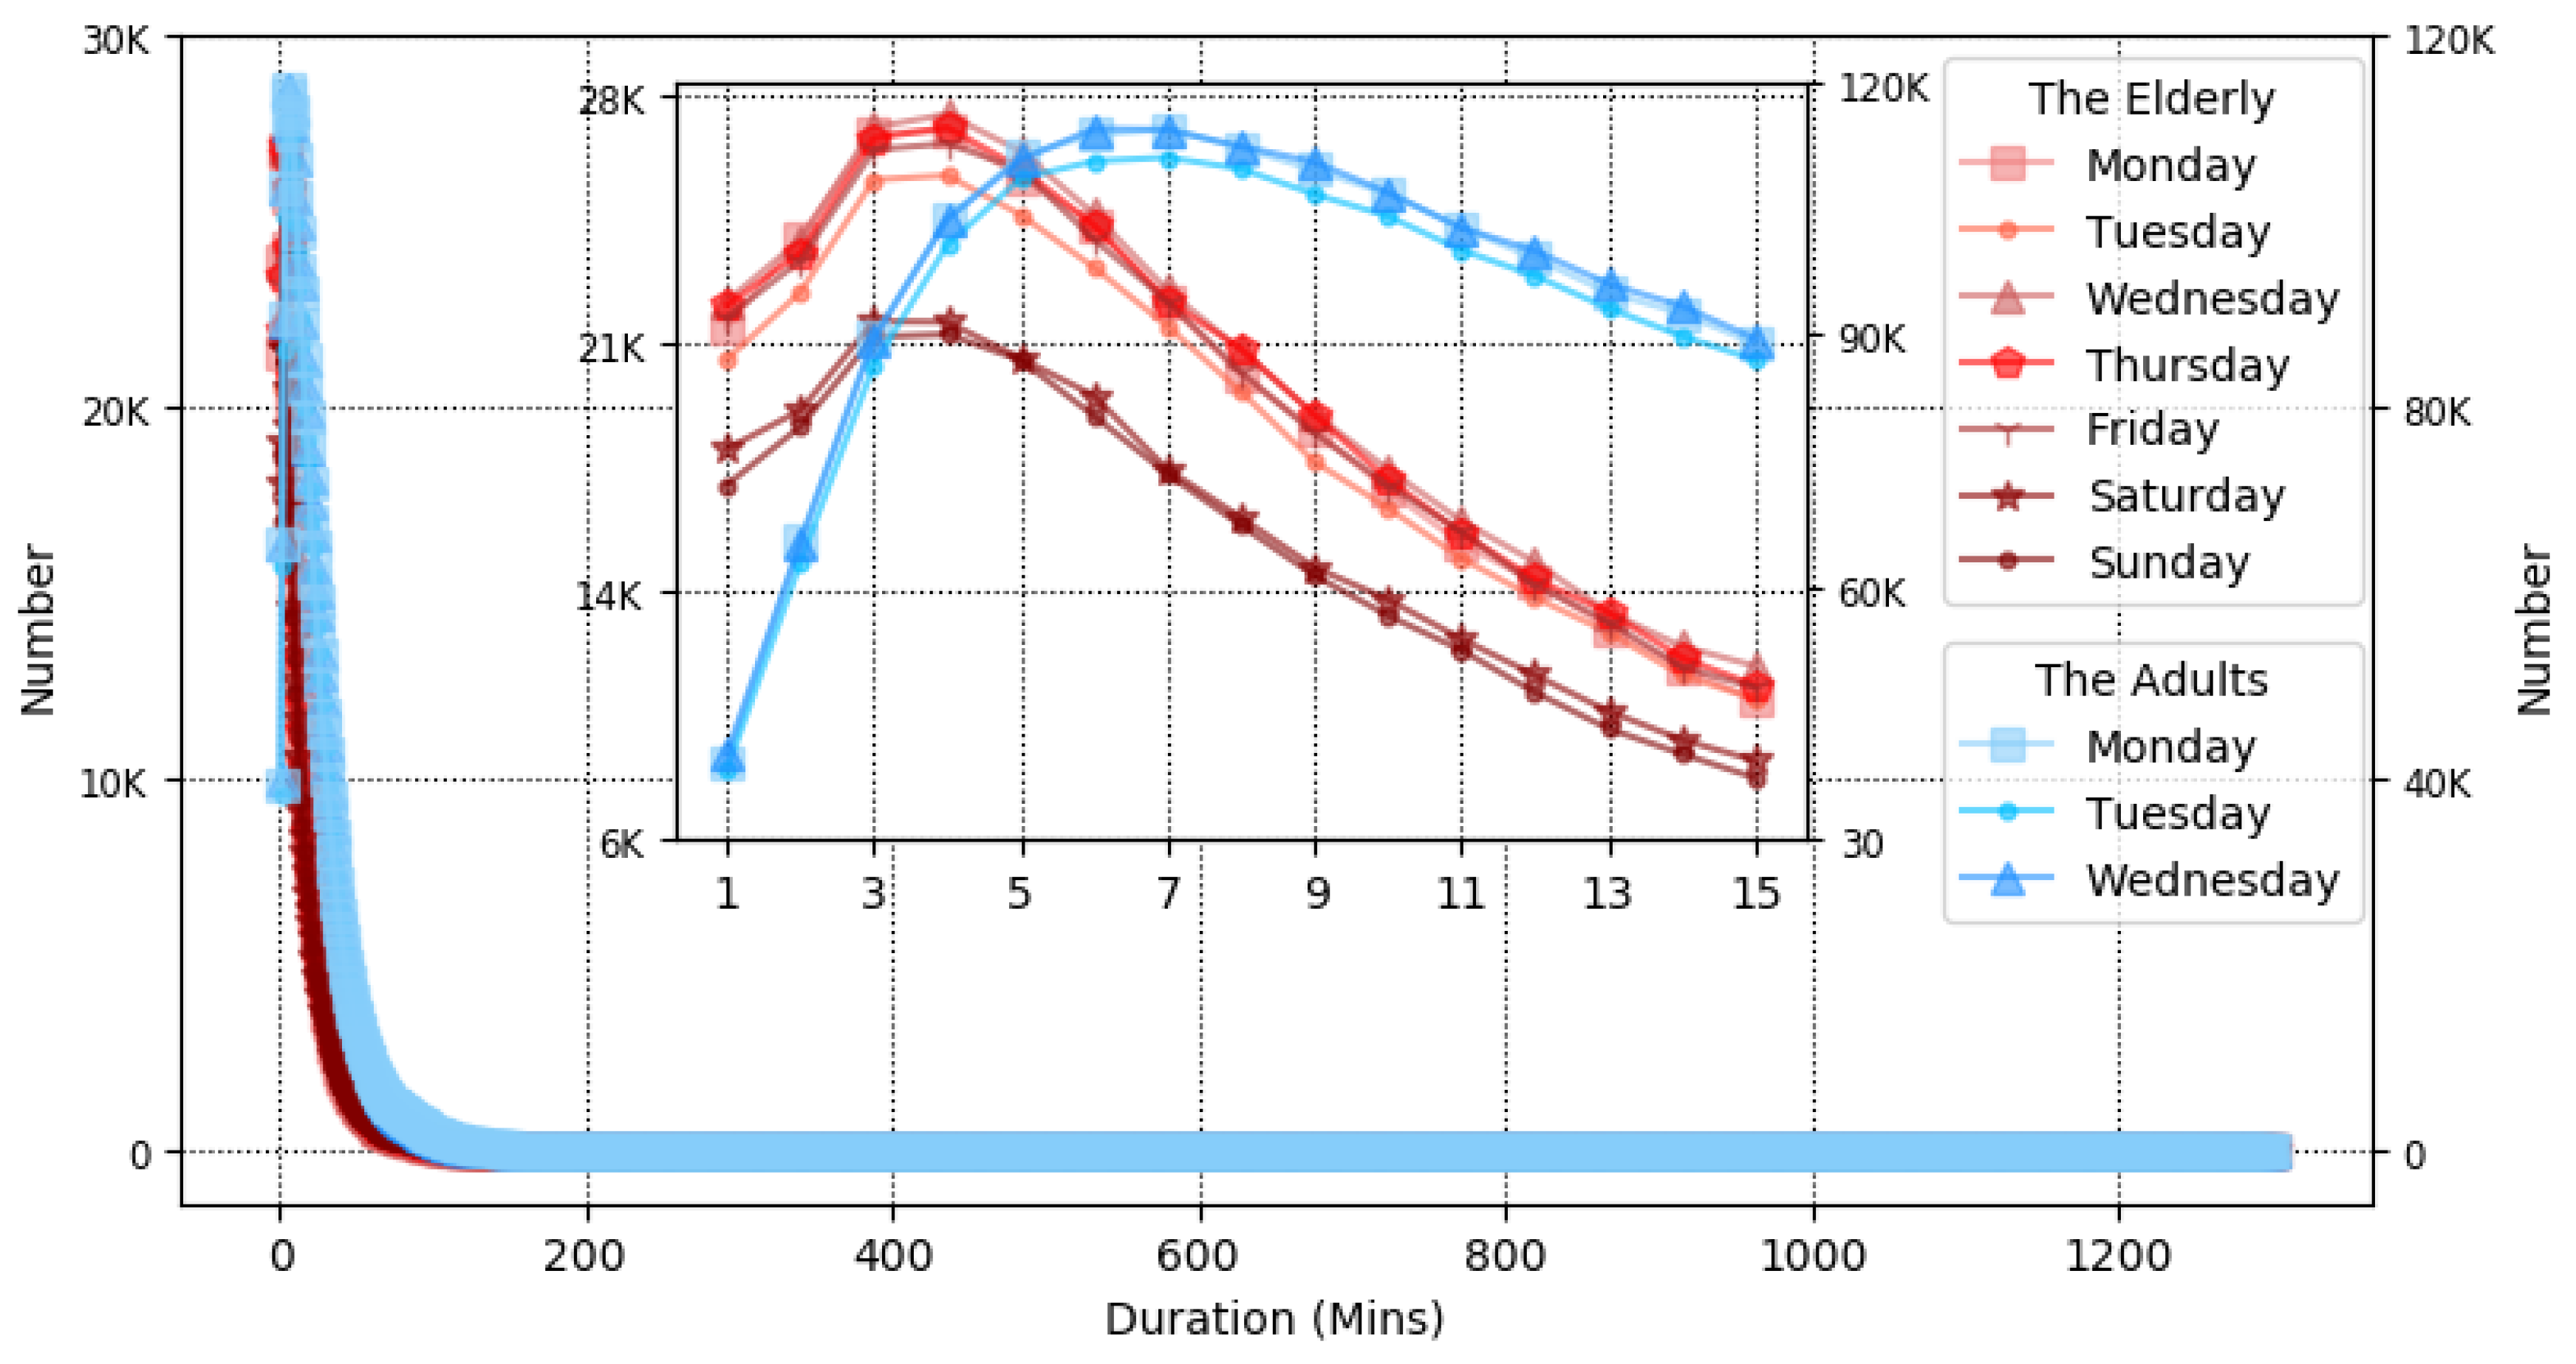
The travel duration is defined as the period of time between boarding and alighting a bus during a trip. This time is obviously based on the possible travel distances and traffic congestion conditions.
Figure 5 shows the statistical description of the travel durations of the elderly and the adults. The red lines represent that of the elderly, and the blue lines represent that of the adults.
In
Figure 5, the travel duration for most of the elderly was from 3 to 4 min and that for adults was from 6 to 7 min. This means that most elderly stayed on buses for 3 or 4 min and most adults stayed for 6 or 7 min. The travel duration of the adults was longer than that of the elderly. The result was similar to that of travel distance. The reason for the shorter travel duration of the elderly is possibly due to the fact of health conditions or a dislike of a compressed travel situations inside the buses, whereas adults are time-controlled by their work environment. From the observations and analyses above, it can be concluded that (a) the travel duration of the adults is double that of the elderly and (b) most elderly stayed on the bus for 3 to 4 min and most adults stayed for 6 to 7 min.
Similar to the travel distance distribution in
Section 4.2.1. using the head/tail break rule, the elderly can be naturally divided into three groups in terms of travel duration as shown in
Table 5: long-time duration traveler (greater than 49 min, with 8% of the total), middle-time duration travelers (greater than 20.3 min and less than 49 min, with 21% of the total), and short-time duration travelers (less than 20.3 min, with 71% of the total). Interestingly, the long-time duration elderly travelers was even “longer” than that of the adults.
4.2.3. Travel Frequency
Travel frequency is defined as the number of times a person takes a bus on a daily basis. The travel frequency of the elderly has further been compared with that of adults. A statistical description of the travel frequency characteristics of the two groups has been obtained and is illustrated in
Figure 6. The red lines show the statistical description of the travel frequency of the elderly, and the blue lines shows the travel frequency of the adults.
In
Figure 6, it can be seen that the trends in travel frequency for the elderly and the adults were very similar. Most of the elderly and the adults travel once by bus in one day. The number then decreased quickly to a small value. Two reasons can explain this situation. Firstly, according to the above analysis, the elderly traveled short distances. They could select walking, as the second choice. Secondly, adults may prefer using the subway for traveling rather than taking bus. The travel frequency, in such a case, for adults is small. The elderly can be naturally divided into three groups in terms of travel duration in
Table 6: the highest frequency traveler (greater than 2.7 times, with 32% of the total), middle frequency travelers (greater than 1.91 times and less than 2.7 times, with 22% of the total), and short frequency travelers (less than 1.91 times, with 46% of the total).
The travel frequency of the elderly is as follows: (a) most the elderly travelled once per day by taking the bus; (b) most of the adults also travelled once per day by taking the bus. As in the previous section, the elderly and adults can be divided into different groups. It was found, however, that the elderly travelled more frequently, at the two levels, than the adults. In this instance, only bus travel was considered while subway travel was not taken into account, as bus usage was the main purpose of this study. Noticeably, the total amount of adult travel was much larger than that of the elderly.
4.3. Spatial Distribution Patterns
Spatial distribution characteristics are another important factor as regards the analysis of mobility behavior. In this section, the focus is on the study area within the 6th ring road in Beijing, as the majority of bus stops are located within this region. Two comparisons are made in the following section. Firstly, the spatial distribution of the elderly between weekdays and the weekend are made. Secondly, a comparison of spatial distribution of the elderly and the adults are made and the regions identified where the elderly groups and the adult groups could conflict in terms of bus usage.
4.3.1. Spatial Distribution of the Elderly
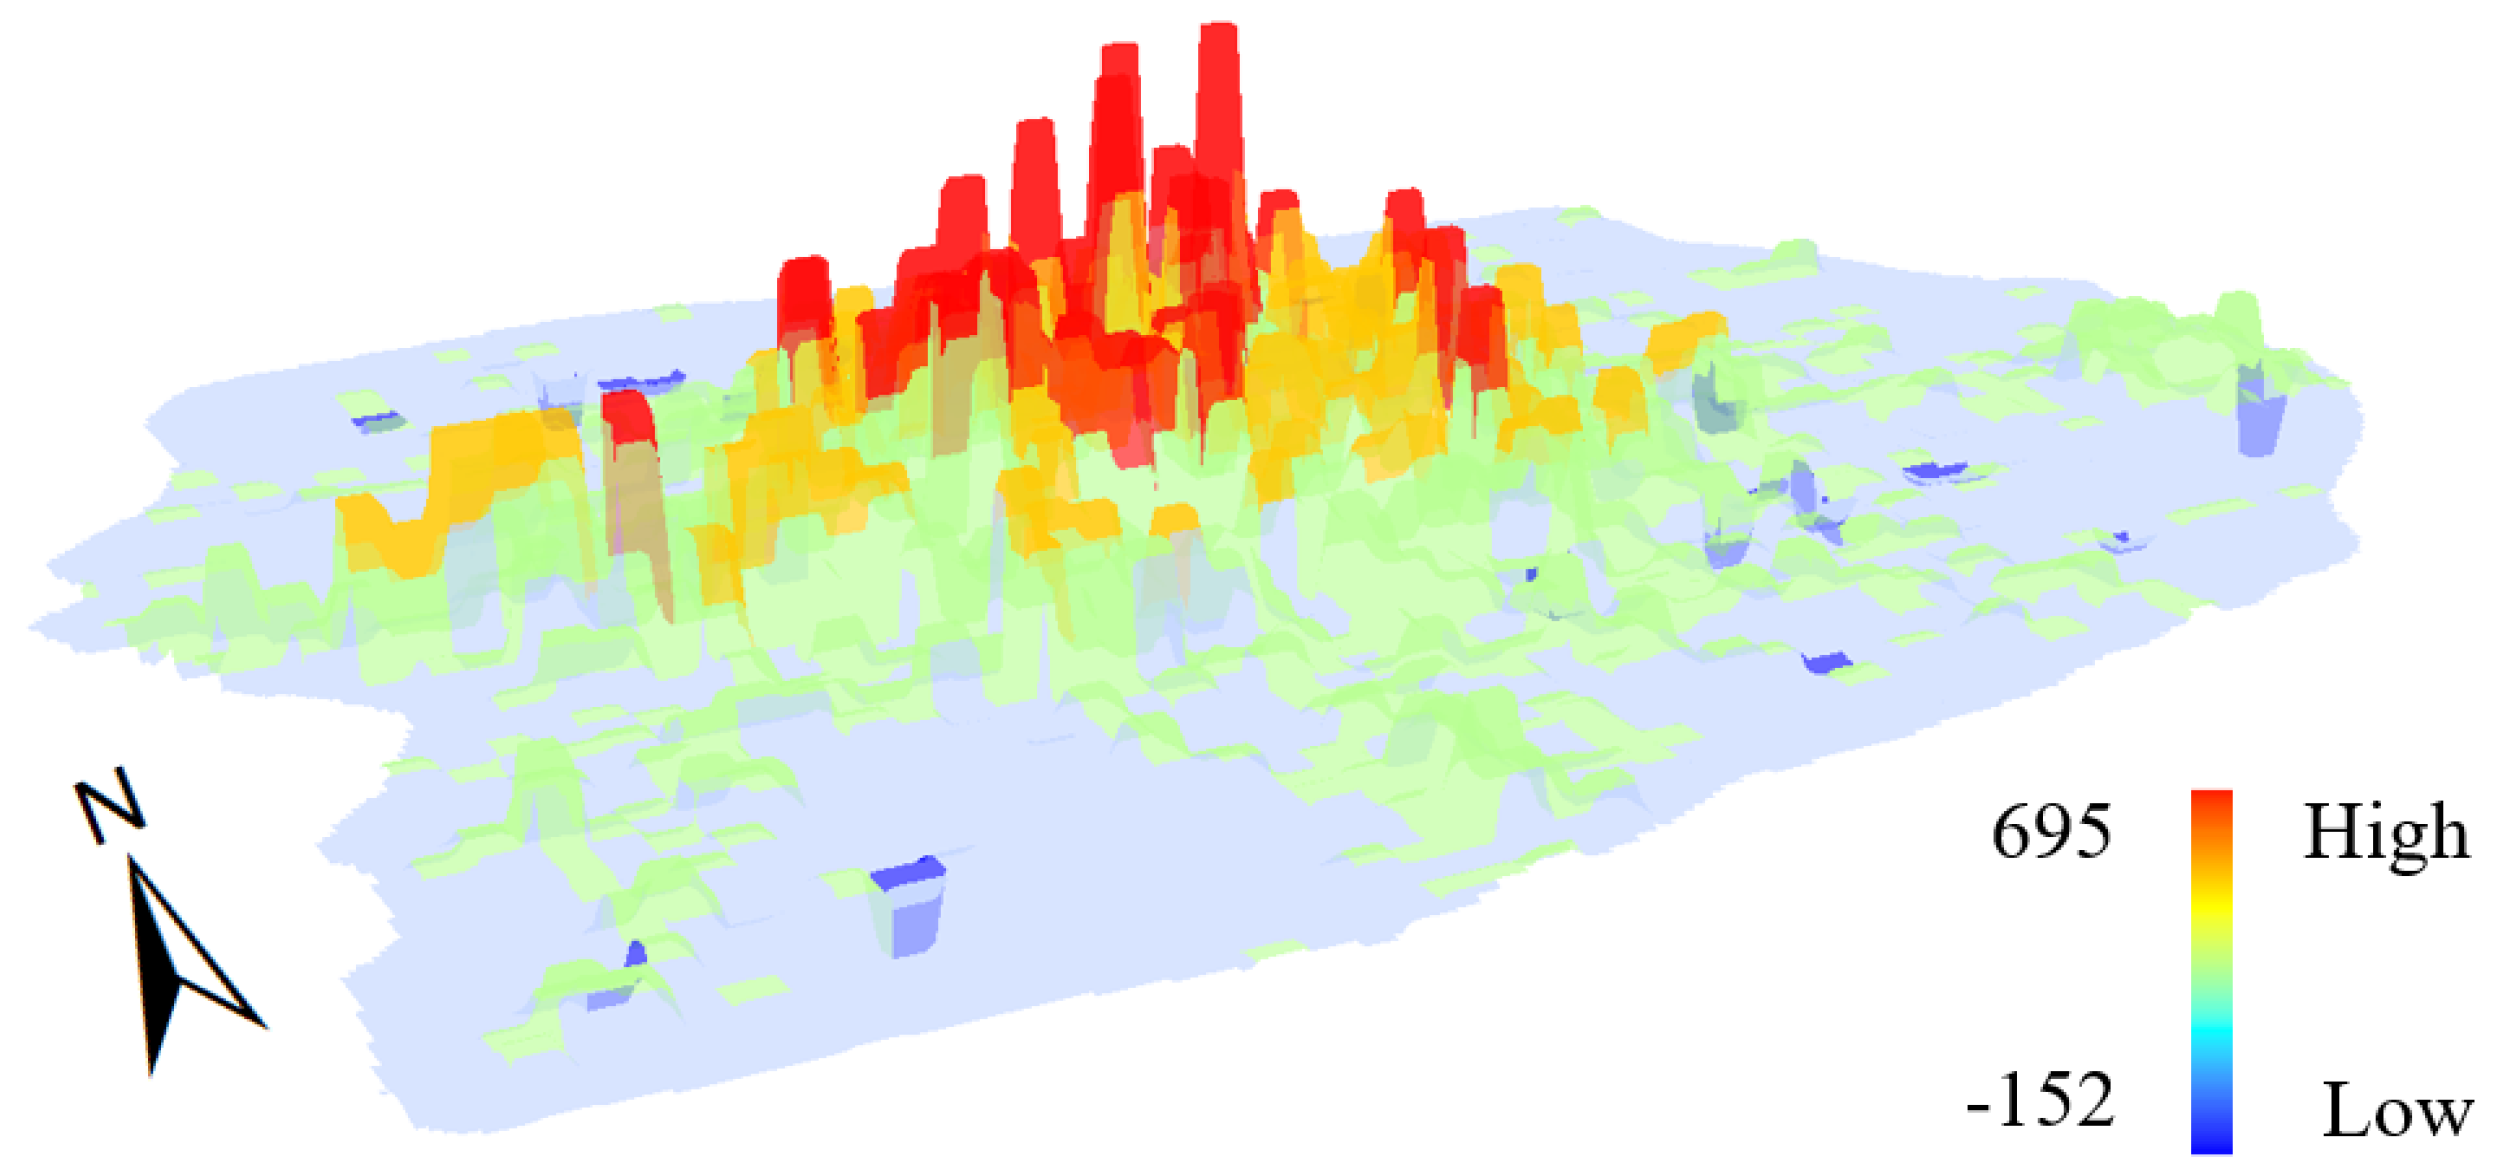
Figure 7 shows the spatial distribution of the travel density of the elderly on weekdays (
Figure 7a) and weekends (
Figure 7b). The resolution of spatial grids used to generate the density was 1 km. The color from green to red illustrates the depth of the number from low to high.
It is clear that the areas with a large number were concentrated in the central regions of the city. Beyond the center regions, the areas with large numbers were mainly in the north and west. According to the distribution analysis results, the number of travelers on the weekend was less than those on weekdays. Overall, the travel volume of the elderly during weekends was lower than that on weekdays. However, the spatial distribution patterns on both occasions were similar. To compare the difference of the elderly’s distribution during weekdays and the weekend, the number of travelers within each grid on weekdays was used to minus the number of travelers within the same grid on the weekend. The red indicates positive values, and the blue the negative values (
Figure 8).
As shown in
Figure 8, there was little difference between elderly travelling during the weekdays and the weekend based on the spatial distribution. The travel volume during weekdays was higher than that at the weekend in most of the areas, but lower in only a few areas than the weekend, which are in deep blue and in the direction downwards to the grids. The above provides a clear picture how the travel demand of the elderly changes spatially.
4.3.2. Comparison of Spatial Distributions
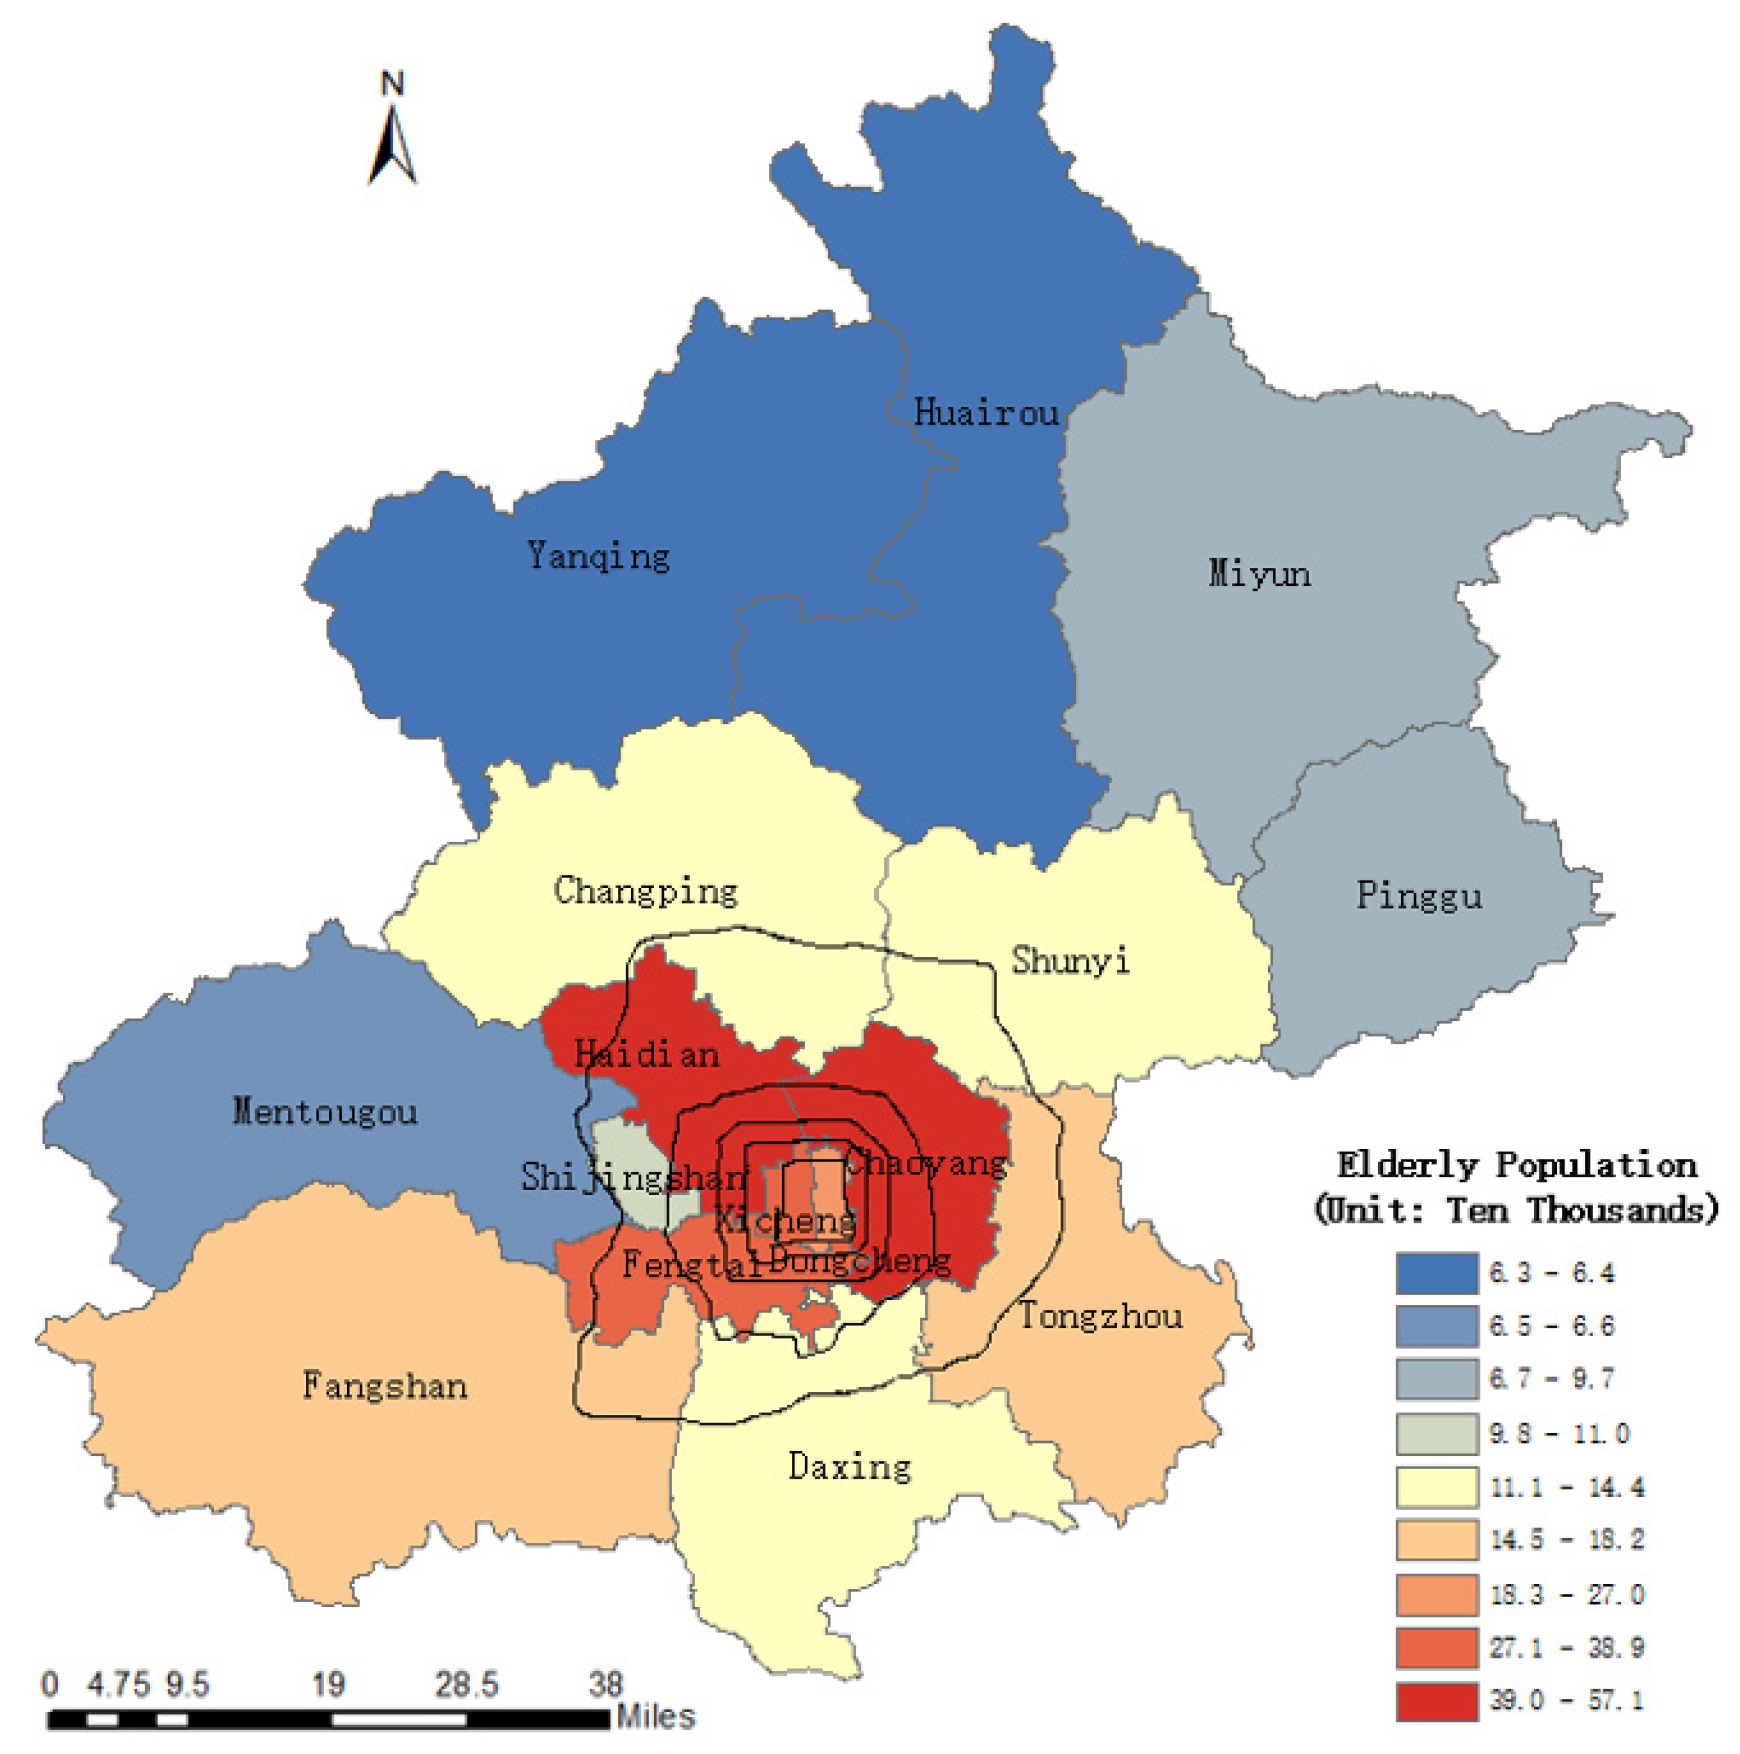
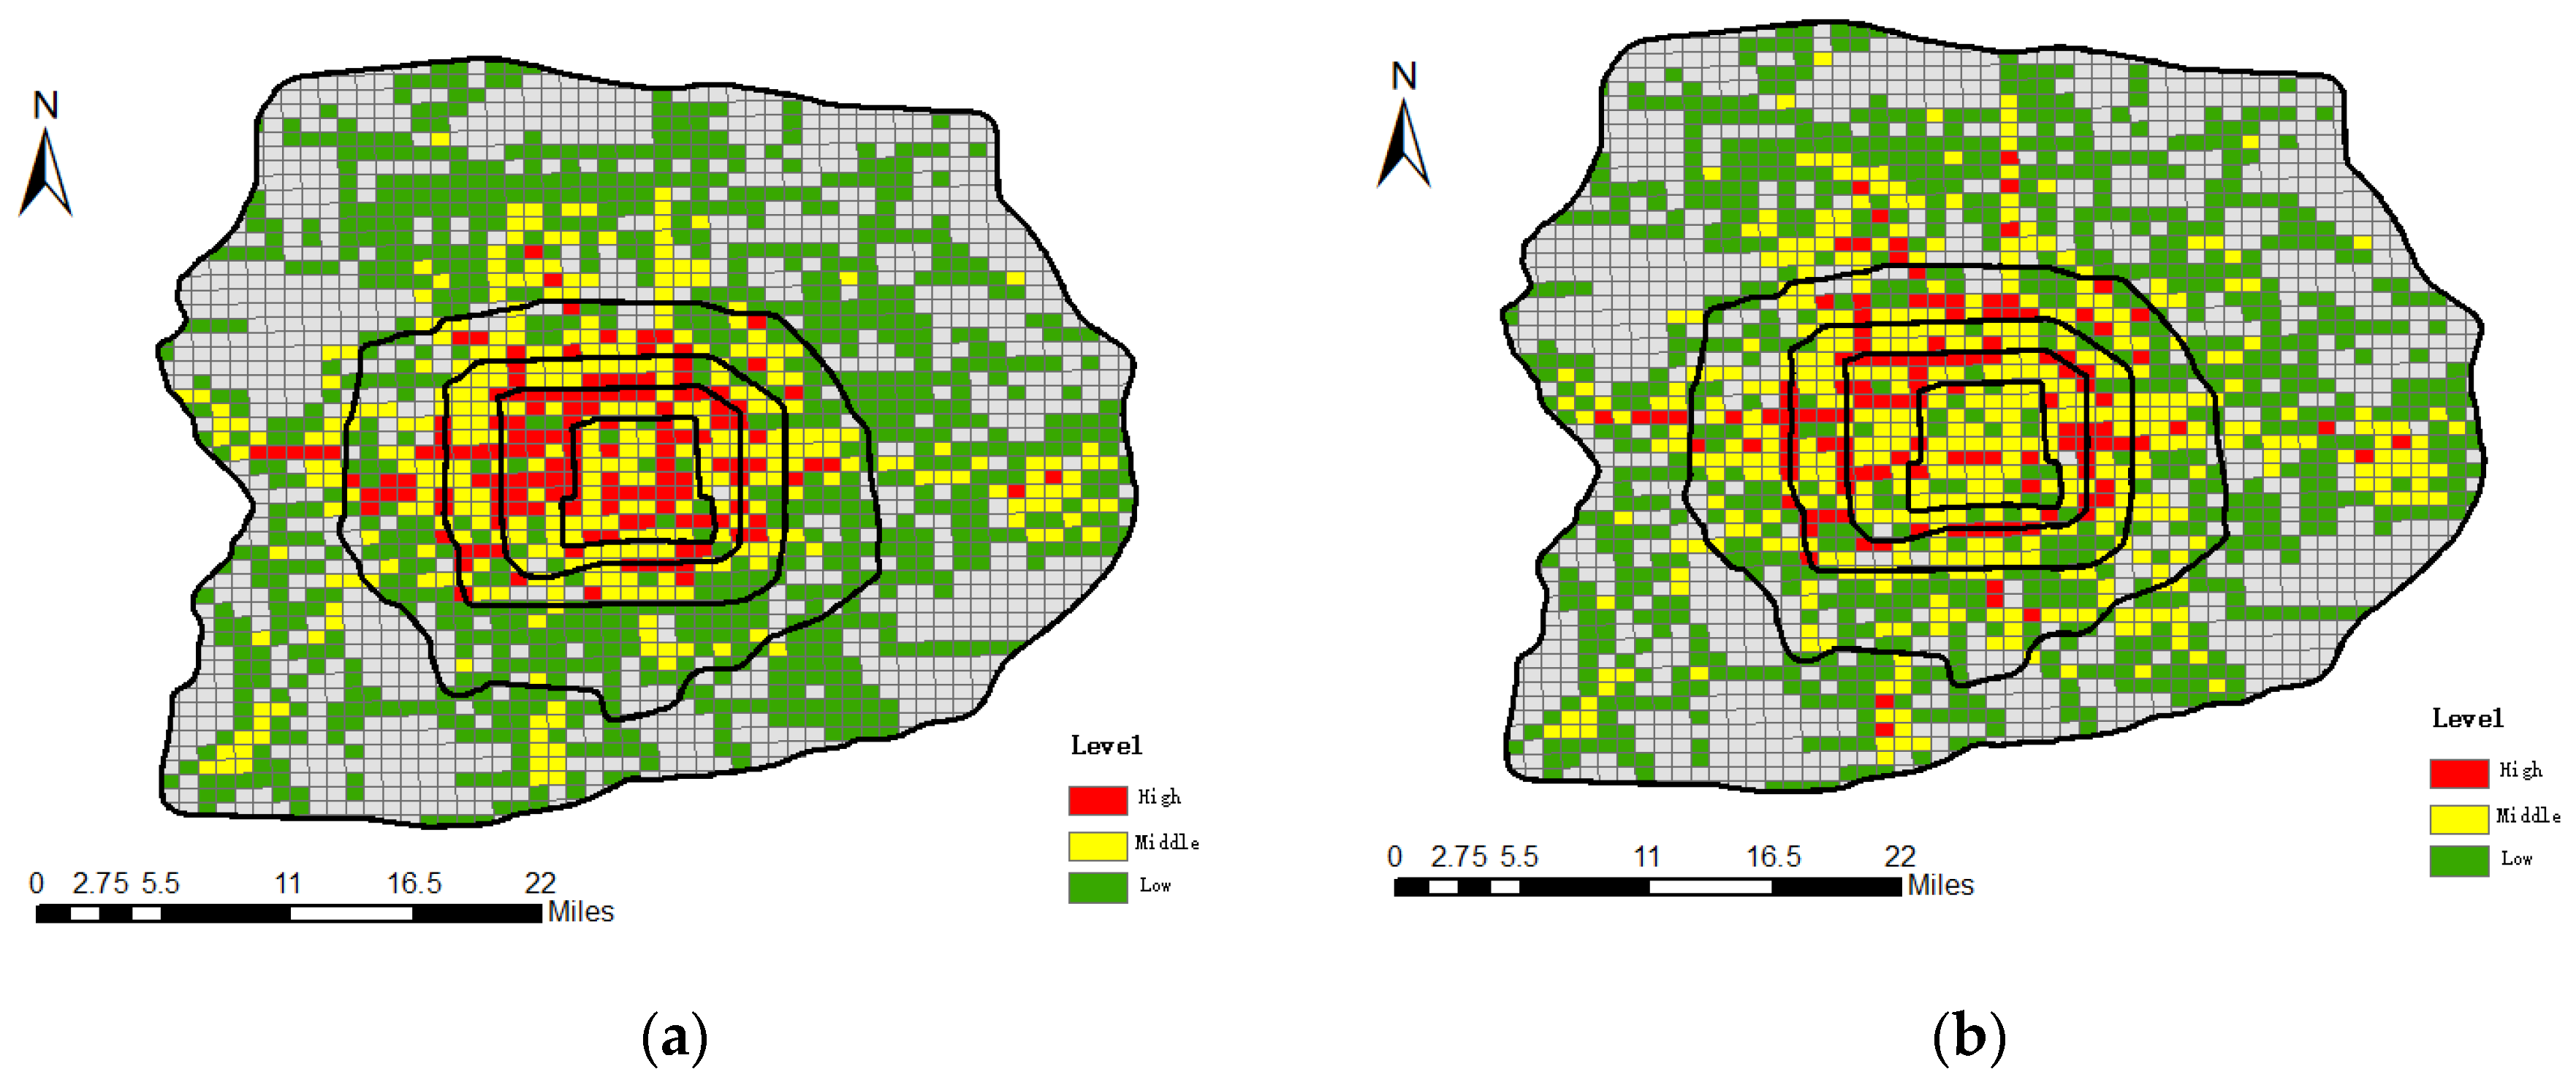
In this section, the spatial distribution difference between the elderly and the adults are compared. First, we compared the spatial distribution of an entire day. Due to the limitation of the smart card data, the number of elderly and the adult travelers were calculated from 10 April 2017 to 12 April 2017. As the number of travelers are on different quantitative scales, that number was divided into three levels: high, middle, and low. The nature break classification method was used to divide the number into the three levels. Three colors were used to describe the travel number.
Figure 9 shows the spatial distributions of the travel number of both the elderly (
Figure 9a) and the adults (
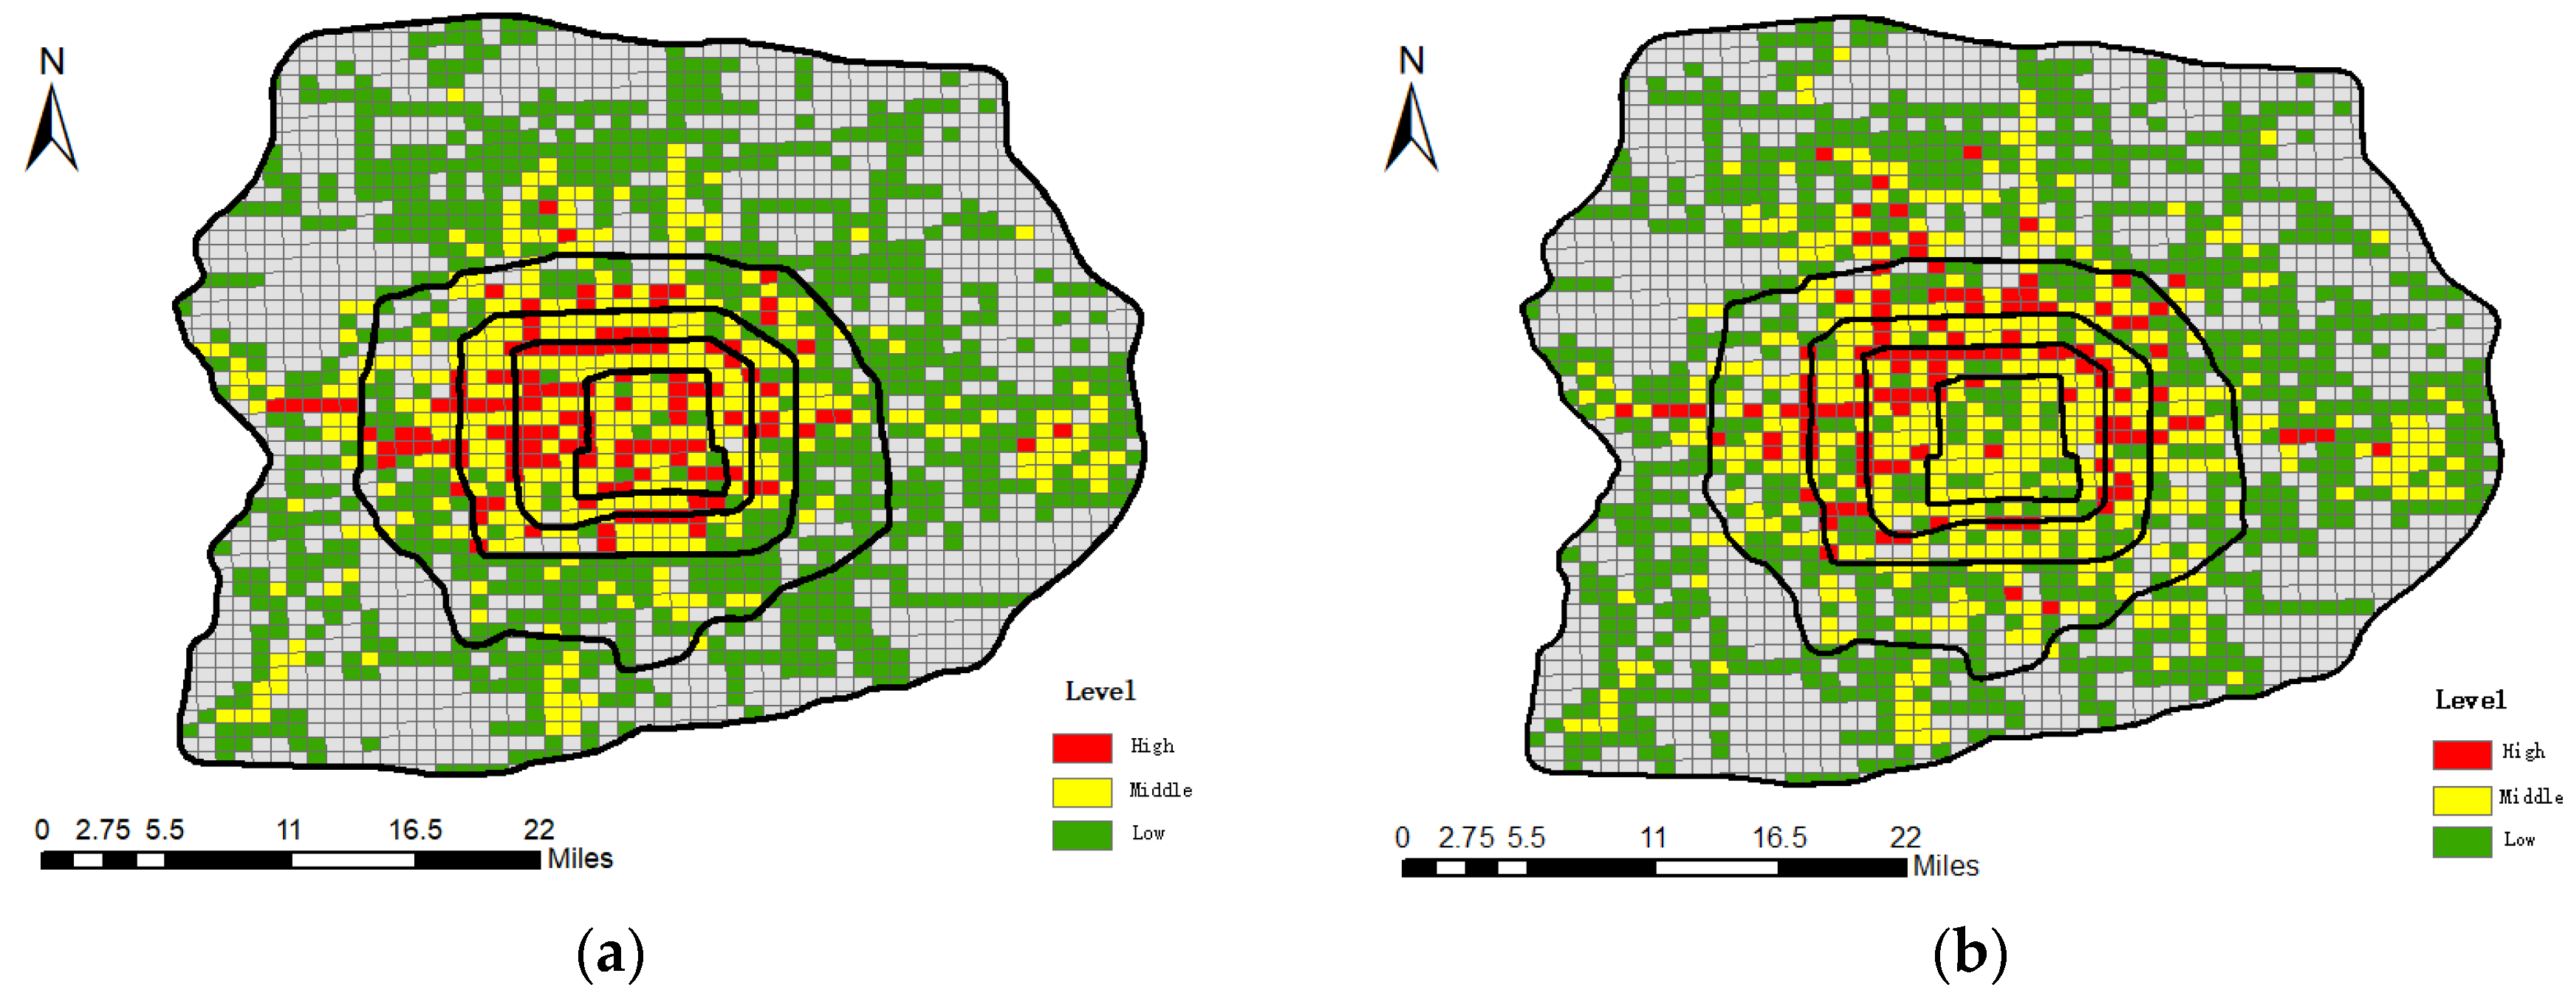
Figure 9b). Second, we compared the spatial distribution of the peak hour from 8:00 AM to 9:00 AM.
Figure 10 shows the spatial distribution of the travel volume of: (a) the elderly and (b) the adults during peak hour.
For the elderly, most of the high value grids were concentrated within the 4th ring road, in particular, beyond the 3th ring road and within the 4th ring road in the west direction. Beyond the 4th ring road, the number of high value grids was very small. Several grids represented clustering distribution characteristics. Compared with the adult distribution, the grids with high value showed a random distribution. Although most of the high value grids, located within the 4th ring road, there was no clear regional clustering characteristics. Most high value grids showed a line-clustering pattern along with the ring road. From the figure, many high value grids were distributed along with the 3rd ring road, while some were located west of the 4th ring road. Overall, the distribution of the elderly and the adults of the high value and middle value grids were located at the center regions and seldom in the remote regions. Compared to
Figure 9,
Figure 10 is very similar. Especially, the spatial distribution of the high level, where there is no clear change between them.
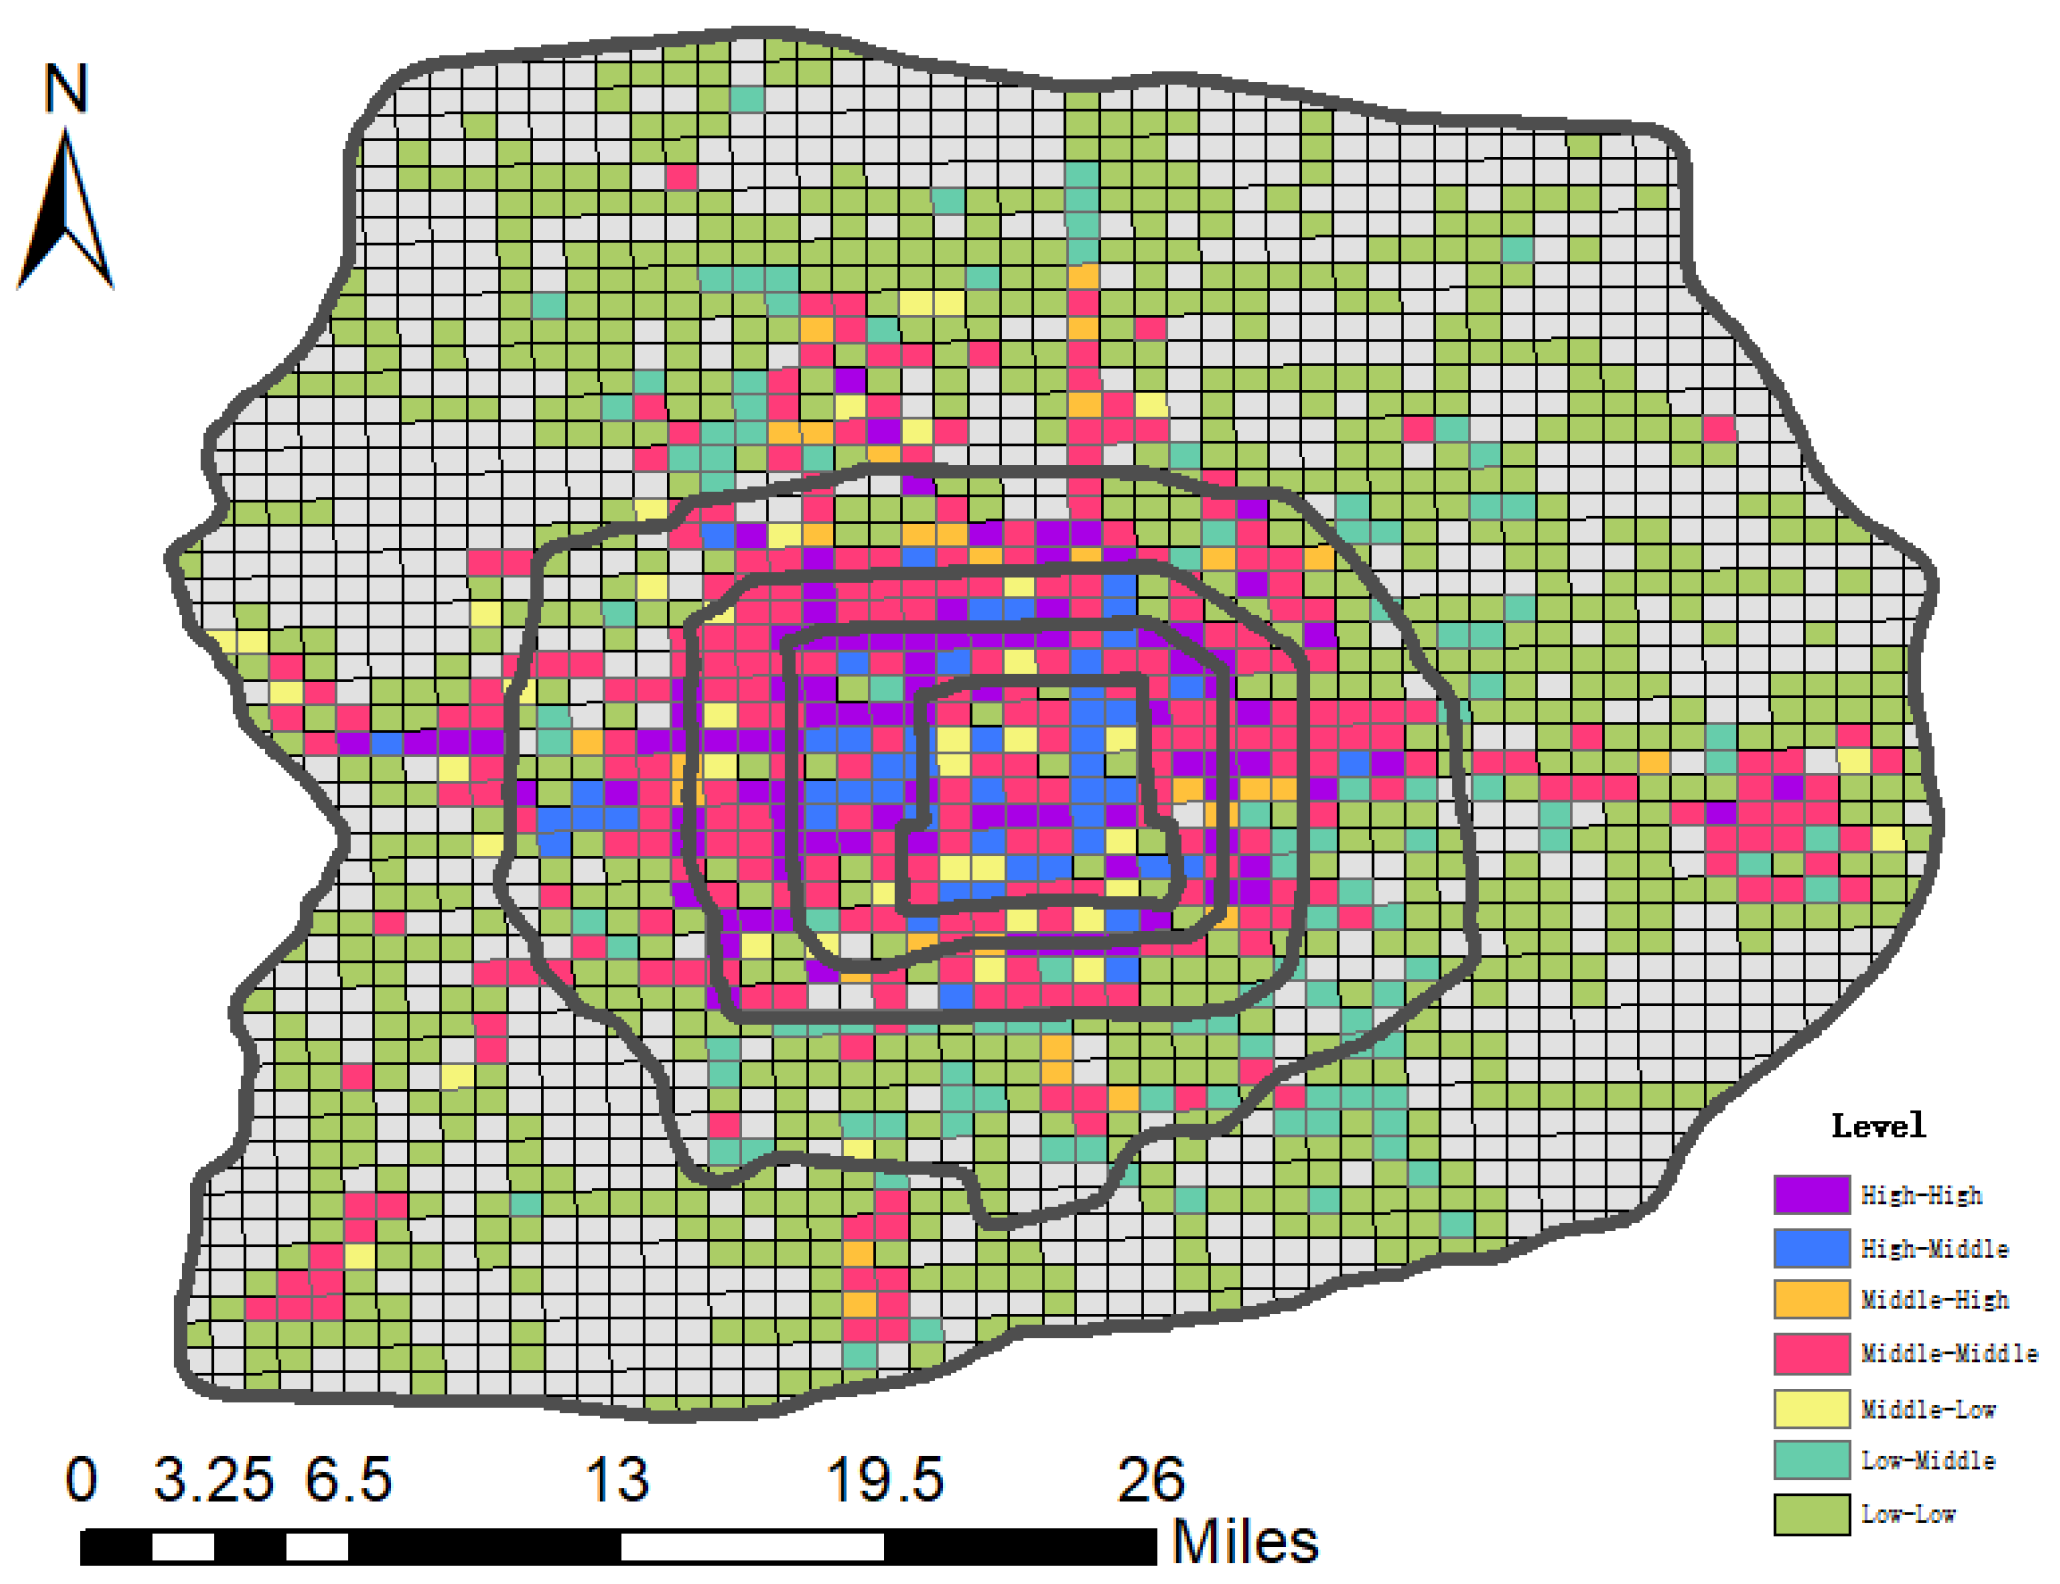
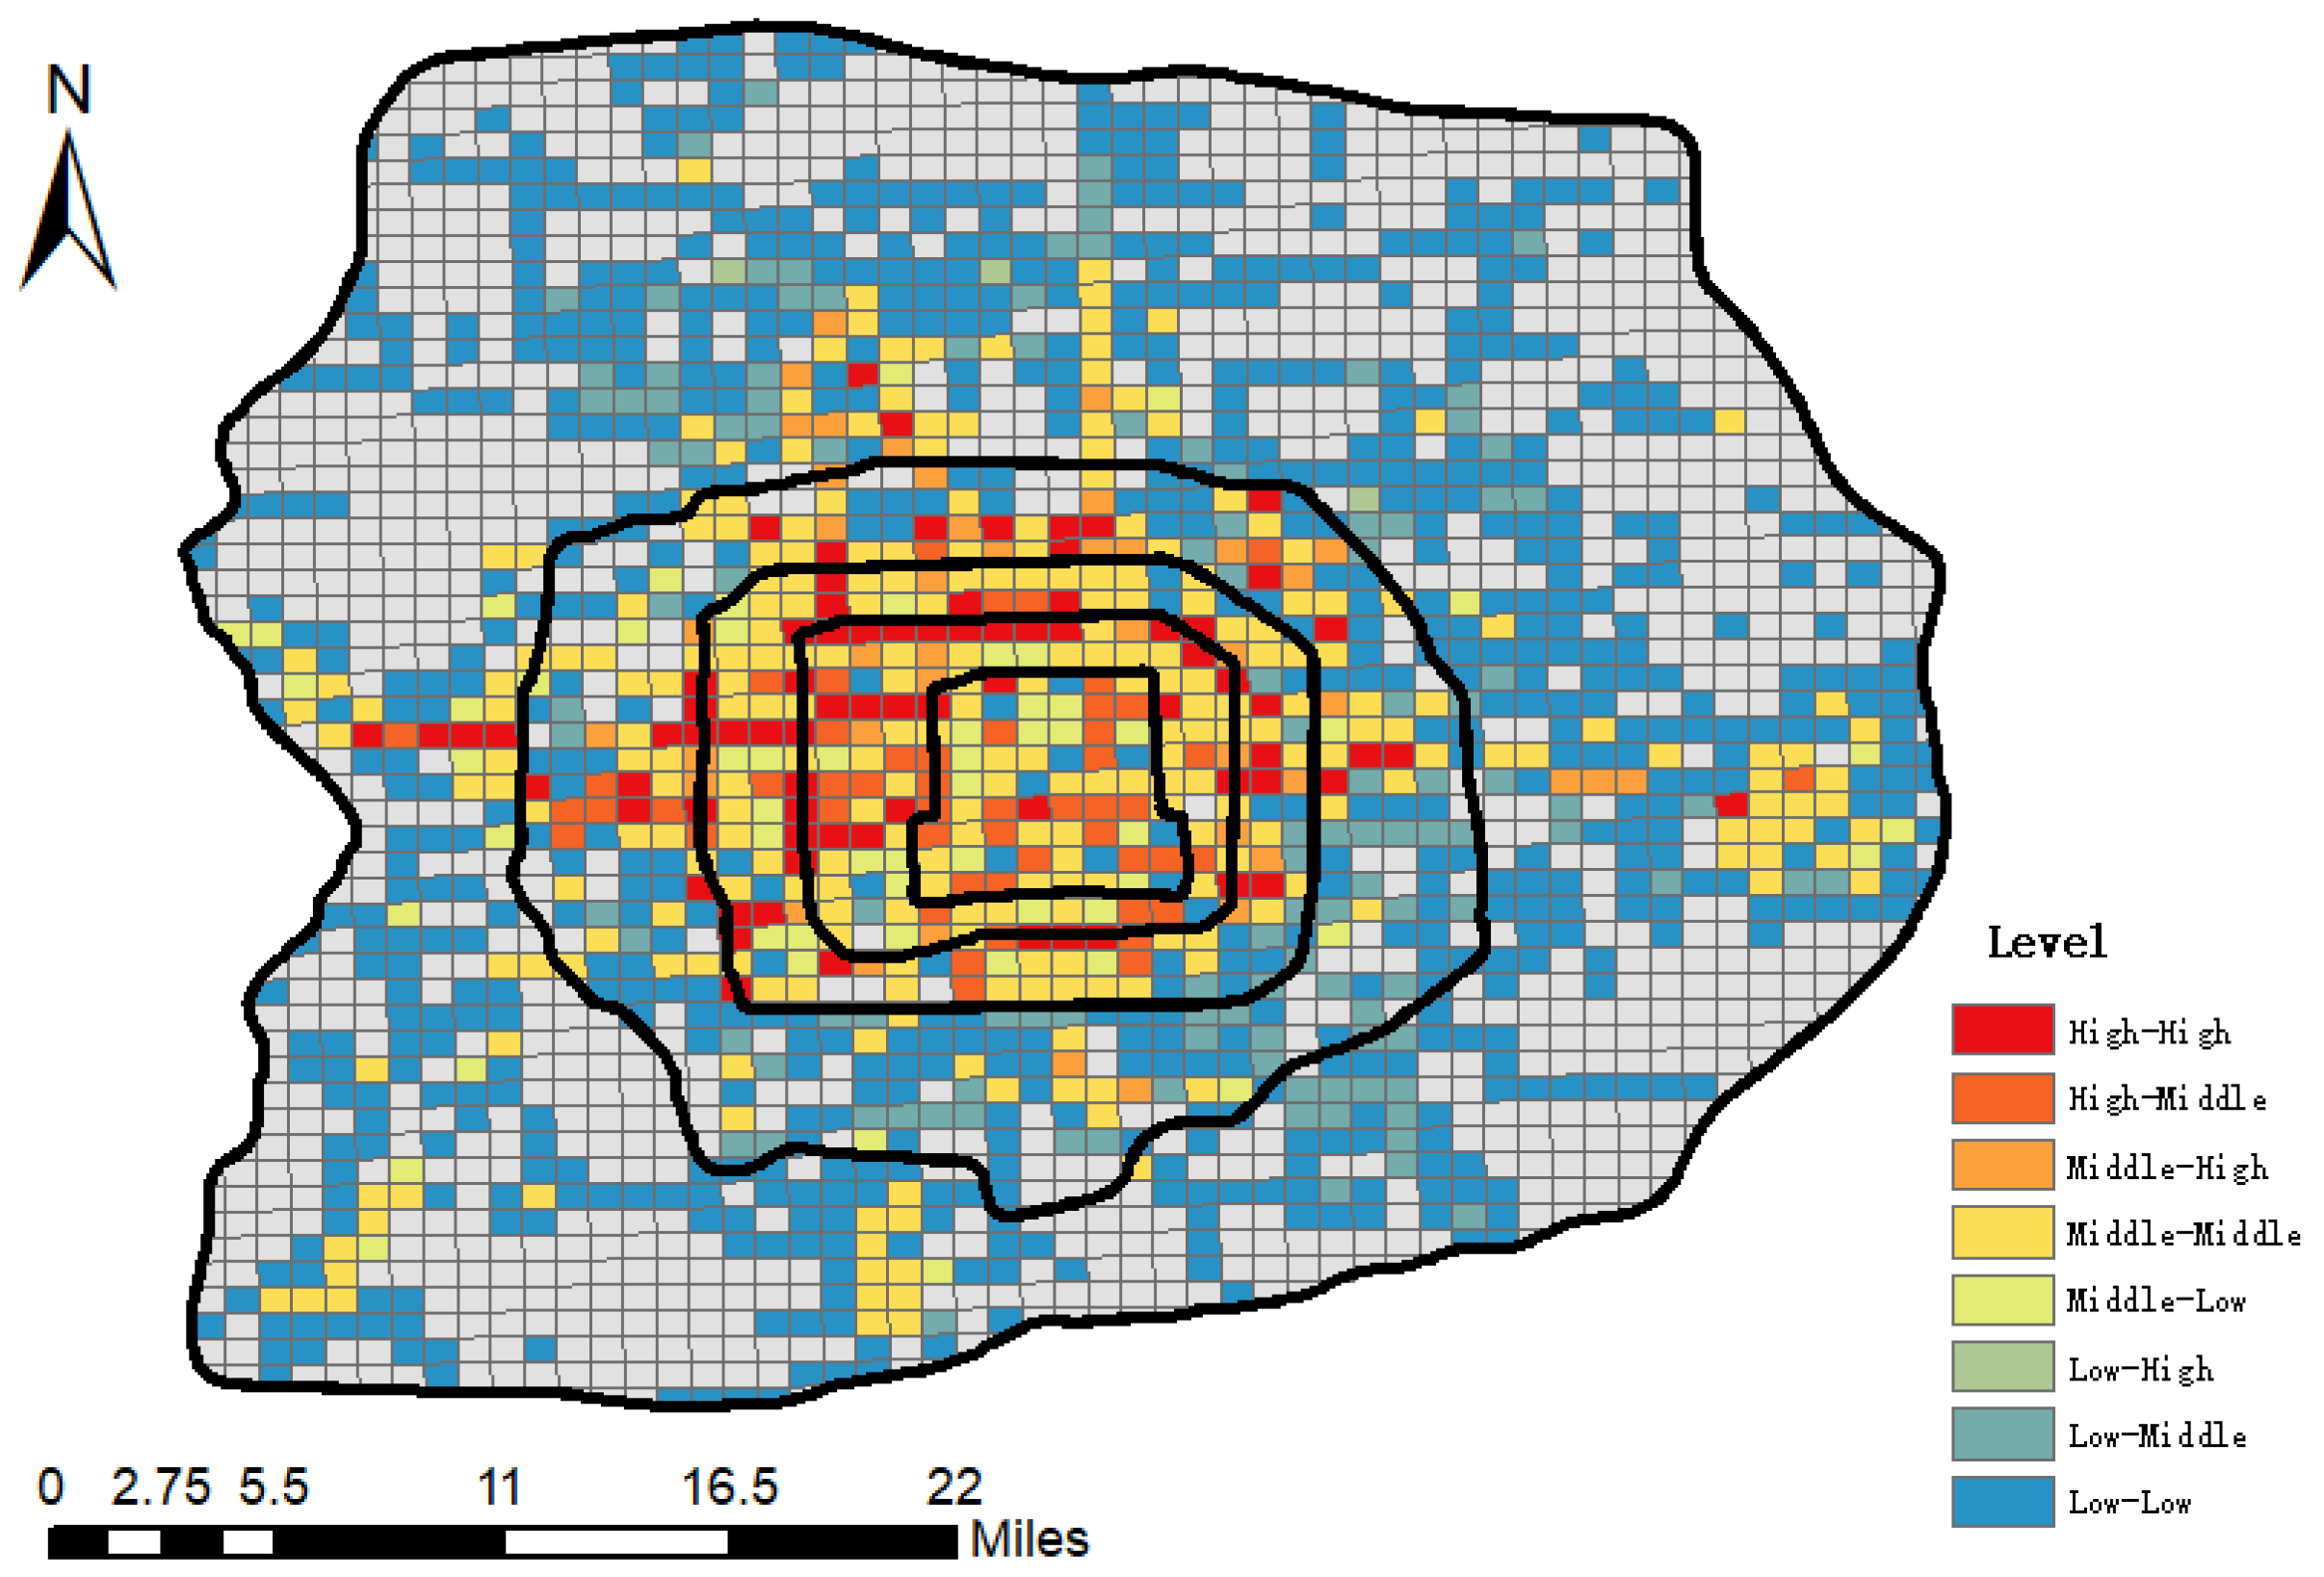
To explore which regions housing the elderly and the adults affected each other when taking bus, the three levels (High, Middle, Low) of the elderly and adults’ travels overlapped. In principle, there are supposed to be nine types: High–High, High–Middle, High–Low, Middle–High, Middle–Middle, Middle–Low, Low–High, Low–Middle, and Low–Low. However, for an entire day, only seven of these types were found and visualized as shown in
Figure 11. For the peak hour, eight types were found and visualized as shown in
Figure 12.
In
Figure 11, the seven types are High(E)–High(A), High(E)–Middle(A), Middle(A)–High(E), Middle(E)–Middle(A), Middle(E)–Low(A), Low(E)–Middle(A), and Low(E)–Low(A); E and A indicate elderly and the adults. The first type High(E)–High(A) will affect each other more significantly than do the other types, etc.
Figure 12 adopted the same method. From a general view, the elderly group and the adults group affected each other, especially at the center regions within the fourth ring road. The peak hour presents similar situation. This result can help the transport department to optimize bus lines to reduce the effect on each of the two groups (i.e., the elderly and the adults) when using buses, particularly in the red regions.
6. Conclusions
This research study presented in this paper developed a systematic approach for analyzing temporal and spatial characteristics of the elderly traveling by bus using smart card big data. These characteristics included temporal distribution, travel distance, travel duration, travel frequency, and spatial distribution. Findings regarding these mobility characteristics can directly contribute to transport policy making, management, and services.
Beijing, a representative of the megacity of which the aging population forms a sizable proportion and in which the bus is the main public transport mode for the elderly, was used as the study area presented in this paper. The temporal patterns of the elderly and adults were investigated and compared based on the identification of the temporal similarities and differences and also a corresponding transport policy (such as public transport fare) and transport management (such as bus scheduling). It was inferred that the public transport service should be improved, such as by finding the means to reduce traffic congestion, the latter being aided by avoiding conflict of the elderly joining working adult groups in peak hour travel. The spatial interaction of travel by the elderly and the adults was categorized into different levels such as High–High and High–Middle to represent or indicate the spatial conflict of travel demand. This system can be combined with the temporal patterns for future transport planning. Spatial variations of the elderly travelling during weekdays and the weekend were analyzed. An analysis of travel demand provided guidance for aging-related transport planning. More interestingly, the scaling and small-world property of travel behavior were identified from the perspective of complex systems. Based on the head/tail break rule, the elderly were naturally classified as long-, middle-, and short-distance travel groups. The percentage and numbers in each group were assessed to enable the facilitation of more detailed transport policy making and planning.
The systematic and comprehensive approach for analyzing the travel behavior characteristics of the elderly using smart card data further developed in this study is not only applicable to Beijing but also for other cities worldwide, particularly in terms of transport decision making and management. A well-planned urban transport system that can cope with the aging population trend in terms of their mobility characteristics is essential for a future smart city.

 ,
, 


