Towards Self-Service GIS—Combining the Best of the Semantic Web and Web GIS


1
Department of Geosciences, Kadaster & Utrecht University, 3584 CS Utrecht, The Netherlands
2
Department of Behavioural, Management and Social Sciences (BMS), Kadaster & University of Twente, 7500 AE Enschede, The Netherlands
3
Kadaster & TriplyDB, 1043 BP Amsterdam, The Netherlands
*
Author to whom correspondence should be addressed.
ISPRS Int. J. Geo-Inf. 2020, 9(12), 753; https://0-doi-org.brum.beds.ac.uk/10.3390/ijgi9120753
Submission received: 30 October 2020
/
Revised: 4 December 2020
/
Accepted: 11 December 2020
/
Published: 15 December 2020
(This article belongs to the Special Issue Spatial Data Infrastructure for Distributed Management and Processing)
Abstract
:The field of geographic information science has grown exponentially over the last few decades and, particularly within the context of the pervasiveness of the internet, bears witness to a rapid transition of its associated technologies from stand-alone systems to increasingly networked and distributed systems as geospatial information becomes increasingly available online. With its long-standing history for innovation, the field has adopted many disruptive technologies from the fields of computer and information sciences through this transition towards web geographic information systems (GIS); most interestingly in the context of this research is the limited uptake of semantic web technologies by the field and its associated technologies, the lack of which has resulted in a technological disjoint between these fields. As the field seeks to make geospatial information more accessible to more users and in more contexts through ‘self-service’ applications, the use of these technologies is imperative to support the interoperability between distributed data sources. This paper aims to provide insight into what linked data tooling already exists, and based on the features of these, what may be possible for the achievement of self-service GIS. Findings include what visualisation, interactivity, analytics and usability features could be included in the realisation of self-service GIS, pointing to the opportunities that exist in bringing GIS technologies closer to the user.
1. Introduction
Since its inception, the field of geographic information science and its associated technologies have undergone rapid technological advancement and geographic information systems (GIS) now have functional capabilities which include geostatistical analysis, network analysis and geographic modelling. The field is characterised by specific expertise, one with a longstanding history of forward thinking and a track record for ongoing innovation. Over the past few decades, in line with the increasingly expansive presence of the internet in daily activity, both personal and commercial, the availability of spatial information online has grown exponentially and has led to the rapid transition of GIS technologies from stand-alone GIS systems for the GIS expert to networked systems supported by distributed client-server applications [1,2]. These distributed applications, also known as web mapping applications or web GIS in the Cloud, are defined by Esri, the leading commercial provider of GIS technologies, as any GIS interface which makes use of web technology to communicate between a client and server and is available as a web browser, desktop application or mobile application [3]. These distributed web mapping applications allow users to access, interact and 022visualise spatial information dynamically from a range of often heterogeneous data sources and communicate effectively with other users based on this information.
As the field of geographic information science and its associated technologies has grown, so too has it grown apart, in some respect, from the fields of traditional computer science (CS) and information systems (IS). This has resulted in some limitations in the uptake of innovations seen in CS and IS by the GIS field, the most interesting of which for this paper is the innovation seen with regards to the semantic web and the potential this has for the field of GIS. As has already been extensively explored, the use of semantic web technologies for the formalisation of geospatial information is integral to improved interoperability of data; both with regards to other geospatial information sources but also for the interoperability between spatial and non-spatial data on the web [1]. For web GIS applications, in particular, the increased use of semantic technologies can change how applications access geospatial information on the web, allowing for improved interoperability of between (distributed) applications and data, efficient data processing, cross-platform integration and improved accessibility of the data used in these applications.
In recognising the opportunity in using semantic web technologies to innovate within the field of GIS, geospatial semantic web research, supported by the open standards developed by the W3 community, has focused on making the exploration, editing and linking of external data with a spatial dimension and geospatial information easier by formalising these with said technologies (see [4]). This is done with the goal of enriching the linked data web with geographic information where suitable, allowing for better accessibility and integration of data from a wider range of (heterogeneous) resources. In view of this, there has been some movement towards the large-scale adoption of semantic web technologies to improve the prevalence of linked spatial data, exemplified by its development and implementation across organisations globally (see GeoKnow, LinkedGeoData or Ordnance Survey). Despite this, the challenge to effectively make use of the web as a platform for effective geospatial data integration, querying and visualisation in a self-service manner, particularly for use in a non-developer context, remains.
It is within this context that this research paper tasks itself to provide a novel insight into how a self-service web-based GIS can be achieved in practice and what functionality this may include with the non-expert user in mind. To do so, the current state of the art of semantic technologies, web GIS and self-service GIS will be presented; the reason for the current disjoint between these is analysed, and the points at which the integration between these could be useful in the context of the identified research is discussed. Following this, a review of relevant practical examples of tools, making use of semantic web technologies, will be done based on three functionality groupings, namely, (geo)data exploration, (geo)data visualisation and visual analytics.
2. Technological Disjoint: The Role of Standardisation and Interoperability
As technological advancements have led to the ubiquity of the internet, so too has there been a rapid increase in the prevalence and use of web technologies, including cloud computing, internet-enabled devices and applications as well as data generation on an unprecedented scale. Some of the main advantages of the widespread use of web technologies are the potential for increased interconnectivity of organisations, people, smart things as well as access to the vast amounts of data which is becoming available through the internet [5]. For this level of interconnectivity to be fully realised, however, there is a need for standardisation to be commonplace, with the goal of improving interoperability between applications and datasets available on the web.
Best practice for improving this interoperability for applications and services on the web is the use of W3C (World Wide Web Consortium) open web standards [6]. The standards maintained by the Consortium follow principles of openness, accessibility and trust in supporting the development and integration of applications, services and data on the web. While intra-organisational standardisation of web services allows for improved information integration within the organisation, it does not necessarily support the interoperability between an organisation or conform to the idea of open standards, which is an issue of increasing importance as organisations become part of information ‘chains’ within a networked economy [7]. The W3C provides standards for both the document web, where the integration and interoperability of information across web pages are required, and for the ‘web of data’, where information is being shared between web services otherwise known as the Semantic Web [6]. The Semantic Web, which is made up of Linked Data, is made possible through the use of semantic technologies, including RDF, SPARQL, OWL and SKOS, and the standards which govern the organisation of data using vocabularies and those which govern the storage, management and querying of data on the web. While there generally does exist a lag in the uptake of LD in organisations across various industries, the value of Linked Data implementation in business is acknowledged in its potential to decrease the cost and increase the flexibility of data integration and gives rise to new service [8].
Advancements in web technologies have had significant effects on the GIS industry, including the increasingly rapid transition to web-based GIS in the Cloud to improve accessibility as well as the availability of vast amounts of geographic information which is being increasingly shared openly within the geospatial community. In line with a general trend towards increased standardisation of technologies, the Open Geospatial Consortium (OGC), in response to some of the historically non-interoperable systems within the industry itself, provides the GIS community with standards which support interoperability between GIS applications, services and geospatial data. Indeed, the open standards outlined by the Consortium are an integral part of reducing the risks of non-interoperability by ensuring that standards are ‘created in an inclusive, international and participatory industry’ where everything that is owned is common and has free rights of distribution. By ensuring that the standard-setting process is inclusive, the hope is that more organisations, companies and governments will adopt these within the industry [9]. Interestingly, despite increased uptake in the advancements seen in the IS and CS field by the GIS industry, and in the common recognition that standardisation is a necessary process, there still does exist some technological disjoint between the fields on the issue of standardisation of web-based services and applications.
With the shift from stand-alone, desktop GIS applications to the increasing prevalence of web-GIS applications, geo-web services, which provide the geospatial information on which these applications run, have become increasingly important. The increased use of cloud computing technologies enabling these applications means that these geo-web services providing data are increasingly distributed across different locations, contexts and organisations. Because W3C standards are best practice standards and are widely adopted, the limited use of these web standards, particular semantic web standards and technologies which structure the data on the web, by the GIS field means that there is often a widespread lack of interoperability between geospatial data, geo-services and products and those developed by the IS and CS field. A lack of cross-industry interoperability often results in unnecessary inefficiency through, amongst other issues, the creation of data silos, a lack of real-time (geospatial) information as well as limitations to the capabilities of or the contexts in which GIS applications and tools can be used [1,10].
As geoinformation and GIS technologies increasingly become an integral part of organisational information systems, standardisation is becoming increasingly important for two reasons. Firstly, the process of standardisation allows for the integration of distributed geo-web services in a GIS application, reducing the need for manual manipulation and transformation of data to integrate the different datasets required to perform a specific analysis [1,11]. In the context of open geospatial information, standardisation is even more important, where the goal is to share information freely to contribute to more valuable analysis in a range of contexts and across organisations in a networked information chain [7,12]. Secondly, within an organisation itself, standardisation of data allows for the integration of spatial datasets with non-spatial datasets, enriching both; moreover, it allows for more meaningful analysis to be done to reveal with improved efficiency the connections, relationships and patterns only available when data are integrated. Easier and perhaps automatic integration of data also improves the accessibility of said data, making it available to a wider range of users; the benefits of which are numerous. Increased efforts in aligning GIS standards with web standards allows for the potential that is contained within the GIS field to the web.
Self Service GIS: Web-GIS Innovation Using Semantic Technologies
As the GIS industry transfers from stand-alone GIS systems targeted almost exclusively at the GIS professional to the networked, distributed web-GIS based in the Cloud targeting a wider range of users and contexts, the use of web technologies and standards will become increasingly important. It is because of the distributed and heterogeneous nature of web services and products that the use of these standards become imperative to ensure a more integrated experience within and between organisations and individuals. As an extension of web-GIS, and in catering for non-GIS experts looking to make use of spatial and non-spatial data in an easily accessible way, the concept of self-service GIS (SSGIS) would directly benefit from the increased use of web and semantic technologies and standards and, where these are used, will have a key influence in ensuring (geospatial) information is more accessible to the end-user. As a next step in transitioning to web-GIS and with this vision in mind, the way in which self-service GIS can be achieved, and the precedent for achieving this type of tool, should be explored.
SSGIS generally allows for easier user interaction and basic analysis of geospatial data through web-based geographical applications [13]. Indeed, SSGIS is easily identified based on the simplicity of its functionality with regards to how users interact with the data being visualised through the system and based on the expected level of expertise that is being catered for by the application. As such, the target user group generally covers non-expert users looking to answer spatial questions with limited computational complexity and do not require a background in geo- or data-processing. To extend this definition, however, this paper seeks to argue that self-service GIS should conceptually stretch beyond this to include certain philosophical aspects of the web such as its general emphasis on openness (open standards, open data) as well as the combining and sharing of more and more data to enrich these data for reuse in wider contexts. Naturally, a self-service GIS application will, then, ensure the combining of spatial and non-spatial data in this enrichment process and make geoinformation more accessible to a wider range of users.
As this paper looks ahead to how self-service GIS may be best developed, it is important to explore why this would be best developed based on web technologies and standards; the reason for which is twofold. Firstly, the open standards which govern web technology allow for better interoperability between any SSGIS application and other products and services which interact with this application, including non-spatial data, software packages and other applications available on the web. What is particularly important for any SSGIS application, however, is the interoperability of the data sources which it makes use of. It is likely that any SSGIS application will make use of a range of datasets in providing the end-user with the required functionality. The more interoperability there is between these sources and services, the more efficient and accessible the application itself will be. Secondly, in making use of web-based data sources governed by semantic web standards, an SSGIS application can make use of data ‘on the source’, where data are provided to the end-user in real-time. In being available on the web, an SSGIS application is naturally also more accessible to a wider range of users who can access and interact with the application and reuse insights resultant from an application in other contexts.
This paper is divided into three sections, namely, a state-of-the-art review of web-GIS, the Semantic Web and Self-Service GIS to the extent that this can be classified as an already existing service, a tooling review, and a discussion. The state-of-the-art is presented to provide an overview of existing technologies and situate the conceptualisation of self-service GIS within these existing technologies. To then assess the tooling precedent which exists and could support the delivery of self-service capabilities based on linked data and semantic technologies, this paper will conduct a review of existing Linked Data tooling examples. Finally, the discussion section aims to outline what the features of an SSGIS application would be in practice with the goal of providing guidance on how SSGIS could be applied in a range of contexts.
3. State of the Art: Web GIS, Semantic Web and Self-Service GIS
To discuss the impact that the uptake of semantic web technologies can have within the context of developing and implementing self-service (web) GIS applications, the research contained within this paper first needs to situate itself within the available research. To do so, each topic will be defined, and its current state and relevance to this project outlined. To guide the presentation of this content, this section will be divided according to each subject area with the overlap in the advancement of each technology noted where relevant.
3.1. Web GIS
Web GIS, first appearing in 1993 with the development of the Xerox Corporation’s interactive map viewer [2], allows for the retrieval of spatial information over the web and user interaction with this information in the form of data browsing, manipulation or spatial analysis depending on the interface (Putz, 1994 as cited by [2,3]). Such an application is achieved through a distributed information system, whereby the GIS server interacts with a web browser, desktop or mobile application to deliver geospatial information to the user by making use of web technologies to communicate between these [3]. While the first examples of Web GIS were limited to simple interactive functionality such as simple zoom and layer selections, the advent of 2.0, where information sharing and user-generated content rose, and continues to rise, exponentially, saw the capabilities of the Web GIS transform from primarily spatial data browsing to currently have functionality in four distinct areas [14]. Firstly, geovisualisation and data querying are the most frequently available functions in a Web GIS, with the results generally presented as maps to the user. As is the basis of spatial information, each location on a map is presented through a data visualisation also as attributes which describe the characteristics of the location in question. Secondly, the collection of geospatial information, both as a professional or commercial effort as well as through volunteered data collection, is also a function of a Web GIS. There are numerous examples of this function in practice with arguably the most successful example of volunteered geographic information (VGI) projects being OpenStreetMap. The third function of Web GIS, as an extension of the first two functions, is the dissemination of geospatial information through either the further interaction that secondary users of a particular dataset stored in a Web GIS have or through the downloading and sharing of data. This dissemination of geospatial information through one of these methods is also done following the geospatial analysis, as the fourth function of a Web GIS. Web GIS servers can now interact and integrate data from distributed sources and send data to the client application in formats which include HTML and binary imagery but also XML (Extensible Mark-up Language) or JSON (JavaScript Object Notation).
There are numerous commercial examples of web mapping applications including those geared for consumer consumption, see Google Maps, Yahoo Maps and MapQuest, as well as those fitted to suit the computational needs to geoinformation professionals. Both groups of applications, although most importantly for the first group, seek to continuously improve user experience and engagement with geospatial information by providing highly detailed geospatial data and high-resolution imagery of large swaths of the earth’s surface. The user interfaces within these applications are developed to be highly interactive and responsive and are generally easily accessed using mobile applications which provide location-based services to the user in real-time. To develop and implement these Web GIS applications, as well as to send and receive the data which supports these applications, both the consumer web mapping applications and those geared towards professionals in the field make use of web technologies. Primarily, Web GIS clients and servers generally communicate through the HTTP protocol, where the simplest form a Web GIS can be in is one server and one or more clients. In general, however, Web GIS architectures are designed in a three-tier system, which includes a data tier and can be completely distributed across the internet and interact with each other using web services. These web services include, but are not limited to, a Web Feature Service (WFS) and Web Map Service (WMS). While it is common that terms such as Web GIS and GeoWeb as well as Internet GIS and geospatial Web are very closely related to each other, these terms are not synonymous. Web GIS and GeoWeb can be used interchangeably with the only consideration being that the GeoWeb involves the interaction between heterogeneous data forms (geospatial information as well as webpages, photographs and news articles) rather than strictly geospatial information. However, Internet GIS extends its support of services beyond those which work strictly on the web, and as such, is not technically synonymous with Web GIS [15].
Esri stresses the numerous advantages of as well as the challenges faced by the implementation of Web GIS, particularly where the technology is developed and used in a range of contexts [3]. The organisation has made the Web GIS the centrepiece to their corporate strategy to increase the use of GIS with more organisations in a broader context [16]. Because a Web GIS makes use of distributed web services as described above, the reach the developer has to an application’s user base is global, not least because these applications can generally be used on a user’s mobile phone. Secondly, because the reach is global, there is a large number of daily users of Web GIS applications, particularly because of the proliferation of location-based services, which in turn reduces the cost of developing and maintaining the applications when this is averaged by the number of users the application has. Additionally, because the user groups that are targeted by Web GIS’ tend to be more diverse than those targeted by professional GIS software packages, the end application tends to be very user friendly and applied to a wider range of contexts than those applicable to professional needs. Despite these advantages, there are still challenges faced by Web GIS, particularly with regards to the interoperability of data from diverse sources and which are heterogeneous in nature as well as with accommodating the diverse needs of end-users in designing the user interface, challenges which are identified, explored and addressed through this research.
3.2. The Semantic Web
The Semantic Web, in being defined as the facilitation of the creation of a fully linked, tagged and machine-readable web of online data in various forms, makes use of various technologies to formalise the semantics related to these data and the domains of knowledge that they are related to. Such technologies include the Resource Description Framework (RDF) and the related Schema (RDFS), various Web Ontology Languages (OWL); all of which are used to fully formalise the metadata related to particular datasets, which, in turn, structure data on the web [17]. The semantics which are formalised using this range of web technologies allow for the improvement of reasoning and interoperability of heterogeneous web resources. The Semantic Web makes primary use of HTTP URIs to enable cross-machine interaction across websites, organisations and countries [18]. For the machines in question to be able to access and process the information being represented, the information needs to be presented by describing the data in reference to a particular knowledge base, which is formalised as an ontology. This level of functionality is achieved through the Semantic Web Stack, which is generalised into three layers, namely, the naming and addressing layer, the syntax layer, and the semantic layer [19].
The foundational technology of this Semantic Web Stack is the Resource Description Framework (RDF), which was, at the outset, used as a method of extending XML (Extensible Markup Language); a modelling language which is used to uniformly serialise data but is unable to provide all requirements needed for the Semantic Web Stack. The purpose of such a framework is to handle semantic relations based on unique identifiers and to link these relations using triples [19,20]. A single or ‘flat’ RDF triple can be expanded into a tangled graph data model known as a Knowledge Graph (KG), where the data or relationships described by the RDF triple are semantically enriched and placed in context through the connection with other knowledge bases using Semantic Web technologies and standards. A KG combines several data management models in its implementation, including the traditional database model, a graph model as well as, and perhaps most critically, a knowledge base model bearing the formal semantics of numerous knowledge domains [21]. Indeed, the data contained within a KG are expressed and interpreted in making use of several representations and modelling instruments, including class structures, relationship typing, categorisation ordered into taxonomies, free-text descriptions and ontologies and it is these instruments which allow the data contained within the Graph to be linked and expanded to other available Graphs and data [18,21,22]. It should be noted, however, that RDF graphs, knowledge bases and KGs are not necessarily synonymous with one another. RDF graphs do not necessarily need the semantic enrichment of data instances, setting it apart from a KG, and knowledge bases do not always include formal structure and semantics in the description of the knowledge domain, again rendering a knowledge base of this type different from a KG.
There are many examples of large KGs, both corporate and open source, that are actively used and expanded, including, but not limited to, Google’s KG, DBpedia and GeoNames; the former of which is not available for use beyond Google projects. The DBpedia KG, which started in 2006 and is the core of the Linked Open Data movement, is a community-run and open source project and is exposed and structured by making use of Semantic Web technologies and standards. The graph makes use of Wikipedia infoboxes to create dataset contained within the KG where the ontology used within covers a range of entity categories, including people, organisations, events and diseases [23]. Because of its data source, the KG is constantly evolving and expanding as users make additions to Wikipedia, but it is also the largest multilingual KG available [23]. Similarly, GeoNames is one of the largest KGs, primarily focused on geographical name data instances, and is available as an open-source dataset. Currently, the body of literature available on the advantages in the formalisation, development and implementation of geographic knowledge graphs is growing. Indeed, researchers often point to the role that geospatial semantics have in improving the interoperability and accessibility of geospatial information [24,25] and to the computational advantages of developing geospatial-specific knowledge graphs [26]. The literature available on the adoption of these for Web GIS applications is, however, limited. More generally, however, semantic technologies have been successfully applied in various contexts to improve the sharing [27] and integration [28,29] of disparate services.
3.3. Self-Service GIS
Self-Service GIS (SSGIS), envisioned as an extension to the typical functionality contained within Web GIS, is generally geared towards the non-expert user in allowing for easier user interaction and basic analytic geo-analytic functionality through web-based geographical applications [30]. To date, however, this concept has not been concretely defined and remains very limited in its application. To support the increased uptake of this conceptualisation going forward, this paper aims to extend the current idea more concretely by arguing that any conceptualisation of SSGIS should also encompass the openness of the internet by making use of open standards and, where possible, open data. SSGIS has numerous advantages, most notably for the accessibility of geospatial data, simple analytics and visualisation for a larger set of user groups. Indeed, where non-expert users, in particular, can engage with software packages for geo-analysis and -visualisation, geospatial analysis can be accessed and used in larger and potentially novel contexts [28]. Because the value of geospatial information is more readily recognised outside of the traditional academic and technical fields, and because it has become more accessible as a result of technological developments, the need for people to access and interact with geospatial information on a self-service basis beyond the field of GIS has increased. Despite this, however, SSGIS remains elusive; both with regards to examples of implemented applications in a range of contexts as well as discussions around necessary feature inclusions and potential SSGIS architectural design solutions needed to support the widespread implementation of technology.
The use case for self-service GIS functionality is not without precedent. Miami-Dade County in the United States makes available to citizens GIS tools which allow for the storage, edit, display and query of geoinformation management with the intention of being able to answer a certain set of questions. These questions have been pre-emptively defined, and small self-service applications are built to answer each one. Currently, the Miami-Dade Self-Service GIS makes use of 43 smaller applications centred around these themes. These range from aerial photography and address search, rising sea levels and street maintenance as well as water and sewer allocation across the county. These applications require no expert knowledge related to GIS and support the idea that self-service necessarily requires ease-of-use for end-users. Additionally, the Greater Manchester Fire and Rescue Service has also presented the business case for better GIS integration into their operation to improve incident recording and for the eventual KPI reporting, essentially focusing on the ability to store and query incidents to improve business processes. The development of this application focused on the use of open standards to improve the interoperability between databases and other applications used within the organisation. The simplicity of the application is also stressed to ensure the end-user can effectively and accurately report fire and rescue incidents.
While these cases do showcase where SSGIS could be applied in various contexts, they do not currently make use of semantic web technologies, arguably to the detriment of interoperability and accessibility. Having outlined the advantages that the converging web GIS and the semantic web in the realisation of SSGIS can bring, this paper now looks to existing Linked Data tooling examples with the goal of identifying what features may be required for SSGIS itself. Each chosen tool will be presented in turn and the features of each identified based on an applied framework are discussed.
4. Current State-Of-The-Art Linked Data Tooling and Services
In seeking to comprehensively identify what the necessary features and functionalities of an SSGIS making use of semantic web technologies are, it is first necessary to review existing examples of linked data/self-service tooling based on their common and/or innovative feature inclusions. Semantic web technology, and the principles of Linked Data which support it, is not a new concept, but its implementation has been slow in various fields and within large organisations which can benefit from its uptake [8,31]. This limited uptake could, arguably, be a result of the limited number of Linked Data tools available to support organisations and industries in implementing these projects. As a way of taking stock of what tools do exist and how these may support SSGIS in specific, this section identifies and discusses each in turn. This list may not be exhaustive but arguably provides a representative overview of what tooling is available.
In taking inspiration from a previous review of SPARQL clients performed by Rietveld and Hoekstra [32], this review makes use of categories similar to those used by the authors, but altered and expanded for better application to linked data tools and applications more broadly. Naturally, the review done by the authors focused on features relating to Linked Data querying contained within the clients, whereas this review takes a slightly wider view of the features of a tool or application as a whole. The features identified in each of these examples cover a range of categories, and each is defined below. It is likely that not all of the features identified in this review will be of use, or able to be implemented, in any final SSGIS application, but this review does indicate the range of feature possibilities which could be provided to end-users based on the goals of the self-service application.
- Visualisation Features
This category covers the range of features pertaining to how data on the backend of an application are presented to the end-user in the application interface. This review identified four visualisation options within the set of existing tools included, namely:
- Graph
- Table
- Chart
- Geovisualisation
- Applicability Features
- Platform independence: describes whether a technology is specific to one specific operating system or can be used across multiple platforms.
- Available as a library: interfaces that are open source and are available for further development or integration into other applications, projects or libraries.
- Multiple endpoints: describes whether the user can access multiple endpoints or whether the client is pre-configured to provide data from a specific endpoint only.
- Interactivity Features
As stressed by the review of all the tooling examples below, a key feature of a self-service application is for the user to be able to interact with the data based on certain functionality inclusions. This review makes use of four interactivity features which are deemed to be important inclusions for self-service applications. How these are realised is highly dependent on the tooling in question and their appearance is described extensively in the following review:
- Drag and drop
- Filtering
- Searching
- Drawing
- Advanced Analytics
In line with the vision that a self-service GIS is able to provide users with the ability not only to browse and view geoinformation but also produce their own insights based on the combining of multiple datasets, it may be necessary that a self-service GIS application is able to provide a level of analytical features to the end-user. How extensive these features are and what their exact function depends on the context and the target user of the application:
- Geo-analytics
- Data analytics
- Querying
- Temporal analytics
- Usability Features
At the centre of self-service tooling is the usability functionality that makes user engagement with the application more efficient and convenient. The usability features included in this review are as follows:
- Query retention
- Data upload
- Results download
- Endpoint search
- Query building
The tooling examples have been sorted into three categories, namely, browsers and viewers, analytics dashboards and querying clients. As such, some of the clients reviewed by the authors also appear here. Each tool is discussed in turn based on the presence (or important absence) of specific features. For ease of readability, these reviews are summarised in the table included in Appendix A. The tools included in this review were chosen based on their findability and loose application to Self-Service GIS. The tools included here are unlikely, and not intended, to be exhaustive. It should be noted that certain features such as zooming and panning, for example, are general inclusions of geographic visualisation of data, and as such have not been included in the framework as individual features in this review.
4.1. Linked Data Browsers and Viewers
The following section reviews seven linked data browsers and viewers in total for the purpose of this review. For each tool, a summary table as well as a detailed discussion of the merits and shortcomings of the tool is included.
4.1.1. LD (Linked Data) Map
The LD Map application (see Figure 1 below) is built based on the BRT (Basisregistratie Topografie) dataset maintained by Kadaster, the Dutch Land Registry. This web map application allows for the searching of a geographical name with the goal of identifying where this particular name appears around the Netherlands. The zoom feature on a small scale allows for frequency clusters of the search name to be seen and, on a large scale, the point-based location of the name represented by a pin as you can see represented in the figure below. On the backend of this application, SPARQL and ElasticSearch are being deployed to query the data based on the search term input. As such, this application is loosely designated as having the querying feature, but it should be noted that the user themselves are not able to actively engage in querying the data in the traditional sense.
The useability and interactivity features contained within this particular application are limited. With regards to interactivity, the only feature available is to run a search over the data, and the useability features that we included in this review are not featured in this application. However, once a name has been searched, selecting a particular instance will provide all the semantic information contained within the BRT on this particular geographical name. Clicking on the URI of any attribute contained in each instance returns the XML description, essentially allowing for the results to be downloaded inadvertently, which is loosely included as a usability feature. Naturally, the visualisation features of this application are limited to geographic features and only point-based representations.
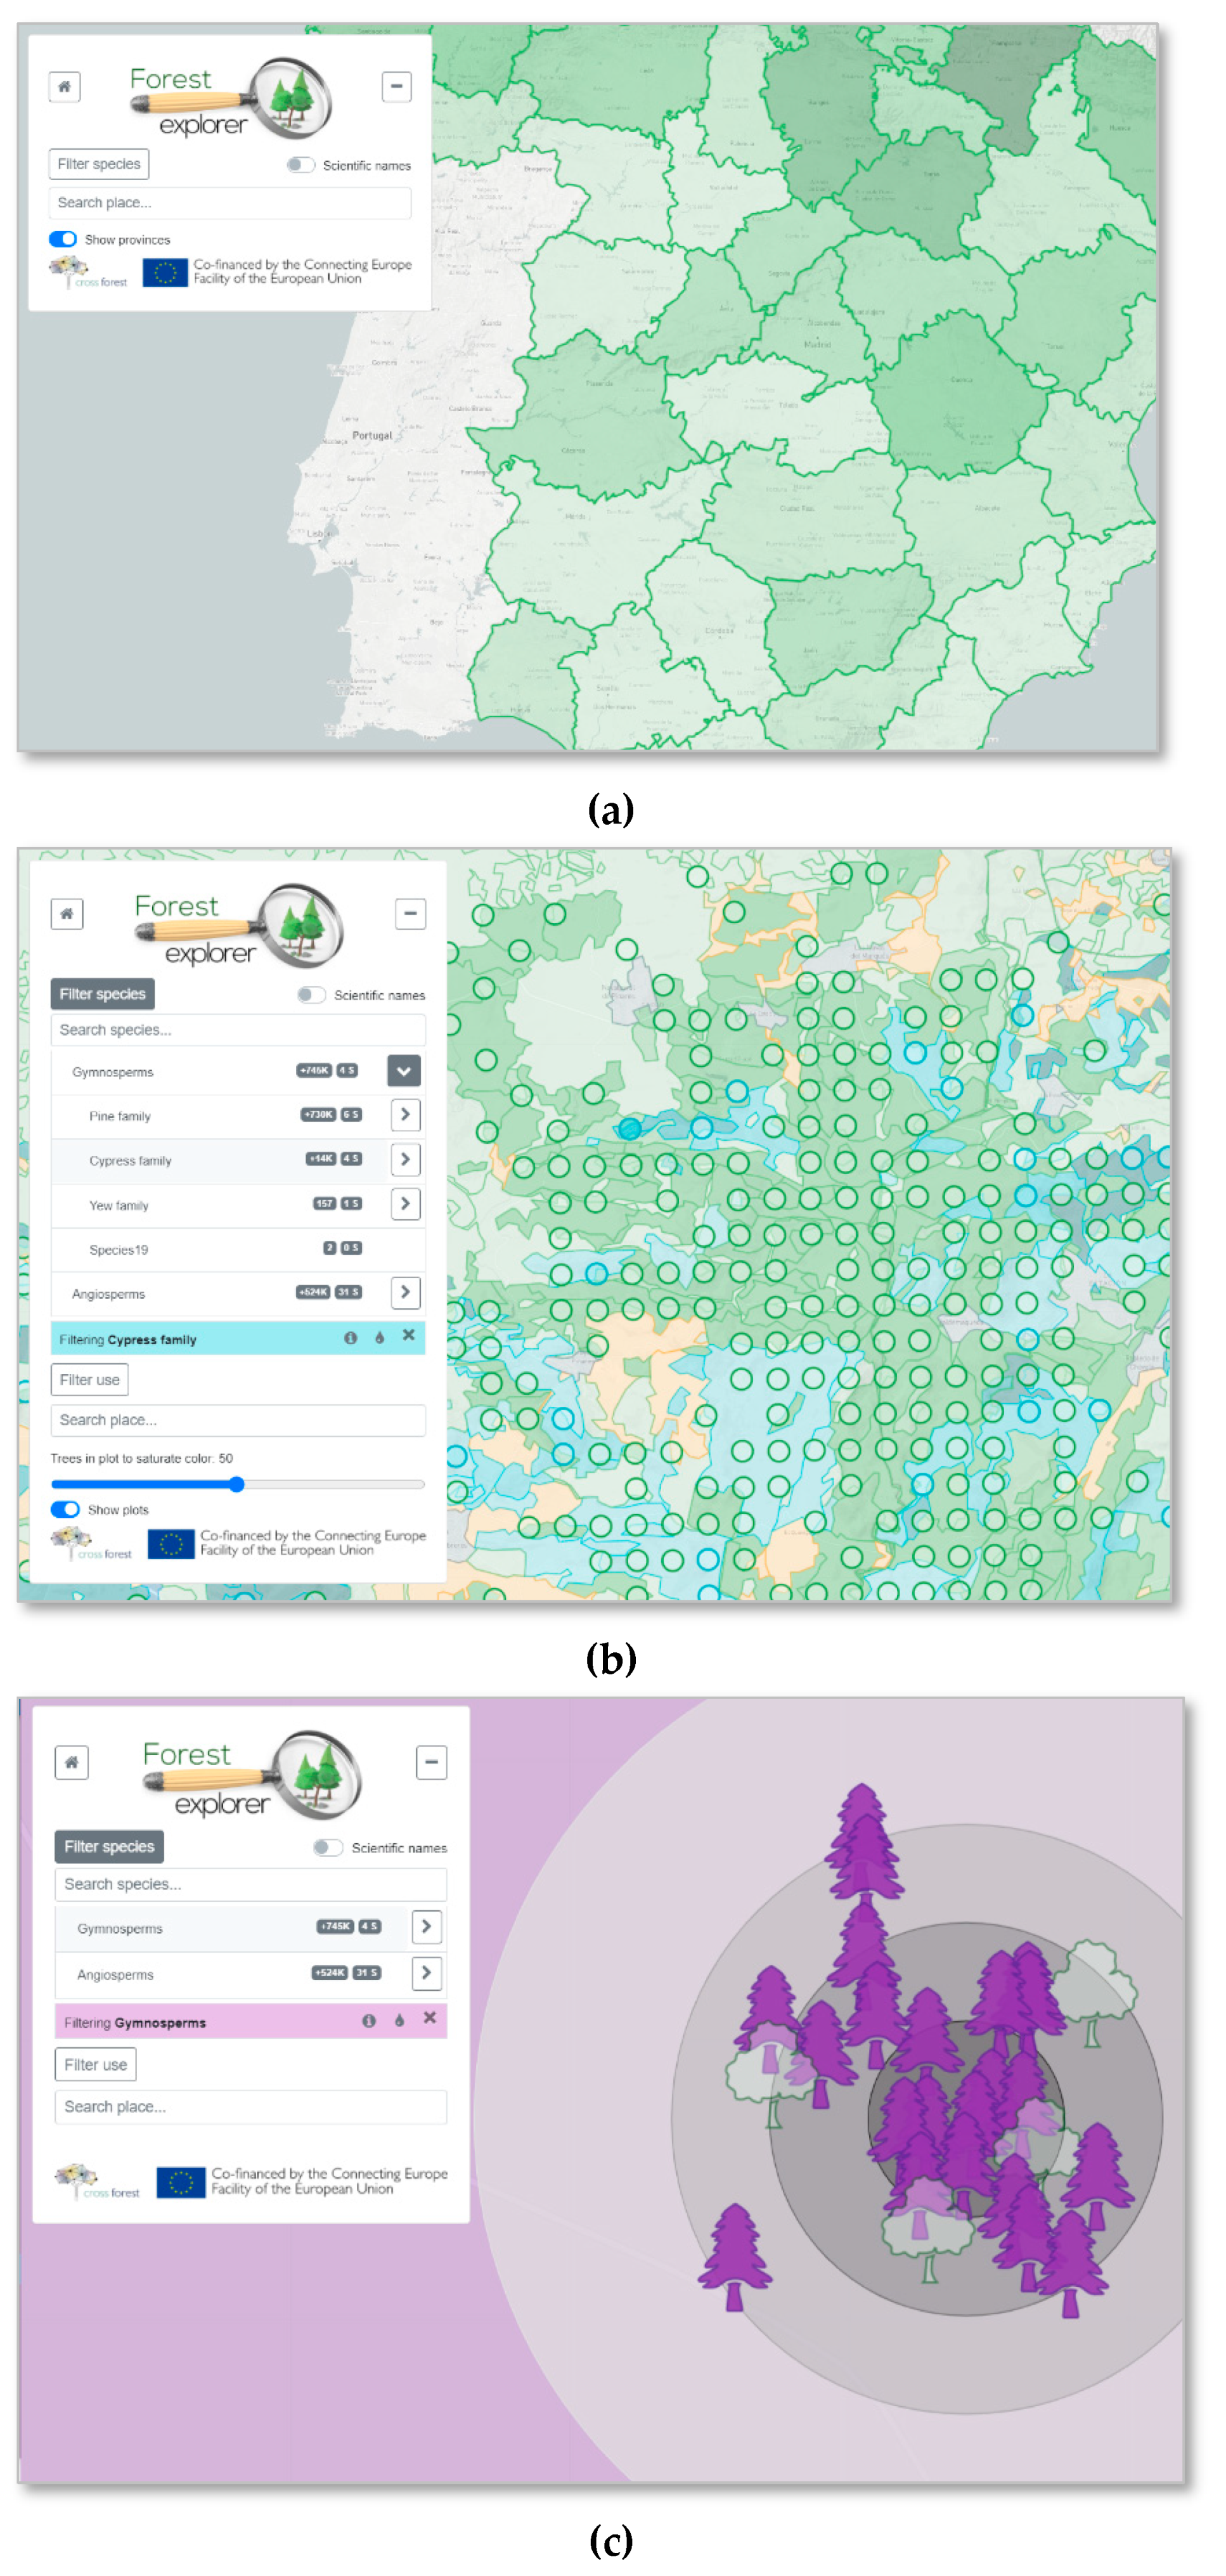
4.1.2. Forest Explorer
The Forest Explorer application, developed by a group of researchers at the University of Valladolid in Spain, is a web tool used to browse the contents of the Cross-Forest dataset which contains the forest inventory and land cover map of Spain. The user interface consists of a geo-visualisation feature which allows zooming and panning, where different zooming scales make use of different geo-analytics features, of which there are three types (see Figure 2). At the smallest scale, a polygon layer is available in which each province in Spain is represented, and hovering over each provides the user with a pop-up containing the metadata and aggregated data pertaining to the number and type of trees in the inventory. The next and larger scale provides an overview of the land cover and individual plots contained within the dataset. At this level, the filtering and searching features allow for the frequency of different trees within a plot to be referenced, and the geo-analytics feature displays this frequency based on a gradient colour scale in each plot. The last and largest scale shows a point-based representation of each tree in the dataset and provides data for each tree with regards to its height and diameter; further evidence of the geovisualisation features of the application. While the application itself does not allow for querying on the frontend, the application does feature querying abilities in parsing the filtering and searching features dictated by the user. In terms of the useability features of the application, these are limited based on the framework on which this review is based. The tool is available as a library and is platform-independent because it can be redeployed on any operating system.
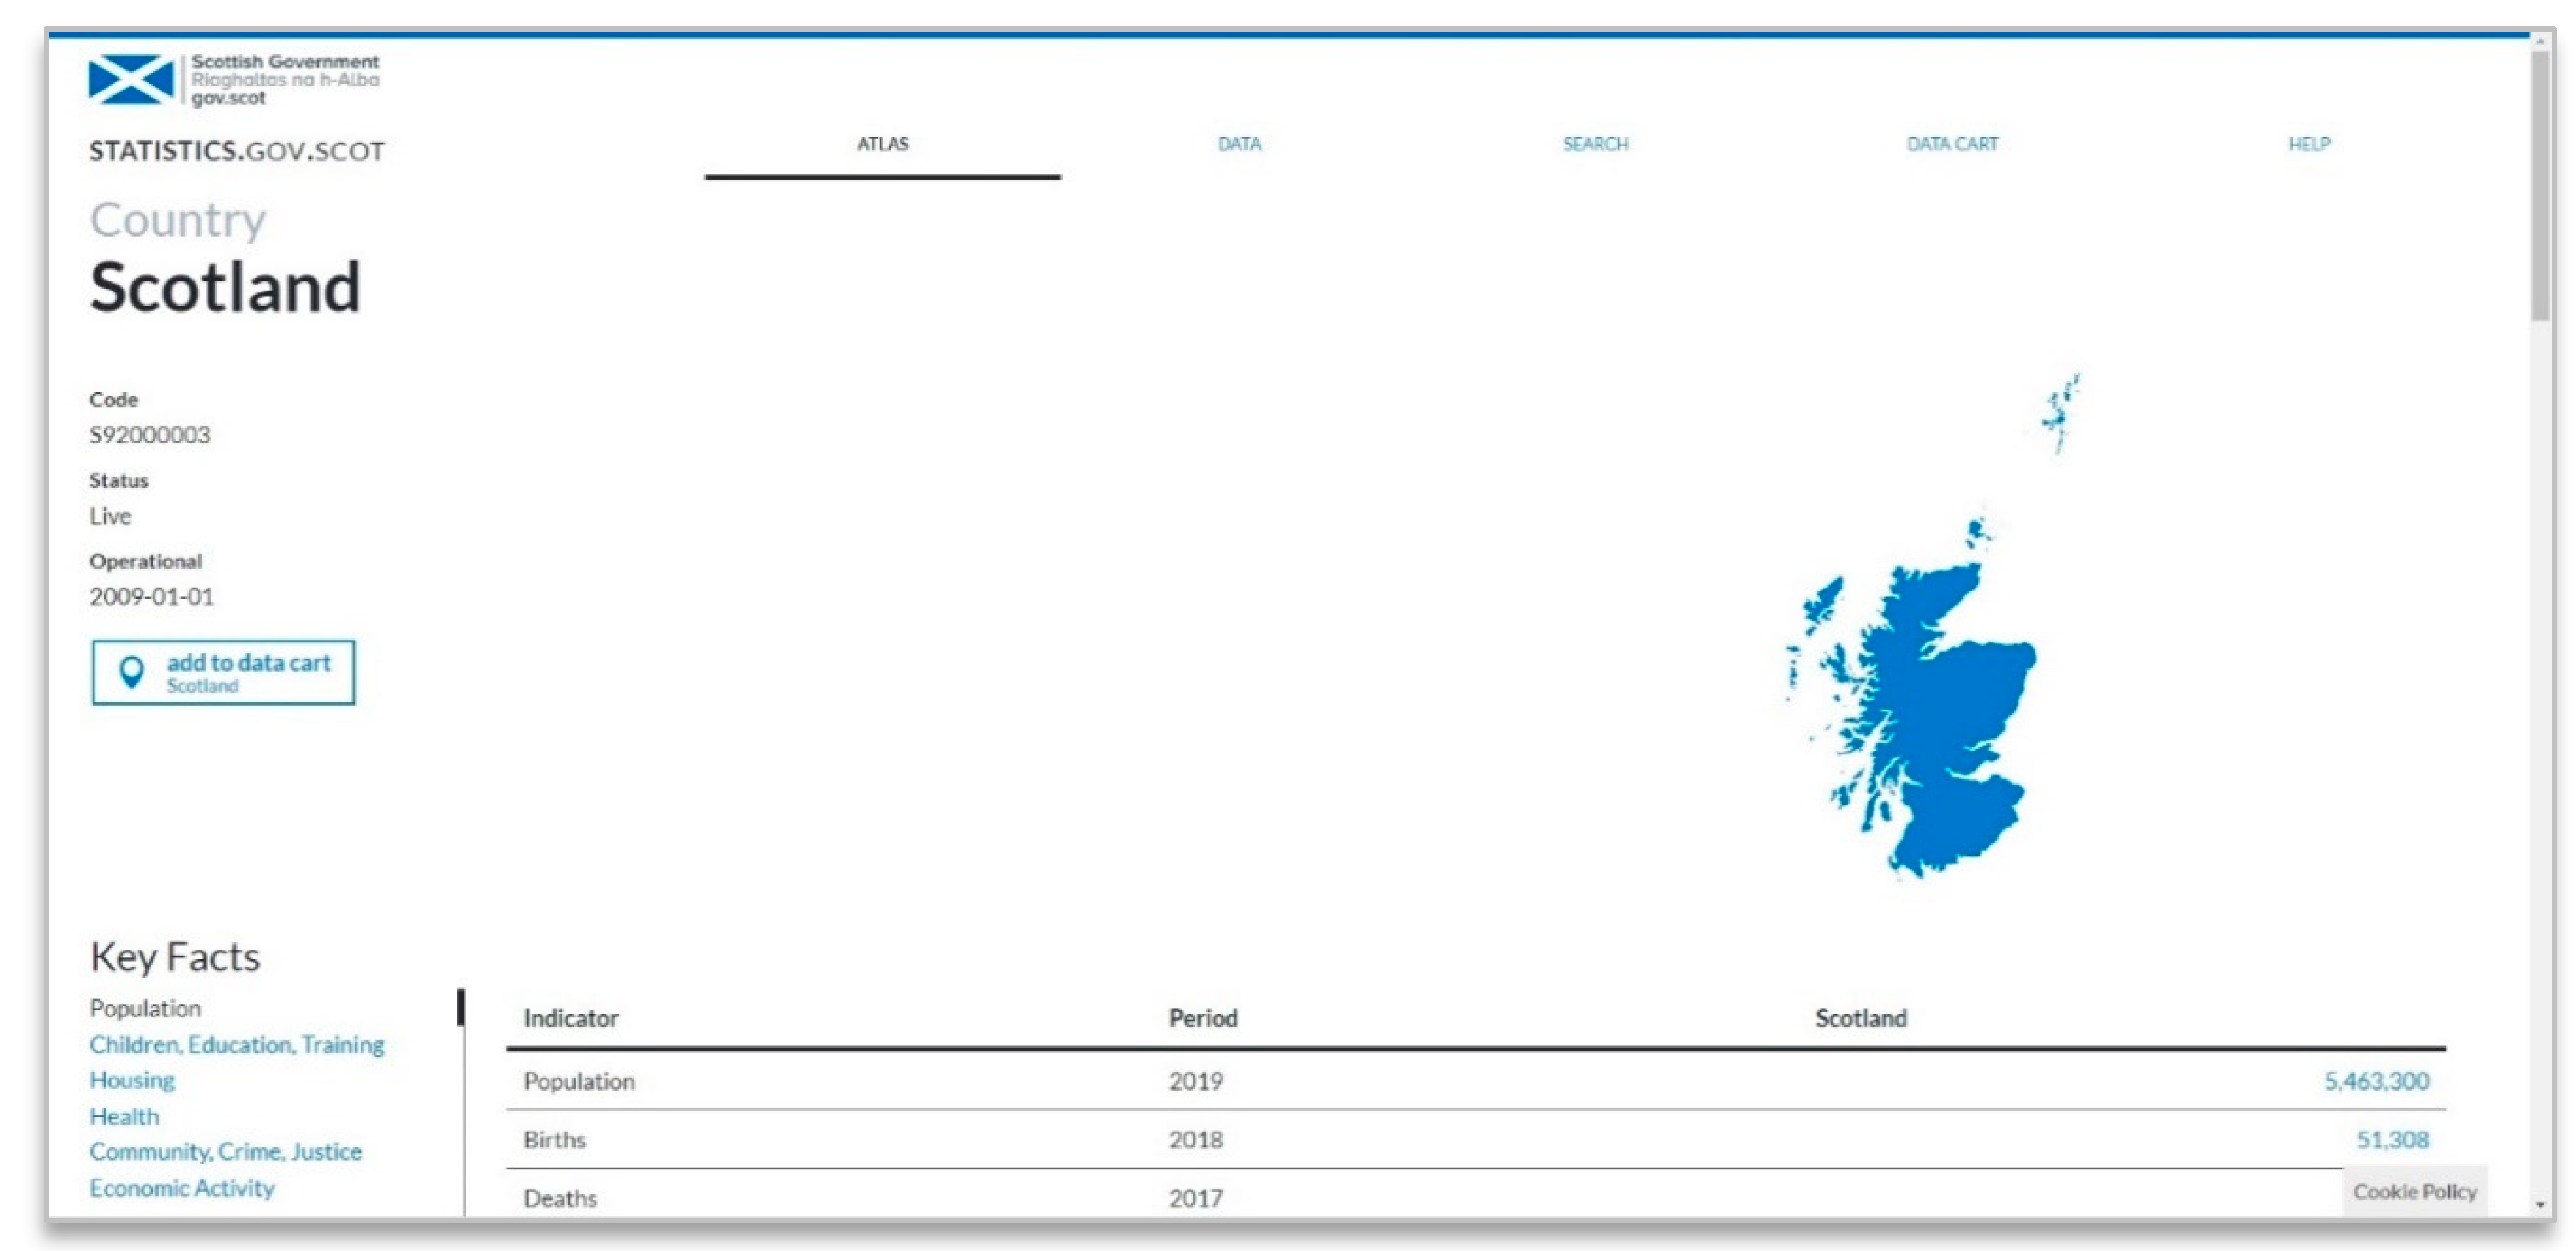
4.1.3. Linked Data Browsing Tool—Scottish Statistics Office
The Scottish Statistics Office’s linked data browser is available as a web-based repository rather a purely geovisualisation/dashboard application and is deployed with the goal of supporting the exploration, visualisation and download of the range of datasets available. This is targeted at both the layman user as well as the programmer which can make use of the APIs available. In terms of the basic interactivity features included in this application, users are able to search for either data or places/postcodes, filter datasets based on particular themes and then further filter the information contained within the dataset based on particular attributes contained within. These data are available for visualisation as both a chart, a table or a geovisualisation of the data. In general, this tool can be classified as a URI lookup service with the target audience being both layman users and programmers. The basic homepage view displaying these features are illustrated in the figure below (Figure 3).
For the more advanced user, the ability to query the data through an SPARQL client is also possible with this tool. This ‘advanced analytics’ feature also makes the ability to interact with temporal data possible, although this feature is limited to the browsing rather than analysis of temporal data within the tool. Although the tool does not allow for the integrated use of R within the webpages, the APIs that are made available to the user allow for the results of SPARQL queries to be imported into R, allowing for the most up-to-date data to be used for further and ongoing analysis. The results of a filtering/searching exercise, as well as an SPARQL query, can be downloaded in CSV format to be shared and reused. The use of APIs on an SPARQL endpoint allows for the query to be retained, but in a broader fashion, the results of a search are also retained in the data cart feature included in the tool. It is also possible to search for an endpoint using the general search features, as the results of the search are available both in tabular clickable links as well as in an API endpoint format.
4.1.4. Linked Data Browsing Tool—Ordnance Survey
Great Britain’s national mapping agency, Ordnance Survey, has a linked data browser similar to the previous example with less of a range of visualisation features comparatively. The browser is based on three separate linked data resources, including 1:50,000 Scale Gazetteer, Code-Point Open and the administrative geography gazetteer for the country, all of which are modelled based on corresponding geographies. This linked data browser can be classified as closer to a URI Lookup service rather than a true data browser due to the limited interactivity features. A user has three options for retrieving data through this browser, namely, performing a search based on a keyword, performing a query and searching for an identifier through the lookup service. The results of these options are posted as an API which can easily be shared and the metadata for each dataset can be exported in JSON, XML, Turtle or a raw data download. This is the extent of the usability features available to the end-user making this tool primarily suited for a user group familiar with SPARQL, APIS and programming languages. The tool does have platform independence in the sense that it is available on any operating system.
4.1.5. Ontodia/Metaphacts
The Ontodia, a library which supports data exploration, analytics, authoring and knowledge sharing, is integrated into the Metaphacts browsing application provides users with a platform from which they can create, explore and utilise enterprise knowledge graphs with the goal of managing and interacting with knowledge graphs as well as developing graph-based applications. Looking at the whole platform then, Metaphacts provides the largest range of visualisation features in comparison to the rest of the browsers included in this review. The applications allow for tabular, chart and graph visualisation (as illustrated in Figure 4 below) as well as spatial data rendering to a map, tree rendering to support tree-based visualisation, including the visualisation of sub-trees, as well as timeline-based visualisation of data. The interactivity features included also represent the largest range in comparison to other applications.
In reducing data complexity, Ontodia allows for an advanced data analysis to be performed by the user based on simple interaction features. These support the ability to perform what-if analyses, pathfinding and matching analyses, grouping for better qualitative analyses. The ability to query data using SPARQL is available but layman users can also perform queries without knowledge of SPARQL itself. When making use of this function, it is possible to retain past queries or make use of pre-existing queries. Users can share findings through APIs, download the results in CSV or JSON format or download the visualisation of a graph or relationship as PNG/SVG. The platform is not available as a library but is platform-independent, being available to users based on having a commercial/corporate account for enterprise knowledge management.
4.1.6. Interactive Data Lab—Voyager 2
Data Voyager (Voyager 2), developed by UW Interactive Data Lab (IDL), is a data exploration tool inspired by the features included in Tableau. The application, which is available as a library and is platform-independent, allows the user to either manually or automatically specify charts based on their uploaded datasets. The user interface supports interactivity features such as drag and drops to set the data that are represented on the chart axis. Dropdown menus allow for certain chart themes and visualisation characteristics such as colour, size and shape of the data point on the chart to be defined (see Figure 5 below). The final outputs can be exported/downloaded as a JSON as a standalone result as well as for integration into Jupyter Notebook.
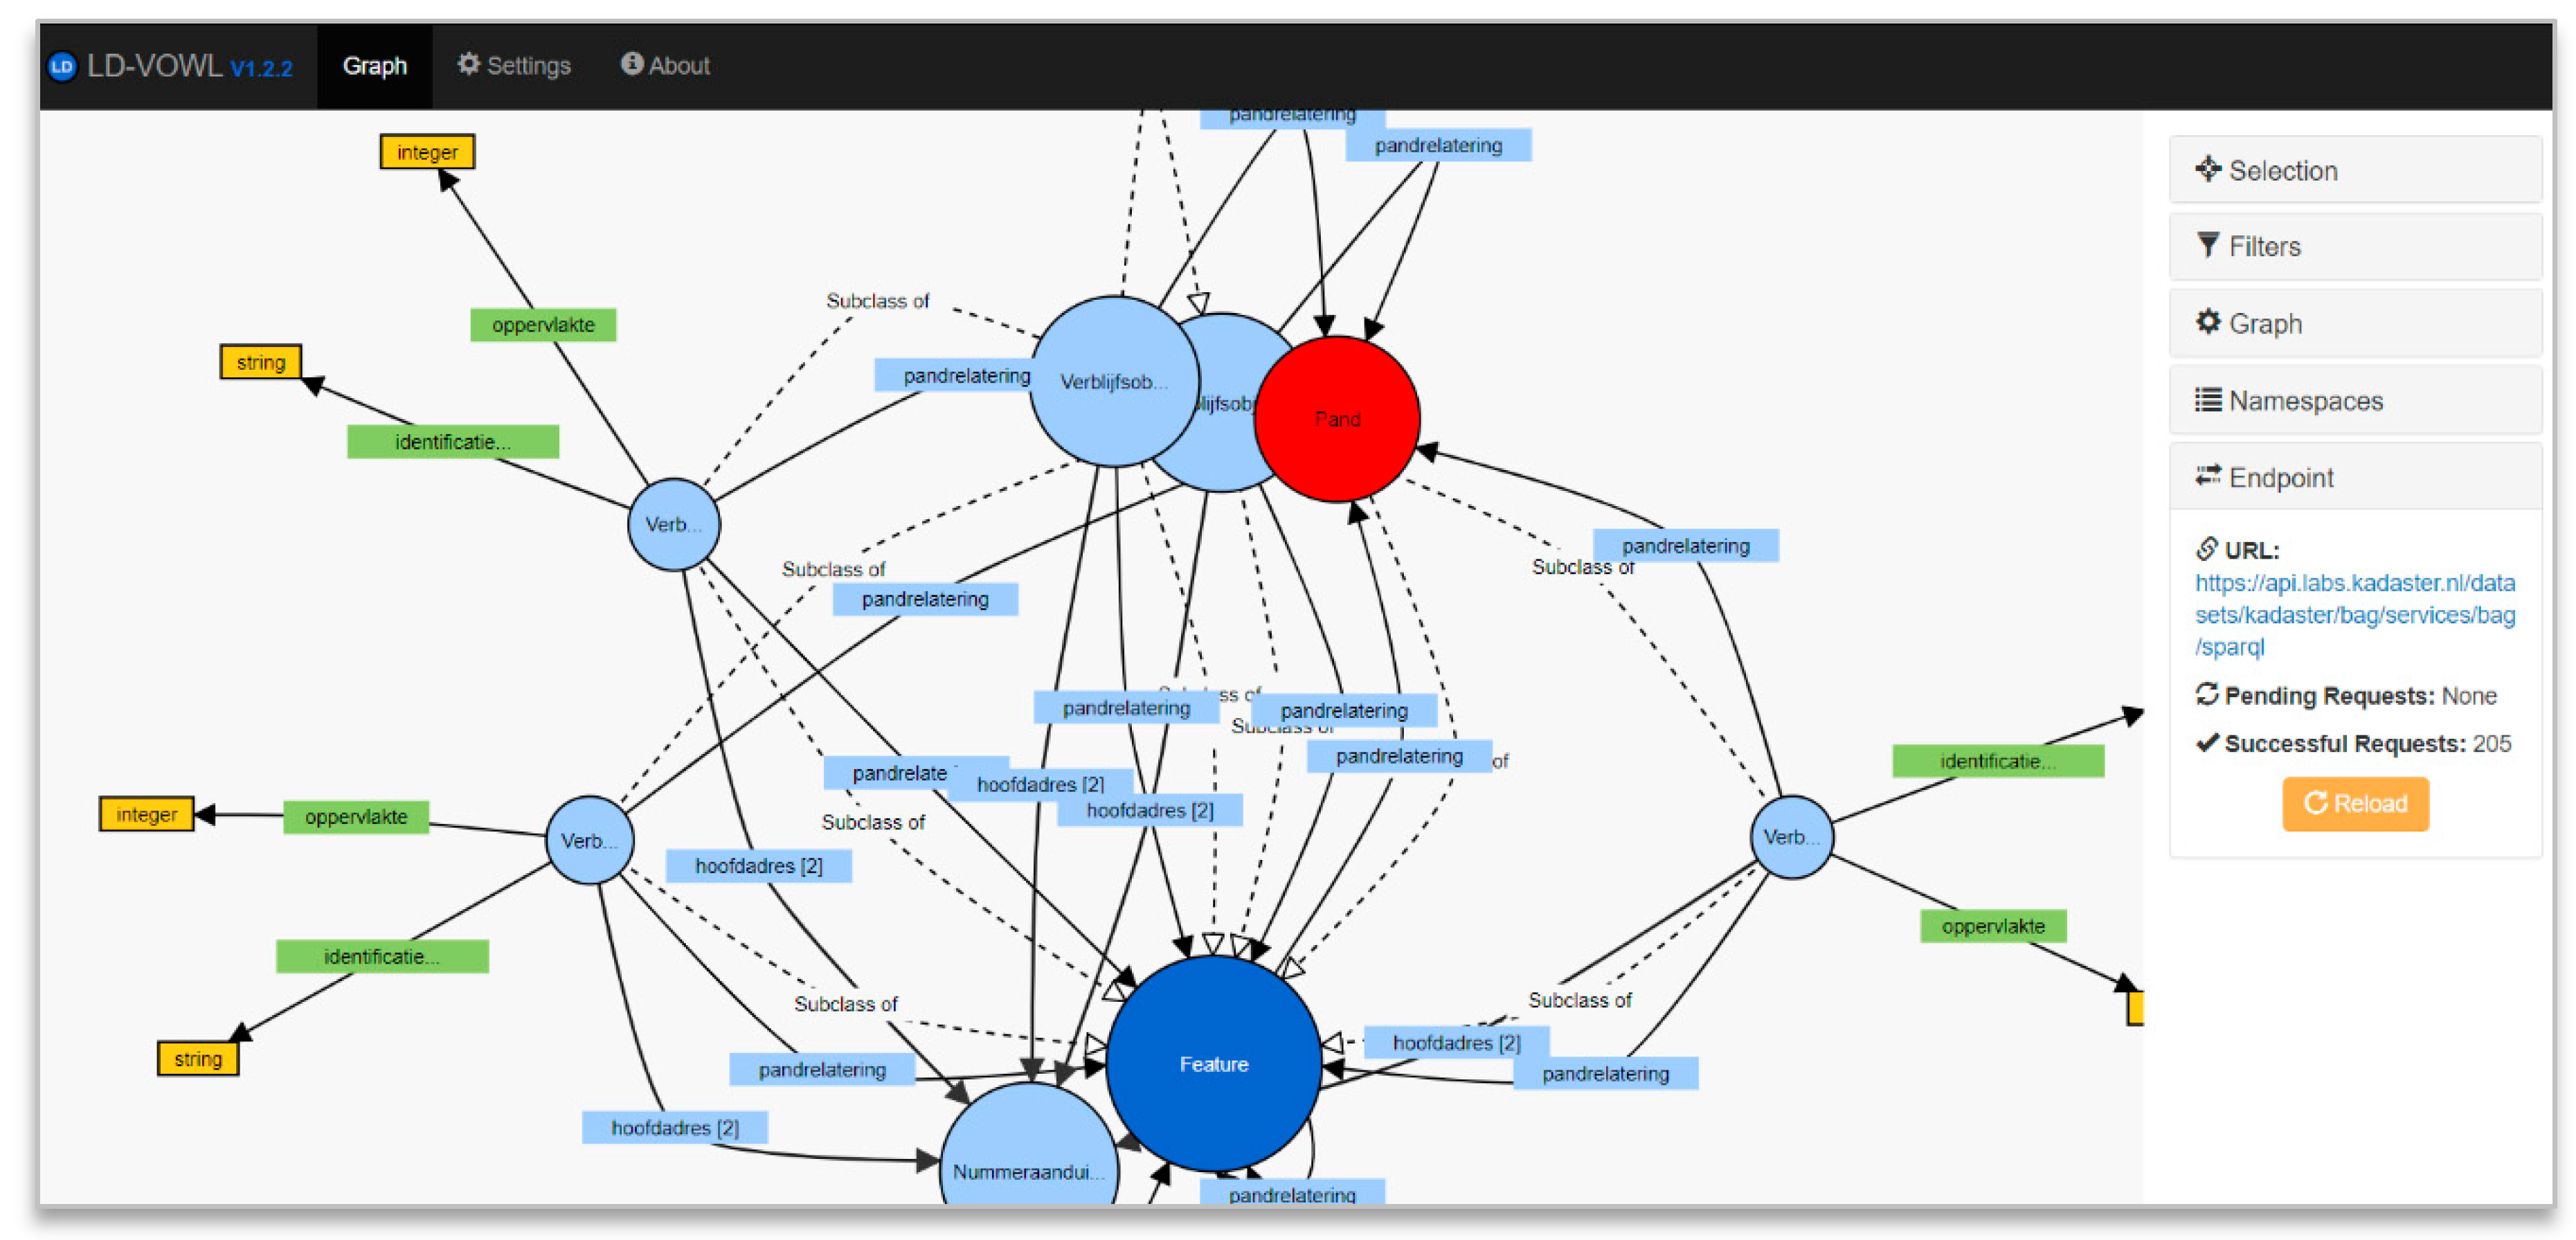
4.1.7. LD-VOWL
LD-VOWL, an interactive graph visualisation tool, extracts schema information from a given endpoint defined by the user and displays the information based on VOWL notation where the requirements are the endpoint is SPARQL-compliant and returns information in JSON format. Compliant endpoints can be searched for through the application. The interactivity features of the application are limited to drag and drop and the application of filters which allow for the display of class disjointness, subclass relations and datatypes contained within the data (see Figure 6 below). The application allows for multiple endpoints to be displayed in the application, although not at the same time. The application is available as a library and is also platform-independent, allowing the application to be run on any operating system.
4.2. Linked Data Analytics Dashboards
The following sections reviews linked data dashboards which provide some level of analytic functionality over the data. These are far less numerous than those reviewed in the previous section. For each tool, a summary table as well as a detailed discussion of the merits and shortcomings of the tool is included.
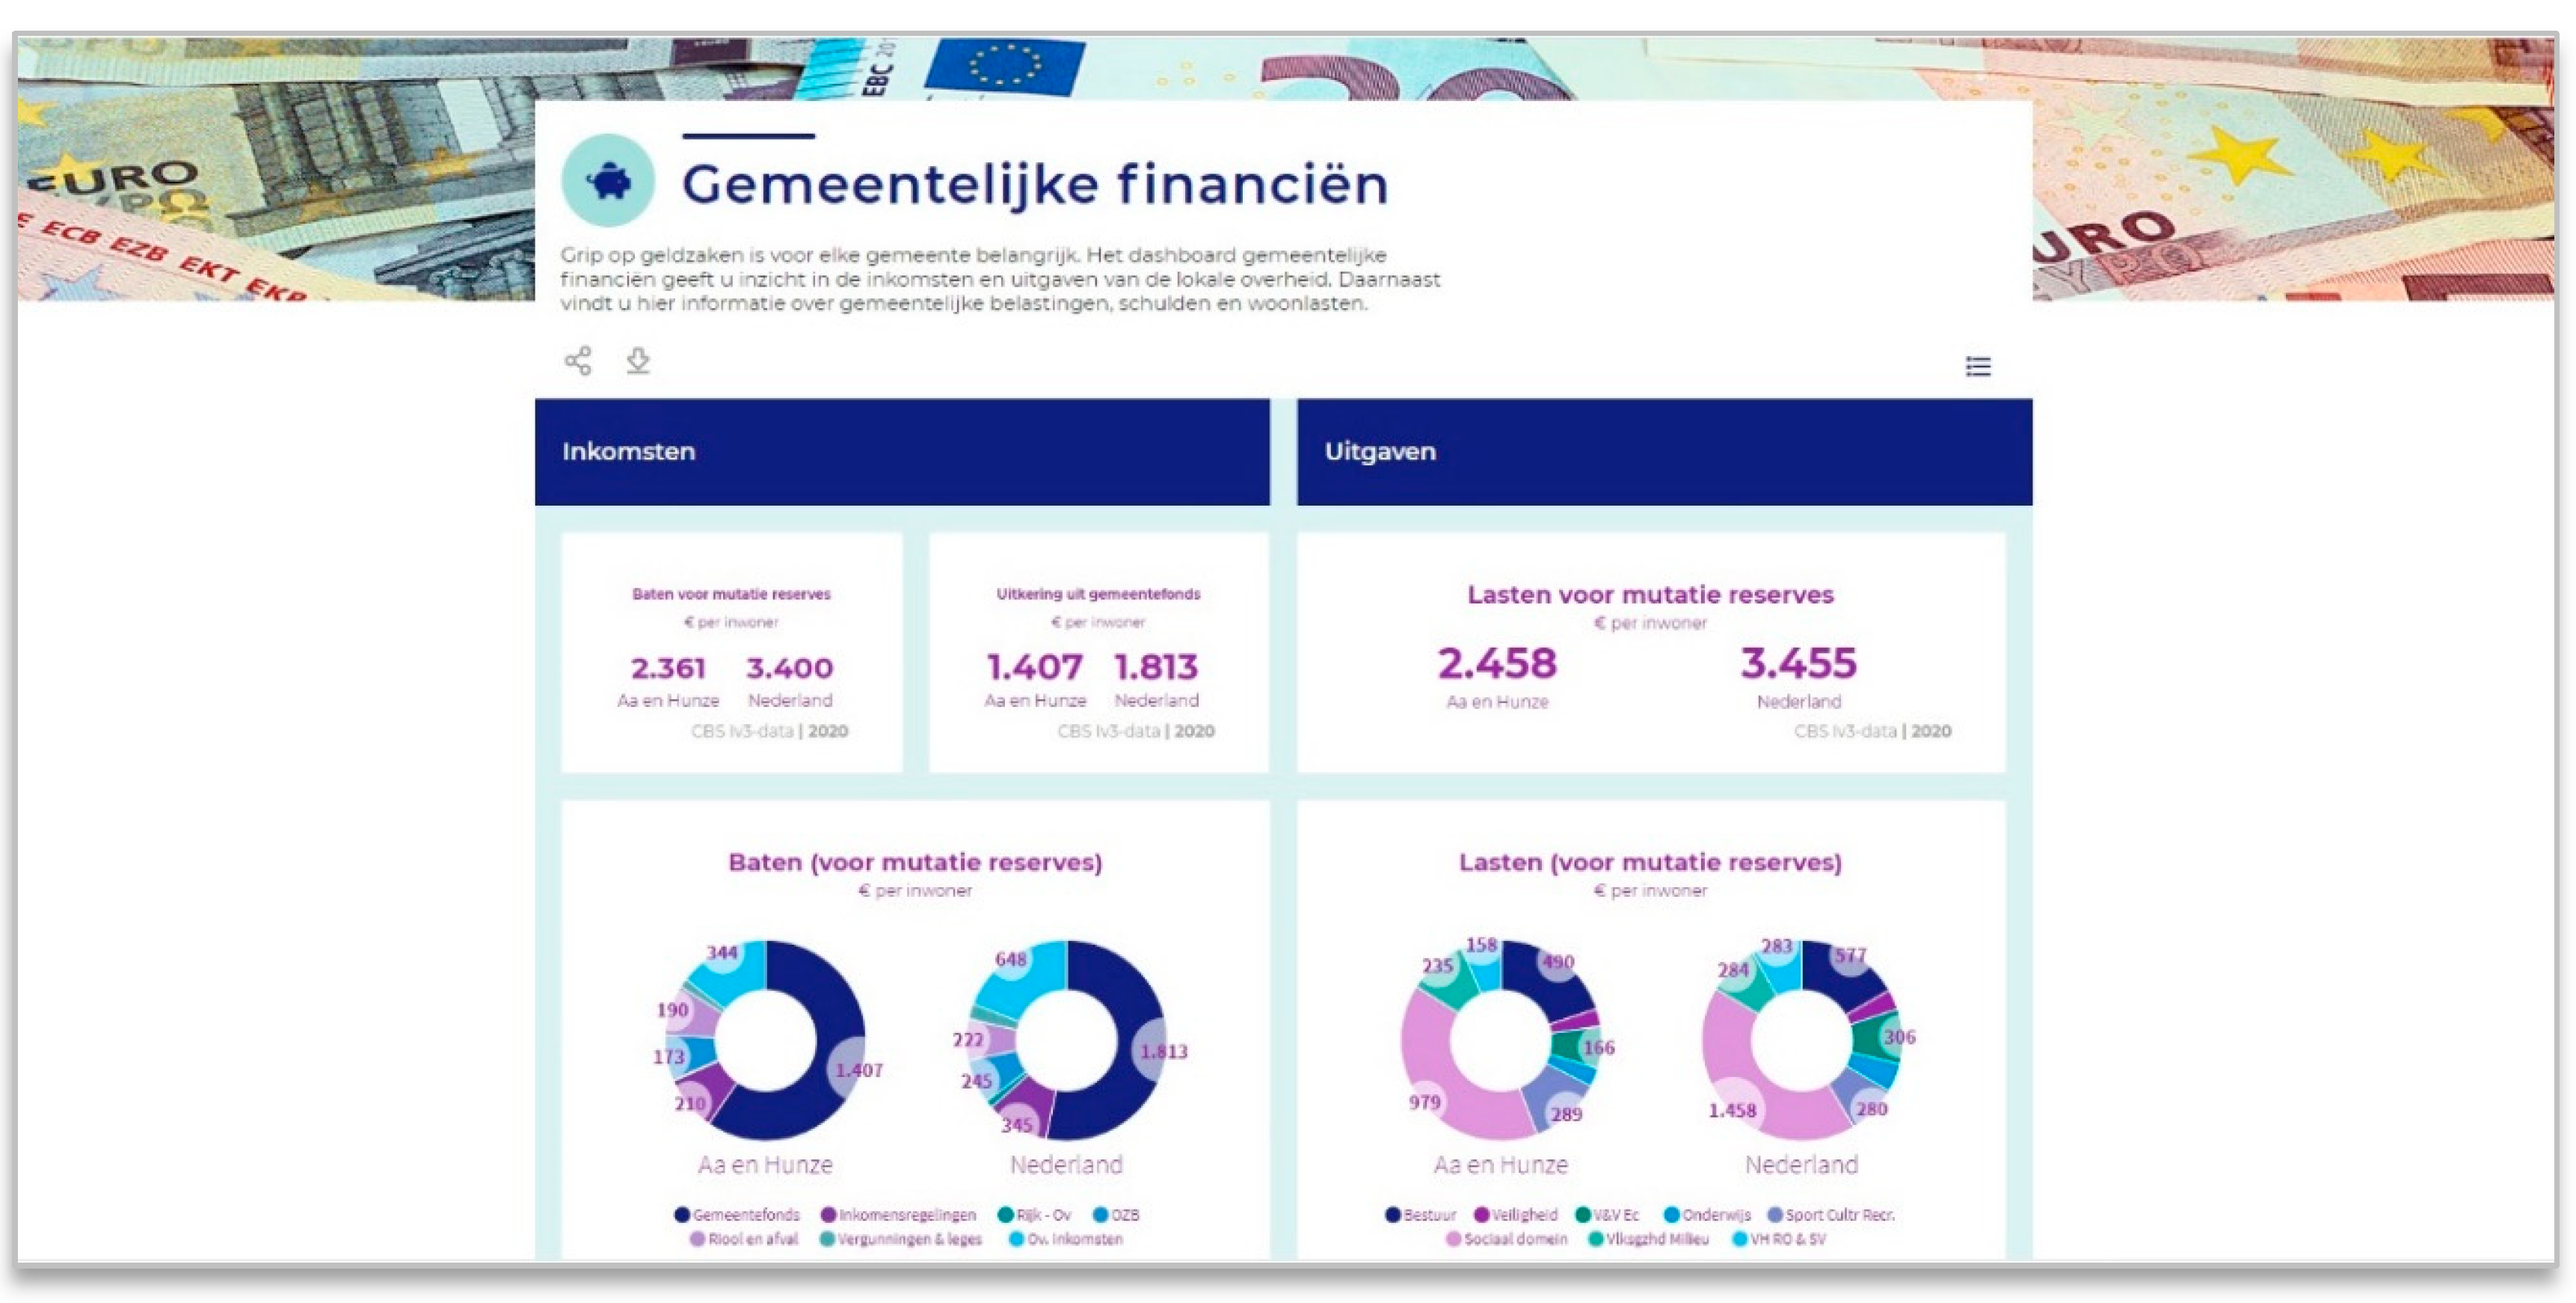
4.2.1. Waarstaatjegemeente.nl
This dashboard, which primarily makes use of data within the Netherlands from various organisations, including the Dutch Bureau of Statistics (CBS) and the Dutch Land Registry (Kadaster), presents data for each “gemeente” (municipality) in the country based on thematic visualisations of various data attributes. The visualisation features include tabular, chart, numerical and geographic visualisations and are available for download in PDF, CSV and Excel format. Within each thematic page, there are several data tiles illustrating the aggregated data relating to a specific data point for all municipalities. Clicking on one of these tiles allows the user the access the database behind each tile from a specific data provider, and the database is presented in the user interface as an interactive dashboard.
Within the database dashboard, the user can browse the data in more depth by filtering and searching for data points based on one or more municipalities. The visualisation features contained within this dashboard support both chart and table visualisations and themes, title and colours can be applied to visualisations for sharing purposes (see Figure 7 below). Here, users are also able to interact with temporal data. The usability features available in this dashboard include the downloading of results in CSV, PDF, Excel as well as Word and PowerPoint presentations. Additionally, the results of a specific analysis can also be downloaded as an XML file with the ability to integrate the findings within the users’ own Swing.EU Workspace, the platform which supports this dashboard. This dashboard is platform-independent but is not available as a library.
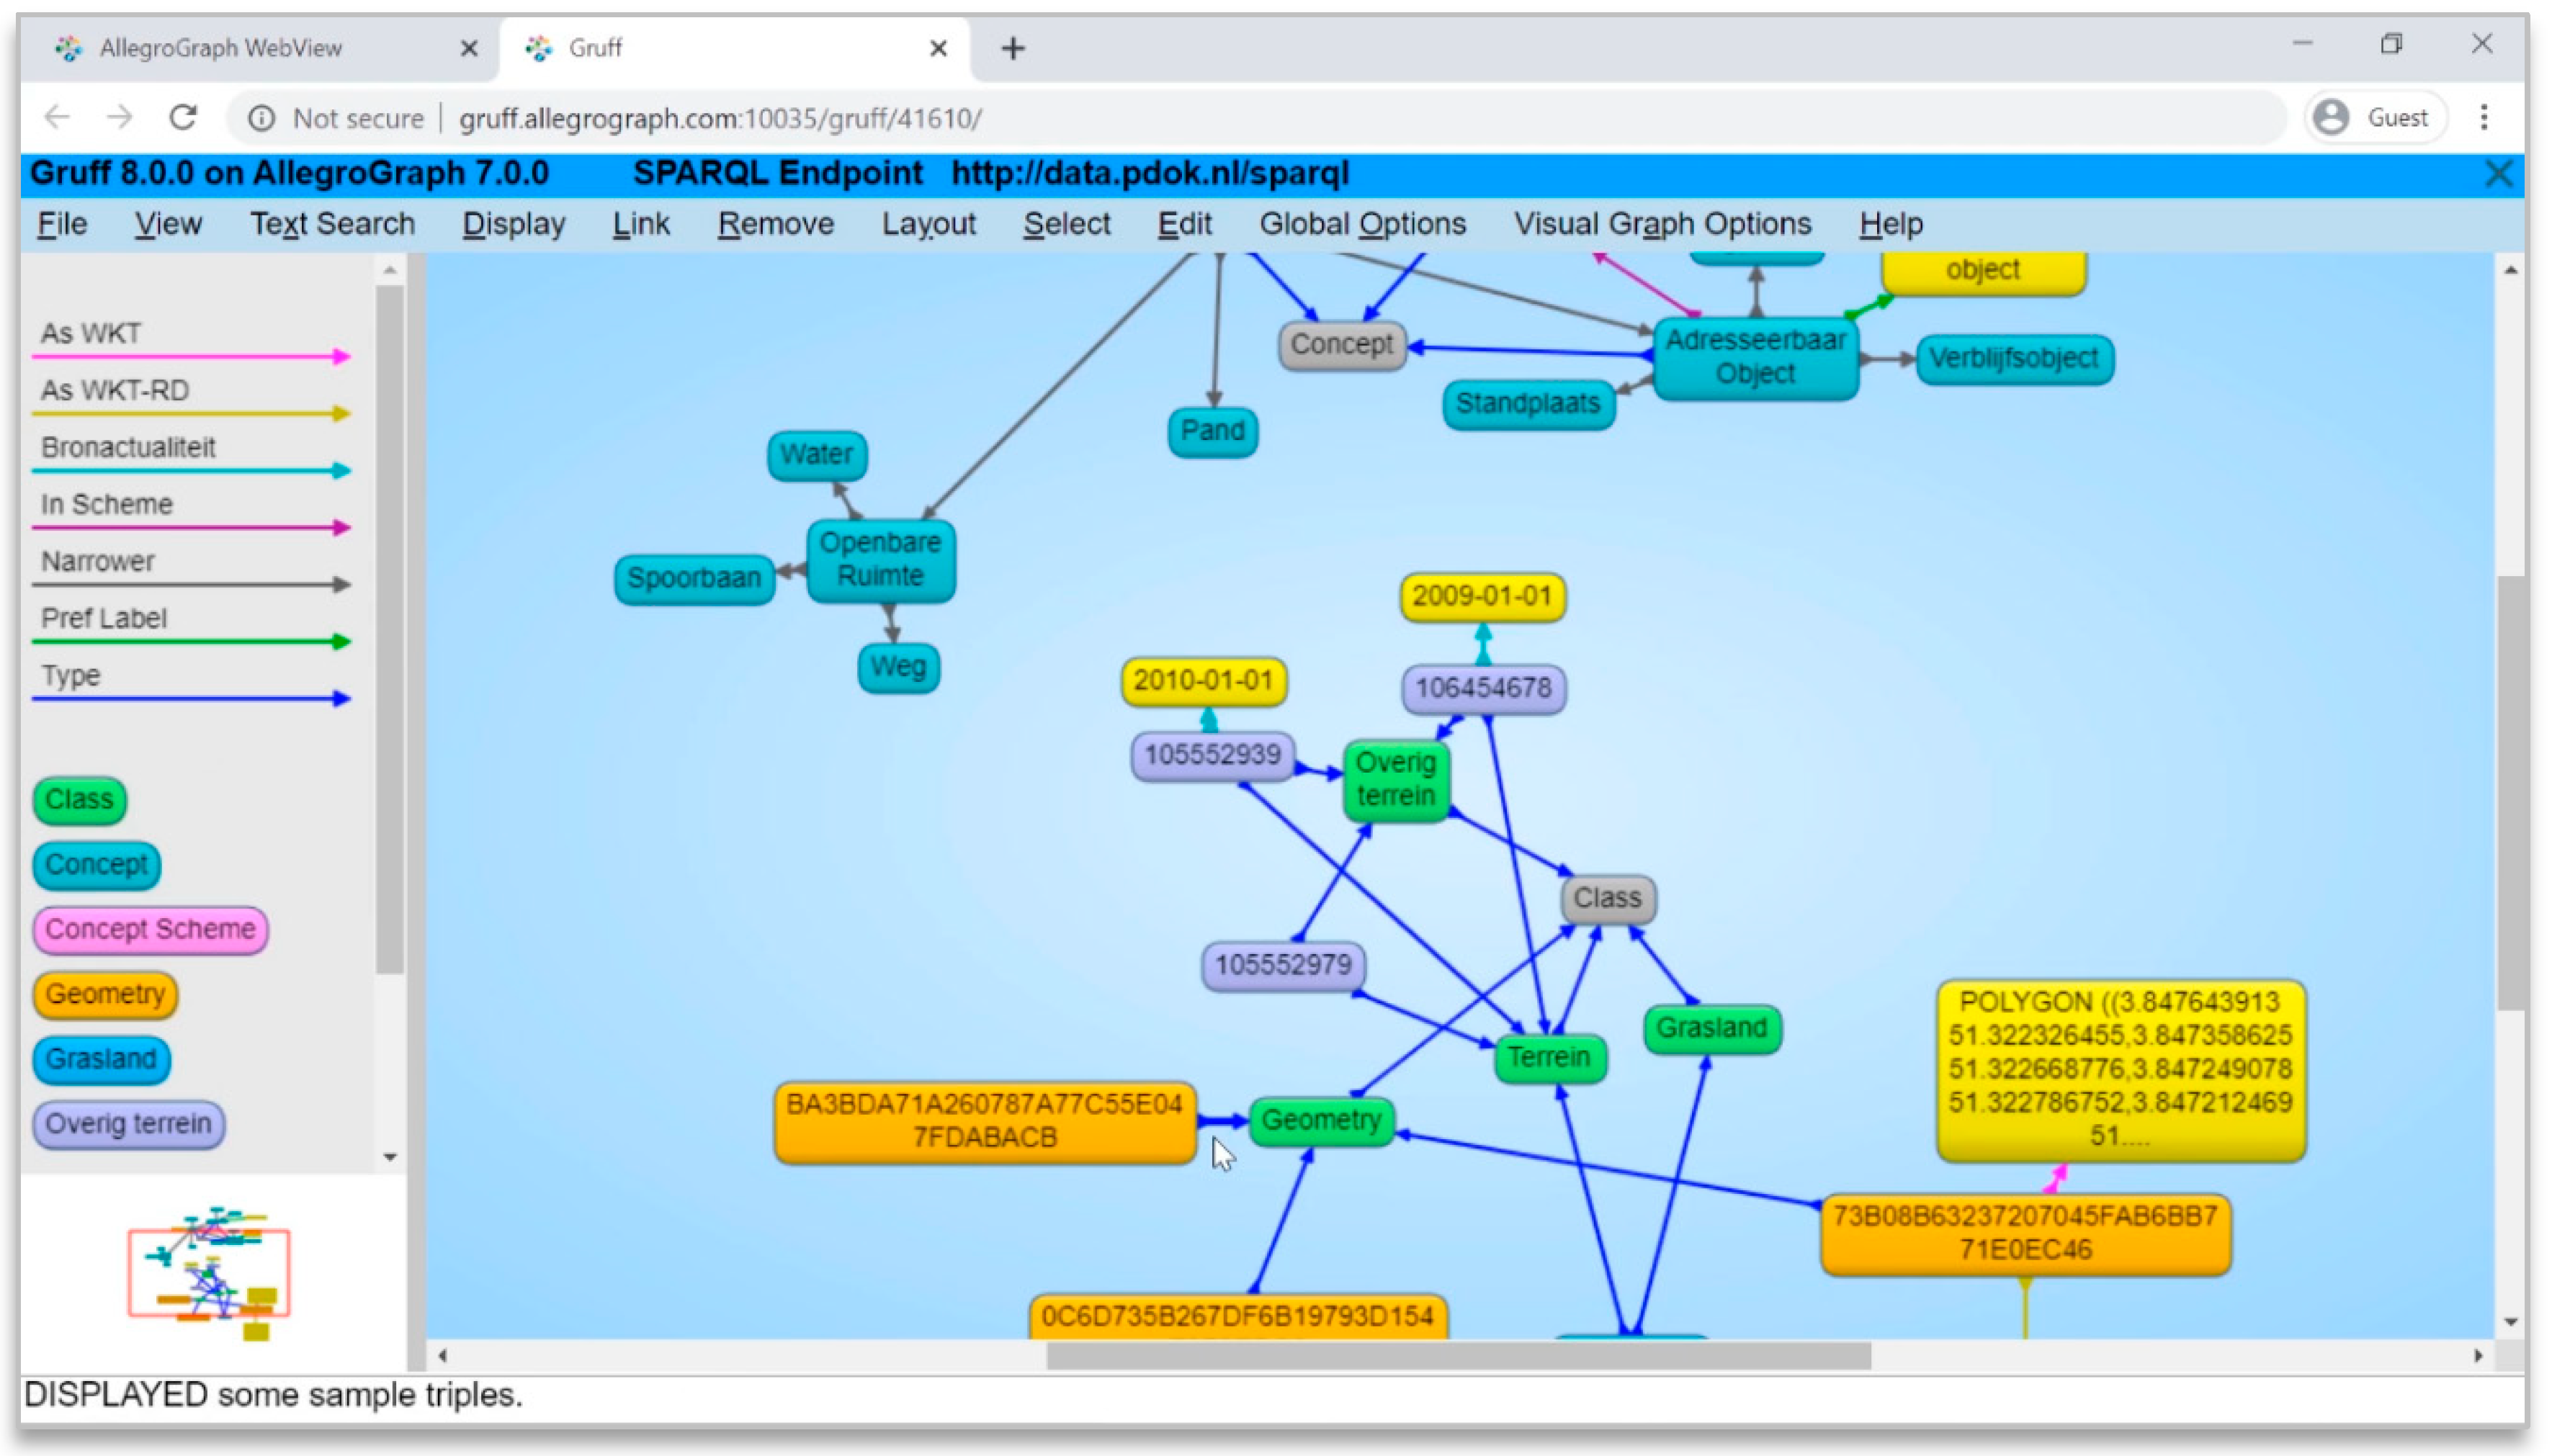
4.2.2. Allegrograph—Gruff
Gruff, developed by Allegrograph, allows for the visualisation of knowledge graphs in an interactive user interface to support complex analysis of enterprise data. Data within the dashboard application can be visualised as either a (knowledge) graph (illustrated in Figure 8 below) or a table containing the properties of data, and data can be interacted with based on the filtering and searching of these properties within the user interface. This application has a unique ‘Time Machine’ feature which allows for the exploration of connections within the data based on a given temporal context. In terms of the applications applicability features, the application can be deemed platform-independent based on the fact that it is browser-based. The application loads multiple endpoints but does not have endpoint-searching functionality.
The application allows data visualised and selected in the graph interface to be loaded into a graphical query builder to allow for query building. This makes the querying of the SPARQL endpoint loaded by the user to be a more easily accessible function to non-expert users of SPARQL. Within the graphical query builder, users can model relationships contained within a query by drawing relationships between the variable nodes. The query builder is easily switched to the SPARQL query interface for manual manipulation of the query, where the results are rendered in both tabular, chart and graph-based visualisations. The results can also be downloaded in CSV format. This application is not available as a library.
5. Discussion: What Are the Features of SSGIS?
The purpose of developing and implementing a self-service GIS is to bring geoinformation closer the end-user, allowing for better accessibility, interaction, reuse and sharing of existing geoinformation as well as the potential for combining this spatial information with other, non-spatial data. In the previous section, a review of current linked data (self-service) tooling was carried out to identify what the features along given categories of each were. The discussion that follows puts forward the argument that, based on this review, certain features may be necessary inclusions in SSGIS. This is not to say that these features in isolation are key to the realisation of SSGIS in particular. Rather, because SSGIS is arguably based on the intersection of self-service tooling, linked data tooling and web-based GIS, these features should be seen as inspiration on the road to realising SSGIS. It should be recognised as seen in the range of features seen across the above-mentioned applications, that these features can be treated as a ‘pick-and-mix’ wherein features are chosen based on their relevance to the end-user and the ability of each to be implemented given existing architectural constraints. What follows is intended to pose questions as to what the intended context of an SSGIS is and, therefore, what features can be included to offer end-users the best experience.
5.1. Visualisation Features
While the nature of a self-service GIS clearly implies that any application includes geovisualisation as a primary feature, the review of other applications clearly suggests the user demand for tabular and chart visualisations in a self-service environment and that these are widely available for integration. Chart visualisation may be particularly important where some level of analytical functionality is included in the application, and what type of chart visualisations are included depends on what the end-user is looking to achieve or what questions an end-user is looking to answer in making use of the SSGIS application. The review above identified very few applications which were centred around geovisualisation, providing this as an option rather than as the main visualisation feature. Arguably, however, an SSGIS tool does not necessarily have to include geovisualisation as a primary feature as long as the tool makes use of spatial data at some level with geovisualisation prioritised as the feature which supports better user engagement and experience [33]. As such, a tool may still be designated as SSGIS where a query returns the name of a city or street (spatial data) but does not visualise its location on a map.
5.2. Applicability Features
While including the applicability features outlined in the review above is not mandatory for the realisation of self-service GIS, where the goal is to produce a self-service application based on web technologies, platform independence is a natural feature of the application. The advantage of using web technologies based on open standards is that interoperability is easier to achieve and platform independence is a by-product of this, wherein applications and tools are easily run on any operating system. Arguably, the ability to load data from multiple endpoints should be a priority in an SSGIS application with the goal of combining spatial and non-spatial data to form better insights or answer specific spatial questions. The availability of a library feature is only important where developers are looking to make use of open-source software and integrate a small project into the larger SSGIS project, a feature which is likely to present more opportunities to include interactivity, analytical and usability features.
5.3. Interactivity and Usability Features
The level of interactivity included in an SSGIS is completely dependent on the goal of the application, the type of data the application is using as well as the type of questions end-users are looking to answer through the application. Either search or filter interactivity, or indeed both, were included in nearly all of the tools and applications reviewed, reflecting the general need for users to be able to search for specific data instances and filter out certain information that may not be relevant. This may, of course, be generally true for all web-based or self-service tooling, but the importance in this finding is that this should not be ignored when implementing SSGIS. It may be seen as a requirement as the user seeks to interact with the tooling and data. Interactivity features to some degree ought to, by definition, be included in any SSGIS application regardless of the level of complexity of the application because users need to be able to interact with the data contained in the application in order to gather the insights or visualise the data they require.
As an extension of this, the usability feature inclusions may, in part, allow for data to be combined from other sources based on the file upload. Where an application is based on (semantic) web technologies, however, this uploading of external data requires some transformation for compatibility to existing data on the application as well as some level of data validation. Any inclusion of this feature should take account of how these processes can be integrated in a user-friendly manner. Additionally, many of the tooling and applications reviewed allowed for either downloading of the results or other forms of sharing (social media, presentation, imbedding in web pages), pointing to a general demand amongst users of being able to share findings with others in their communities. This need to share findings also extends to the retention of any querying that the user is able to do, either through an API or within the querying interface itself, although this feature is not common with current tooling examples. It is likely that there are other usability features which should be included in an interface to allow for easier user-experience and can be identified based on the target user group and the goal of the application.
5.4. Advanced Analytics
Following the understanding that self-service GIS inherently means that the user is able to interact with the data available through the application, the question of whether these data are available for manipulation by application features is posed. Where the goal of an application is to allow end-users to analyse data in making use of geoprocessing, data manipulation, querying or otherwise, advanced analytics features should be included in the features of said application. What the exact make-up of these features is depends on the capabilities of the application itself as well as what types of questions end-users are looking to answer in making use of the application. It is unlikely that an SSGIS has the same level of functionality as commercially available GIS software, because this would make the target user group GIS experts, which generally have their needs met through these proprietary applications. Because the target user group is more likely to consist of non-experts, care should be taken to limit the analytic functionality to a level where the user is comfortable but is still able to answer complex questions.
While it may be true that there is some level of generality in the feature inclusions in an SSGIS, such as geo-visualisation, interactivity and results sharing as well as a level of analytic functionality, the exact features of an SSGIS application are highly context-specific. Although SSGIS applications are, by definition, seeking to cater to the needs of the non-expert user in answering spatial questions, the range of user requirements within this user group is still wide. Additionally, what spatial questions the application is attempting to cater for in providing a service also dictates which features are necessary and which would add unnecessary complexity for the user. In defining the features of SSGIS, then, it should be these end-user needs which ultimately guide feature selection within a given architectural setup. As such, future research and implementations of SSGIS should base feature inclusion choices on a thorough review of the types of spatial questions which are likely to be asked by the end-user in using the application and what functionality will be necessary to make answering these possible in a user-friendly and efficient manner.
6. Conclusions
In this paper, the current technological disjoint between the GIS, IS and CS fields are presented with a particular focus on the way in which the former has not yet fully realised the potential that the combination of web GIS and semantic web technologies have, particularly with regards to the conceptualisation of self-service GIS. Self-service GIS is herein defined as a web-based GIS interface which includes the basic functionalities of GIS with the goal of allowing non-expert users to interact with geoinformation on the web in a self-service manner. It is argued here that this definition is best supported by semantic technologies due to the advantages this brings for interoperability and accessibility of geoinformation from heterogeneous sources on the web. This definition serves to embrace the openness and vision of the web in making use of open standards and open data; bringing both spatial and non-spatial data on the web closer to the end-user. Inspiration for a fully realised SSGIS can be drawn from other browsers and viewers on aspects of self-service functionality for the end-user.
While linked data and semantic web technologies are not new technologies, their uptake in a range of industries has been slow, perhaps due to limited tooling to support these endeavours. With the goal of providing insight into what tooling does exist and which can be used to support the realisation of self-service GIS in a range of contexts, this paper presents a tooling review of Linked Data tools and discusses what features could support self-service GIS. While certain necessary features are easily identified based on the definition of self-service GIS, the exact choices that should be made on feature inclusions in a given application remain highly dependent on context and user needs.
While there is currently a general lack of geo-centric self-service tooling, with many tooling examples opting to provide geovisualisation features as an option rather than the primary visualisation feature, self-service GIS can still be realised when a tool still makes use of spatial information, allowing the user to engage with spatial data on some level. As such, existing tooling does have the potential to support self-service GIS in a range of contexts. While geovisualisation need not be an integral part of self-service GIS, it is argued that user experience and engagement with spatial data might be improved where geovisualisation is possible; particularly where the target audience is the non-expert user. Being able to share an analysis with others through means of geovisualisation arguably makes spatial information far more accessible and should be prioritised in a self-service GIS application. Future implementations of self-service GIS should engage the end-user in the design process of said application, identifying the core features of this application and balancing the potential complexity of the application by including with the underlying architectural requirements for this complexity.
Funding
This research received no external funding.
Conflicts of Interest
The authors declare no conflict of interest.
Appendix A

Table A1.
Tooling Review Summary.
| Browsers and Viewers | Analytics Dashboards | |||||||||
|---|---|---|---|---|---|---|---|---|---|---|
| LD Map | Forest Explorer | Scottish Statistics Office | Ordnance Survey | Ontodia/Metaphacts | Voyager 2 | LD-VOWL | Waarstaatjegemeente.nl | Gruff | ||
| Visualisation Features | Graph | X | X | X | ||||||
| Tabular | X | X | X | X | X | |||||
| Chart | X | X | X | X | ||||||
| Geographic | X | X | X | X | X | |||||
| Applicability Features | Platform Independence | X | X | X | X | X | X | X | X | X |
| Available as Library | X | X | X | |||||||
| Multiple Endpoints | X | X | ||||||||
| Interactivity Features | Drag and Drop | X | X | X | ||||||
| Filtering | X | X | X | X | X | X | ||||
| Searching | X | X | X | X | X | X | X | |||
| Selection by Drawing | X | |||||||||
| Advanced Analytics | Geo-analytics | X | X | |||||||
| Data-analytics | X | X | ||||||||
| Querying | X | X | X | X | X | X | ||||
| Temporal | X | X | X | X | X | |||||
| Usability Features | (Query) Retention | X | X | |||||||
| File Upload | X | X | ||||||||
| Results Download | X | X | X | X | X | X | ||||
| Endpoint Search | X | |||||||||
| Query Builder | X | |||||||||
References
- Lemmens, R.; Wytzisk, A.; By, R.D.; Granell, C.; Gould, M.; van Oosterom, P. Integrating Semantic and Syntactic Descriptions to Chain Geographic Services. IEEE Internet Comput. 2006, 10, 42–52. [Google Scholar]
- Fu, P.; Sun, J. GIS in the Web Era. In Web GIS: Principles and Applications; USPS: Washington, DC, USA, 2011. [Google Scholar]
- Esri Enterprise. About Web GIS. n.d. Available online: https://enterprise.arcgis.com/en/server/latest/create-web-apps/windows/about-web-gis.htm (accessed on 15 October 2020).
- Zhang, C.; Zhao, T.; Li, W. Geospatial Semantic Web; Springer: Berlin/Heidelberg, Germany, 2015. [Google Scholar]
- Langley, D.J.; van Doorn, J.; Ng, I.C.L.; Stieglitz, S.; Lazovik, A.; Boonstra, A. The Internet of Everything: Smart Things and Their Impact on Business Models. J. Bus. Res. 2021, 122, 853–863. [Google Scholar] [CrossRef]
- Raggett, D. W3C Study of Practices and Tooling for Web Data Standardisation. W3C. 2017. Available online: https://www.w3.org/2017/12/odi-study/ (accessed on 12 September 2020).
- TNO. Standardisation of Semantics. n.d. Available online: https://www.tno.nl/en/focus-areas/information-communication-technology/roadmaps/efficiency-effectiveness-quality-and-the-costs-of-systems/scalable-it-systems/standardisation-of-semantics/ (accessed on 15 October 2020).
- Folmer, E.; Ronzhin, S.; Van Hillegersberg, J.; Beek, W.; Lemmens, R. Business Rationale for Linked Data at Governments: A Case Study at the Netherlands’ Kadaster Data Platform. IEEE Access 2020, 8, 70822–70835. [Google Scholar] [CrossRef]
- Reichardt, M. The Havoc of Non-Interoperability: An OpenGIS Consortium (OGC) White Paper. 2004. Available online: http://portal.opengeospatial.org/files/?artifact_id=5097 (accessed on 13 October 2020).
- Alameh, N. Service Chaining of Interoperable Geographic Information Web Services. 2010. Available online: http://web.mit.edu/nadinesa/www/paper2.pdf (accessed on 15 October 2020).
- Esri. Spatial Data Standards and GIS Interoperability White Paper. 2003. Available online: https://www.esri.com/library/whitepapers/pdfs/spatial-data-standards.pdf (accessed on 7 July 2020).
- Percivall, G. OGC’s Open Standards for Geospatial Interoperability. In Encyclopedia of GIS; Shekhar, S., Xiong, H., Zhou, X., Eds.; Springer: Cham, Switzerland, 2017. [Google Scholar] [CrossRef]
- Esri. Voorbereiden Op Een Web GIS-Migratie: Een Belangrike Verandering en Haalbaar Voor Elke Organisatie. Esri Mag. 2019. Available online: https://magazine.esri.nl/esri-magazine-2-2019/web-gis/ (accessed on 12 October 2020).
- Fu, P. Getting to Know Web GIS; Esri Press: Redlands, CA, USA, 2020. [Google Scholar]
- Peng, Z.R.; Tsou, M.H. Internet GIS-Distributed Geographic Information Services for the Internet and Wireless Networks; John Wiley and Sons: Hoboken, NJ, USA, 2003. [Google Scholar]
- Esri. Transformation and Opportunity. 2013. Available online: https://www.esri.com/about/newsroom/arcuser/transformation-and-opportunity/ (accessed on 20 September 2020).
- Zhang, F.; Cheng, J. Construction of RDF(S) from UML Class Diagrams. J. Comput. Inf. Technol. 2015, 22, 237. [Google Scholar]
- Bizer, C.; Cyganiak, R.; Heath, T. How to Publish Linked Data on the Web. 2007. Available online: http://wifo5-03.informatik.uni-mannheim.de/bizer/pub/LinkedDataTutorial/ (accessed on 20 September 2020).
- Tekli, J.; Rjeily, A.A.; Chbeir, R.; Tekli, G.; Houngue, P.; Yetongnon, K.; Abebe, M.A. Semantic to Intelligent Web Era. In Proceedings of the 5th International Conference on Management of Emergent Digital Ecosystems, Luxembourg, 29–31 October 2013; Association for Computing Machinery: New York, NY, USA. [Google Scholar]
- Guus, S.; Raimond, Y. RDF 1.1 Primer. W3C Working Group Note. 2014. Available online: http://www.w3.org/TR/rdf11-primer/ (accessed on 20 September 2020).
- Ontotext. What Is a Knowledge Graph? Available online: https://www.ontotext.com/knowledgehub/fundamentals/what-is-a-knowledge-graph/ (accessed on 15 October 2020).
- Lemmens, R.; Falquet, G.; Métral, C. Towards Linked Data and Ontology Development for the Semantic Enrichment of Volunteered Geo-Information. In Proceedings of the Link-VGI: Linking and Analyzing Volunteered Geographic Information (VGI) across Different Platforms, Workshop at the AGILE 2016 Conference, Helsinki, Finland, 14 June 2016. [Google Scholar]
- DBpedia. About. Available online: https://wiki.dbpedia.org/about (accessed on 15 October 2020).
- Yan, B. Geographic Knowledge Graph Summarisation. 2019. Available online: https://www.iospress.nl/book/geographic-knowledge-graph-summarization/ (accessed on 11 October 2020).
- Rohnzin, S.; Folmer, E.; Maria, P.; Brattinga, M.; Beek, W.; Lemmens, R.; van’t Veer, R. Kadaster Knowledge Graph: Beyond the Fifth Star of Open Data. Information 2019, 10, 310. [Google Scholar] [CrossRef] [Green Version]
- Zhu, Y. Geospatial semantics, ontology and knowledge graphs for big Earth data. Big Earth Data 2019, 3, 187–190. [Google Scholar] [CrossRef] [Green Version]
- Zhang, C.; Li, W.; Zhao, T. Geospatial data sharing based on geospatial semantic web technologies. J. Spat. Sci. 2010, 52, 35–49. [Google Scholar] [CrossRef]
- Karan, E.P.; Irizarry, J.; Haymaker, J. BIM and GIS Integration and Interoperability Based on Semantic Web Technology. J. Comput. Civ. Eng. 2016, 30, 04015043. [Google Scholar] [CrossRef]
- Akinci, B.; Karimi, H.; Pradhan, A.; Wu, C.C.; Fichtl, G. Chapter 9: CAD and GIS Interoperability through Semantic Web Services. In CAD and GIS Integration; CRC Press: Boca Raton, FL, USA, 2009. [Google Scholar]
- What Is the Potential for Self-Service GIS? Sensors and Systems, 15 July 2015. Available online: https://sensorsandsystems.com/what-is-the-potential-for-self-service-gis/ (accessed on 25 September 2020).
- Williams, T. Overcoming Resistance to Technology Change: A Linked Data Perspective. UCB Biosciences Inc., 2018. Available online: https://www.phusewiki.org/docs/Frankfut%20Connect%202018/TT/Papers/TT01-tt04-19214.pdf (accessed on 11 October 2020).
- Rietveld, L.; Hoekstra, R. The YASGUI family of SPARQL clients1. Semantic Web 2016, 8, 373–383. [Google Scholar] [CrossRef]
- Folmer, E.; Beek, W.; Rietveld, L.; Ronzhin, S.; Geerling, R.; den Haan, D. Enhancing the Usefulness of Open Governmental Data with Linked Data Viewing Techniques. In Proceedings of the 52nd Hawaii International Conference on System Sciences, Maui, HI, USA, 8–11 January 2019. [Google Scholar]
Figure 1.
Toponamenzoeker Linked Data Browser, using the search term “Koning”. Retrieved from: https://labs.kadaster.nl/demonstrators/namen-app/#/.
Figure 1.
Toponamenzoeker Linked Data Browser, using the search term “Koning”. Retrieved from: https://labs.kadaster.nl/demonstrators/namen-app/#/.
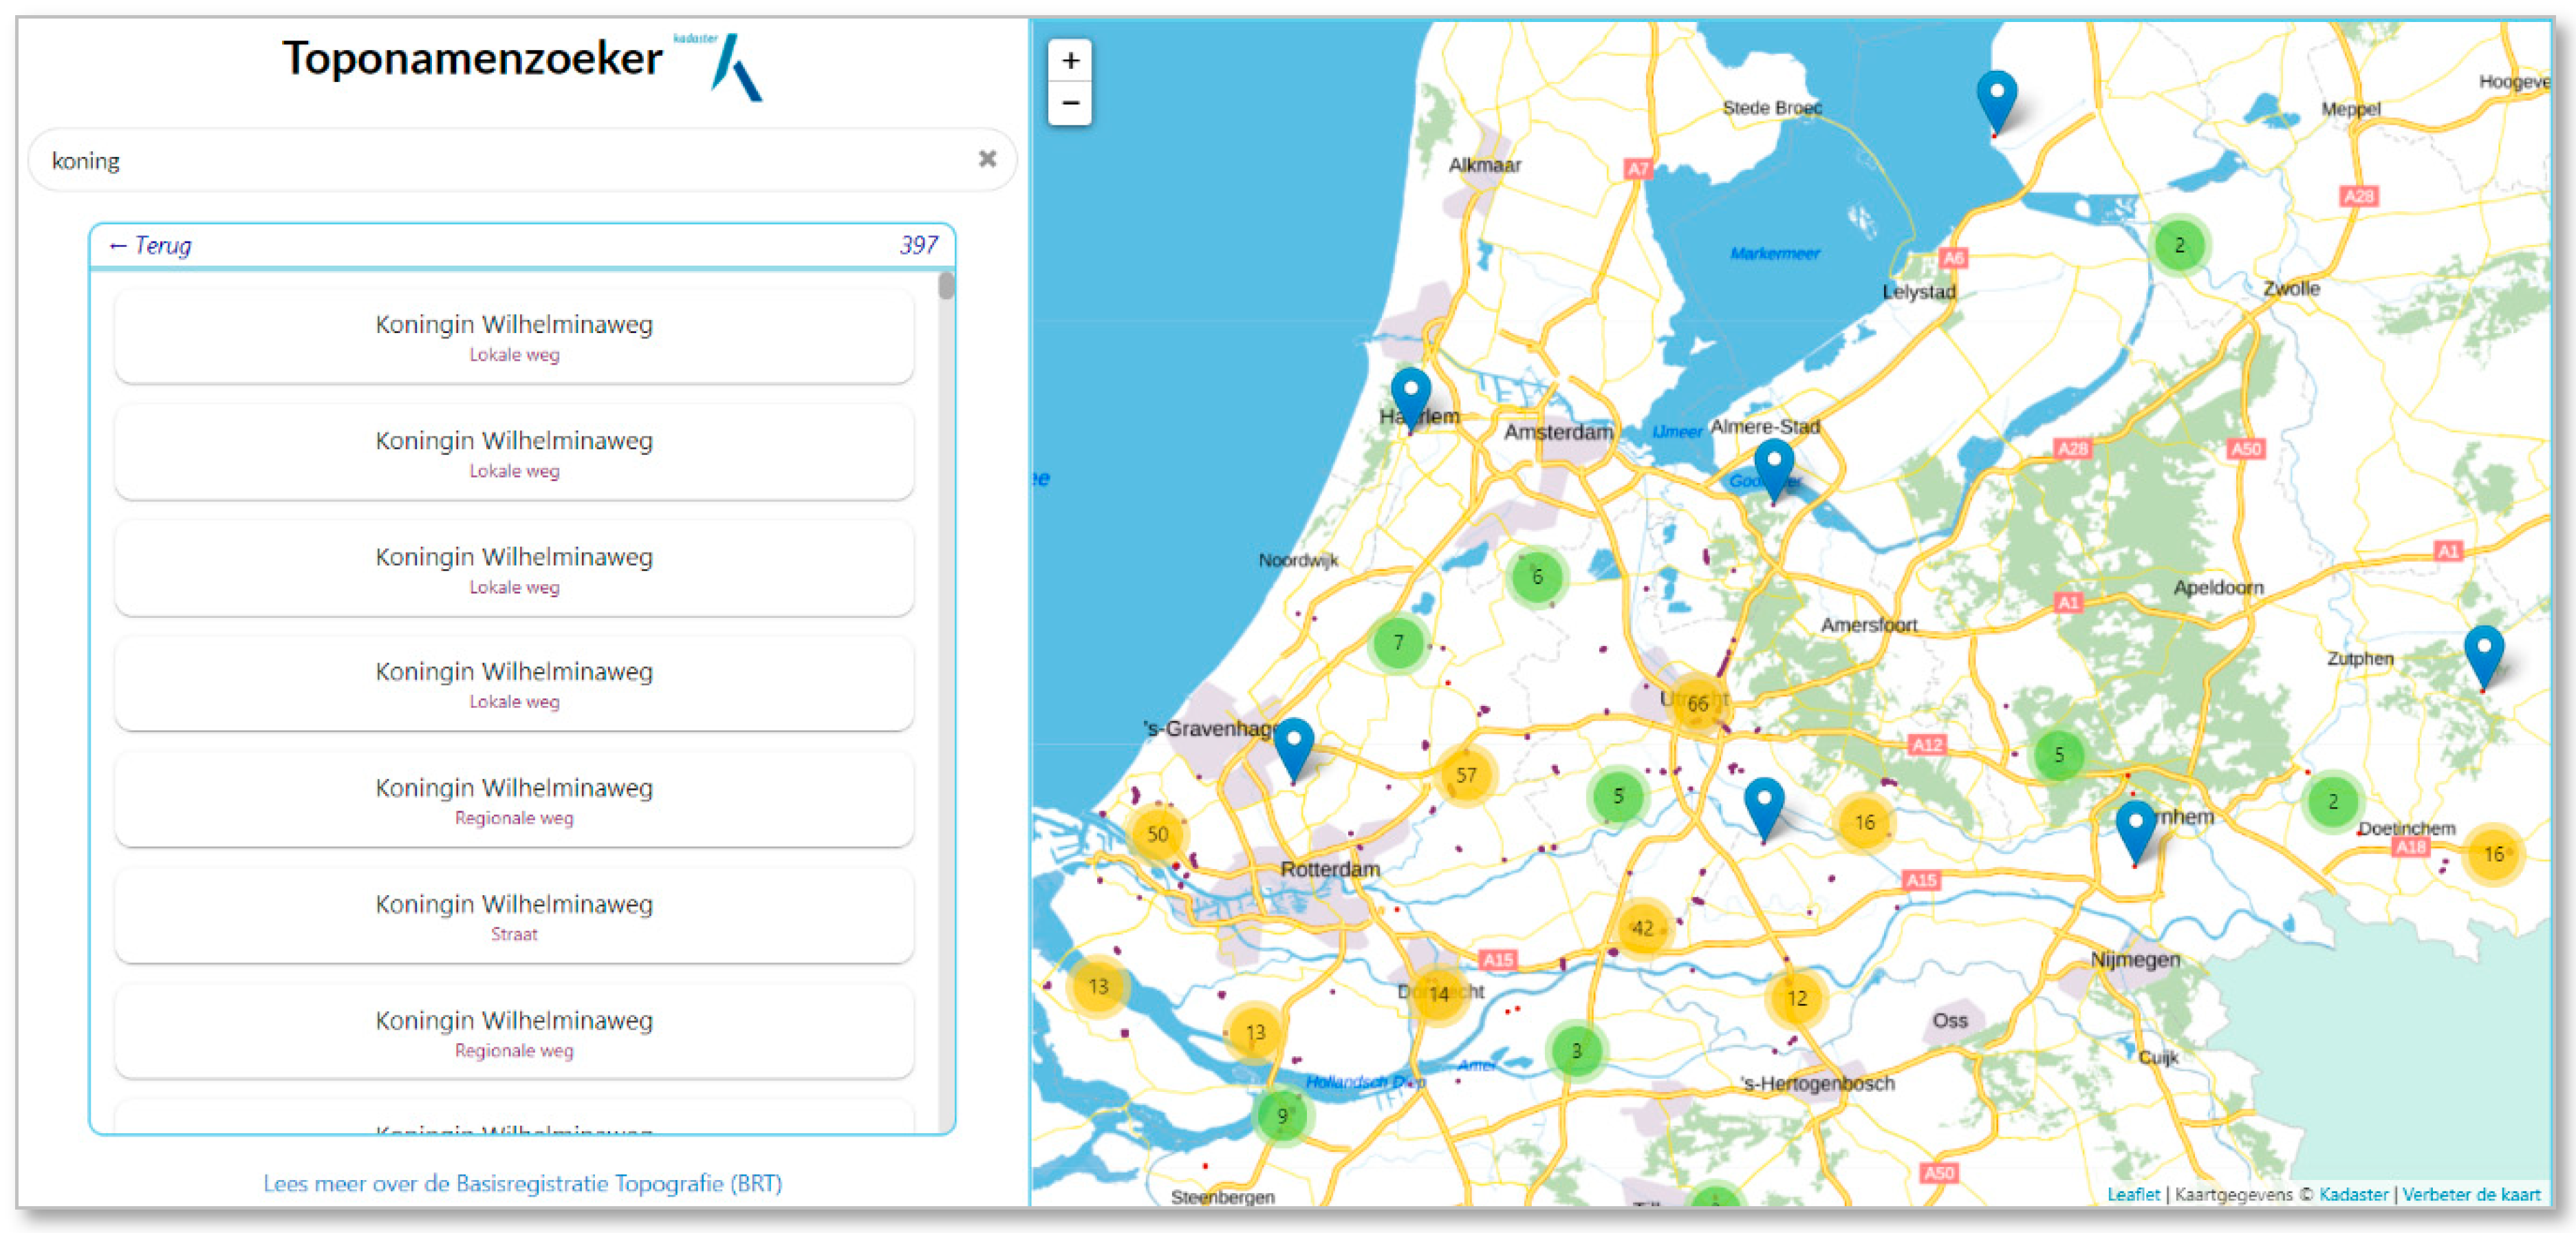
Figure 2.
Screenshots of Forest Explorer User Interface: (a) Forest Explorer at minimum zoom level showing Spanish provinces. (b) Forest Explorer at medium zoom level showing concentrations of trees within a particular zone. (c) Forest Explorer at full zoom level showing all trees contained in the dataset. Retrieved from: https://forestexplorer.gsic.uva.es/.

Figure 3.
Homepage: Scottish Statistics Office Linked Data Browser. Retrieved from: https://statistics.gov.scot/atlas/resource?uri=http://statistics.gov.scot/id/statistical-geography/S92000003.
Figure 3.
Homepage: Scottish Statistics Office Linked Data Browser. Retrieved from: https://statistics.gov.scot/atlas/resource?uri=http://statistics.gov.scot/id/statistical-geography/S92000003.

Figure 4.
Ontodia User Interface based on Example Dataset.
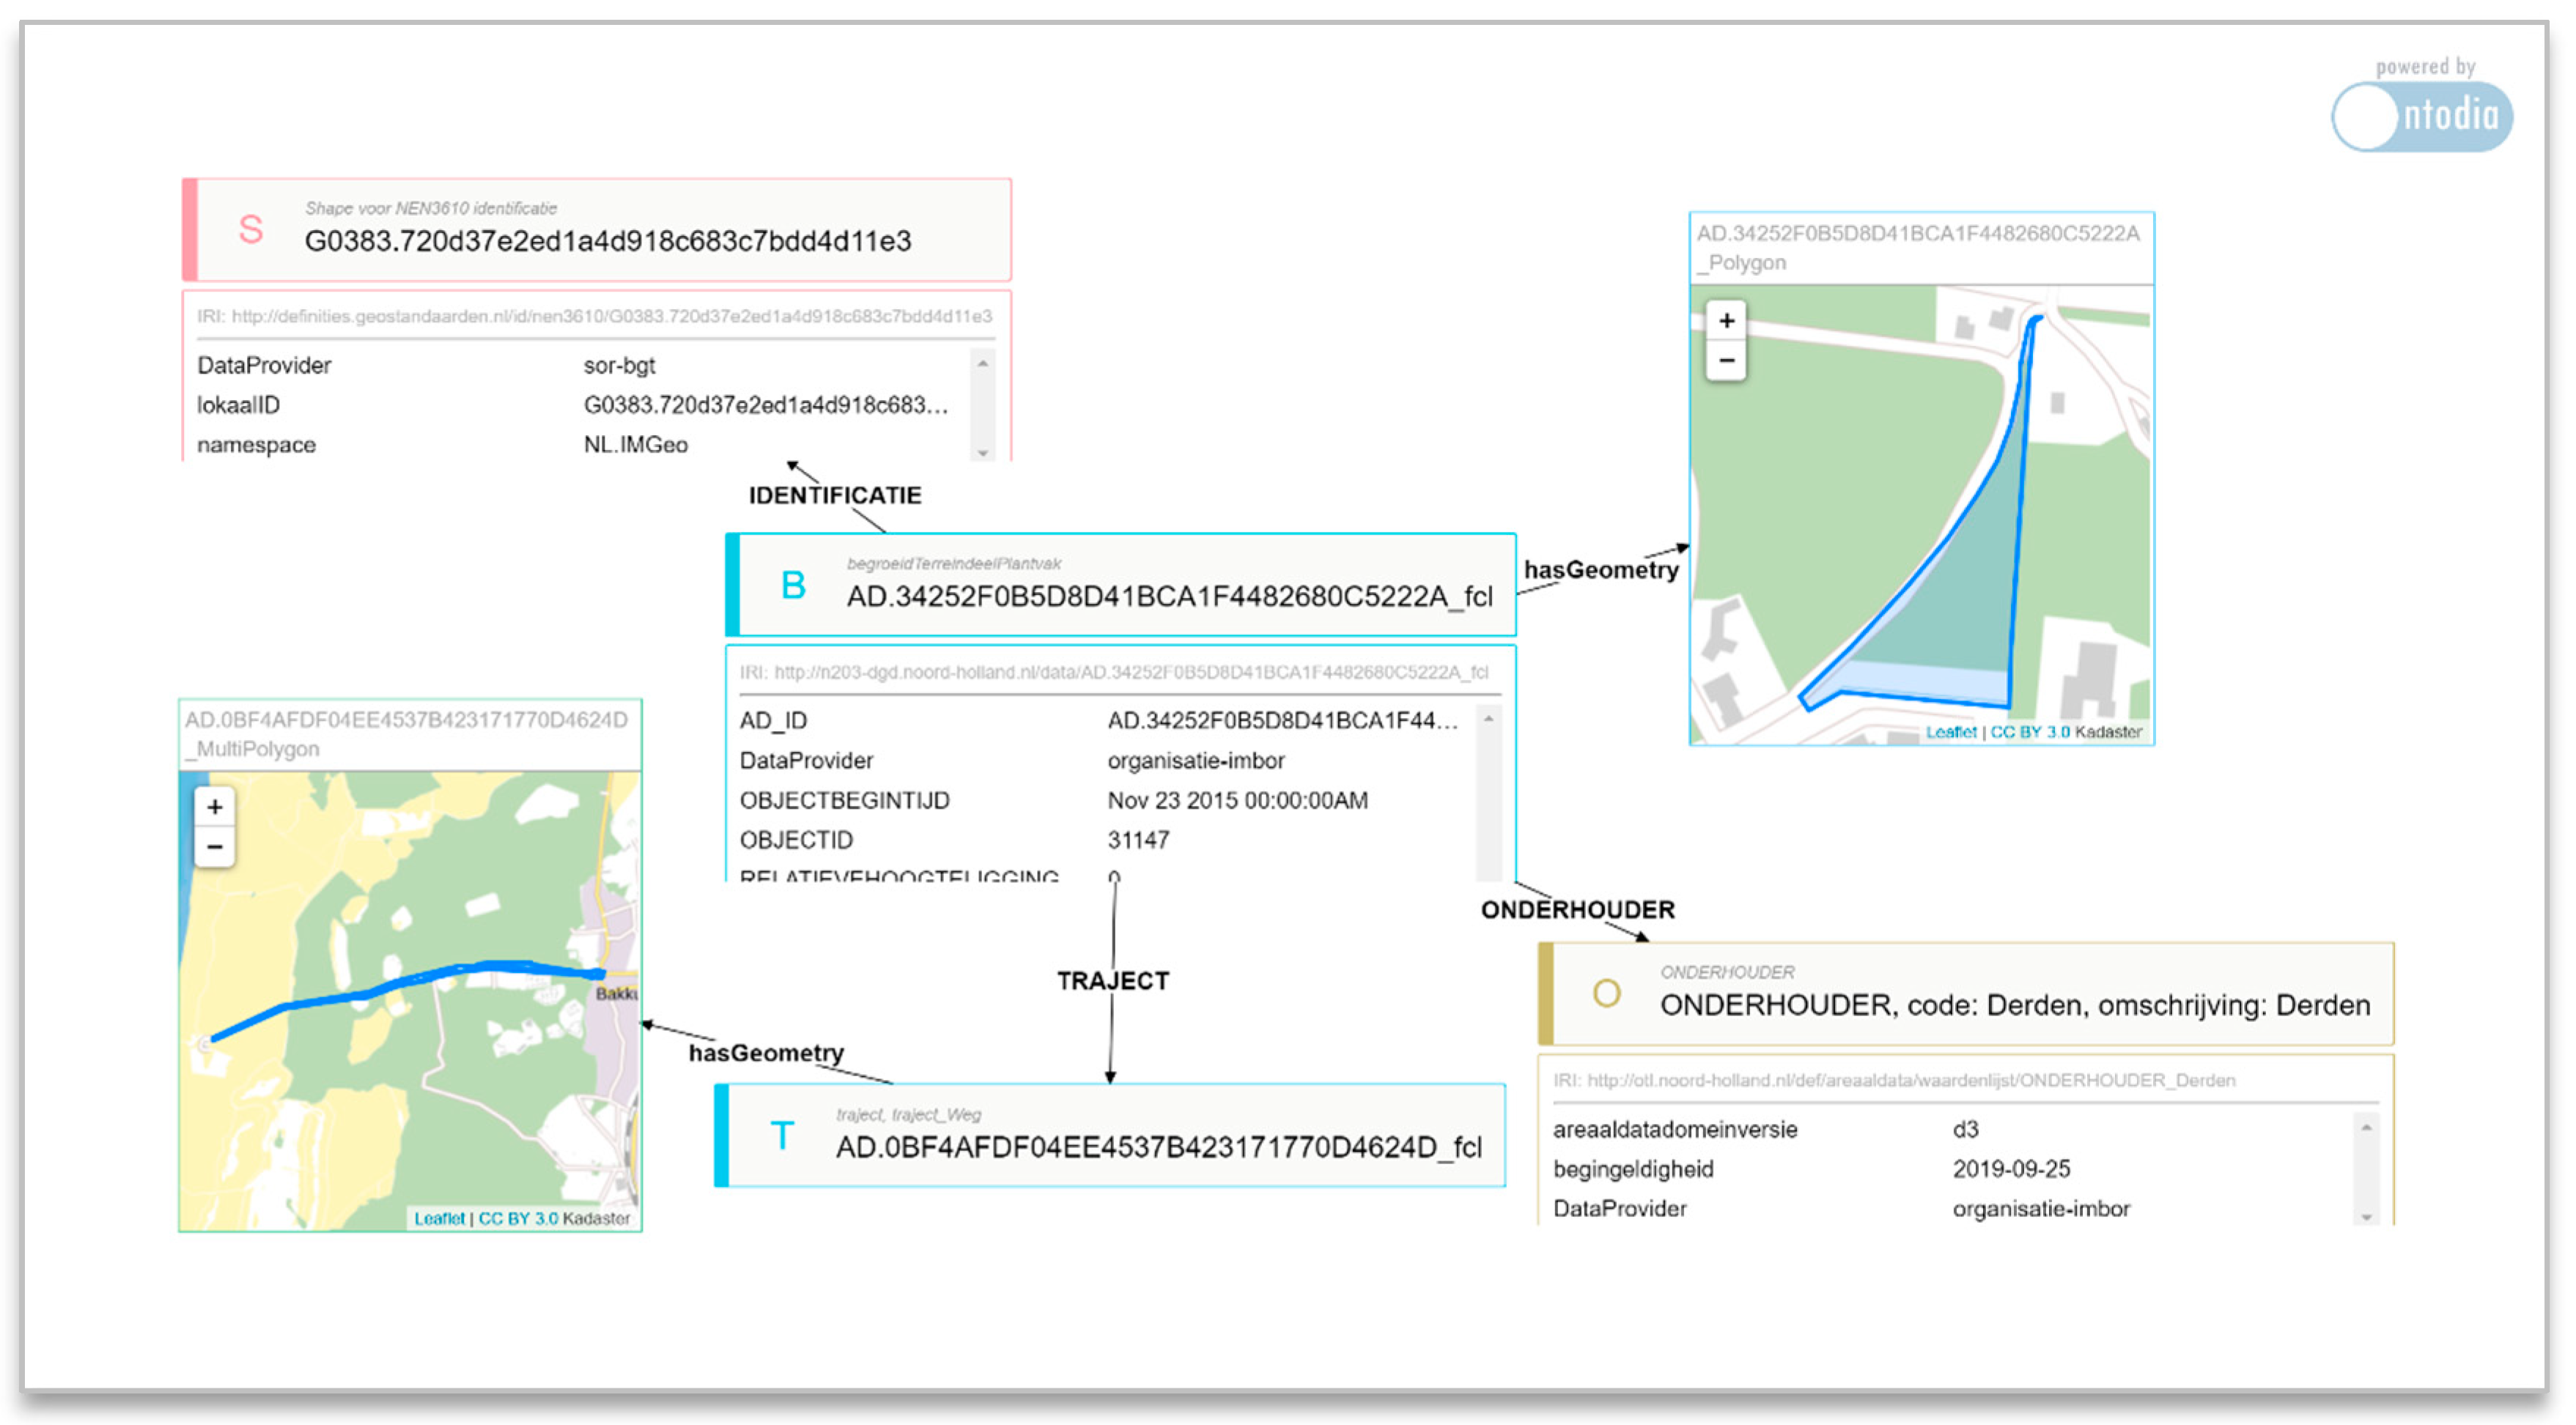
Figure 5.
Demonstration of the Use of Linked Data selection within a Business Intelligence (BI) tool, Voyager. Retrieved from: https://labs.kadaster.nl/assets/videos/voyager.webm.
Figure 5.
Demonstration of the Use of Linked Data selection within a Business Intelligence (BI) tool, Voyager. Retrieved from: https://labs.kadaster.nl/assets/videos/voyager.webm.
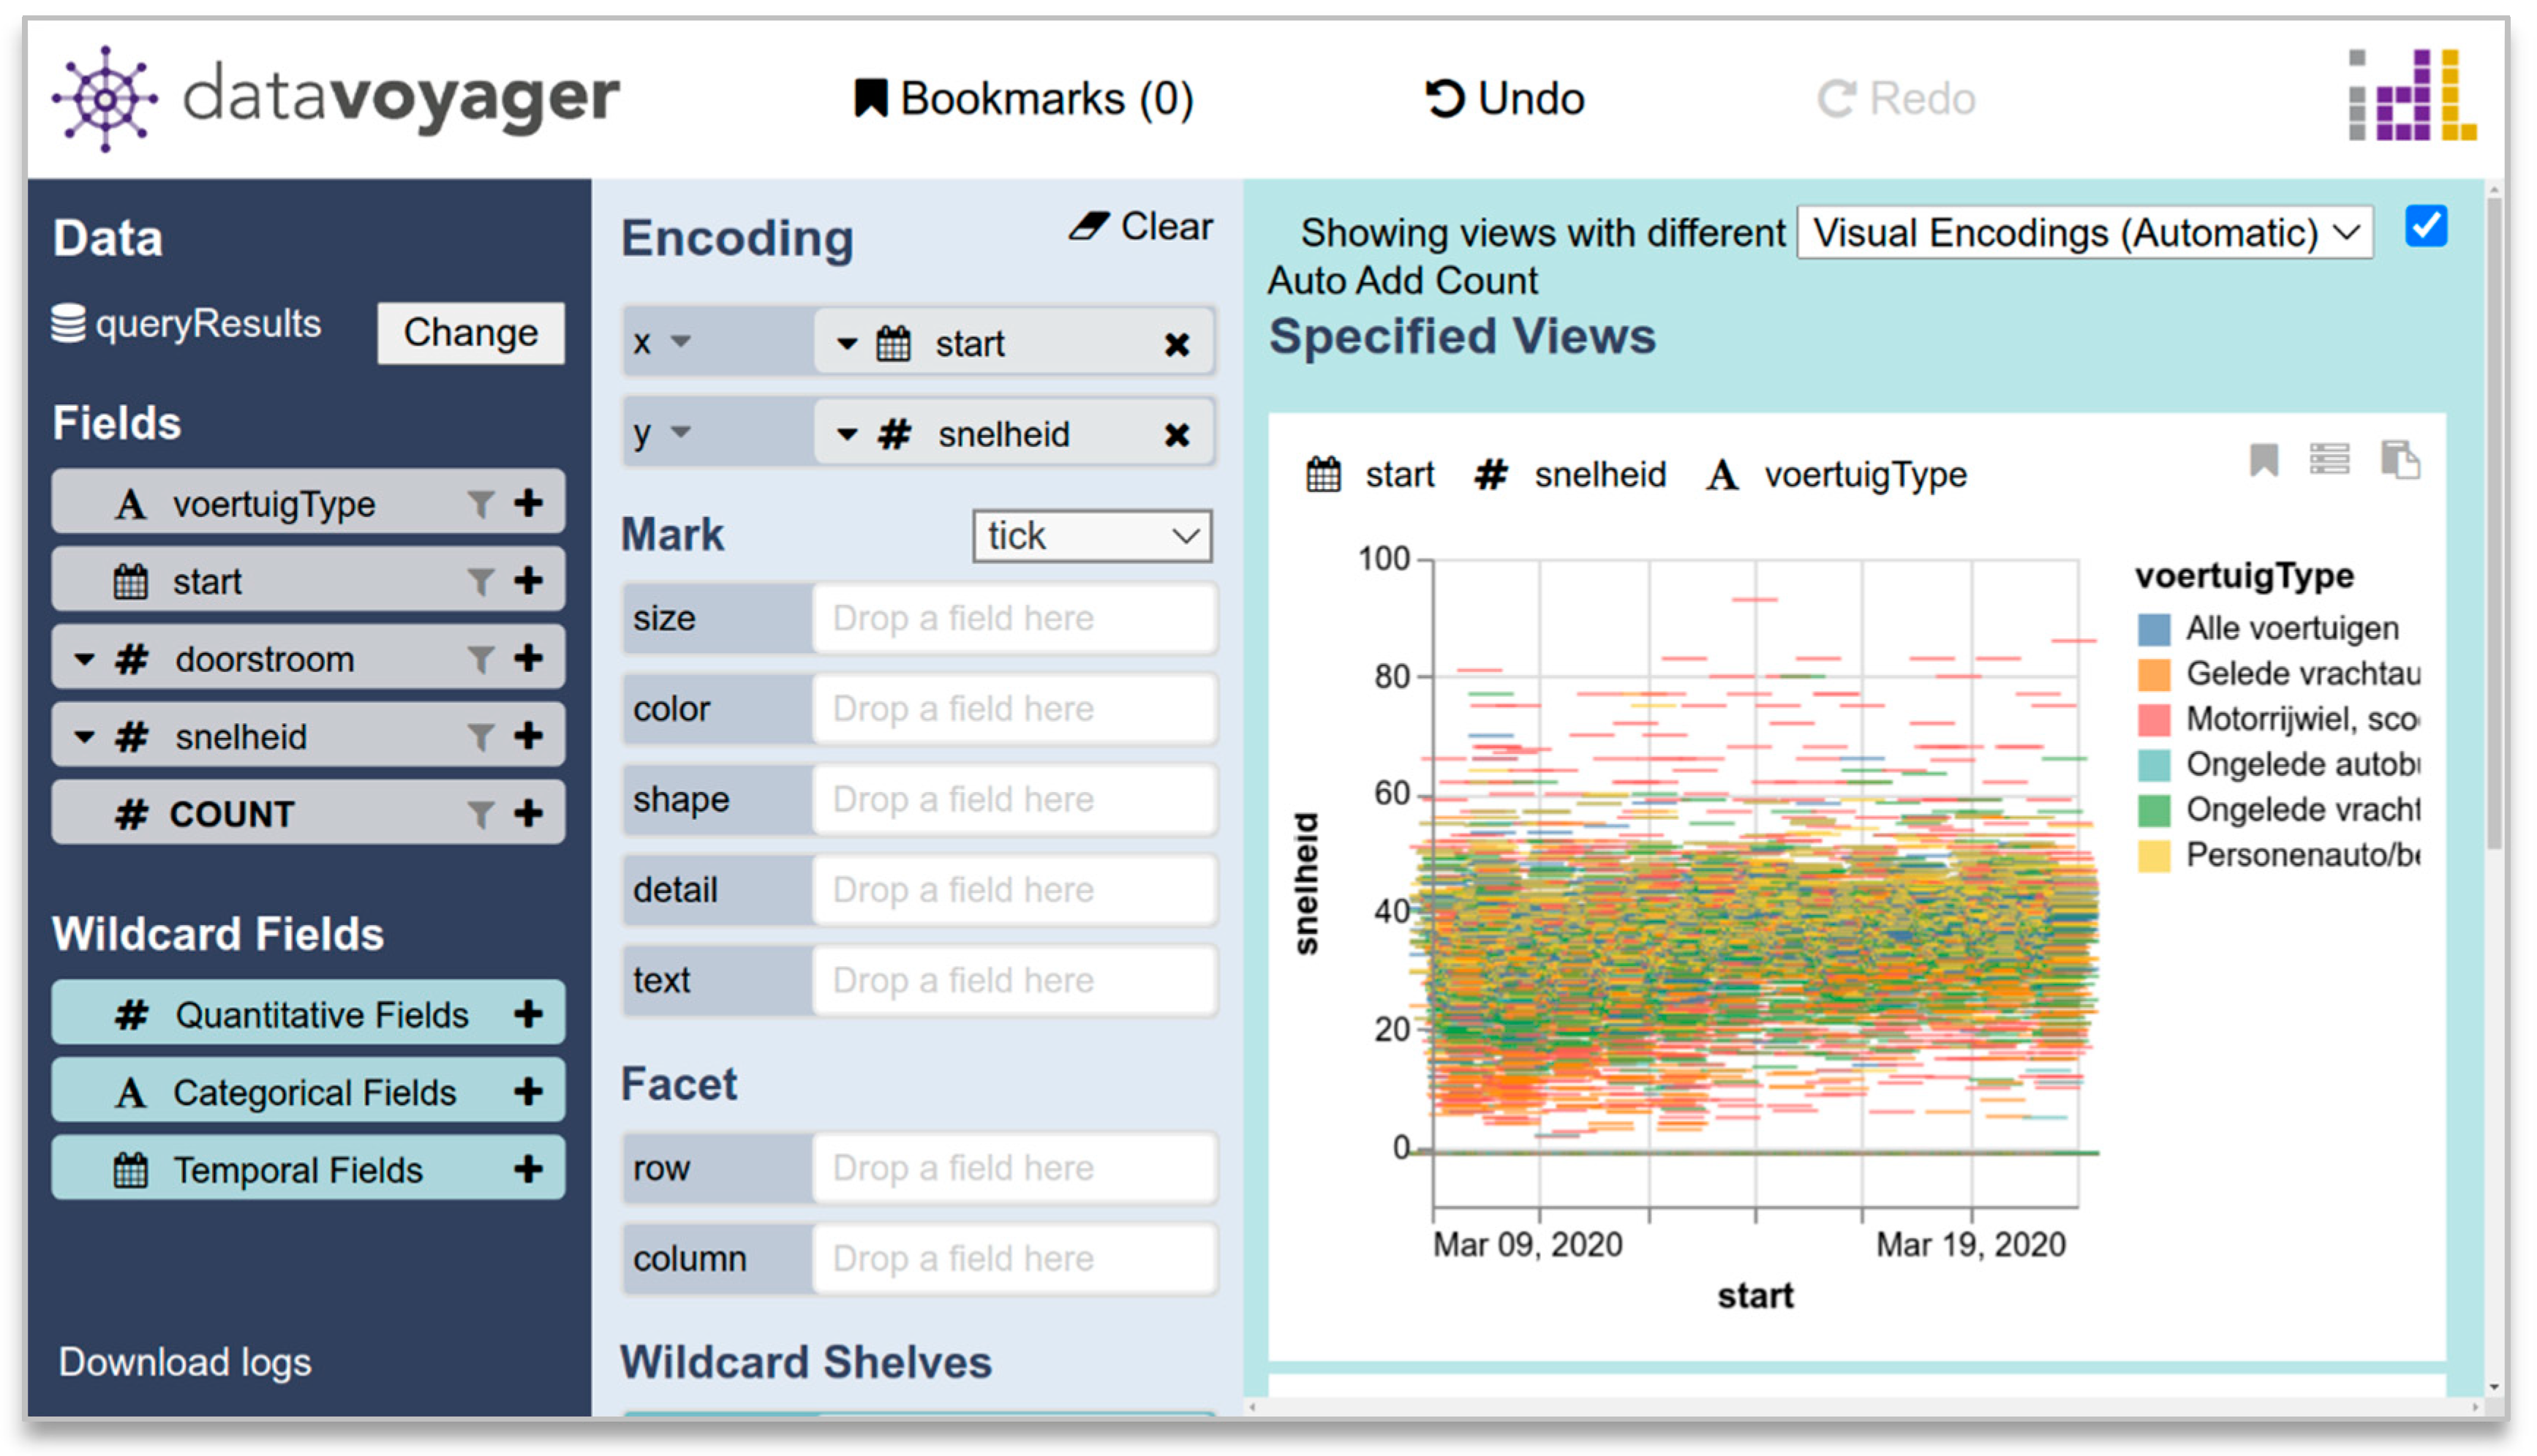
Figure 6.
Example User Interface making use of Basisregistratie Adressen en Gebouwen (BAG) dataset, Kadaster. Retrieved from: LD-VOWL.
Figure 6.
Example User Interface making use of Basisregistratie Adressen en Gebouwen (BAG) dataset, Kadaster. Retrieved from: LD-VOWL.

Figure 7.
Waarstaatjegemeente.nl browser displaying municipality finances. Retrieved from: https://www.waarstaatjegemeente.nl/dashboard/gemeentelijke-financi%C3%ABn.
Figure 7.
Waarstaatjegemeente.nl browser displaying municipality finances. Retrieved from: https://www.waarstaatjegemeente.nl/dashboard/gemeentelijke-financi%C3%ABn.

Figure 8.
Gruff Demonstrator using Basisregistratie Adressen en Gebouwen (BAG), Kadaster.

Publisher’s Note: MDPI stays neutral with regard to jurisdictional claims in published maps and institutional affiliations. |
© 2020 by the authors. Licensee MDPI, Basel, Switzerland. This article is an open access article distributed under the terms and conditions of the Creative Commons Attribution (CC BY) license (http://creativecommons.org/licenses/by/4.0/).
Share and Cite
MDPI and ACS Style
Rowland, A.; Folmer, E.; Beek, W. Towards Self-Service GIS—Combining the Best of the Semantic Web and Web GIS. ISPRS Int. J. Geo-Inf. 2020, 9, 753. https://0-doi-org.brum.beds.ac.uk/10.3390/ijgi9120753
AMA Style
Rowland A, Folmer E, Beek W. Towards Self-Service GIS—Combining the Best of the Semantic Web and Web GIS. ISPRS International Journal of Geo-Information. 2020; 9(12):753. https://0-doi-org.brum.beds.ac.uk/10.3390/ijgi9120753
Chicago/Turabian StyleRowland, Alexandra, Erwin Folmer, and Wouter Beek. 2020. "Towards Self-Service GIS—Combining the Best of the Semantic Web and Web GIS" ISPRS International Journal of Geo-Information 9, no. 12: 753. https://0-doi-org.brum.beds.ac.uk/10.3390/ijgi9120753
Note that from the first issue of 2016, this journal uses article numbers instead of page numbers. See further details here.