1. Introduction
The employment of Unmanned Aerial Vehicles (UAV) for obtaining data about changes in land use in the form of images occurs in small areas in which various changes can be observed. Thanks to their capability to position themselves at a constant height and remain stationary for a specific period, multirotor UAVs can provide opportunities to observe the phenomenon that occurs in each area. The ability to start air raids every couple of minutes over the area of several hectares allows one to record people moving around. In our research, we have touched upon the problem of producing thematic maps of the land cover, illustrating official land use, including places whereby the use of which has been changed by pedestrians.
Methods of obtaining UAV data require creating a digital elevation model (DEM) and a point cloud based on the images obtained [
1,
2,
3]. The actual reflection of geometry of the recorded area or object, including defining its actual location, is particularly interesting. To do so, researchers focus on GCPs that serve as reference points used in the aerial triangulation of imagery [
4,
5,
6]. Using geodetic techniques of measurement allows one to have accurate coordinate values and accurate heights of the photogrammetric models [
7,
8,
9,
10,
11].
It becomes crucial to properly adjust mapping methods of presenting raster data transformations from images into qualitative and quantitative vector data. We can see the necessity to develop well-known methods of cartographic presentation for visualizing data obtained from UAVs. Obtaining static data based on images is relatively simple, but the observation of and recording changes in dynamic phenomena in the form of images requires a particular approach [
12]. Recording space used by pedestrians outside designated sidewalks is one of such phenomena. We assume that actual land cover also includes also the areas occupied by pedestrians outside designated sidewalks, e.g. worn shortcut paths or areas along sidewalks used when the sidewalk is too narrow for all pedestrians.
The aim of the research on cartographic visualization is to obtain highly effective spatial information. The effectiveness of cartographic visualisations connect to the creation of maps that enable the simple and unequivocal reading of features of geographical phenomena [
13]. The effectiveness of visualisation is defined as both the efficiency and effectiveness of the communication of information [
14]. It is directly proportional to the quantity of information correctly received and is inversely proportional to the time used to obtain it [
15].
The increase in cartographic effectiveness significantly improves the usefulness of maps [
16] by suitable mapping methods and graphic variables, with which we can capture and demonstrate changes occurring in the area [
17,
18,
19]. The choice of the mapping technique is key to thematic map design. Mapping techniques are specific methods applied to the cartographic presentation of spatial phenomena and the relations existing there between. The following factors are decisive for the effectiveness of the obtained map: measurement level, geometric form of objects, and graphic variables. The classification of attributes is effected on specific measurement levels by the assignment of numbers or categories to objects, which is tantamount to the presentation of the relations existing between these objects by suitably selected measurement scales. Each map comprises a set of graphical elements that present spatial data [
20]. First and foremost, general geographical and topographical maps provide nominal information, and to a lesser extent, quantitative data. Several mapping methods may be used in any one map. Quantitative data are presented applying a statistical approach, and the end-product of the utilization of this specific mapping method are statistical maps. The geometrical form of objects requires the adoption of an appropriate mapping method. Point phenomena may be represented to emphasise qualitative or quantitative attributes.
For the representation of areal phenomena, use is made of the following: chorochromatic maps, choropleth map, dasymetric maps, areal cartodiagrams, scope maps, isoline maps and statistical surfaces. Apart from the division into qualitative and quantitative data, it is worth mentioning the regular or irregular nature of the distribution of areal phenomena, which frequently entails the selection of basic fields for data [
21]. Satellite or UAV images, which show types of land cover for individual grids, are called chorochromatic graticule maps, where each grid cell has a different colour.
The dot method is considered as a variant of the point symbol method, but on the dot map, a small circle becomes the sign, the size of which enables the more precise location of the phenomenon. The most logical method of location entails introducing the assumption that one dot presents one object, but in practice a specific value is given to a single dot; this is known as the dot ratio [
22].
Heat maps (specific variant of the choropleth map), with various color scales used for areas with different intensity of points that represent magnitude of a given phenomenon, are particularly beneficial for visualizations and the exploration of large quantitative data sets [
23,
24,
25,
26].
The combination and transformations of mapping methods of point and areal phenomena require appropriate graphical procedures that make it possible to maintain the legibility of the cartographic visualisation effect, i.e., enabling the unequivocal interpretation of spatial relations.
The main objective of our work was to work out thematic maps based on UAV imagery that would present the actual use of the small, urbanized area, including places for which pedestrians changed the form of use. In this research, we pinpointed a few intermediary goals:
To obtain data on land use and the location of pedestrians in the research area based on low-level aerial imagery.
To adjust mapping methods to the point-to-polygon transformation of pedestrians’ representation.
To use the dot map, buffer map, chorochromatic map and the so-called heat map to present quantitative data by means of the area method, and for cartographic presentation of the actual land use by pedestrians.
To demonstrate the effectiveness of the thematic maps created, presenting the actual land use by pedestrians.
2. Study Area
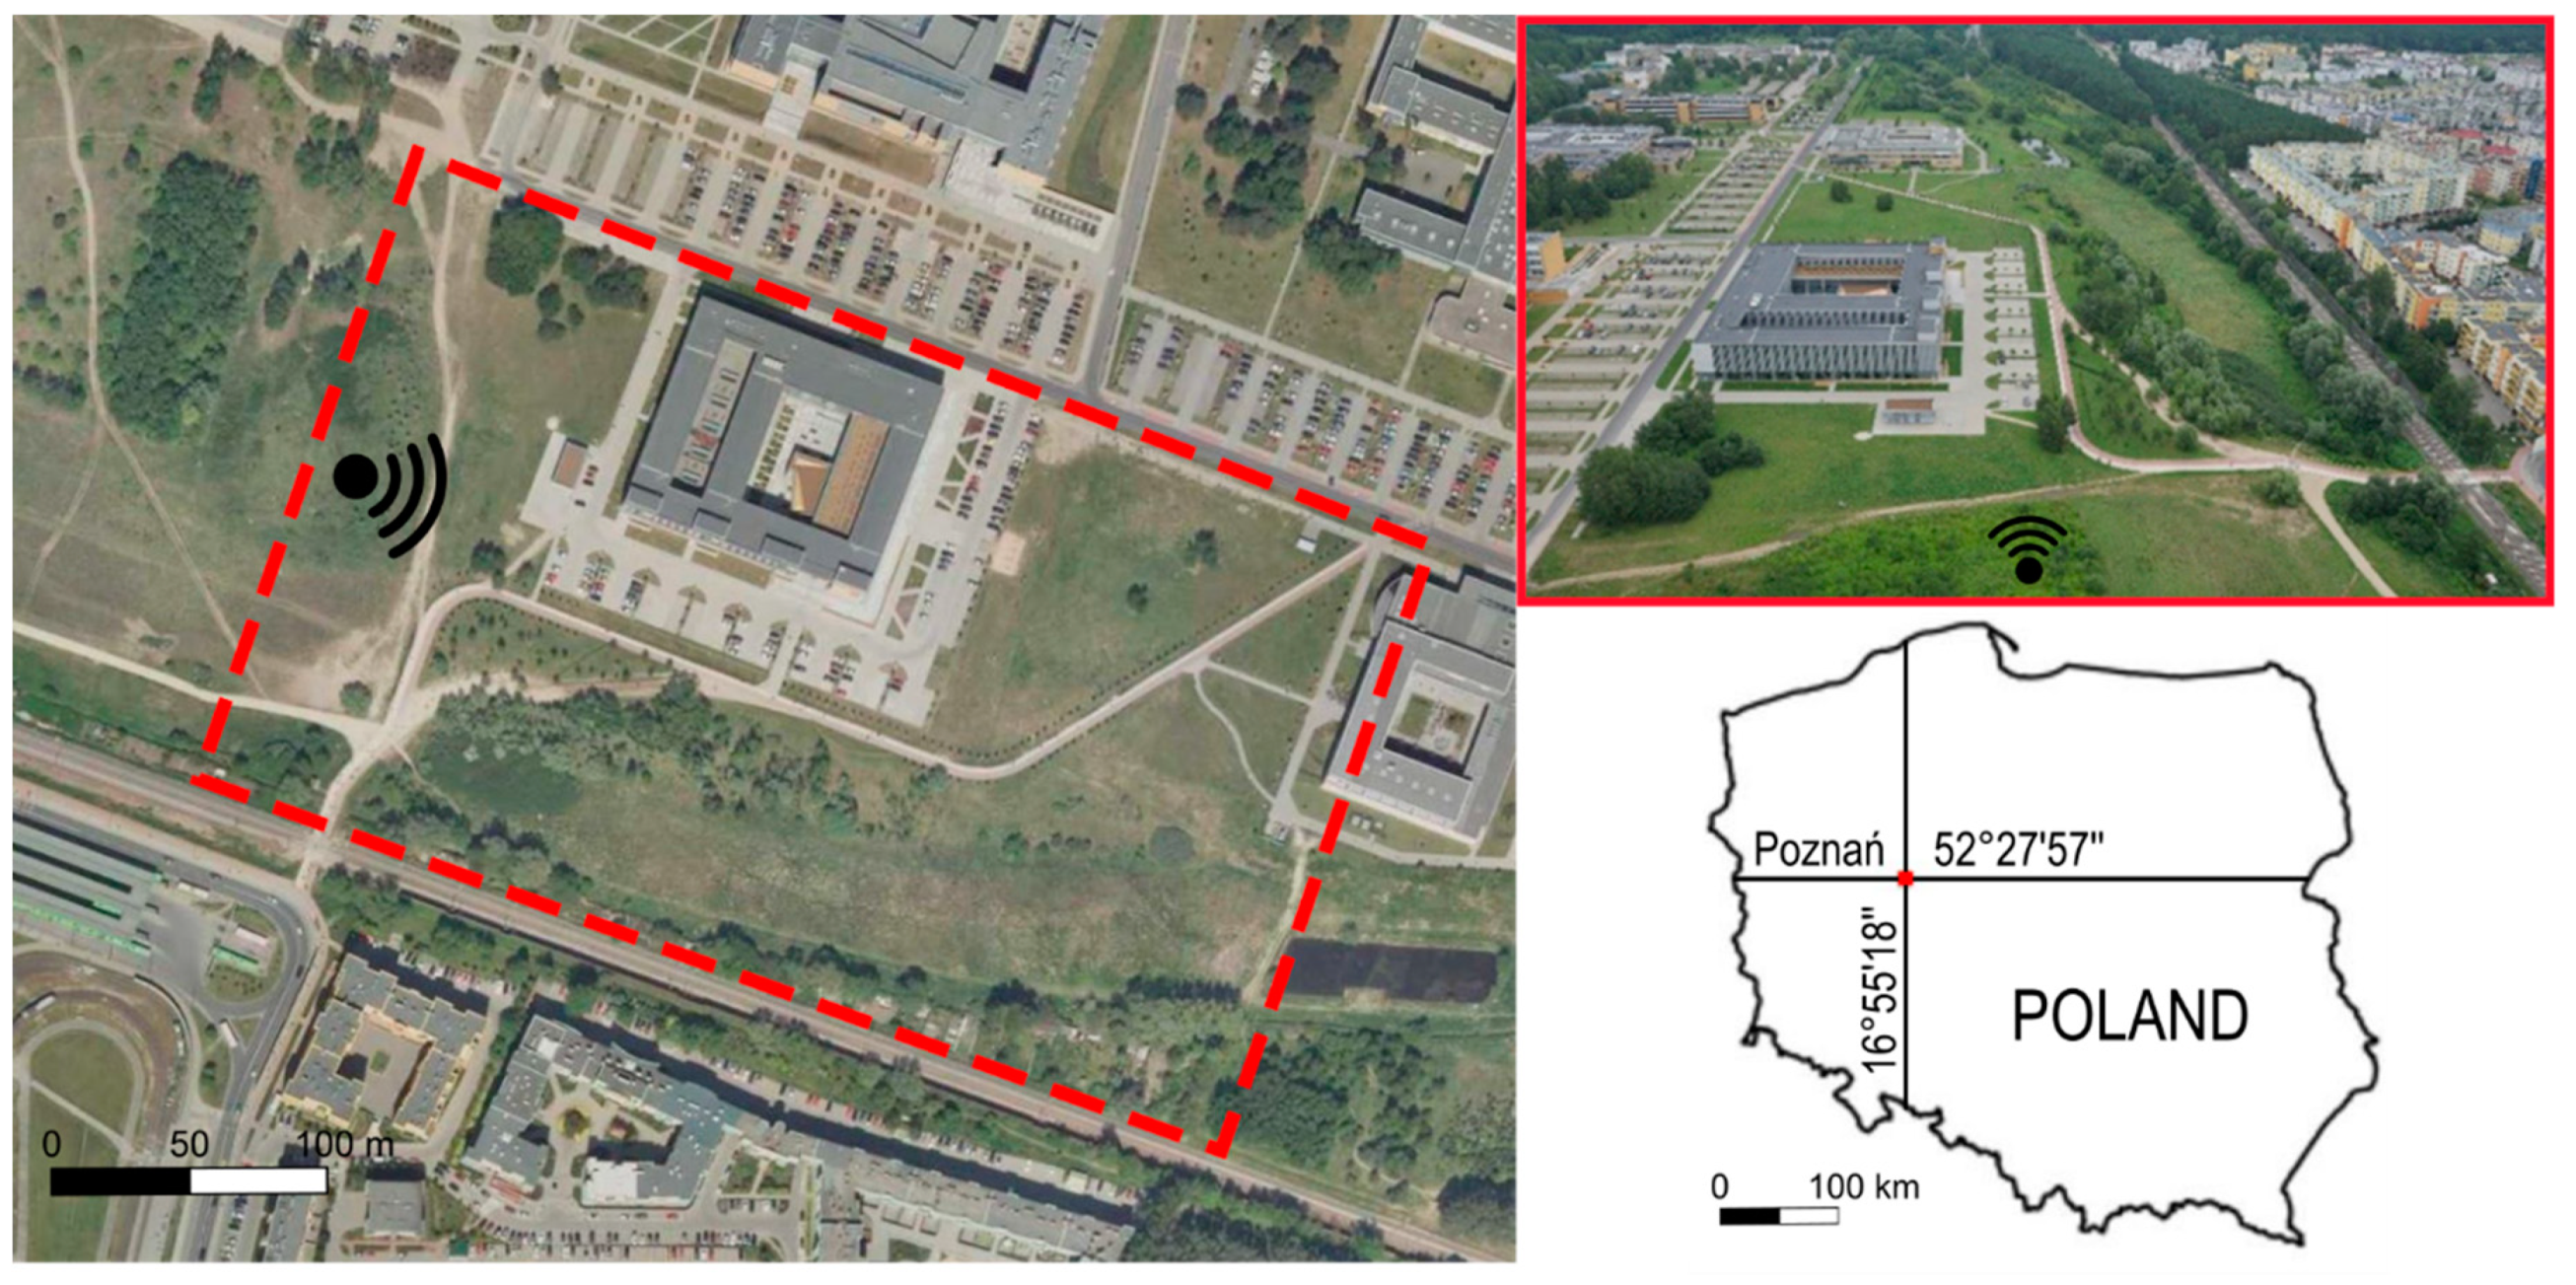
The inclusion of pedestrian movement in the identification of the actual land use has become the main determinant in the process of pinpointing conditions the research area should be characterized by. We have assumed that the use of the research area by pedestrians should be as intense as possible. For the purposes of the research, we concluded that urbanized areas would be most intensely used by pedestrians. A relatively dense and diverse form of urbanized areas, as well as the nature of the phenomenon analyzed, and technology employed for observation, should help one reduce the size of the research area. In this study, we assumed that the maximum research area, depending on the specificity of construction of selected areas, would be no larger than 10 ha. The construction of the research area should be balanced and include both buildings and structures, such as corridors (roads, sidewalks, parking lots), objects of the so-called small architecture and green spaces. The study was conducted in the western part of Poland, the Greater Poland province, in the city of Poznań. In accordance with the standards adopted in terms of the research area characteristics, we selected the area that was a part of the campus of Adam Mickiewicz University in Poznań. The area is 9 ha and met all the selected criteria (
Figure 1). A chosen fragment is one of the parts most intensely used by pedestrians, as it is located between the main part of the campus and the railway station. The area selected for the research is used daily by thousands of students and university employees, as well as the residents of the nearby housing estates.
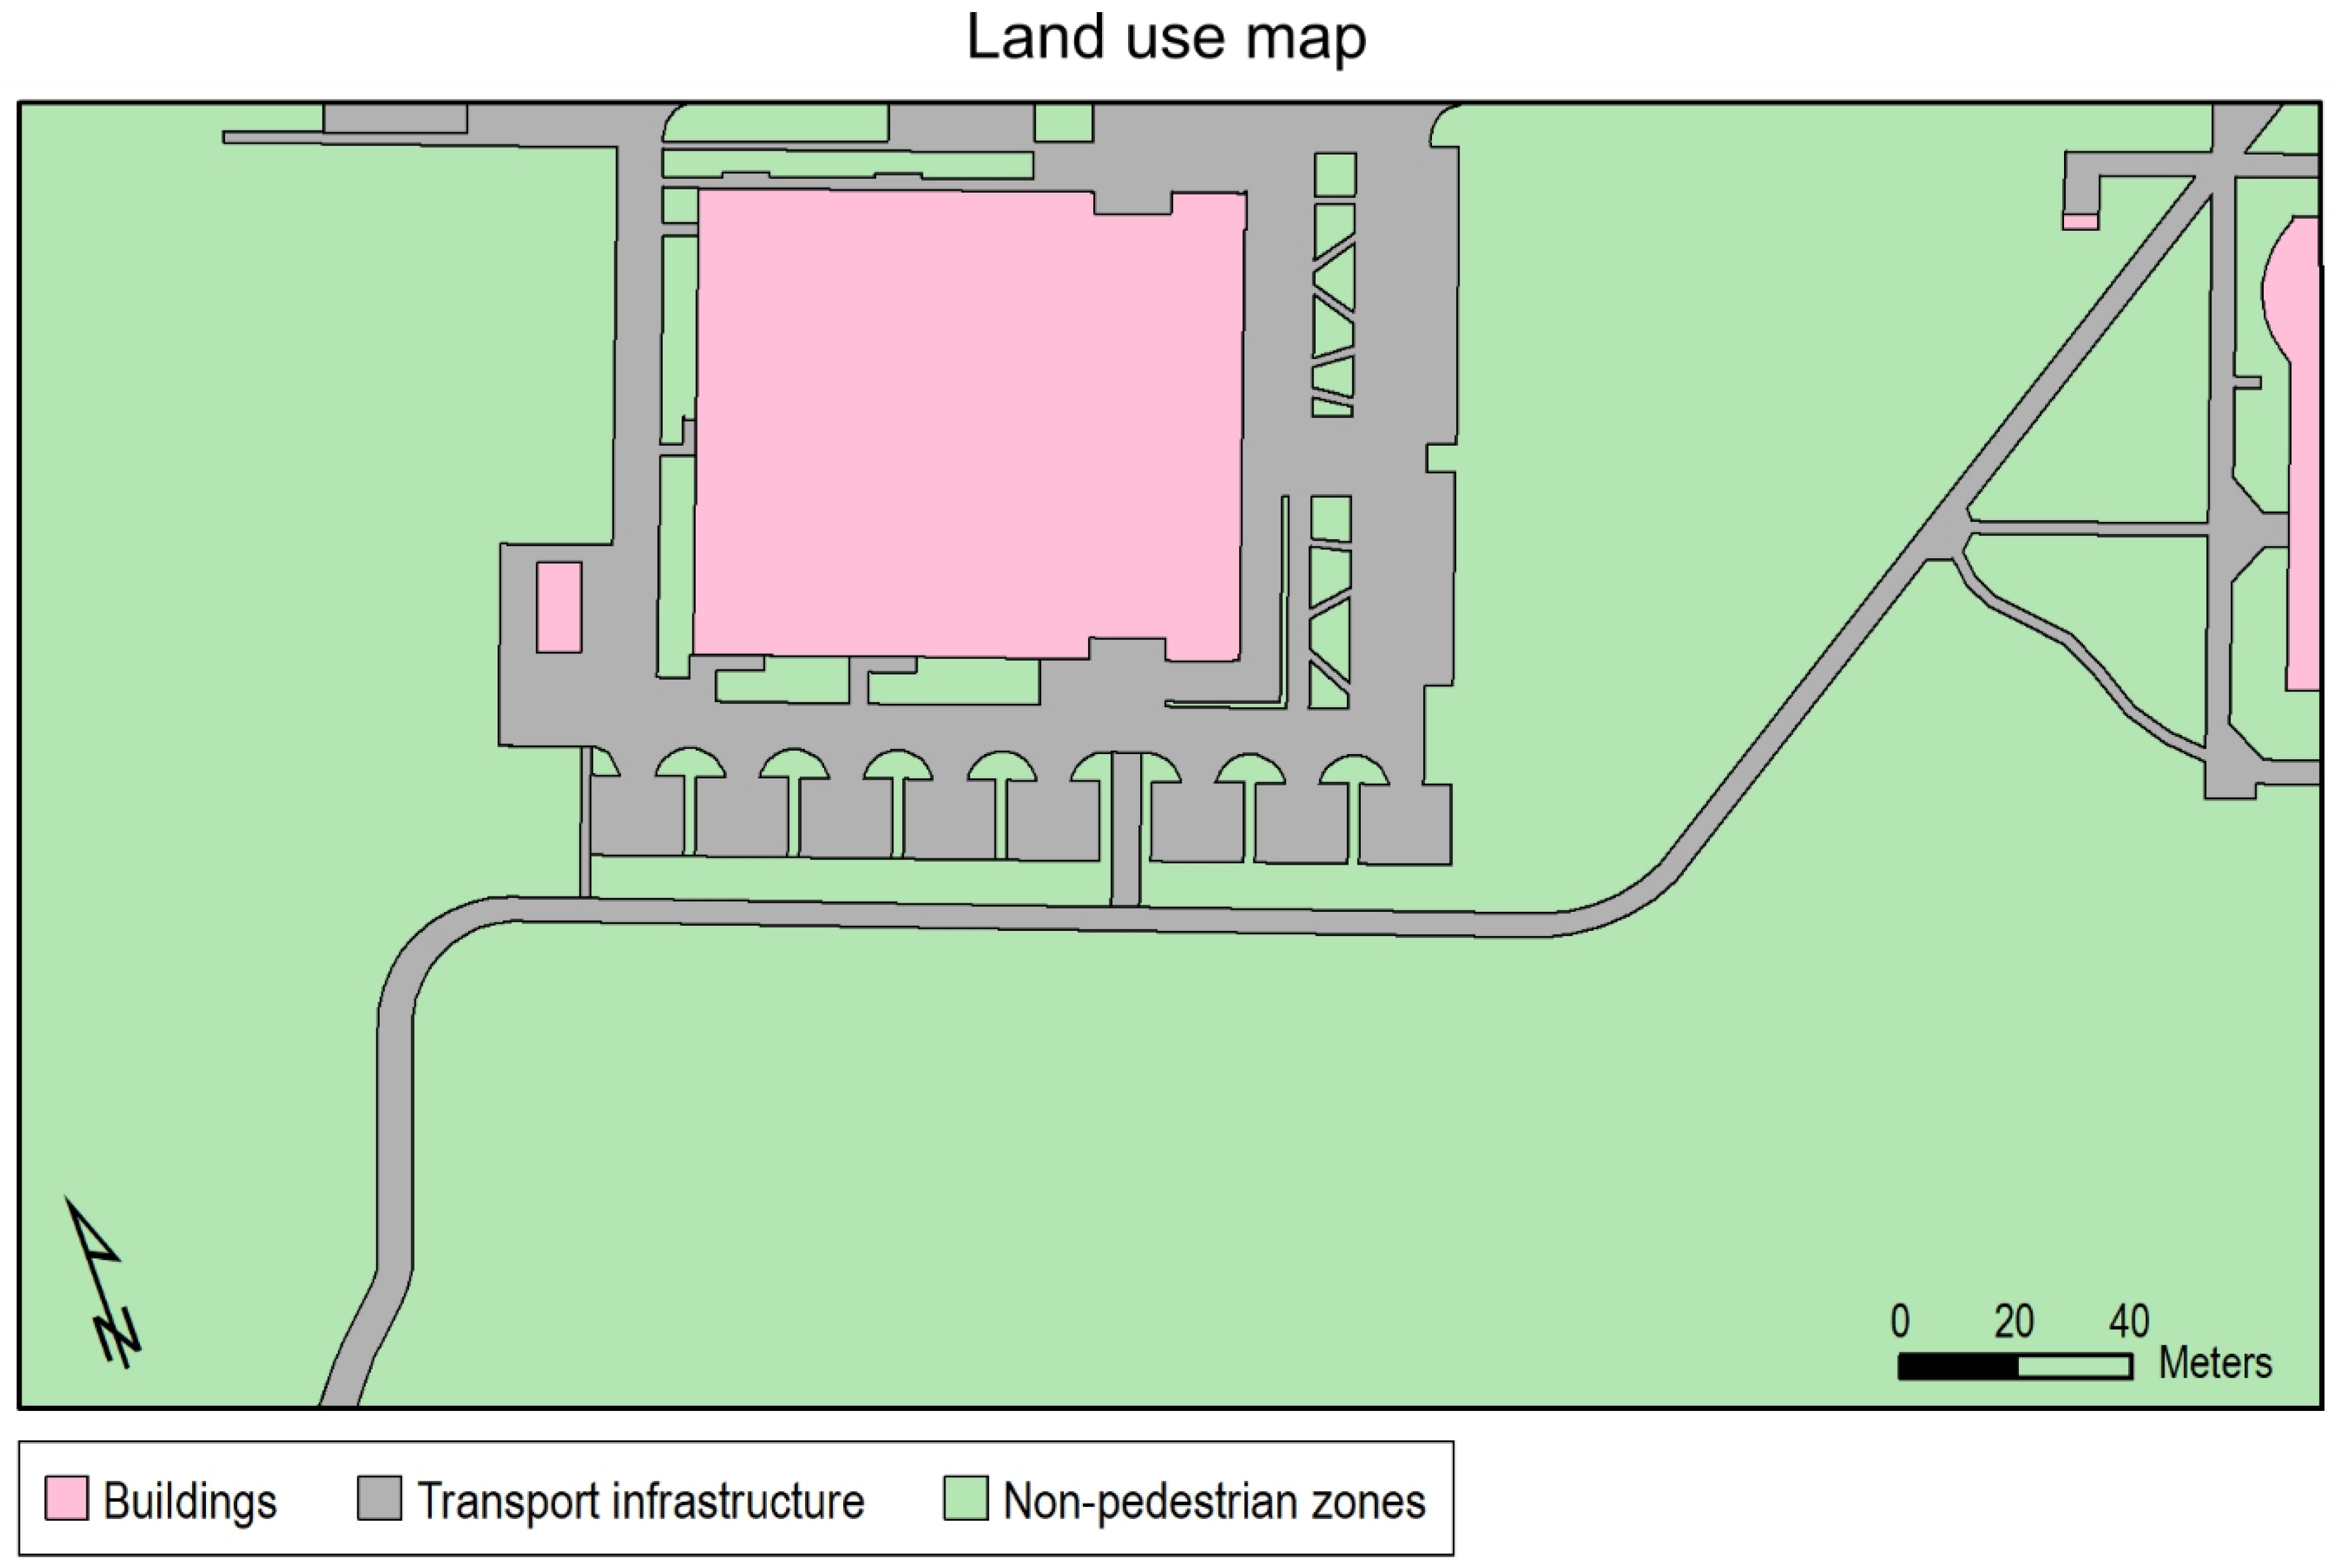
Then, we analyzed the research area in terms of transport infrastructure (
Figure 2). Our priority was to mark out areas for pedestrians, i.e., sidewalks, routes for pedestrians and cyclists, parking lots and access roads. These elements were included in the research as areas in which pedestrian movement was allowed (
Figure 2 Transport infrastructure). Additionally, we presented built-up areas (
Figure 2 Buildings). The rest of the research area consisted of green areas, classified as nonpedestrian zones. The areas marked out constituted qualitative data. A map presenting the infrastructure of the research area (
Figure 2) was worked out with the application of the chorochromatic mapping method, traditionally used for presenting land use.
3. Methodology
To achieve our objectives, we adopted four main stages of research:
Concept of the point-to-polygon transformation of pedestrian representation (
Section 3.1;
Figure 3),
3.1. Concept of the Point-to-Polygon Transformation of Pedestrian Representation
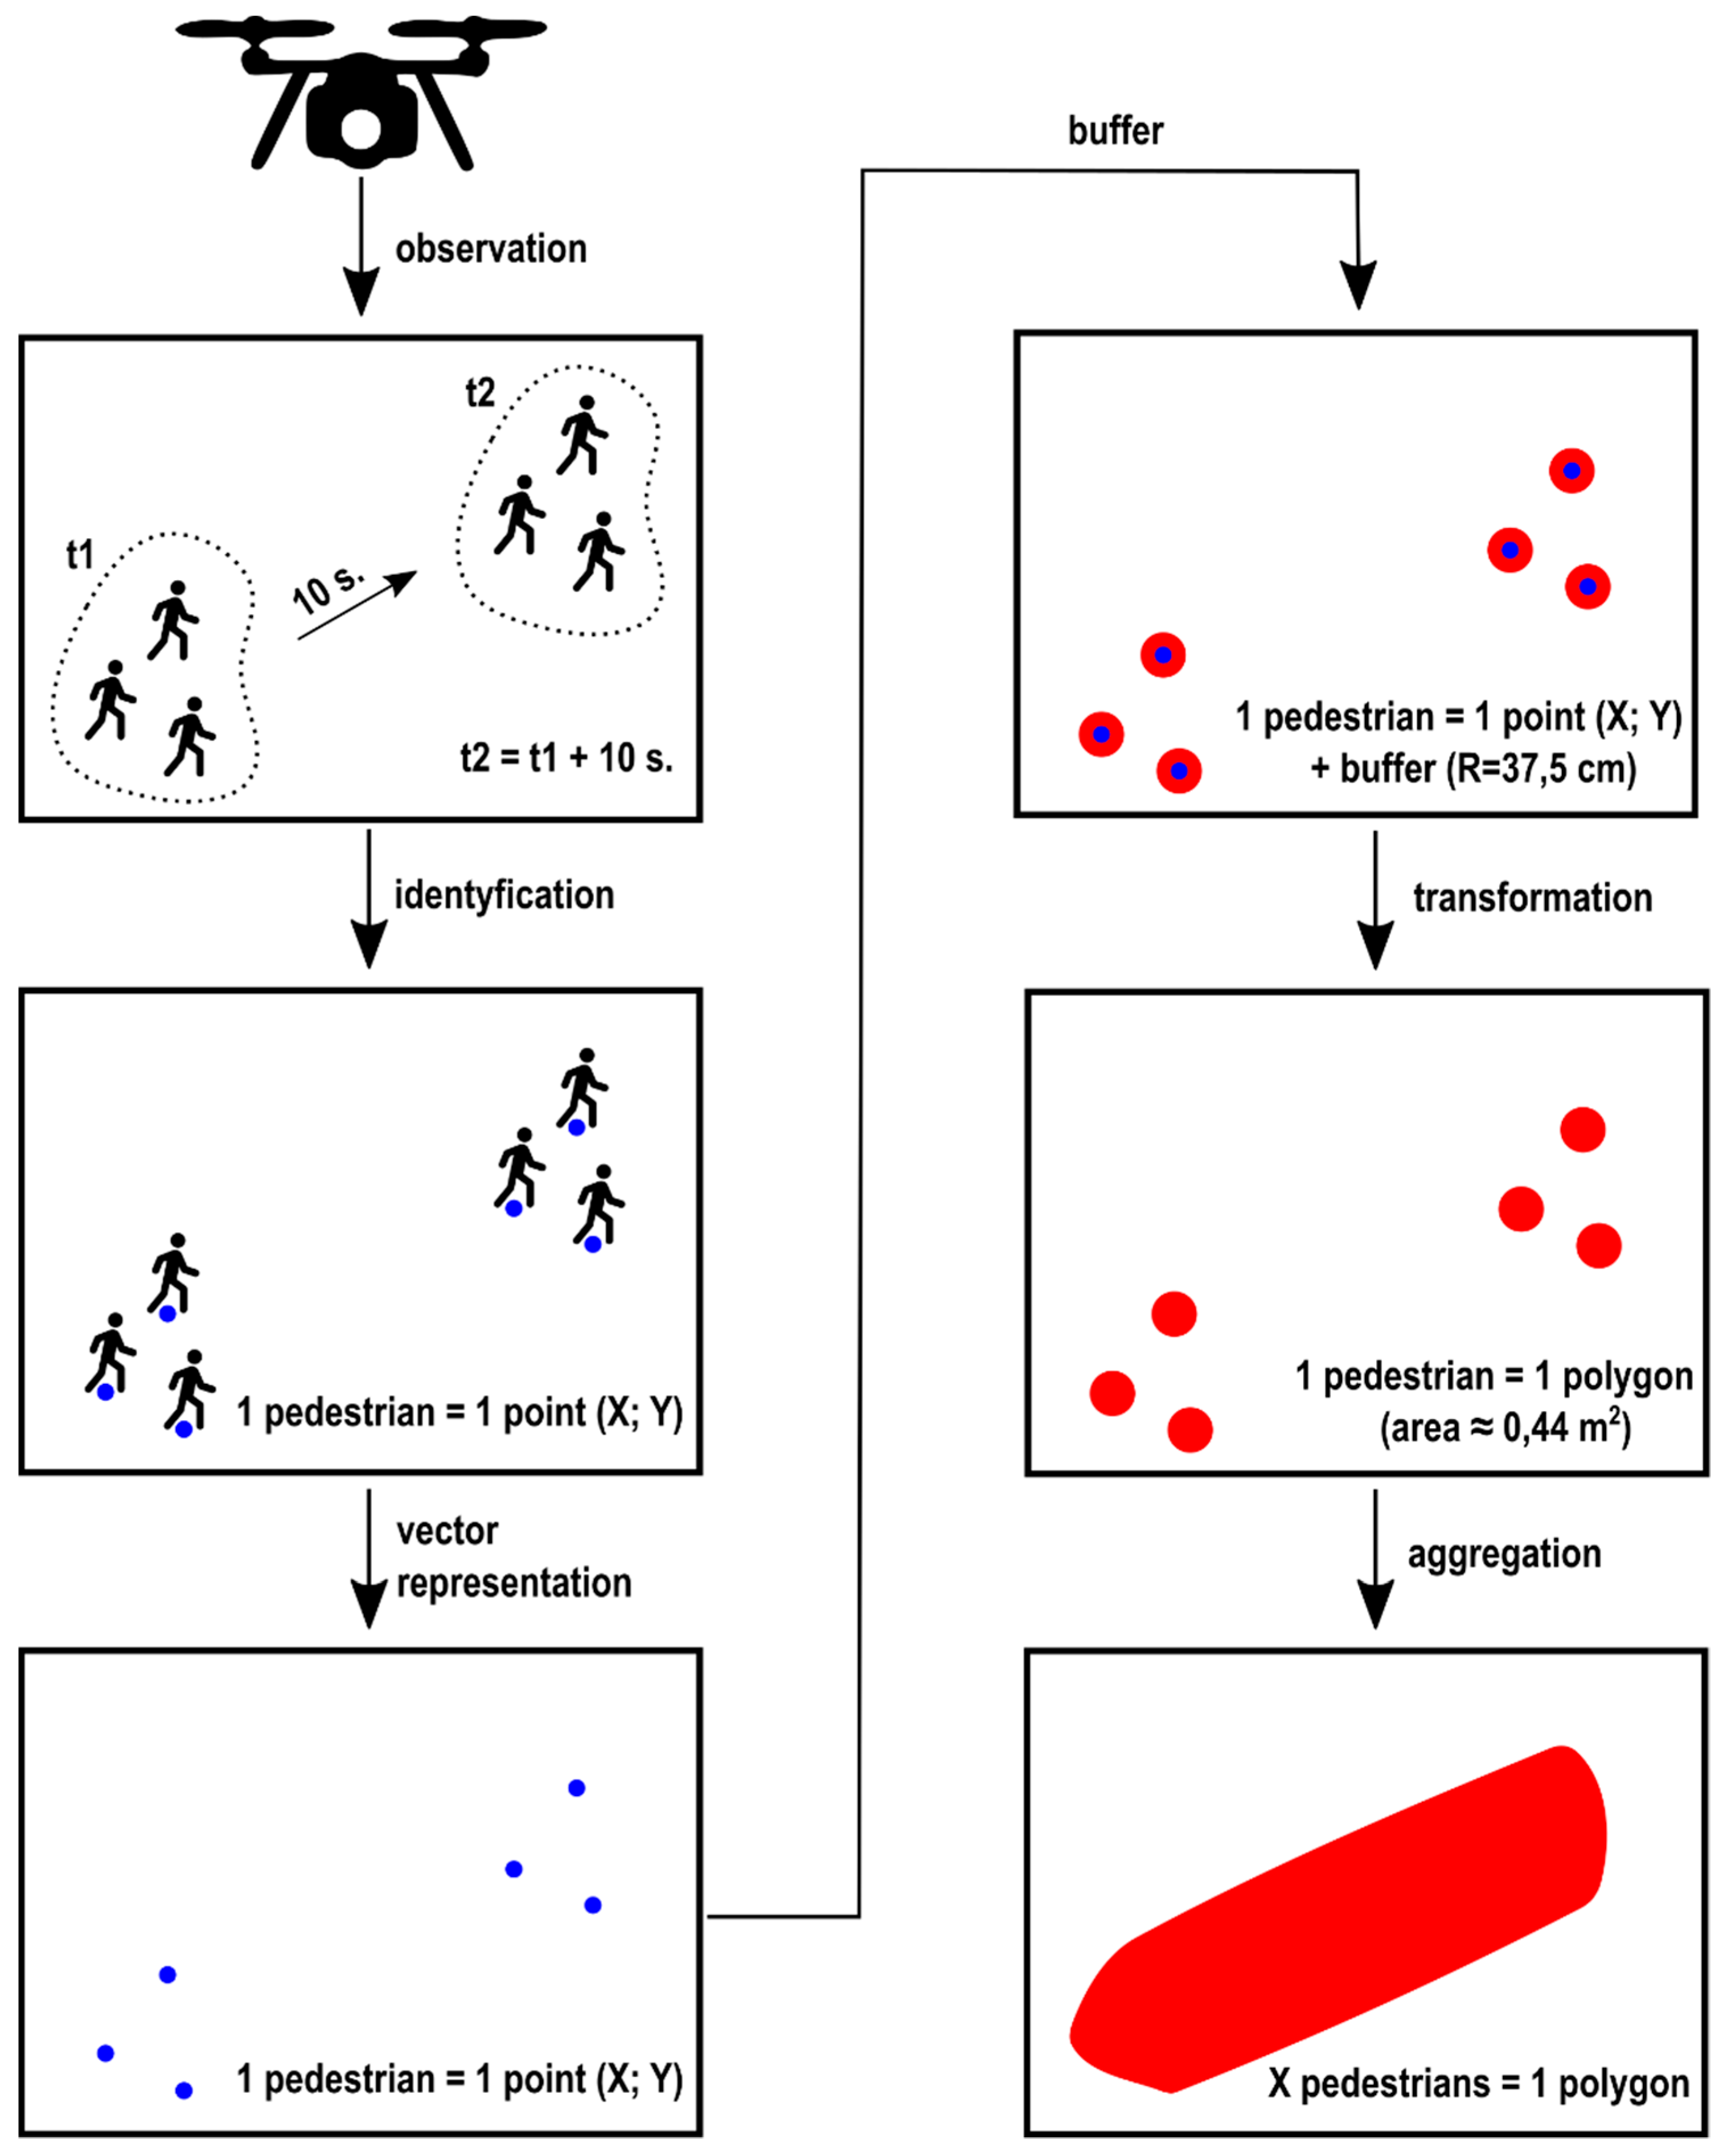
The employment of UAVs for recording the same area at different times makes it possible to scrutinize changes between individual images. Pedestrian movement is a highly dynamic phenomenon; hence, we have decided to use short time intervals between individual images of the research area. We adopted the interval of 10 seconds that would help us record pedestrian movement. The process of aerial triangulation of the images obtained, and their subsequent vectorization, allowed us to specify the location of individual pedestrians, which, in turn, made it possible to represent pedestrians by means of point objects and to identify each of them in the coordinate system (X; Y).
The ability to specify the accurate location of pedestrians in the images obtained and a large scale of the map resulted in the conclusion that the surface object would make the more accurate representation, allowing us to present the area occupied by an individual person in the way that resembles the actual state. To do that, it was necessary to transform the point representation of pedestrians into the polygon representation. To determine the area occupied by an individual pedestrian, we have specified the value of a buffer by means of which transformation would take place. We assumed that the buffer value of a single point would be 37.5 cm (diameter of 75 cm), which corresponded with the largest length of the pedestrian’s footstep (62.5–75 cm) [
27]. Then, we marked out the area of the actual land use based on the obtained polygon objects representing pedestrians. The aim of this was to determine the areas informally used by pedestrians. With recording pedestrians at intervals, it is not possible to determine the location of individual pedestrians between the images obtained. In the research, we have assumed that obtaining images at short intervals and the average speed of pedestrians of 5 km/h [
28,
29,
30] would allow us to determine the aggregate distance between pedestrians captured in individual images.
Figure 3 depicts a concept of point-to-polygon transformation of the pedestrian’s representation. It shows the different stages of identification and cartographic representation of pedestrians in the research area, as well as the final result presenting the area of the actual land use.
3.2. Obtaining Low-Level Imagery
In this research, we decided to obtain spatial data by means of the low-level imagery method. The time of recording pedestrians’ movement in the research area with the employment of UAVs strictly correlated with the maximum pedestrian movement intensity. A field survey allowed us to determine that pedestrian movement in the selected research area was the most intense between 7:30 and 8:15 on weekdays during the academic year. Thus, we decided to conduct the research with the employment of UAVs specifically during this time. Having considered the size of the research area and the necessity to observe pedestrian movement, we concluded that the multirotor UAV would be the best choice in terms of obtaining visual data. We used the Tarot X6 platform, equipped with a camera with 16.1 Mpx matrix. Although the platform was equipped with the Global Navigation Satellite Systems (GNSS), we decided that the aerial triangulation process of the imagery obtained would be carried out with the employment of GCPs located in the research area, which allowed us to make the process as accurate as possible [
31,
32]. The GNSS RTK technique is one of the methods of measuring GCPs [
33]. For the measurement, we used the GNSS Trimble R4 Receiver, model 3, with differential corrections provided by the permanent reference station network. To create as accurate photogrammetric analysis of the research area as possible, it was necessary to record it from all sides and to work out the 3D model, using the Stucture-from-Motion (SfM) algorithm [
34,
35].
It was important to provide security during UAV raids. The observation of pedestrian movement was conducted in accordance with the existing provisions of law. In the study, the priority was to ensure safety for the operator, the UAV platform, and most of all for people in the vicinity during the flight mission using UAV technology. Bearing in mind safety and legal regulations, it became impossible to fly directly over pedestrians. This was mainly due to the inability to obtain images using the classic photogrammetric flight path based on photogrammetric series. In order to achieve the aim of the study, we have determined that it is necessary to register all pedestrians moving in the study area at the same time. We also assumed that the registration of pedestrian traffic would be carried out from one observation post. Such an approach in the conducted study forced the necessity to obtain oblique photos. We used an unmanned aerial vehicle (UAV)—a multirotor platform—which ensured stable registration of the research area from one observation position. The photogrammetric images obtained were processed in the Agisoft Metashape Professional software. The GCP-based aerial triangulation process resulted in obtaining the average RMSE value for all GCPs at the level of 0.27 m. Orthophotomaps were exported from Agisoft Metashape Professional for all the images obtained in the GeoTIFF format to identify pedestrians recorded in the research area. During the recording of pedestrian movement in the research area, we obtained 275 images in total.
3.3. Identification and Vectorization of Pedestrians
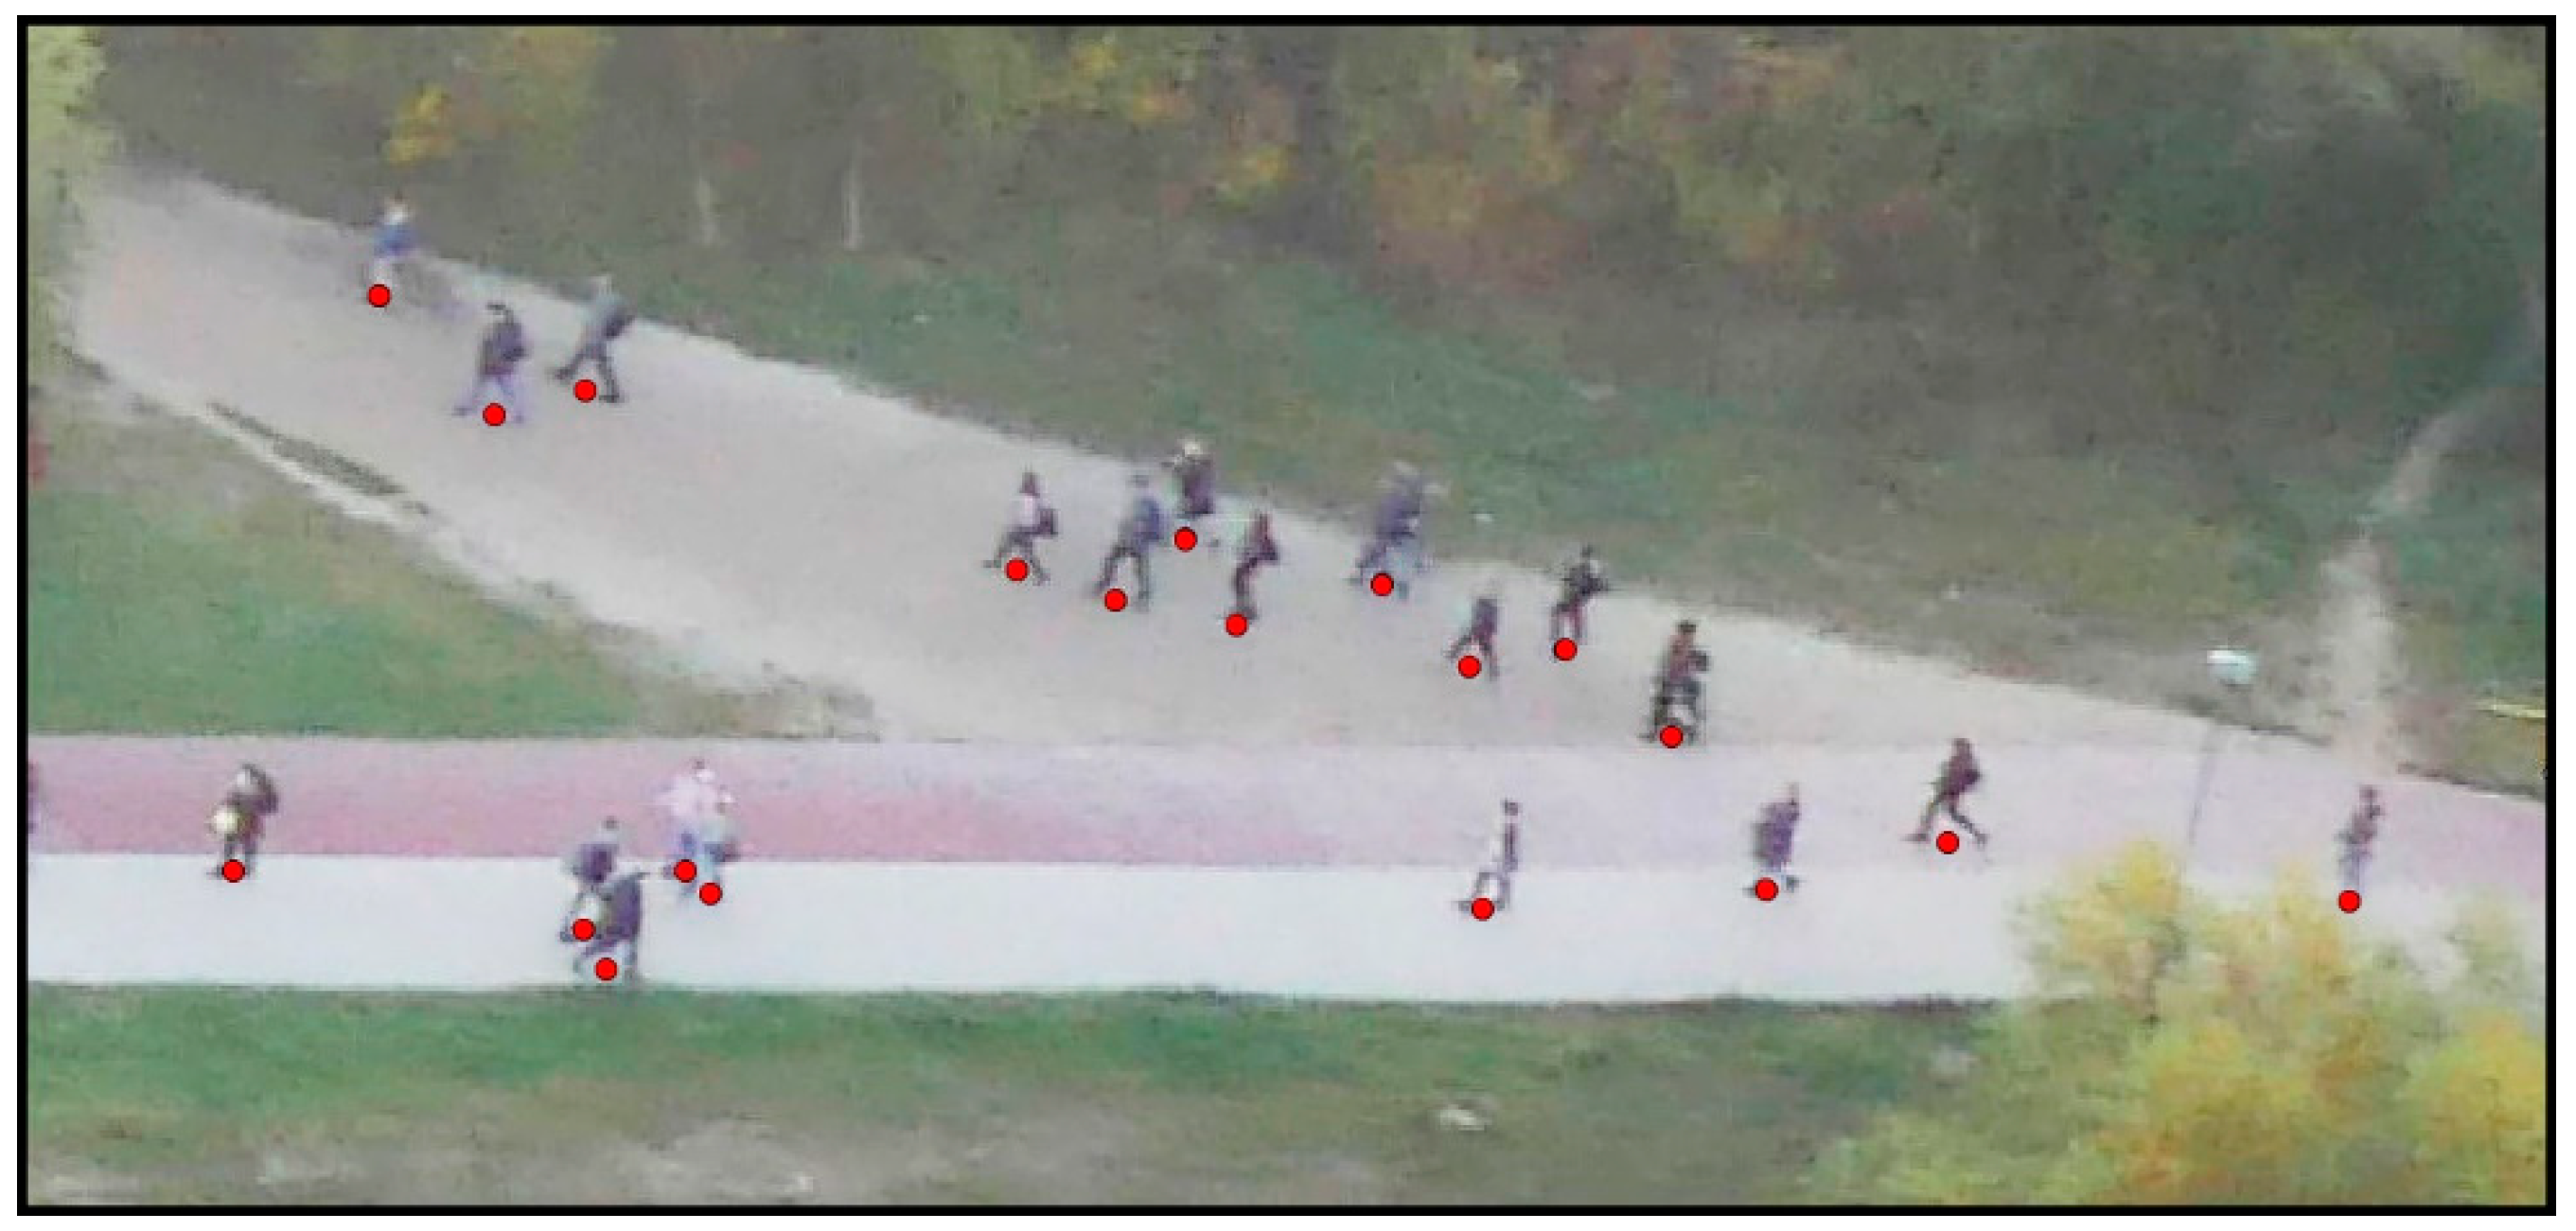
The orthophotomaps, created for all images, were then imported to the GIS software. In the study, we will use the ESRI ArcMap software to process spatial data and develop thematic maps. In this software, we vectorized pedestrians recorded in individual images to determine their exact situational coordinates (X; Y). It was difficult to determine the accurate vectorization place of each pedestrian, as pedestrians were constantly moving. We specified that the place of projecting the center of gravity of each pedestrian in the research area plane would constitute the vectorization point (
Figure 4); this was conducted for the 275 images obtained at 10-s intervals.
3.4. Cartographic Visualization of Pedestrians’ Location
In our attempt to meet research objectives on designing maps that use adequate mapping techniques for presenting the real land use by pedestrians, we adopted the following order of creating intermediary maps:
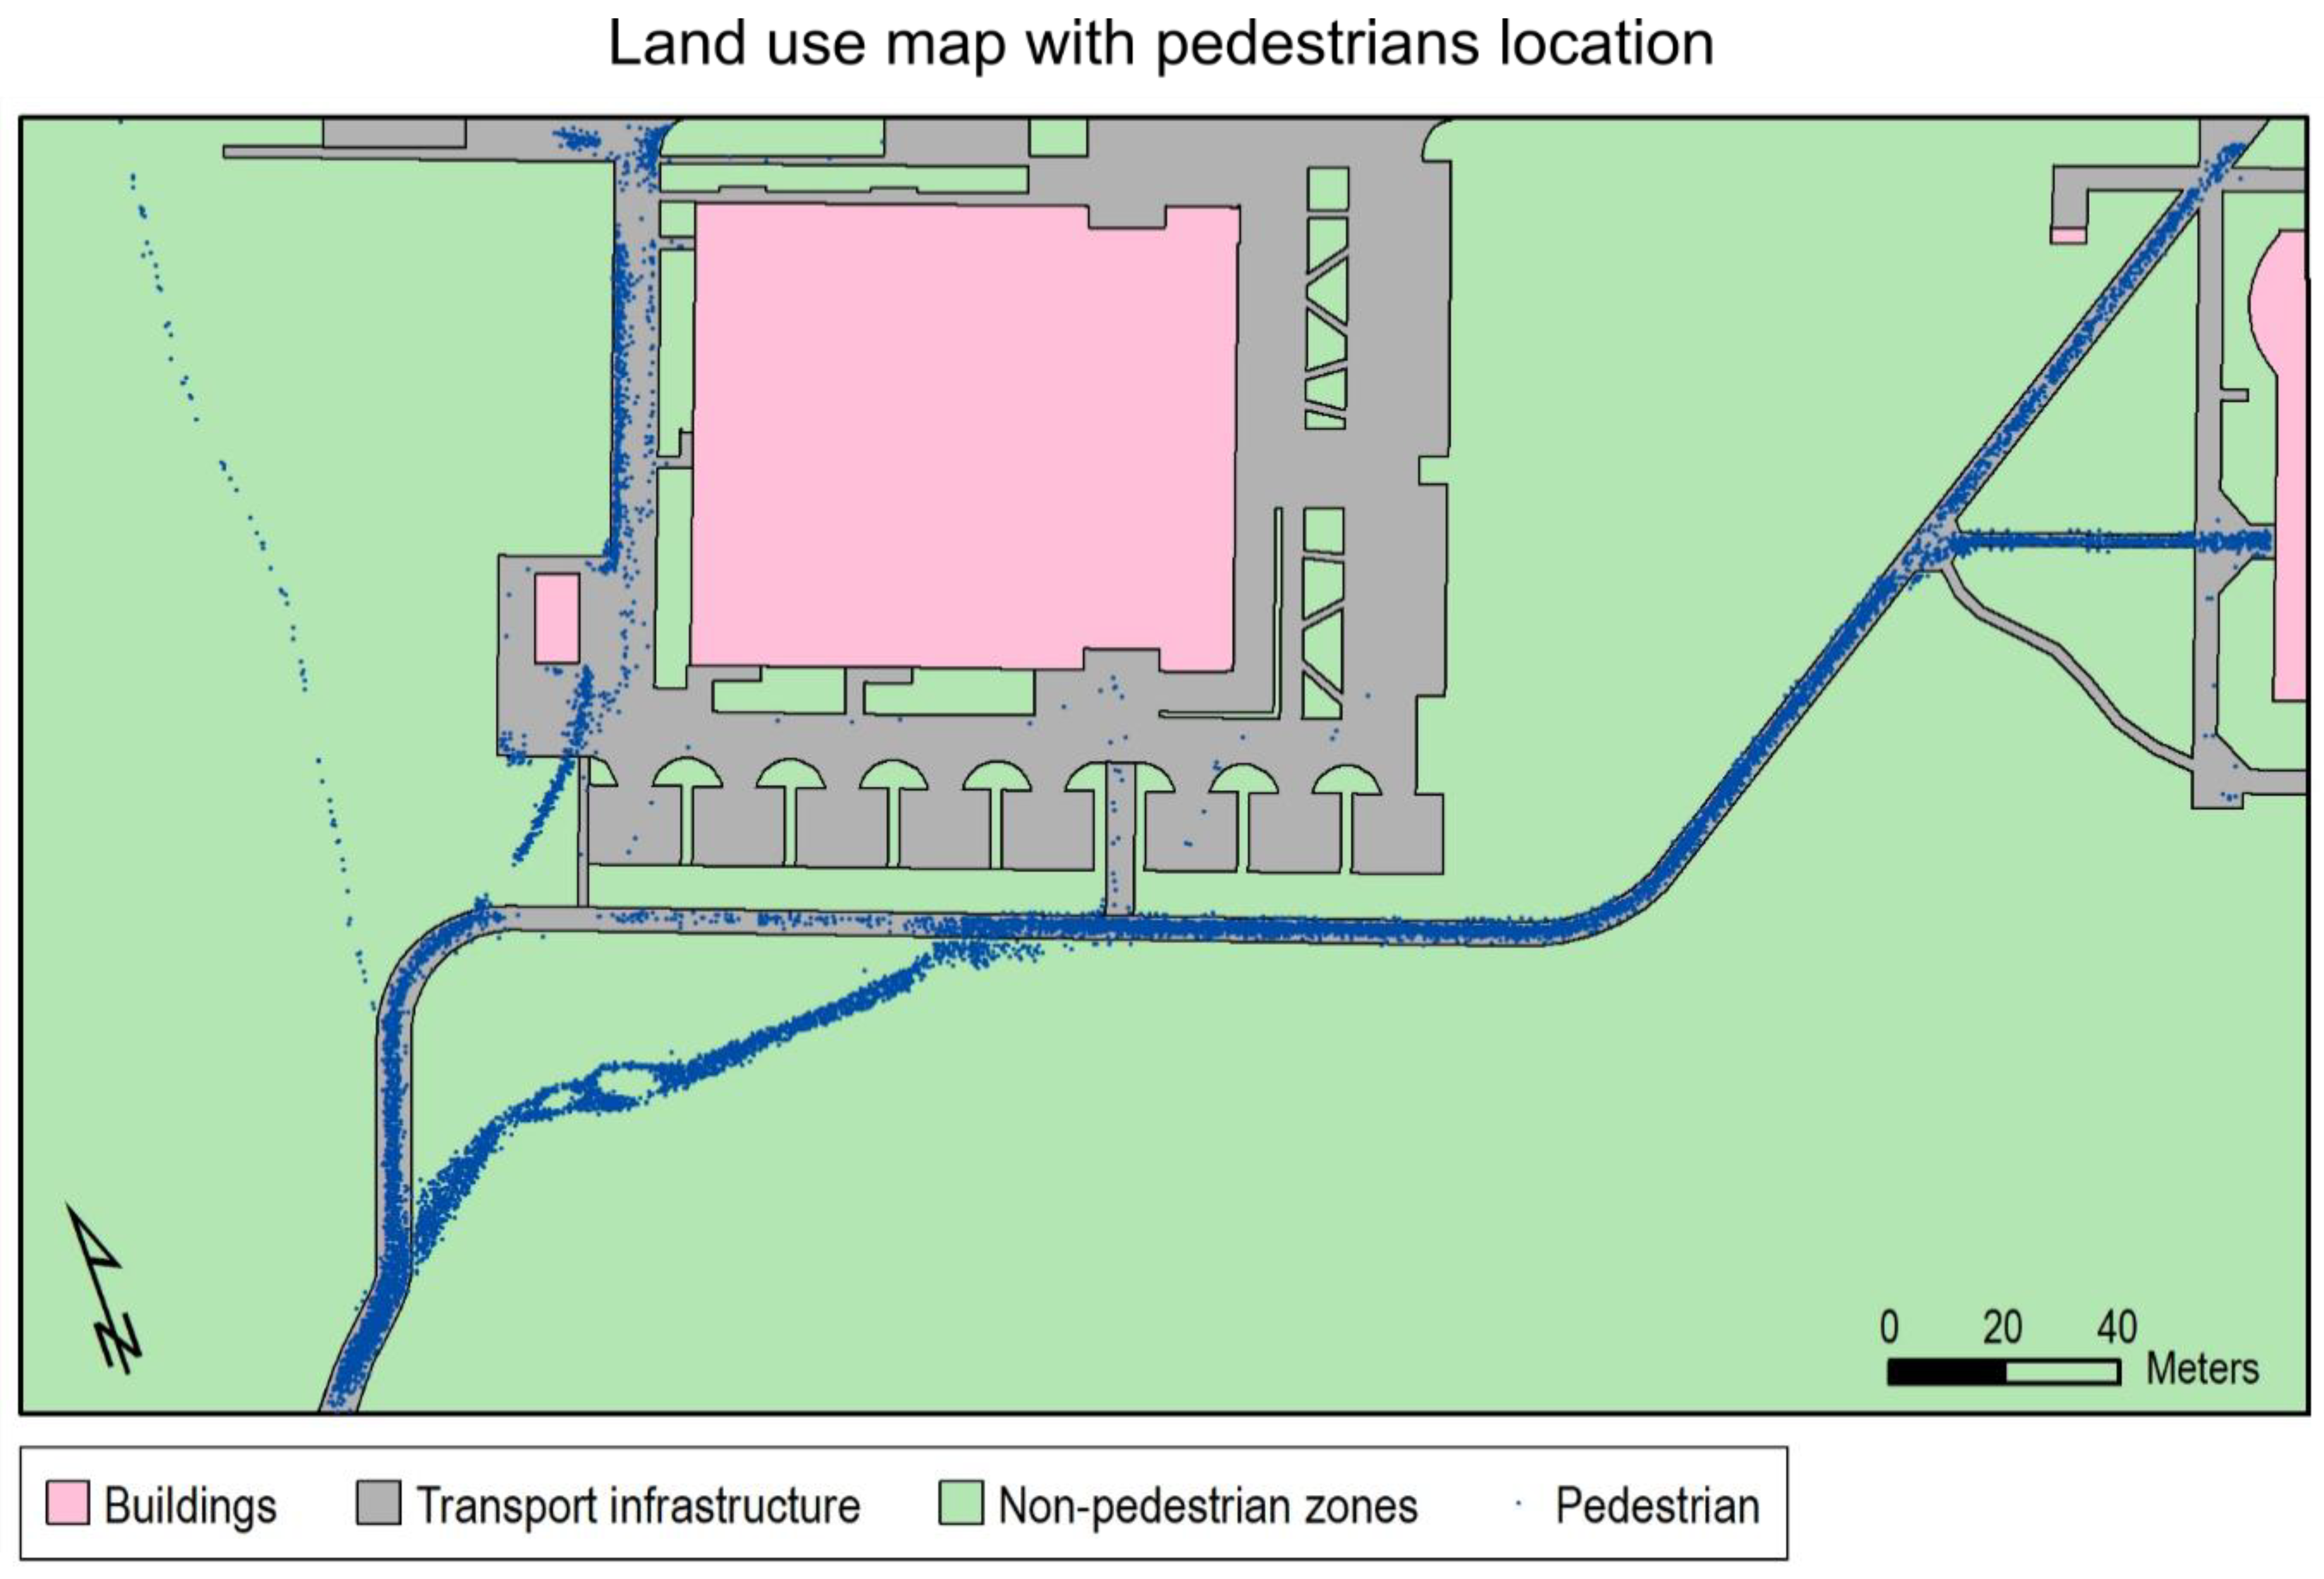
The map depicting land use with the location of pedestrians in the research area: the area method (qualitative data) and the dot method (quantitative data) (
Figure 5).
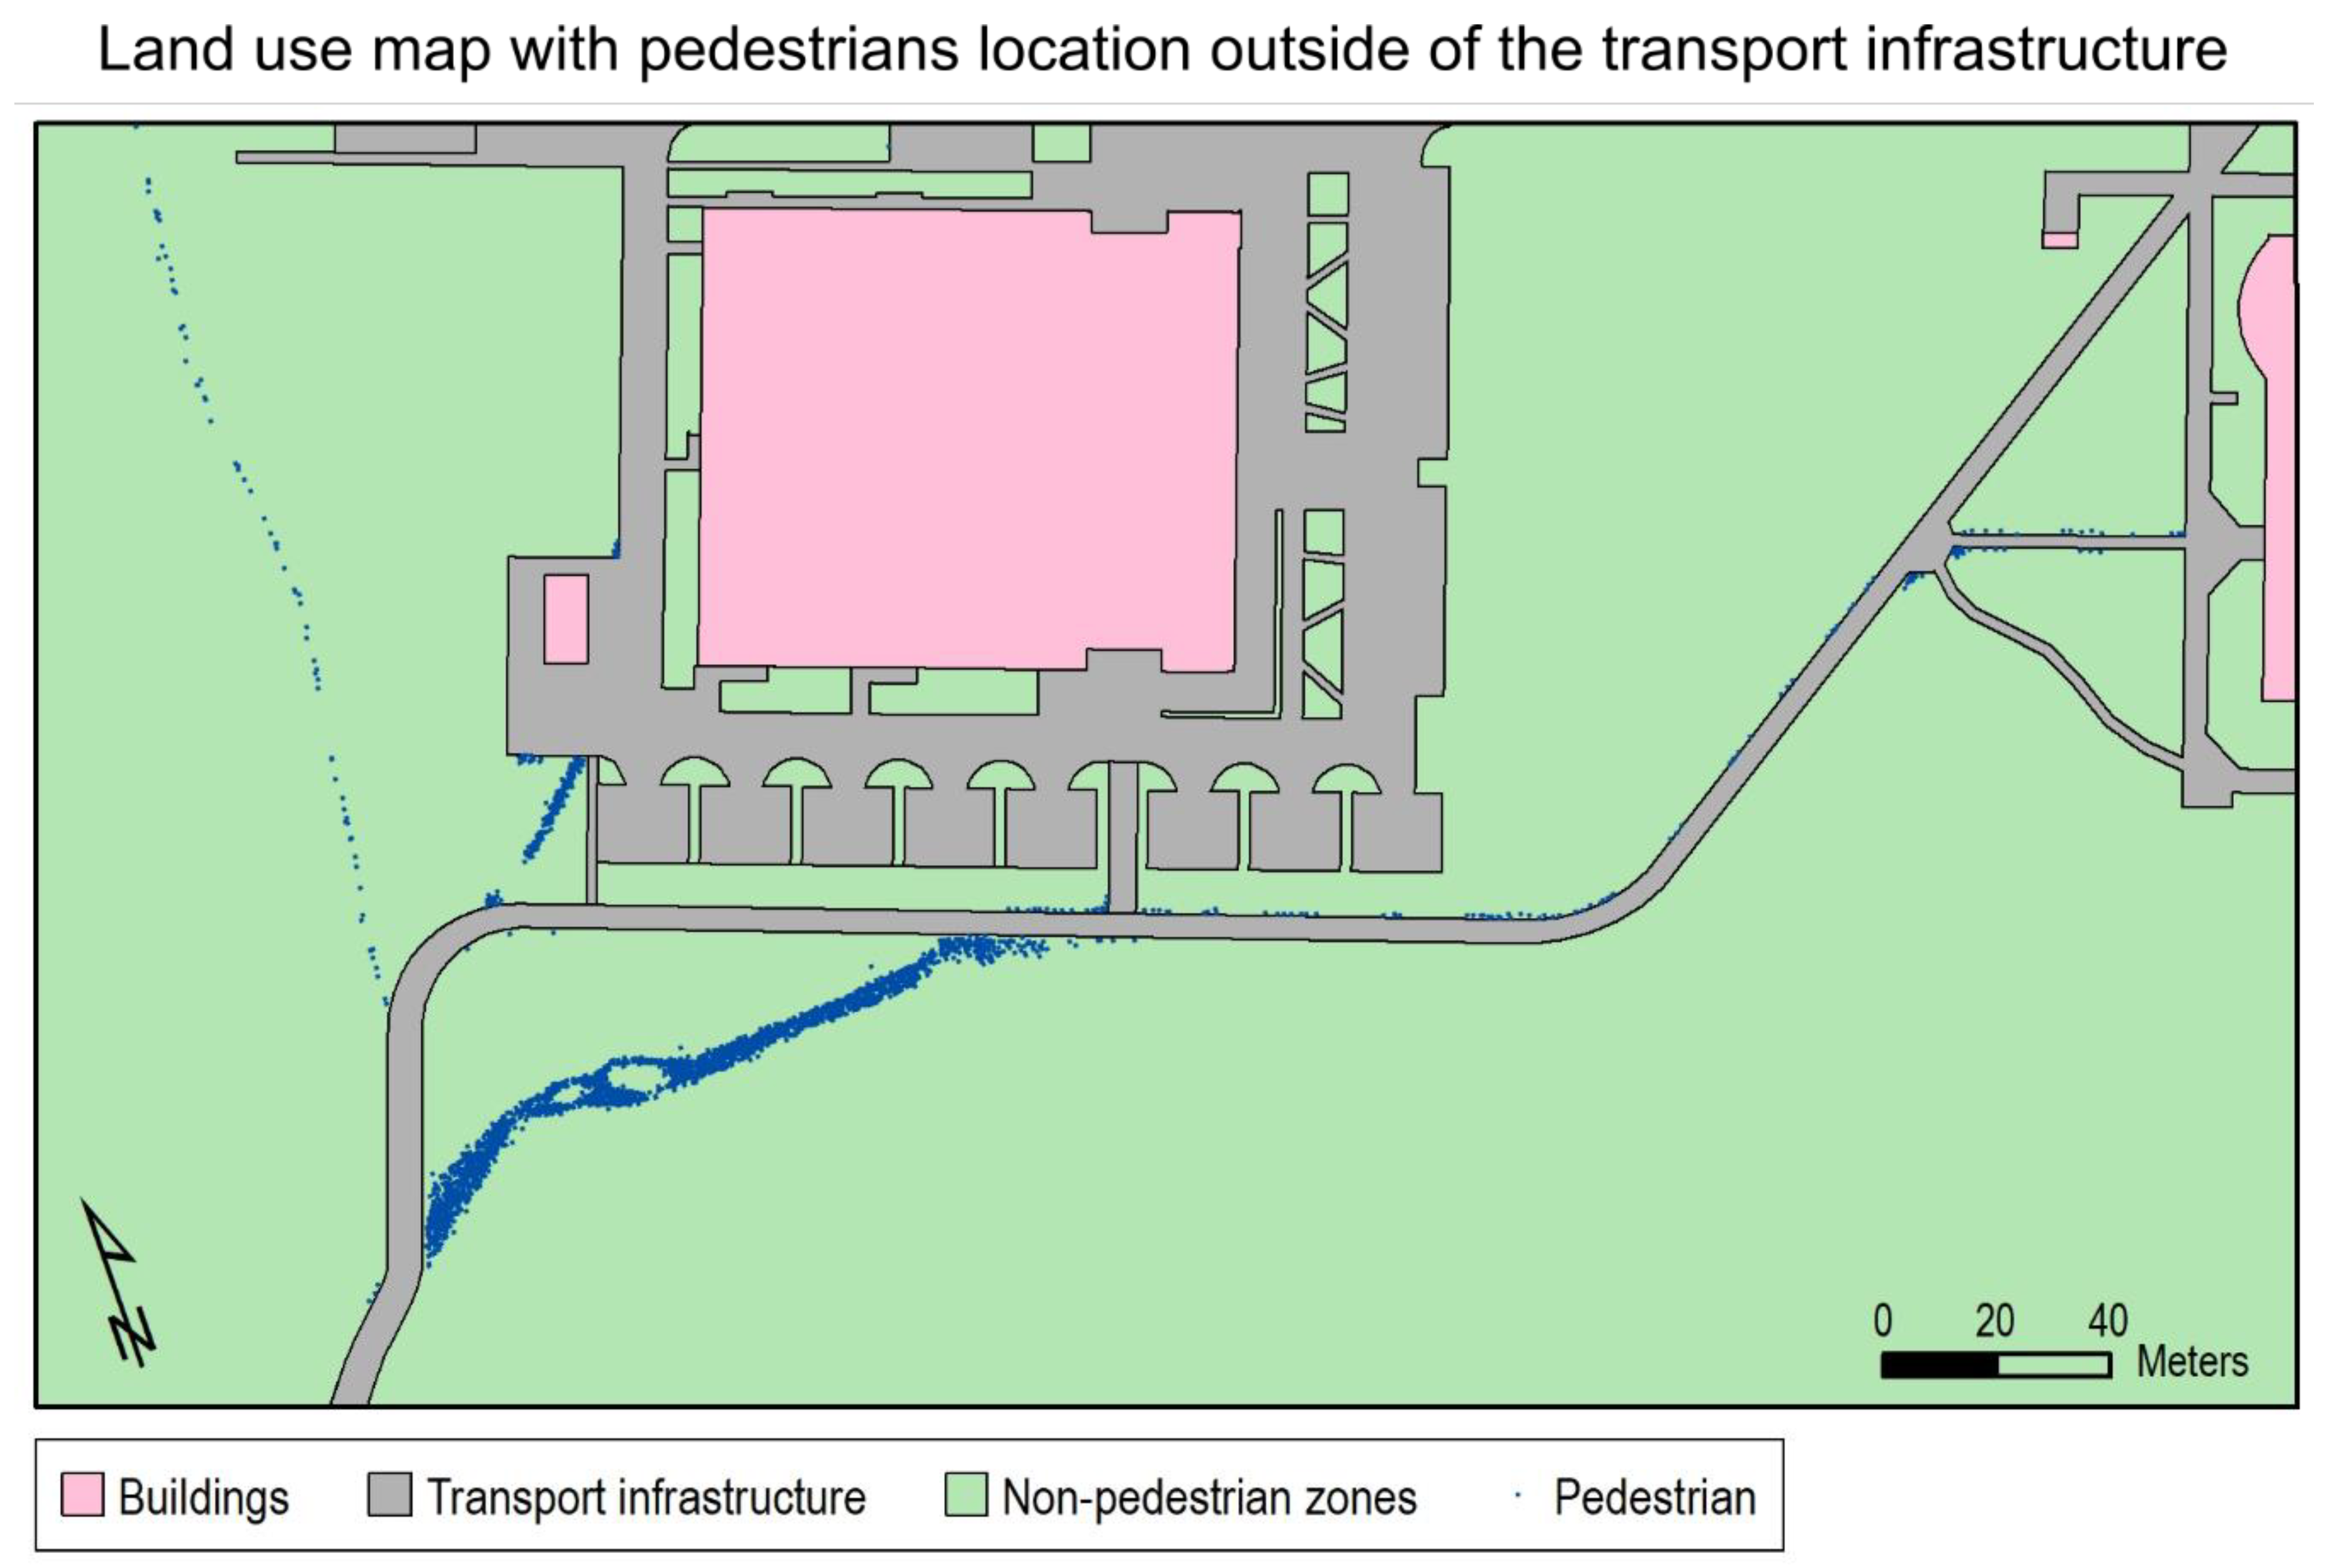
The map depicting land use with the location of pedestrians outside the transport infrastructure: the area method (qualitative data) and the dot method (quantitative data) (
Figure 6).
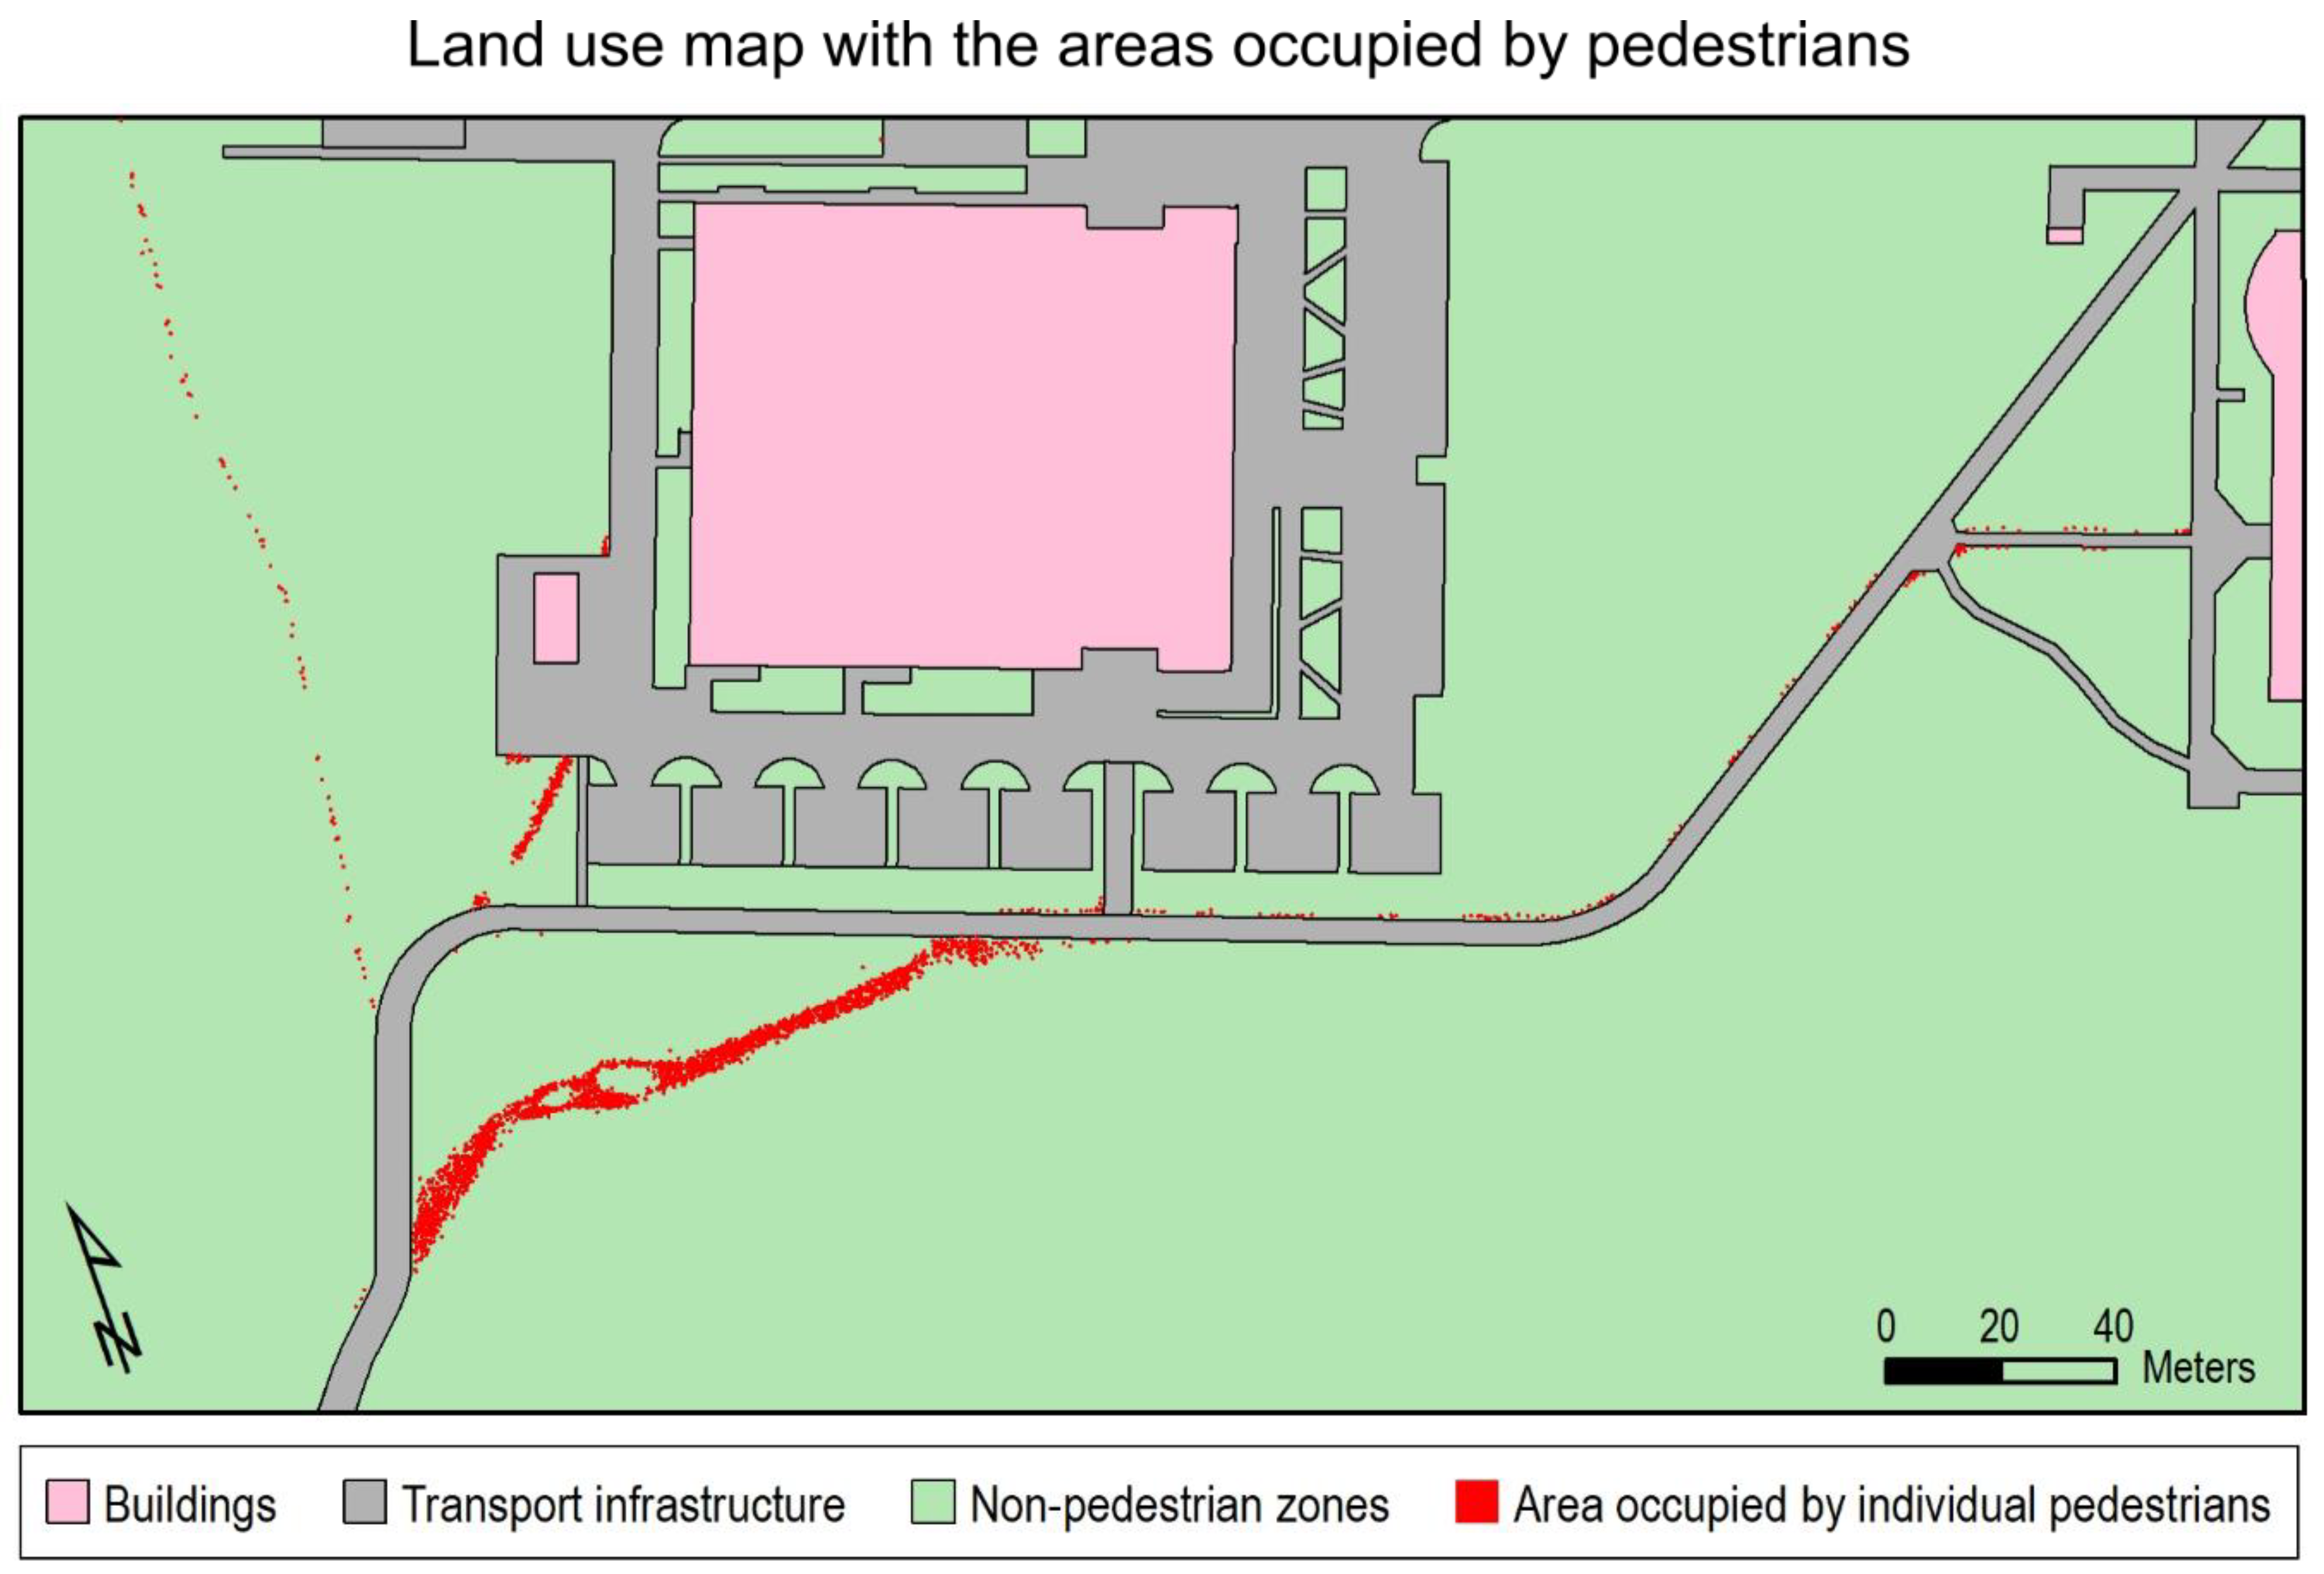
The map depicting land use with the areas occupied by pedestrians: the area method (qualitative data) (
Figure 7).
Mapping techniques were listed in terms of data type (geometry of objects).
Vectorization conducted in the research allowed one to obtain quantitative data presenting the location (X; Y) of pedestrians in the research area. The most natural way to present such data is to use dots [
36]. For presenting quantitative data we used the dot method. Points as 0-dimensional objects are represented with a pair of coordinates [
24], as presenting a point object on the map through direct physical representation of point geometry would make such object invisible. To read its location, it was necessary to use the additional attribute, the dot ratio. When designing our dot map, we assumed the dot width (diameter) of 0.5 mm, because it is the smallest symbol size recognizable by the map user [
37]. The dot created is a cartographic representation of a point feature, and the geometric center of the dot corresponds to the coordinates of the point it represents. On the previously prepared map (
Figure 5) pedestrians were represented as objects in the shape of a small circle, so that it is visible to map users. This is only the cartographic representation of a point object on the map. Quantitative data were presented in the background of the map showing the infrastructure of the research area (
Figure 2). Such combination of methods of cartographic presentation made it possible to present both qualitative and quantitative data. As a result, researchers obtained a map for the creation of which two methods, the dot method and the chorochromatic map were used. In
Figure 5 we demonstrated the spatial layout of all the recorded pedestrians (quantitative data) in the background of the infrastructure of the research area (qualitative data).
In the research. we decided to mark out the areas incorrectly used by pedestrians, i.e., informal land use. Pedestrians, who were moving outside the specified transport infrastructure, were considered informal land users. To single such people out of all recorded pedestrians, we carried out subtraction on the quantitative data set. Such activity was possible thanks to the use of the
Erase tool, which allowed to localize only those pedestrians outside the designated transport infrastructure. In Map 6 we marked pedestrians using land in the informal way. As in
Figure 5, for presenting quantitative (pedestrians) and qualitative (infrastructure) data, we used two mapping methods, i.e., the dot method and chorochromatic mapping.
A small research area and the UAV technology employed allowed us to obtain accurate location of individual pedestrians. We concluded that the representation of pedestrians by means of the dot mapping method was not adequate. It was related to the opportunity to work out large-scale cartographic visualizations that can faithfully reflect pedestrians in the research area. The intermediary objective of the research was to determine the area of the land that pedestrians used incorrectly, i.e., informal areas. We specified that it was necessary to carry out the point-to-polygon transformation of pedestrians’ representation.
Transformation was understood as a change of the mapping technique, i.e., the transformation of the geometry of the element used in cartography, which would allow us to determine the area that pedestrians occupy outside the transport infrastructure specified. The average length of a human footstep is between 62.5 to 75 cm, depending on sex and type of walk [
27]. We assumed that the area occupied by an individual moving pedestrian would be equal to a circle that is 75 cm (the maximum length of a human footstep) in diameter. That meant that each point object representing an individual pedestrian was been surrounded by a buffer of 37.5 cm, counting from the values of coordinates describing the location of the point. After transformation, one person was represented by means of a polygon object with the geometry of a circle occupying the area of 0.44 m
2 (
Figure 7). The ArcMap
Buffer tool was used to transform point features into area features. Transformation of the point representation of a pedestrian into the polygon representation resulted in the change in data type (from quantitative to qualitative data). The map presenting the area occupied by pedestrians outside the transport infrastructure (
Figure 7) was worked out with the use of the chorochromatic mapping method. The buffer value adopted in the research constitutes just an example and can be modified, depending on needs and the assumptions of the research.
3.5. Results: Working out Final Maps
Working out intermediary maps (
Figure 5,
Figure 6 and
Figure 7) made it possible to create additional cartographic analyses that effectively demonstrate the actual land use by pedestrians. Since we distinguished two mapping techniques, the following map types were worked out:
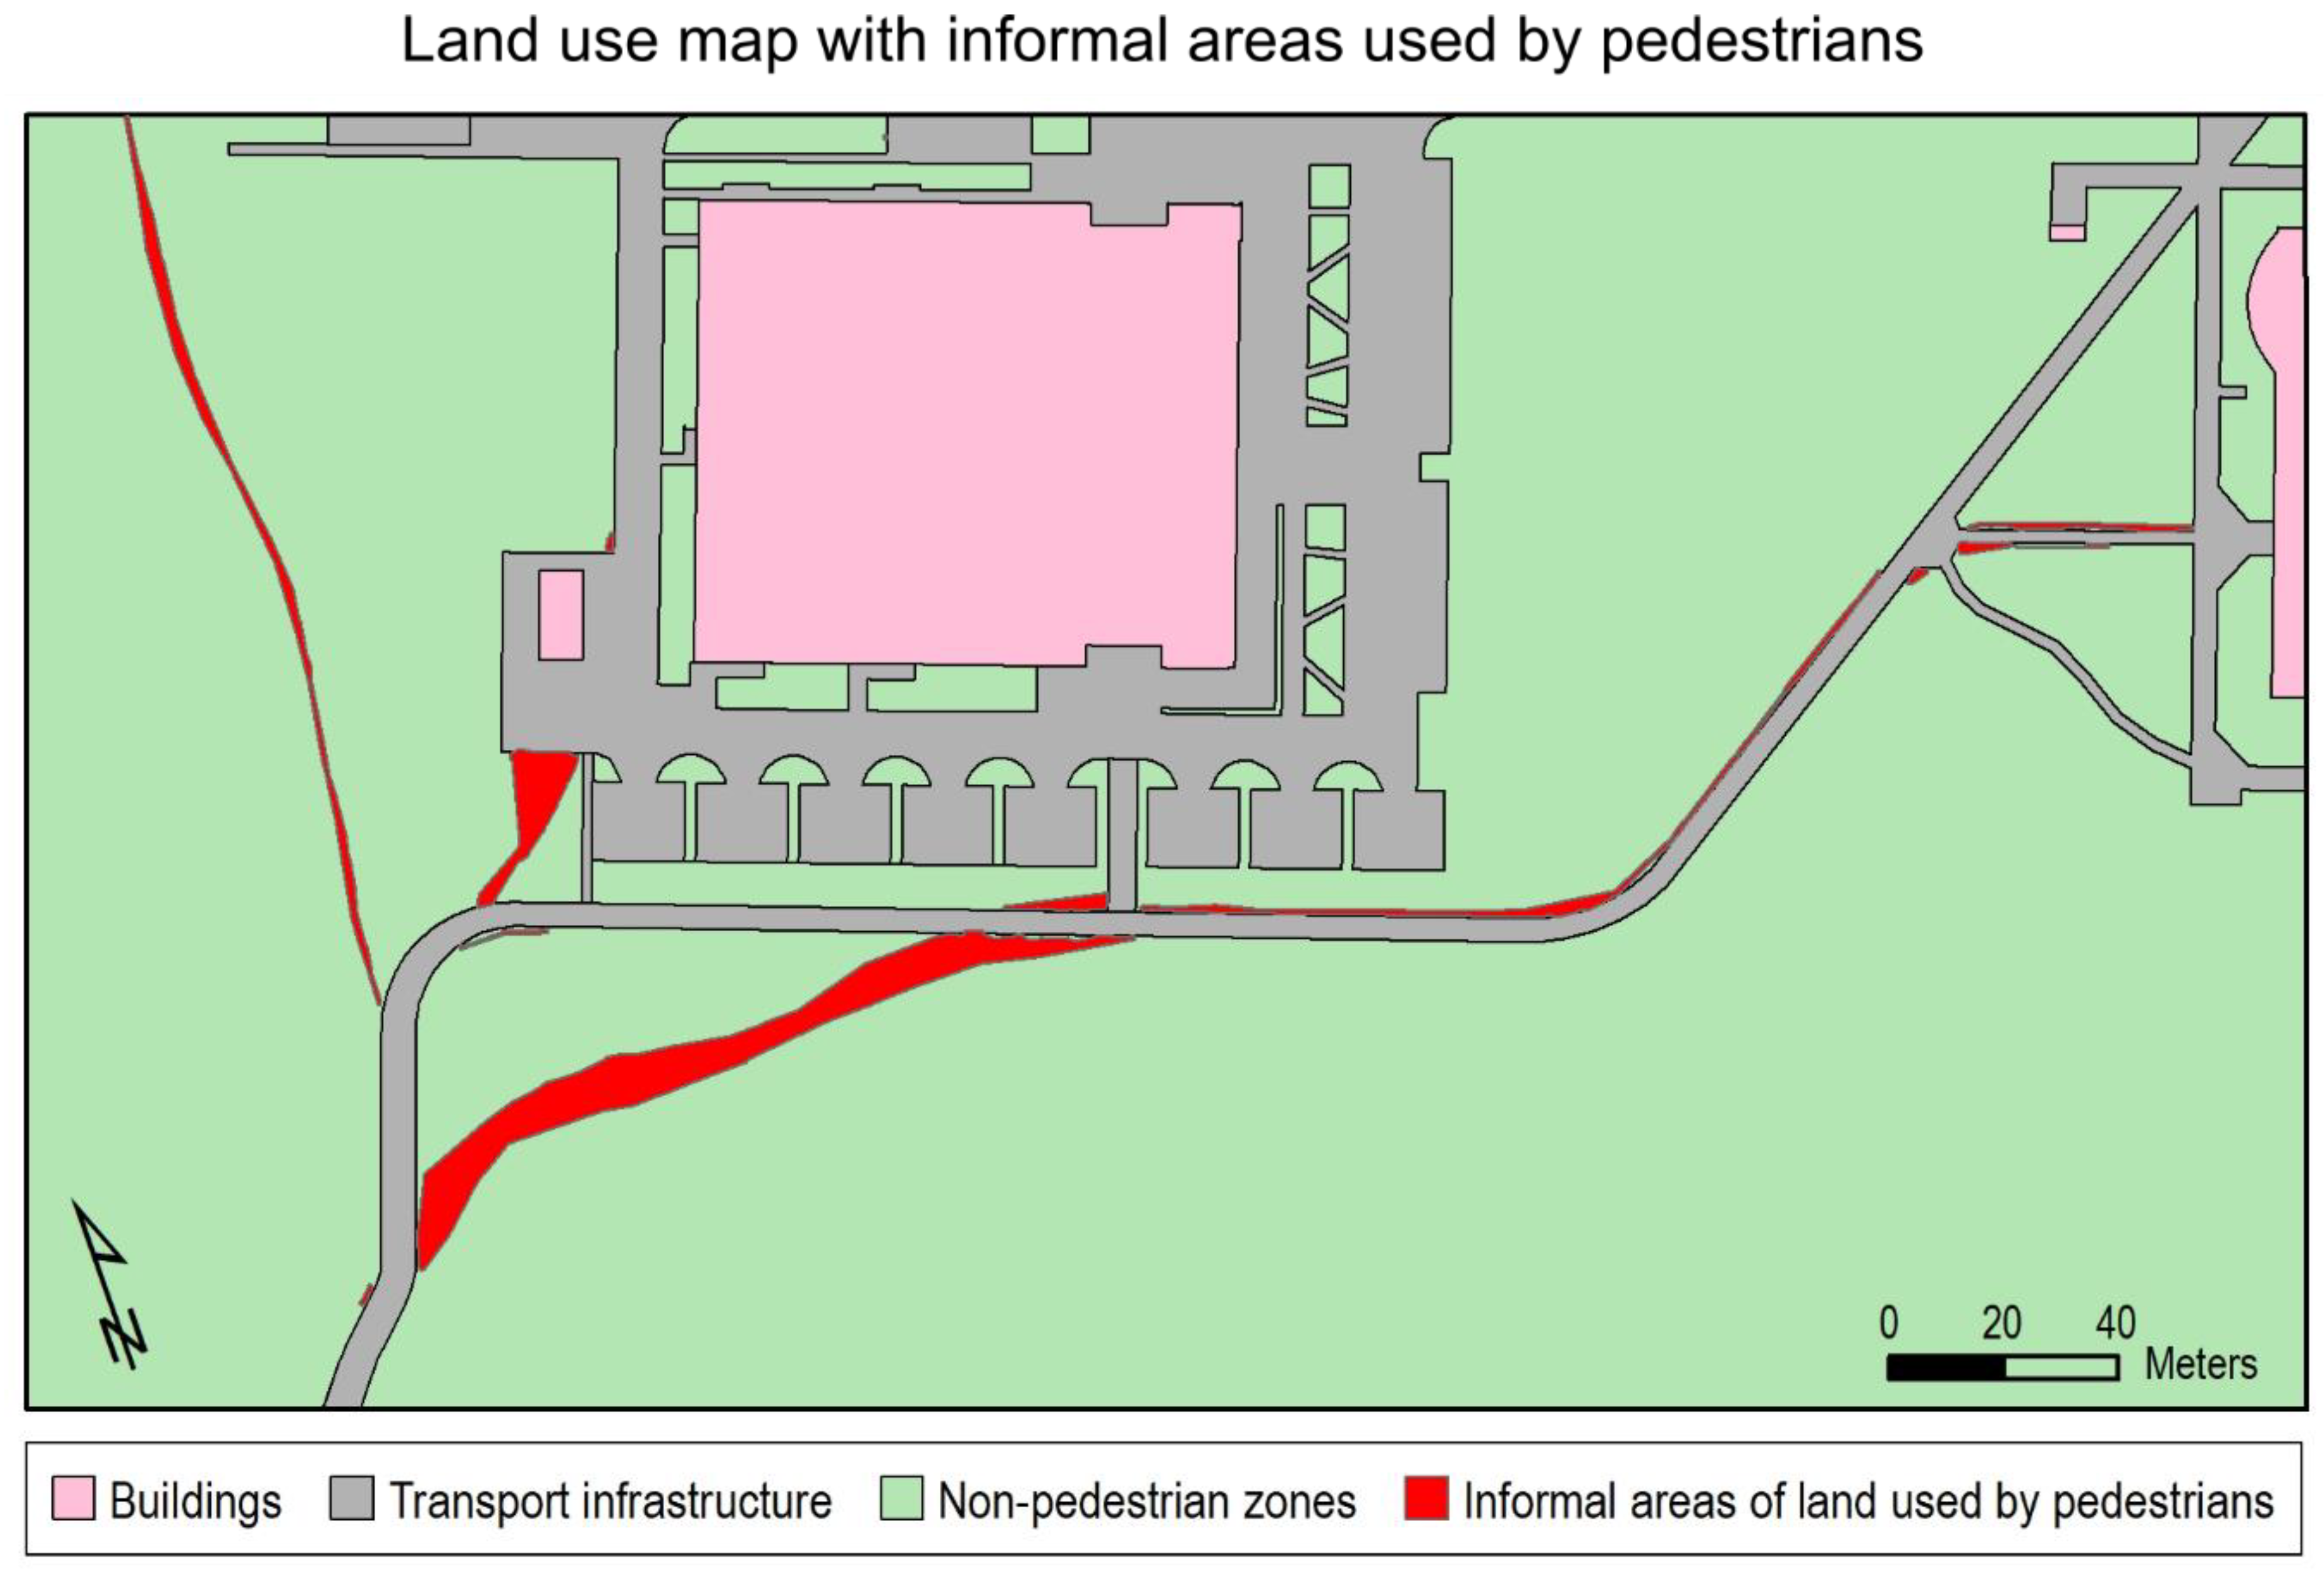
The map presenting informal areas of land used by pedestrians: the area method (qualitative data) (
Figure 8),
The map presenting pedestrian density in the research area: the area method (qualitative data) (
Figure 9).
The transformation of point objects into polygon objects (the representation of pedestrians on the map) allowed us to determine the area occupied by individual pedestrians in the research area. The area in question refers only to pedestrians recorded in individual images and does not determine the land use area. When obtaining images at specific intervals, it is impossible to obtain data on the location of individual pedestrians in the research area between the states recorded. However, the large number of recorded pedestrians in individual images of the same area and visibly repetitive pedestrian routes in the research area make it possible to obtain data on the location of pedestrians at the time between individual images. In the research, individual images recording the research area were obtained at 10-s intervals, which was related to the observation of the dynamic phenomenon. To determine the actual size of informal land use areas in the analyzed research area, we decided to aggregate (generalize) the polygons created. For this purpose, the
Aggregate Polygons cartographic generalization tool available in the ArcMap software was used. During the process of defining aggregate variables we determined the aggregation distance representing individual pedestrians, which was 13.9 m. The value defined the average distance the pedestrian could cover in 10 s, i.e., during the interval between individual images. In our calculations, we assumed that the average walking speed was 5 km/h [
28,
29,
30]. To avoid the aggregation of polygons located on the opposite sides of sidewalks, the dividing layer (i.e., the transport infrastructure) was determined. Because of this aggregation, we obtained the area of the informal land use by pedestrians in the research area (
Figure 8). In addition, the repeatability of pedestrian traffic along the transport infrastructure, recorded on interval images from Low-Level Aerial Imagery and carrying out cartographic generalization consisting in the aggregation of surface objects presenting individual pedestrians on images made at different times, allowed for the estimation of their paths, and obtaining information about the location of pedestrians in the time between single images. For working out the map, we used the chorochromatic mapping method that presents qualitative data on land use. Additionally, aggregation allowed us to generalize areal data presenting the area occupied by individual pedestrians and to obtain the total area of informal land use (
Figure 8).
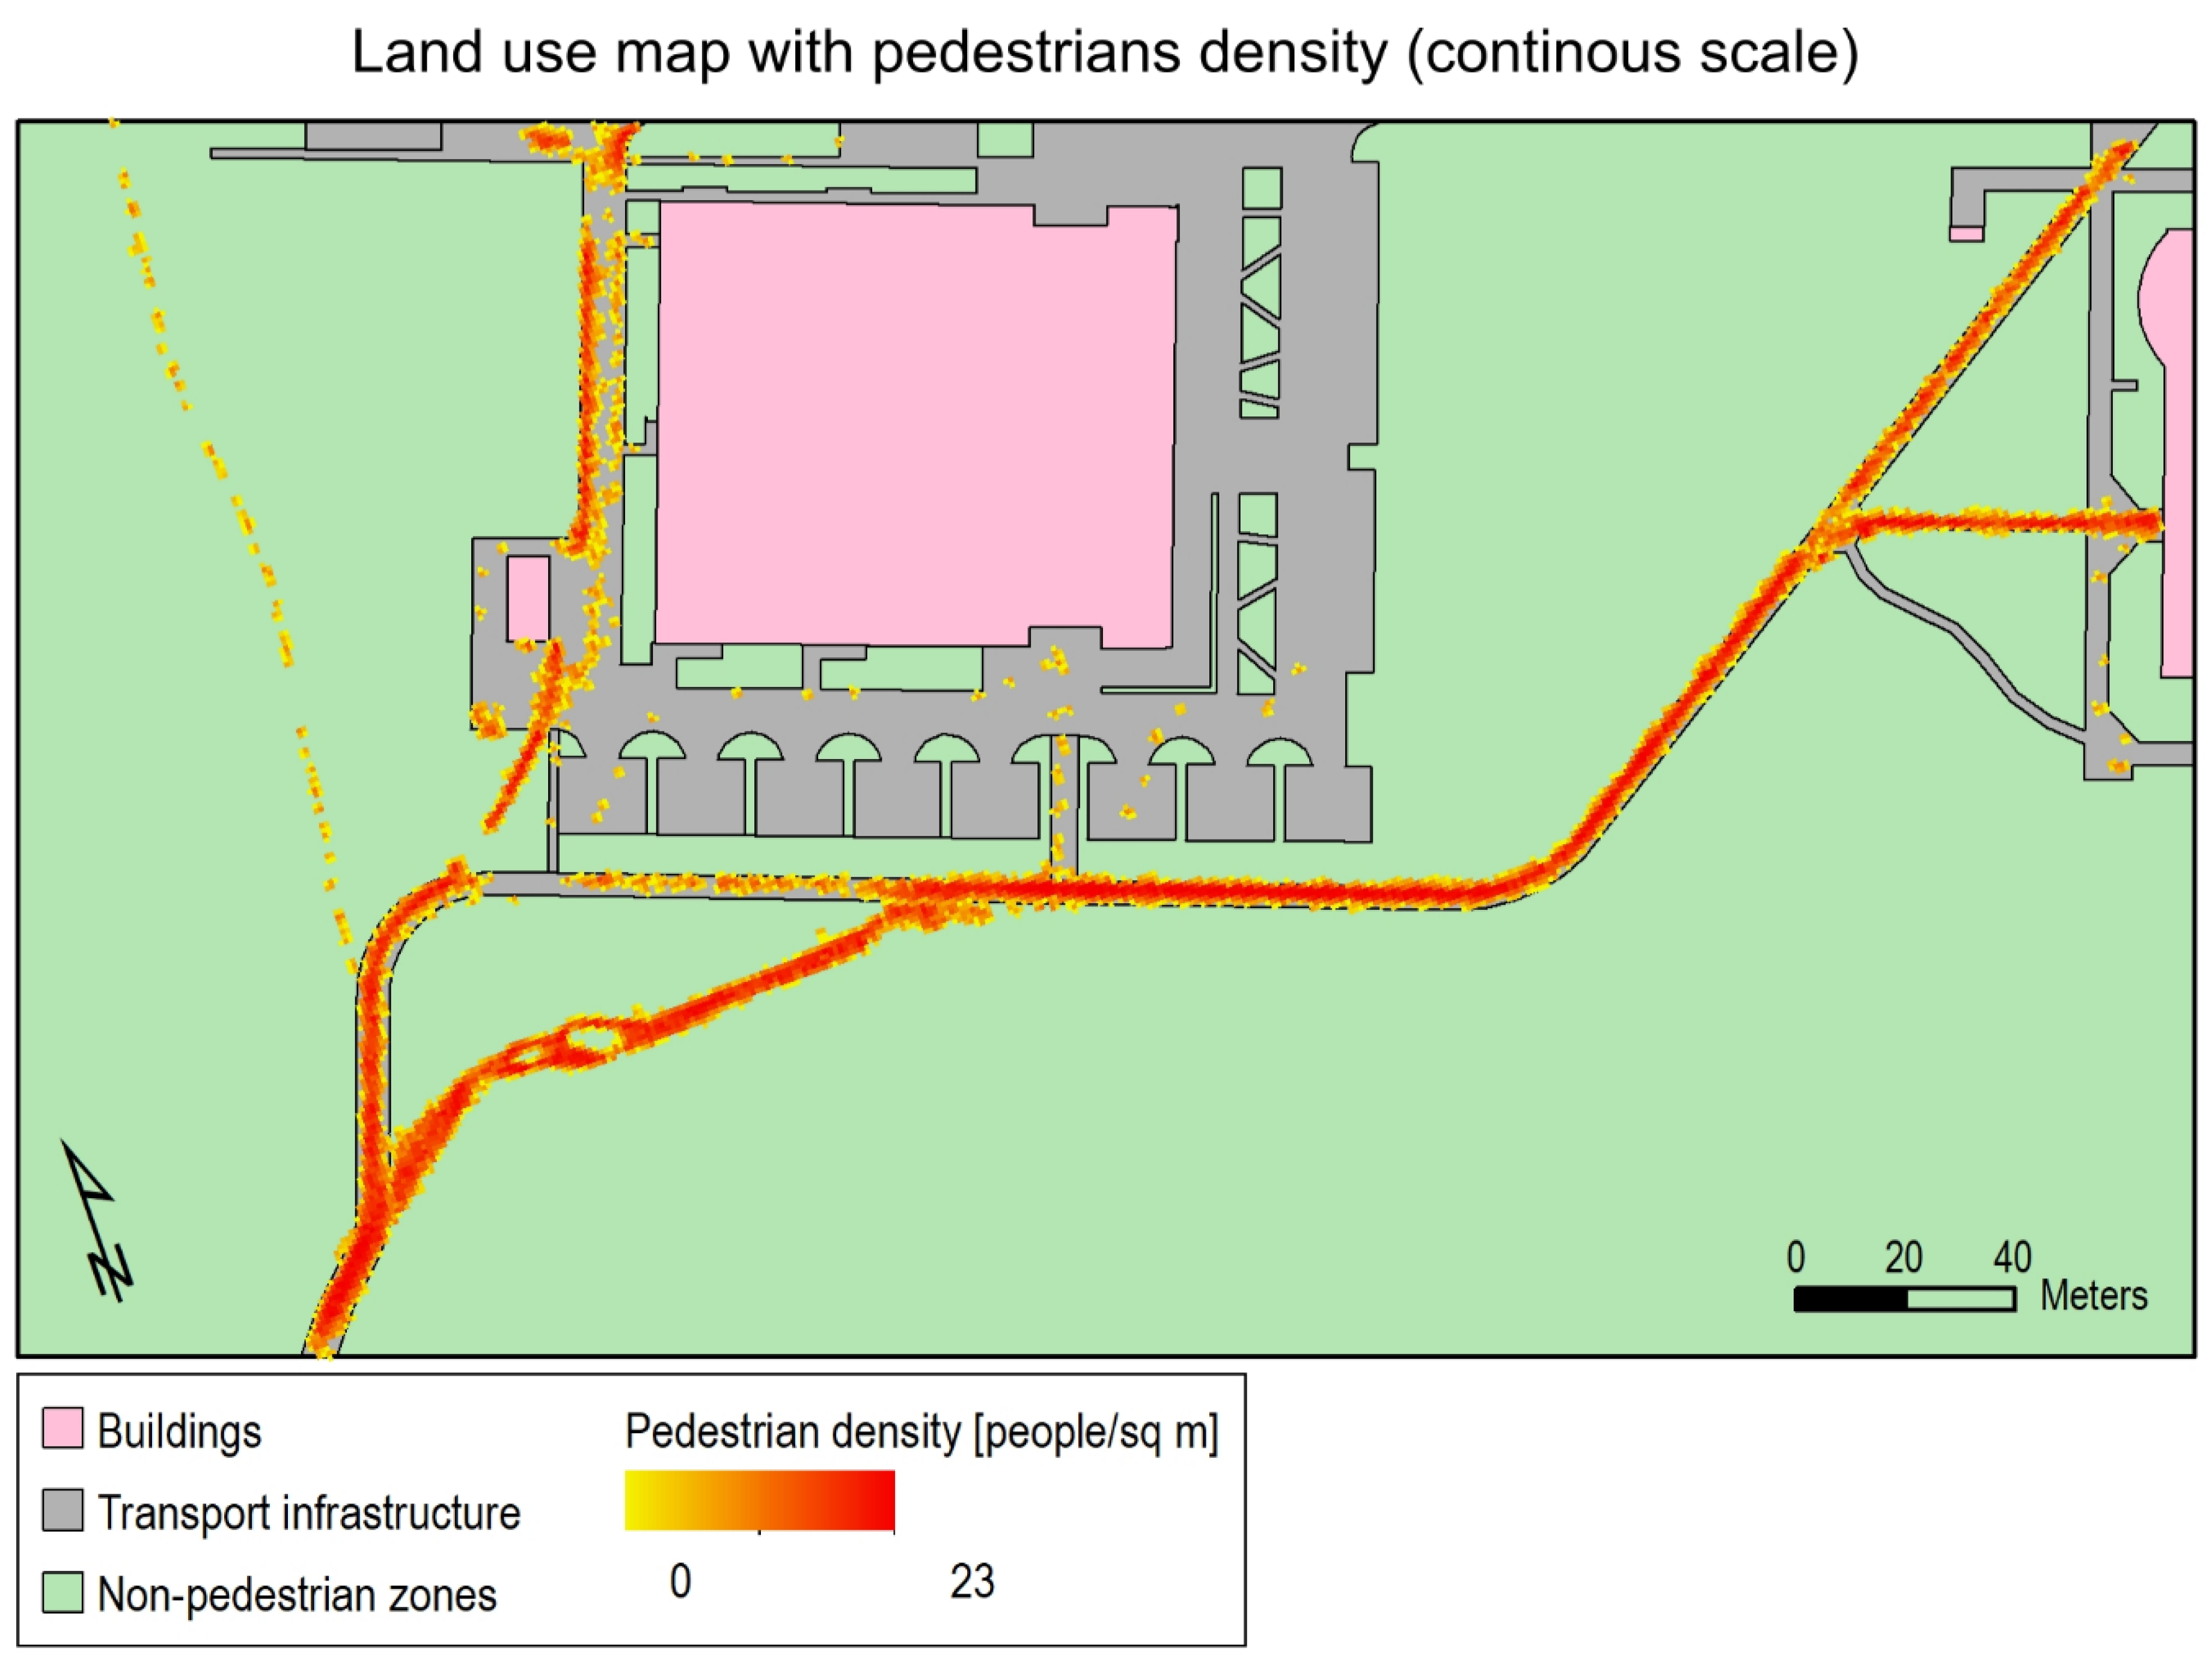
The presentation of large sets of quantitative data makes it difficult or even impossible to interpret the represented phenomenon correctly. To effectively present the results of the quantitative data set study, we used the
heat map [
23]. In traditional cartographic methodology maps presenting quantitative data are considered cartograms if they cover the entire area [
38]. However, if they show values of average intensity only for classified fields, they are considered dasymetric maps. In the research the dot method was used for working out the heat map that presented quantitative data by means of the area method (the dasymetric map). The heat map was created in the software using the
Kernel Density tool. To work out the
heat map [
39], we used point objects presenting the location of pedestrians. According to the nomenclature of cartographic methodology, to design the heat map (
Figure 9), we used a dasymetric mapping method, presenting the average phenomenon intensity only in classified fields, i.e., areas in which the presence of pedestrians was identified. To boost the effectiveness of data presentation, we showed the data in the background of the research area infrastructure, worked out with the use of the chorochromatic method. We calculated pedestrian density in the research area and provided it in the form of the number of people per 1 m
2. The heat map of the observed pedestrian movement allowed us to obtain information about the frequency of use of specific research areas by pedestrians (
Figure 9). It showed that, despite the existing transport infrastructure, pedestrians use areas that are not meant to be used for walking. Moreover, the map makes it possible to draw a conclusion that such phenomenon occurs very frequently in some parts of the research area.
The use of the heat map compensated for the disadvantage of the dot map, i.e., the lack of differentiation when the dots touch each other or overlap. Therefore, we proposed to present quantitative data using a continuous-scale heat map to obtain information about the intensity of pedestrian traffic in the study area. Unlike the dot map, the heat map presents surfaces with a cumulative number of point features. In the case of this test, it is an area of 1 m
2. Additionally, we proposed a second version of the heat map (
Figure 10), with a more interpretable step scale in four intervals based on Jenks’ natural breaks classification method.
4. Conclusions and Discussion
In this article, we demonstrated a method of researching and visualizing actual land use. The research was conducted based on low-level aerial imagery obtained from UAVs. The UAV technology allowed us to observe and record pedestrian movement in the research area under analysis. As pedestrians were recorded, it was challenging to design a raid with the UAV platform to ensure maximum security for them. It was then necessary to meticulously observe the analyzed urbanized area in search of possible location of photogrammetric raid stations. Determining them with precision helped us accurately capture the entire research area. It mattered also in terms of opportunities to carry out the process of aerial triangulation of the imagery obtained and to achieve possibly accurate value of pedestrians’ location in the research area. Modelling static objects by means of the UAV technology, as commonly described in the literature, allowed us to extend the methodology of observing pedestrian movement as a dynamic phenomenon. The methodology of designing maps presenting the actual land use and considering the areas used by pedestrians based on UAV images can be used in other areas while meeting two conditions. The first condition is that there should be relatively high pedestrian traffic in the transport infrastructure and in nonpedestrian zones. The second condition is the ability to use the UAV platform with safety for people and appropriate technical conditions.
Data obtained in this way made it possible to create thematic maps to present the actual use of a small, urbanized area, including areas where pedestrians changed the form of use.
To be able to obtain data on land use and the location of pedestrians through the observation of their movement, it was necessary to select the appropriate UAV platform. A study of the subject made it possible to choose a multirotor UAV as a highly effective tool, maintaining one position during a raid and constantly observing the entire research area. A selection of time intervals between images was also a highly significant factor. Taking into consideration the average speed of pedestrians during walking, we established that 10-s intervals are optimal for recording pedestrian movement.
It was possible to determine the area occupied by individual pedestrians in the research area thanks to the change of method, as the dot method (
Figure 5) turned into the area method through the transformation of point objects into polygon objects based on the adopted basis of the buffer value (
Figure 7). The value of the buffer diameter is a proposal based on the human stride length while walking [
27]. It can be modified depending on the observed dynamic phenomenon; for example the visualization of runners. The cartographic generalization, consisting in the aggregation of polygon objects presenting individual pedestrians, allowed us to group individual polygon objects in informal land use areas (
Figure 8). We presented a concept of the representation of the point-to-polygon transformation of pedestrians in
Figure 3.
We worked out mapping methods adjusted to vectorial point-to-polygon transformation of pedestrians’ representation and indicated validity of using qualitative methods (the range method) and quantitative methods (the dot method, the dasymetric version of the heat map,
Figure 9) other than just the chorochromatic method.
The suggested method of new visualizations consisted in the point-to-polygon transformation of the representation of pedestrians [
18]. We believe it is the way to enrich the process of designing land use maps that so far have focused on conveying spatial data in the traditional way in the form of chorochromatic maps. We are not trying to suggest the best method, as each of these mapping techniques depicts different features of the phenomenon [
40]. Hence, the effectiveness of these maps depends on the aspect of the spatial phenomenon they analyze. The employment of the principles of static map design helps one to create a clear and transparent cartographic image [
22].
Quantitative data, such as the location of individual pedestrians on the map, can be depicted by means of the dot method. However, if multiple point objects occur next to one another, the effectiveness of the map diminishes and it becomes less clear [
41]. To boost the effectiveness of the map, such quantitative data can be presented by means of the heat map (specific variant of the choropleth map), which makes it possible to present the number of pedestrians per given area.
The point-to-polygon transformation of pedestrian representation constitutes a shift from quantitative to qualitative data. Thanks to the generalization of qualitative data in the area occupied by individual pedestrians, it is possible to depict the actual land use. However, such data presentation fails to provide information on magnitude of the occurring phenomenon, as opposed to heat maps. In our opinion, the actual use of land, considering the places for which pedestrians changed the form of use, is a good way to combine several mapping techniques to present the quantitative and qualitative aspects of this spatial phenomenon. We decided to add the second version of the heat map (
Figure 10) with a more interpretable step scale [
17,
22,
38,
42].
The research conducted and the cartographic analysis designed constitute a suggestion how pedestrians recorded in the research area by UAVs can be represented. So far, researchers have attempted to develop a visualization of participants in a mass event based on low-level aerial imagery [
18]. In their research, they proposed a set of animations that presented the distribution of participants in a mass event (dynamic objects) in the research area at specific times of the event. Additionally, the animations show the main points of interest of the participants of the mass event (static objects). Dynamic and static objects were presented using an orthophotomap, a dot map and a map of buffers then assessed by experts in terms of the effectiveness. Most of the pedestrians in the study cited sat, but were not in motion. Methods of presentation can be developed and modified, and then tested on users [
18]. Sets of data resulting from such studies can be used for creating visualizations in 3D and 4D, which were not the subject matter of the research but have a great potential for perspective and temporal geovisualizations [
7]. Broad sets of quantitative data, obtained by means of UAVs, can be also used for designing animated cartographic visualizations [
43].
Currently, new methods of cartographic presentation can be analyzed more accurately in terms of effectively conveying data through eye-tracking studies carried out on users [
44,
45]. Recognition and tracking of human trajectories is a valuable issue due to many aspects of everyday life. A method commonly used for this purpose was satellite receivers [
46]. In the past, attempts were made to determine human movement due to the epidemiological risk and the possibility of transmitting serious diseases through movement and contact with other people [
47]. Data obtained with the use of basic GPS receivers, which were equipped with students moving around the campus. However, the basic GPS receiver does not allow to obtain accurate data on the location of individual people, unlike the UAV platform and the obtained images fitted into the coordinate system based on the GCPs. In addition, the proposed method of tracking pedestrians with the use of a GPS receiver requires that each tracked person be equipped with it, which may cause unnatural behavior. The method we propose using the UAV platform allows for the observation of people moving without affecting their behavior. As such, it was possible to determine the actual land use by pedestrians and to design a large-scale thematic map to present the phenomenon.


