Prototyping a Social Media Flooding Photo Screening System Based on Deep Learning


Department of Geography, University of South Carolina, Columbia, SC 29208, USA
*
Author to whom correspondence should be addressed.
ISPRS Int. J. Geo-Inf. 2020, 9(2), 104; https://0-doi-org.brum.beds.ac.uk/10.3390/ijgi9020104
Submission received: 31 December 2019
/
Revised: 29 January 2020
/
Accepted: 7 February 2020
/
Published: 9 February 2020
(This article belongs to the Special Issue Spatiotemporal Platforms for Addressing Social and Physical Challenges)
Abstract
:This article aims to implement a prototype screening system to identify flooding-related photos from social media. These photos, associated with their geographic locations, can provide free, timely, and reliable visual information about flood events to the decision-makers. This screening system, designed for application to social media images, includes several key modules: tweet/image downloading, flooding photo detection, and a WebGIS application for human verification. In this study, a training dataset of 4800 flooding photos was built based on an iterative method using a convolutional neural network (CNN) developed and trained to detect flooding photos. The system was designed in a way that the CNN can be re-trained by a larger training dataset when more analyst-verified flooding photos are being added to the training set in an iterative manner. The total accuracy of flooding photo detection was 93% in a balanced test set, and the precision ranges from 46–63% in the highly imbalanced real-time tweets. The system is plug-in enabled, permitting flexible changes to the classification module. Therefore, the system architecture and key components may be utilized in other types of disaster events, such as wildfires, earthquakes for the damage/impact assessment.
1. Introduction
Flooding poses a considerable threat to human occupation of the landscape and results in the most significant property damage of natural disasters. It dysfunctions human settlements, damages infrastructure, and causes countless losses in local economy and residential properties. Flooding is a common type of natural disaster in the United States [1]. While the heavy rainfall pattern may be changing from global warming, floods are becoming more frequent in the United States [2]. In recent years, the United States suffered from several severe floods, such as the Louisiana Flood in 2016, Houston Flood in 2017, and Hurricane Florence Flood in 2018. Damages from floods in the United States was up to $60 billion in 2017 [3].
Situational awareness and inundation mapping requires an early notice of where a flood is occurring and how severe (commonly referred in the disaster community as “how big and how bad”). Inundation maps serve the purpose of defining the flooding extent and severity, flood forecasting, and floodplain mapping [4,5]. The U.S. Geological Survey (USGS) usually sends out a team after a major flood event to collect the high watermarks in the field. These maps are often officially published months after the flood event [6], and while useful for mitigation and modeling, there are no timely for a present flood event.
Volunteer geographic information (VGI) is a potential solution for rapid flood mapping [7]. Known as the “human sensors” in the context of VGI, social media (e.g., Twitter, Facebook) users collect and broadcast information about their physical and social environment [8,9,10]. Recent studies demonstrated that real-time, free, and geotagged social media posts could be exploited in rapid flood situation awareness and mapping [6,11,12,13,14]. Most of these studies have viewed the uploaded photos in flood relevant posts as the critical in situ visual information for enhancing flood situational awareness. For instance, a photo posted by a resident showing a flooded yard is useful for assessing the water height and working conditions for nearby flood controls.
However, efficiently and accurately extracting useful flooding-related photos from the massive amounts of unstructured social media data poses considerable challenges. For example, in November 2018 approximately 5000 tweets were posted, on average, each second [15]. Those tweets cover various topics and flood-related topics represent very small proportions. Among those pioneering studies, keyword-based manual filtering of the flood relevant posts is the dominant method [6,11] but with obvious limitations. First, the posts that contain flooding photos might be overlooked if there is no flood-related keyword in the text. Second, manually examining the massive social media posts is inefficient, leading to the impracticality of real-time analysis.
There are substantial challenges to automatically identifying relevant and extracting appropriate flooding-related information from social media-posted images. The uploaded images may include screenshots of text, posters, illustrations, cartoons, advertisements, modified photos. For a flood event, the on-topic images only represent small portions of the entire dataset, and this is especially true for tweets with geographic information. For instance, the global geotagged tweets with “flood” represent only 0.034% of the geotagged tweets from the Twitter Streaming Application Program Interface (API). The tweeted photos were captured from various devices, angles, and environments, serving a wide variety of purposes. The arbitrariness of an attached photo exacerbates the uncertainty of the detection results. Thus, a fully automatic flooding photo detection method is difficult to implement, and a manual final verification stage is needed before the labeled flooding photos can be used. In addition, the location information is critical for disaster situational awareness and response, so that verifying the locations of those flooding photos is required. Currently, there is no feasible method to conduct location verification except manual work. Therefore, a practical approach is to build a system that can automatically filter out irrelevant photos and provide a relatively small amount of flooding photos for manual verification.
Deep learning, or multi-layer artificial neural network approaches, has gained rapid development since 2012 [16]. It is widely used to identify objects, recognize speech, or match items [16]. As a non-manual and efficient filtering method, deep learning is a promising approach to extracting flood-relevant posts from massive social media data [17]. For example, recent studies [18,19,20] analyzed both the text and image of a post to determine whether the post is flood relevant or not. More importantly, the deep learning method can process the massive social media data in real-time, providing timely information for first response of the local disaster management team.
In view of these challenges and the advancement of deep learning, this paper explores a full workflow to extract and verify flooding photos for social media. First, training examples were collected by inspecting tens of thousands of flooding photos. Then, detailed criteria for flooding photo identification were established for the system. Finally, a database-centralized and plug-in enabled architecture was designed and implemented based on deep learning technique, enabling the system to screen the flood photos in real-time. The plug-in architecture enables the system to conduct other real-time image analyzing tasks such as screening wildfire photos by adding new plug-ins.
2. Related Work
2.1. Image Classification Based on Deep Learning
The goal of image classification (also called image categorization or labeling) is to assign an image to a class according to its content. For example, given a photo of a cat, the algorithm returns the probabilities of a set of candidate labels, such as cat, dog, or tiger. A qualified algorithm should assign a much higher probability to the cat label than other labels. Before the deep learning paradigm, the bag-of-words (BoW) algorithm was the most popular and successful approach to such image labeling [21]. The features of the image are extracted by descriptors, such as SIFT (scale invariant feature transform [22]) and SURF (speeded up robust features [23]), that form the vocabulary. BoW methods treat features like words and then cluster images based on their features in the vocabulary. A BoW method could not exploit the spatial context of features when extracting objects in the images. The SVM (support vector machine) and its hierarchical models are other popular approaches for image labeling.
Deep neural network approaches have made significant progress in the past decade. For example, in the ILSVRC 2012 Challenge, the competitors needed to classify 150,000 testing images into 1000 classes by training their classifiers with 1.2 million images. AlexNet won with the accuracy significantly ahead of the second place that was based on the non-neural-network methods (16% vs. 26.2% in error rate). In recent years, the error rate has decreased from the use of more complex CNNs, such as VGG [24] and ResNet [25]. Popular open-source deep learning frameworks (e.g., Tensorflow, Pytorch) provide these trained CNNs, and the user can easily apply them to classify images or train the CNNs with the customized training dataset. The ILSVRC 2017 is the most recent image classification challenge in which the error rate for the winning design decreased to 2.251%, much better than even human performance of 5% [26]. Based on these results, the organizer of the challenge regarded the image classification question as solved and closed the competition—no future challenges.
CNNs also can be designed for specific tasks. Gebru [27] detected and classified cars in Google Street View, and acquired a community income prediction with a high correlation to ground reference data (r = 0.82). The CNN based on AlexNet recognized 50 million images of 200 largest American cities and categorized the cars into 2600 categories. The authors used the detected cars to conduct a sociological study correlated with local demographics. The fine-grained car detector, trained by 347,811 samples, provides the basic data in this search. Another group of authors [28] trained a CNN to recognize plant diseases. They used 4483 images to train AlexNet for classifying 13 leaf diseases, including apple and peach. The trained AlexNet obtained an average accuracy of 96.3%. The image classification based on CNN was also applied in many other application contexts, such as medical image analysis [29,30,31], and animal detection [32].
2.2. Flooding Photo Classification
While text analysis of social media been extensively studied, the visual information, or the posted images, has not been investigated as per our best knowledge of current literature. The term “image” referred to in this research means all types of images posted on social media, including photos, screenshots, and attached other raster files. In this study, a “photo” is the image obtained from cameras of natural scenes (i.e., not artificial). Photos record the on-site visual information, while other image types may have no relationship with the on-site environment. In this study, we focused on the image analysis of social media during flood events. Specially, posted photos showing ongoing flooded situations are flooding photos. Retweets and screenshots from public media are difficult to be localized, so we considered these posts as secondhand information and non-flooding even if they contained flooding content.
Flooding photo classification has become a new research topic in disaster management. The Multimedia Satellite Task at MediaEval [33], a competition of disaster photo detection and satellite image classification, aims to promote multimedia access and retrieval algorithms. In 2017 and 2018, this task focused on the flooding event. The contestants combined the text and photos from social media to determine whether a tweet was flooding related. The top methods in 2017 reached an accuracy higher than 95% [34]. The training data came from the YFCC100M [35] image dataset but did not have a specific criterion about flooding photos. The researchers used the statement of “unexpected high-water levels in the industrial, residential, commercial and agricultural area” as the definition of flooding photo. The human annotators rated the photo on a scale of 1–5 according to the strength of the flooding evidence. This competition did not emphasize the application and employment of these algorithms.
CNN-based methods to detect flooding tweets are dominant in literature. Paper [20] used an 8-layer CNN to classify the flooding photos from tweets and then used frequently occurring words in textual posts during a flood event to refine the detection results. The final precision was 87.4% in a balanced test set. A visual–textural fused CNN was applied in [19], in which an Inception V3 [36] CNN was used for the tweeted image, and a Word2Vec [37] method was employed to convert the tweeted text to an array fed into another CNN. Those two CNNs extracted from the tweet generated a vector of 1024 dimensions from image and text respectively. Then these two vectors were concatenated to train machine learning models, such as SVM, to classify flooding tweets. An accuracy of 96.5% was achieved in a balanced test set.
Feng and Sester [18] used CNN and other methods to classify pluvial flood relevant tweets. Both text and photos in the tweets were combined and classified as relevant or irrelevant. The authors used three subsets (7600 photos each) collected from Twitter and Instagram to train the model. Subset 1 contained images from social media. These images were flood irrelevant, selected by human annotators. Subset 2 was flooding photos from known events in Paris, London, and Berlin. Subset 3 consisted of photos of natural (non-flooded) water surfaces such as lakes. Two image classifiers were trained to distinguish flooding photos from Subset 1 and Subset 2, respectively. A photo was identified as flood relevant if both classifiers considered it as flooded. The highest F1-score [38] is reported as 0.9288.
Although these studies have been conducted on social media-streamed flooding photo detection, their objectives for further applications and standards of data collection are not clear. The simulated datasets lack real-time, event-specific information. We believe that the detected flooding photos provide in situ information about ongoing flood events. Also, most of the pilot studies do not systematically consider the overall workflow, such as image acquisition, system generality, and extendibility. Alam et al. [39] reported an online social media image processing system to assess the damage severity, but they only provided an image classification function. Moreover, a flooding photo detection system can be generalized as an image analyzing system to cope with various images analyzing tasks, such as image classification and object detection. In this study, we developed a real-time image analysis for social media (RIASM) to satisfy these multiple purposes. We also reported the performance of RIASM when applying it to the highly imbalanced datasets from the production environment, which were not reported in the aforementioned literature.
3. Methodology
3.1. System Architecture
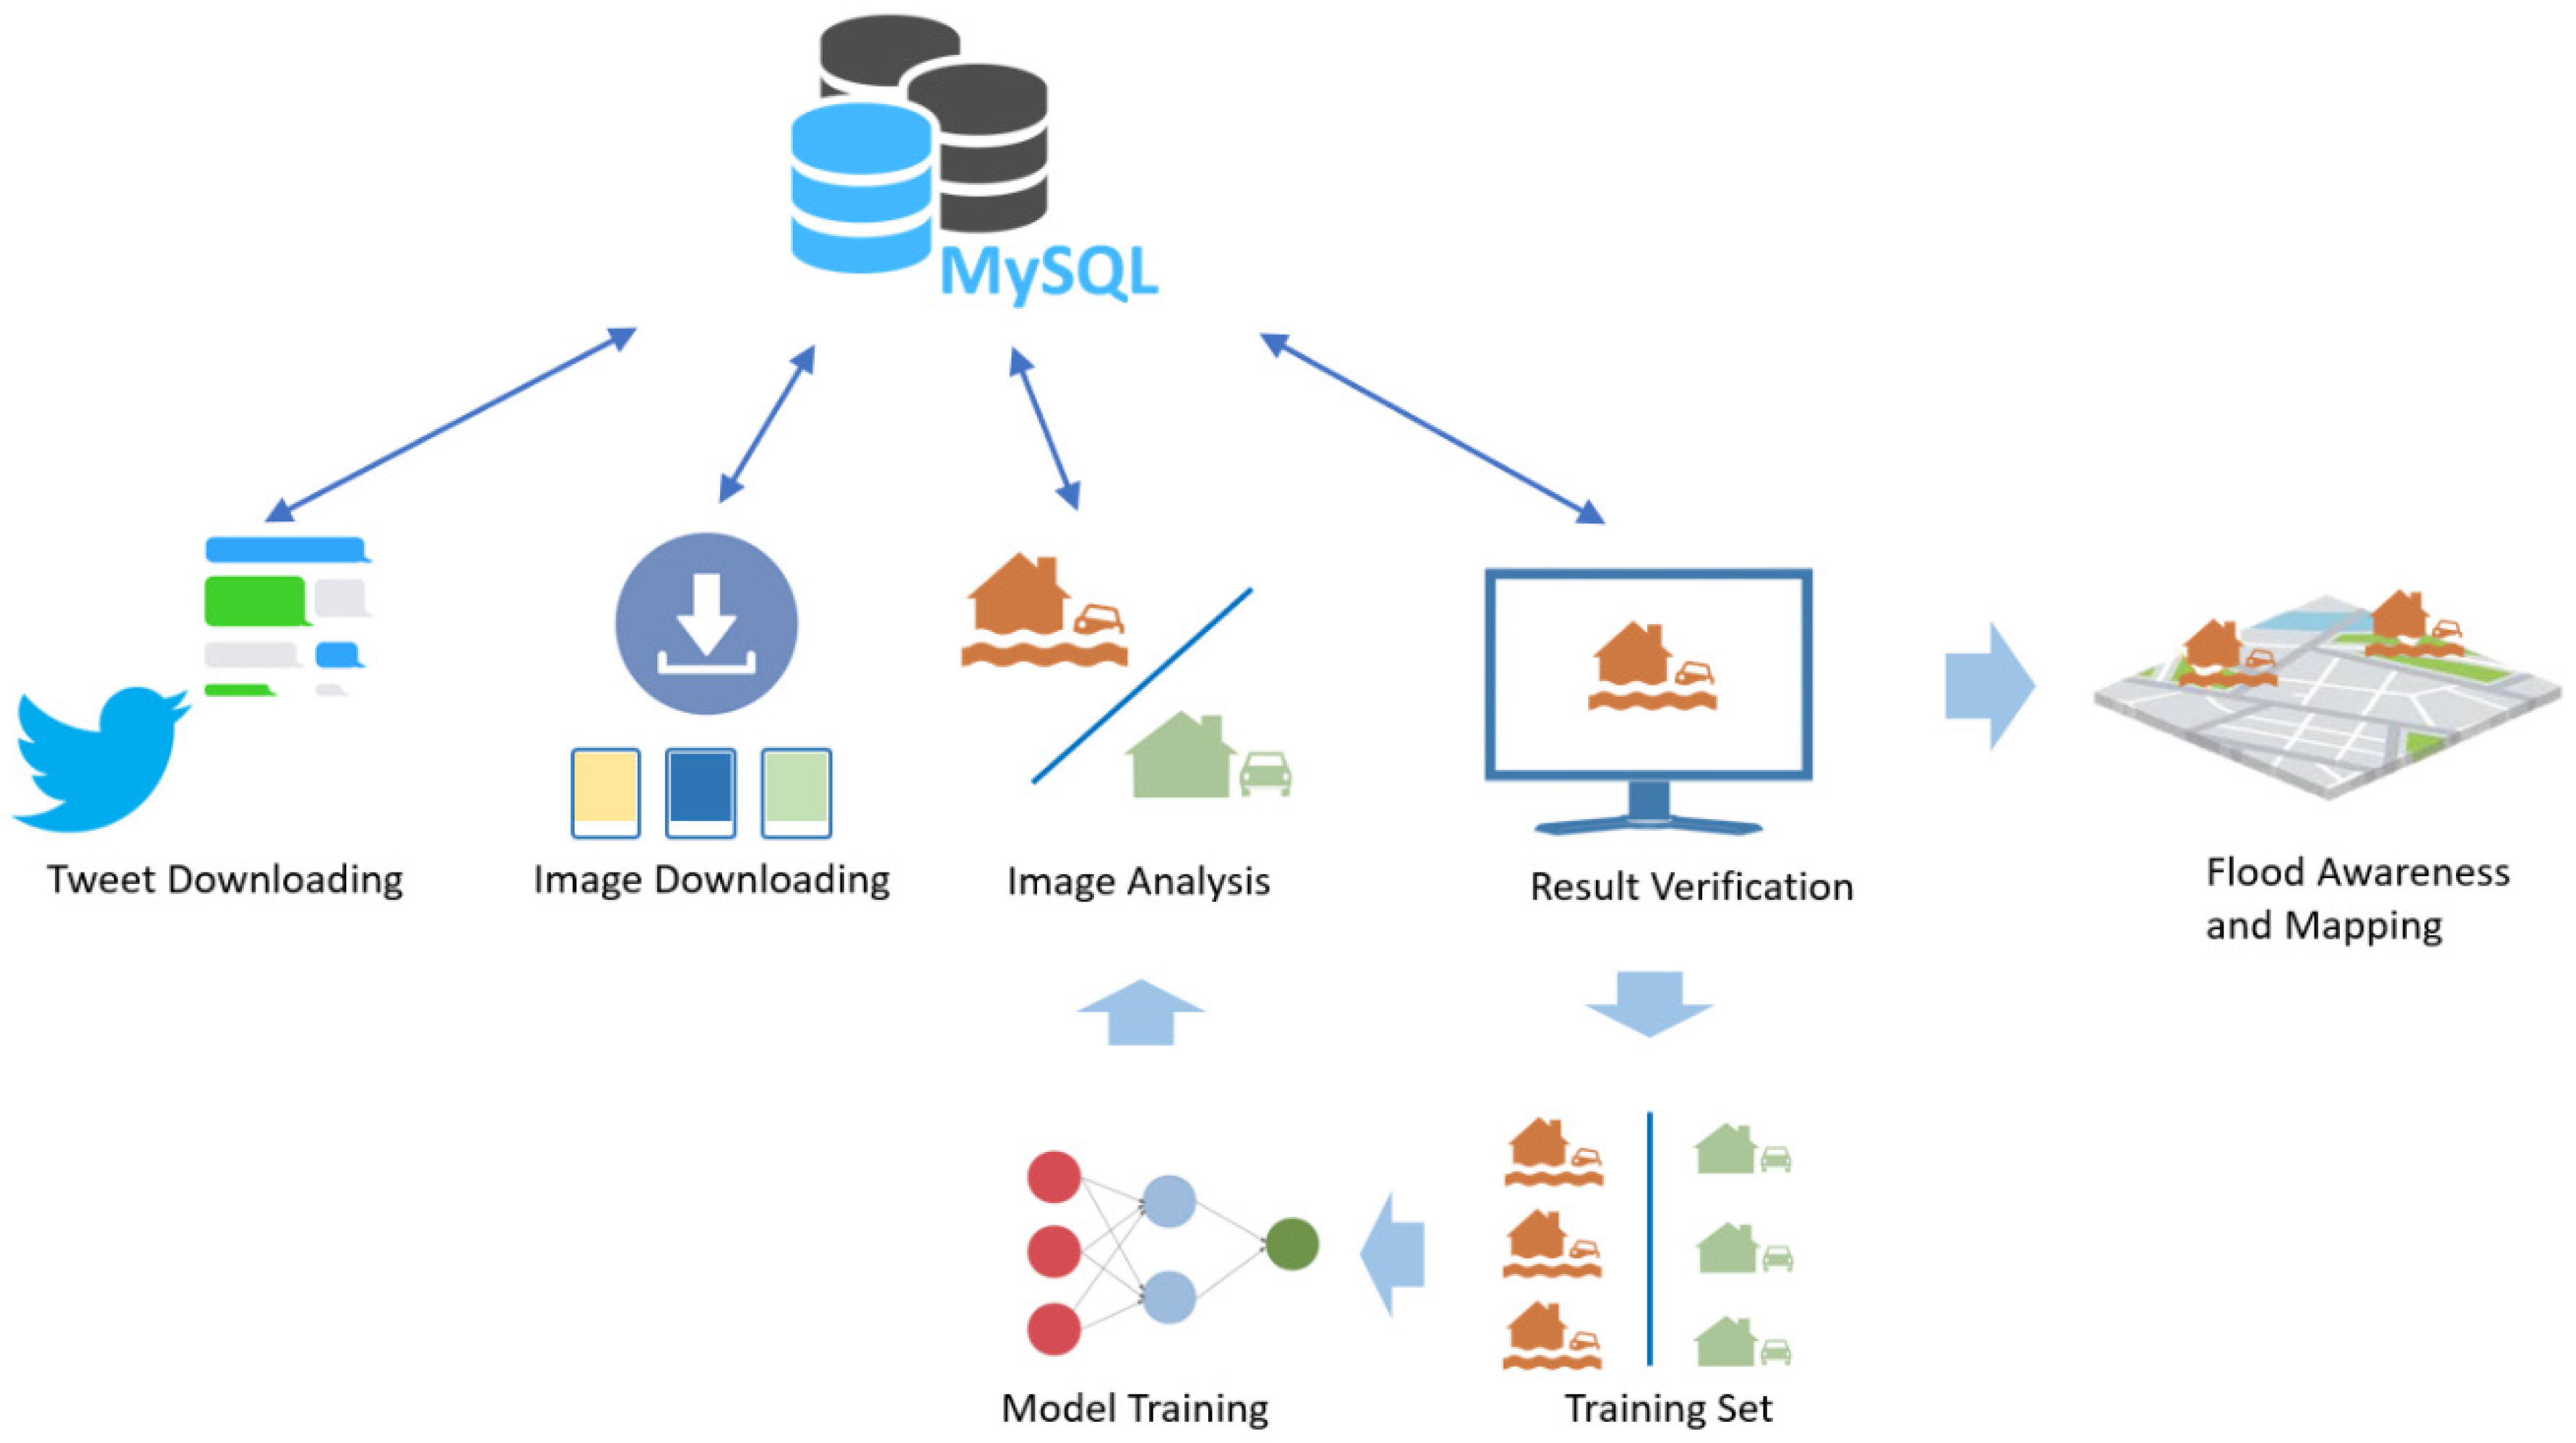
This research was to implement a system for screening geotagged flooding photos from the massive social media posts for rapid flooding situation awareness. The first task was to collect flooding photo samples to build a training dataset for flooding/non-flooding photo classification. Based on a small set of manually collected flooding photos, an iterative method was applied to train a sample CNN classifier to collect more flooding photos from social media images. In order to screen the social media photos in real-time, several independent modules were developed for the following sub-tasks: tweets downloading, image downloading, image analysis, and result verification. A MySQL database was used to store and exchange the data from these modules. The system is designed as a general social media image analysis platform that can perform various scene detection and object detection tasks. Figure 1 demonstrates the architecture of the proposed system.
RIASM adopts a database-centralized and plug-in-based design, containing four major modules for each sub-task. Currently, RIASM uses Twitter as a data source. As a database-centralized system, its modules communicate with the database only, and they are independent of each other. The failure of a module will not directly affect other modules. For example, when the Tweets Downloading module is not working, the Image Downloading module can still obtain images by retrieving downloaded tweets from the database. If the Image Downloading module fails, the Image Analyzer still retrieves unanalyzed images until all downloaded images have been analyzed. More details are provided in the following sub-sections.
3.1.1. Tweet Downloading Module
Because of the massive volume of data being streamed, we categorized the tweets as hot data and cold data [40] to retrieve and update them efficiently. Hot data needs to be accessed right away, while the cold data is accessed less frequently. The new downloaded tweets (i.e., the hot data) will be temporarily stored in a relational database (MySQL in this study), being retrieved by other modules. Once the analysis of the associated image is finished, the tweets are viewed as cold data and tagged as processed then loaded into Impala [41], which is an open-source parallel processing SQL query engine for data stored in a computer cluster running Apache Hadoop.
RIASM downloads geotagged real-time tweets from Twitter Streaming API. Tweets posted in the area of interest are collected and stored in the database regardless of their written language, followed by the filtering of keywords and hashtags. Streaming API pushes tweets in a JSON (JavaScript Object Notation) format with dozens of fields, for example, the ID of tweets, and the URLs of uploaded images. Before storing tweets into the database, the Tweet Downloading module conducts real-time text analysis without deferring the speed of tweets capturing, such as calculating the sentiment score for each tweet. A translation plugin is embedded in RIASM so that the tweets written by non-target languages can be translated into the target language such as English and stored in the database. The emojis, which are heavily used in social media, are also texturized for universal text mining. The streaming API sends about 10–20 geo-tagged tweets per second in the United States, and about 10% among them have accurate longitude and latitude coordinates. These statistics were recorded noted in February 2019, and they may change because of operations from Twitter or user behaviors. The collected tweets are stored periodically (e.g., every minute).
3.1.2. Image Downloading Module
Compared with tweet downloading, image downloading is time-consuming and resource-intensive. About 10% of tweets have images attached. To download the newly posted images in real-time, a multi-processing approach is applied to speed up the downloading process. In the Images Downloading module, each downloading process independently communicates with the database, such as obtaining non-processed tweets and tagging them as processed after downloading images. The downloaded images are stored as files named by tweet IDs, so image files can be easily connected back to original tweets.
Downloading images from real-time tweets is relatively simple because the posted images have corresponding URL (uniform resource locator) in the tweets JSON. The subsystem can obtain the image directly from the URL.
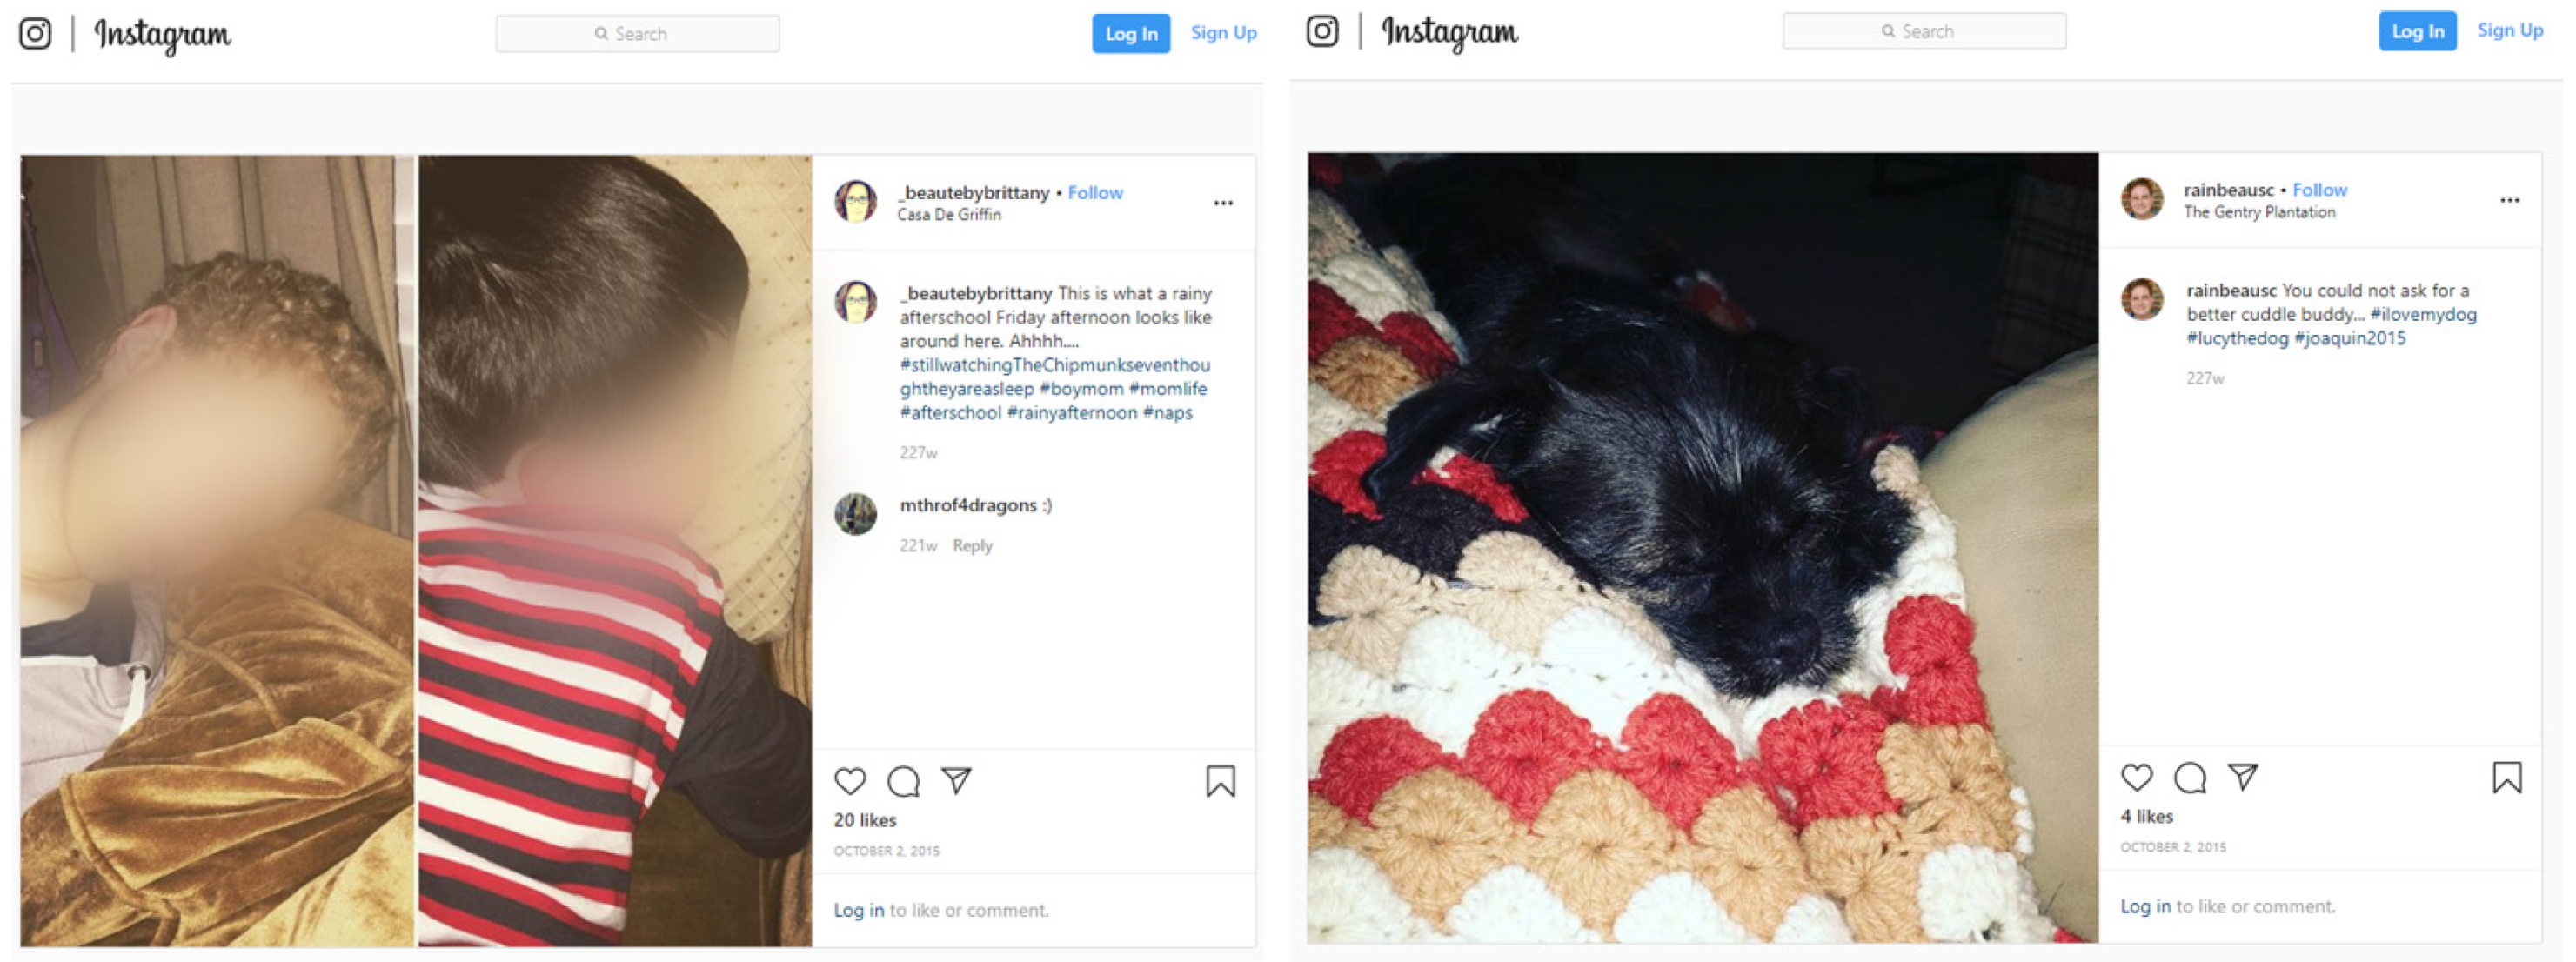
In some tweets, users share external URLs. About 30% of URLs link to the posts of social media websites (e.g., Twitter.com and Instagram.com). These external images are also downloaded. Because Twitter shortens the full URL into the short (tiny) URL, such as “https://t.co/Qi8Xs5jopp,” we used a browser driver to open the short URL and get the full URL (e.g., https://www.instagram.com/p/8WY30zr7F6GkXdywqP7pJJfuLPrrMncIjG2yc0/). If a URL comes from a social media website, the program will get its HTML page and download the images embedded in the HTML file. Table 1 lists five tweets and their short URLs as examples. Two web pages of the URLs in the second and fourth tweets are shown in Figure 2.
The downloading speed is determined by the Internet accessing speed and computer performance (e.g., CPU cores and bandwidth). In our test, RIASM can download 4–10 images per second.
3.1.3. Image Analysis Module
This module retrieves newly downloaded images from the database and then feeds those images into a trained model to detect flooding photos. The flooding photo detector utilizes GPUs to speed up. The results are stored in the database. We implemented this module as plug-in capable, which means that the flooding photo detection model can be replaced by other image analyzers, such as the tornado detector or wildfire detector. Such analyzers can run in parallel, and they share the same database and tweet/image downloading modules. For example, we added a YOLO-v3 [42] object detector and a face recognition model using the strategies aforementioned as showcases. Image analyzers independently retrieve images and store results with SQL queries to the same database.
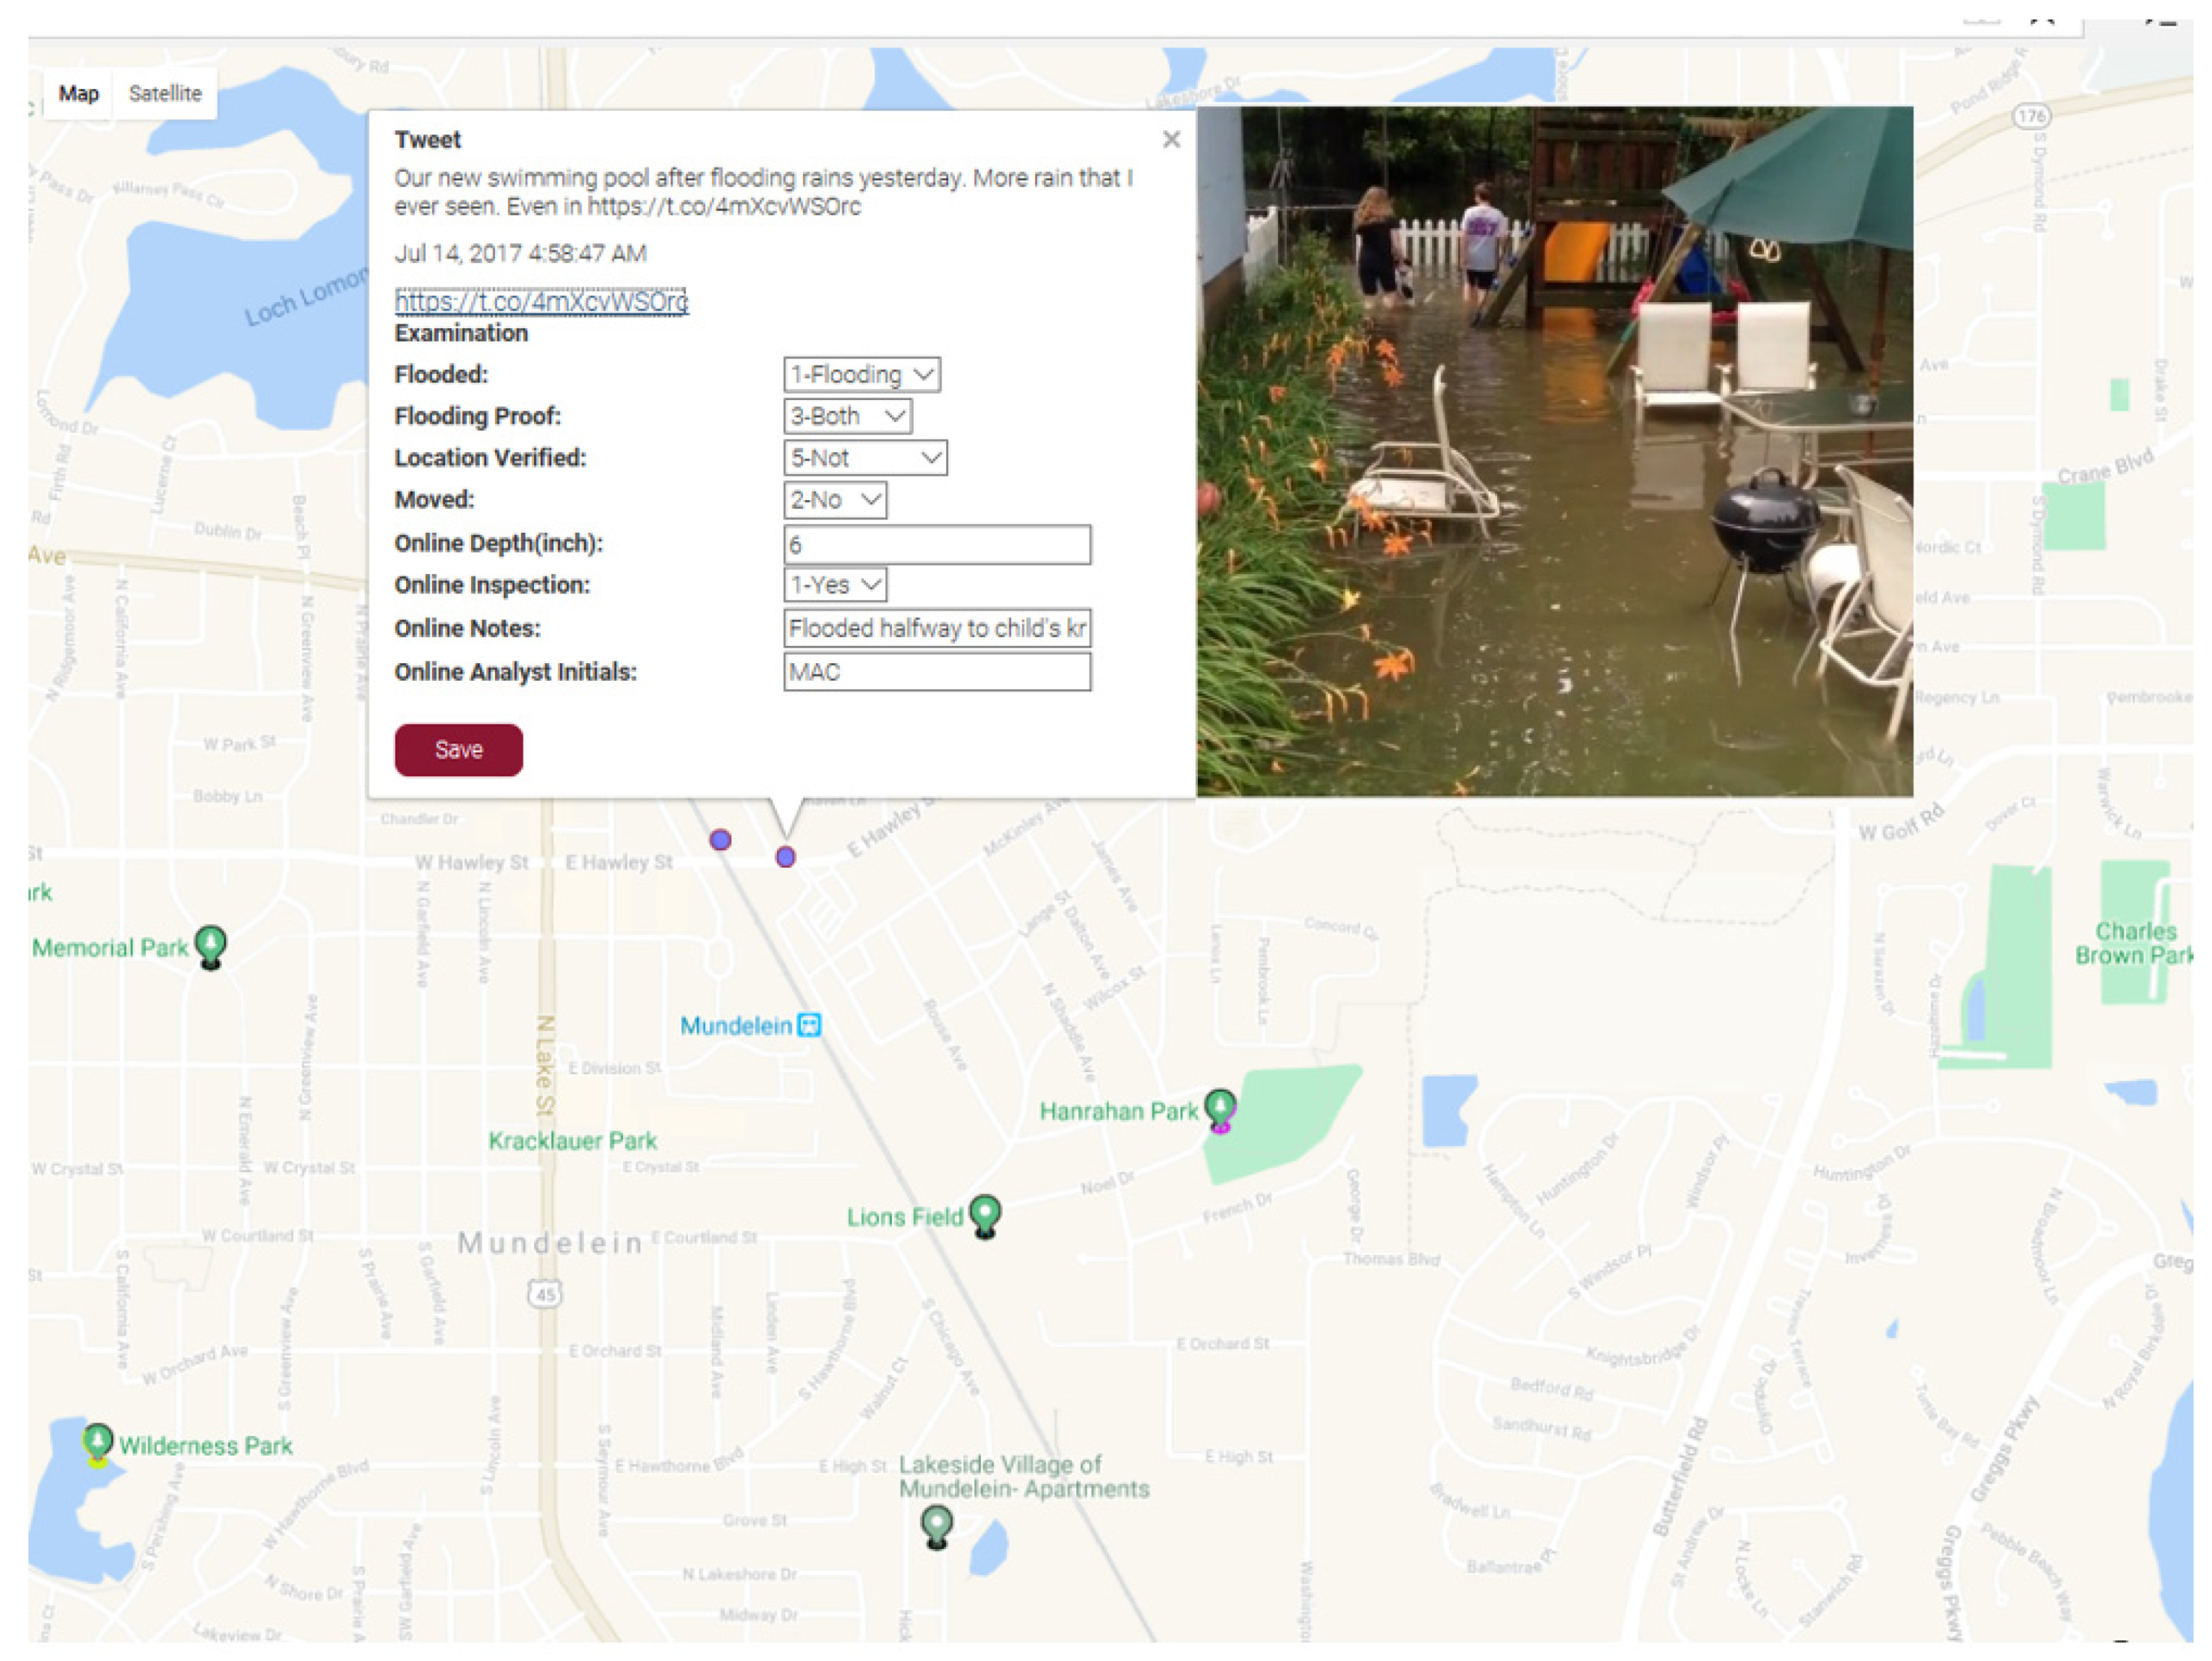
3.1.4. WebGIS-Based Result Verification Module
The non-flooding photos take up the majority of tweets even in a flooding event (more than 95%). Therefore, the detector may mistakenly label a noticeable amount of non-flooding photos as flooding. Additionally, flooding photos from social media vary greatly. Human knowledge and experience are thus needed in a reliable classification. RIASM connects a WebGIS application for human operators to screen the auto-classified results and associate the labeled photos with geographic location. The interface is based on Google Map, displaying both the image and tweet in the system (Figure 3). Even modestly trained users can determine whether a photo is flooding or not. Other information input by users such as water height can also be recorded in the database.
3.2. Dataset and Training
A training dataset is needed to train CNNs. Since there is no publicly available flooding photo dataset, we built a flooding photos training dataset from social media images. The rationale for using images from social media is to represent a wide variety of images. Downloading flooding images from search engines or other existing datasets is an easier method for building a dataset, but the variance of flooding photos and the non-flooding photo is under-represented. We used the images from social media only to preserve the photos captured by amateurish citizens, rather than iconic flooding photos produced by journalists or experienced photographers. In our dataset, many flooding photos record the inundated indoor scenes, and they are different from the flooding photos retrieved from a Google search, which are mostly outdoor scenes.
The flooding photo only takes up a small portion of the whole tweet repository. For instance, the tweets with “flood” consist of 0.034% of our tweet repository of 800 million tweets from 2016 to 2018 in the United States. Manually labeling the flooding photos in the whole repository is unfeasible. This research uses an iterative method to collect flooding photos from the whole repository. A list of about 800 tweets was collected and manually verified in a flooding event in 2017. A team checked 11,000 geotagged tweets and labeled about 800 of them as flood relevant. There are 430 flooding images among these 800 tweets. However, a training dataset of 430 positive samples is not large enough to train a CNN. Utilizing the image search engines of Google.com and Bing.com, we collected 1500 additional flooding images to enrich the training dataset. As to the negative samples, 1500 non-flooding images are selected randomly from ImageNet [43]. Thought these flooding and non-flooding photos come from different sources, they can form a preliminary training dataset.
Building the flooding training dataset is an iterative process. The preliminary dataset was used to train a simple 2-layer CNN. The trained CNN extracts flooding photos from the images of the tweets with “flood” in our repository of the contiguous U.S in 2016–2017 (excludes the tweets used in Section 4.1 Case 1: Houston Flood 2017). In the beginning, the trained CNN receives a low accuracy because of the imperfection of the preliminary training dataset. Many images are mislabeled. However, the ratio of the flooding photo in the classification results with a “flooding” label is higher than the original distribution. A human annotator can efficiently pick up the real flooding photos in the “flooding” results. The verified flooding photos are then used as the training dataset to re-train the CNN. In every iteration, a human annotator helps to purify the classified flooding photos as the new training dataset. After serval iterations, most flooding photos are moved to the training dataset. In the training stage, the CNN was trained by a balanced dataset, meaning numbers of non-flooding and flooding photos were the same. In the final training dataset, all images from search engines were removed, and 3000 flooding photos are left. Both flooding and non-flooding photos were derived from social media in this stage.
3.2.1. The Criteria for Identifying Flooding Photo
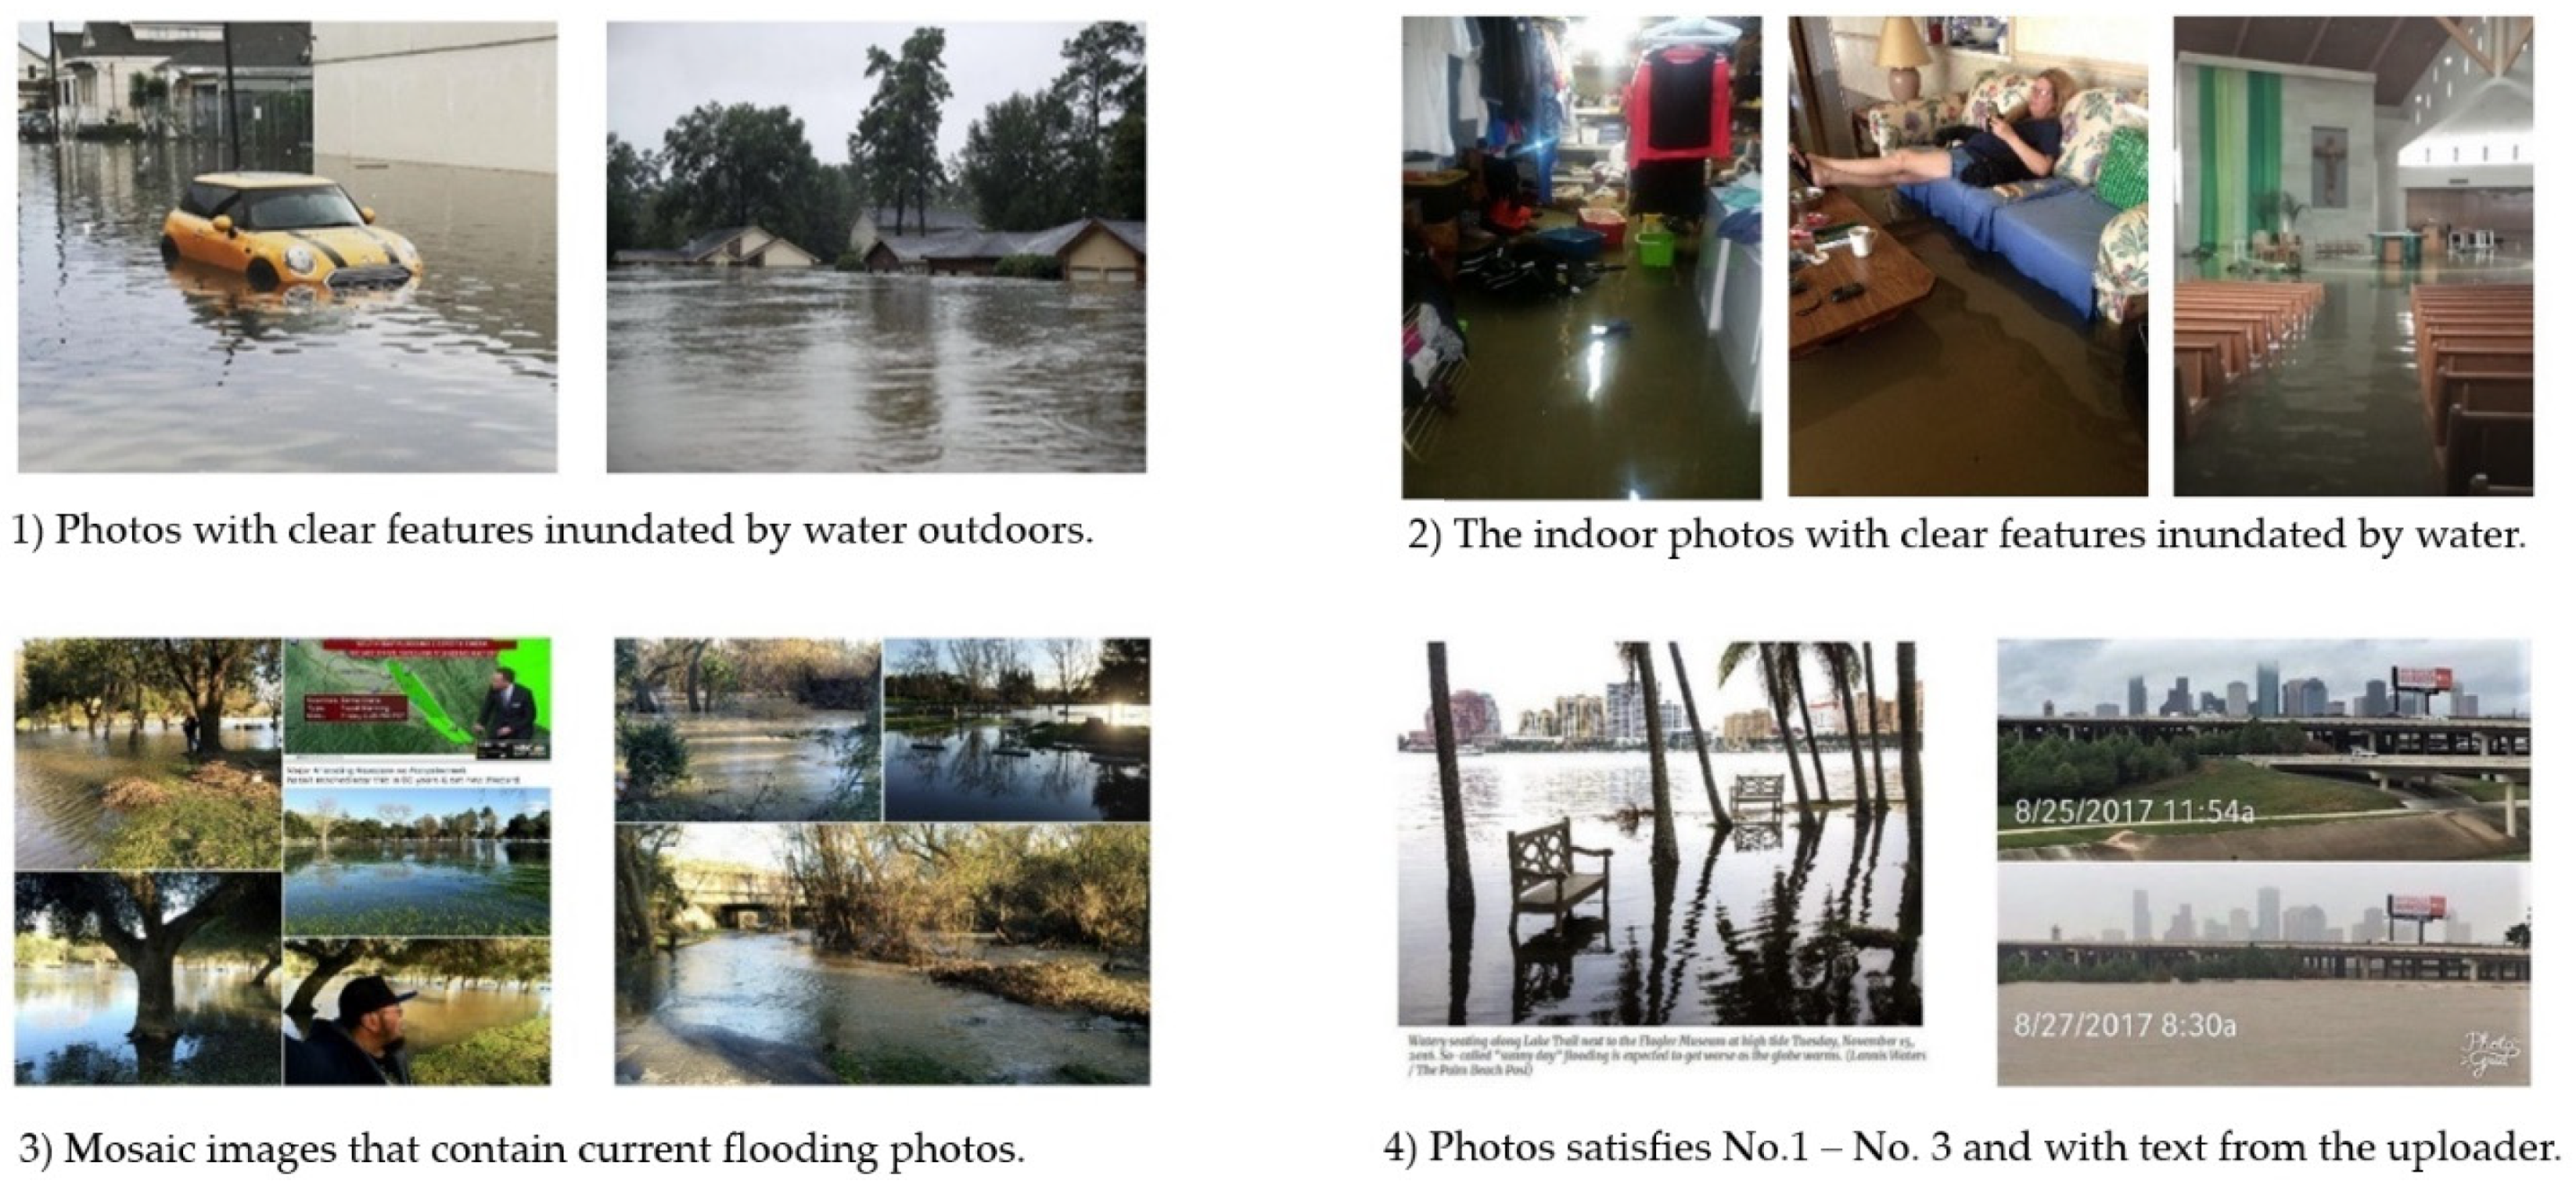
We found no specific definition for flooding photos in the literature, so we established criteria to identify flooding photos. In the beginning, we found that some photos showing flood may not necessarily be useful for disaster responders, for instance, “Pray for Houston” posters and historical flooding photos. These photos were “flood-related,” but are not useful for characterizing a present flooding event. We realize that the identified flood photo should reflect on-site information about an ongoing flood event for more reliable situational awareness. In addition, features, such as houses, cars, or trees, are objects that would not typically appear in water bodies; thus, the presence of these features in water bodies is critical in identifying flooding photos. A flooding photo should contain those features inundated by water. In contrast, a photo that does not have inundated features cannot provide distinguishable visual information about the ongoing flood is a non-flooding photo. Therefore, we define a “flooding photo” as an in-situ photo containing inundated features that reflects an ongoing flood and provides firsthand visual information.
With several rounds of refining classification results of the initial classifier, the detailed criteria were established gradually. Table 2 and Table 3 show rules to identify flooding and non-flooding photos. Figure 4 and Figure 5 show some examples of those rules. To ensure consistency when developing the criteria, only one human annotator labeled the flooding photos. When necessary, the annotator organized a discussion with other members of the research team to resolve ambiguities and revise the criteria.
3.2.2. CNN Training and Selection
After the training dataset was finalized, we divided the dataset by randomly placing 75% of the flooding photos in a training set, and the remaining 25% in a test set. The training set and test set share the same distribution as the dataset was randomly divided. Currently, there is no golden rule for the size of the training set and test set. The ratio of 75:25 used in our study is similar to the common rule of 70:30 mentioned in [44]. The number of flooding photos in the training set was 2250 and in the test set was 750.
In each set the number of flooding and non-flooding photos was equal. After the CNN was trained using the training set, the accuracy was evaluated with the test set using the metric in Equation (1):
This study fine-tuned four pre-trained popular CNN architectures, including VGG [24] ResNet [25], DenseNet [45], and Inception V3 [36], to determine which one is the most suitable for flooding photo detection. We directly used these four models pre-trained byImageNet [43] from the built-in models of PyTorch. Because the training set was relatively small, we used all samples to train models without applying k-fold cross-validation. We only changed the number of output neurons in the last linear layer to two, representing the two classes of Flooding and Non_flooding, and then trained the model 200 epochs on two Nvidia Titan xp GPUs using a learning rate of 0.001. The training process took about 10 h. Similarly, we trained VGG16 and DenseNet201 from scratch. As shown in Table 4, VGG 16 trained from scratch results in the highest accuracy (93%). These trained models also resulted in similar recalls and a precision of about 0.9. Therefore, we use the trained VGG 16 from scratch in our RIASM system. Furthermore, Huang et al. [25] used our training data as the biggest subset and found the same accuracy (92.94%) using five-fold cross-validation and a more sophisticated transfer learning method. This further verifies the validity of our training dataset.
Transfer learning does not obtain a competitive result perhaps because of the difference of contents between flooding photos and ImageNet images. Flooding photos are scene images and contain many objects, while images of ImageNet have dominating objects.
4. Case Studies of RIASM
4.1. Case 1: Houston Flood in 2017
The trained VGG16 was applied to a tweet dataset of the Houston Flood in 2017. This dataset contains about 140,000 geotagged tweets in metropolitan Houston which suffered an unprecedented flood caused by Hurricane Harvey 2017. The posted time of tweets ranged from 15 August 2017 to 1 October 2017. Among the downloaded 39,000 photos, 2237 were labeled as flooding by the trained VGG16.
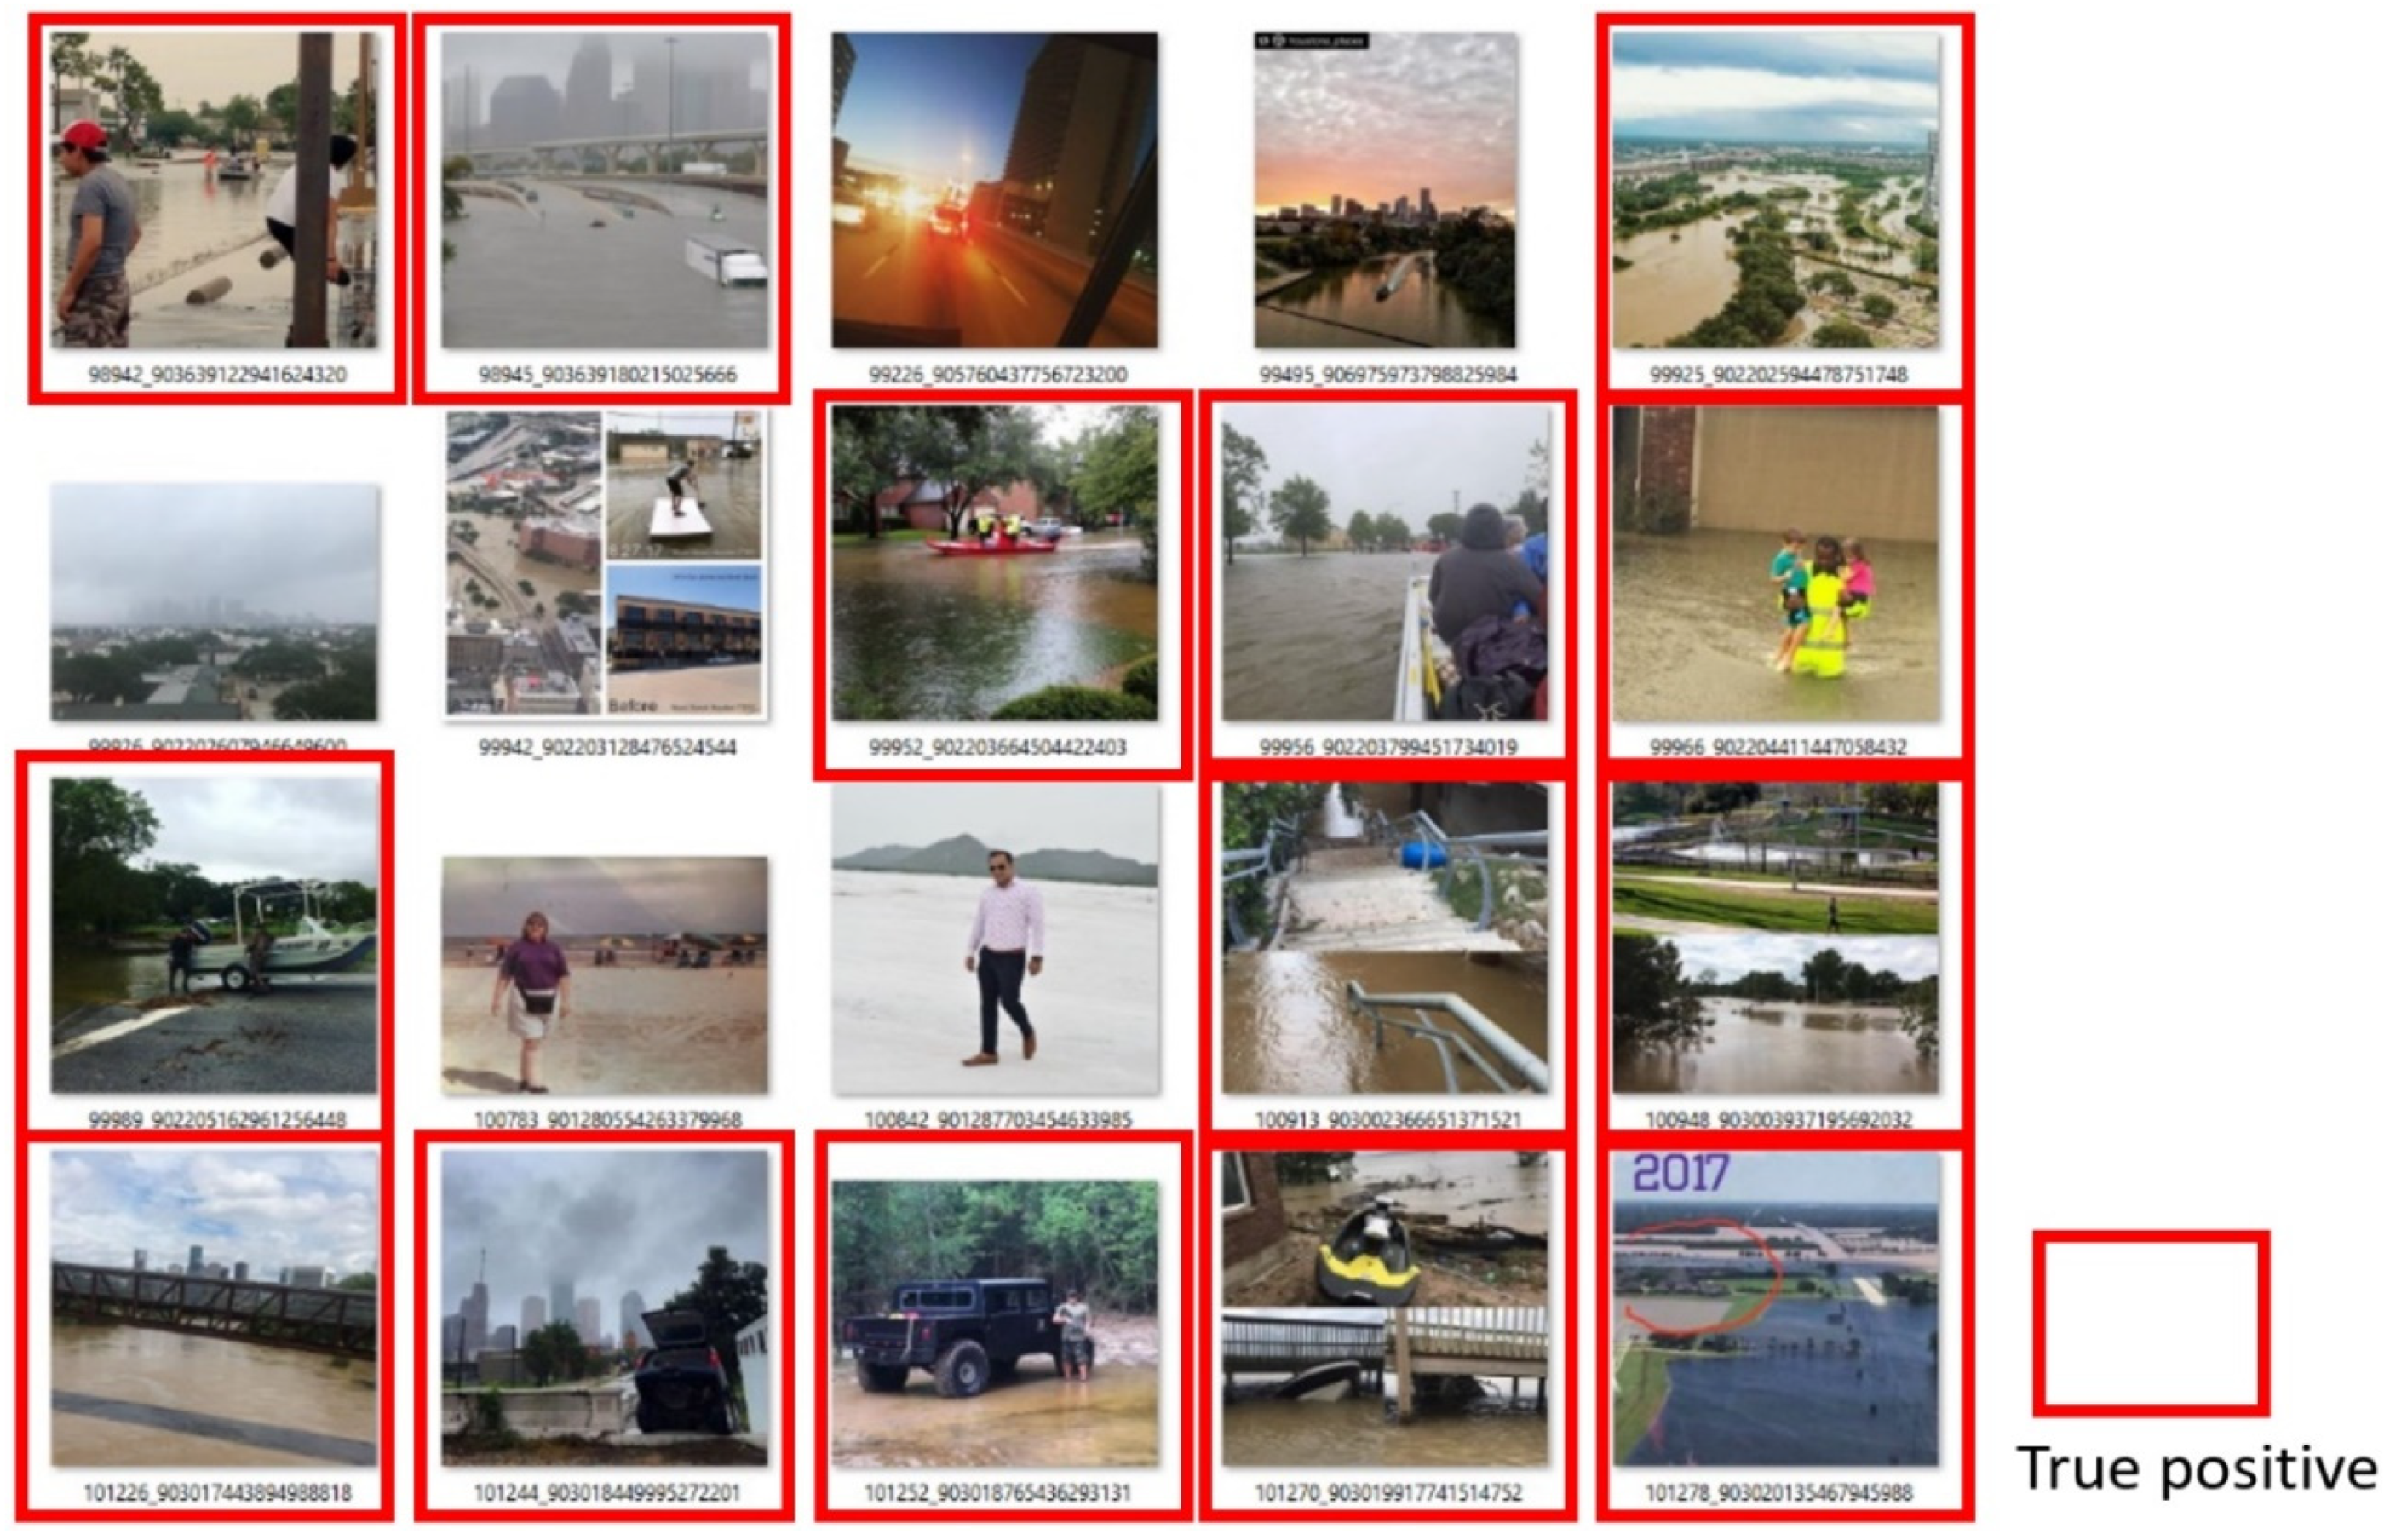
Accuracy from this highly imbalanced dataset will be distorted by the dominant non-flooding images, so we used precision and recall in this study case, see Equations (2) and (3). Figure 6 and Figure 7 demonstrates some samples of the detection results. In this dataset 1400 of 2237 were verified as real flooding after a manual check based on the rule in Table 2 and Table 3. Therefore the precision of flooding photo was 63% (1400/2237). Because of the labor-intensity, we manually checked 20% of the non-flooding results and found 15 flooding photos, which meant about 75 non-flooding photos were missed by the trained CNN. The recall of flooding photos was 95% (100%—75/1475). This indicates that the classifier has an acceptable performance when applying it to real data with a highly imbalanced distribution.
4.2. Case 2: Hurricane Florence Flood in 2018
On 14–17 September 2018, Hurricane Florence caused extensive damage in the coastal area of North Carolina and South Carolina [46]. It caused heavy rainfall which led to record floods in the Carolinas [47]. Over 1.2 million people in the affected area were under mandatory evacuation orders [48]. We downloaded 6975 images from 136,000 geotagged tweets posted in Carolinas from 14 to 30 September, and the trained VGG16 returned 818 flooding photos. Of the identified flooding photos 372 out of 818 photos were true positives after a manual verification (Figure 8). The precision was 45.5% (373/818), lower than the results in Houston Flood 2017. Because of the heavy workload, we did not check the result of the non-flooding photo, so the recall was not calculated.
5. Discussions
Timely approaches are needed for rapid flood situation awareness and mapping. Meanwhile, these approaches should be cost-efficient to employ. Obtaining remotely sensed images is an effective way to collect the continuous situation of a large flooded area [49,50]. However, severe weather condition such as clouds along with heavy rainfall hinders the airborne or satellite sensor from obtaining optical images. In best scenarios, commercially operated optical satellites can acquire high-resolution images several days after an event. This severely limits the reliable use of satellite remote sensing for the emergency response phase (i.e., the first 3 days of a disaster). Other limitations of remote sensing techniques include the long pre-processing time for image geometric and atmospheric correction, low efficiency and high risk of deploying unmanned aerial systems (UAS), and the difficulty to estimate water height from 2-dimensional imagery. We do believe aerial or satellite remote sensing sources have an important role; however, we believe real-time flooding photos extracted from social media augment the situational awareness for emergency responders.
The flooding photos extracted by RIASM benefits several purposes. Flooding photos can be used as independent observations of flood events. The water height estimated from the flooding photos can be used to obtain a timely inundation map without field visits, which has been challenging in an ongoing flood event [6]. Also, the time of flood can be extracted from the metadata (posted time or the text), hence generating a dynamic inundation map. The traditional field survey of high watermarks lacks the temporal dimension because the survey is conducted after the flood event from anecdotal information (e.g., debris lines or water lines), whereas the flooding photos extracted from social media provide high temporal relevance. Flooding photos can also be used as a supplementary data source, to refine the assessments based on remote sensing images. For example, Schnebele and Cervone [10] and Huang [12,13,14] used VGI integrating UAV, EO-1, and Landsat 8 imagery to enhance flood response. These researchers treated the flood-related VGI (mostly photos) as reliable observation points and applied these points to refine the flooding probability of nearby regions. In this sense, RIASM has the potential to be incorporated into traditional flood mapping systems to fill knowledge gaps and provide additional verification of a disaster’s extent or magnitude.
RIASM can be viewed as a social media image analysis platform in various fields. The plug-in mechanism enables RIASM to conduct other images analysis tasks easily by plugging new image categorization algorithms and models, such as tornados, wildfires, earthquakes, and general object detectors. A YOLO-v3 model was added to detect common objects (e.g., person, car, and cat) and the results reveal some interesting phenomena. For instance, in the United States dogs appear more in social media photos than other countries. Other visual-based models can also be used, such as violence detection [51,52], face recognition [53], gender and age extraction [54], or skin color analysis [55].
As to the scalability, RIASM is able to process all real-time tweets from the free Twitter Streaming API (~50 tweets/second) and can handle 200 tweets/second when processing pre-downloaded tweets running on our 8-core CPU workstation. Image classification or other image analysis such as semantic segmentation [56] does not require such substantial GPU computation. Since each module of RIASM is designed as an independent process, the capability on data downloading and analyzing can be obtained by simply starting more processes. As a result, RIASM can scale up with more powerful hardware such as more CPU cores and GPU cards. Regarding human verification, the two case studies revealed that the extracted flooding photos only account for about 1 percent of the geotagged tweets during flooding events. Considering the maximum downloading speed of 50 tweets/second, there would be about 30 flooding photos being extracted every minute, which can be handled by one person during the human verification process.
RIASM has been well-designed to store the tweets in multiple languages, including emojis. Other research on tweet text analyses can be embedded into the system, for example, using the text and images together to classify the flooding related tweets [20]. The RIASM architecture also has the potential to tackle the representative issues of twitter data [57] by automatically extracting the demographic information (e.g., gender, age, and race) from the tweet photos, which may benefit human mobility studies based on social media [58,59].
Cross-culture studies based on RIASM are promising although we have only begun initial investigations. Images are intuitive and language-free. According to the downloaded geotagged tweets, about 40% of tweets are written in over 30 languages other than English, such as Portuguese (13%), Spanish (9%), and Japanese (6%). Obviously, the proportion of tweets using a specific language will vary by geographic region in the world. Notably, research based on the image content is not constrained by language. The image is “language-free.” For text mining, RIASM has been connected to the Google Translation API to translate tweets into English or other languages. Other open-sourced translation libraries (e.g., Open NMT [60]) can be embedded in a similar approach. There is considerable research left to explore the importance of and difference because of language in geocoded tweets.
6. Limitations and Future Research
About 4800 flooding photos collected in the research come from social media images posted in the U.S. during 2016–2017 with the addition of two flooding events. These photos are beneficial to retrain the CNN to detect new flooding photos posted in future flood events. However, these 4800 flooding photos and the randomly selected non-flooding photos used in this study are still under representative of the social media images which have a large variance and a highly imbalanced class distribution. This under-representation leads to a low precision when applying the trained CNN to the real-time social media images. Data augmentation, such as flipping and rotation have been tested in training, but the results did not provide a substantial improvement. More data augmentation methods and training strategies need to be tested. Buda et al. [56] recommend oversampling as the first choice for the imbalanced training dataset, which means using the replica of the flooding photos to form more positive samples to correspond to the negative samples. However, identifying a reasonable number of non-flooding photos to retrain the variety of social media images needs further research.
When applying the trained CNN to the dataset of Houston Flood in 2017, the recall of flooding photos was 95%, and the precision was 63%. In the hurricane Florence flood of 2018, the precision was 46%. Compared with the balanced test set in the training process (Section 3.2), these results show two limitations of the trained CNN. The first limitation is the lower precision in the highly imbalanced social media images. In the two study cases, the flooding photos consisted of less than 5% of the entire image set, which was far less than the test set (50%) of the training dataset. The precision of the CNN dropped from more than 90% to about 50%, mislabeling many non-flooding photos as flooding. However, the recall of 95% was acceptable in the Houston flood of 2017. Another limitation was, in severe flood events, the threatened residents likely would be evacuated prior to the flooding, leading to a low number of social media posts. Therefore, the number of detected flooding photos may decrease because of fewer social media posts with geotags at the flooding location or the resident did not post at all. Therefore, the number of detected flooding photos may decline because of fewer social media posts. The study case of hurricane Florence in 2018 clearly showed this decrease.
This study focused on prototyping a system for real-time flooding photo detection from social media, rather than investigating a state-of–the-art flooding photo detector. Further research is needed to improve precision and recall in the production environment. Many factors need to be considered to train a model with high performance. Popular architectures tested in this study gained similar results in this test set, other newly developed architectures may have better performance. The practitioners who want to apply CNN to classify images in their domains should build training datasets carefully according to their research questions. For example, the flooding photo in our research was defined as the on-site photo providing firsthand visual information about ongoing floods and must have inundated features. This definition leverages the advantage of object detection capabilities of CNNs and also serves the purpose of filtering unwanted water.
7. Conclusions
The research designed and prototyped a system named RIASM to collect, store, and analyze the images posted on Twitter in real-time. We contribute to the literature and community with a practical approach to obtaining flooding insights from the massive social media data based on deep learning. The system allows the CNN model to be re-trained by a larger training dataset when more analyst-verified flooding photos are added to the training set in an iterative manner. The total accuracy of flooding photo detection was 93% in a balanced test set, and the precision ranges from 46–63% in the highly imbalanced real-world tweets during two flooding events. The flooding photos extracted from social media with RIASM augment the situational awareness for emergency responders by providing independent observations of flood events on the ground. The plug-in-based design of RIASM makes it extendable for supporting other types of disaster events such as wildfires and earthquakes for the damage/impact assessment as well as other studies beyond disaster management.
Author Contributions
Conceptualization: Huan Ning and Zhenlong Li; methodology, Huan Ning; software, Huan Ning; validation, Huan Ning; formal analysis, Cuizhen (Susan) Wang, Michael E. Hodgson; resources, Zhenlong Li; writing—original draft preparation, Huan Ning; writing—review and editing, Michael E. Hodgson, Cuizhen (Susan) Wang; supervision, Zhenlong Li; project administration, Zhenlong Li. All authors have read and agreed to the published version of the manuscript.
Funding
This research received no external funding.
Conflicts of Interest
The authors declare no conflict of interest.
References
- Union of Concerned Scientists Climate Change, Extreme Precipitation and Flooding: The Latest Science. 2018. Available online: https://www.ucsusa.org/global-warming/global-warming-impacts/floods (accessed on 22 March 2019).
- Wuebbles, D.J.; Fahey, D.W.; Hibbard, K.A. Climate Science Special Report: Fourth National Climate Assessment; U.S. Global Change Research Program: Washington, DC, USA, 2017; Volume I. [Google Scholar]
- National Weather Service. Summary of Natural Hazard Statistics for 2017 in the United States; National Weather Service: Silver Spring, MD, USA, 2017.
- U.S. Department of the Interior; U.S. Geological Survey (USGS). Flood Event Viewer. Available online: https://water.usgs.gov/floods/FEV/ (accessed on 22 March 2019).
- Koenig, T.A.; Bruce, J.L.; O’Connor, J.; McGee, B.D.; Holmes, R.R., Jr.; Hollins, R.; Forbes, B.T.; Kohn, M.S.; Schellekens, M.; Martin, Z.W.; et al. Identifying and Preserving High-Water Mark Data; Techniques and Methods; U.S. Geological Survey: Reston, VA, USA, 2016; p. 60.
- Li, Z.; Wang, C.; Emrich, C.T.; Guo, D. A novel approach to leveraging social media for rapid flood mapping: A case study of the 2015 South Carolina floods. Cartogr. Geogr. Inf. Sci. 2018, 45, 97–110. [Google Scholar] [CrossRef]
- Goodchild, M.F.; Glennon, J.A. Crowdsourcing geographic information for disaster response: A research frontier. Int. J. Digit. Earth 2010, 3, 231–241. [Google Scholar] [CrossRef]
- Sheth, A. Citizen Sensing, Social Signals, and Enriching Human Experience. IEEE Internet Comput. 2009, 13, 87–92. [Google Scholar] [CrossRef] [Green Version]
- Nagarajan, M.; Sheth, A.; Velmurugan, S. Citizen Sensor Data Mining, Social Media Analytics and Development Centric Web Applications. In Proceedings of the 20th International Conference Companion on World Wide Web, Hyderabad, India, 28 March–1 April 2011; ACM: New York, NY, USA, 2011; pp. 289–290. [Google Scholar]
- Adam, N.R.; Shafiq, B.; Staffin, R. Spatial Computing and Social Media in the Context of Disaster Management. IEEE Intell. Syst. 2012, 27, 90–96. [Google Scholar] [CrossRef]
- Fohringer, J.; Dransch, D.; Kreibich, H.; Schröter, K. Social media as an information source for rapid flood inundation mapping. Nat. Hazards Earth Syst. Sci. 2015, 15, 2725–2738. [Google Scholar] [CrossRef] [Green Version]
- Wang, C.; Li, Z.; Huang, X. Geospatial assessment of flooding dynamics and risks of the October’15 South Carolina Flood. Southeast. Geogr. 2018, 58, 164–180. [Google Scholar] [CrossRef]
- Huang, X.; Wang, C.; Li, Z. Reconstructing Flood Inundation Probability by Enhancing Near Real-Time Imagery With Real-Time Gauges and Tweets. IEEE Trans. Geosci. Remote Sens. 2018, 56, 4691–4701. [Google Scholar] [CrossRef]
- Huang, X.; Wang, C.; Li, Z. A near real-time flood-mapping approach by integrating social media and post-event satellite imagery. Ann. GIS 2018, 24, 113–123. [Google Scholar] [CrossRef]
- Sayce, D. Number of Tweets per Day? Available online: https://www.dsayce.com/social-media/tweets-day/ (accessed on 23 March 2019).
- LeCun, Y.; Bengio, Y.; Hinton, G. Deep learning. Nature 2015, 521, 436–444. [Google Scholar] [CrossRef]
- Tkachenko, N.; Zubiaga, A.; Procter, R. WISC at MediaEval 2017: Multimedia Satellite Task. In Proceedings of the MediaEval 2017: Multimedia Benchmark Workshop, Dublin, Ireland, 13–15 September 2017; p. 4. [Google Scholar]
- Feng, Y.; Sester, M. Extraction of Pluvial Flood Relevant Volunteered Geographic Information (VGI) by Deep Learning from User Generated Texts and Photos. ISPRS Int. J. Geo-Inf. 2018, 7, 39. [Google Scholar] [CrossRef] [Green Version]
- Huang, X.; Li, Z.; Wang, C.; Ning, H. Identifying disaster related social media for rapid response: A visual-textual fused CNN architecture. Int. J. Digit. Earth 2019, 1–23. [Google Scholar] [CrossRef]
- Huang, X.; Wang, C.; Li, Z.; Ning, H. A visual–textual fused approach to automated tagging of flood-related tweets during a flood event. Int. J. Digit. Earth 2018, 1–17. [Google Scholar] [CrossRef]
- Druzhkov, P.N.; Kustikova, V.D. A survey of deep learning methods and software tools for image classification and object detection. Pattern Recognit. Image Anal. 2016, 26, 9–15. [Google Scholar] [CrossRef]
- Lowe, D.G. Object recognition from local scale-invariant features. In Proceedings of the Seventh IEEE International Conference on Computer Vision, Kerkyra, Greece, 20–27 September 1999; Volume 2, pp. 1150–1157. [Google Scholar]
- Bay, H.; Tuytelaars, T.; Van Gool, L. Surf: Speeded Up Robust Features. In Proceedings of the European Conference on Computer Vision, Graz, Austria, 7–13 May 2006; Springer: Berlin/Heidelberg, Germany, 2006; pp. 404–417. [Google Scholar]
- Simonyan, K.; Zisserman, A. Very Deep Convolutional Networks for Large-Scale Image Recognition. arXiv 2014, arXiv:1409.1556. [Google Scholar]
- He, K.; Zhang, X.; Ren, S.; Sun, J. Deep Residual Learning for Image Recognition. arXiv 2015, arXiv:1512.03385. [Google Scholar]
- Russakovsky, O.; Deng, J.; Su, H.; Krause, J.; Satheesh, S.; Ma, S.; Huang, Z.; Karpathy, A.; Khosla, A.; Bernstein, M.; et al. ImageNet Large Scale Visual Recognition Challenge. Int. J. Comput. Vis. 2015, 115, 211–252. [Google Scholar] [CrossRef] [Green Version]
- Gebru, T.; Krause, J.; Wang, Y.; Chen, D.; Deng, J.; Fei-Fei, L. Fine-Grained Car Detection for Visual Census Estimation. In Proceedings of the Thirty-First AAAI Conference on Artificial Intelligence, San Francisco, CA, USA, 4–10 February 2017; Volume 2, p. 6. [Google Scholar]
- Sladojevic, S.; Arsenovic, M.; Anderla, A.; Culibrk, D.; Stefanovic, D. Deep Neural Networks Based Recognition of Plant Diseases by Leaf Image Classification. Available online: https://www.hindawi.com/journals/cin/2016/3289801/ (accessed on 11 November 2018).
- Tajbakhsh, N.; Shin, J.Y.; Gurudu, S.R.; Hurst, R.T.; Kendall, C.B.; Gotway, M.B.; Liang, J. Convolutional Neural Networks for Medical Image Analysis: Full Training or Fine Tuning? IEEE Trans. Med. Imaging 2016, 35, 1299–1312. [Google Scholar] [CrossRef] [Green Version]
- Wang, D.; Khosla, A.; Gargeya, R.; Irshad, H.; Beck, A.H. Deep Learning for Identifying Metastatic Breast Cancer. arXiv 2016, arXiv:1606.05718. [Google Scholar]
- Bar, Y.; Diamant, I.; Wolf, L.; Greenspan, H. Deep learning with non-medical training used for chest pathology identification. In Proceedings of the Medical Imaging 2015: Computer-Aided Diagnosis; International Society for Optics and Photonics, Orlando, FL, USA, 21–26 February 2015; Volume 9414, p. 94140V. [Google Scholar]
- Yoon, Y.-C.; Yoon, K.-J. Animal Detection in Huge Air-view Images using CNN-based Sliding Window. In Proceedings of the International Workshop on Frontiers of Computer Vision (IWFCV), International Workshop on Frontiers of Computer Vision (IWFCV), Hakodate, Japan, 21–23 February 2018. [Google Scholar]
- Bischke, B.; Helber, P.; Schulze, C.; Srinivasan, V.; Dengel, A.; Borth, D. The Multimedia Satellite Task at MediaEval 2017. In Proceedings of the MediaEval 2017: MediaEval Benchmark Workshop, Dublin, Ireland, 13–15 September 2017. [Google Scholar]
- Bischke, B.; Bhardwaj, P.; Gautam, A.; Helber, P.; Borth, D.; Dengel, A. Detection of Flooding Events in Social Multimedia and Satellite Imagery using Deep Neural Networks. In Proceedings of the MediaEval 2017: MediaEval Benchmark Workshop, Dublin, Ireland, 13–15 September 2017. [Google Scholar]
- Thomee, B.; Shamma, D.A.; Friedland, G.; Elizalde, B.; Ni, K.; Poland, D.; Borth, D.; Li, L.-J. YFCC100M: The New Data in Multimedia Research. Commun ACM 2016, 59, 64–73. [Google Scholar] [CrossRef]
- Szegedy, C.; Vanhoucke, V.; Ioffe, S.; Shlens, J.; Wojna, Z. Rethinking the inception architecture for computer vision. In Proceedings of the IEEE Conference on Computer Vision and Pattern Recognition, Las Vegas, NV, USA, 26 June–1 July 2016; pp. 2818–2826. [Google Scholar]
- Kim, Y. Convolutional neural networks for sentence classification. arXiv 2014, arXiv:14085882. [Google Scholar]
- Goutte, C.; Gaussier, E. A probabilistic interpretation of precision, recall and F-score, with implication for evaluation. In Proceedings of the European Conference on Information Retrieval, Santiago de Compostela, Spain, 21–23 March 2005; Springer: Berlin/Heidelberg, Germany, 2005; pp. 345–359. [Google Scholar]
- Alam, F.; Imran, M.; Ofli, F. Image4Act: Online Social Media Image Processing for Disaster Response. In Proceedings of the 2017 IEEE/ACM International Conference on Advances in Social Networks Analysis and Mining, Sydney, Australia, 31 July–3 August 2017; pp. 601–604. [Google Scholar]
- Levandoski, J.J.; Larson, P.; Stoica, R. Identifying hot and cold data in main-memory databases. In Proceedings of the 2013 IEEE 29th International Conference on Data Engineering (ICDE), Brisbane, QLD, Australia, 8–12 April 2013; pp. 26–37. [Google Scholar]
- Kornacker, M.; Behm, A.; Bittorf, V.; Bobrovytsky, T.; Ching, C.; Choi, A.; Erickson, J.; Grund, M.; Hecht, D.; Jacobs, M. Impala: A Modern, Open-Source SQL Engine for Hadoop. In Proceedings of the CIDR, Asilomar, CA, USA, 4–7 January 2015; Volume 1, p. 9. [Google Scholar]
- Redmon, J.; Farhadi, A. YOLOv3: An Incremental Improvement. arXiv 2018, arXiv:1804.02767. [Google Scholar]
- Krizhevsky, A.; Sutskever, I.; Hinton, G.E. ImageNet Classification with Deep Convolutional Neural Networks. In Advances in Neural Information Processing Systems 25; Pereira, F., Burges, C.J.C., Bottou, L., Weinberger, K.Q., Eds.; Curran Associates, Inc.: New York, NY, USA, 2012; pp. 1097–1105. [Google Scholar]
- Ng, A. Machine Learning Yearning. Available online: https://www.deeplearning.ai/machine-learning-yearning/ (accessed on 3 February 2020).
- Huang, G.; Liu, Z.; van der Maaten, L.; Weinberger, K.Q. Densely Connected Convolutional Networks. arXiv 2016, arXiv:160806993. [Google Scholar]
- US Department of Commerce. Historical Hurricane Florence. 12–15 September 2018. Available online: https://www.weather.gov/mhx/Florence2018 (accessed on 26 December 2019).
- Irfan, U. Hurricane Florence’s “1000-year” Rainfall, Explained. Available online: https://www.vox.com/2018/9/20/17883492/hurricane-florence-rain-1000-year (accessed on 25 March 2019).
- Langone, A.; Martinez, G.; Quackenbush, C.; De La Garza, A. Hurricane Florence Makes Landfall and Looks to Stick Around. Available online: https://time.com/5391394/hurricane-florence-track-path/ (accessed on 26 December 2019).
- Feng, Q.; Liu, J.; Gong, J. Urban flood mapping based on unmanned aerial vehicle remote sensing and random forest classifier—A case of Yuyao, China. Water 2015, 7, 1437–1455. [Google Scholar] [CrossRef]
- Tralli, D.M.; Blom, R.G.; Zlotnicki, V.; Donnellan, A.; Evans, D.L. Satellite remote sensing of earthquake, volcano, flood, landslide and coastal inundation hazards. ISPRS J. Photogramm. Remote Sens. 2005, 59, 185–198. [Google Scholar] [CrossRef]
- Won, D.; Steinert-Threlkeld, Z.C.; Joo, J. Protest Activity Detection and Perceived Violence Estimation from Social Media Images. In Proceedings of the 25th ACM International Conference on Multimedia, Mountain View, CA, USA, 23–27 October 2017; pp. 786–794. [Google Scholar]
- Kalliatakis, G.; Ehsan, S.; Fasli, M.; Leonardis, A.; Gall, J.; McDonald-Maier, K. Detection of Human Rights Violations in Images: Detection of Human Rights Violations in Images: Can Convolutional Neural Networks help? arXiv 2017, arXiv:1703.04103. [Google Scholar]
- Schroff, F.; Kalenichenko, D.; Philbin, J. FaceNet: A Unified Embedding for Face Recognition and Clustering. In Proceedings of the CVPR, Boston, MA, USA, 7–12 June 2015; pp. 815–823. [Google Scholar]
- Jia, S.; Lansdall-Welfare, T.; Cristianini, N. Gender Classification by Deep Learning on Millions of Weakly Labelled Images. In Proceedings of the 2016 IEEE 16th International Conference on Data Mining Workshops (ICDMW), Barcelona, Spain, 12–15 December 2016; pp. 462–467. [Google Scholar]
- Ryu, H.J.; Adam, H.; Mitchell, M. InclusiveFaceNet: Improving Face Attribute Detection with Race and Gender Diversity. arXiv 2017, arXiv:171200193. [Google Scholar]
- Buda, M.; Maki, A.; Mazurowski, M.A. A systematic study of the class imbalance problem in convolutional neural networks. Neural Netw. 2018, 106, 249–259. [Google Scholar] [CrossRef] [Green Version]
- Jiang, Y.; Li, Z.; Ye, X. Understanding demographic and socioeconomic biases of geotagged Twitter users at the county level. Cartogr. Geogr. Inf. Sci. 2019, 46, 228–242. [Google Scholar] [CrossRef]
- Martín, Y.; Li, Z.; Cutter, S.L. Leveraging Twitter to gauge evacuation compliance: Spatiotemporal analysis of Hurricane Matthew. PLoS ONE 2017, 12, e0181701. [Google Scholar] [CrossRef] [Green Version]
- Jiang, Y.; Li, Z.; Cutter, S.L. Social network, activity space, sentiment and evacuation: What can social media tell us? Ann. Am. Assoc. Geogr. 2019. [Google Scholar] [CrossRef]
- Klein, G.; Kim, Y.; Deng, Y.; Senellart, J.; Rush, A.M. OpenNMT: Open-Source Toolkit for Neural Machine Translation. arXiv 2017, arXiv:170102810. [Google Scholar]
Figure 1.
The architecture of RIASM.

Figure 2.
External web pages of shortened URLs from tweets.

Figure 3.
The WebGIS-based results verification module.

Figure 4.
Examples of flooding photos.

Figure 5.
Examples of non-flooding photos.

Figure 6.
Photos identified as flooding by the trained VGG16 in the Houston Flood of 2017 dataset. These randomly selected 25 photos contain 14 real flooding photos.
Figure 6.
Photos identified as flooding by the trained VGG16 in the Houston Flood of 2017 dataset. These randomly selected 25 photos contain 14 real flooding photos.

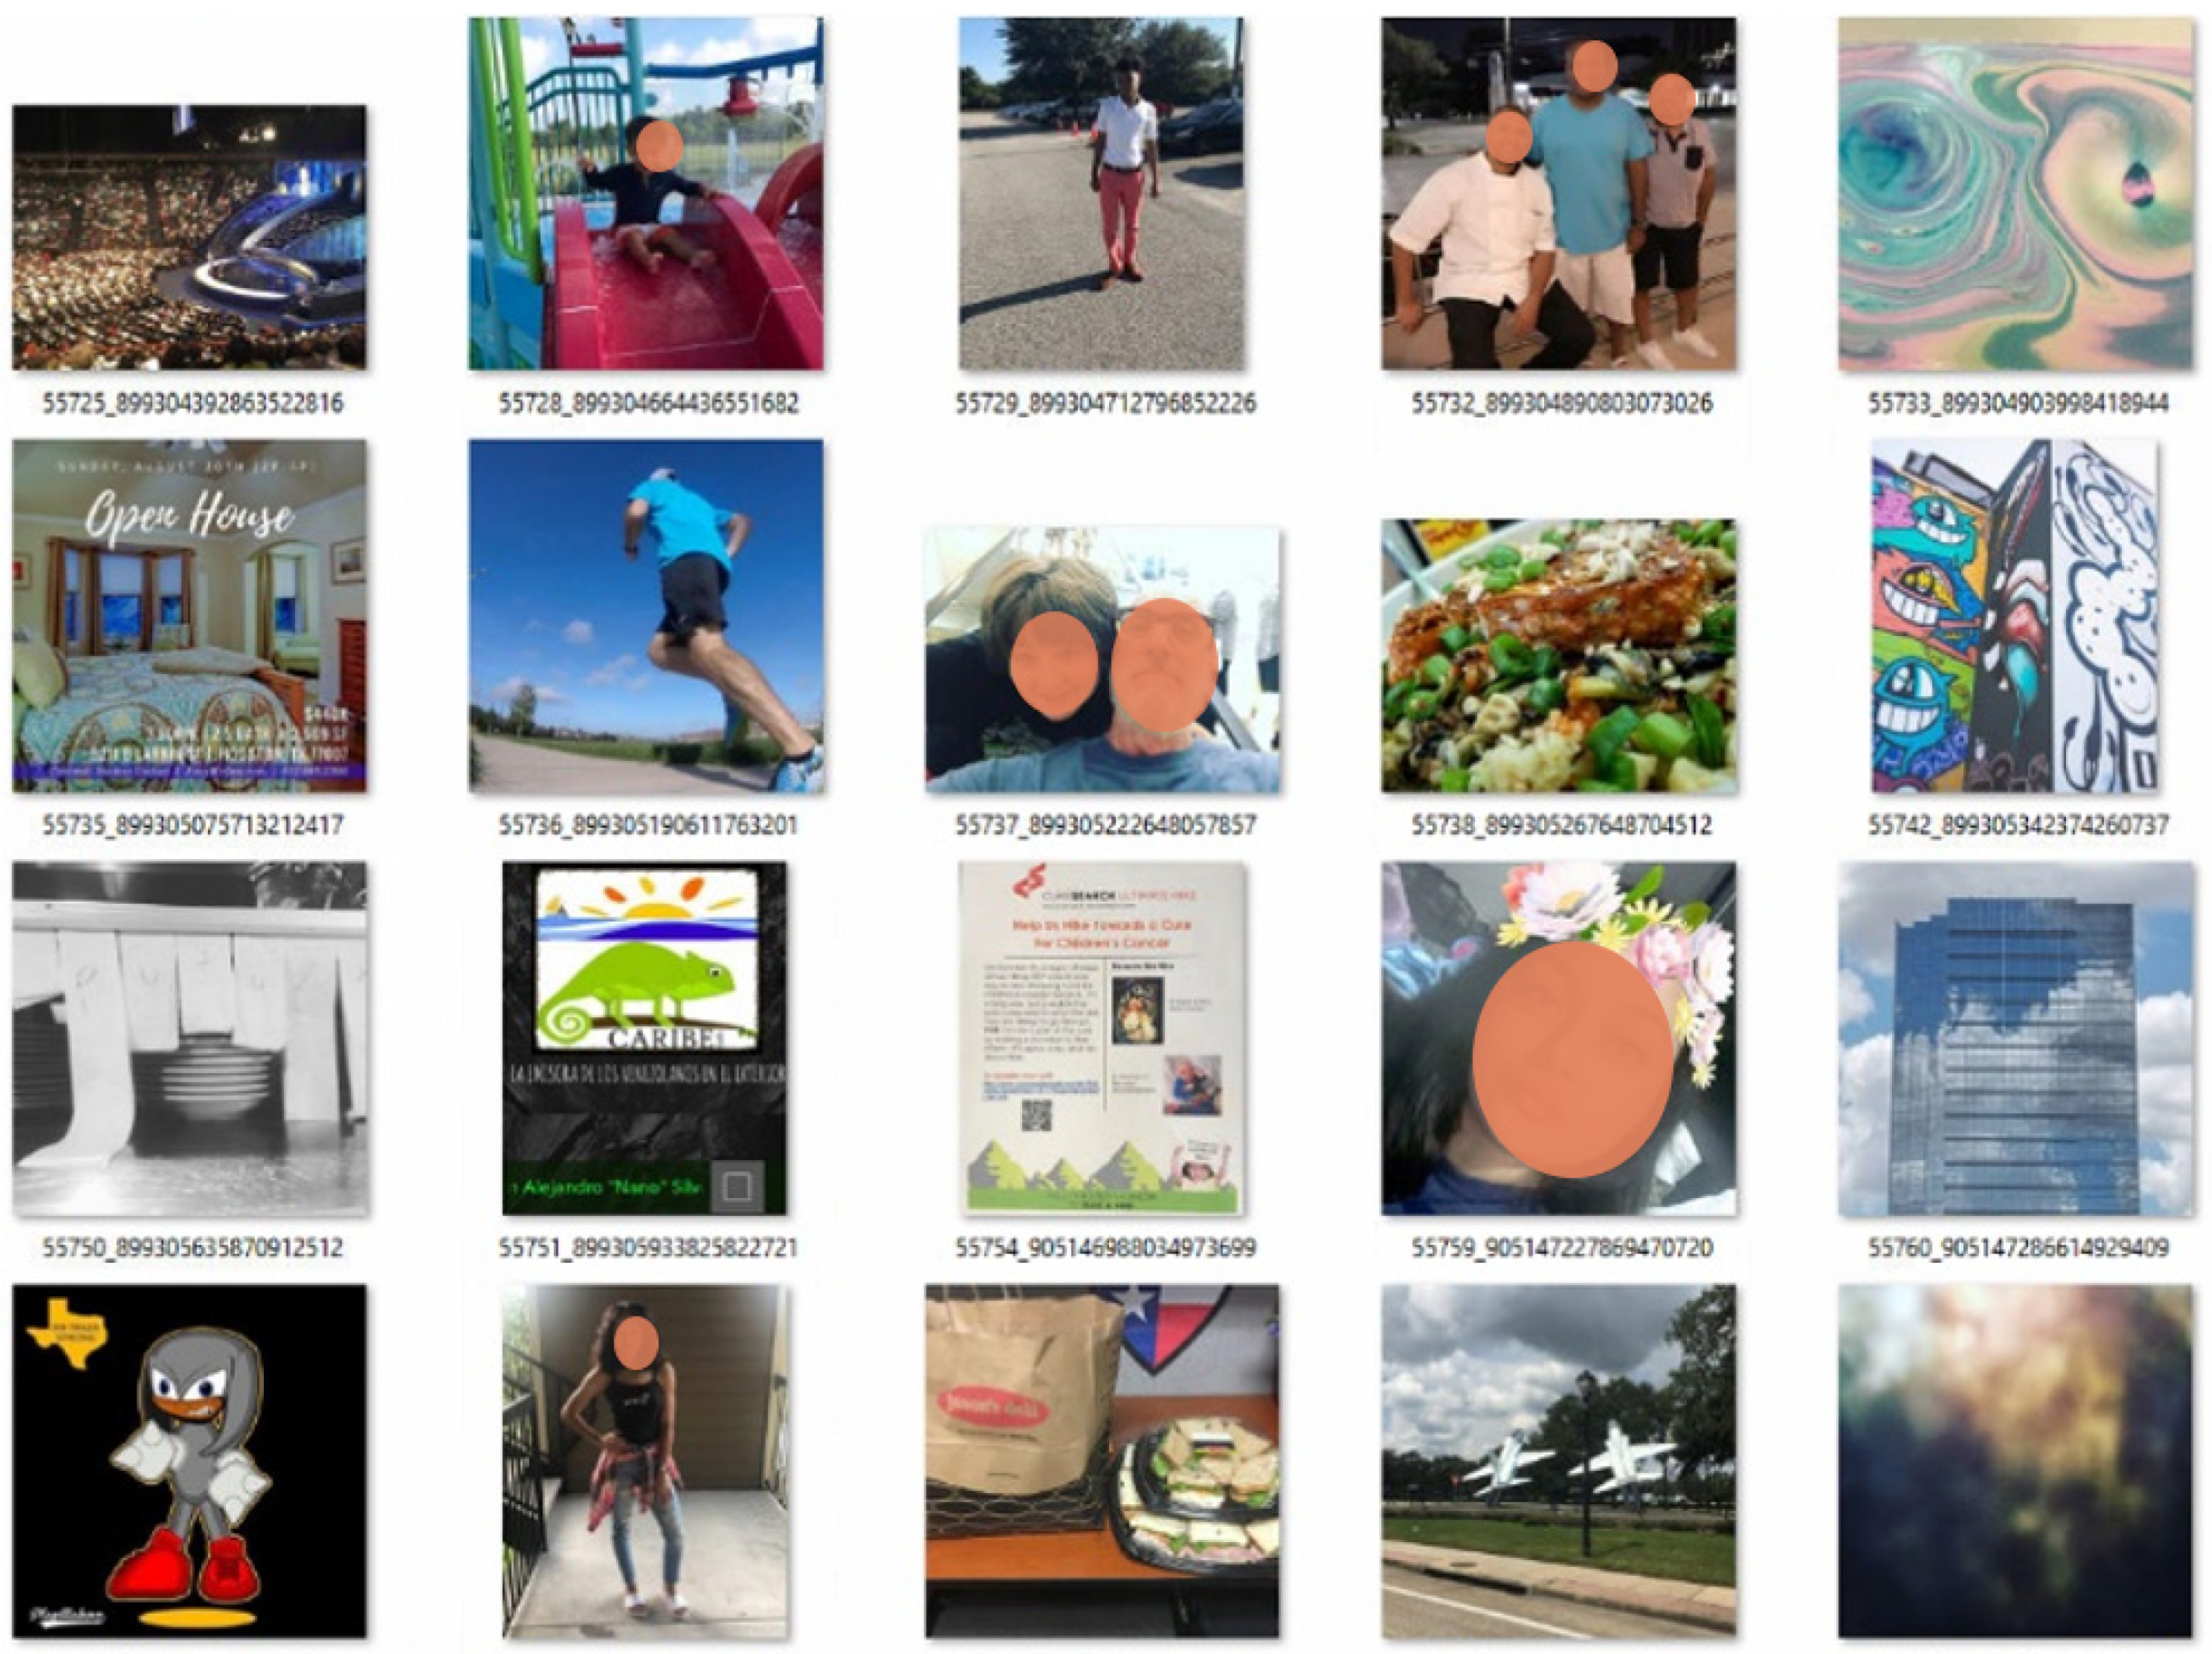
Figure 7.
Non-flooding photos identified by the trained VGG16 in Houston Flood 2017 dataset. These randomly selected 25 photos are all correctly labeled.
Figure 7.
Non-flooding photos identified by the trained VGG16 in Houston Flood 2017 dataset. These randomly selected 25 photos are all correctly labeled.

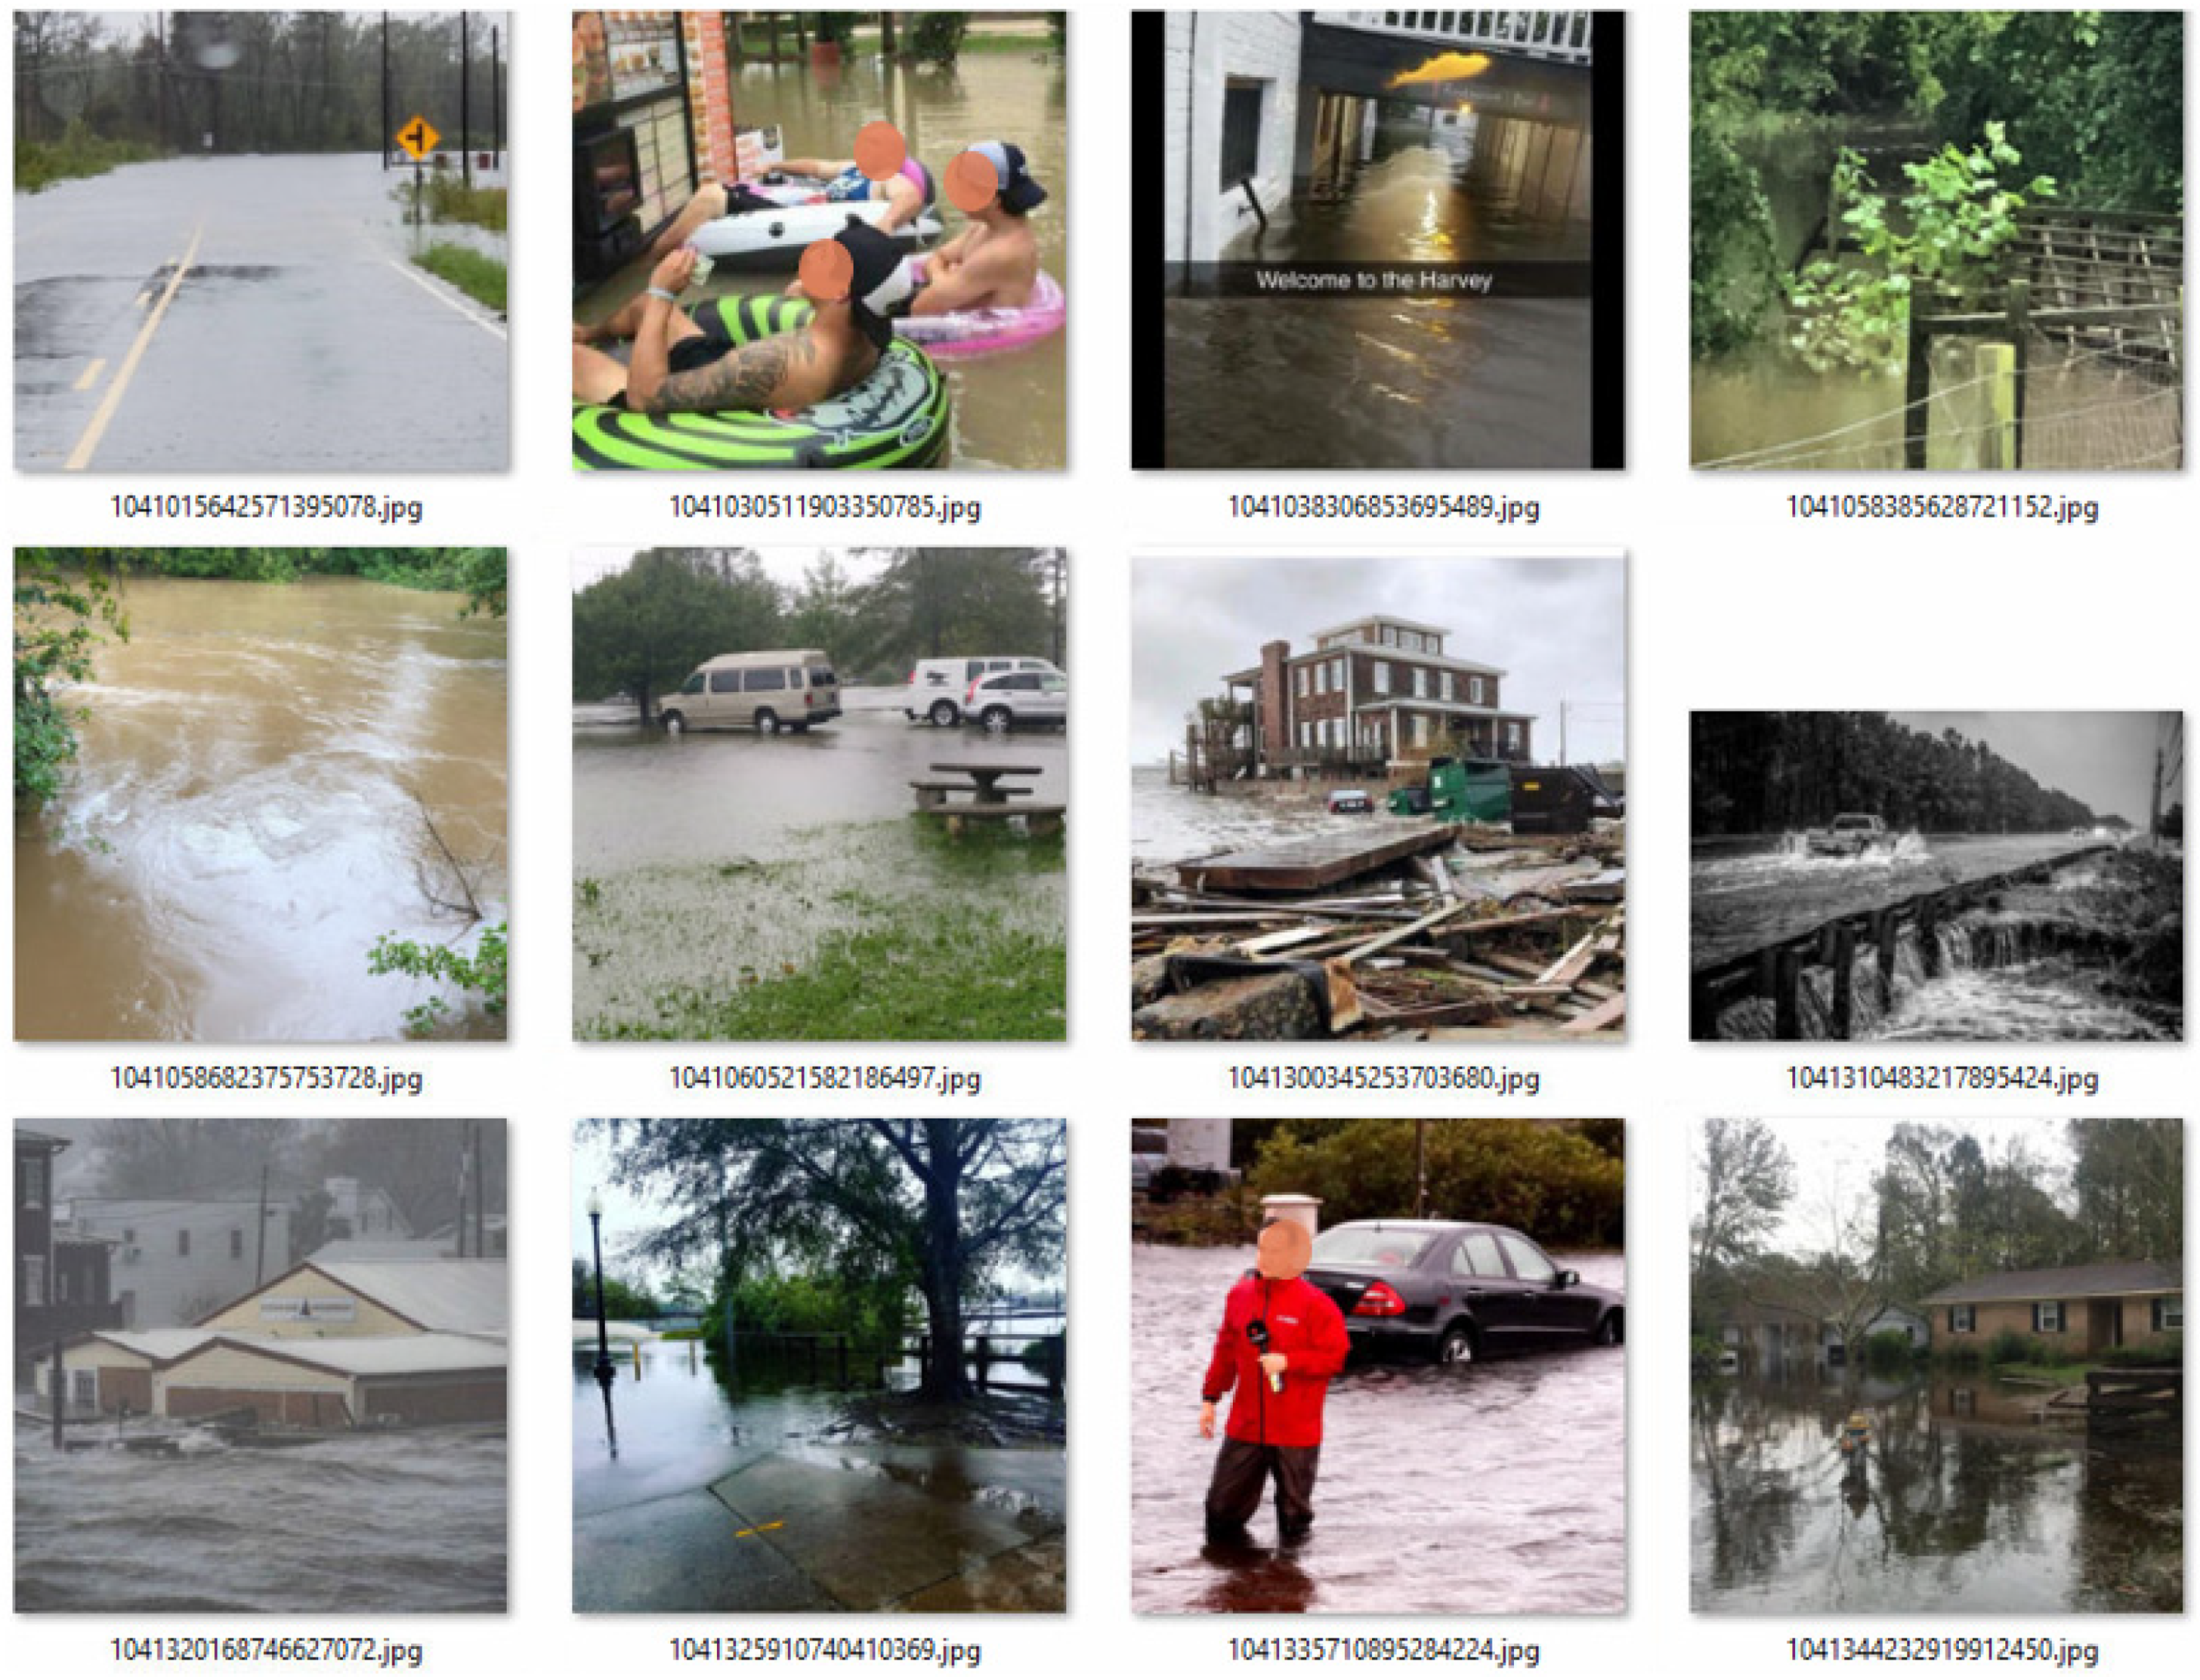
Figure 8.
Samples of the verified flooding photos posted during Hurricane Florence Flood.


Table 1.
Samples of shortened uniform resource locators (URLs) in tweets.
| Time | Text | URLs |
|---|---|---|
| 2015/10/2 17:11 | If you didn’t know, but I are under a flash flood warning??AND today was??????? | https://t.co/Qi8Xs5jopp |
| 2015/10/2 17:15 | You could not ask for a better cuddle buddy... @ The Gentry??????? | https://t.co/QBT04Dlk6p |
| 2015/10/2 17:16 | Drinking in the rain. (@ Pearlz Oyster Bar in Columbia; SC) | https://t.co/ZqNykREp30 |
| 2015/10/2 17:23 | This is what a rainy afterschool Friday afternoon looks like around here. Ahhhh....??????? | https://t.co/G9nGFGeJb7 |
| 2015/10/2 17:33 | At 4:30 PM; Myrtle Beach [Horry Co; SC] DEPT OF HIGHWAYS reports FLOOD | http://t.co/Sr8UHDxWnf |
Table 2.
Rules for identifying the flooding photos. If an in-situ photo reflects an ongoing flood and provides firsthand visual information, it can be identified as a flooding photo.
Table 2.
Rules for identifying the flooding photos. If an in-situ photo reflects an ongoing flood and provides firsthand visual information, it can be identified as a flooding photo.
| No.1 | Description | Photos with clear features inundated by water outdoors. |
| Reason | Inundated features, which are normally not in the water, such as houses, cars, and trees, are critical to characterizing a flooding photo. | |
| No.2 | Description | Indoors photos with clear features inundated by water. |
| Reason | Indoor flooding photos also reflect the on-site formation of ongoing floods | |
| No.3 | Description | A mosaic image contains ongoing flooding photos. |
| Reason | Mosaic images formed by flooding photos satisfy No.1 and No.2 contain the same information of their sub-photos. | |
| No.4 | Description | The photo satisfies No.1 – No. 3 and with text from the uploader. |
| Reason | The flooding photo with text (usually a description or the date for photos) reflect the on-site formation of ongoing floods. |
Table 3.
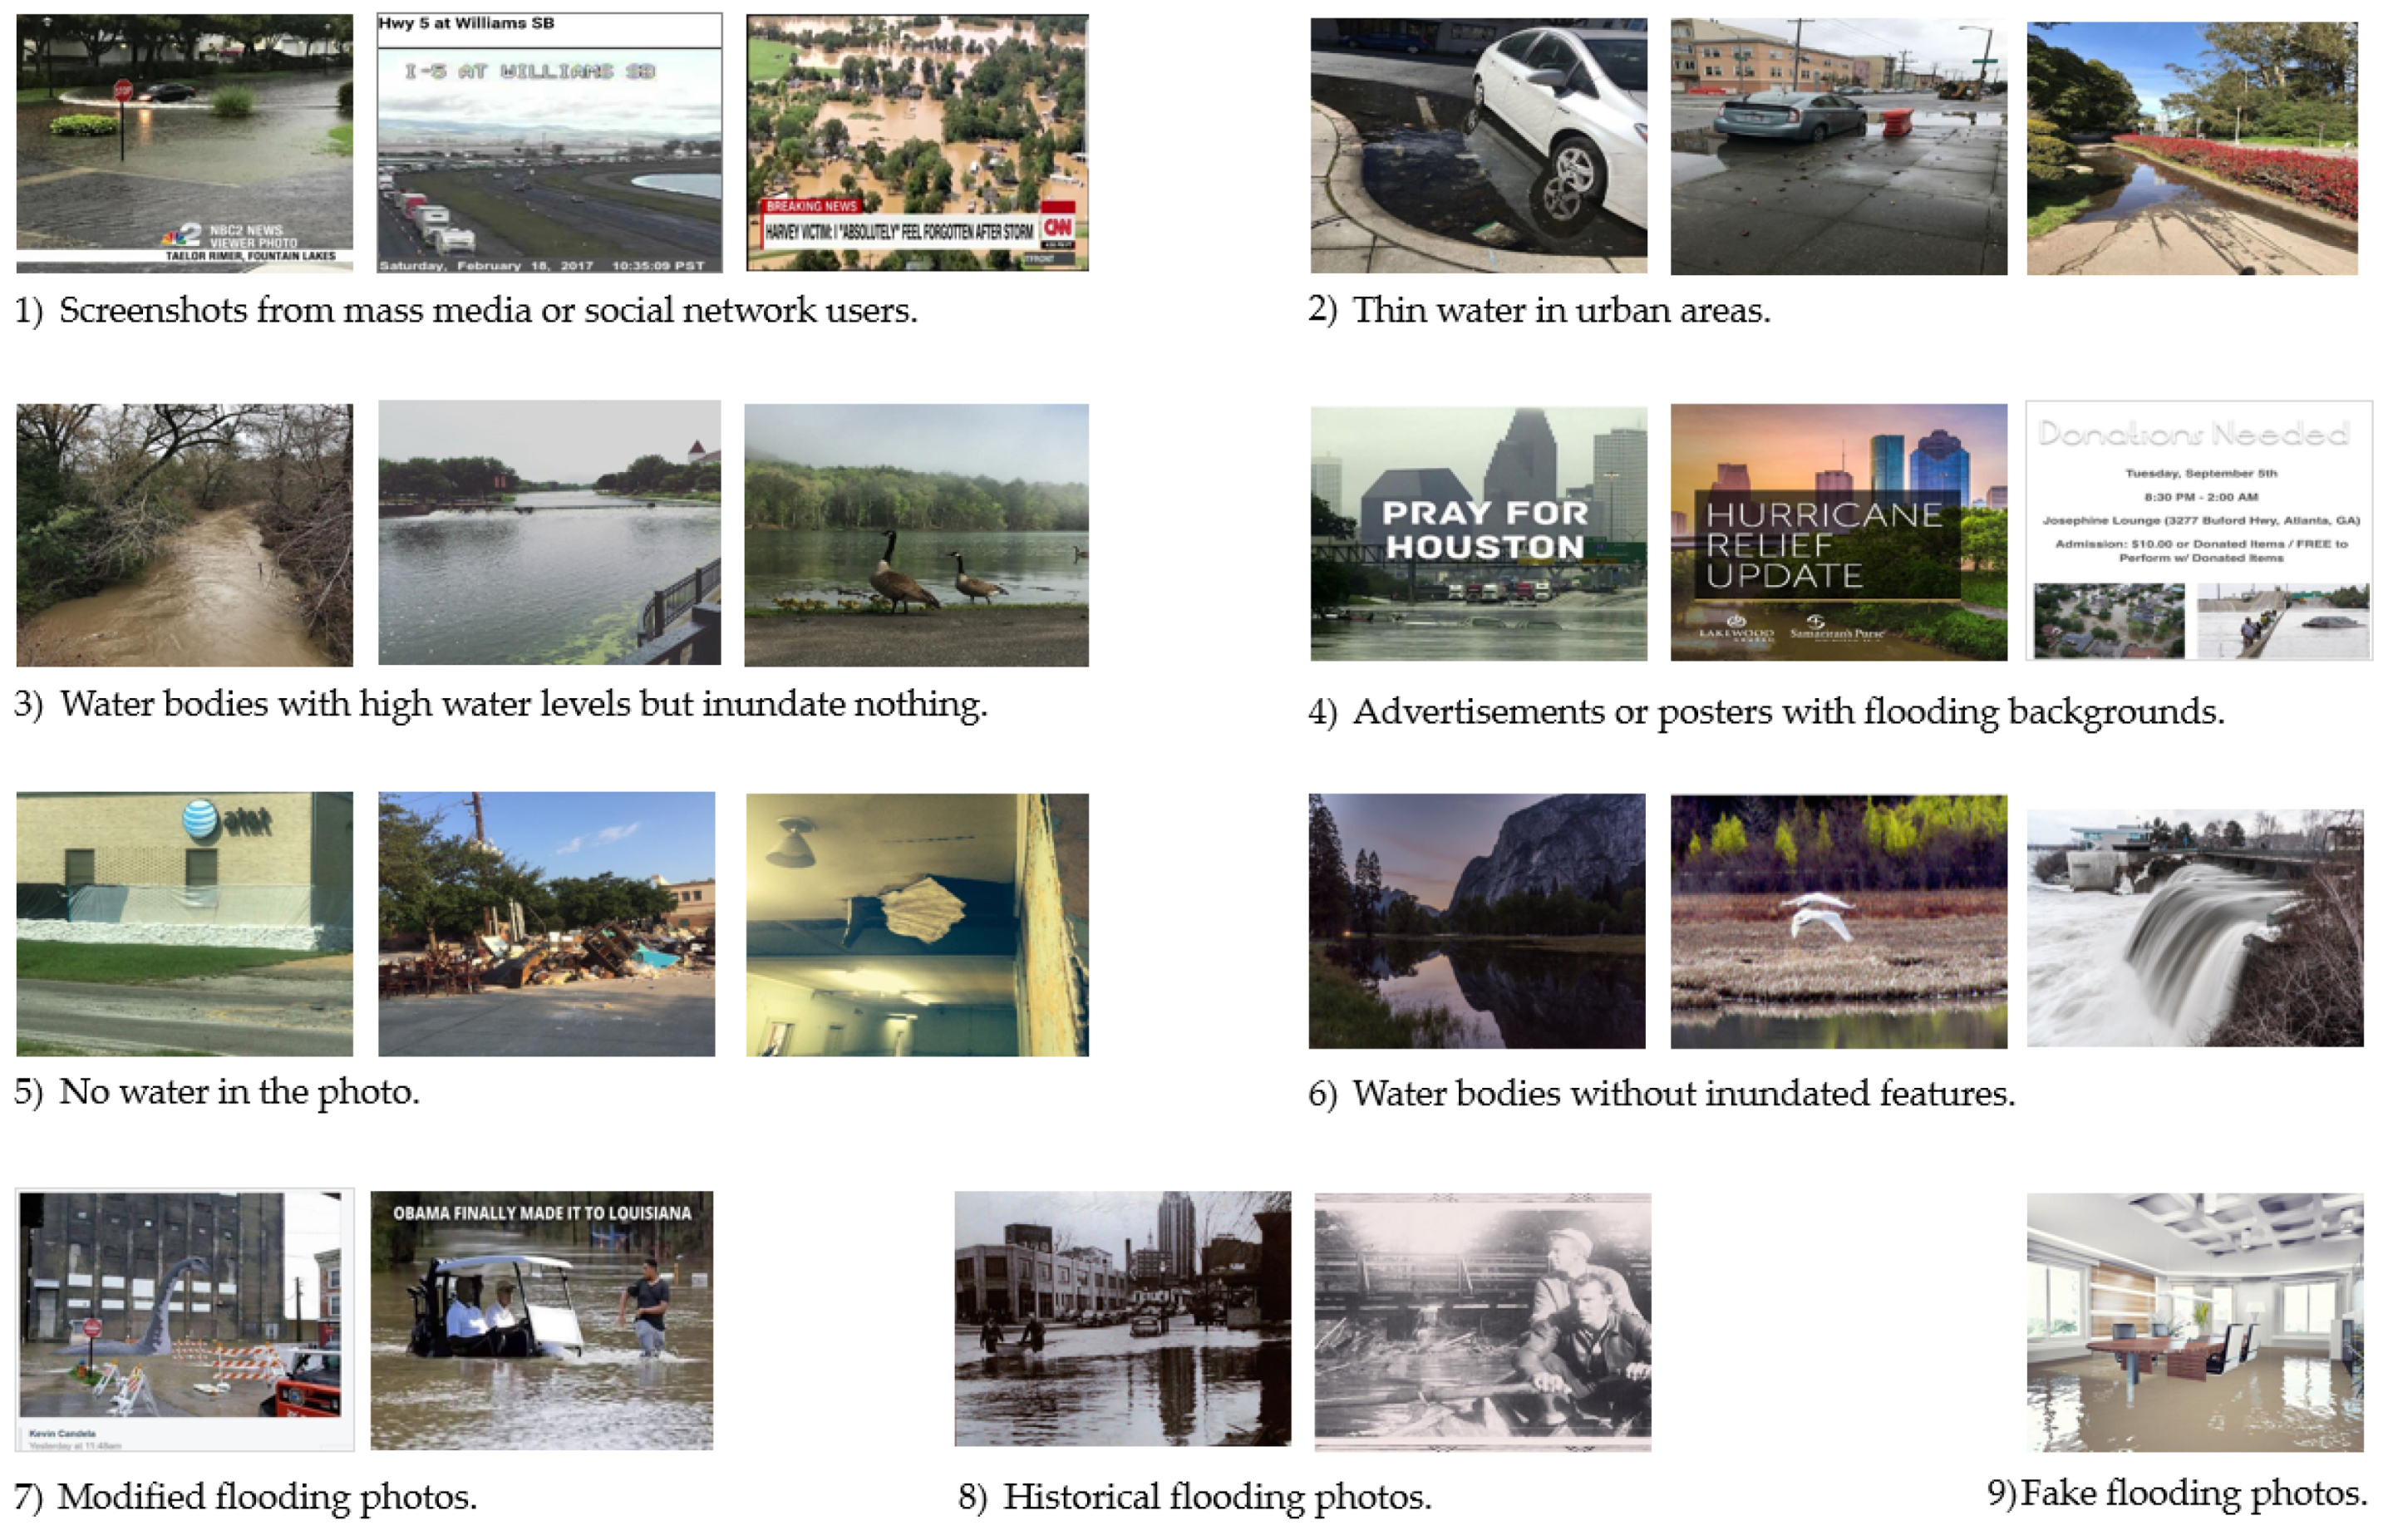
Rules for identifying non-flooding photos. A photo that cannot provide distinguishable visual information about the ongoing flood is a non-flooding photo.
Table 3.
Rules for identifying non-flooding photos. A photo that cannot provide distinguishable visual information about the ongoing flood is a non-flooding photo.
| No.1 | Description | Screenshots from mass media or social network users. |
| Reason | Cannot be considered as firsthand information. | |
| No.2 | Description | Thin water in urban areas. |
| Reason | The situation is still under control, not a flood. | |
| No.3 | Description | Water bodies with high water levels but inundate nothing. |
| Reason | The situation is still under control, not a flood. | |
| No.4 | Description | Advertisements or posters with flooding backgrounds. |
| Reason | Cannot indicate an ongoing flood. | |
| No.5 | Description | No water in the photo. |
| Reason | Cannot indicate an ongoing flood. | |
| No.6 | Description | Water bodies without referencing objects. |
| Reason | Cannot tell whether there is a flood. | |
| No.7 | Description | Modified flooding photos. |
| Reason | Cannot provide reliable information about the ongoing flood. | |
| No.8 | Description | Historical flooding photos. |
| Reason | Cannot provide reliable information about the ongoing flood. | |
| No.9 | Description | Fake flooding photos. |
| Reason | Cannot indicate an ongoing flood. |
Table 4.
Accuracies of the tested CNNs.
| Network | Method | Total Accuracy |
|---|---|---|
| VGG16 | Trained from scratch | 93% |
| VGG16 | Transfer learning | 91% |
| Inception V3 | Transfer learning | 91% |
| ResNet 152 | Transfer learning | 91% |
| DenseNet201 | Trained from scratch | 91% |
| DenseNet201 | Transfer learning | 91% |
© 2020 by the authors. Licensee MDPI, Basel, Switzerland. This article is an open access article distributed under the terms and conditions of the Creative Commons Attribution (CC BY) license (http://creativecommons.org/licenses/by/4.0/).
Share and Cite
MDPI and ACS Style
Ning, H.; Li, Z.; Hodgson, M.E.; Wang, C. Prototyping a Social Media Flooding Photo Screening System Based on Deep Learning. ISPRS Int. J. Geo-Inf. 2020, 9, 104. https://0-doi-org.brum.beds.ac.uk/10.3390/ijgi9020104
AMA Style
Ning H, Li Z, Hodgson ME, Wang C. Prototyping a Social Media Flooding Photo Screening System Based on Deep Learning. ISPRS International Journal of Geo-Information. 2020; 9(2):104. https://0-doi-org.brum.beds.ac.uk/10.3390/ijgi9020104
Chicago/Turabian StyleNing, Huan, Zhenlong Li, Michael E. Hodgson, and Cuizhen (Susan) Wang. 2020. "Prototyping a Social Media Flooding Photo Screening System Based on Deep Learning" ISPRS International Journal of Geo-Information 9, no. 2: 104. https://0-doi-org.brum.beds.ac.uk/10.3390/ijgi9020104
Note that from the first issue of 2016, this journal uses article numbers instead of page numbers. See further details here.