1. Introduction
Modeling human mobility in a city is tightly related to geographical patterns and spatial distributions. Understanding individual movements brings useful insights for a variety of applications, such as urban planning [
1], security [
2], migration studies [
3], disease spread [
4], traffic prediction (transportation planning) [
5], tourism [
6], and recommender systems [
7]. Researchers have tried to use surveys [
8] from travel or tourist centers in a traditional way to study mobility patterns; however, thanks to new technologies, finding a dataset to analyze people’s mobility is not a big concern anymore. Recently, a significant effort has been made with different types of datasets, including phone call records (CDR) [
9], WiFi or RFID [
10,
11], global positioning system (GPS) [
12] and location-based social network (LBSN) [
13] data, in order to obtain useful information from geographical movements. In this area, researchers have tried to tackle various questions: Does human mobility follow any model or pattern? Is it possible to extract significant patterns to define mobility models? Is it possible to estimate trajectory via home-to-work commutes? Do these trajectory patterns depend on the initial geographical position of individuals?
Traditional survey records are based on questions and answers which require human resources and a lot of time to obtain and to be analyzed statistically. On the other hand, GPS or CDR data have privacy limitations and lack a large amount of data. More recently, the explosive use of social media with geo-locations shared by users launched new research fields using location-based social networks (LBSNs) like Twitter, Facebook, Foursquare, or the Chinese microblog Sina Weibo, revealing unique opportunities to track mobility behaviors. These user-generated data provide extensive knowledge in three dimensions, namely, space, time, and textual content. Then, human mobility research can be accomplished using a different and complementary perspective, depending on the goal of the analysis.
With the rapid improvement in technology and widespread use of smart-phones in contrast to other sources of data, more and more people use applications to share their moments with others. This huge amount of check-in data can be considered as big data. It contains not only geo-tagged data, but also people’s social profiles, enabling researchers to conduct a comprehensive study on geographical positions, mobility behavior, social connections or travel demands. Moreover, the check-in data from social networking sites are publicly available in big sizes. For example, the Chinese Sina Weibo microblog allows users to send texts, photos, and videos while sharing their location online. According to the Weibo industry research and development center [
14], in the first half of 2018, the number of mobile microblog users in China was about 316 million, showing an increase of 29.23 million compared with the end of 2017. On the other hand, recent findings in [
15] have proven that China is one of the most rapidly developing countries, thus city planners have focused more on implementing urban planning designs for spatial urban pattern development. Constructing a bridge between urban infrastructure layout and planning is a momentous objective. Therefore, studying urban spatial schemes has gained huge attention, aiming to design impactful commercial business districts (CBD) in smart and sustainable cities. The European regional cohesion policy determines capacity, quality, viability timeline and history and landscape as four dimensions of the objective of achieving all aspects of urban life through expert planning in smart metropolitan areas. Focusing on metropolitan spatial structures, city planners play an important role in monitoring and managing a better and safer mobility, topography, economic development, consumer preferences, population growth, and sustainable transportation, such that all these factors together aim to improve the quality of inhabitant’s lives. Using technologies as an emerging tool to analyze the spatio-temporal aspects of human mobility in newly developed cities such as Shanghai helps the government to better understand citizen’s needs and the heartbeat of movement in order to provide efficient traffic flow between movements due to supply and demand. To achieve this aim, it is important to identify the frequently congested regions in CBD areas and the reasons these areas are congested. Understanding citizen’s demands helps managers to make better decisions to spread and balance different types of services in all regions in order to maximize movement flow, optimize resources, and reduce congestion. Researchers have offered different descriptions of commercial central districts. McColl et al. [
16] described an area with a main centralization of business land use as CBD, with a similar point of view to Drozdz et al. [
17], who pointed out that a significant CBD area contains enormous financial activities. Following [
18], we agreed that a CBD area contains a dense distribution of commercial resources and has high-density road networks. Every open data source point of interest (POI) that represents an entity in the geographical space is a reflection of the CBD.
Our main motivation here is to test the validity of geo-located Weibo data as a means of elucidating human mobility and activity patterns. In addition, we aim to identify important places in people’s lives with the support of location-based services in order to improve understanding of general human movement patterns and support the creation of realistic and practical models of human mobility. We also tried to adopt a geo-tagged Weibo dataset in order to analyze the behavioral characteristics of users from two perspectives, namely, their activity time and check-in point of interest types.
Despite the different values of check-in social media data, there are some issues that affect the quality of research in this field. When using social networks, an Internet connection is required to allow users to share their posts and generate spatio-temporal data, using the geolocation from where the user posts the message and the moment when they did. However, what if the user does not have an Internet connection at the specific posting time? The post will not have a tagged geo-location and time stamp and will not be useful for data analytics. In addition, a fake check-in happens when a user shares a location which is above the venue threshold of the actual location. Due to various reasons, a user may share a post claiming they are “enjoying food in a restaurant”, but in fact, they have made the post staying at home. Thus, fake check-in records should be excluded from the analysis.
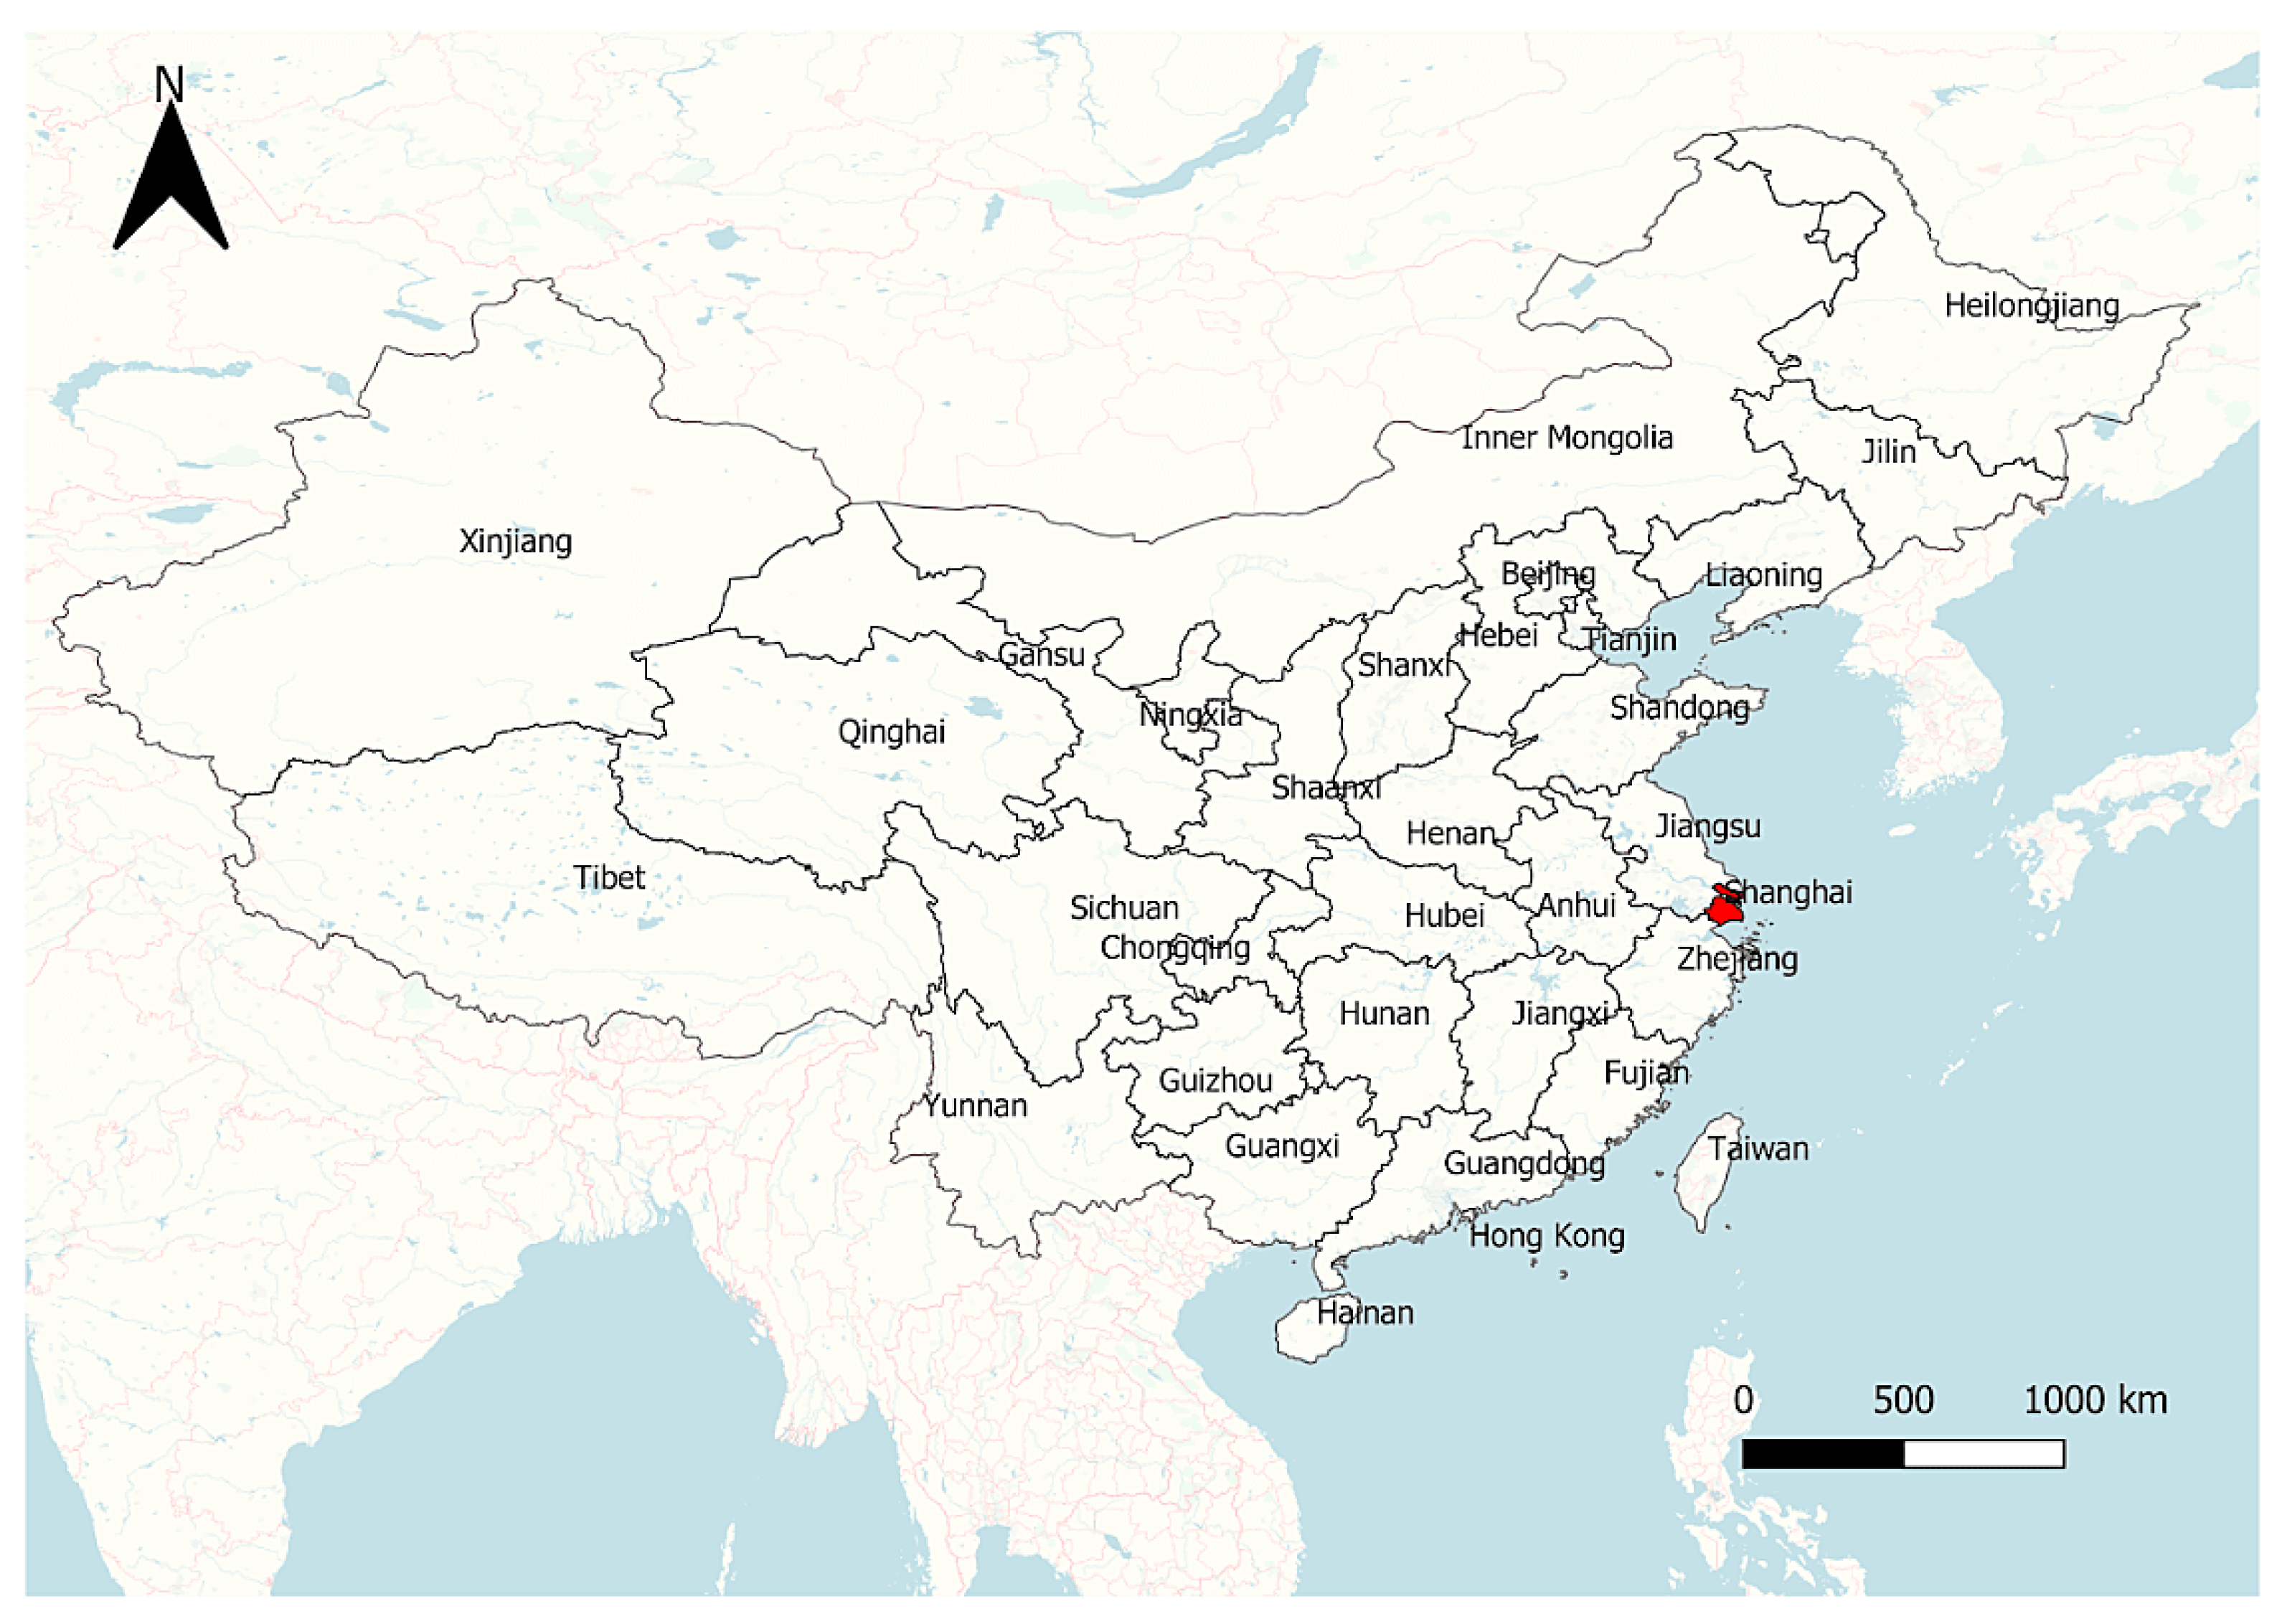
In this paper, we aim to analyze human mobility in the city of Shanghai from spatio-temporal big data extracted from the Chinese microblog Sina Weibo. As a major city of China, Shanghai was chosen as the case study of this research applying several data analytics algorithms to validate the use of a one-year period of Weibo data as a means of discovering human mobility patterns. The data available from the Sina Weibo dataset were enriched with a POI dataset to associate a more meaningful interpretation of the geo-location of each Weibo post. Several questions were posed, such as: How does one find out significant locations in people’s lives as an important aspect of characterizing human mobility? Is there an impact due to gender differences? How does one discover and describe mobility trajectories?
The remainder of this paper is organized as follows. In
Section 2, relevant research work related to social media data analytics is presented.
Section 3 gives a brief introduction of our case study and the dataset used in our analysis. In activity-based mobility studies, the generation of origin-destination (OD) matrices for analyzing movement behavior is essential. People’s movement is explored from an intra-urban perspective to generate OD travel matrices to identify trips from home to workplaces. In
Section 4, we explain the details of the cleaning data in order to identify accurate OD matrices.
Section 5 presents the methodology applied and provides a detailed description of the algorithms implemented to detect trip patterns, discover the most popular visited places, explore the temporal dimension, and estimate trajectories through the calculation of origin–destination travel matrices. In particular, different groups of people (male and female) were considered in the analysis of 11 different districts of Shanghai. The results obtained are visualized using adequate techniques to support decision-making.
2. Related Work
Human mobility refers to the movement of an individual or a group of people from their origin geolocation to their destination. Recently, people’s mobility has become a hot topic not only for the academic community for fundamental research purposes, but has also as an important research field for policymakers in smart cities in order to provide better services for citizens (e.g., in urban planning, public health, transportation). Human mobility has become an interesting topic for different research fields, ranging from computer science to social science [
19] and geographical science [
20]. The concept can be applied to areas of study such as urban planning, decision-making, migration, epidemic control, and transportation services. Understanding human movement becomes a crucial research question, and the purpose behind it is to integrate different data sources available for a variety of topics. Different topics can be obtained and analyzed from two perspectives of spatio-temporal analysis.
Liu et al. [
20] worked on taxi trajectory data and introduced a number of point pair vectors. They analyzed the population distribution assuming that each trip has two points: a pick-up point which was considered as the origin and a drop-off point considered as destination. They applied the Monte Carlo method to Shanghai data to validate their model. In another study, Liang et al. [
5] showed that the average population who visits a zone in a city is a good data source to model human mobility and the resident population. Thus, they calculated the daily population visiting a zone, using a radiation model to predict the flows of crowds. These two research works focused on the spatial distribution of flows, however, to highlight a difference with another research, Wu et al. [
21] calculated intra-urban human mobility by combining activity-based and movement-based approaches and focused more on temporal variation. Compared to previous studies, Wu et al. [
21] used temporal properties to find out whether people’s activities were in a fixed area or not and introduced two different types of activities, namely, locationally mandatory activities (LMA) and locationally stochastic activities (LSA). Since agent-based modeling (ABM) techniques are good for capturing actions in a time series, Bonabeau et al., [
18] introduced different applications using ABM related to dynamic human behavior patterns in the real world. The most important fields for the application of flow studies include traffic, human mobility management, and evacuation. The importance of this field is revealed when the number of crowd disasters (disasters caused by crowds) rises. A suitable system for supporting transport system planning based on people’s movement analysis would present the transportation network and simulate an individual’s activity, origin, the destination of trips, and timing properly. A further step in this system would be to predict how the changes in people’s behavior and activity could affect trips and movement in cities. Another interesting application of human mobility analysis is for city management. Carpooling has been introduced in order to tackle some transportation problems in big cities, with the goal of sharing part of the ride or expenses with other users. Human mobility analysis supports the implementation of mobility management policies to control the number of vehicles on the road. Furthermore, it reduces traffic and CO2 emissions, and, thus, air pollution. Another interesting study was published by Cezar [
22], who worked on GPS data to find the routine trips in Pisa [
23] and applied the density-based clustering method to social media data to find out the number of users in different events, like cultural and religious conferences or festivals, and detect which ones attract a large number of people.
Another useful data source to analyze people’s movement is call detailed record (CDR) data. Cellular network providers collect the call records and text messages of each person to provide better services. Each CDR data contain the duration and location of each call, as well as associated text messages if they are available. These data can be used to obtain the location of the owner of a cell phone and, according to several surveys, CDR data are considered a better data source. For instance, Isaacman et al. [
24] used CDR data to confirm individuals’ movements that can be detected by analyzing the footprint left by the user in the places they called from. They chose Hartigan’s leader algorithm [
25] to cluster the cell towers, which were first sorted in a descending order. The reason they chose this algorithm is that it does not require the definition of the number of clusters in the analysis. Since the distance among cell towers in suburban areas is about 1 to 3 miles, while in urban areas it is approximately 200 meters, they found that one mile is an appropriate equalization of the two kinds of area. Moreover, logistic regression was applied to determine the likelihood of the importance of a cluster.
Nowadays, due to the easy use of social media services like Foursquare, Twitter, Facebook, and Sina Weibo, especially on phones, they have become very popular and have attracted the attention of researchers. There are billions of people who use social media to share their knowledge, ideas, daily life routines and photos while sharing their location. These location-based services (LBS) not only attract people’s attention towards sharing their experiences but also allow researchers to take advantage of this significant source of data for analyzing people’s behavior. Cheng et al. [
26] collected check-in records from 220,000 users from different sources of location sharing services (LSS) to analyze aspects of spatio-temporal and textual mobility patterns. They proposed different ideas based on the density of the datasets in New York City, Los Angeles, and Amsterdam. They found out that human mobility is influenced by economic and geographical constraints and sentiment analysis of text messages enriched understanding of their research. Ullah et al. [
27] also analyzed spatio-temporal data from LBSNs to show the impact of people in green spaces. Yan et al. [
28] investigated three different datasets, including Sina Weibo data, to analyse individual’s decision-making regarding the places they tend to go and the influence of the economic aspects of crowds on hot spot destinations. They proved that the gravity model is well-suited to predicting the effects of mobility on destinations. They believe the results are applicable for decision-making policies. In another research, Liu et al. [
29] focused on examining the mobility differences between four different communities of Wuhan City, based on Sina Weibo data. They classified communities according to their check-in activities at specific areas and investigated their spatio-temporal behavior in six groups of categories. Wang et al. [
30] analyzed the relationship between human trajectory and Weibo access locations, additionally combining mobile phone records. They first classified the locations visited by users based on phone records and then found out the most frequently visited places by the Weibo distribution data. They concluded that time and speed patterns are beneficial for the classification of trajectories. In a similar work, Chao et al. [
31] studied Sina Weibo data to analyse students’ activities on campus. Using the Chinese University of Geosciences Wuhan (CUG Wuhan) community, as a case study, they found out the influence of distance on students’ spatio-temporal mobility patterns. Differing by the gender of users, they made a comparison of the results. They discovered that the community, in their research, tended to make more Weibo posts related to entertainment activities. In another work, Hasan et al. [
32] analyzed a Twitter dataset to categorize the spatio-temporal dimension of mobility patterns. Categorizing people’s activity was addressed in this research, illustrating the frequency of visited popular places. Kernel density estimation (KDE) [
33] was used to find out the distribution of activities over three major cities in the U.S. by splitting the temporal aspect into 3 hour intervals. They discovered that people choose their destination based on the popularity of visited places, not randomly. Moreover, there is a greater likelihood of making a destination based on the influence of other users that have selected the same place before and shared their experiences through social media. One year later, Hasan et al. [
34] worked more on social media check-in data from Twitter to classify individual activity patterns. They applied the latent dirichlet allocation (LDA) [
35] algorithm to find the distribution of specific words in tweets, that represent home and working places.
Yilan et al. [
36] proposed a three-step methodology. First, in order to find the unique venues, they applied a distance-based clustering algorithm on ‘days’ of the check-in records instead of the total number of user’s check-in. They used a distance-based clustering algorithm to discover the unique venues, then filtered the important clusters by frequently visited places in total days, and finally find out the ‘work’ and ‘home’ places, which were labeled based on check-in records and POI data. A gravity model provides an estimate of the volume of flow, for example, goods, services, or people between two or more locations. This could be the movement of people between cities or the volume of trade between countries. Gao et al. [
37] proved that check-in data are a suitable and efficient model to predict human mobility using their gravity model, despite some other research works [
29] where authors believe the gravity model [
30] is not well-fitted to elucidate spatial interactions. In order to solve the challenge of low graph density, they used the particle swarm optimization (PSO) method to obtain the best fit. They revealed the underlying distance of inter-urban travel demand based on social media check-in data and flight passenger data.
Recently, many efforts have been made to analyze human mobility from very distinct datasets. A great effort has been made to review recent works in [
38]. Different methods and models have been used to understand human movement. The gravity model is one of the most used models for analysis in this regard. Since the gravity model is static, the parameters must be adjusted with real mobility data from additional sources of data. Beiro et al. [
39] designed a hybrid model with a classical gravity model by training a real dataset from Flickr to find people’s traces in the U.S.
As a summary, different data types and methods used for human mobility analysis are presented in
Table 1.
In addition to previous approaches, there are also research works on human mobility for geographical studies and urban planning whose goal is to find people’s important places of movement and, specifically, to analyze their mobility between home and work with the purpose of location tracking. This kind of analysis allows the creation of origin–destination (OD) matrices. There are three categories for OD matrices that can be useful in transportation applications. Collecting data for OD household surveys in a traditional way is time-consuming, does not provide continuous data, and is basically for a specific study area. Another method is count-based OD from traffic detectors. Although this method reduces estimation time and expenses, it has a high cost in terms of installing infrastructure on roads, plus it presents coverage issues. With the emergence of new technology, new sources of data have been introduced to collect traffic flow data, such as GPS and Bluetooth data, which both have their own limitations, for example, due to privacy concerns. When collecting user’s trajectory data by GPS, the user’s agreement is required, and since users tend to turn off Bluetooth on their devices to save battery, this influences the sample rate. LBSN services overcome all these limitations in the era of new technologies as a dynamic mobility solution. Yang et al. [
40] obtained an OD matrix using a novel mixed combining regression and gravity model using Foursquare check-in data. They classified eight categories of venues using an agglomerative hierarchical clustering method. Using Chicago Metropolitan Agency for Planning (CMAP) data helped to compare and evaluate their model estimating OD travel matrix for non-community trips. In another study, Wang et al. [
41] worked with taxi GPS data to obtain travel patterns from OD flows. They proposed a chord diagram plot to illustrate the spatio-temporal patterns of residents in seven-day taxi trajectories in Beijing.
In another work, Kurkcu et al. [
42] proposed a density-based clustering algorithm, elucidating the most common human mobility features of home-to-work travel, validating Twitter data as a ubiquitous and suitable data source to elucidate travel demands. Identifying home places, they clustered the most visited locations of a user based on the number of tweets and assumed the most visited place as a home or origin. In addition to time filtering, they applied some keyword filters on tweets to verify the origin of a user’s trip. Based on those conditions, they chose the strongest density as a home place for a given user. Their research shows that Twitter data are a potential suitable source of data to analyze activity patterns. On the other hand, Xuan et al. [
43] analyzed different group’s behavior using the smart card data (SCD) of Shenzhen combined with social media data. Focusing on students and travelers, they revealed useful insights into travel flows in both aspects of the spatial and temporal characteristics. They applied the K-means algorithm to divide travelers into different groups and check their specific temporal activities on different days of the week. The results show a major hub in the metro system based on the number of tap-in and tap-out times in the dataset.
All these works have shown the relevance and potential of using geo-located data from different sources to analyze human mobility. In particular, this confirms the interest in exploiting social media data in this regard. In this paper, a selected number of algorithms inspired by previous works are implemented to discover human patterns, starting from traditional statistical analysis and progressing to dynamic data analysis of social media.
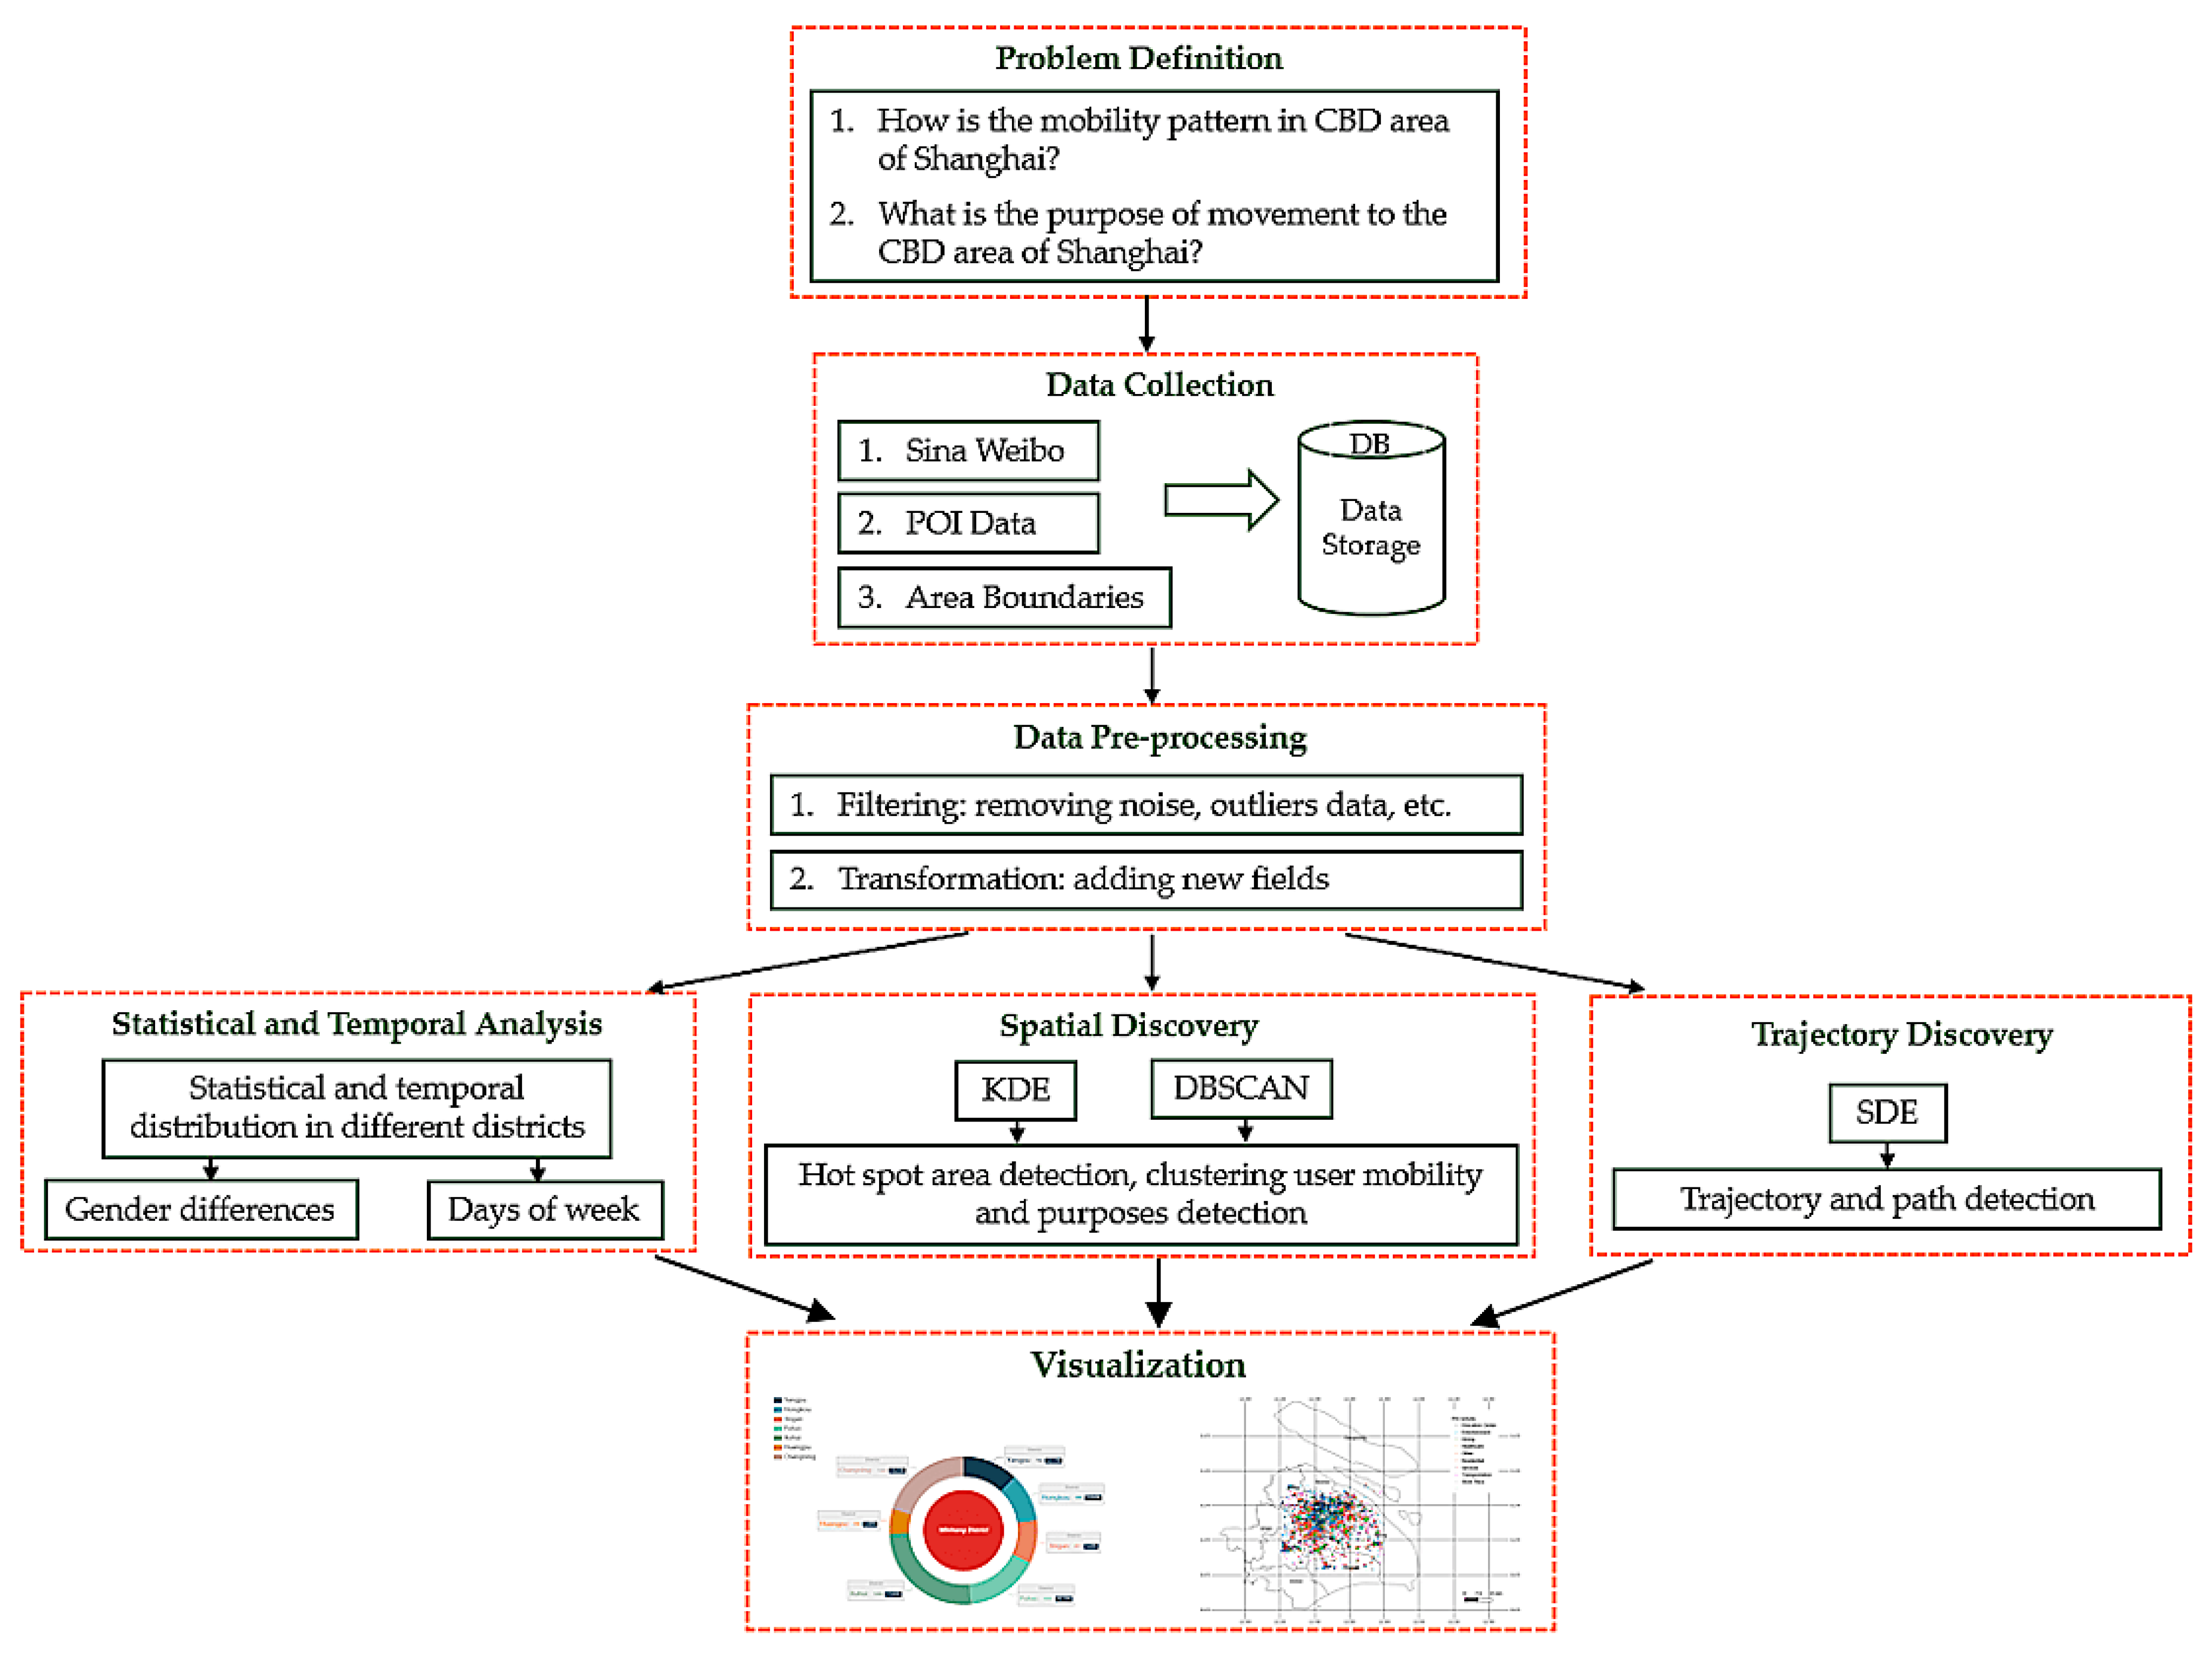
5. Methodology and Results
The research follows the lifecycle of an average data analysis/mining project. It starts by formulating questions, then moves on, collecting the data, preprocessing the data, exploring the data and communicating the data findings.
Figure 7 shows the steps of the methodology applied.
5.1. Exploratory Analysis and Visualization
In our experiments, we divided the analysis into different sections. In this section, we investigate and compare the statistical analysis regarding the Sine Weibo data from between 2014 and 2015 from 11 districts of Shanghai, including the CBD area. After cleaning the data, we obtained 233,467 check-in, geo-tagged results and analyzed these from different perspectives, as explained below:
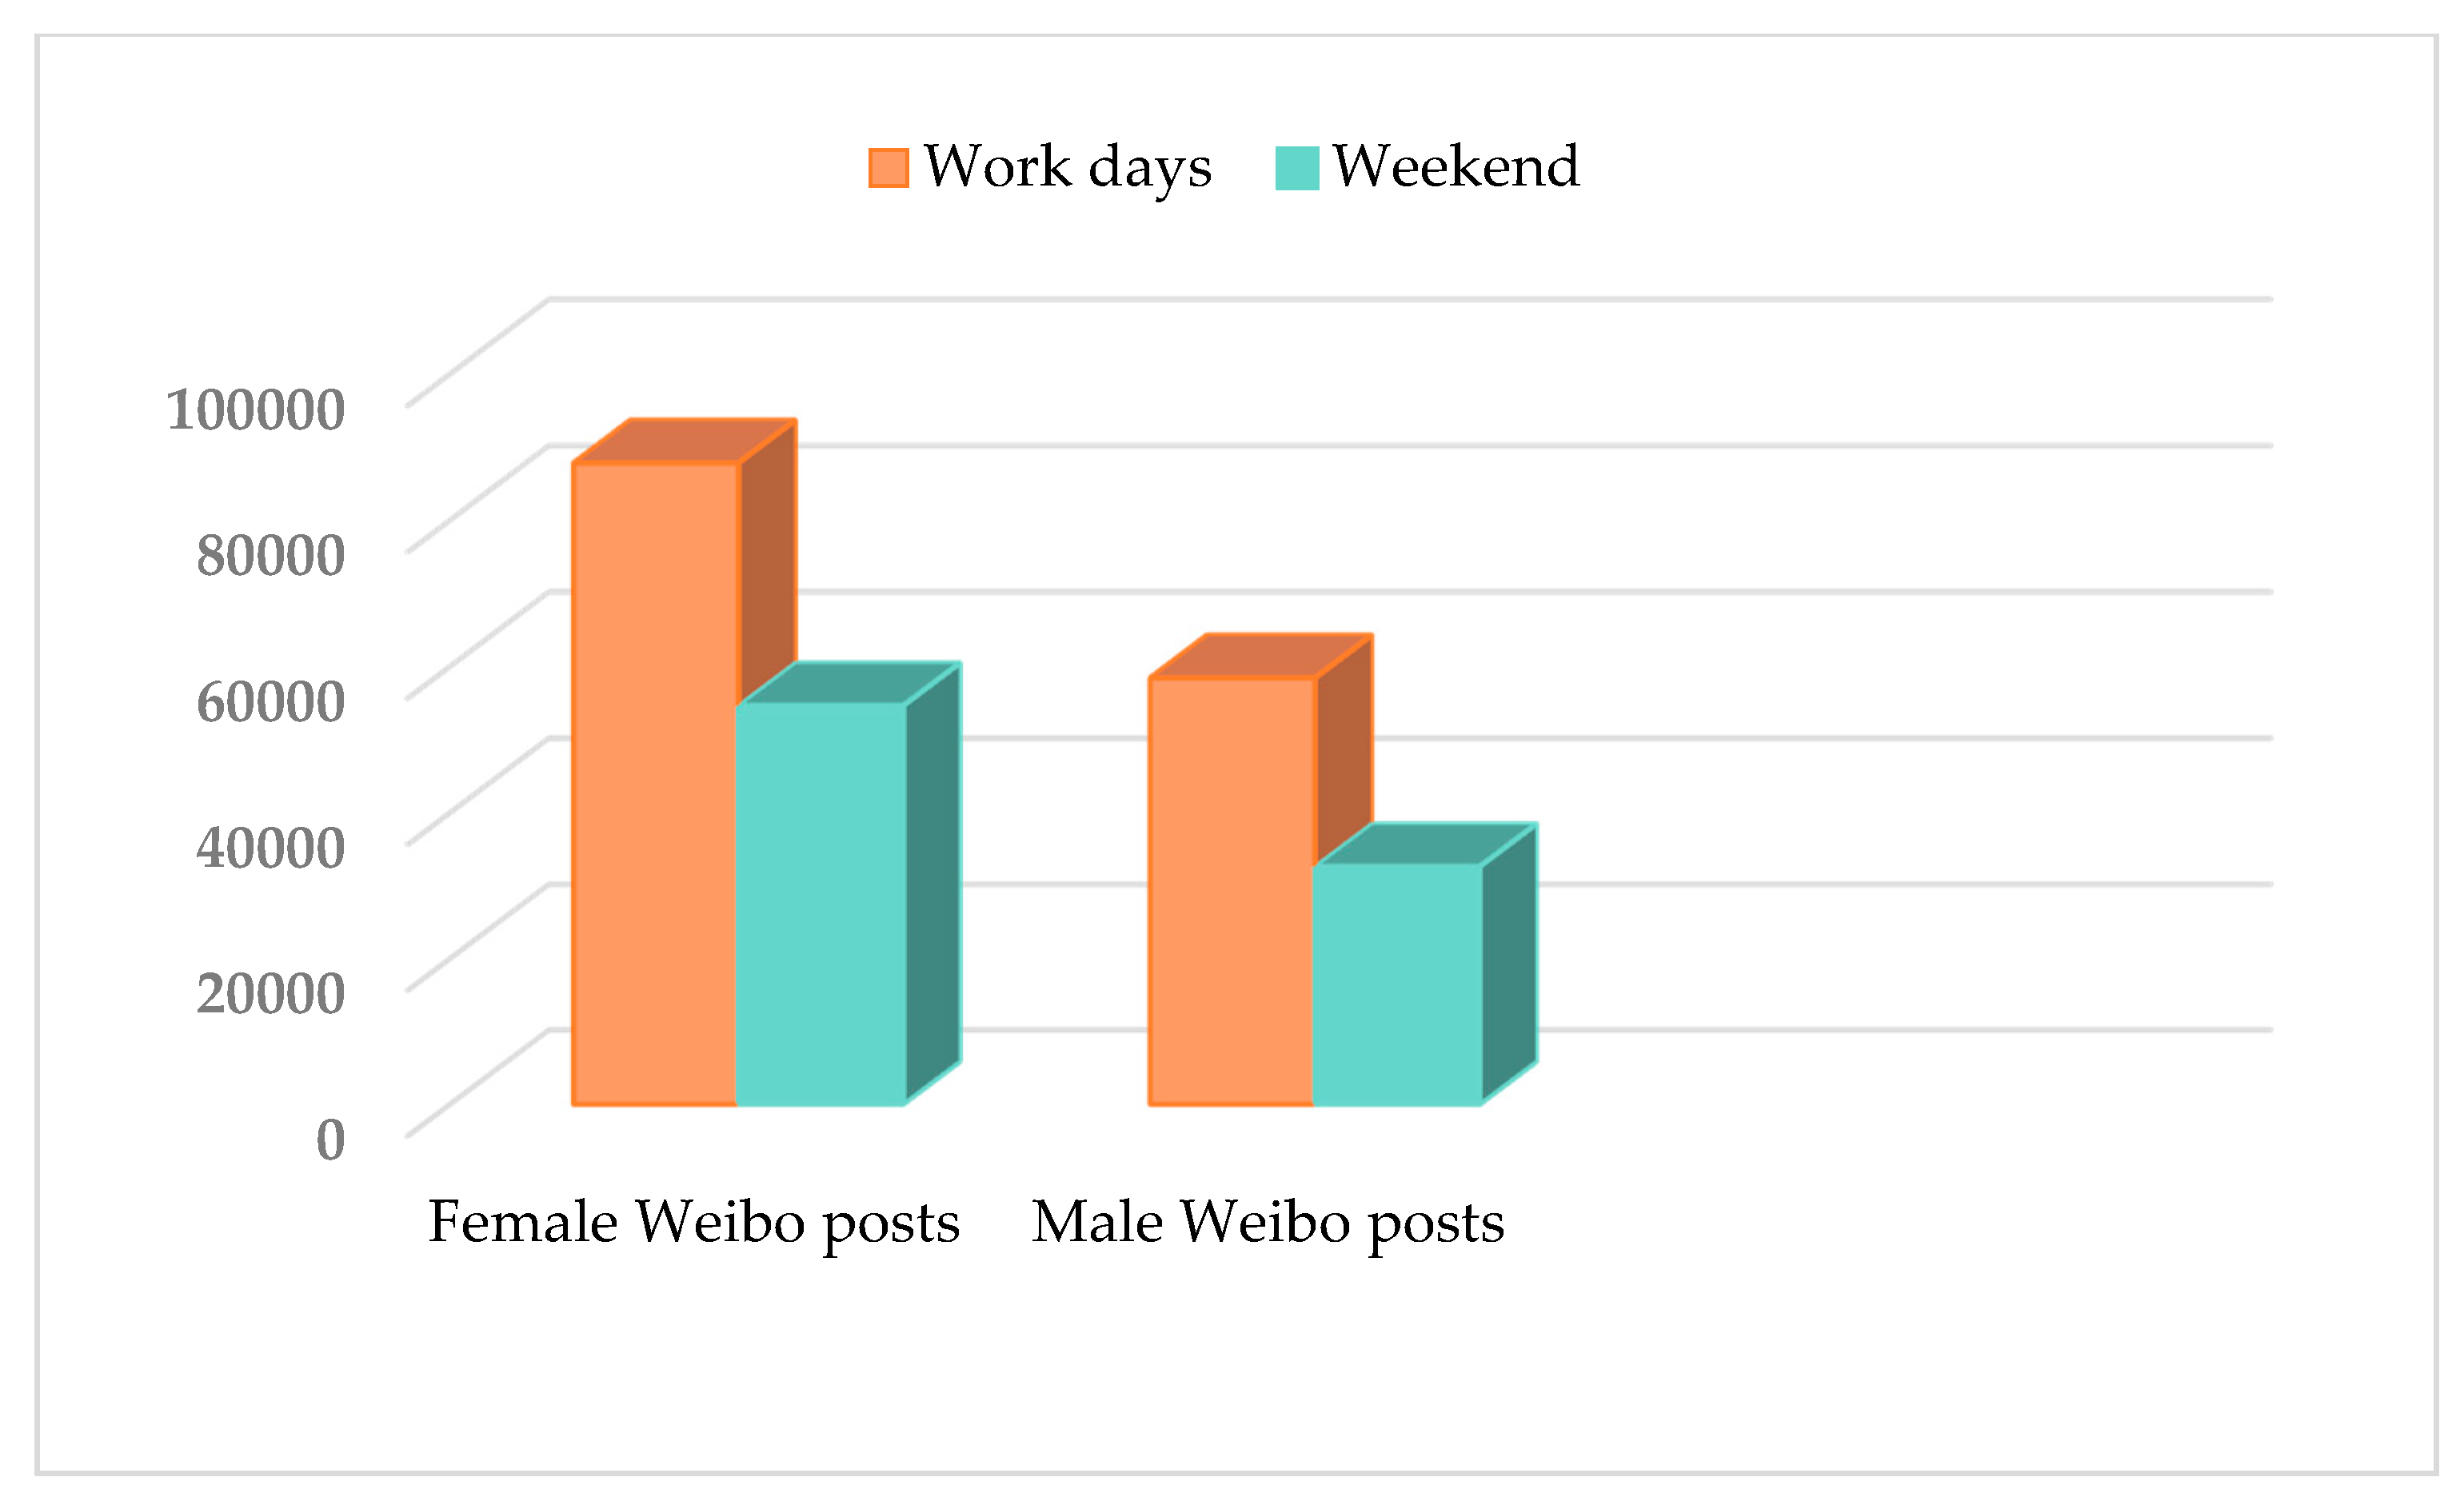
Regarding the analysis of different communities, we analyzed the data based on gender. The results in
Figure 8 show female and male activities in two periods of time from 2014 and 2015. We found that, in both years, females were more active than males. Analyzing the total check-in numbers differentiated by gender, we found that Sina Weibo, as a social media platform, is more popular among females, with 22% more female users than males;
In order to find the peak hour of activities and the patterns of human mobility, we analyzed the data based on time. We analyzed the data of two different periods of the years separately and found that the activity trend was almost the same; thus, we merged the data of the two year period and illustrated the results in
Figure 9. Despite other studies that have analyzed mobility based on periods of time (every six or four hours), we chose hourly movement to figure out more details because of the rapid movement of people, and because we believe that people do not stay in one place for several hours and check-in several times. The horizontal axis represents the time of day, starting from midnight (0) and moving to 11 PM, and the vertical axis shows the number of check-ins at that specific time or hour. The distribution of check-ins for females (red color) and males (blue color) is denoted by two different colors. First, we sorted the time series in descending order by each hour timestamp, then checked the user check-ins in those series by gender
where
denotes the set of time
t per day
d for the group of users
u by gender.
The results show that both females and males are more active at the end of working days in the period of 18:00 to 21:00, while fewer activities happened between 11:00 to 14:00, which are considered as lunch and resting times during working days. However, it was also observed that the check-in frequency of females was almost consistent, with a slight increase during the day, while it was the opposite for males in the same period of time;
Based on the analysis, it is clear that human activities vary over time, but it is of great significance to analyze human mobility in different regions. For this reason, we analyzed user activities in different districts to illustrate spatial dependencies. The goal here is to help urban authorities, who hope to understand human mobility patterns in different regions within the city.
Figure 10 shows human activities based on 11 districts of Shanghai from 2014 and 2015. From
Figure 10, it is obvious that Yangpu is the most famous district among users because it is now the location of the city hall, The Bund, and the most famous shopping malls and tourist sites.
Table 4 shows the most visited districts in Shanghai. Among these top six districts, five are located in the CBD area of Shanghai;
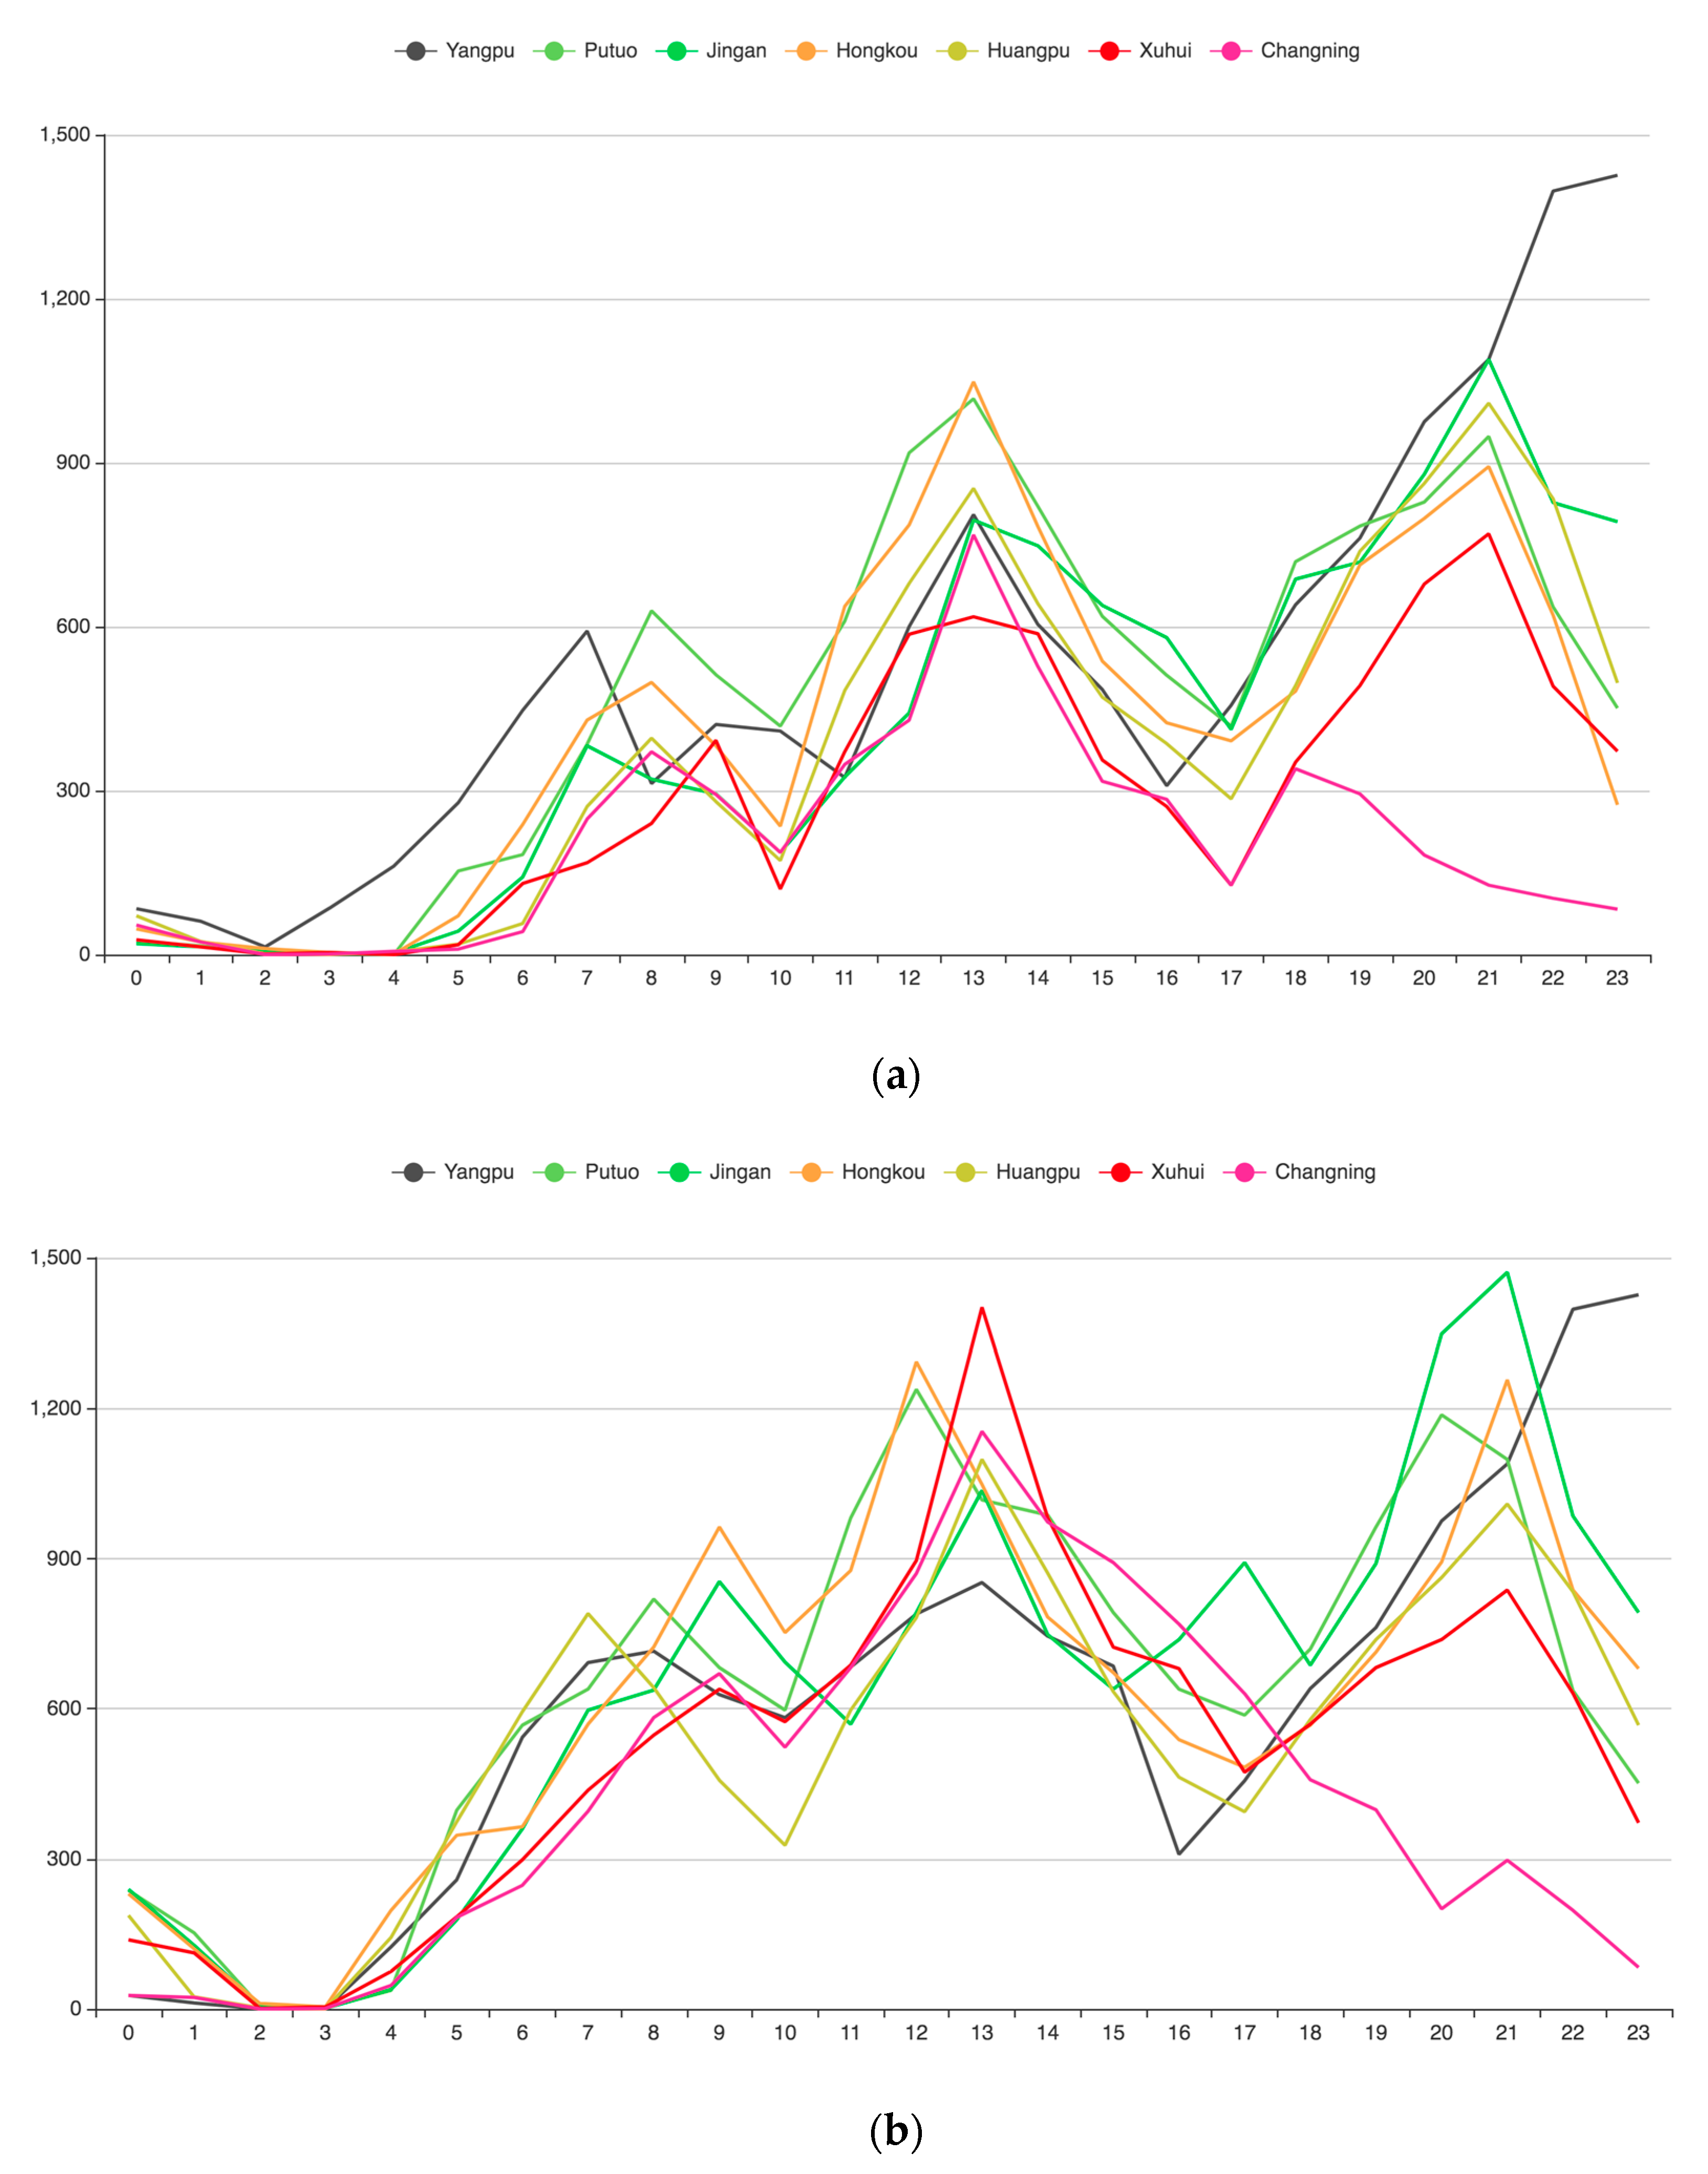
Moreover, for further and in-depth analysis we investigated big geo-data and applied mining techniques to discover knowledge concerning spatio-temporal relations, as shown in
Figure 11. We analyzed the check-in activities at different hours of the day and compared the two years of data for seven districts of Shanghai, considered as a CBD. The horizontal axis represents the time of day, starting from midnight (0) and moving to 11 PM, and the vertical axis shows the number of check-ins at that specific time or hour. The distribution of check-ins is denoted in eleven districts of Shanghai, including the CBD area and its four neighboring districts, which are shown in a different color.
The analysis shows that people tend to publish more Weibo posts within the period of 1100 to 1400 h, which is considered as a lunch and resting time. Each color shows a different district and the size of the graphic reflects the number of Weibo posts posted in that district. We can see that the trends are almost the same over the two years. There are clear increases in the number of Weibo posts posted during the lunchtime break period and when people are normally back home at night.
5.2. Kernel Density Estimation (KDE)
As discussed above, the temporal information of movement in geographical space is important to detect the spatio-temporal trends of underlying human mobility. However, with the increasing number of aggregated human/vehicle trajectories in urban space, the space–time path representation model will be hard to interpret because of the overlapping and cluttering issues. To solve this problem, we applied the kernel density estimation (KDE) [
46], which has been widely used in spatial analysis to characterize a smooth density surface that shows the geographic clustering of point or line features in 2D space. KDE is a non-parametric algorithm used to calculate the density of features in a given dataset. Applying KDE helps us to create a smooth curve in a given dataset and find the strongest density, which represents the most important places in people’s lives. KDE is formulated as follows
where
h is bandwidth and
n is the number of points. The bandwidth affects the smoothness of the resulting distribution. With the kernel function
k, this algorithm weights the points in each location to calculate the distance. The bandwidth has a direct influence on the shape of the curve, meaning that the bigger the value of the bandwidth parameter, the smoother the curve, which contains more points (a large bandwidth leads to a very smooth density distribution and a small bandwidth leads to an unsmooth distribution). Since we applied KDE, we can show a curve line showing the underlying distribution, which is expressed as
As shown in Equation (3), k is the kernel function estimate of the density at a point y within a group of points, xi, and i = 1 … N and h is the bandwidth. We used KDE to find the nearest neighbor here.
The process consists of finding the POI nearest neighbor to each user status using an efficient spatial search algorithm called KD-Tree, which creates a binary search tree (index) to match against the lookups, which is carried out quickly, reducing the search time to O (d log n) where d is the number of dimensions (in this case, two latitude and longitude). If a POI is within a predefined umbral, then we associate the activity category to the user’s status. The KD-Tree algorithm consists of partitioning the space along one dimension at a time (for example latitude), finding the median of the data that conform with the selected dimension, splitting the data based on the median, and changing the axis in a cyclic fashion at each partitioning step until, in each partition, we have the highest M number of points in each partition (leaf size 10).
As shown in
Figure 12, most user activities are located in the center of Shanghai, or, more specifically, in seven districts, including Jingan, Hongkou, Huangpu, Xuhui, and Putuo, which are considered as central business districts (CBD). Focusing on these specific areas, we analyzed the mobility of people in different aspects. First, in order to remove noise and achieve smoother data, we applied the density-based spatial clustering of applications with noise (DBSCAN) algorithm.
5.3. Density-Based Spatial Clustering of Applications with Noise (DBSCAN)
Spatial clustering analysis is a well-known data mining technique. It groups objects into clusters according to their similarities in both the location and attribute aspects. DBSCAN [
47] was used in this study. We used the DBSCAN algorithm to find clusters of important locations in the user’s mobility, which are densely connected in the region given in the dataset. As a clustering method, DBSCAN can remove noise on a set of points and verify whether, based on the Euclidean distance, a group of points are close to each other. Two main parameters are required by DBSCAN:
Epsilon (eps): In order to find close neighborhood points, eps is established as the maximum distance needed between points to define a cluster;
Min Points (MinPts): This parameter denotes the minimum number of points to shape a cluster.
For example, if
eps is equal to 0.5 meters and
MinPts is equal to 7, DBSCAN will start with a random point and discover the seven points around its region of up to 0.5 meters, forming the first cluster, and if it could not find the minimum number of points to define the dense region, it would consider this random point as noise. We chose 5% of user’s published Weibo posts in the dataset as
MinPts with a 200-meter
esp value. Choosing a suitable value for
eps is crucial, because if the value is too high, the majority of the points will be merged in a same cluster, while, on the other hand, if a small value will be selected for
eps, there will not be enough points for the cluster or it will not see the minimum number of points, and thus it will be considered as noise. A k-distance graph can be used to find a suitable
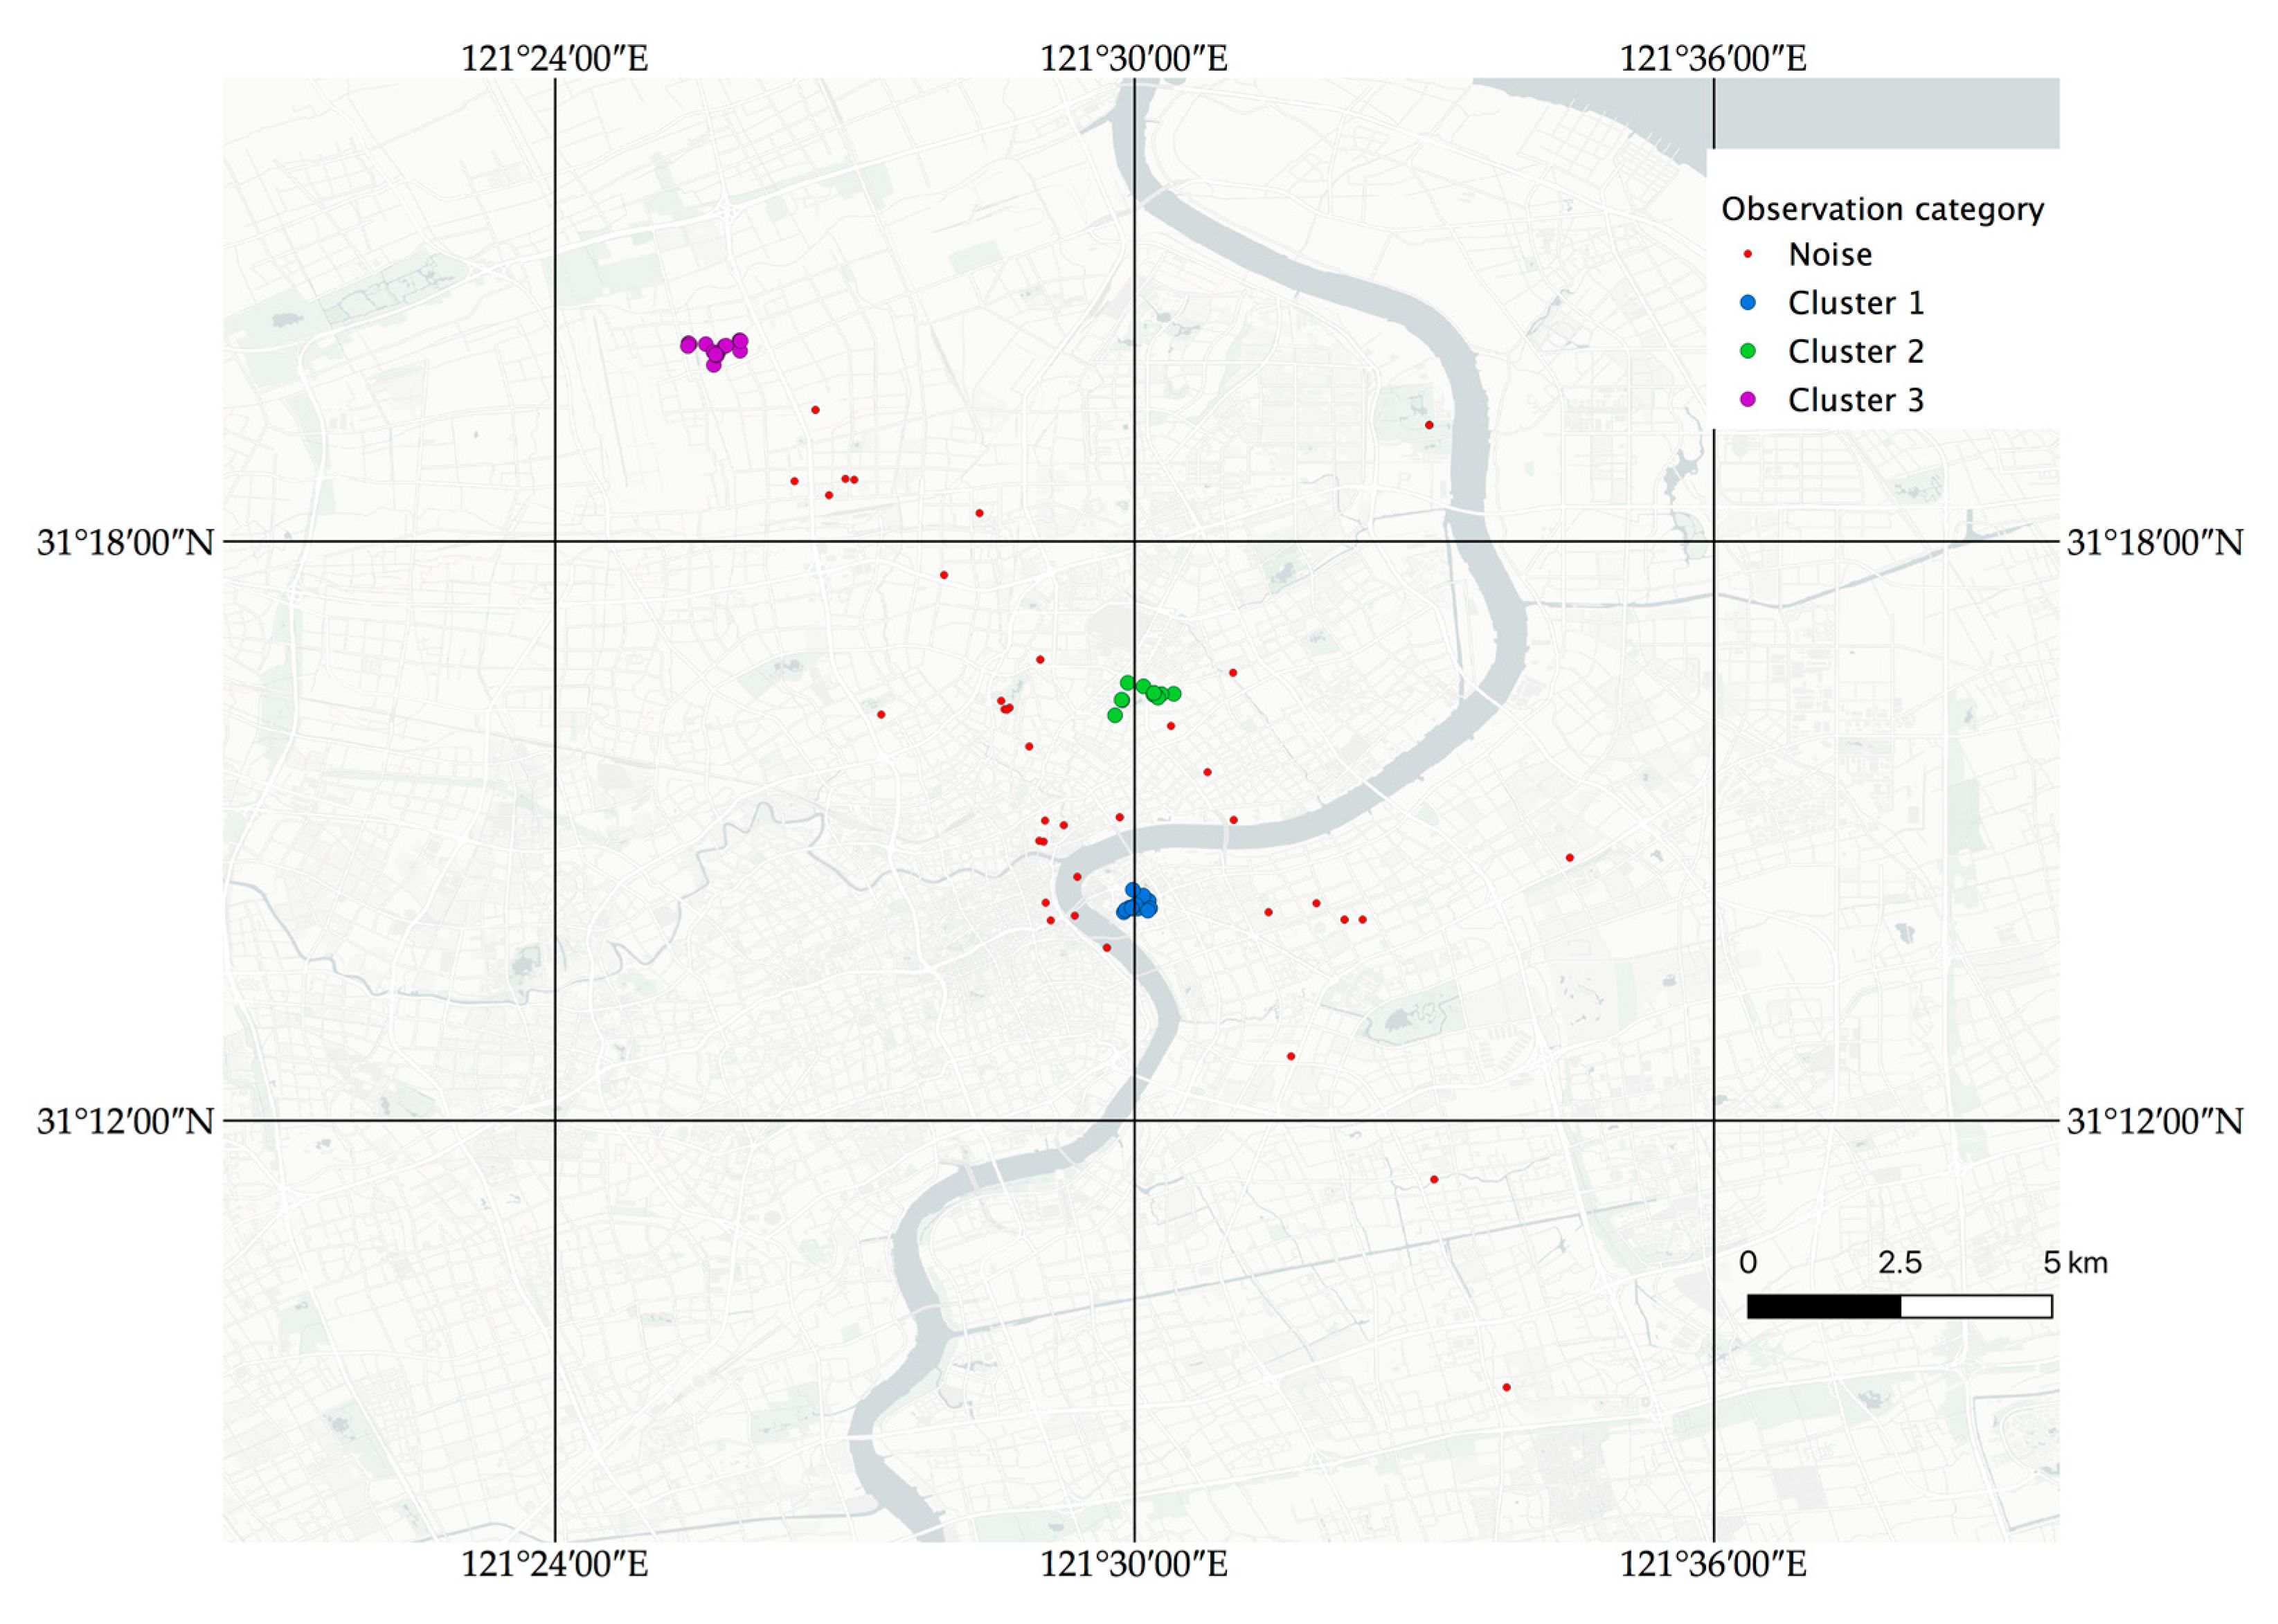
eps value. In the implementation of the DBSCAN algorithm, the data were filtered and users that had less than or equal to 20 Weibo posts were chosen. We set the parameters of DBSCAN to find five samples within 500 meters to make a cluster.
Figure 13 shows an example of the clustering with DBSCAN.
One of the major challenges in analyzing LBSN data is the bias in human mobility, because users can update their location at any time and place at home or work. By applying DBSCAN, we found the most important places in the user’s mobility and consider the strongest location of a user, that is, the densest area with the most points, as ‘home’, since people have more free time at home and we believe that there is a relationship between free time and posting on Weibo. The results were verified with the spatio-temporal aspects of published Weibo posts. For the spatial aspect, we explored the longitude and latitude of each district, in addition to the boundary data. For the temporal aspect in each district, we assumed that the time period between 6 to 11 PM, during Monday to Saturday representative of ‘home’ activities. However, we eliminated values larger than 10 miles and lower than 0.1 miles due to the limitation of boundaries in the study area, as shown in
Figure 13. The results were verified randomly by checking the user’s profile, where they chose their residential district while creating their account.
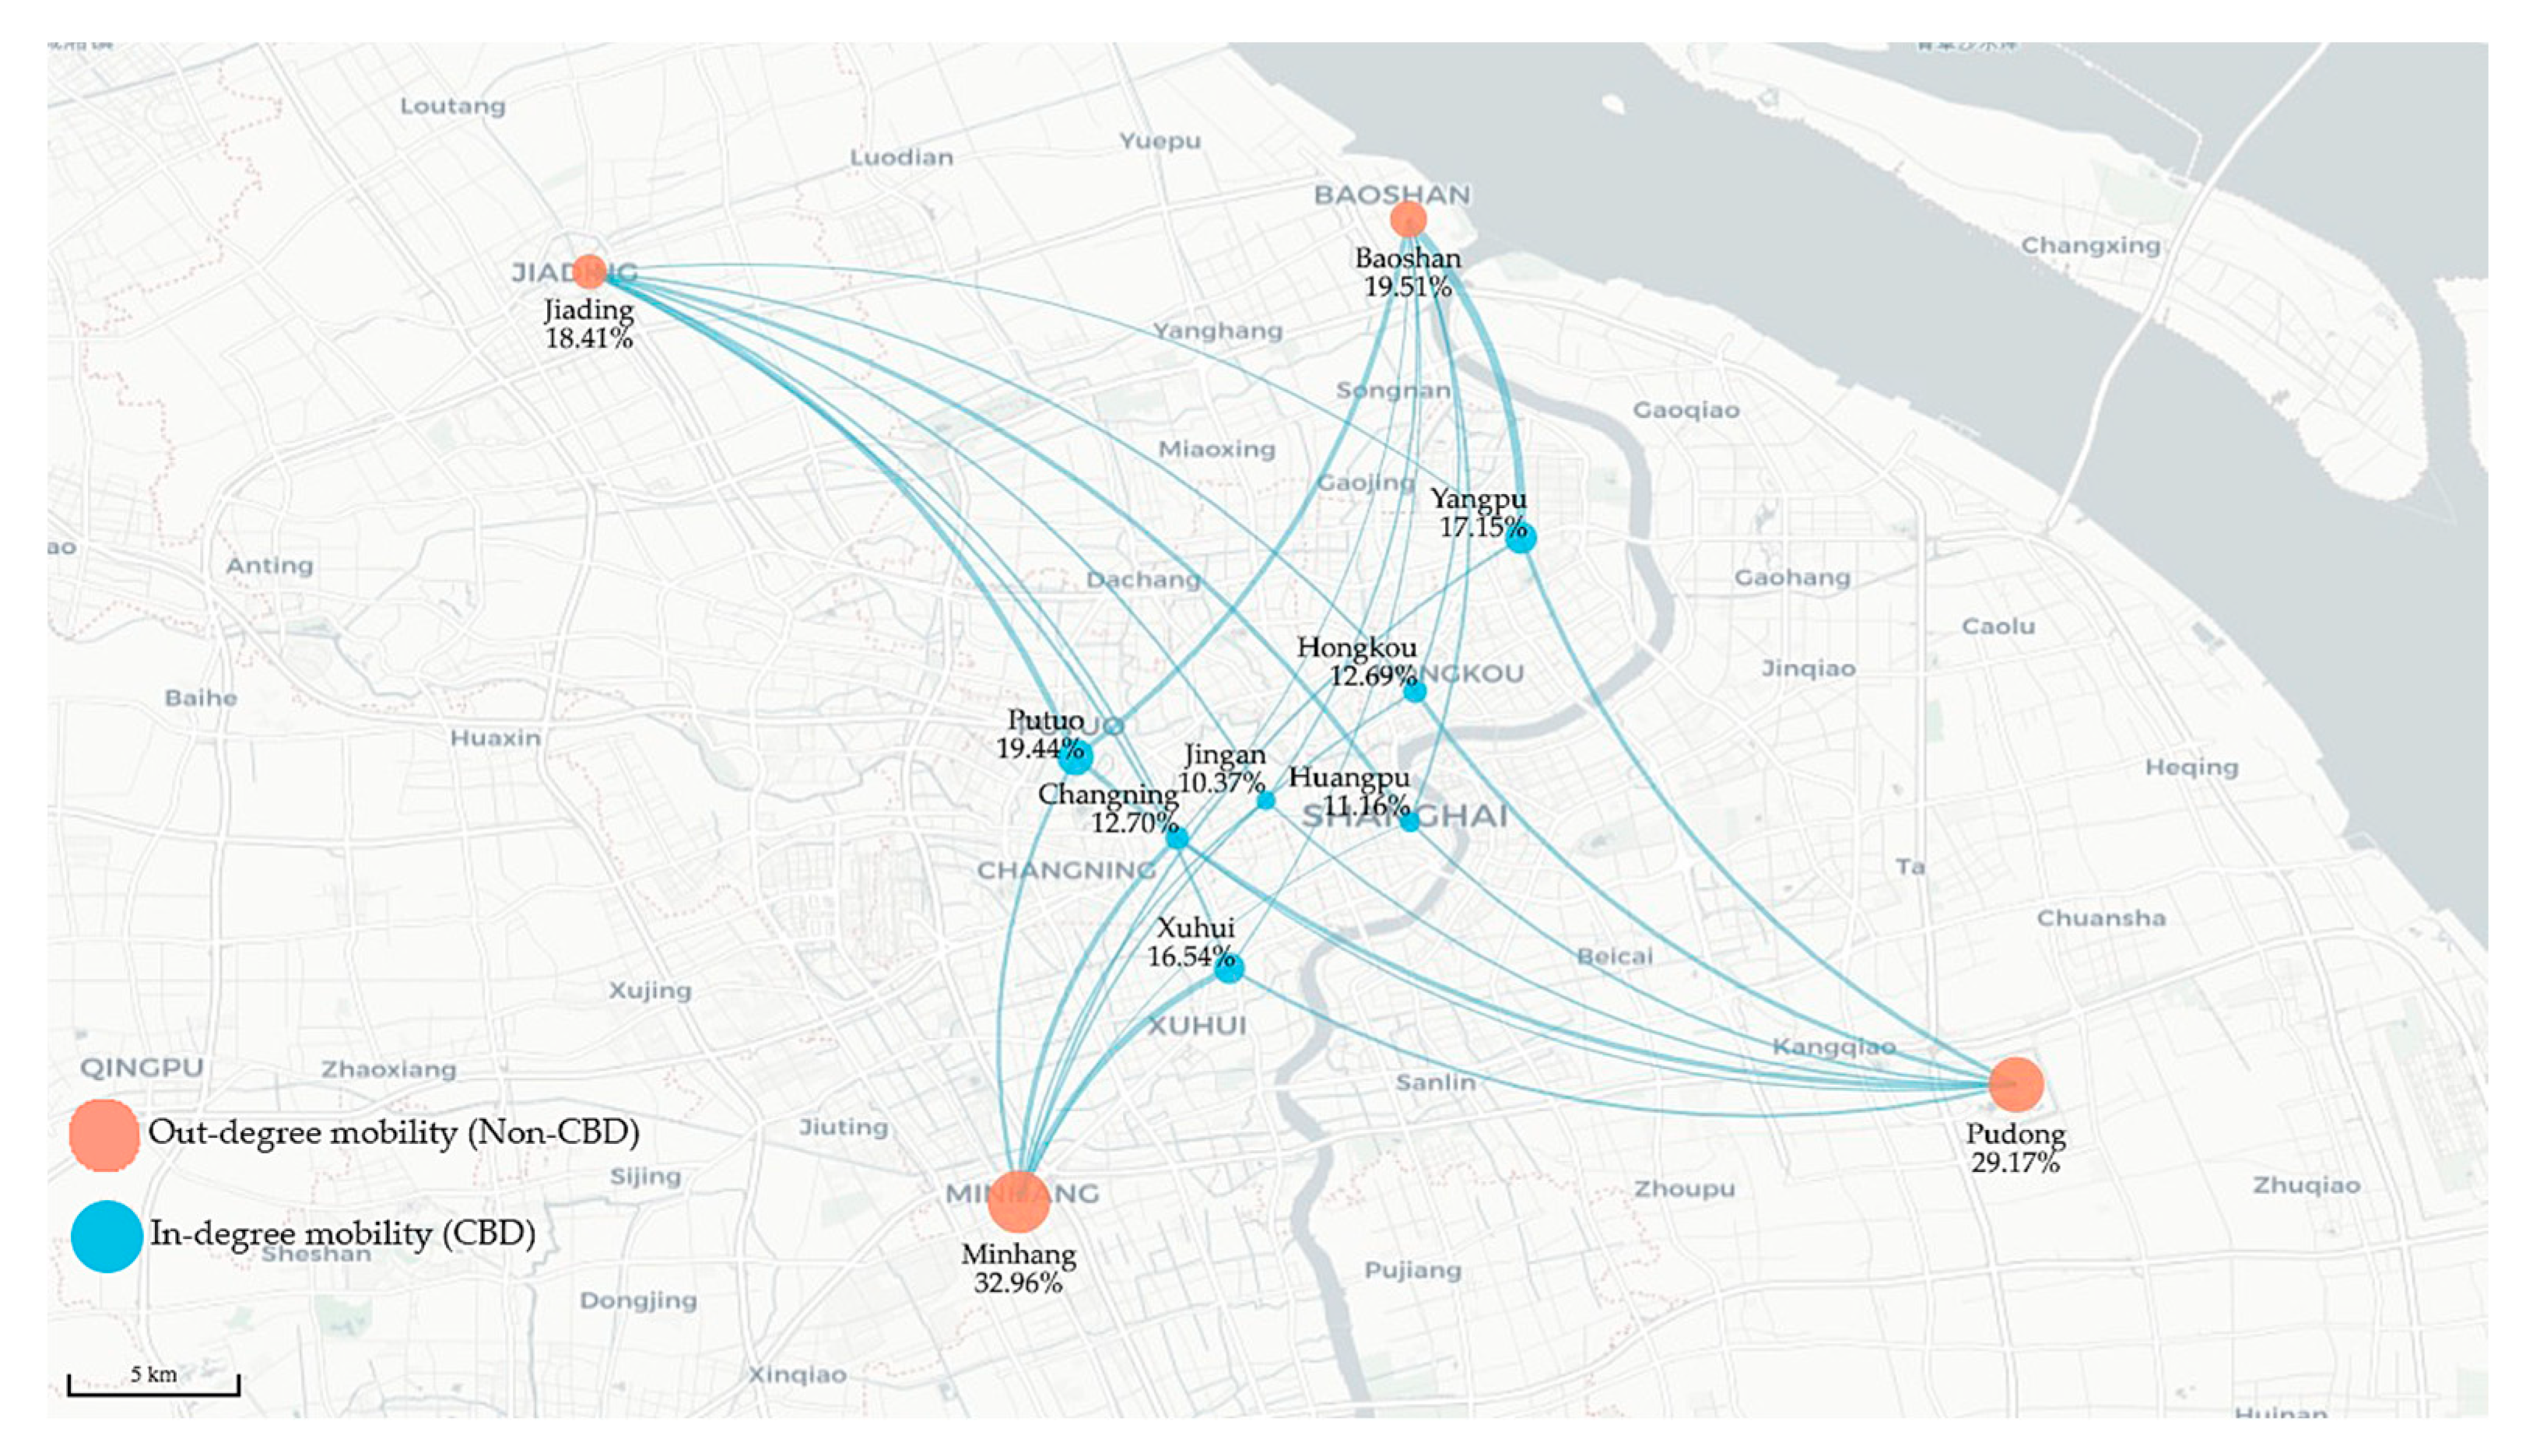
Figure 14 shows a general view of total movement between districts. In general view, In-degree mobility was calculated by the percentage of sum of all Weibo posts from non-CBD districts divided to the total number of Weibo posts, and Out-degree mobility is the percentage of number of Weibo posts from all CBD districts divided by total number of Weibo posts and, in order to give better detail of the idea of mobility, we visualized the statistical results as well as the geospatial map separately for each district for the users whose ‘home’ was in the same district and had check-ins during the day time from 8:00 a.m. to 6:00 p.m. in the CBD area. To do so, we should calculate the displacement metrics. We investigated the displacement between users’ iterative check-ins, representing the mobility distance between the user’s likely home locations.
Although the gravity model is the most commonly used method to estimate the distance of consecutive check-ins, there are some limitations that need to be balanced, as mentioned in [
30]. Therefore, following the previous studies [
48], we proposed the Haversine formula to compute the great circle distance between a pair of points by feeding the longitude and latitude of two published Weibo posts within a three-hour interval into the equation below
where
r is the radius of earth,
φ is longitude and
is latitude. At each three-hour interval, the displacement is calculated by dividing the sum of the displacements by the total number of unique users.
Then,
where
indicates the average displacements from two period of time,
, and
for each day
di. The term
represents the displacements for
users contributing in each day and at specific time intervals. In this study, a
value = of 3 hours was used to calculate the mobility between districts. As shown in the equation, the average displacement is calculated by dividing the summation of all displacements by the total number of users, and the results of this are shown in
Figure 15. The ‘geopy’ Python package was used to run the code and calculate the distance between Weibo posts.
We made four groups (clusters) for the four neighboring districts of Baoshan, Pudong, Minhang, and Jiading that include users whose ‘home’ belongs within the longitude and latitude of each district. We investigated the mobility of users in days of week to the central business district, as shown in
Figure 15 (here, check the
supplementary files to see the dynamic mobility of people).
5.4. Standard Deviational Ellipse (SDE)
The standard deviational ellipse (SDE) was proposed by Baojun to analyze the distribution characteristics of discrete point data, considering a rotated ellipse with a long axis that denotes the main orientation distribution [
49]. There are some SDE functions available in software, for example, ArcGIS, used to analyze spatio-temporal data, which helps to visualize the orientation distribution ellipse of discrete points of data. As an effective tool, it visualizes a realistic model for human movement with less sensitivity to outliers. It had been used for research fields, such as the geo analysis field [
50]. At a detailed level, we also used this helpful method to investigate human mobility tagged with travel demand. As shown in
Figure 16, the major movement of people is along the CBD area in the west-east direction. The eccentricity of the ellipse is larger in the period of 4 to 8 p.m. and decreases gradually by night from the period between 10 p.m. and midnight. It is tightly connected to the geographic distribution of the city’s infrastructure, because the CBD area, which is also called Puxi, is bisected by the Huangpu River on the west part, connecting with the east part of river by the Pudong New Area, where one of the major tourist attractions is located.
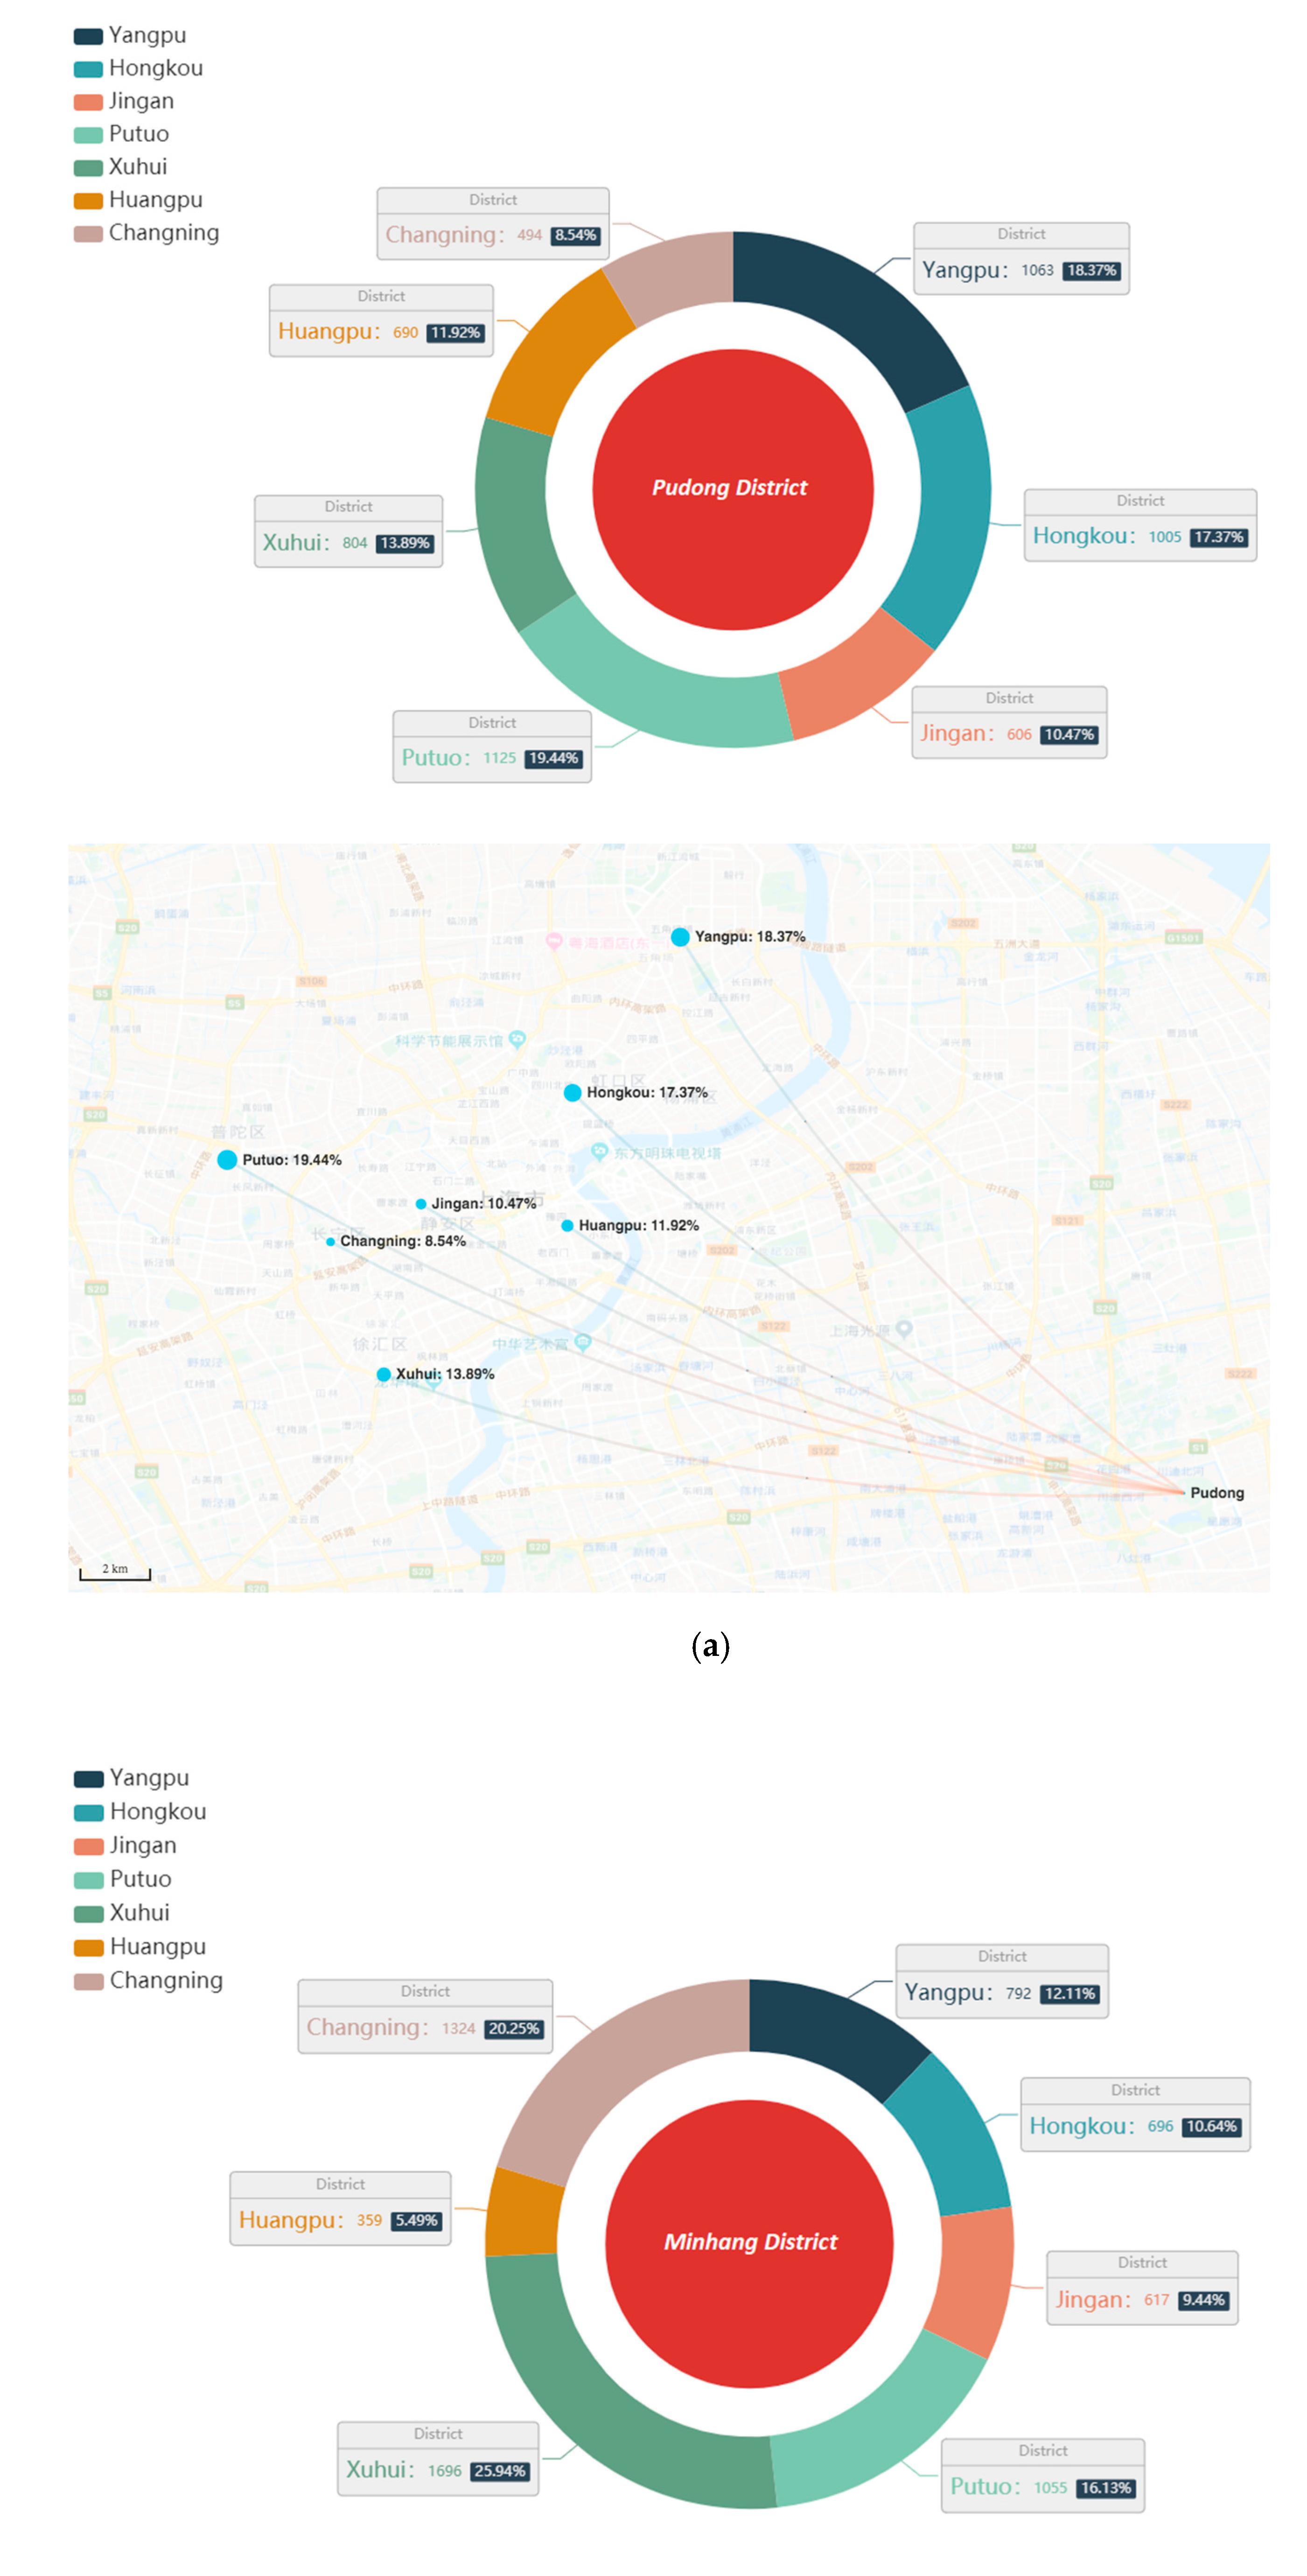
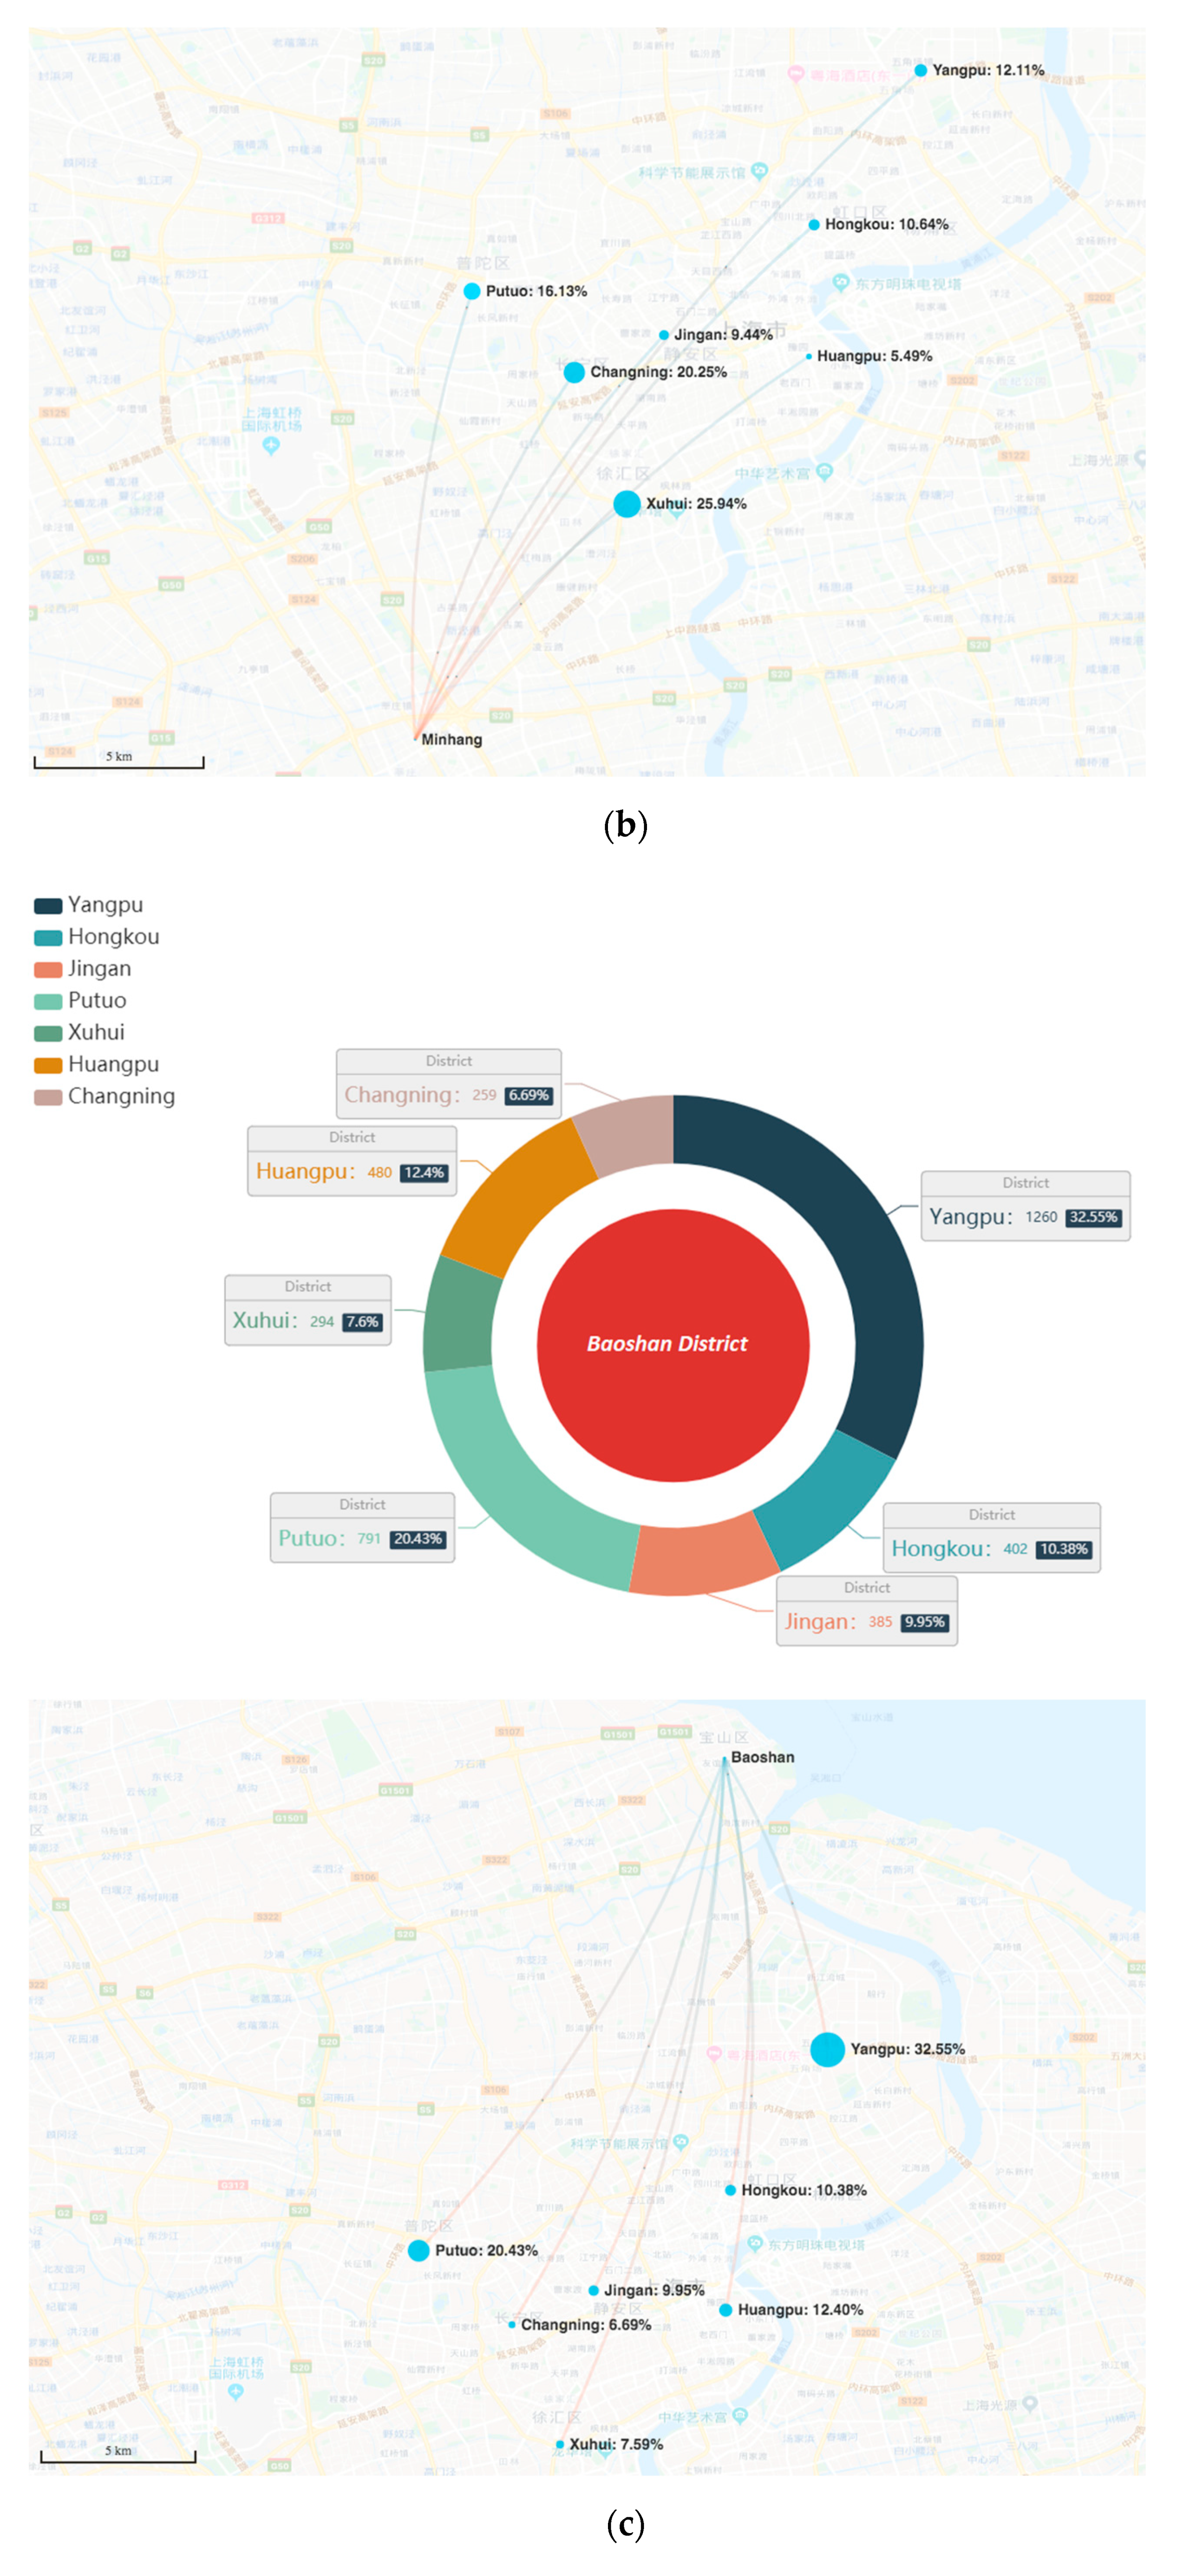
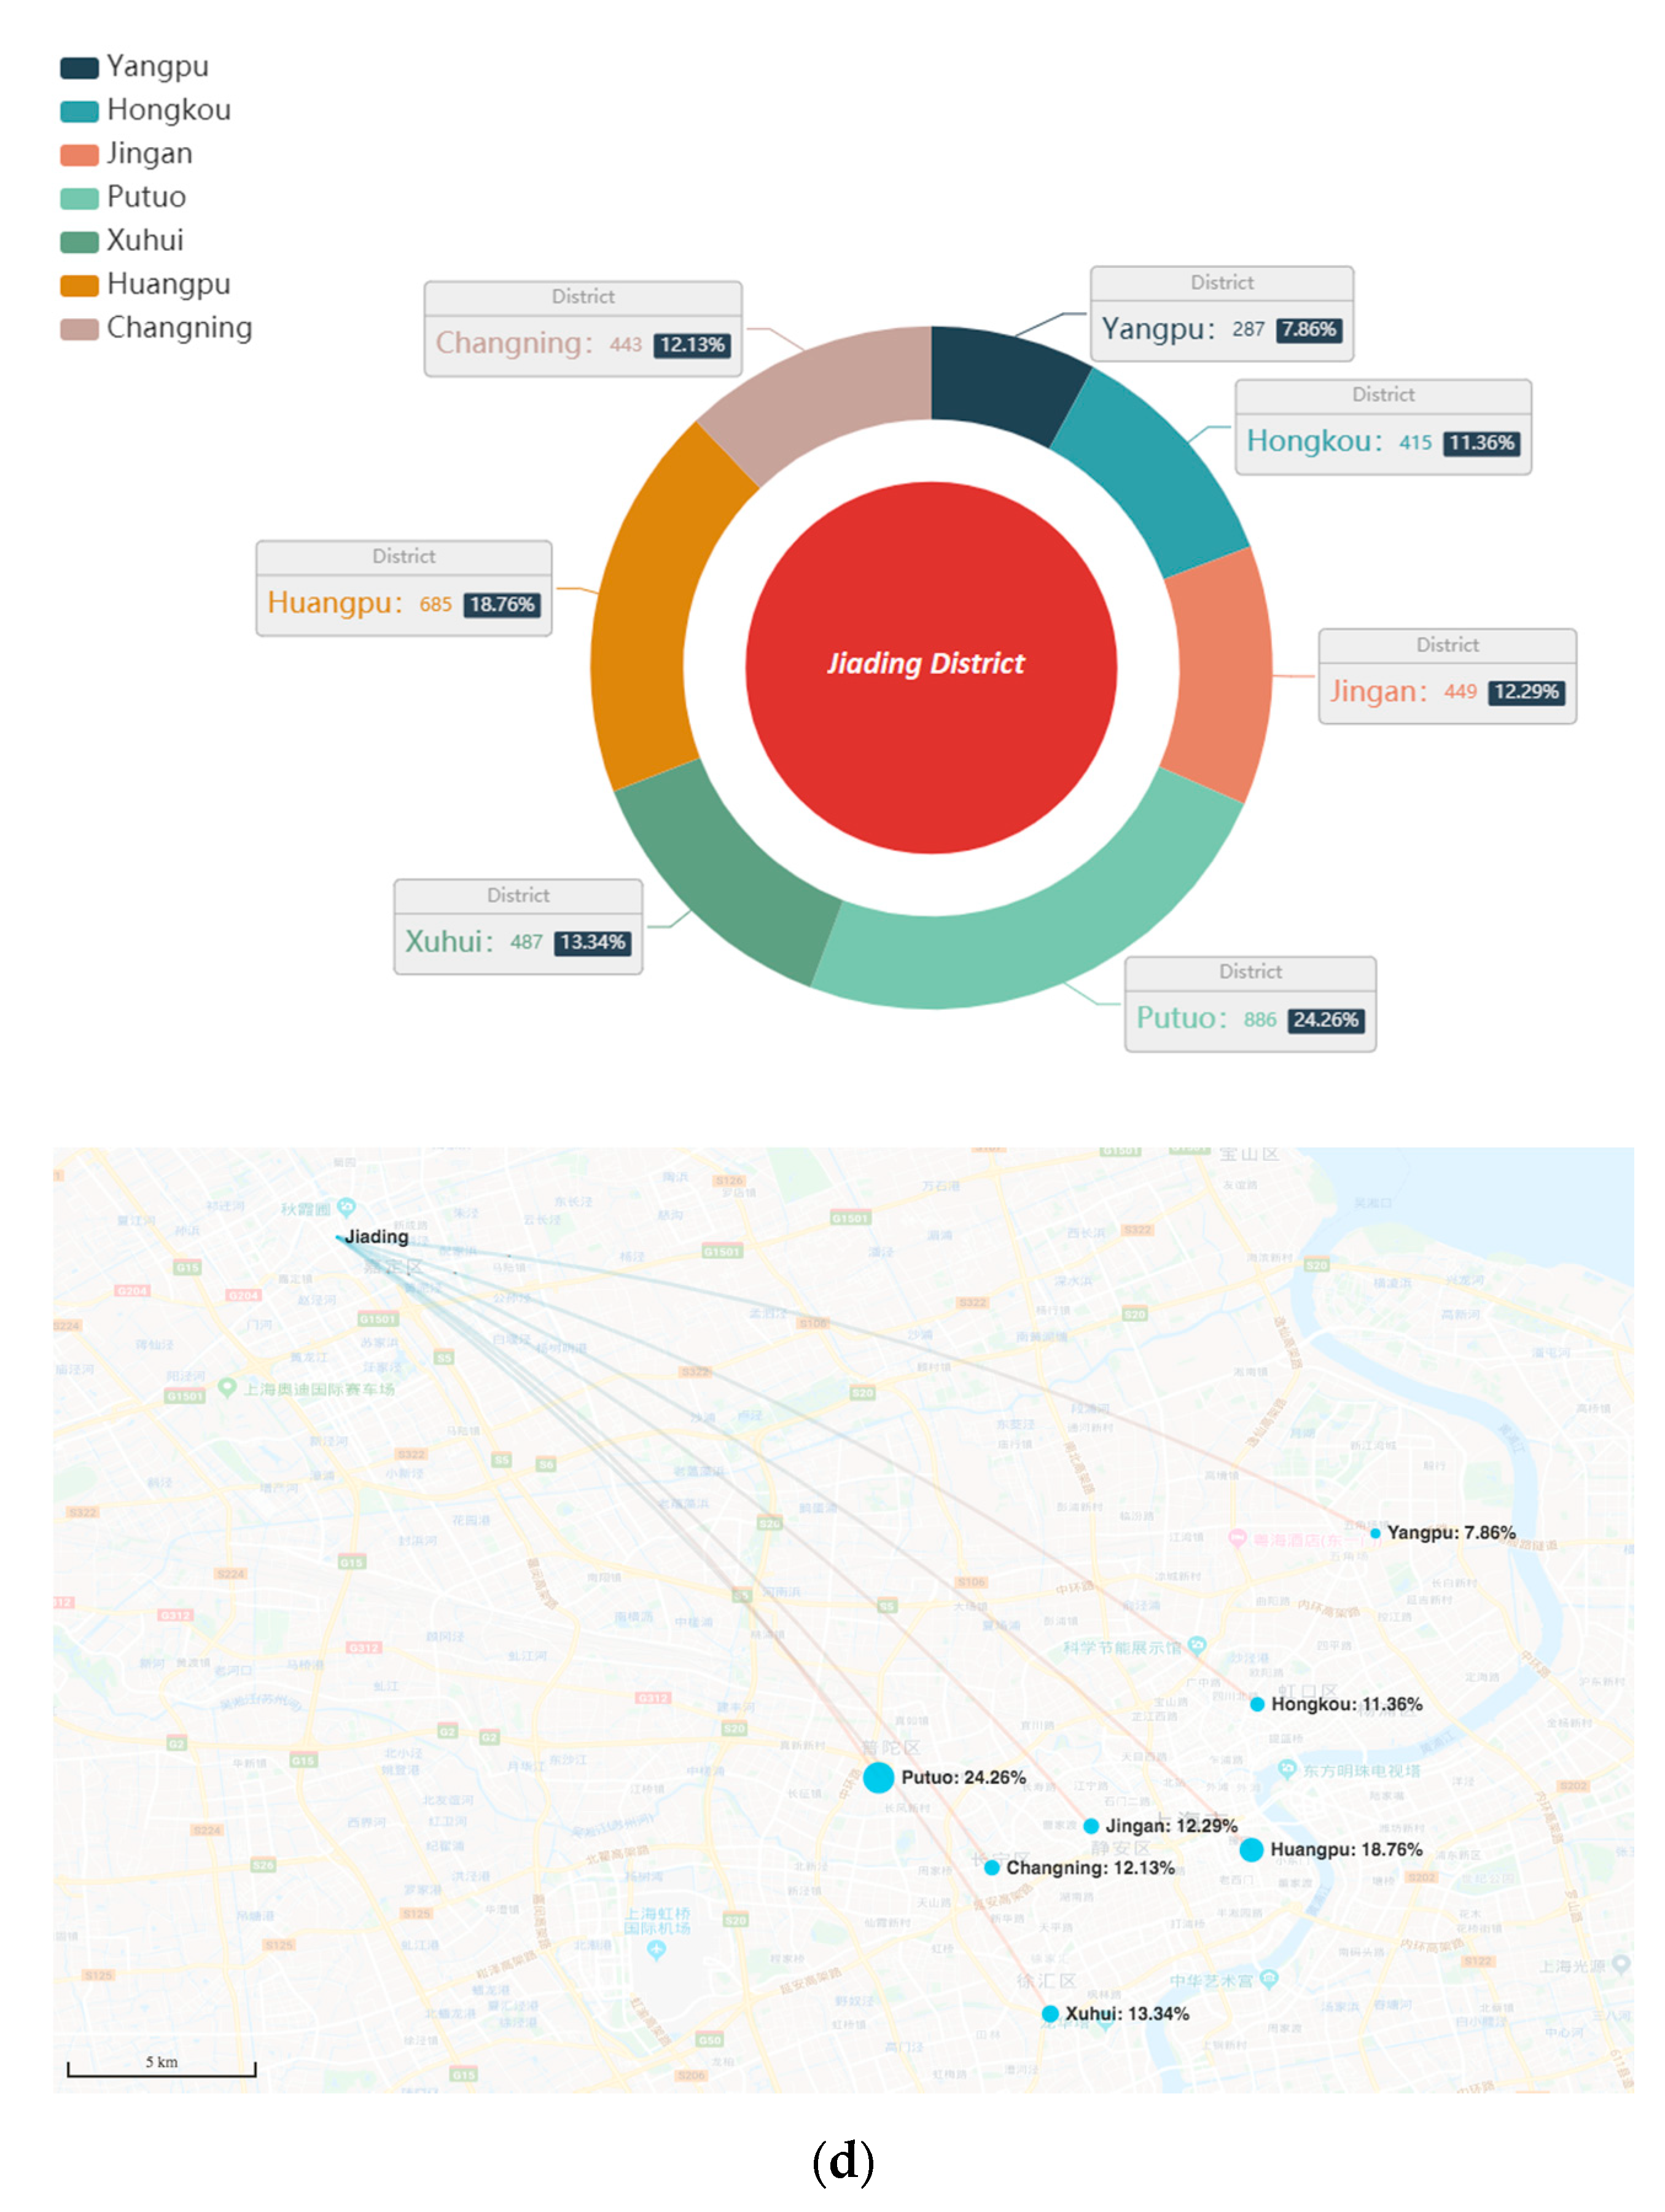
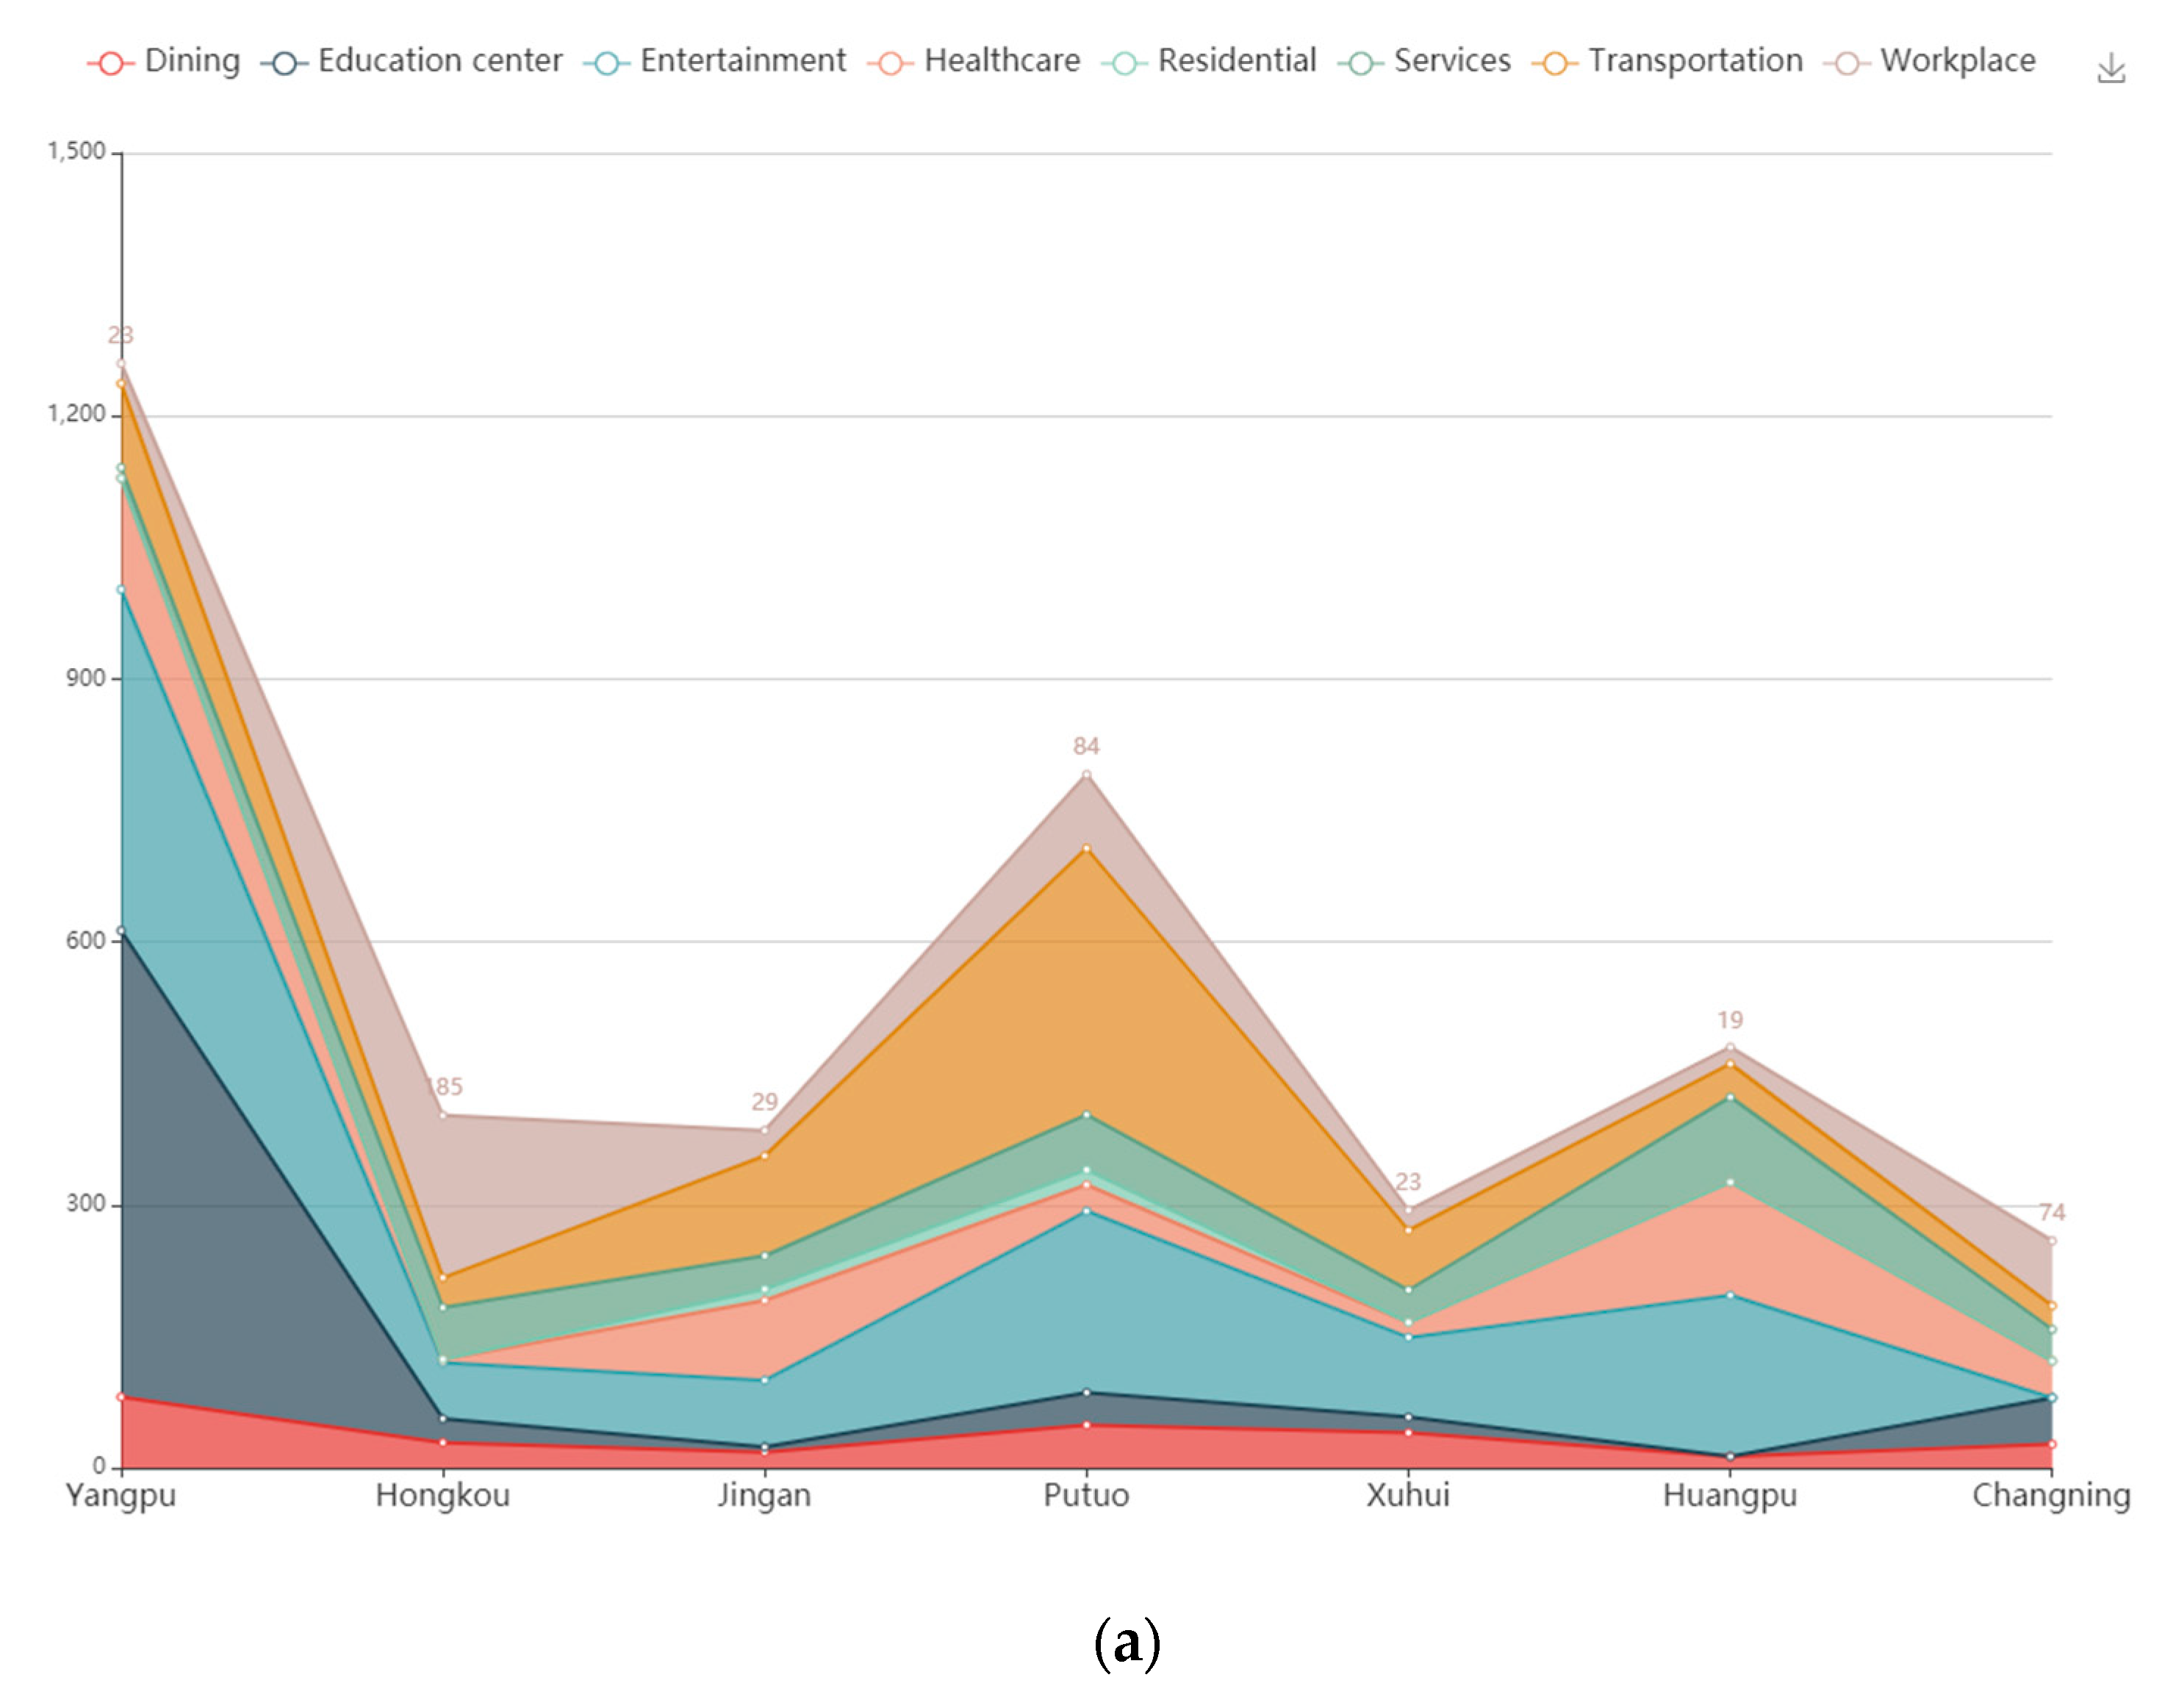
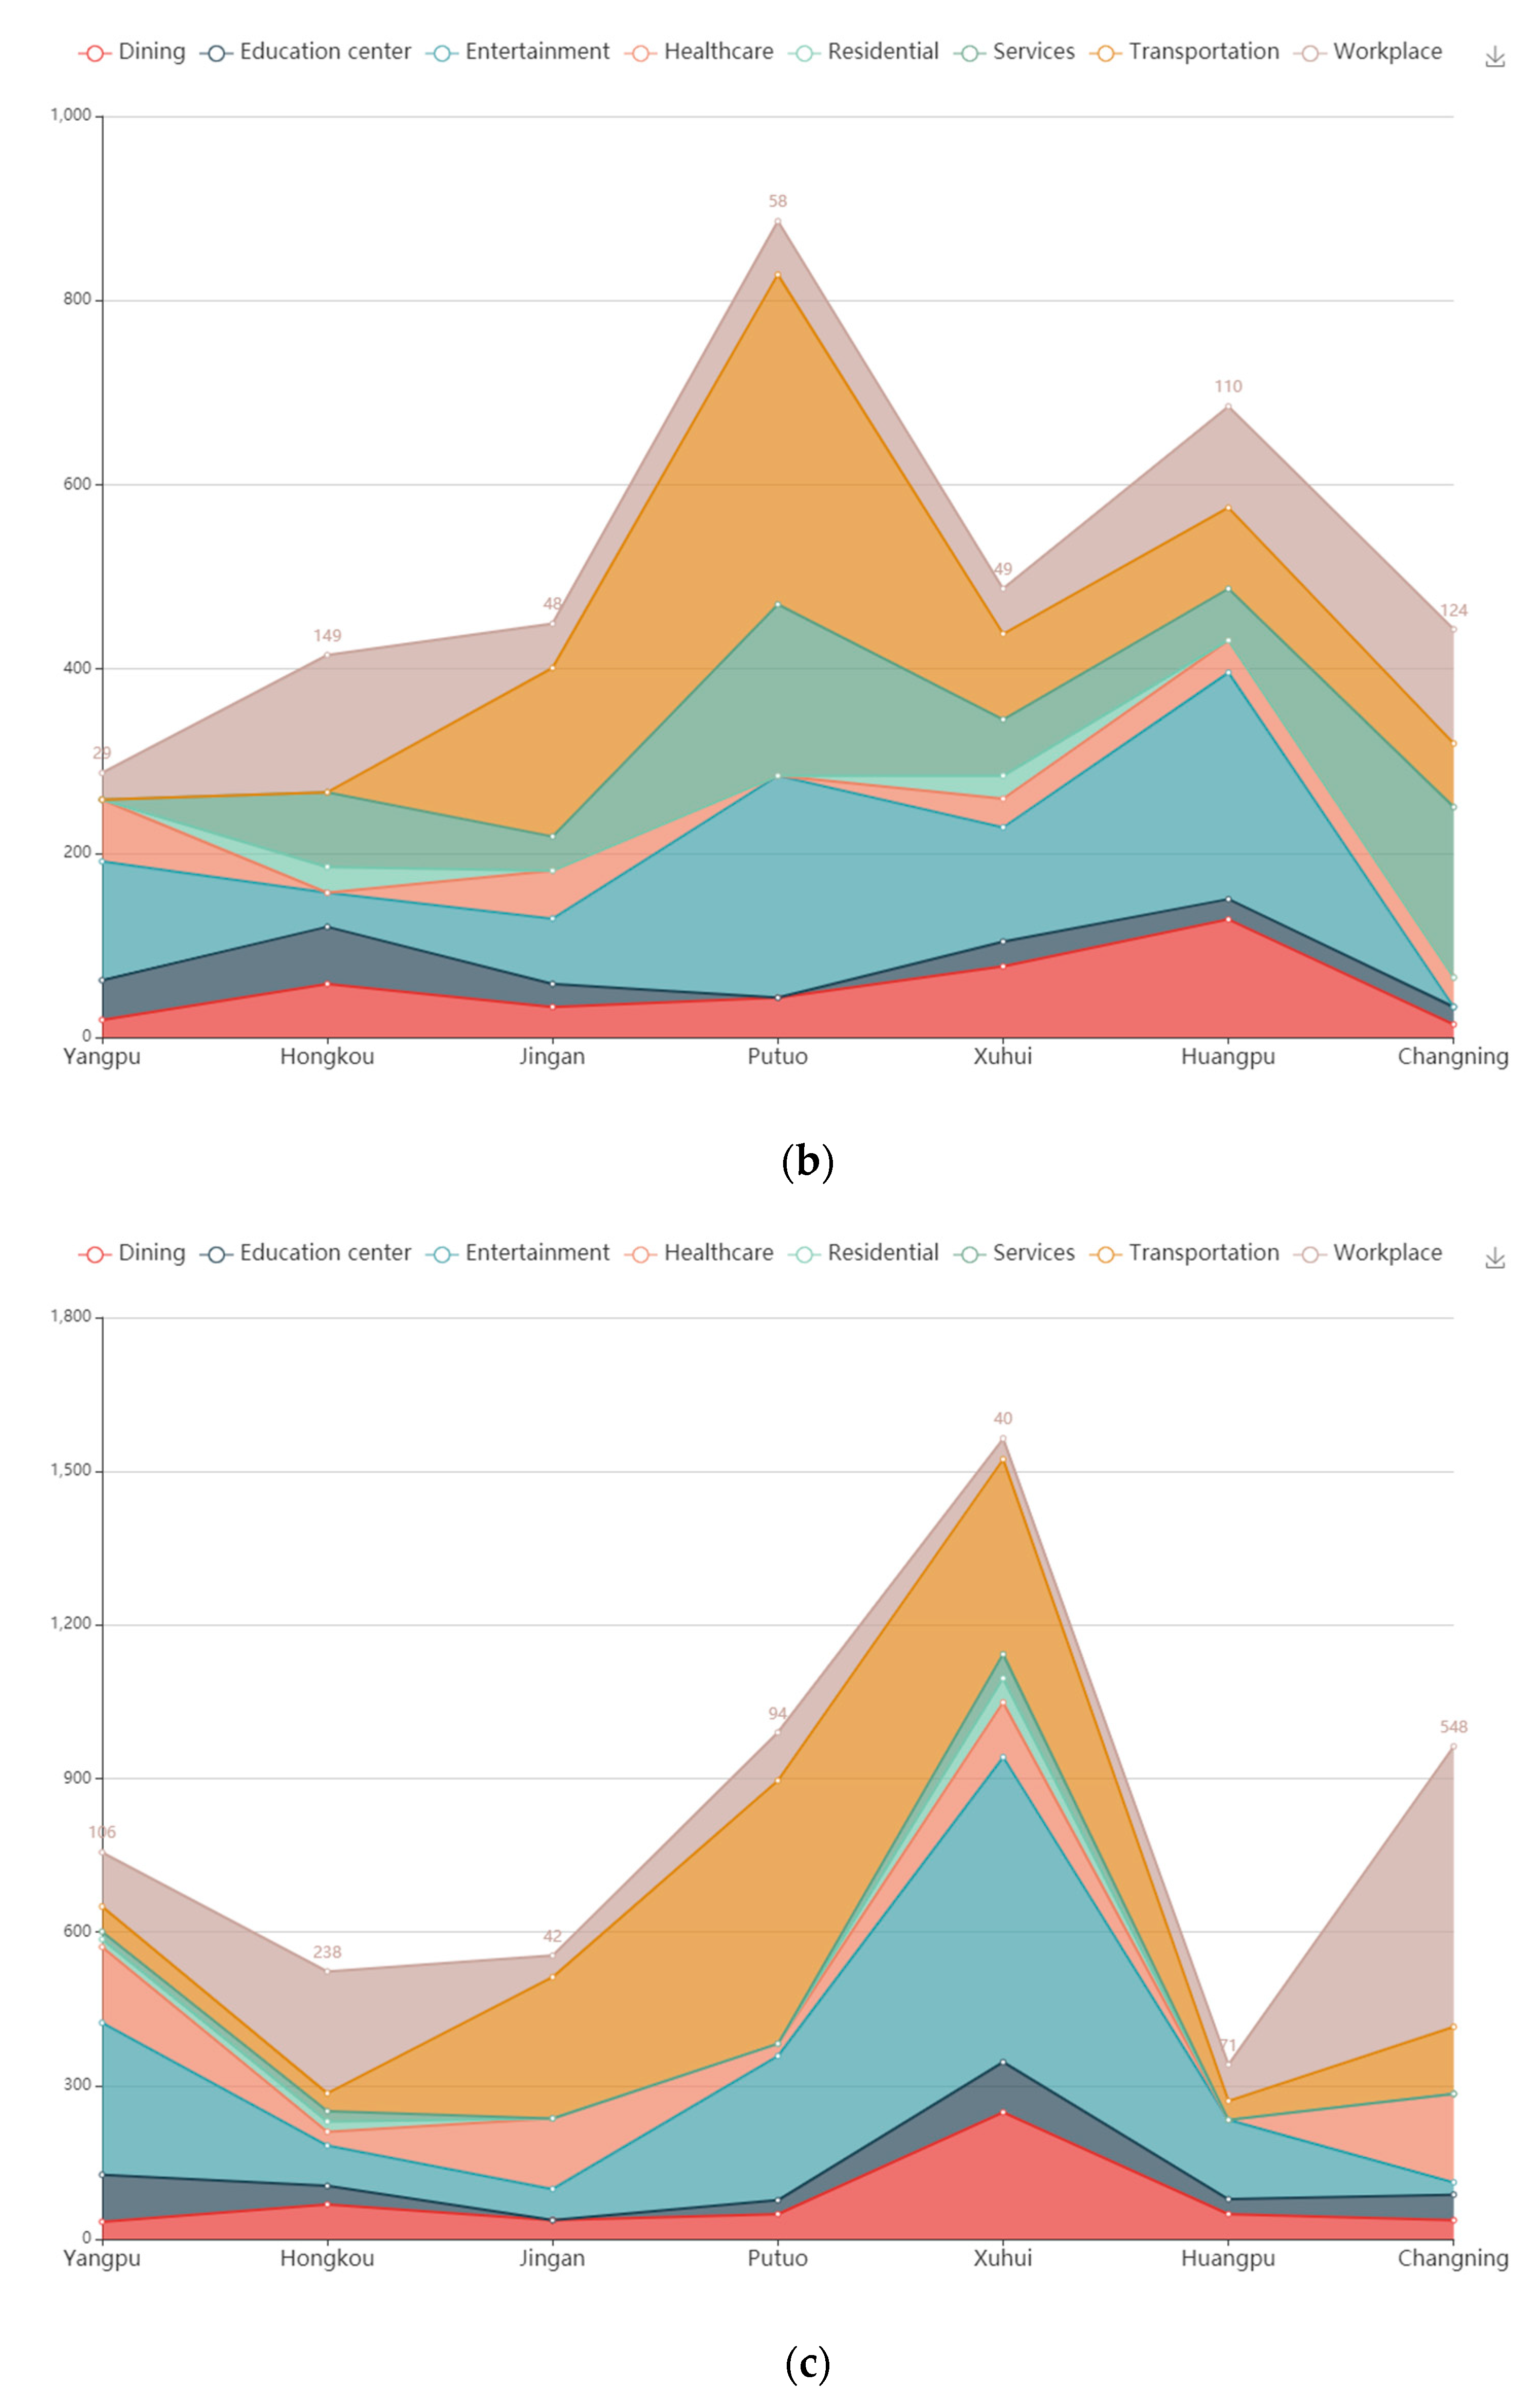
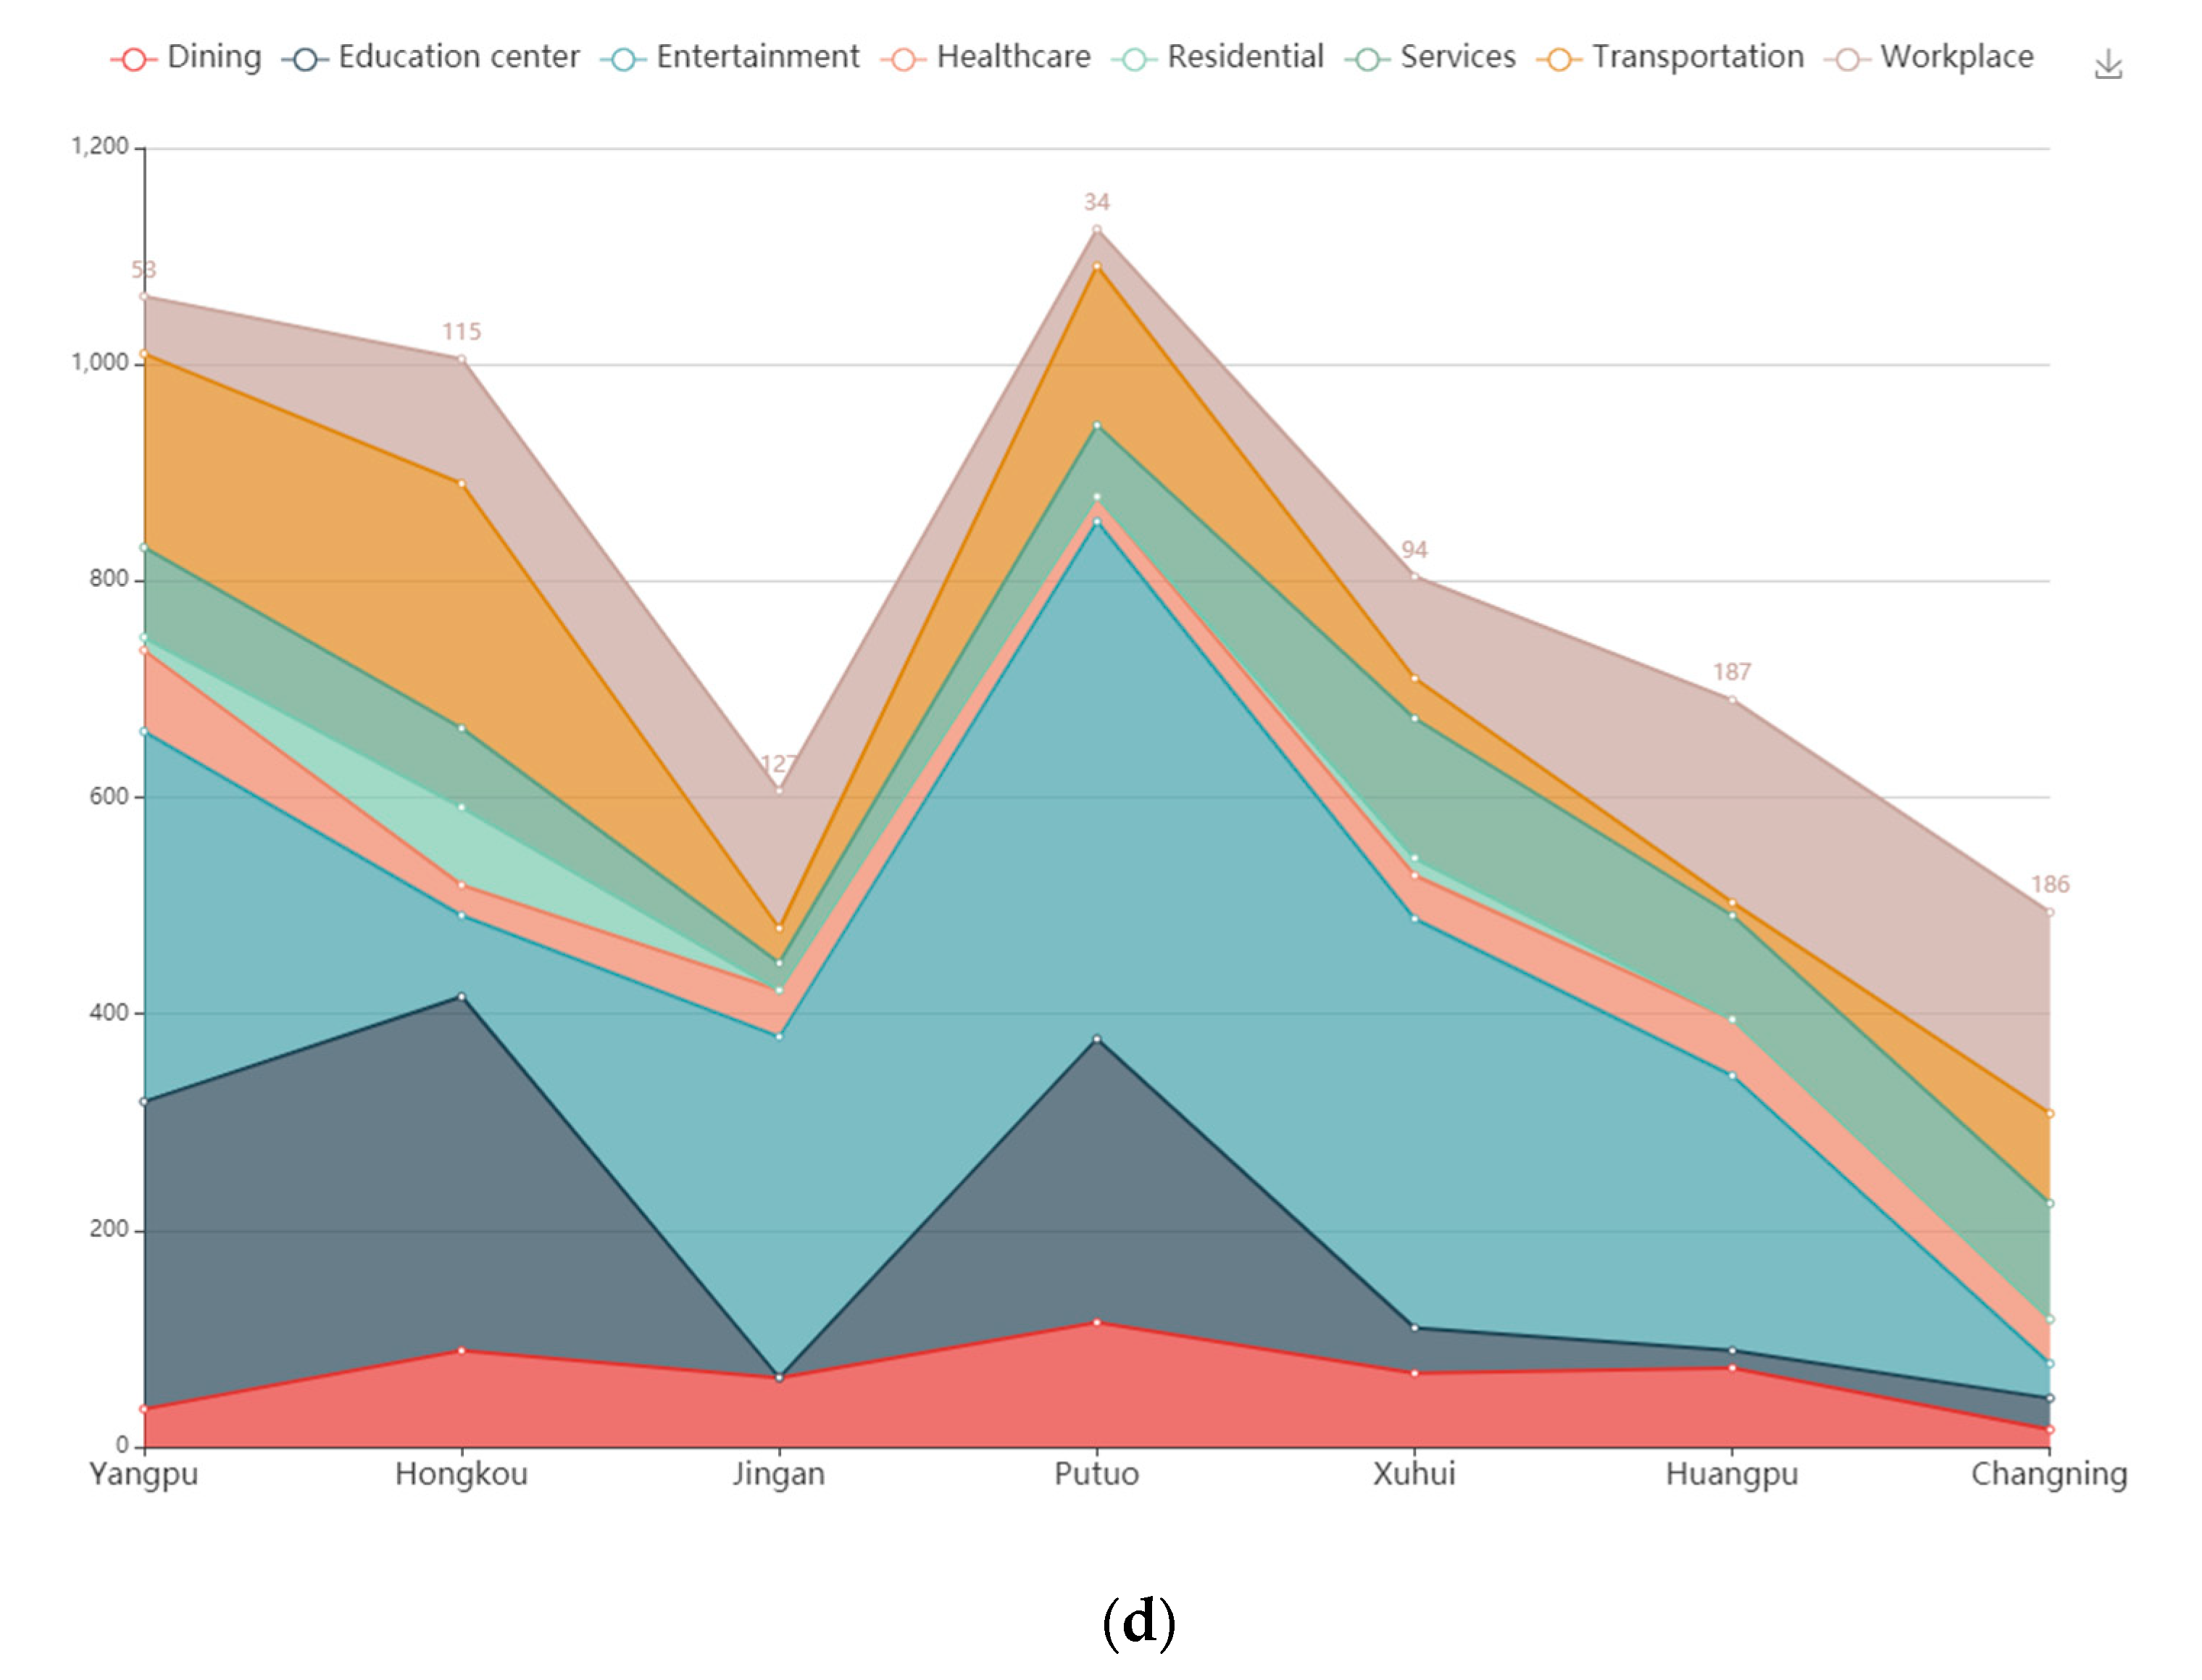
In order to answer one of the purposes of this study, that is, to elucidate people’s interests or reasons to move to other districts, we focused our analysis on the total movement of each of four neighbor districts, namely, Baoshan, Jiading, Minhang and Pudong, to the CBD area and toward the points of interest in each district. The results are shown in
Figure 17.
From the figures, we can understand the following facts that prove the validity of geo-tagged social media data:
Transportation-related activities are bold in Putuo (because the western railway station is in this district) from the neighbor district and are less than in Pudong, and this is reasonable because there is a major airport located in Pudong;
It can be observed that fewer people move from Baoshan to the CBD, in spite of Pudong. The reason for this is that the population and land area of Baoshan are smaller, and more people move from Pudong.
Education activities mostly happen in Yangpu (there are some famous universities there);
Another interesting result is that from each neighbor district, the mobility is increased in the border district compared to districts further away. For example, less mobility is seen from Baoshan to Xuhui or Changning.
Moreover, another interesting result achieved by this analysis is the confirmation of different spatial patterns of people moving towards points of interest in the CBD area of Shanghai. Our data demonstrated the tropism of travel in eight categories of the seven districts. As shown in
Figure 18, there is a matrix for each trajectory, denoted as
Tx,y, where
x {1,2,3, …, 7} categories of points of interests and
y {1,2,3, …, 8} districts.
Tx,y in each district represents the travel distance in that specific boundary of the region within a time interval that we chose, namely, two hours, which we considered to be representative for an activity in a day and in order to avoid data redundancy.
The test was successful, as it was able to identify the following findings:
Among all travel trajectories, the matrix points out that a larger movement happened in Yangpu (T7,y) and Putuo (T5,y), but not in Hongkou (T2,y), which indicates smaller movement. The reason for this may be that the land area in Yangpu and Putuo is larger than the rest of the districts. (T1,7) is a good illustration for the use of transportation in Changning district, as evidenced in the train stations or international airport in this district, followed, respectively, by Putuo (T5,7) and Jingan (T4,7);
Another interesting finding is the travel demand for entertainment activities which indicates that Huangpu (T3,3) is a preferred choice compared to Changning and Hongkou, which have a smaller scope. T2,8 illustrates this point clearly, where workplace-related check-ins in the Hongkou District require less travel effort. However, it is the opposite case for the Xuhui and Yangpu districts, with a larger Tx,y regarding the ‘dining’ category;
The effectiveness of the SDE technique is exemplified in
Figure 18, representing the evident direction of movement. For example, the direction of people’s movement in Xuhui is almost north-west and movement in Huangpu is nearly toward the south-east. In spite of the fact that LBSN data are not precise enough to estimate the origin–destination of citizens, it is guaranteed from the results provided by this analysis that they are extremely helpful for urban planning and, additionally, the design of city infrastructure.
6. Discussion
Statistical analysis offers a robust set of techniques and tools for understanding data independently of the topic and domain. In the case of mobility patterns associated with users in social media, this kind of tool provides insights to understand the distribution of users (gender analysis), how and when they interact with each other (temporal analysis), and where they move in a specific region (spatio-temporal analysis). Although these techniques help to understand the way people move and interact, the use of semi-supervised learning algorithms (like clustering) provides a deeper understanding of mobility patterns and how users distribute themselves among different points of interest, ultimately leading to the estimation of trending places and trajectory paths.
The combination of basic statistical tools and grouping algorithms allows researchers and planners to make assumptions about how users interact, which, after using adequate visualization tools, can help to boost decision-making quality in smart cities. Additionally, the adequate duration of location-based social media data provides real-world information that supports decision-making in a fast-growing environment. Most of the applications today analyze the textual content of information for understanding what people think and how they deliver this information to others, but the analysis of spatio-temporal data is gaining momentum, taking into account the benefits associated with the extraction of mobility patterns and how they can be used to increase user experience in a specific region. This presents the following questions: Who is more active? Where do people tend to go? How do they group among each other? These are questions that can be answered with the exploratory experiments presented in this paper, which highlights its relevance. Studying Shanghai, as it is one of the most developed cities, reveals crucial facts that help not only city planners to make better decisions, but also business developers. Revealing the correlation of spatio-temporal distribution helps managers to provide better services in different regions in order to reduce the congestion in a specific area and improve the quality of life. For example, when results reveal a specific percentage of people are moving from district A to district B for healthcare or medical services, that shows people tend to get better services in district B or they are facing a lack of specific services at the origin. Analyzing eight different activities in seven major districts of Shanghai in this research is helpful for urban planners to make precise decisions in designing a better structure for a city. On the other hand, identifying hot spots in the city opens a new aspect for business opportunities. Imagine a company wants to invest its funds to open a new branch in the city; this research helps them to reduce their risk of loss. Compared to recent work by Rizwan et el. [
51], in this research work we analyzed human mobility behavior. Different methods and algorithms had been applied on POI data and Sina Weibo Social media data to find the CBD area of Shanghai. This analysis proved to be a useful source of data and validated geo-tagged location-based social media data as suitable research tool for researchers. By clustering similar user’s mobility behavior, we found out a variety of citizens’ behavior based on their gender and distance from CBD area. Furthermore, we investigated the reasons people tend to go to the CBD area of Shanghai. By creating eight groups of activities, such as dining, entertainment and work-places, we revealed the hidden purposes of mobility. These new insights are useful not only for business developers but also for the government to improve the quality of life in developed cities. Analyzing Weibo data in both aspects of the spatio-temporal human mobility to the CBD area of Shanghai had not been focused on in the previous work. As well as this, users’ iterative check-ins from ‘home’ to CBD area were calculated to measure displacement matrices by Haversine formula. In contrast to [
51], which focused only on analyzing the frequency of using LBSN based on gender differences in ten districts of Shanghai, we made four groups of neighboring districts and analyzed user’s mobility behavior and their purposes to the CBD area, plus the moving trajectories in Shanghai.
There are many benefits associated with this study (like the ones presented in previous chapters), but there are also some natural limitations, like the availability of temporal data, which, in many social media channels, is restricted (Twitter, for instance). The results are also highly dependent on the user’s interactivity being associated with different points of interest, where a low interaction means a poor understanding of mobility patterns, while a higher interaction means a better perception, which can support smart city planning decisions.
Additional limitations in this study include the user’s preferences, relating to how often they update lifetime events (sporadic activities lead to biased conclusions). Users also tend to lie regarding their position and preferences, as social media is not a private hub, thus information could be used for malicious purposes.
To overcome previous limitations, we explore different spatio-temporal algorithms and different preprocessing techniques for the data to refine the conclusions, bearing in mind that not only the frequency of actions, but also the grouping factor of data regarding the mobility of users, is important. The idea is to reach more accurate predictions based on automatic pattern processing, rather than making inferences about variable relationships among data (i.e., classical statistical analysis).

 ,
, 


